vegetational study of the temple city of bhubaneswar
TRANSCRIPT

363
Geo-Eco-Trop., 2021, 45, 2 : 363-374
Vegetational study of the temple city of bhubaneswar (India):
plant community analysis
Etude botanique de la ville temple de bhubaneswar (Inde): analyse de la communauté végétale
M.K. SATAPATHY1 & S.K. DAS2*
Résumé: L'analyse de la communauté végétale dans quatre sites de chacune des zones centrale et de transition de la ville de Bhubaneswar a montré que dans la zone de transition, Mangifera indica L., Neolamarckia cadamba (Roxb.) Bosser.etc. étaient les arbres dominants. Dans la zone centrale, les arbres dominants étaient Delonix regia (Boj. Ex Hook) Raf., Anacardium occidentale L. et Mangifera indica L. À partir des valeurs calculées de la fréquence relative (RF), de la densité relative (RD), de la dominance relative (RDo) et l'indice de valeur d'importance (IVI), Delonix regia s'est avéré assez dominant dans la population. Anacardium occidentale L., Strychnos nux-vomica L. avaient une population relativement pauvre. Dans la zone de transition Mangifera indica L. suivi de Neolamarckia cadamba (Roxb.) Bosser. était présent dans une population élevée. D'après l'analyse de l'indice de valeur d'importance de la famille, il a été observé que les Poacées étaient la famille la plus dominante, suivies par les Cypéracées et les Fabacées. En raison de davantage d'activités anthropiques dans les zones centrales, la richesse en espèces se situait davantage dans la zone de transition que dans la zone centrale. La régularité des espèces était plus pour les herbes, suivies des arbustes et des arbres dans les deux zones. Les différents paramètres ci-dessus ont montré des différences marquées entre les sites d'étude en raison des variations des conditions du sol, du climat local et des interférences biotiques. Mots clés: Communauté, indice de diversité, dominance relative, indice de valeur d'importance, valeur d'indice familial Abstract: Analysis of the plant community in four sites of each of Central and Transition zones of Bhubaneswar city showed that in the Transition zone, Mangifera indica L., Neolamarckia cadamba (Roxb.) Bosser.etc. were the dominant trees. In the Central zone, the dominant trees were Delonix regia (Boj. ex Hook) Raf., Anacardium occidentale L., and Mangifera indica L. From the calculated values of Relative Frequency (RF), Relative Density (RD), Relative Dominance (RDo) and Importance Value Index (IVI), Delonix regia was found to be quite dominant in the population. Anacardium occidentale L., Strychnos nux-vomica L. had relatively poor population. In the Transition zone Mangifera indica L. followed by Neolamarckia cadamba (Roxb.) Bosser. were present in high population.. From the analysis of Family Importance Value index, it was observed that Poaceae was the most dominant family followed by Cyperaceae and Fabaceae. Because of more anthropogenic activities in the core areas, species richness was more in the transition zone than the central zone. Species evenness was more for herbs, followed by shrubs and trees in both the zones. The various above parameters showed marked differences among the study sites because of variations in soil conditions, local climate and biotic interferences. Key words: Community, Diversity index, relative dominance, Importance value Index, Family Index value
INTRODUCTION
Cities provide ample opportunities to their citizens for economic development, better living standards, jobs and educational opportunities leading to migration of people from villages to cities. This continuous and unabated migration over the years has made cities densely populated and unsustainable. It has been predicted by UNO (STANLEY, 2008) that the number of people in Indian towns and cities will reach at 814 million by 2050 Under the smart city mission, announced by the Government of India in 2015 (KULASHRESTHA, 2016), Bhubaneswar the capital of Odisha has been declared as one of the cities for comprehensive development of its physical, institutional, social and economic infrastructure. As such it attracts the attention of policy makers, and planners, and the government has been putting lots of stress to make it a model city for others. At the time of construction of new capital in 1948, Bhubaneswar and its surrounding areas supported a thick vegetation cover, mostly of deciduous type and the biodiversity was remarkably rich (ROUT AND DASH, 1998). However with expansion of capital city, the rich flora of Bhubaneswar has largely been replaced by shrubs with stunted growth. _________________________________________ 1, 2 Department of Botany, Regional Institute of Education (NCERT) Achrayavihar, Bhubaneswar, Odisha, India, 751 022
364
Corresponding author : Email: [email protected]/ [email protected]; Mo: 09437194035
Though some study has been conducted by Botanists on the flora of Bhubaneswar, there is no comprehensive study that could throw light for the future planning and development of Bhubaneswar modern city from vegetational perspective. Under this background, the present study was conceptualized to make quantitative study of vegetational patches and look for plant community analysis.
MATERIALS AND METHODS
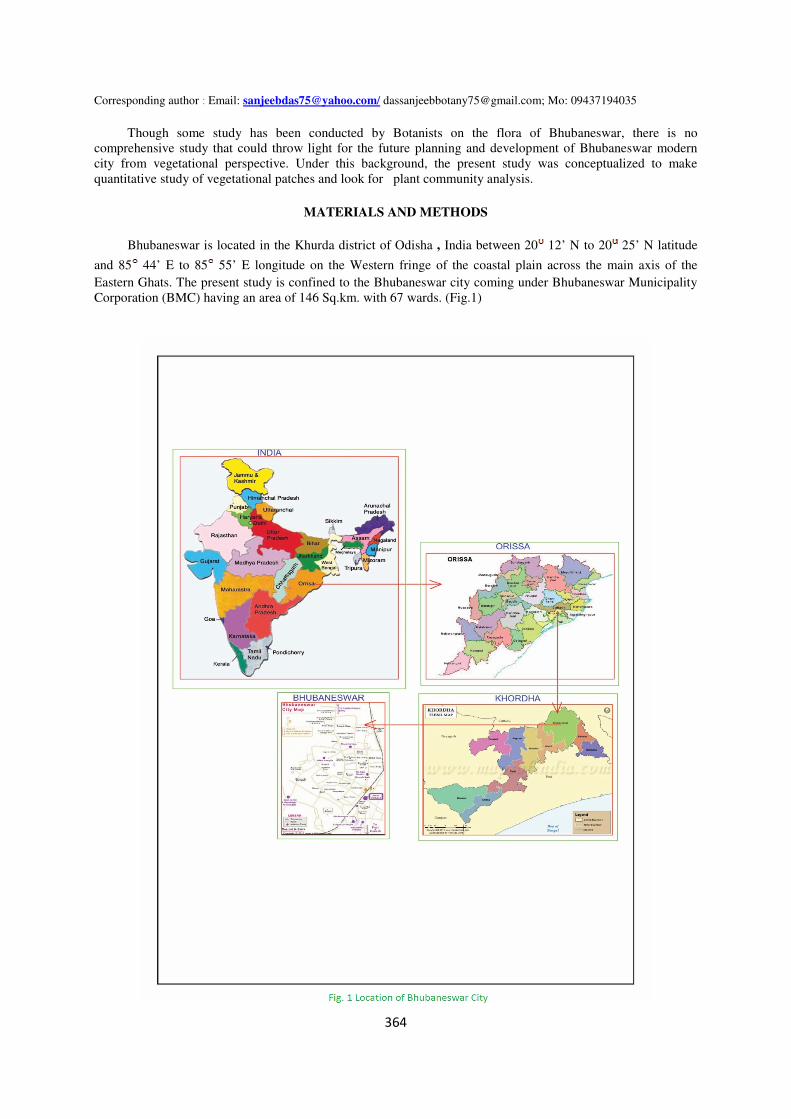
Bhubaneswar is located in the Khurda district of Odisha , India between 20 12’ N to 20 25’ N latitude
and 85 44’ E to 85 55’ E longitude on the Western fringe of the coastal plain across the main axis of the Eastern Ghats. The present study is confined to the Bhubaneswar city coming under Bhubaneswar Municipality Corporation (BMC) having an area of 146 Sq.km. with 67 wards. (Fig.1)

365
The present study was based on primary data collected through the survey from holistic and eco-systematic perceptiveness. The plants collected repeated field trips were identified in the Botany section of Regional Institute of Education, Bhubaneswar and documented following the “The Botany of Bihar and Orissa” (HAINES, 1925) and “Flora of Orissa” ( SAXENA AND BRAHMAN, 1996). For plant community (vegetation) analysis, the central part of the Bhubaneswar city was taken as the Central zone (CZ). Samples were collected from randomly selected four wards such as WN-28, WN-17, WN-37 and WN-36. The area 10 kms radius surrounding the Central Zone was considered as the Transition Zone (TZ). Sampling wards in this zone included WN-23, WN-02, WN-32 and WN-67. (Fig.2)

366
Plant community was quantitatively analyzed following Quadrate method. From each (Central as well as Transition) zone, four sampling sites were randomly selected and from each site, 10 quadrates were taken and the size of each quadrate was decided looking into the nature of vegetation of the locality. Vegetation data were analyzed by their synthetic characters like Abundance (A), Frequency (F), Density (D), Relative Density (RD), Relative Frequency (RF), Relative Dominance (RDO), Basal Area (BA), Importance Value Index (IVI) following the standard formulae (KORMONDY, 1969). Family Importance Value (FIV) was calculated (GANESH et al., 1996) representing the sum of relative density, relative diversity and relative dominance of the family. Abundance / Frequency (A/F) ratio was calculated to describe the distribution pattern of a species (CURTIS AND COTTON, 1956). I) Abundance: It represents the number of individuals of any species per unit area of occurrence. It was calculated as follows:
Abundance = Total no.of individualof thespecies in all quadrats
No.of quadrats in which species occurred
II) Frequency: Frequency is the number of sampling units in which a particular species occurs and this was calculated as follows:
Frequency =No.of quadrats in which species occured
Total no.of Sampling Unit Studied
III) Density: The number of individuals of the species in an unit area is its density. It was calculated as follows
Density (%) = No.of individuals of the species
Total Area studied
IV) Dominance: Dominance is the stem area occupied by stem of a species in any given area. It is calculated by measuring the diameter of the individual stems and adding the stem areas of the species in a given area. Basal area of the species = Sum of the basal areas of all individuals present. V) Relative Density: This is calculated by the following formula
Relative density = Density of thespecies
× 100Totaldensity of all thespecies
VI) Relative Frequency: Relative frequency of the species is calculated by using the following formula:
Relative Frequency = Frequency of thespecies
×100Total frequency of all species
VII) Relative Dominance: This is calculated by the following formula
Relative dominance = Dominance (cover) of thespecies
Totaldominance of allspecies
VIII) Importance Value Index (IVI): This is a value that reflects the relative importance of the individual species in the study area. It is calculated by adding relative density, relative dominance and relative frequency values for each species (CURTIS AND COTTON, 1956, PHILIP, 1959). IVI = Relative Dominance + Relative Density + Relative Frequency. IX) Family Importance Value (FIV): It represents the sum of relative density, relative diversity and relative dominance of the family. FIV = Relative Density + Relative Diversity + Relative Dominance (for single family) X) Abundance / Frequency ratio (A/F)
This is the ratio of the abundance and frequency of the given species (CURTIS AND COTTON, 1956). It is used to describe the distribution pattern of the species in the area. The distribution of plants is said to be regular, random and clumped or contagious when the value of A/F ratio is <0.025, 0.025-0.05 and >0.05 respectively.

367
XI) Diversity Indices
Diversity indices are values propounded by various ecologists which incorporate several parameters into single values. Diversity indices such as Shannon – Wiener Index, Concentration of Dominance (CD), Species Richness (SR) and Species Evenness (SE) were calculated for herb, shrub and tree species both for Central as well as Transition Zones (SIMPSON, 1949; WHITTAKER, 1977) a) Shannon - Wiener Index: It is a measure of general diversity (SHANNON AND WIENER, 1963) determined with the information function.
=
−=′S
i
pipiH1
ln
Where =′H Shannon index of general diversity
pi = proportion of its species in that community i.e ni / N
ln = natural log s =Total number of species present in the area pi = ni / N
Where in i = No. of Individuals in a species N = Total number .of individuals in all species present. The Shannon index is a measure for diversity (SHANNON, 1949). Values smaller than 2 indicate low diversity, while values greater than 2 point to a high diverse stand. b) Concentration of Dominance (CD): It is the inverse of diversity is measured by Simpson’s index (Simpson, 1949)
=
−=′1
2)(i
piH
Where pi = proportion of its species in that community
c) Species Richness (SR): Species richness is a measure of the number of species found in a sample. It is calculated by the number of species present in the sample is divided by the square root of the number of individuals in the sample. This particular measure of species richness is known as D (Menhinick's index). (WHITTAKER, 1977)
D = s /√N Where s = The number of different species present in the sample, and N = Total number of individuals one species. d) Species Evenness (SE): The distribution of individuals over species is called species evenness. It is measure of the relative abundance of different species making up the richness of an area. This evenness is an important component of diversity indices (LEINSTER AND COBBOLD, 2012). Several equations have been proposed to calculate evenness from diversity measure. The most important and accepted one is Pielou index (J). It is calculated as
)ln(s
HJ
′= .
Where J = Pielou’s Equitability index =′H Shannon Wiener diversity index
S = Total no. of species present in the area ln = logarithm to the base. The Pielou’s index is a measure of how evenly distributed abundance is among the species that exists in a community. The Pielou index is defined between 0 and 1, where 1 represents a community with perfect evenness and decreases to zero as the relative abundances of the species diverge from evenness.
RESULTS
In the Central Zone, 592 plant species were recorded in all the three seasons from which 314 plants were common. As such 278 different plant species were recorded in the four selected sites. Similarly in the Transition Zones, 294 different plant species were recorded.
368
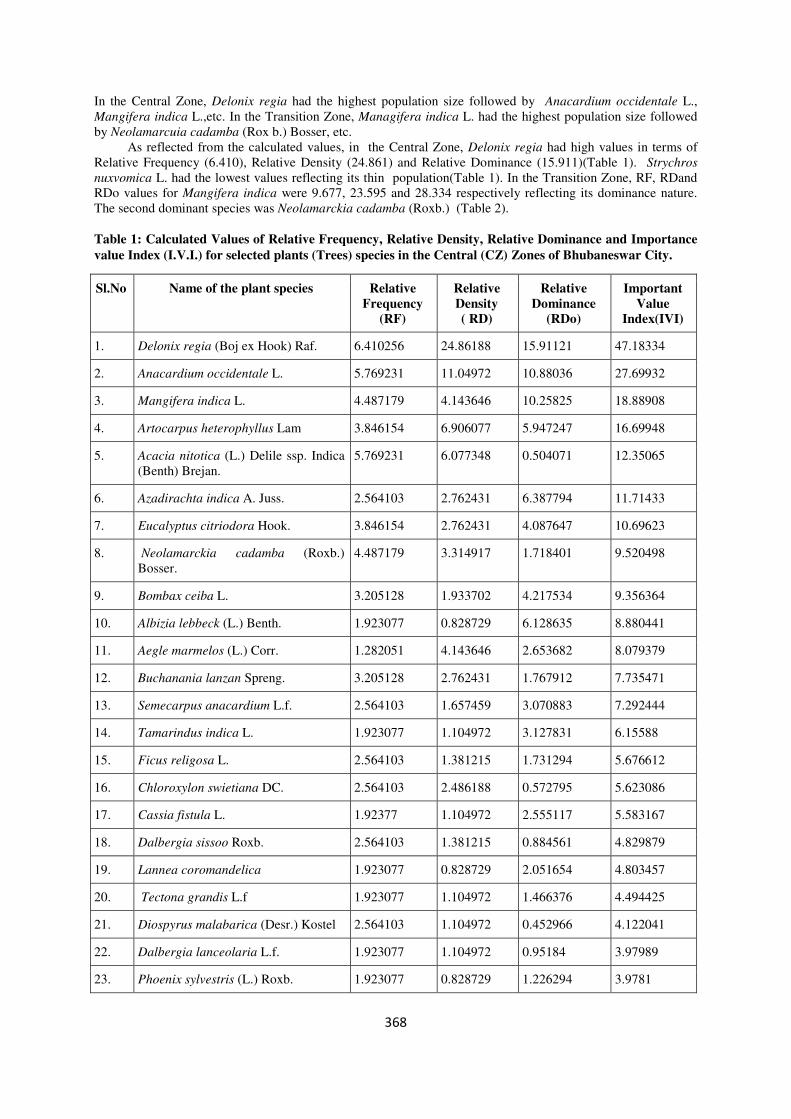
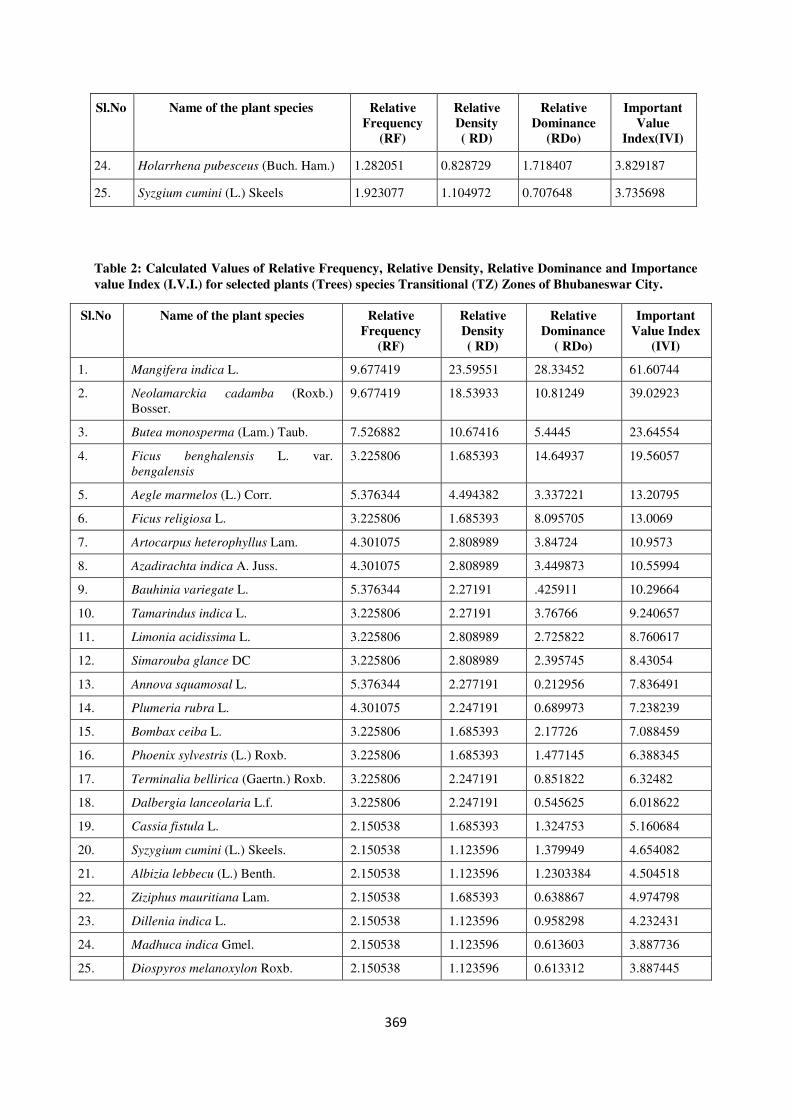
In the Central Zone, Delonix regia had the highest population size followed by Anacardium occidentale L., Mangifera indica L.,etc. In the Transition Zone, Managifera indica L. had the highest population size followed by Neolamarcuia cadamba (Rox b.) Bosser, etc. As reflected from the calculated values, in the Central Zone, Delonix regia had high values in terms of Relative Frequency (6.410), Relative Density (24.861) and Relative Dominance (15.911)(Table 1). Strychros nuxvomica L. had the lowest values reflecting its thin population(Table 1). In the Transition Zone, RF, RDand RDo values for Mangifera indica were 9.677, 23.595 and 28.334 respectively reflecting its dominance nature. The second dominant species was Neolamarckia cadamba (Roxb.) (Table 2). Table 1: Calculated Values of Relative Frequency, Relative Density, Relative Dominance and Importance
value Index (I.V.I.) for selected plants (Trees) species in the Central (CZ) Zones of Bhubaneswar City.
Sl.No Name of the plant species Relative
Frequency (RF)
Relative
Density ( RD)
Relative
Dominance (RDo)
Important
Value Index(IVI)
1. Delonix regia (Boj ex Hook) Raf. 6.410256 24.86188 15.91121 47.18334
2. Anacardium occidentale L. 5.769231 11.04972 10.88036 27.69932
3. Mangifera indica L. 4.487179 4.143646 10.25825 18.88908
4. Artocarpus heterophyllus Lam 3.846154 6.906077 5.947247 16.69948
5. Acacia nitotica (L.) Delile ssp. Indica (Benth) Brejan.
5.769231 6.077348 0.504071 12.35065
6. Azadirachta indica A. Juss. 2.564103 2.762431 6.387794 11.71433
7. Eucalyptus citriodora Hook. 3.846154 2.762431 4.087647 10.69623
8. Neolamarckia cadamba (Roxb.) Bosser.
4.487179 3.314917 1.718401 9.520498
9. Bombax ceiba L. 3.205128 1.933702 4.217534 9.356364
10. Albizia lebbeck (L.) Benth. 1.923077 0.828729 6.128635 8.880441
11. Aegle marmelos (L.) Corr. 1.282051 4.143646 2.653682 8.079379
12. Buchanania lanzan Spreng. 3.205128 2.762431 1.767912 7.735471
13. Semecarpus anacardium L.f. 2.564103 1.657459 3.070883 7.292444
14. Tamarindus indica L. 1.923077 1.104972 3.127831 6.15588
15. Ficus religosa L. 2.564103 1.381215 1.731294 5.676612
16. Chloroxylon swietiana DC. 2.564103 2.486188 0.572795 5.623086
17. Cassia fistula L. 1.92377 1.104972 2.555117 5.583167
18. Dalbergia sissoo Roxb. 2.564103 1.381215 0.884561 4.829879
19. Lannea coromandelica 1.923077 0.828729 2.051654 4.803457
20. Tectona grandis L.f 1.923077 1.104972 1.466376 4.494425
21. Diospyrus malabarica (Desr.) Kostel 2.564103 1.104972 0.452966 4.122041
22. Dalbergia lanceolaria L.f. 1.923077 1.104972 0.95184 3.97989
23. Phoenix sylvestris (L.) Roxb. 1.923077 0.828729 1.226294 3.9781
369
Sl.No Name of the plant species Relative
Frequency
(RF)
Relative
Density
( RD)
Relative
Dominance
(RDo)
Important
Value
Index(IVI)
24. Holarrhena pubesceus (Buch. Ham.) 1.282051 0.828729 1.718407 3.829187
25. Syzgium cumini (L.) Skeels 1.923077 1.104972 0.707648 3.735698
Table 2: Calculated Values of Relative Frequency, Relative Density, Relative Dominance and Importance
value Index (I.V.I.) for selected plants (Trees) species Transitional (TZ) Zones of Bhubaneswar City.
Sl.No Name of the plant species Relative
Frequency
(RF)
Relative
Density
( RD)
Relative
Dominance
( RDo)
Important
Value Index
(IVI)
1. Mangifera indica L. 9.677419 23.59551 28.33452 61.60744
2. Neolamarckia cadamba (Roxb.) Bosser.
9.677419 18.53933 10.81249 39.02923
3. Butea monosperma (Lam.) Taub. 7.526882 10.67416 5.4445 23.64554
4. Ficus benghalensis L. var. bengalensis
3.225806 1.685393 14.64937 19.56057
5. Aegle marmelos (L.) Corr. 5.376344 4.494382 3.337221 13.20795
6. Ficus religiosa L. 3.225806 1.685393 8.095705 13.0069
7. Artocarpus heterophyllus Lam. 4.301075 2.808989 3.84724 10.9573
8. Azadirachta indica A. Juss. 4.301075 2.808989 3.449873 10.55994
9. Bauhinia variegate L. 5.376344 2.27191 .425911 10.29664
10. Tamarindus indica L. 3.225806 2.27191 3.76766 9.240657
11. Limonia acidissima L. 3.225806 2.808989 2.725822 8.760617
12. Simarouba glance DC 3.225806 2.808989 2.395745 8.43054
13. Annova squamosal L. 5.376344 2.277191 0.212956 7.836491
14. Plumeria rubra L. 4.301075 2.247191 0.689973 7.238239
15. Bombax ceiba L. 3.225806 1.685393 2.17726 7.088459
16. Phoenix sylvestris (L.) Roxb. 3.225806 1.685393 1.477145 6.388345
17. Terminalia bellirica (Gaertn.) Roxb. 3.225806 2.247191 0.851822 6.32482
18. Dalbergia lanceolaria L.f. 3.225806 2.247191 0.545625 6.018622
19. Cassia fistula L. 2.150538 1.685393 1.324753 5.160684
20. Syzygium cumini (L.) Skeels. 2.150538 1.123596 1.379949 4.654082
21. Albizia lebbecu (L.) Benth. 2.150538 1.123596 1.2303384 4.504518
22. Ziziphus mauritiana Lam. 2.150538 1.685393 0.638867 4.974798
23. Dillenia indica L. 2.150538 1.123596 0.958298 4.232431
24. Madhuca indica Gmel. 2.150538 1.123596 0.613603 3.887736
25. Diospyros melanoxylon Roxb. 2.150538 1.123596 0.613312 3.887445

370
From frequency class distribution of plant species in both Central and Transition Zones, it was observed that Central Zone site-1 and site –4 showed disturbed vegetation whereas in the Transition Zone, except site-2, other three sites (Site – 1, Site – 3, and Site –4) showed disturbed vegetation. (Table-3).
Table 3: Frequency class distribution of plant species in both Central & Transition Zones of Bhubaneswar City.
Frequency classes (%)
Site-1( CZ-1) Site-2( CZ-2) Site-3( CZ-3) Site-4( CZ-4) No. of species
% of total no. of spp.
No. of species
% of total no. of spp.
No. of species
% of total no. of spp.
No. of species
% of total no. of spp.
Central Zones( TZ)
1-20 43 51.80 49 56.32 29 63.04 27 66
21-40 18 21.68 12 13.79 7 15.21 6 13.33
41-60 4 4.81 3 3.44 2 4.34 1 2.22
61-80 16 7.22 9 10.34 4 8.09 3 6.66
81-100 12 14.45 14 16.09 6 13.04 8 17.77
Transition Zones( TZ)
Site-1( TZ-1) Site-2( TZ-2) Site-3( TZ-3) Site-4( TZ-4)
1-20 35 28.45 28 31.46 14 35 10 29.41
21-40 36 29.26 22 24.71 8 20 11 32.35
41-60 10 8.13 5 5.61 2 5 1 2.94
61-80 22 17.88 15 16.85 5 12.5 6 17.64
81-100 20 16.26 19 21.34 12 30 5 14.70
The Importance Value Index (IVI) represents the phytosociological structure of a species in the community. The IVI values ranged between 1.171 to 47.183 in Central Zones (Table-1) and 3.887 to 61.607 in Transition Zones (Table 2). The dominant species in terms of IVI values were D. regia, & A. occidentale and
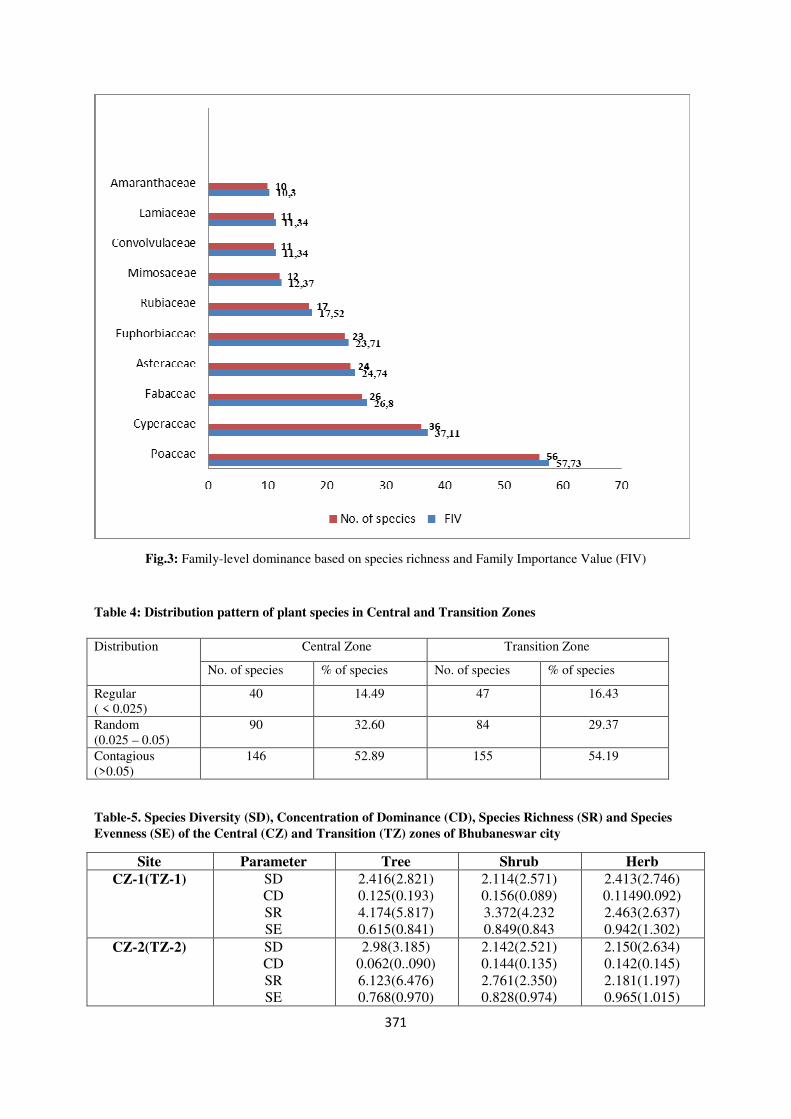
M. indica L. & Neolarmarckia cadamba in central and transition zones respectively. Family Importance Value (FIV) data showed that the most dominant family was Poaceae (57.73) followed by Cyperaceae (37.11), and Fabaceae (26.80), (Fig. 3). In terms of species richness, family Poaceae (33 genera 56 species) had the highest species richness followed by Cyperaceae (6 genera, 36 species). In central zone, out of 276 species, 146 species show contagious distribution, 90 species had random distribution and 40 species had regular distribution. Petrospermum
acerifolium, Acacia nilotica, Butea Monosperma etc. were contagiously distributed, Ficus racemosa the, Bombax ceiba, Artocarpus heterophyllus, etc. were randomly distributed . In the Transition Zone, out of 286 species, 155 species showed contagious distribution, 84 species had random distribution and 47 had regular distribution (Table 4). Different diversity indices like Species Diversity (SD), Concentration of Dominance (CD), Species Richness (SR) and Species Evenness (SE) for tree, shrub and herb species for both Central and Transition Zones has been shown in Table 5.
371
Fig.3: Family-level dominance based on species richness and Family Importance Value (FIV)
Table 4: Distribution pattern of plant species in Central and Transition Zones
Distribution Central Zone Transition Zone
No. of species % of species No. of species % of species
Regular ( < 0.025)
40 14.49 47 16.43
Random (0.025 – 0.05)
90 32.60 84 29.37
Contagious (>0.05)
146 52.89 155 54.19
Table-5. Species Diversity (SD), Concentration of Dominance (CD), Species Richness (SR) and Species
Evenness (SE) of the Central (CZ) and Transition (TZ) zones of Bhubaneswar city
Site Parameter Tree Shrub Herb
CZ-1(TZ-1) SD CD SR SE
2.416(2.821) 0.125(0.193) 4.174(5.817) 0.615(0.841)
2.114(2.571) 0.156(0.089) 3.372(4.232 0.849(0.843
2.413(2.746) 0.11490.092) 2.463(2.637) 0.942(1.302)
CZ-2(TZ-2) SD CD SR SE
2.98(3.185) 0.062(0..090) 6.123(6.476) 0.768(0.970)
2.142(2.521) 0.144(0.135) 2.761(2.350) 0.828(0.974)
2.150(2.634) 0.142(0.145) 2.181(1.197) 0.965(1.015)

372
CZ-3(TZ-3) SD CD SR SE
1.746(3.015) 0.327(0.089) 3.524(5.432) 0.617(0.915)
1.854(2.015) 0.148(0.139) 2.372(2.431) 0.842(1.942)
2.043(2.183) 0.138(0.173) 2.182(1.835) 0.745(0.726)
CZ-4(TZ-4_) SD CD SR SE
2.047(1.990) 0.119(0.317) 4.242(4.215) 0.645(0.794)
1.764(1.842) 0.147(0.167) 2.242(2.435) 0.843(0.817)
1.904(1.940 0.185(0.134) 1.464(2.248) 0.945(0.846)
Average(CZ/TZ) SD CD SR SE
2.290(2.750) 0.158(0.172) 4.515(5.485) O.661(0.868)
1.968(2,246) 0.148(0.132) 2.68(2.862)
3.362(0.894)
2.127(2.365) 0.144(0.136 2.072(1.753) 0.899(0.972)
Table 4: Distribution pattern of plant species in Central and Transition Zones
Distribution Central Zone Transition Zone
No. of species % of species No. of species % of species
Regular ( < 0.025)
40 14.49 47 16.43
Random (0.025 – 0.05)
90 32.60 84 29.37
Contagious (>0.05)
146 52.89 155 54.19
Table-5. Species Diversity (SD), Concentration of Dominance (CD), Species Richness (SR) and Species
Evenness (SE) of the Central (CZ) and Transition (TZ) zones of Bhubaneswar city
Site Parameter Tree Shrub Herb
CZ-1(TZ-1) SD CD SR SE
2.416(2.821) 0.125(0.193) 4.174(5.817) 0.615(0.841)
2.114(2.571) 0.156(0.089) 3.372(4.232 0.849(0.843
2.413(2.746) 0.11490.092) 2.463(2.637) 0.942(1.302)
CZ-2(TZ-2) SD CD SR SE
2.98(3.185) 0.062(0..090) 6.123(6.476) 0.768(0.970)
2.142(2.521) 0.144(0.135) 2.761(2.350) 0.828(0.974)
2.150(2.634) 0.142(0.145) 2.181(1.197) 0.965(1.015)
CZ-3(TZ-3) SD CD SR SE
1.746(3.015) 0.327(0.089) 3.524(5.432) 0.617(0.915)
1.854(2.015) 0.148(0.139) 2.372(2.431) 0.842(1.942)
2.043(2.183) 0.138(0.173) 2.182(1.835) 0.745(0.726)
CZ-4(TZ-4_) SD CD SR SE
2.047(1.990) 0.119(0.317) 4.242(4.215) 0.645(0.794)
1.764(1.842) 0.147(0.167) 2.242(2.435) 0.843(0.817)
1.904(1.940 0.185(0.134) 1.464(2.248) 0.945(0.846)
Average(CZ/TZ) SD CD SR SE
2.290(2.750) 0.158(0.172) 4.515(5.485) O.661(0.868)
1.968(2,246) 0.148(0.132) 2.68(2.862)
3.362(0.894)
2.127(2.365) 0.144(0.136 2.072(1.753) 0.899(0.972)

373
DISCUSSION
The flora of Bhubaneswar and its surroundings are broadly classified as north tropical moist deciduous (mixed) type. The entire area before construction of the capital city was under different reserve forests like Bharatpur and Rampur protected forests covering 1553.6886 Sq.Km (27%) of the total area of 5664 sq.km dominated by Sal and Bamboos. The biotic factors have changed the original characters of the vegetation and presently the North-western part of the city, the Bharatpur Reserve Forest spreads over 847.53 Sq.Km.(OFDC, 2017).
So far as the distribution of plant species in different sites of the central zone, it was observed that the site –1(CZ – 1) and site –2 (CZ – 2) had more number of species as compared to other sites. It could be due to institutional campus territory which is well protected and conserved without disturbance Plants in site- 3 (CZ – 3) and site- 4 (CZ – 4) were found to be less in number because of developmental works such as construction of buildings and high rise apartments, roads, etc. The transition zone that stands in continuation with forest areas beyond its limit had more number of plant species in rainy season. In two of its sites (TZ–3 and TZ –4) plants were less in number, probably due to construction activities round the year.
Structure, composition and function are the three important attributes of plant communities. The analytical features such as RF, RD, RDO, IVI and Species Diversity (SD) showed marked differences among the study sites. This possibly could be due to variations in soil conditions, local climate and biotic (positive/negative) interferences (TIMILSINA et al., 2017). The vegetation of any place is the outcome interaction of many factors such as the elevation, soil, species composition and biotic interferences. (BLISS, 1963). The values of vegetation parameters obtained for most of the sites in the present study suggest interesting composition and structure of existing plants in the city. The obtained results have time and again are not in tune with the popular opinion of complete devastation of plants due to habitation and city development. Neither has it supported destruction due to the catastropy of super cyclone in 1999.
In the present study, 52.89 (Central Zone) and 54.19 (Transitional Zone) percent of the total species showed contagious pattern of distribution which is the characteristic feature of natural vegetation (ODUM,1971).Among the sites, an overview distribution pattern (A/F ratio) for herb, shrub and tree layers showed contagious growth pattern followed by random. These points strongly argue that the Bhubaneswar city which is just adjacent to the Chandaka reserve forest have at least some areas with vegetation having a good species composition (unlike other cities) though not highly diversified like a forest. The nature of distribution shows a ray of natural impact over anthropogenic disturbance, of course not in any case as it happens in a forest community. . The value of diversity index in the present study ranged from 1.746 to 3.185 for trees, 1.764 to 2.571 for shrubs and 1.904 to 2.746 for herbs. The diversity index is generally higher in tropical forests (5.06) (Knight, 1975) whereas for Indian forest, it ranged between 0.83 to 4.90 (PARTHASARATHY, 1999; KUMAR et. al., 2006). The value of diversity index found in the present study, though cannot be compared with the forest community mentioned above, may certainty be considered as interesting and not very poor as usual in case of modern cities. The species dominance for shrubs and herbs was higher in Transitional Zone than the Central zone. However in transitional zone, TZ-1 and TZ-2 showed more species richness than the CZ-1 and CZ-2 of central zone. This could be because of less degree of interference in the Transitional Zone. However, low species richness in the central zone, could be due to anthropogenic activities, such as road expansion, construction of residential areas, etc. Further because of invasion of large number of alien species, species richness level increased by lowering the dominance of few other species.
The Concentration of Dominance (CD) of the present study ranged from 0.132 to 0.158. This value reported for plant community stands always at the bottom line with an indication of diversity than dominance. The evenness of plant species in Transition Zone shows more values than the Central Zone as the number of individuals of most abundant species is extremely greater than the least abundant species.
The species dominance for shrubs and herbs was higher in Transitional Zone than the central zone. However in the transitional zone, TZ-1 and TZ-2 showed more species richness than the CZ-1 and CZ-2 of central zone. This could be because of less degree of interference in the Transitional Zone. However, due to anthropogenic activities, such as road expansion, modernization of the city, construction of residential areas, etc. in the central zone, low species richness was recorded. Further due to invasion of large number of alien species, species richness of shrubs and herbs level increases by lowering the dominance of few other species. This situation is suitable to release resources available to early successional species and increasing environmental heterogeneity that provides a basis for specialization and resource partitioning (DENSLOW, 1980).
374
From Raunkier’s frequency class analysis, it was observed that in the Central Zone, sites such as CZ-1 and CZ-2 were undisturbed (uniform) whereas CZ-3 and CZ-4 exhibited disturbed vegetation. Similarly in the Transitional Zone, except TZ-2, other three sites (TZ-1, TZ-3 and TZ-4) showed disturbed vegetation. This indicated that the vegetation is under severe anthropogenic, biotic and abiotic stress. With the increase of aesthetic sense among people specially students, and women, many gardens and a forestation programmes in the undisturbed site (uniform) have been initiated in and around the city, which became the major sites for introduction of new species.
Bhubaneswar being a fast expanding city, there is an urgent need for proper planning with emphasis on minimising anthropogenic interference(s) at least in undisturbed sites in the core and peripheral zones of the city in order to keep the age old vegetation especially trees intact besides their sustainable use.
ACKNOWLEDGEMENT
The authors acknowledge with thanks the Principal, Regional Institute of Education ((NCERT) Bhubaneswar for extending necessary support and facilities for the present study and Prof. R.C. Mohanty, Emeritus Scientist Utkal University, Bhubaneswar for his encouragement and technical advice.
REFERENCES
BLISS, L.C., 1963. Apline Plant Communities of the Presidential Range. New Hampshire. Eco., 44(4): 678-697. CURTIS, J.T., COTTON, G., 1956. Plant Ecology Workbook Laboratory Field Reference Manual-Burgess
Publishing Co., Minnesota. DENSLOW, J.S., 1980. Gap partitioning among tropical rain forest trees. Biotropica., 12: 47-55. GANESH, T., GANESAN, R., SOUBADRADEVY, M., DAVIDAR, P. AND BAWA, K.S., 1996. Assessment
of plant biodiversity at a mid-elevation evergreen forest of Kalakad-Mudanthurai tiger reserve, Western Ghat, India. Curr. Sci., 71: 379-92.
HAINES, H.H., 1921-25. The Botany of Bihar and Orissa. 6 Parts. Adlard and Sons & West Newman Ltd., London.
KNIGHT, D.H., 1975. A Phytosociological analysis of species rich tropical forest on Barro Colorado Island, Panama. Ecol. Monogr., 45: 256-289. KORMONDAY, E.J., 1969. Concepts of Ecology- Prentice Hall. Inc., Englewood Cliffs, NewJersey. KUMAR, A., SAXENA, A. & MARCOT, B.G., 2006. Tree species diversity and distribution patterns in tropical
forests of Garo hills. Curr. Sci., 91(10): 1370-1381. KULSHRESTHA S.K., 2016. Smart Cities: A new competitive approach to Urban Transformations. Institute of
Town planner. Indian J., 13(1): 1-19. LEINSTER, T., C. A. COBBOLD ., 2012. Measuring diversity: the importance of species similarity. Ecol.,
93(3): 477–489. ODUM, E.P., 1971. Fundamentals of Ecology, 3rd Edition.W.B. Saunders Co., Philadelphia. OFDC Report. 2017. Annual Report of Forest Department. Orissa Forest Development Corporation.
Government of Orissa, Bhubaneswar. PARTHASARATHY, N., 1999. Tree diversity and distribution in undisturbed and human-impacted sites of
tropical west evergreen forest in Southern Western Ghats. India. Biodivers. Conserv., 8: 1365-1381. PHILIPS, E.A., 1959. Methods of Vegetation Study, A Holt Dryden book. Henry Holt and Company,
Incorporation. RAUNKIAER, C., 1934. The Life Form of Plants and Statistical Plant Geography. Oxford University Press,
UK. ROUT D.K., DASH, M.C., 1998. Environment status of Bhubaneswar. Orissa Pollution Control Board,
Bhubaneswar. SAXENA, H.O. AND BRAHMAN, M., 1994-96. Flora of Orissa. Vol.1- 4. Orissa Forest Development
Corporation, Bhubaneswar. SHANNON C.E., 1949. The Mathematical theory of communication. University Illinois Press, Urbana. SHANNON C.E., W. WIENER., 1963. The Mathematical theory of communication. University Illinois Press,
Urbana. SIMPSON E.H., 1949. Measurement of Diversity. Nature., STANLEY., 2008. Monitoring land-cover changes: a comparison of change detection techniques. Int. J. Remote
sens., 20:139-339. TIMILSINA, N., ROSS, MS & HEINEN, J.T., 2017. A community analysis of Sal (Shorea robusta) forests in the Western Terai of Nepal. Forest Ecol. Manag., 241: 223-234. WHITTAKER, R.H., 1977. Dominance and diversity in land plant communities. Sci., 147: 250-260.