vehicle technologies and fuel cell technologies program ... · vehicle technologies and fuel cell...
TRANSCRIPT
Vehicle Technologies and Fuel Cell Technologies Program: Prospective Benefits Assessment Report for Fiscal Year 2016
ANL/ESD-16/2
Energy Systems Division

DisclaimerThis report was prepared as an account of work sponsored by an agency of the United States Government. Neither the United States Government nor any agency thereof, nor UChicago Argonne, LLC, nor any of their employees or officers, makes any warranty, express or implied, or assumes any legal liability or responsibility for the accuracy, completeness, or usefulness of any information, apparatus, product, or process disclosed, or represents that its use would not infringe privately owned rights. Reference herein to any specific commercial product, process, or service by trade name, trademark, manufacturer, or otherwise, does not necessarily constitute or imply its endorsement, recommendation, or favoring by the United States Government or any agency thereof. The views and opinions of document authors expressed herein do not necessarily state or reflect those of the United States Government or any agency thereof, Argonne National Laboratory, or UChicago Argonne, LLC.
About Argonne National Laboratory Argonne is a U.S. Department of Energy laboratory managed by UChicago Argonne, LLC under contract DE-AC02-06CH11357. The Laboratory’s main facility is outside Chicago, at 9700 South Cass Avenue, Argonne, Illinois 60439. For information about Argonne and its pioneering science and technology programs, see www.anl.gov.
DOCUMENT AVAILABILITY
Online Access: U.S. Department of Energy (DOE) reports produced after 1991 and a growing number of pre-1991 documents are available free via DOE’s SciTech Connect (http://www.osti.gov/scitech/).
Reports not in digital format may be purchased by the public from the National Technical Information Service (NTIS):
U.S. Department of Commerce National Technical Information Service 5301 Shawnee Rd Alexandria, VA 22312 www.ntis.gov Phone: (800) 553-NTIS (6847) or (703) 605-6000 Fax: (703) 605-6900 Email: [email protected]
Reports not in digital format are available to DOE and DOE contractors from the Office of Scientific and Technical Information (OSTI):
U.S. Department of Energy Office of Scientific and Technical Information P.O. Box 62 Oak Ridge, TN 37831-0062 www.osti.gov Phone: (865) 576-8401 Fax: (865) 576-5728 Email: [email protected]

Vehicle Technologies and Fuel Cell Technologies Program: Prospective Benefits Assessment Report for Fiscal Year 2016
ANL/ESD-16/2
byT.S. Stephens1, C.H. Taylor2, J.S. Moore2, and J. Ward3
1 Energy Systems Division, Argonne National Laboratory2 TA Engineering, Inc.3 U.S. Department of Energy, Office of Energy Efficiency and Renewable Energy
February 23, 2016


v
CONTENTS ACRONYMS ................................................................................................................................. ix
ABSTRACT .................................................................................................................................... 1
1 INTRODUCTION AND PROGRAM OVERVIEW ................................................................. 3
2 PROGRAM ACTIVITIES, MILESTONES, AND OUTPUTS ................................................ 5
2.1 Vehicle Technologies Office Program .............................................................................. 5 2.1.1 Batteries and Electric Drive Technologies ............................................................ 5 2.1.2 Advanced Combustion Engine R&D .................................................................... 6 2.1.3 Materials Technology R&D .................................................................................. 6 2.1.4 Fuels and Lubricant Technologies R&D ............................................................... 7 2.1.5 Vehicle Systems .................................................................................................... 7 2.1.6 Outreach, Deployment, and Analysis .................................................................... 8
2.2 Fuel Cell Technologies Office Program ............................................................................ 8 2.3 Summary of Fuel Savings by Technology Area ................................................................ 9
3 TRANSLATING PROGRAM GOALS INTO MODEL INPUT ............................................ 14
3.1 Light-Duty Vehicle Analysis ........................................................................................... 15 3.1.1 Light-Duty Vehicle Attributes and Levelized Cost of Driving ........................... 15 3.1.2 Light-Duty Vehicle Market Penetration Modeling ............................................. 17 3.1.3 Light-Duty Vehicle On-Road Stock Modeling ................................................... 20 3.1.4 Attribution of Light-Duty Vehicle Benefits to Technology Areas ..................... 21
3.2 Heavy Truck Analysis ..................................................................................................... 29 3.2.1 Heavy Truck Baseline ......................................................................................... 29 3.2.2 Heavy Truck Advanced Technology Modeling .................................................. 30 3.2.3 Heavy Truck Market Penetration and Stock Modeling ....................................... 33 3.2.4 Attribution of Heavy Truck Benefits by Technology Area ................................. 34
4 RESULTS OF MODELING: MARKET PENETRATION AND FLEET FUEL ECONOMY ............................................................................................................................. 36
4.1 Light-Duty Vehicle Levelized Cost of Driving ............................................................... 36 4.2 Light-Duty Vehicle Market Penetration .......................................................................... 36 4.3 Average Light-Duty Vehicle Fuel Economy ................................................................... 43 4.4 Heavy Truck Market Penetration .................................................................................... 49 4.5 Average Heavy Truck Fuel Economy ............................................................................. 50
5 RESULTS OF MODELING: OVERALL BENEFITS OF THE VEHICLE TECHNOLOGIES AND FUEL CELL TECHNOLOGIES PROGRAMS ............................. 52
6 REFERENCES ......................................................................................................................... 56

vi
FIGURES 1 General Approach and Information Flow in the Benefits Analysis ...................................... 3
2 Reductions in Petroleum Consumption Attributable to VTO and FCTO Technology Areas in 2035 ...................................................................................................................... 11
3 Reductions in Petroleum Consumption Attributable to VTO and FCTO Technology Areas in 2050 ...................................................................................................................... 11
4 Reductions in Greenhouse Gas Emissions Attributable to VTO and FCTO Technology Areas in 2035 .................................................................................................. 13
5 Reductions in Greenhouse Gas Emissions Attributable to VTO and FCTO Technology Areas in 2050 .................................................................................................. 13
6 Projected Fuel Prices Used for Modeling, in 2010 Dollars per GGE ................................. 20
7 Average Annual Petroleum-Based Fuel Consumption per Car in 2050 for the No Program Case, Based on Market Share Modeled by LVCFlex. .................................... 24
8 Average Annual Petroleum-Based Fuel Consumption per Car in 2050 for the Program Success case, Based on Market Share Modeled by LVCFlex. ............................. 24
9 Average Annual Petroleum-Based Fuel Consumption per Car in 2050 for No Program and Program Success, Based on Market Share Projected by the LVCFlex Model. ................................................................................................................. 25
10 Average Annual Petroleum-Based Fuel Consumption in Cars in 2050 for No Program and Program Success, with Savings Due to Drivetrain Efficiency Improvements, and Those Due to Changes in the Stock Shares of Drivetrain Technologies Disaggregated ............................................................................................... 26
11 Average Annual Petroleum-Based Fuel Consumption in Light Trucks in 2050 for No Program and Program Success, Disaggregated into Savings Due to Drivetrain Efficiency Improvements, and Savings Due to Changes in the Stock Shares of Drivetrain Technologies ...................................................................................................... 27
12 Projected Levelized Cost of Driving of LDVs in 2025. ...................................................... 37
13 Projected Levelized cost of Driving of LDVs in 2035. ....................................................... 37
14 LDV Sales Shares by Powertrain Type for No Program and Program Success, Projected by the LVCFlex Model ....................................................................................... 38
15 LDV Sales Shares by Powertrain Type for No Program and Program Success, Projected by the MA3T Model ............................................................................................ 38
16 LDV Sales Shares by Powertrain Type for No Program and Program Success, Projected by the LAVE-Trans Model ................................................................................. 38
17 LDV Sales Shares by Powertrain Type for No Program and Program Success, Projected by the ParaChoice Model .................................................................................... 39

vii
FIGURES (CONT.) 18 LDV Sales Shares by Powertrain Type for No Program and Program Success,
Projected by the ADOPT Model ......................................................................................... 39
19 LDV Stock by Powertrain Type for No Program and Program Success, Projected by the LVCFlex Model ....................................................................................................... 41
20 LDV Stock by Powertrain type for No Program and Program Success, Projected by the MA3T model .................................................................................................................. 41
21 LDV stock by powertrain type for No Program and Program Success, Projected by the LAVE-Trans model ....................................................................................................... 42
22 LDV stock by powertrain type for No Program and Program Success, Projected by the ParaChoice model .......................................................................................................... 42
23 LDV stock by powertrain type for No Program and Program Success, Projected by the ADOPT model ............................................................................................................... 42
24 Fleet-Average Fuel Economies of New Cars, Light-Duty Trucks, and LDV Fleet for No Program and Program Success, Based on Market Projections of the LVCFlex Model .................................................................................................................. 44
25 Average On-Road Fuel Economy of Cars, Light-Duty Trucks, and LDV Fleet for No Program and Program Success, Based on Market Projections of the LVCFlex Model .................................................................................................................................. 44
26 Fleet-Average Fuel Economy of New Cars, Light-Duty Trucks, and LDV Fleet for No Program and Program Success, Based on Market Projections of the MA3T Model .................................................................................................................................. 45
27 Average On-Road Fuel Economy of Cars, Light-Duty Trucks, and LDV Fleet for No Program and Program Success, Based on Market Projections of the MA3T Model .................................................................................................................................. 45
28 Fleet-Average Fuel Economy of New Cars, Light-Duty Trucks, and LDV Fleet for No Program and Program Success, Based on Market Projections of the LAVE-Trans Model ........................................................................................................................ 46
29 Average On-Road Fuel Economy of Cars, Light-Duty Trucks, and LDV Fleet for No Program and Program Success, Based on Market Projections of the LAVE-Trans Model ........................................................................................................................ 46
30 Fleet-Average Fuel Economy of New Cars, Light-Duty Trucks, and LDV Fleet for No Program and Program Success, Based on Market Projections of the ParaChoice Model .................................................................................................................................. 47
31 Average On-Road Fuel Economy of Cars, Light-Duty Trucks, and LDV Fleet for No Program and Program Success, Based on Market Projections of the ParaChoice Model .................................................................................................................................. 47

viii
FIGURES (CONT.) 32 Fleet-Average Fuel Economy of New Cars, Light-Duty Trucks, and LDV Fleet for
No Program and Program Success, Based on Market Projections of the ADOPT Model .................................................................................................................................. 48
33 Average On-Road Fuel Economy of Cars, Light-Duty Trucks, and LDV Fleet for No Program and Program Success, Based on Market Projections of the ADOPT Model .................................................................................................................................. 48
34 Fleet-Average Fuel Economy of New Medium- and Heavy-Duty Trucks for No Program and Program Success ............................................................................................ 51
35 Average On-Road Fuel Economy of Medium- and Heavy-Duty Trucks for No Program and Program Success ............................................................................................ 51
36 Estimated Reduction in Oil Security Costs Based on Projections of LDV Sales from the LAVE-Trans Model and HT Sales from the TRUCK Model, with Uncertainty Intervals ........................................................................................................... 54
TABLES 1 Projected Reductions in Oil Consumption by U.S. Light-Duty Vehicle Fleet
Attributable to EERE, by Technology Area .......................................................................... 9
2 Projected Reductions in Petroleum Consumption by U.S. Fleet of Medium- and Heavy-Duty Trucks Attributable to VTO, by Technology Area ........................................ 10
3 Comparison of Key Characteristics of the Light-Duty Vehicle Choice Models ................. 19
4 Percent LDV Market Penetration Estimates for No Program and Program Success, from the LVCFlex Model .................................................................................................... 39
5 Percent LDV Market Penetration Estimates for No Program and Program Success, from the MA3T Model ......................................................................................................... 40
6 Percent LDV Market Penetration Estimates for No Program and Program Success, from the LAVE-Trans Model .............................................................................................. 40
7 Percent LDV Market Penetration Estimates for No Program and Program Success, from the ParaChoice Model ................................................................................................ 40
8 Percent LDV Market Penetration Estimates for No Program and Program Success, from the ADOPT Model ..................................................................................................... 41
9 Medium- and Heavy-Duty Truck Market Penetration Estimates for the Target Case, as Percentage of VMT ......................................................................................................... 49
10 Projected Benefits of Vehicle Technologies Office and Fuel Cell Technologies Office Programs .................................................................................................................. 53

ix
ACRONYMS ADOPT Automotive Deployment Option Projection Tool AEO Annual Energy Outlook BEV battery electric vehicle BIC best-in-class CAFE Corporate Average Fuel Economy CI compression ignition CO2 carbon dioxide DOE Department of Energy (United States) EERE Energy Efficiency and Renewable Energy EPA Environmental Protection Agency (United States) FASTSim Future Automotive Systems Technology Simulator FCTO Fuel Cell Technologies Office FCV fuel cell vehicle GGE gallon gasoline equivalent GHG greenhouse gas GREET Greenhouse Gases, Regulated Emissions, and Energy Use in Transportation
Model HEV hybrid electric vehicle HT heavy-duty truck HTEB Heavy Truck Energy Balance Model HTEBdyn Heavy Truck Energy Balance Dynamic Model ICE internal combustion engine LAVE-Trans Light-Duty Alternative Vehicle Energy Transitions Model LCD levelized cost of driving LDV light-duty vehicle NHTSA National Highway Transportation Safety Administration PEV plug-in electric vehicle PHEV plug-in hybrid electric vehicle R&D research and development

x
SI spark-ignition SUV sport utility vehicle TAE TA Engineering VMT vehicle miles traveled VTO Vehicle Technologies Office

1
VEHICLE TECHNOLOGIES AND FUEL CELL TECHNOLOGIES PROGRAM: PROSPECTIVE BENEFITS ASSESSMENT REPORT
FOR FISCAL YEAR 2016
by
T.S. Stephens, C.H. Taylor, J.S. Moore, and J. Ward
ABSTRACT
Under a diverse set of programs, the Vehicle Technologies and Fuel Cell Technologies offices of DOE’s Office of Energy Efficiency and Renewable Energy invest in research, development, demonstration, and deployment of advanced vehicle, hydrogen production, delivery and storage, and fuel cell technologies. This report estimates the benefits of successfully developing and deploying these technologies (a “Program Success” case) relative to a base case (the “No Program” case). The Program Success case represents the future with completely successful deployment of Vehicle Technologies Office (VTO) and Fuel Cell Technologies Office (FCTO) technologies. The No Program case represents a future in which there is no contribution after FY 2016 by the VTO or FCTO to these technologies.
The benefits of advanced vehicle, hydrogen production, delivery and storage, and fuel cell technologies were estimated on the basis of differences in fuel use, primary energy use, and greenhouse gas (GHG) emissions from light-, medium- and heavy-duty vehicles, including energy and emissions from fuel production, between the base case and the Program Success case. Improvements in fuel economy of various vehicle types, growth in the stock of fuel cell vehicles and other advanced technology vehicles, and decreased GHG intensity of hydrogen production and delivery in the Program Success case over the No Program case were projected to result in savings in petroleum use and GHG emissions. Benefits were disaggregated by individual program technology areas, which included the FCTO program and the VTO subprograms of batteries and electric drives; advanced combustion engines; fuels and lubricants; materials (for reduction in vehicle mass, or “lightweighting”); and, for medium- and heavy-duty vehicles, reduction in rolling and aerodynamic resistance. Projections for the Program Success case indicate that by 2035, the average fuel economy of on-road, light-duty vehicle stock could be 47% to 76% higher than in the No Program case. On-road medium- and heavy-duty vehicle stock could be as much as 39% higher. The resulting petroleum savings in 2035 were estimated to be as high as 3.1 million barrels per day, and reductions in GHG emissions were estimated to be as high as 500 million metric tons of CO2 equivalent per year.

2
The benefits of continuing to invest government resources in advanced vehicle and fuel cell technologies would have significant economic value in the U.S. transportation sector and reduce its dependency on oil and its vulnerability to oil price shocks.

3
1 INTRODUCTION AND PROGRAM OVERVIEW The Vehicle Technologies Office (VTO) of DOE’s Office of Energy Efficiency and Renewable Energy conducts research and development to (1) improve the energy efficiency of current cars, light trucks, and heavy vehicles, and (2) develop new technologies that will help transition vehicles away from using petroleum fuels. DOE’s Fuel Cell Technologies Office (FCTO) has a comprehensive portfolio of activities that address the barriers facing the development and deployment of hydrogen and fuel cells, with the ultimate goals of decreasing our dependence on oil, reducing carbon emissions, and enabling clean, reliable power generation. The analysis in this report concludes that the prospective benefits of these R&D activities will likely be significant, as more fuel-efficient vehicles and no-petroleum vehicles are adopted for use in the U.S. This report also describes scenarios for the commercialization of and FCTO technologies currently and soon-to-be under development, and methods for estimating the benefits expected from successful deployment of these technologies. A number of analytic models were used, including advanced vehicle simulation and power flow models that correlate the impacts of R&D activities to future fuel economy improvements and alternative drivetrain and hydrogen storage developments. Other models are used to estimate how more efficient and alternative fuel vehicles penetrate the on-road stock and the resulting reductions in energy use and greenhouse gas (GHG) emissions. The analysis links VTO and FCTO program goals to estimated benefits, as shown in Figure 1, which also indicates some of the models used for each step in the process. Further details on methods and assumptions are given in Section 3.
FIGURE 1 General Approach and Information Flow in the Benefits Analysis
Vehicle simulations
using VISION model
using customer vehicle choice
models
Market penetration
Fuel prices, etc.
Benefits by FCTO and VTO technology area
Petroleum, GHGs for on‐road stock
Energy‐ and GHG‐intensities from GREET
Vehicle simulations
using VISION model
using customer vehicle choice
models
Market penetration
Fuel prices, etc.
Benefits by FCTO and VTO technology area
Petroleum, GHGs for on‐road stock
Energy‐ and GHG‐intensities from GREET
Component‐level attributes
from VTO and FCTO program managers, and
Argonne and industry experts
Vehicle simulations
from VTO and FCTO program managers, and
Argonne and industry experts
Component‐level attributes
Component‐level attributes
from VTO and FCTO program managers, and
Argonne and industry experts
Vehicle simulations using Autonomie and HTEBdyn models
Component‐level attributes
from VTO and FCTO program managers, and Argonne and industry experts
using VISION model
using consumer vehicle choice models
Market penetration
Fuel prices and availability
Benefits by FCTO and VTO technology area
Petroleum, GHGs for on‐road stock
Energy‐ and GHG‐intensities from GREET
Vehicle simulationsVehicle simulations

4
The analyses documented here were made assuming the VTO and FCTO budget levels will remain at recent historical levels. The technology development plans and milestones for each VTO program and for the FCTO program are presented in Section 2, with the estimated petroleum savings and GHG reductions attributable to each program. Section 3 first lays out the baseline scenario, “No Program,” against which to measure VTO and FCTO program benefits and the “Program Success” scenario. The remainder of Section 3 details modeling of advanced vehicle technologies and how the estimated improvements in fuel economy are attributable to subprograms and key activities, first for light-duty vehicles, then for heavy trucks. Section 4 presents and discusses the resulting estimates of fuel economy improvements and projections of market penetration of VTO and FCTO program technologies. In Section 5, the benefits of the VTO and FCTO programs to the entire U.S. fleet, in terms of reductions in energy use and GHG emissions, and some of the economic implications of these reductions are discussed.

5
2 PROGRAM ACTIVITIES, MILESTONES, AND OUTPUTS 2.1 VEHICLE TECHNOLOGIES OFFICE PROGRAM Aligning with the President’s Climate Action Plan and all-of-the-above approach to American energy, the VTO supports a broad technology portfolio; adheres to a comprehensive and analysis-based strategy of research, development, demonstration, and deployment activities; and creates strategic public-private partnerships to develop new technologies and move them from the laboratory onto the road. As such:
• R&D focuses on reducing the cost, minimizing emissions, and improving the energy-related performance of a mix of medium- and long-term vehicle technologies, including advanced batteries, electric drive technologies, lightweight and propulsion materials, advanced combustion engines, advanced fuels and lubricants, and other enabling transportation technologies.
• Modeling, evaluation, and demonstration provide objective, publicly available
data to identify the most appropriate federal investments and pathways for technology improvements, along with lessons learned for cost-effective future deployment.
• Outreach and deployment provide technical assistance, tools, and resources to
help local communities and regions accelerate alternative fuel vehicle and infrastructure market growth and help consumers and fleets understand their options for saving money and reducing environmental impact.
• Strategic public-private research partnerships with industry (e.g., U.S. DRIVE
and 21st Century Truck Partnerships) leverage technical expertise, prevent duplication, ensure public funding remains focused on the most critical barriers to technology commercialization, and accelerate progress. Strategic public-private partnerships with end-users and other key stakeholders (e.g., Clean Cities, National Clean Fleets Partnership, and Workplace Charging Challenge) focus on overcoming market barriers and catalyzing private sector action to enable the widespread use of advanced technology vehicles.
2.1.1 Batteries and Electric Drive Technologies The VTO Batteries and Electric Drive Technologies subprogram supports development of the low-cost, high-energy batteries and low-cost, efficient electric drive systems needed for widespread adoption of plug-in electric vehicles (PEVs, including all-electric vehicles and plug-in hybrid electric vehicles).

6
Battery R&D focuses on the technologies necessary to reduce modeled high-volume battery costs from $300/kWh in 2014 to $125/kWh by 2022, a nearly 60% reduction, by funding research programs with partners in academia, at national laboratories, and in industry. These technologies include high-energy and high-power materials and systems that promise to significantly reduce the cost, weight, and volume of PEV batteries. The focus of the Electric Drive Technologies subprogram is on developing technologies and designs to reduce the cost, improve the performance, and increase the reliability of power electronics, electric motors, and other electric propulsion components. Activities also include R&D of advanced thermal management technologies and advanced materials and manufacturing processes for electric drive technologies. The electric drive cost target for FY 2016 is $12/kW ($660/system), a 25% reduction from the 2012 cost of $16/kW ($880/system). R&D is focused on power electronics, electric motors, and thermal management using advanced, low-cost materials, technologies, and topologies compatible with the high-volume manufacturing of motors, inverters, chargers, and DC/DC converters for electric drive vehicles. The subprogram will continue subcomponent R&D of high-temperature capacitors, wide-bandgap semiconductors, advanced magnets, and materials and designs for high-temperature packaging. 2.1.2 Advanced Combustion Engine R&D The VTO Advanced Combustion Engine R&D subprogram focuses on new technologies to enable the commercialization of high-efficiency advanced internal combustion engines (ICEs) for passenger and commercial vehicles. Increasing the efficiency of ICEs is one of the most cost-effective approaches to reducing petroleum consumption and associated GHG emissions of the nation’s vehicle fleet in the near- to mid-term. A 2013 National Academies review of VTO research efforts stated that ICEs “are going to be the dominant automotive technology for decades, whether in conventional vehicles, hybrid vehicles, PHEVs [plug-in hybrid electric vehicles], biofueled or natural gas vehicles” (NRC, 2013a). The Advanced Combustion Engine R&D subprogram will support research to accelerate the development of high-efficiency advanced combustion engines while reducing emissions, and develop technologies to use waste energy from engine exhaust to further improve vehicle fuel economy. 2020 targets are to increase the engine efficiencies of passenger vehicles such that fuel economy is improved by 35% for gasoline vehicles and 50% for diesel vehicles compared with 2009 gasoline vehicles, and to demonstrate a 30% increase in Class 8 truck engine efficiency compared with a 2009 baseline under the VTO SuperTruck initiative. 2.1.3 Materials Technology R&D The VTO Materials Technology subprogram supports vehicle lightweighting and improved propulsion efficiency through the discovery, development, and utilization of materials and enabling technologies for light- and heavy-duty vehicles. The Materials Technology

7
subprogram seeks to accomplish these technical objectives through research programs with academia, national laboratories, and industry. Weight reduction R&D emphasizes all vehicle systems, including the body, chassis, interior, and powertrain. The full breadth of lightweight materials are considered, such as advanced high-strength steels, aluminum alloys, magnesium alloys, carbon fiber composites, and hybrid materials. Propulsion materials R&D is focused on high-performance materials to withstand the aggressive conditions of high-efficiency combustion and the demands of improved electric vehicle drivetrains. Goals for cost and performance targets are for material technology to enable 35% weight reduction in a light-duty vehicle body compared with the 2002 baseline, with a target of $4.32 per pound removed on a lifecycle basis by 2019. 2.1.4 Fuels and Lubricant Technologies R&D The VTO Fuel and Lubricant Technologies subprogram develops technologies that reduce petroleum consumption through vehicle powertrain efficiency improvements and alternative fuels. The subprogram’s activities fall into three main categories: (1) alternative and renewable fuels, such as natural-gas-derived fuels, drop-in biofuels, and other renewable fuels; (2) using unique, unconventional fuel properties to improve efficiency; and (3) lubricant technologies that can reduce friction losses in new and legacy vehicles to improve fuel economy. Fuels such as natural gas, drop-in biofuels, and higher alcohols (e.g., butanol) frequently have technical barriers that prevent their implementation in equipment and infrastructure designed for petroleum and petroleum-based products. Work to overcome these barriers will include support for new alternative-fuel engine offerings, testing and evaluation of refueling infrastructure, and evaluation of the emissions impact of novel alternative fuels. 2.1.5 Vehicle Systems The Vehicle Systems subprogram supports a broad portfolio of foundational activities to reduce petroleum consumption in the U.S. transportation sector. They include: (1) developing advanced vehicle modeling tools to identify the most promising technologies and reduce their cost and time to market; (2) evaluating components and vehicles in both laboratory and on-road environments to validate the modeling tools; (3) proving the long-term reliability and benefits of advanced technologies; (4) identifying critical R&D needs to improve these technologies; (5) developing critical codes and standards to reduce the time to market and cost of PEVs and components, while ensuring real-world interoperability; and (6) R&D of enabling technologies to improve overall vehicle efficiencies and reduce energy requirements, such as high-efficiency heating and cooling systems, drivetrain hybridization, better aerodynamics, and low rolling resistance technologies.

8
2.1.6 Outreach, Deployment, and Analysis The Outreach, Deployment, and Analysis VTO subprogram includes a portfolio of activities to catalyze the widespread adoption of advanced vehicle technologies. These include the Vehicle Technologies Deployment activity, which enables and works with a nationwide network of local public/private partnerships (Clean Cities coalitions), bringing together key stakeholders to help accelerate the use of alternative fuel and energy-efficient vehicles. Vehicle Technologies Deployment also funds the annual DOE/EPA Fuel Economy Guide and www.fueleconomy.gov, as well as the collection and dissemination of related data (required by law) to the public. The Advanced Vehicle Competitions activity encourages university student engineers to participate in advanced technology development—helping to address the need for more highly-trained engineers in advanced vehicle technologies to overcome barriers in the marketplace. The Legislative and Rulemaking activity focuses on a variety of DOE statutory responsibilities established in the Energy Policy Act (EPAct) of 2005 and other statutes and legislation, primarily related to requirements for state and alternative fuel providers to operate alternative fuel vehicle fleets. The Analysis activity has been added to the Outreach, Deployment, and Analysis program to provide additional budget clarity and consolidate cross-cutting vehicle technologies analyses. This subprogram supports the planning, execution, and communication of technological, societal, economic, and interdisciplinary analyses to inform overall VTO program planning and key technology investment decisions. 2.2 FUEL CELL TECHNOLOGIES OFFICE PROGRAM Hydrogen fuel and fuel cells have the potential to advance energy security and reduce emissions of GHGs and criteria pollutants by improving energy efficiency, enabling alternative fuel sources, and spurring domestic production of clean energy technologies. Widespread use of hydrogen and fuel cells can have a major impact toward achieving Office of Energy Efficiency and Renewable Energy (EERE) goals of expanding the adoption of sustainable, domestically powered transportation alternatives; improving the efficiency of energy use; stimulating the growth of domestic clean energy manufacturing; and enabling the integration of clean energy into a reliable, resilient, and more efficient electricity grid. Fuel cells also enable highly efficient use of energy and have the potential for zero carbon emissions when powered by renewable fuels or hydrogen produced in tandem with carbon capture and storage. Analysis by Oak Ridge National Laboratory indicates that by 2050, market penetration of fuel cell electric vehicles (FCVs) could reach 40% to 60% of light-duty vehicle stocks (not just sales) if program targets are met, and the resulting benefits of the FCTO’s efforts could therefore include reductions in national oil consumption of 2 million to 4 million barrels per day and reductions in GHG emissions of 200 million to 450 million metric tons per year.

9
FCTO’s portfolio includes both fuel cell and hydrogen fuel R&D, with an emphasis on renewable production pathways and optimal methods for delivery and storage of hydrogen to help meet cost and performance goals. Real-world demonstration and validation in the near term will help to accelerate market growth and provide critical feedback for future R&D. FCTO also addresses a number of nontechnical factors, such as user confidence, ease of financing, availability of codes and standards, and refueling infrastructure logistics, particularly for FCVs. 2.3 SUMMARY OF FUEL SAVINGS BY TECHNOLOGY AREA The petroleum savings projected to result from VTO subprograms and the FCTO program by vehicles of all types was estimated by adding up the fuel saved by the vehicles with the relevant technologies on the road in a given year. Total petroleum savings were attributed to each program area using the methodology described in Section 3. Table 1 shows the estimated ranges of reductions in fuel consumption by the U.S. fleet of light-duty vehicles (LDVs) in 2025, 2035, and 2050, by technology area. Ranges are shown because estimates for LDV petroleum savings were developed using multiple projections of market shares of vehicles by drivetrain technology, as discussed below. Totals are different from the sum of the reductions because the minimum and maximum reductions in each technology area are from different projections. Also, the small amount of petroleum savings resulting from improvements in aerodynamic drag and rolling resistance are not currently included in the VTO portfolio of projects applicable to LDVs. To put these estimated reductions in petroleum use in context: In 2005, LDVs in the U.S. consumed some 16.9 quads of petroleum (Davis et al., 2014). Table 2 shows the estimated reductions in fuel consumption in quadrillion Btu’s per year in 2025, 2035, and 2050 by medium- and heavy-duty trucks, including classes 4 through 8.
TABLE 1 Projected Reductions in Oil Consumption by U.S. Light-Duty Vehicle Fleet Attributable to EERE, by Technology Area (quad/yr)
Quadrillion Btu’s per Year
EERE Transportation Technology Area
2025 2035 2050 Batteries and electric drive 0.1–0.4 0.2–1.3 0.8–2.1 Advanced combustion engines 0.5–1.1 0.7–1.5 0.4–1.2 Materials 0.3–0.4 0.3–0.7 0.2–0.6 Fuels and lubricants 0.1–0.1 0.1–0.1 0.0–0.1 Fuel cells 0.0–0.1 0.1–1.4 0.5–1.4 Non-EERE vehicle changes 0.0–0.1 0.1–0.2 0.1–0.2 Total LDV Fleet Petroleum Use Reduction 1.3–1.7 2.6–4.0 2.7–4.2

10
TABLE 2 Projected Reductions in Petroleum Consumption by U.S. Fleet of Medium- and Heavy-Duty Trucks (Classes 4–8) Attributable to VTO, by Technology Area (quad/yr)
Quadrillion Btu’s per Year
VTO Technology
2025 2035 2050 Engine and drivetrain efficiency and thermal management 0.8 1.4 2.0 Aerodynamic and rolling resistance reduction 0.3 0.6 0.8 Idle reduction (nonhybrid) 0.0 0.1 0.1 Hybridization 0.0 0.0 0.1 Other (accessories and auxiliaries) 0.0 0.0 0.0 Total HT Fleet Petroleum Use Reduction 1.1 2.1 3.0
Reductions attributable to engine and drivetrain efficiency and friction reduction are combined in the table. For heavy- and medium-duty trucks (HTs, including size classes 4-8), reductions in fuel consumption due to improvements in aerodynamics and rolling resistance are also shown. No petroleum savings for HTs were attributable to the FCTO program. The technologies listed in Table 2 do not correspond directly to the VTO programs discussed in Sections 2.1.1 through 2.1.6, but to the technologies being developed and demonstrated under VTO programs such as SuperTruck and the 21st Century Truck Partnership. Medium- and heavy-duty trucks in the U.S. consumed 5.1 quads of petroleum in 2005 (Davis et al., 2014). The projected reductions in petroleum consumption in 2035 by technology area are shown in Figure 2. The fraction of the reduction that is attributable to each technology area is shown within each bar. Figure 3 shows the reductions in petroleum consumption projected for 2050 by technology area. Petroleum savings are shown in million barrels per day (MMbpd) where 1 MMbpd = 1.916 quad/yr (based on 125,000 Btu/gal and 42 gal/barrel). Estimates of petroleum consumption for the No Program and Program Success cases are shown in gray, with the light gray bars indicating the ranges of estimates. The colored bars show the reduction (the difference in petroleum use between the No Program and Program Success cases) projected on the basis of different LDV choice models. Projections were made using multiple LDV consumer choice models in order to examine the impacts of uncertainty in LDV market projections. These models and the market share projections are discussed in Section 3. Since the projected market penetration of advanced technology vehicles differed among LDV consumer choice models, the resulting petroleum use and GHG emissions were also different, as seen in Figures 2 and 3. For all cases, the TRUCK model was used for HT market penetration projections. In the figures, HT fuel savings are aggregated into “HDV Engine,” which is same as the values shown

11
FIGURE 2 Reductions in Petroleum Consumption Attributable to VTO and FCTO Technology Areas in 2035 (Models used: LVCF = LCV Flex; MA3T = MA3T; LaveTr = LAVE-Trans; and ParaCh = ParaChoice)
FIGURE 3 Reductions in Petroleum Consumption Attributable to VTO and FCTO Technology Areas in 2050 (Models used: LVCF = LCV Flex, MA3T = MA3T, LaveTr = LAVE-Trans, and ParaCh = ParaChoice)
0.0
2.0
4.0
6.0
8.0
10.0
No Program
Progr Success
(LVCF)
Progr Success
(MA3T)
Progr Success
(LaveTr)
Progr Success
(ParaC
h)
Program
Success
Petroleum Consumption (MMbpd)
2035 Petroleum Consumption
LDV Fuel Cell Technol
LDV Fuels/Lubes
LDV Lightweighting
LDV Engine
LDV Electrification
HDV Engine
HD Vehicle
Oil consumption (range)
Oil consumption (min)
0.0
2.0
4.0
6.0
8.0
10.0
No Program
Progr Success
(LVCF)
Progr Success
(MA3T)
Progr Success
(LaveTr)
Progr Success
(ParaC
h)
Program
Success
Petroleum Consumption (MMbpd)
2050 Petroleum Consumption
LDV Fuel Cell Technol
LDV Fuels/Lubes
LDV Lightweighting
LDV Engine
LDV Electrification
HDV Engine
HD Vehicle
Oil consumption (range)
Oil consumption (min)

12
in Table 2 for “Engine and drivetrain efficiency and thermal management,” and “HD Vehicle,” which includes the remaining technologies listed in Table 2. The projected reductions in GHG emissions in years 2035 and 2050, by technology area, are shown in Figures 4 and 5, respectively. Estimated GHG emissions for the No Program and Program Success cases are shown in gray, with the light gray bars at the tops of the gray bars indicating the range of estimates. Again, since different LDV choice models gave different GHG projections, ranges are shown. Emission reductions were estimated based on the projected changes in fuel used (including gasoline, diesel, electricity, and hydrogen) and the GHG-intensity of each fuel, as described in Section 3. These results suggest that the successful deployment of VTO and FCTO technologies can reduce petroleum consumption and GHG emissions. The portions of the reductions attributable to specific VTO subprograms and to FCTO are uncertain, as indicated by the different breakouts for the LDV choice models shown in Figures 2 through 5. Reductions due to heavy truck technologies are fairly large and are of the same magnitude in all four breakouts, which is expected, since the same market penetration model was used for all projections. The portions attributable to individual VTO programs and to FCTO vary between projections on the basis of LDV choice model. The LVCFlex and LAVE-Trans models predict greater market penetration by fuel cell vehicles than the other models, and reduction estimates based on these are larger for FCTO. On the other hand, the LAVE-Trans and MA3T models project rapid market penetration by plug-in vehicles, leading to large reductions attributable to battery and electric drive technologies. Market share projections by LDV choice model are discussed in greater detail in Sections 3.1.2 and 4.2. Less variability is seen for combustion and lightweighting, since these technologies apply to all drivetrain types (with the exception of fuel cell vehicles, for which combustion technologies are not applicable). Therefore, differences in projected market shares of different drivetrains result in less variability in petroleum and GHG reductions attributable to combustion and lightweighting Larger differences are seen for electrification and fuel cell technologies, which are more sensitive to differences in projected market shares of plug-in and fuel cell vehicles. These differences are discussed further in Section 4.

13
FIGURE 4 Reductions in Greenhouse Gas Emissions Attributable to VTO and FCTO Technology Areas in 2035 (Models used: LVCF = LCV Flex, MA3T = MA3T, LaveTr = LAVE-Trans, and ParaCh = ParaChoice)
FIGURE 5 Reductions in Greenhouse Gas Emissions Attributable to VTO and FCTO Technology Areas in 2050 (Models used: LVCF = LCV Flex, MA3T = MA3T, LaveTr = LAVE-Trans, and ParaCh = ParaChoice)
0
200
400
600
800
1,000
1,200
1,400
1,600
1,800
2,000
No Program
Progr Success
(LVCF)
Progr Success
(MA3T)
Progr Success
(LaveTr)
Progr Success
(ParaC
h)
Program
Success
GHG Emissions (M
MT CO2eq/yr)
2035 GHG Emissions
LDV Fuel Cell Technol
LDV Fuels/Lubes
LDV Lightweighting
LDV Engine
LDV Electrification
HDV Engine
HD Vehicle
GHG Emissions (range)
GHG Emissions (min)
0
500
1,000
1,500
2,000
2,500
No Program
Progr Success
(LVCF)
Progr Success
(MA3T)
Progr Success
(LaveTr)
Progr Success
(ParaC
h)
Program
Success
GHG Emissions (M
MT CO2eq/yr)
2050 GHG Emissions
LDV Fuel Cell TechnolLDV Fuels/LubesLDV LightweightingLDV EngineLDV ElectrificationHDV EngineHD VehicleGHG Emissions (range)GHG Emissions (min)

14
3 TRANSLATING PROGRAM GOALS INTO MODEL INPUT The analysis of advanced technologies to estimate their benefits was based on a three-step, market-based approach. First, the average fuel economy and incremental costs of new vehicles that incorporate DOE-supported technologies were estimated. Second, consumer choice models were used to estimate the market shares of these platforms in the future. Finally, the projected fuel economies and market shares were used as inputs to the VISION model, which projects future on-road vehicle stock and estimates fuel consumption and GHG emissions. From these, the fuel savings and GHG emission reductions were estimated and attributed to VTO and FCTO technologies. Each of these steps is described below, first for LDVs in Section 3.1, then for HTs in Section 3.2. For both LDVs and HTs, two scenarios were developed:
1. The “No Program” case, which assumes there is no technology improvement or cost reduction beyond 2015 due to the VTO and FCTO programs
2. The “Program Success” case, which assumes there are future technology
improvements and cost reductions that meet VTO and FCTO program goals The fuel savings and GHG reductions were taken to be the difference in the fuel use and GHG emissions between these two cases. The No Program case was developed to represent future vehicle technology, fuel use, and GHG emissions without the effects of technology improvements brought about by the VTO and FCTO programs. The DOE Energy Information Administration’s Annual Energy Outlook (AEO) is the official DOE-wide projection and analysis of future U.S. energy supplies, demands, and prices (EIA, 2014). As such, it is an obvious choice for a baseline against which to compare an energy future enriched by DOE programs. However, the AEO Reference case assumes current policies remain in effect until they sunset. Projections made for the AEO Reference case thus incorporate assumptions about the market success of technologies historically supported by the VTO and FCTO. A more appropriate baseline case for comparing LDVs and HTs was constructed by projecting the diminishing technological progress over time that would be expected to occur without VTO- and FCTO-supported R&D. The No Program and Program Success cases for light-duty and heavy-duty vehicles are described in the following sections. The overall methodology for benefits analysis is similar to that used previously for the VTO programs, formerly called the Government Performance and Results Act report (e.g., Stephens et al., 2014).
15
3.1 LIGHT-DUTY VEHICLE ANALYSIS 3.1.1 Light-Duty Vehicle Attributes and Levelized Cost of Driving For LDVs, the No Program case, a baseline based on simulations of future vehicles, was developed by assuming that only incremental technology improvements would occur without support from the VTO and FCTO programs. Parameters describing vehicle component performance, manufacturing costs, and other attributes were estimated for 2010, 2015, 2020, 2025, 2030, and 2045 based on input from VTO and FCTO analysts and program managers and Argonne vehicle technology experts. Analogously, for the Program Success case, starting assumptions about vehicle component characteristics were based on VTO and FCTO program targets and relevant vehicle data available in the Autonomie library, a database used with the Autonomie toolkit (ANL, 2015a). These starting assumptions were used in the Autonomie toolkit (ANL, 2015a) to simulate vehicles in five classes—compact car, midsize car, compact sport utility vehicle (SUV), midsize SUV, and pickup truck―with each one having the following types of drivetrains:
• Conventional spark ignition (gasoline)
• Conventional compression ignition
• Hybrid electric (gasoline);
• Plug-in hybrid electric, spark ignition engines, with nominal charge-depleting ranges of 10 and 40 miles (PHEV10, PHEV40)
• Hydrogen fuel cell vehicle
• Battery electric, with batteries sized for ranges of 100 and 300 miles
(BEV100, BEV300) For each of these powertrain architectures, the Autonomie model was used to simulate future vehicles, appropriately sized to offer sufficient power, given the weight of the glider (chassis, body, and interior components) and drivability requirements. This was done for each technology scenario to estimate each vehicle’s fuel economy in city and highway drive schedules prescribed by EPA. The incremental costs associated with the advanced powertrains were calculated by using a combination of direct inputs from VTO and FCTO for advanced technologies and third-party-estimated (Ricardo Engineering) costs for near-commercial technologies. Specifically, EERE cost and performance targets were used to estimate costs and performance for the Program Success case for batteries, power electronics and electric motors, fuel cells, and on-board hydrogen storage; cost models developed by the Argonne Autonomie group and by Ricardo Engineering were used for estimating costs for other components.

16
Vehicle retail price equivalent was estimated by applying a factor of 150% to the vehicle manufacturing cost. Prices were estimated for the base trim level, and all component price models assumed fully learned, high-production-level costs. Further details will be documented in a forthcoming report (Moawad et al., 2016). Future LDVs were not assumed a priori to meet EPA/National Highway Transportation Safety Administration standards for GHG emissions and Corporate Average Fuel Economy (CAFE) for 2017 through 2025. Sales-weighted average fuel economy values for the new car and light truck fleets were calculated after sales shares were estimated and compared with CAFE standards; however, regulatory flexibilities such as trading or banking of credits were not accounted for. Average fuel economies projected by the vehicle choice models depended on sales shares of the various vehicle types. In most No Program projections, values fell short of CAFE standards, but in all projections for the Program Success case, except those made using the ADOPT model, values met or exceeded the standards. The objective of this analysis was not to assess how advanced vehicle technologies might be applied in order to meet future fuel economy or GHG standards, but to assess the influence of technologies independent of the influence of standards. Therefore, automakers’ strategic decisions regarding technology adoption were not explicitly modeled; rather, the consumer choice models were used to represent consumer demand. Vehicles simulated with these component attributes were assumed to be representative of vehicles available in showrooms five years later, in 2015, 2020, 2025, 2030, 2035, and 2050. Attributes in vehicles in showrooms in 2015 were the same for both the No Program and Program Success cases, since the benefits being analyzed were those accruing after 2015. Attributes of vehicles in showrooms in 2020, 2025, 2030, 2035, and 2050 in the Program Success case reflected the improved efficiency and lower cost that are expected from completely successful achievement of VTO and FCTO program goals and commercialization of these technologies. In addition to the vehicle simulations performed for the No Program and Program Success cases, a third set of simulations was run using the Autonomie toolkit with vehicle component inputs that were intermediate between the pessimistic No Program and the optimistic Program Success (Moawad et al., 2016). The intermediate case was used with the other cases to estimate the levelized cost of driving. As described in Section 3.1.2, one vehicle choice model, ADOPT, used vehicle attribute inputs developed using the National Renewable Energy Laboratory FASTSim model rather than the results of Autonomie simulations. In some cases the FASTSim values differed significantly from the Autonomie values. The levelized cost of driving (LCD) is a measure of typical consumer expenditures per mile driven for a vehicle and the fuel purchased over a period of interest. Here, the period considered was five years. The LCD was calculated for the drivetrains simulated for years 2025 and 2035 for the No Program, Program Success, and intermediate cases. The LCD is the vehicle

17
price combined with the present value of fuel consumed in five years of operation, divided by the miles driven in five years.
∑ ⁄
where PVeh = Vehicle retail price equivalent PV(CFuel) = resent value of fuel costs over N years N = Ownership period (VMT/yr)i = Annual distance driven The LCD was calculated from the estimated retail price equivalent for each vehicle, and the estimated fuel expenditures over the miles driven over five years of vehicle ownership. Based on the 2009 National Household Travel Survey, it was assumed that a vehicle would be driven an average of 13,500 miles per year during the first five years. Fuel expenditures were discounted at 7% annually, intermediate between the high discount rates (often over 20%) at which some vehicle consumers discount future fuel savings (Greene, 2010; Greene et al., 2013), and a low discount rate (near zero) appropriate for discounting of social costs (OMB, 2013). The LCDs for the various powertrains are shown in Section 4. 3.1.2 Light-Duty Vehicle Market Penetration Modeling Outputs of the Autonomie modeling were used with fuel prices as inputs to the vehicle choice models in the second step of LDV modeling. Owing to the large uncertainty of future markets for advanced technology vehicles, multiple projections of market shares of LDVs were developed using different vehicle choice models. Five models under development by VTO were used to give five sets of market projections for the No Program and Program Success cases:
• Market Acceptance of Advanced Automotive Technologies (MA3T) model, developed by Oak Ridge National Laboratory (Lin and Greene, 2010, 2011; Lin, 2015)
• LAVE-Trans model, developed by Oak Ridge National Laboratory
(Liu, 2015; NRC, 2013b)
• LVCFlex model, developed by Energetics, Inc. (Birky, 2015)
• ParaChoice model, developed by Sandia National Laboratories (Manley et al., 2015)
• ADOPT model, developed by the National Renewable Energy Laboratory
(Brooker, 2015)

18
Multiple projections give a range of possible outcomes and permits examination of the effects of these differences on fuel use and GHG emissions. Each of these models was developed with different assumptions, and each represents the LDV market slightly differently:
• The LVCFlex model is a simplified version of the vehicle choice component of the National Energy Modeling System used to develop the AEO. LVCFlex models consumer choice in five size classes: small cars, large cars, small SUVs, large SUVs, and pickups. Sales shares of each size class are specified by the user; in this case the shares by size class and total vehicle sales were specified to be consistent with the AEO 2014 Reference case.
• The LAVE-Trans model gives sales shares for cars and light trucks, and
represents two segments of consumers, early adopters and majority adopters, with the main difference being the value consumers place on newness or maturity of technology. Early adopters more readily adopt vehicles with advanced technologies, such as plug-in vehicles and fuel cell vehicles, while majority consumers are averse to these vehicles. As more of these new vehicles are purchased, both the preference for them by early adopters and the aversion by majority consumers decrease. This phenomenon is calculated in LAVE-Trans, which tracks the on-road populations of these vehicles.
• In the MA3T model, consumers are segmented by attitude toward risk (early
adopter, early majority, and late majority), driving pattern, population density, availability of electric charging at home and at work, and state of residence. Both the LAVE-Trans and MA3T models estimate total light-duty sales and sales shares of each size class endogenously.
• The ParaChoice model is based on the MA3T model, with some
simplifications, but is integrated with an energy sector model that estimates hydrogen prices endogenously. For this analysis, parameters governing hydrogen prices were set to nearly match the FCTO-supplied prices. The four above-mentioned models give estimates of future sales shares by drivetrain technology: conventional spark-ignition (SI), conventional compression-ignition (CI), hybrid electric vehicle (HEV), plug-in hybrid electric vehicle (PHEV), battery electric vehicle (BEV), and FCV.
• The ADOPT model represents vehicles in much more detail, with nearly
1,000 vehicles of different makes, models, and trim levels explicitly represented. The ADOPT model also estimates vehicle attributes endogenously using the National Renewable Energy Laboratory FASTSim tool. That is, the vehicle attributes generated from the Autonomie vehicle simulations used in the other vehicle choice models were not used in the ADOPT model; rather, component-level inputs were used in FASTSim to develop vehicle attributes within the model.

19
Another difference between the five vehicle choice models is the level of aggregation of the powertrain types. Key characteristics of the vehicle choice models as used in this analysis are summarized in Table 3. Total LDV annual sales were assumed to be the same as in the AEO 2014 Reference case extrapolated to 2050 (a linear extrapolation based on the average slope in years 2035 to 2040). Future fuel prices were assumed to be those in the AEO 2014 Reference case extrapolated to 2050 on the basis of the trend from 2035 to 2040. Future hydrogen prices for No Program were supplied by FCTO. Whereas the ParaChoice model used endogenously estimated hydrogen prices, parameters in the model were chosen to match the FCTO-supplied prices in 2014 and 2050, and differed slightly in other years. The assumed fuel prices, in 2010 dollars per gallon gasoline equivalent (GGE), are shown in Figure 6. Biofuel was not modeled, except for the ethanol content in gasoline and E85. Flex fuel vehicles were not modeled explicitly in vehicle choice models, but a small fraction of the conventional SI vehicles were assumed to use E85. Fuel prices were assumed to be independent of fuel demand (no price elasticity). The resulting LDV market share projections are presented in Section 4. TABLE 3 Comparison of Key Characteristics of the Light-Duty Vehicle Choice Models
Model Powertrains Modeleda Size Classes Fuel Prices
Vehicle
Attributes From LVCFlex SI Conv, CI Conv, HEV,
PHEV10, PHEV40, FCV, BEV100, BEV300
Sm car, Lg car, Sm SUV, Lg SUV, Pickup
AEO 2014 Ref case, H2: FCTO
Autonomie
LAVE-Trans SI Conv, CI Conv, HEV,
PHEV40, FCV, BEV100, BEV300
Car, Light truck AEO 2014 Ref case, H2: FCTO
Autonomie
MA3T SI Conv, CI Conv, HEV,
PHEV10, PHEV40, FCV, BEV100, BEV300
Sm car, Lg car, Sm SUV, Pickup
AEO 2014 Ref case, H2: FCTO
Autonomie
ParaChoice SI Conv, CI Conv, HEV,
PHEV10, PHEV40, FCV, BEV100, BEV300
Sm car, Lg car, Sm SUV, Lg SUV, Pickup
AEO 2015 Ref case, H2: FCTOb
Autonomie
ADOPT All makes, models, and trim levels All sizes AEO 2014 Ref
case, H2: FCTO FASTSim
a Several models can include more types of powertrains than are used in this analysis. b Hydrogen prices were estimated endogenously in the ParaChoice model, but were only slightly different from
the FCTO-supplied prices.

20
FIGURE 6 Projected Fuel Prices Used for Modeling, in 2010 Dollars per GGE (1 GGE = 114,500 Btu)
3.1.3 Light-Duty Vehicle On-Road Stock Modeling In the third step of LDV modeling, future energy consumption and GHG emissions by LDVs for both the No Program and Program Success cases were projected for the five vehicle choice models using sales shares calculated in the earlier steps. Sales shares and fuel economy of each LDV with each type of drivetrain were used as inputs to Argonne’s VISION model, 2014 version (Zhou and Vyas, 2014). The VISION model is an accounting spreadsheet that calculates output metrics of interest on a national scale. Results from vehicle choice models with multiple car and light truck size classes were aggregated to give sales-weighted average values of fuel economy and sales share by technology for cars and light trucks. For each drivetrain type, VISION applies a fuel economy adjustment factor to convert combined city/highway test-cycle fuel economy values (supplied by Autonomie) to on-road fuel economy values. These factors range from 0.7 to 0.85, depending on drivetrain type, and are based on factors used by the Energy Information Administration in AEO or on EPA-recommended “mileage-based” equations (EPA, 2006). Full fuel cycle GHG emission coefficiencts for fuels and electricity from the Argonne GREET model were used to estimate GHG emissions (ANL, 2014), using the AEO 2014 Reference case electricity generation mix. For the No Program case, hydrogen was assumed to be produced by methane reforming at stations in the near-term (2015 to 2020), with a GHG-intensity of 104.1 million metric tons of CO2 per quad, and by steam methane reforming at a central facility in years 2020 and later, with a GHG-intensity of 118.5 million metric tons of CO2 per quad.
0.00
1.00
2.00
3.00
4.00
5.00
6.00
7.00
2010 2020 2030 2040 2050
Fuel Price, 2010$ per gge
Gasoline
Diesel
Electricity
Hydrogen (No Progr)
Hydrogen (Progr Success)

21
For the Program Success case, hydrogen was assumed to be produced by methane reforming at stations in the near-term (2015 to 2020), with a GHG-intensity of 104.1 million metric tons of CO2 per quad (same as in the No Program case). In years 2020 and later, hydrogen was assumed to produced by steam methane reforming at a central facility with carbon capture and sequestration, with a GHG-intensity of 54.7 million metric tons of CO2 per quad (lower than in the No Program case, which assumed no carbon capture). Upstream energy and GHG-intensity for hydrogen produced via these pathways were taken from the results of hydrogen pathway analyses by national laboratories (Ramsden, 2015). The distance driven by LDVs (annual vehicle miles traveled, or VMT per vehicle per year) was assumed to be somewhat dependent on the cost per mile, with an elasticity of demand for travel of about -0.1, the default value in the VISION model (Zhou and Vyas, 2014). 3.1.4 Attribution of Light-Duty Vehicle Benefits to Technology Areas From the VISION results for LDVs, the total petroleum savings and GHG reduction by LDVs attributable to VTO and FCTO technologies are measured as the differences between the Program Success and No Program projections of petroleum use and GHG emissions by the total light-duty on-road fleet. These totals were disaggregated into contributions from each VTO subprogram and FCTO. Petroleum savings included those due to:
1. Improvements in the fuel efficiency of each drivetrain type (Section 3.1.4.1)
2. Increases in the shares of vehicles in the on-road stock with drivetrains that consume less, or no, petroleum-based fuel (Section 3.1.4.2)
3.1.4.1 Fuel Savings From Improvements in Fuel Efficiency The petroleum saved in a given year from fuel efficiency improvements was calculated for drivetrain types that consume gasoline or diesel (gasoline ICE, diesel ICE, HEV, and PHEV). The differences between No Program and Program Success in petroleum used annually by vehicles of each drivetrain type were multiplied by the number of such vehicles on the road in that year. Energy efficiency improvements to BEVs and FCVs did not lead directly to petroleum reduction but contributed to increased stock share of these vehicles, as described in Section 3.1.4.2. Petroleum savings due to conventional SI, conventional CI, HEV, and PHEV fuel economy improvements were attributed to VTO subprogram technology areas by estimating the decrease in fuel consumption per mile in advanced vehicles due to improvements in technologies in each of the subprograms.

22
The decrease in the amount of fuel consumed per mile resulting from reduced friction was attributed to the Fuels and Lubricant Technologies subprogram. A 10% reduction in engine friction was assumed to lower fuel consumption by 0.3%, and a 10% reduction in drivetrain frictional losses was assumed to lower fuel consumption by 0.5%, on the basis of power flows in vehicle simulations (EPA and DOE, 2011). A reduction in engine and drivetrain friction was assumed to increase from zero in 2015 to 10% in 2020, to increase from 10% in 2020 to 15% by 2035, and to remain at 15% thorough 2050. As opposed to other DOE technologies, which were assumed to be deployed only in new vehicles, friction reduction was assumed for both new and used vehicles. The differences in vehicle weights in Autonomie simulations for the Program Success and No Program cases were used to estimate the fuel saved by lightweighting. For HEVs and PHEVs, changes in the masses of batteries and PEEM (power electronics and electric motors) were not considered part of lightweighting because the lower weights of these components were attributable to the batteries and electric drive technologies used. It was assumed that the percent decrease in fuel consumption per mile was proportional to the percent decrease in vehicle mass (excluding battery and PEEM mass). For conventional SI and CI vehicles, a proportionality constant of 0.5 was applied (i.e., a 10% mass reduction corresponds to a 5% reduction in fuel consumption). This constant is based on the analytical results of a number of studies showing that a 10% decrease in mass with engine downsizing at constant performance gives approximately a 6.5% decrease in fuel consumption per mile, while without downsizing, the decrease is 3.5% (Kim and Wallington, 2013; Bandivadekar et al., 2008; Pagerit et al., 2006). Here, an intermediate value of 5% was used to estimate the portion of the fuel economy benefit attributable to the Materials program, under the assumption that the remainder of the benefit was due to engine downsizing attributable to the Advanced Combustion Engines program. For HEVs, a value of 4.5% was used on the basis of previous vehicle simulations (Pagerit et al., 2006; Moawad and Rousseau, 2012). For PHEVs, it was assumed that the value was slightly less than for HEVs, and 4% was used. Lower fuel consumption per mile due to reductions in rolling resistance and aerodynamic resistance were estimated but were not attributed to the VTO subprograms for LDVs, because none of these programs supports the reduction of rolling resistance or aerodynamic resistance in LDVs. In general, these fuel savings were small compared with the contributions of VTO technologies. For conventional SI and CI vehicles, the remainder of the petroleum savings was attributed to improvements in engine combustion efficiency (Advanced Combustion Engine subprogram). For HEVs and PHEVs, 70% of the remainder of fuel savings was attributed to improvements in engine combustion efficiency and 30% was attributed to the battery and electric drive technologies used. The value of 70% was arrived at because comparisons of fuel economies of HEVs and similar conventional SI vehicles indicate that HEVs consume approximately 70% of the fuel per mile that similar conventional SI vehicles do; that is,

23
hybridization gives a 30% reduction in fuel consumption per mile. This same percentage was used for PHEVs, as well.
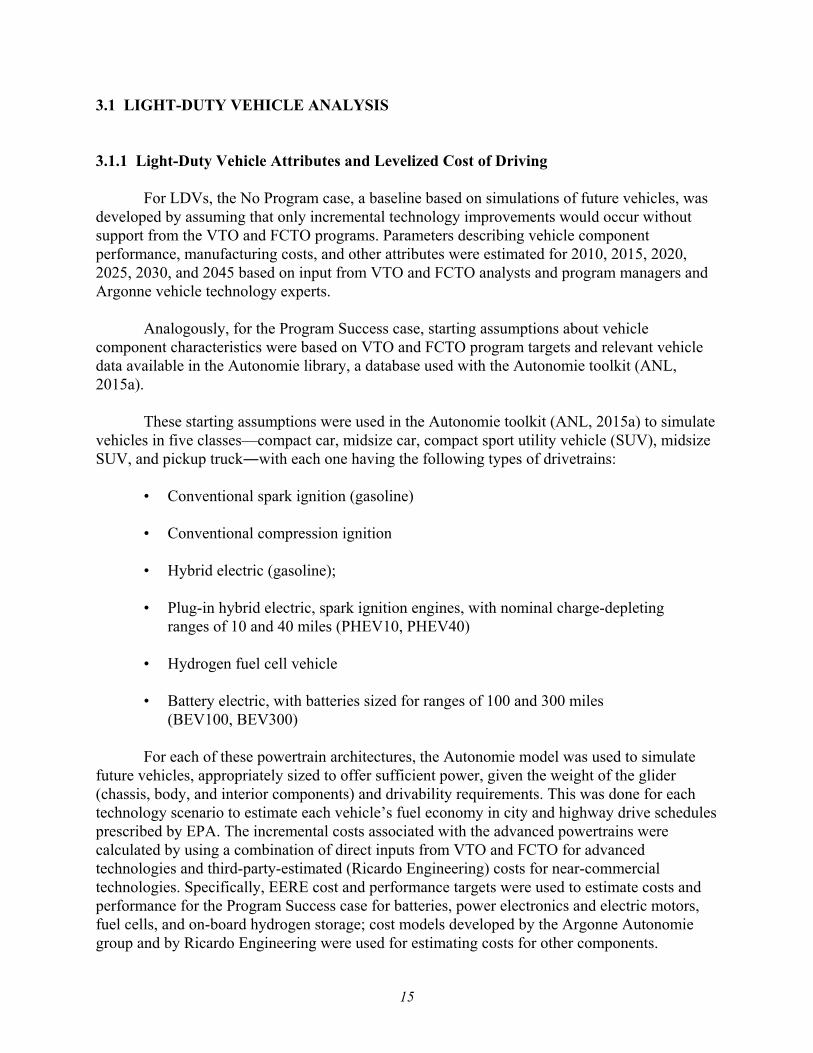
3.1.4.2 Fuel Savings From Changes in Stock Shares The above attributions account for better fuel efficiencies in conventional SI and CI vehicles, HEVs, and PHEVs. Additional fuel savings result from changes in the shares of the on-road stock of vehicles that consume less gasoline and diesel. These shares were higher in the Program Success case due to lower vehicle purchase prices and better fuel economy. The petroleum saved by this stock replacement was attributed to VTO subprograms and FCTO by examining changes in stocks of different drivetrain types and by assuming that more advanced technology vehicles replaced more mature technologies. Technology replacement was assumed to be in the order: conventional SI, conventional CI, HEV, PHEV, BEV, and FCV, which is the order in which they gain market share in the market penetration projections in most cases analyzed here. This order is consistent with the current maturity of the technologies (conventional SI being the most mature and FCV being the most advanced). Fuel savings attributed to FCVs were also estimated by an alternative method assuming FCV replaced a mix of non-FCVs, as described below. Considering the petroleum consumed by the on-road stock of vehicles in this order allows attribution of petroleum savings both to improvements in the fuel efficiencies of each drivetrain type and to substitution or replacement of one technology by another. Figure 7 shows the average amount of petroleum-based fuel consumed per car per year for each drivetrain technology, for cars newer than vintage 2015, plotted against the cumulative number of cars in the on-road stock by drivetrain technology in the above order (CI Conv, HEV, PHEV, BEV, FCV). This plot shows results for cars in 2050 for the No Program case, with sales shares given by the LVCFlex model. Fuel consumed by cars older than 2016 is not considered, since the intention is to assess petroleum savings by technology available after 2015. The area under the curve for each drivetrain type (shown in different colors) is proportional to the petroleum-based fuel consumed by the on-road stock of vehicles of that type, since the height of each area is the petroleum consumed annually per car, and the width of each area is the number of cars on the road in that year. Cars that consume no gasoline or diesel are shown as segments along the x-axis, with the length of the segment indicating the number of these vehicles in the on-road stock. (LCVFlex projected very few BEV300 cars for this case, and these are not shown.) Figure 8 shows the annual petroleum consumption per car for the Program Success case for year 2050 (again, based on sales shares given by the LVCFlex model). This shows lower petroleum consumption by each vehicle type; lower stocks of SI Conv, CI Conv, and PHEV10 cars; and increased stock of other vehicle types. Figures 7 and 8 show projections from the LVCFlex model as an example. Analogous plots were made to analyze the petroleum savings from projections from the MA3T, LAVE-Trans, and ParaChoice models, as well.
24
FIGURE 7 Average Annual Petroleum-Based Fuel Consumption per Car in 2050 for the No Program Case, Based on Market Share Modeled by LVCFlex. Petroleum consumption is plotted against cumulative number of cars in the on-road stock. Shaded areas indicate the amount of petroleum consumed by vehicles of each drivetrain type in 2050.
FIGURE 8 Average Annual Petroleum-Based Fuel Consumption per Car in 2050 for the Program Success case, Based on Market Share Modeled by LVCFlex. Petroleum consumption is plotted against cumulative number of cars in the on-road stock. Shaded areas indicate the amount of petroleum consumed by vehicles of each drivetrain type in 2050.
SI Conv
CI Conv
HEV
PHEV10
BEV100
FCV PHEV
40
SI
CI Conv
HEV
PHEV10
BEV100
FCVPHEV4

25
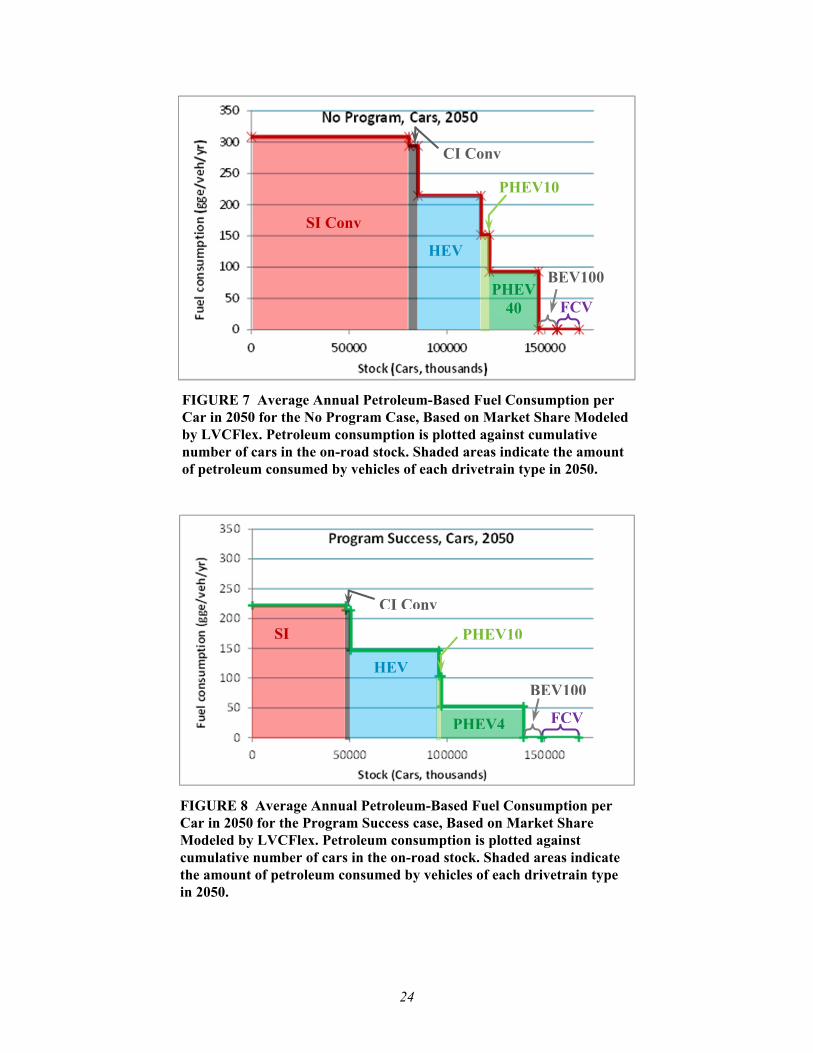
Figure 9 shows the difference in fuel consumption under the No Program and Program Success scenarios. The shaded area indicates the amount of petroleum-based fuel saved by cars in 2050 that is attributable to VTO and FCTO technologies. As discussed earlier, two factors contribute to petroleum savings: (1) more efficient drivetrains and (2) substituting cars with more efficient drivetrains for cars with less efficient drivetrains (stock changes). Petroleum savings projections were disaggregated by powertrain in order to estimate the contribution of each of the two factors and to attribute the savings to VTO and FCTO technologies. Figure 10 shows the petroleum savings from efficiency improvements as cross-hatched, and the savings due to changes in stocks as shaded (pale yellow). Petroleum savings from efficiency improvements were further disaggregated into contributions by each of the four VTO technology areas (advanced combustion engines, batteries and electric drive, advanced materials, and fuels and lubricants). Petroleum savings from changes in stocks of drivetrain technologies were attributed to each of these areas and to FCTO, according to which drivetrain was substituting for which. Although the market penetration models used in this analysis did not consider which vehicles consumers were replacing or trading in (or whether the vehicle was an addition to the household vehicle stock), the general order of market penetration in most cases was SI Conv, CI Conv, HEV, PHEV, BEV, and FCV. As shown in Figure 10 for cars in 2050, the petroleum savings from changes in drivetrain stocks were nearly all due to replacement of SI Conv and CI Conv vehicles by HEVs and PHEVs, and replacement of PHEVs by BEVs (areas shown in yellow). The petroleum savings
FIGURE 9 Average Annual Petroleum-Based Fuel Consumption per Car in 2050 for No Program (red) and Program Success (green), Based on Market Share Projected by the LVCFlex Model. The shaded area indicates the amount of petroleum-based fuel saved by cars in 2050 in the Program Success case over the No Program case.
26
FIGURE 10 Average Annual Petroleum-Based Fuel Consumption in Cars in 2050 for No Program (red) and Program Success (green), with Savings Due to Drivetrain Efficiency Improvements (shown as cross-hatched areas), and Those Due to Changes in the Stock Shares of Drivetrain Technologies (shaded) Disaggregated
from these replacements were therefore attributed to the Battery and Electric Drive program. Some BEVs were replaced by FCVs, but this did not generate petroleum savings because neither BEVs nor FCVs consume petroleum-based fuels. In other cases, FCVs replaced HEVs and PHEVs to a significant extent, leading to large savings in petroleum-based fuel. The petroleum savings in light trucks in 2050 is shown in Figure 11, with the cross-hatched areas showing the petroleum saved by fuel efficiency improvements. Again, this example is based on LVCFlex modeling; the same calculation was performed using results from the MA3T, LAVE-Trans, and ParaChoice models. The yellow area shows the petroleum saved by replacement of ICE light trucks (SI Conv and CI Conv) by electric drive light trucks (HEVs, PHEVs, and BEV); the small gray square shows the petroleum saved by replacement of SI Conv light trucks by CI Conv light trucks; and the pale purple area shows the petroleum saved by replacement of HEV and PHEV10 light trucks by FCV light trucks. LCVFlex projected very few BEV or PHEV40 light trucks, and these are not shown in the figure. Because of uncertainty in future markets and the assumed order in which petroleum savings from drivetrain substitution were assigned, petroleum savings attributable to VTO and FCTO technologies were strongly dependent on projected market penetration of these vehicle types. Therefore, the attribution methodology was modified to assign petroleum savings to the FCTO program in proportion to the increase in vehicle-miles traveled by FCVs in Program Success over No Program, assuming the increase represented miles traveled by FCVs replacing miles traveled by non-FCVs. That is, the petroleum saved by each mile traveled by a
SI Conv
CI
PHEV10
PHEV40
HEV
BEV100
FCV

27
FIGURE 11 Average Annual Petroleum-Based Fuel Consumption in Light Trucks in 2050 for No Program (red) and Program Success (green), Disaggregated into Savings Due to Drivetrain Efficiency Improvements (shown as cross-hatched areas), and Savings Due to Changes in the Stock Shares of Drivetrain Technologies (highlighted in solid gray, yellow, and purple)
FCV is the average petroleum consumed by non-FCVs. For cars, this is the ratio of petroleum consumed by all cars to the vehicle miles traveled (VMT) by all cars except FC cars:
,
and analogously for light trucks:
,
Note that the fuel consumed per mile was estimated using quantities from the Program Success case, since vehicles in this case have benefitted from VTO technologies, and the intent here is to isolate the benefits of FCTO technologies. Using this method, the petroleum saved by fuel cell cars, ΔPFC Cars, was estimated by multiplying the fuel used per mile by non-FC cars by the vehicle miles replaced by FC cars:
∆
SI Conv
CI Conv
PHEV10
HEV
FCV

28
and that saved by fuel cell light trucks, ΔPFC LTs, was estimated analogously:
∆
and the total saved by FCVs, ΔPFCVs, is the sum:
∆ ∆ ∆ Where: = Total petroleum consumed by all cars in Program Success = Total petroleum consumed by all LTs in Program Success = Total VMT by all cars in Program Success = Total VMT by all LTs in Program Success = VMT by FC cars in Program Success = VMT by FC cars in No Program = VMT by FC LTs in Program Success = VMT by FC LTs in No Program Thus, fuel savings attributable to FCTO technologies is assumed to be proportional to the increase in VMT by FCVs and to the average fuel consumed per mile by vehicles replaced by FCVs. This method for estimating petroleum savings by FCVs generally gave more consistent and somewhat higher estimates than the estimates based on drivetrain replacement; therefore, the values reported here were estimated using this VMT-replacement approach. The petroleum savings attributed to VTO subprogram were adjusted slightly to ensure that the total petroleum saved was consistent with the difference in petroleum consumed in the Program Success and No Program cases. As with petroleum savings, GHG reductions were calculated as the difference in GHG emissions between No Program and Program Success. GHG reductions were attributed to VTO subprograms and FCTO on the basis of the petroleum savings attributed to each of these, taking into account the GHG intensity of gasoline and diesel, as well as the estimated changes in electricity and hydrogen consumption and their GHG intensities. GHG intensities were taken from the GREET model for gasoline, diesel, and electricity, assuming the same electricity generation mix as in the AEO 2014 Reference case. In Program Success, hydrogen was assumed to be produced by methane reforming at stations in the near term (2015 to 2020) and by steam

29
methane reforming at a central facility in 2020 and later. Upstream energy and GHG intensity for hydrogen produced via these pathways were taken from results of hydrogen pathway analysis by national laboratories (Ramsden, 2015), as described in Section 3.2.3. Projected reductions in GHG emissions are presented for each VTO subprogram and FCTO in Figures 4 and 5 for 2035 and 2050, respectively. Projected GHG reduction by LDV varies somewhat depending on the LDV choice model used to project market shares, but significant reductions are projected in the four sets of results shown. As with projected petroleum savings, the projected GHG reductions attributable to electrification and FCVs are sensitive to the projected market penetration by plug-in and FCVs. 3.2 HEAVY TRUCK ANALYSIS As with LDV, the analysis of HT benefits from VTO technologies was a four-step process, in which (1) a baseline (No Program) case was developed, (2) fuel economy values and incremental costs of new vehicles with DOE-supported technologies were estimated, (3) market penetration of advanced technology vehicles was projected for Program Success vs. No Program, and (4) the projected fuel savings and GHG reductions were calculated as the differences between the two cases. Sections 3.2.1–3.2.4 report on each step of the benefits analysis for HTs. It was assumed that very few HTs would be FCVs, so savings were attributed to VTO subprograms only. 3.2.1 Heavy Truck Baseline TA Engineering (TAE) developed the No Program case for medium- and heavy-duty vehicles by adjusting the AEO 2014 Reference case fuel economy values for new medium- and heavy-duty vehicles (or collectively, “heavy trucks”, HT). The adjustments removed the fuel economy improvements attributed to the projected market penetration of VTO-funded advanced vehicle technologies. For the AEO Reference case, the DOE Energy Information Administration provided estimates of the contributions of individual component technologies to truck fuel economy and market penetrations. The technology market penetrations were modeled by the Energy Information Administration at a finer level of disaggregation than that in the AEO output tables. As such, the penetrations were analyzed in subclasses consistent with the EPA/NHTSA (National Highway Transportation Safety Administration) fuel consumption rules (EPA and NHTSA, 2011a, 2011b):
• Classes 7 and 8 tractor sleeper cabs • Classes 7 and 8 tractor day cabs • Classes 7 and 8 vocational trucks • Class 3 pickup, van, and vocational • Classes 4–6 vocational

30
“Vocational” as used in the above list is adopted from EPA/NHTSA and refers to all trucks that are not tractors or pickups. These include van- or box-type trucks as well as vehicles such as cement mixers, refuse haulers, dump trucks, and utility vehicles. To attribute individual contributions of VTO-supported technologies to the Reference case new fleet fuel economies, TAE used AEO base year (2011 in AEO 2014) vehicle fuel economies and technology market penetrations for HT subclasses, as documented in AEO’s input files and penetration tables. FC-powered trucks were not considered in this analysis, consistent with the AEO Reference case. This analysis was performed for two years: 2017 (the year the fuel economy standards become fully effective) and 2040 (the last AEO projection year). Results showed that 7.1% of the projected fuel economy improvement of the 2017 fleet of new classes 7 and 8 sleeper cab tractors is attributable to non-VTO technologies. Contributions of non-VTO technologies for 2017 classes 7 and 8 day cab tractors, classes 7 and 8 vocational trucks, and classes 4–6 vocational trucks were estimated at 3.6%, 17.3%, and 13.7%, respectively. Since the AEO new fleet fuel economies are reported in the output tables for a single heavy class, the results of the three classes 7 and 8 truck subclasses were combined using sales shares obtained from the Energy Information Administration. Although the standard AEO output tables report results for a single medium class of trucks, the Energy Information Administration models class 3 trucks separately from classes 4–6, and provide separate results tables. As with the previous prospective benefits analysis, TAE analyzed only classes 4–6 diesel trucks and not the class 3 diesel nor classes 3–6 gasoline trucks (Birky and Moore, 2013; Stephens et al., 2014). Because classes 4–6 gasoline trucks account for a relatively small fraction of classes 4–8 fuel consumption, benefits arising from penetration of VTO technologies in the classes 4–6 gasoline trucks are likely very to be small. The AEO new medium (classes 4–6) and heavy (classes 7 and 8) truck fuel economy projections were then modified to eliminate the VTO technology contributions. Finally, representative baseline vehicles were simulated in the TAE Heavy Truck Energy Balance dynamic model (HTEBdyn) using inputs on vehicle and engine characteristics consistent with the 2010 EPA/NHTSA baseline fuel economy standards. Most inputs were derived from the regulatory impact assessment and associated documentation (EPA and NHTSA, 2011a, 2011b; EPA, 2011a, 2011b). Where input values were not available, TAE relied on prior analyses to determine reasonable ranges and adjusted values within these ranges to obtain results consistent with the AEO base year fuel economies. The HTEBdyn model projected the fuel economy of representative vehicles on the EPA-specified duty cycles. The baseline case for HTs is detailed in Taylor and Moore (2015); the HTEBdyn model and documentation are available online (ANL, 2015b). 3.2.2 Heavy Truck Advanced Technology Modeling Modeling for HT Program Success followed a process flow similar to that for LDVs. Ensuring consistency with VTO program research areas and goals, TAE defined advanced vehicle platforms using input on technology approaches and benefits from VTO program

31
managers, the SuperTruck program (TAE, 2012), and prior years’ benefits analyses (Birky and Moore, 2013; Stephens et al., 2014). The following heavy vehicle classes and technology platforms were included:
• Classes 4–6 diesel delivery Best-in-class (BIC) conventional diesel CI Advanced conventional diesel CI Parallel hybrid diesel-electric CI
• Class 8 combination unit
BIC conventional diesel CI Advanced conventional diesel CI Parallel hybrid diesel-electric CI
• Classes 7 and 8 single unit
BIC conventional diesel CI Advanced conventional diesel CI Parallel hybrid diesel-electric CI
Technology characterizations—model parameters describing performance and cost—were developed for the Best-in-class (BIC) platforms for 2010 and 2015, with 2015 representing full application of current and near-term technologies. Technology characterizations also were developed for the advanced truck platforms representing the VTO program goals for 2015 and 2025. Program goals were assumed to be achieved using the technological approaches of SuperTruck industry teams (TAE, 2012) and the National Research Council (NRC, 2010). As detailed in Taylor and Moore (2015), technical data were specified for the following attributes:
• Base engine maximum thermal efficiency • Waste heat recovery strategy and performance • Coefficient of aerodynamic drag • Aerodynamic profile • Coefficient of rolling friction • Transmission type and efficiency • Truck empty weight • Hybridization strategy
Component costs relative to the baseline truck were estimated using the National Research Council study costs (NRC, 2010). The costs were assumed to decline at a rate of 1% per year following the expected date of technology availability reported in the NRC study. The BIC platform was included to capture the differences in technologies between baseline vehicles used by EPA and NHTSA to establish fuel economy standards and those used by the SuperTruck teams for their baseline vehicles. Therefore, this platform represents real differences in existing product offerings in recent model years and incorporation of very near-term technologies for the 2016–2017 timeframe. As described in the Section 2.2.3, there is some
32
market penetration of BIC trucks prior to 2015, but the petroleum savings and GHG benefits prior to 2015 are not included in the benefits reported here. The advanced conventional diesel and hybrid diesel platforms are two possible approaches to meeting the VTO program goals and are consistent with the development efforts of the SuperTruck industry partners. SuperTruck program goals are established for 2015 and 2025, but commercialization of the technologies developed to achieve them is likely to occur gradually, with some lag time following demonstration. Therefore, market introduction of vehicles with the program goal configurations was assumed to occur in 2017 and 2027 with fuel economies somewhat lower than those goals. Full achievement of the program goals was assumed to occur by 2022 and 2032. This was intended to represent the lag between demonstration of VTO program goals and commercialization of the technologies. Fuel-cell-powered trucks were not considered in this analysis, since even though it is possible to power both medium-duty and heavy-duty vehicles with fuel cells, significant market penetration in classes 7 and 8 trucks, which use the most energy, is not expected. Simulations of Program Success vehicles were developed in the HTEBdyn model and analyzed to estimate the fuel economy of each of these configurations for 2011 (BIC only), 2015 goals, and 2025 goals. Consistent with the fuel economies in the AEO, the analysis used the EPA sleeper cab drive cycle for combination unit trucks and the vocational drive cycle for all other trucks. As discussed above, this analysis was performed for representative trucks in each class, while the baseline includes multiple vehicle types. Therefore, the HTEBdyn results were not directly applicable to the baseline and the following methodology was used to account for the difference in composition. First, the trend of the baseline was applied to the representative vehicle base year (2011) fuel economy estimates from the HTEBdyn. For the analysis years, these values were compared with the advanced vehicle fuel economy estimates in order to develop fuel economy multipliers relative to the baseline. In each weight class, the 2011 BIC truck represents the highest available fuel economy for technologies currently on the market. The 2015 BIC represents incorporation of very-near-term technologies, e.g., advanced EPA SmartWay aerodynamics and next-generation wide-base tires. The 2015 platform was assumed to be available commercially in 2017 at a fuel economy representing 75% of the total improvement expected from all incorporated technologies and 100% improvement by 2022. For 2017 to 2022, it is assumed the added cost for the BIC truck over the baseline remains the same and all technology advances are to improve vehicle performance (i.e., fuel economy). Afterward, technology cost was assumed to decline by 25% by 2040 while fuel economy was held constant. The advanced conventional and hybrid combination unit trucks represent VTO goals, extrapolated from SuperTruck goals for long-haul trucks. The technologies used to achieve these goals are extended to classes 7–8 single unit and classes 4–6 trucks where applicable. These vehicles utilize approaches being investigated by the SuperTruck industry teams. In each truck class, the hybrid platform incorporates all technologies included on the advanced conventional vehicle and assumes synergies between hybridization and waste heat recovery systems (turbo-compounding and organic Rankine cycle). The technologies used to achieve the 2015 goals were

33
assumed to be commercially available in 2017 at a fuel economy representing 75% of the total improvement estimated for all incorporated technologies. By 2022, these platforms are assumed to fully achieve the 2015 goals. As in the BIC platform, the added cost of the advanced conventional and hybrid trucks was assumed to remain constant between 2017 and 2022. Both the advanced conventional and hybrid platforms were modeled with improved fuel economy, achieving 80% of the fuel economy benefits of the 2025 goals by 2027, and 100% by 2033. The added cost for the 2025 advanced conventional technology package would be somewhat higher than the 2015 package, based on 2010 estimates from the NRC study (NRC, 2010). However, it was assumed that ongoing technology advancement would reduce these costs such that the actual cost in 2027 would be slightly lower than the 2022 cost. By 2040, the additional cost for the advanced conventional truck relative to the baseline would be reduced by 15% compared with 2017. The added cost of hybridization depends on assumptions about both learning rates and production volume. Midrange estimates from the NRC study were used with assumptions of low production volume in 2017 and high production volume by 2032. As a result, the hybrid platforms show significant cost reductions of 40% in 2040 relative to 2017. Further details of the technologies, incremental cost estimates, and fuel economy improvements for each HT platform and technology package modeled are given in Taylor and Moore (2015). 3.2.3 Heavy Truck Market Penetration and Stock Modeling In the second phase of the heavy-truck analysis, the fuel economy improvements and estimated costs from HTEB/HTEBdyn modeling were used in the TRUCK market penetration model (ANL, 2015c) to project market penetration of the advanced platforms for 2010 through 2050. TRUCK projects market acceptance by comparing incremental costs and the value of fuel savings with buyer preferences for different payback periods. Since fuel-efficient technology is more cost-effective for trucks with higher annual mileage, the payback algorithm is applied to multiple mileage cohorts rather than assuming the fleet average mileage for all trucks. TRUCK then reports market share as a fraction of total miles driven by trucks of a particular model year in the first year of ownership. As for LDVs, fuel prices for HT market penetration analyses were taken from the AEO 2014 Reference case, extrapolated to 2050. No elasticity of travel demand was assumed for HTs, since these are primarily commercial vehicles with fuel costs passed on to the customers with little effect on the volume of commercial vehicle travel (Winebrake et al., 2015a, 2015b). Market penetration was projected for 2010 through 2050 since the technologies of the baseline and BIC vehicles were based on the AEO baseline year (2011). Therefore, projections include some penetration by BIC trucks prior to 2015. For the benefits estimates reported here, petroleum savings and GHG emission reductions attributable to technologies adopted prior to 2015 were not included, since the intention is to estimate only post-2015 benefits from VTO programs.

34
3.2.4 Attribution of Heavy Truck Benefits by Technology Area For the third and final step of the HT benefits analysis, fuel use by HTs in Program Success was compared with that in the baseline No Program case. Since the VISION model currently is not configured to analyze all the heavy-vehicle platforms modeled for the HT analysis, information from VISION, including total truck sales, age-specific average annual mileage, cumulative scrappage rates, and various correction factors, were applied in an additional spreadsheet tool, HDStock, that tracks the stock of heavy vehicles sold in 2010 and later, derived from the stock model in VISION. Fuel use by these trucks was calculated first by assuming the simulated fuel economies and TRUCK market penetrations, and then by assuming the baseline No Program fuel economy for all trucks. The difference between these two calculations provides a projection of energy and carbon emission savings attributable to the VTO program. The resulting projections of market penetration by advanced technology HTs and the resulting average fuel economy are discussed in Section 4. The HTEBdyn results were used to assess the relative contribution of each of the following technology types to fuel economy improvements:
• Engine efficiency, thermal management, and transmission: Base engine thermal efficiency (engine design and combustion process
improvements) Fuel injector advances, fuel and oil pump improvements Engine friction reduction Waste heat recovery (turbocompounding and organic Rankine cycle) Transmission, axles, controls, etc.
• Aerodynamics and rolling friction:
Coefficient of drag reductions through incorporation of fairings, dynamic gap closure, use of cameras instead of mirrors, and complete tractor and trailer redesign
Profile reductions through dynamic height adjustment and tractor and trailer redesign
Advances in low-rolling-resistance single wide-based tires
• Idle reduction (nonhybrid): Auxiliary power units (conventional and advanced) Automated engine stop/start systems
• Hybridization
• Other, such as auxiliary and accessory improvements, including electrification
(applies to auxiliaries not included in brake thermal efficiency measurements) Note that aerodynamics and rolling friction are not specifically DOE-sponsored technology subprograms, but are significant elements of the SuperTruck industry team strategies. The contributions of existing aerodynamic and rolling friction technologies to the AEO fuel

35
economies were included in the No Program case, so only benefits from improvements beyond these are attributed to the VTO program. Meanwhile, the vehicle platforms analyzed for the Program Success case included fuel economy improvements attributable to aggressive reductions in aerodynamic drag and rolling friction that are expected from the SuperTruck research program. Example strategies that might be used to achieve these reductions include dynamic ride-height and/or trailer gap adjustment and complete tractor and trailer redesign. Design of integrated tractor-trailers was not included. Mass reduction also is a significant component of the SuperTruck program and is a part of the VTO Materials R&D subprogram. Combination unit trucks are assumed to offset mass reductions by increasing cargo weight. Therefore, these advances improve freight efficiency (ton-miles per gallon) but not fuel economy. The HTEBdyn results for classes 7 and 8 single-unit and classes 4–6 trucks do include fuel economy improvements attributable to weight reduction. These results are included with the aerodynamic and rolling friction load reductions. The HTEBdyn model predicted power losses by vehicle component, which were used to calculate fuel consumption by technology type. The fuel consumption by technology area for each advanced vehicle was compared with the base vehicle to find the reduction in duty cycle average gallons per mile attributable to each technology area. For the BIC configuration, percentages were calculated for 2011 and 2015 and interpolated for the intervening years. The 2015 values were then held constant through 2050. For the remaining technologies, values were calculated for 2015 and 2025 and interpolated for the intervening years. The 2025 values were held constant for 2025 through 2050. Further details, including technology contributions disaggregated by size class, are reported in Taylor and Moore (2015).

36
4 RESULTS OF MODELING: MARKET PENETRATION AND FLEET FUEL ECONOMY
The results of the modeling described in Section 3 are presented in Sections 4.1–4.5, below. The levelized cost of driving (LCD) estimated for LDVs with different powertrain technologies are given in Section 4.1. In Section 4.2, projections for the five LDV consumer choice models are compared. The average fuel economies for LDVs based on these projections can be found in Section 4.3. Section 4.4 of the HT modeling for predicted market penetration, and Section 4.5 gives the results for average fuel economy by HT size class. 4.1 LIGHT-DUTY VEHICLE LEVELIZED COST OF DRIVING LCD was estimated for future LDVs with different drivetrains for No Program, Program Success, and an intermediate case, for which vehicle attributes were assumed to be between the No Program and Program Success cases. The LCD is calculated as the ratio of the sum of the vehicle price and the present value of fuel consumed in five years of operation, to the miles driven in five years. The LCD estimated for midsize cars in 2025 is shown in Figure 12, and for 2035 in Figure 13. Several drivetrains are analyzed, in 2010 dollars per mile. A 7% discount rate was assumed. The figures show the LCD of the intermediate case as colored bars, that of No Program as the upper error bar, and that of Program Success as the lower error bar. Program Success LCD values are consistently lower than for the other cases, particularly for more advanced powertrains such as FCVs and BEVs. 4.2 LIGHT-DUTY VEHICLE MARKET PENETRATION New LDV sales shares for No Program and Program Success were projected by drivetrain technology for 2015–2050. Sales shares projected by the five LDV choice models described in Section 3.1.2 are presented in Figures 14–18 and Tables 4–8. Projections by drivetrain type calculated by the stock model in VISION using the sales shares outputs of each model are shown in Figures 19–23. All models show significant penetration by alternative (non-Conv SI) vehicles for both No Program and Program Success, and, except for the ADOPT model, they show greater penetration by alternative vehicles in Program Success. The ADOPT model projected slightly lower penetration by alternative technologies in Program Success. The LVCFlex model projected a very rapid market penetration by HEV and PHEV10 in Program Success, and a large but slow increase in market share of FCVs, with a much higher FCV sales share in Program Success. MA3T projected a large market share for HEVs and BEV100 for both cases. CI Conv penetration is rapid in early years in Program Success, but CI Conv shares fall as PHEV10 and FCV shares increase. MA3T projected a high BEV100 market

37
FIGURE 12 Projected Levelized Cost of Driving of LDVs (midsize cars) in 2025. The bars show the LCDs of Program Success and the upper ends of the error bars show the LCDs of No Program. Present values (PVs) of fuel costs are shown assuming a 7% discount rate.
FIGURE 13 Projected Levelized cost of Driving of LDVs (midsize cars) in 2035. The bars show the LCDs Of Program Success, and the upper ends of the error bars show the LCDs of No Program. Present values (PVs) of fuel costs are shown assuming a 7% discount rate.
$‐
$0.10
$0.20
$0.30
$0.40
$0.50
$0.60
$0.70
$0.80
$0.90
Ref SI
Adv SI
Adv CI
CNG SI
SI HEV
FC HEV
CNG HEV
SI PHEV
10
SI PHEV
40
BEV
100
BEV
300
Levelized cost of driving, 2010$/m
ile
Fuel Cost (PV)
Wheels, Tires, etc.
Transmission
Generator
Integr Traction Dr
Energy Storage
Fuel Tank
Fuel Cell
Emission Control
ICE
Glider
$‐
$0.10
$0.20
$0.30
$0.40
$0.50
$0.60
$0.70
$0.80
$0.90
Ref SI
Adv SI
Adv CI
CNG SI
SI HEV
FC HEV
CNG HEV
SI PHEV
10
SI PHEV
40
BEV
100
BEV
300
Levelized
cost of driving, 2010$/m
ile
Fuel Cost (PV)
Wheels, Tires, etc.
Transmission
Generator
Integr Traction Dr
Energy Storage
Fuel Tank
Fuel Cell
Emission Control
ICE
Glider

38
FIGURE 14 LDV Sales Shares by Powertrain Type for No Program (left) and Program Success (right), Projected by the LVCFlex Model
FIGURE 15 LDV Sales Shares by Powertrain Type for No Program (left) and Program Success (right), Projected by the MA3T Model
FIGURE 16 LDV Sales Shares by Powertrain Type for No Program (left) and Program Success (right), Projected by the LAVE-Trans Model
2015 2025 2035 2045
BEV300
BEV100
FCV
PHEV40
PHEV10
HEV
Conv CI
0%
20%
40%
60%
80%
100%
2015 2025 2035 2045
Sales Share of LDVs
0%
20%
40%
60%
80%
100%
2015 2025 2035 2045
Sales Share of LD
Vs
2015 2025 2035 2045
BEV300
BEV100
FCV
PHEV40
PHEV10
HEV
Conv CI
0%
20%
40%
60%
80%
100%
2015 2025 2035 2045
Sales Share of LD
Vs
2015 2025 2035 2045
BEV100
FCV
PHEV40
HEV
No Program Program Success
No Program Program Success
No Program Program Success

39
FIGURE 17 LDV Sales Shares by Powertrain Type for No Program (left) and Program Success (right), Projected by the ParaChoice Model
FIGURE 18 LDV Sales Shares by Powertrain Type for No Program (left) and Program Success (right), Projected by the ADOPT Model
TABLE 4 Percent LDV Market Penetration Estimates for No Program and Program Success, from the LVCFlex Model
No Program (%) Program Success (%)
Drivetrain Type
2020 2030 2040 2050 2020 2030 2040 2050 SI Conv 87.1 73.7 62.6 50.6 67.0 60.7 45.9 32.2 CI Conv 1.7 4.1 5.7 3.8 7.4 3.7 3.0 2.1 HEV Gasoline 7.4 11.3 11.4 12.8 17.0 16.3 16.6 16.0 PHEV10 1.2 3.0 1.8 1.6 0.8 0.8 0.8 0.7 PHEV40 2.5 6.3 8.3 10.3 7.6 14.0 14.8 14.7 BEV100 0.1 1.5 3.8 3.9 0.2 3.5 3.9 3.2 BEV300 0.0 0.0 0.0 0.0 0.0 0.0 0.1 0.2 FCV 0.0 0.3 6.3 16.9 0.0 1.0 14.9 31.0
0%
20%
40%
60%
80%
100%
2015 2025 2035 2045
Sales Share of LD
Vs
2015 2025 2035 2045
BEV100
FCV
PHEV40
PHEV10
HEV
Conv CI
0%
20%
40%
60%
80%
100%
2015 2025 2035 2045
Sales Sh
are of LD
Vs
2015 2025 2035 2045
CNG
BEV100
FCV
PHEV
HEV
Conv CI
No Program Program Success
No Program Program Success
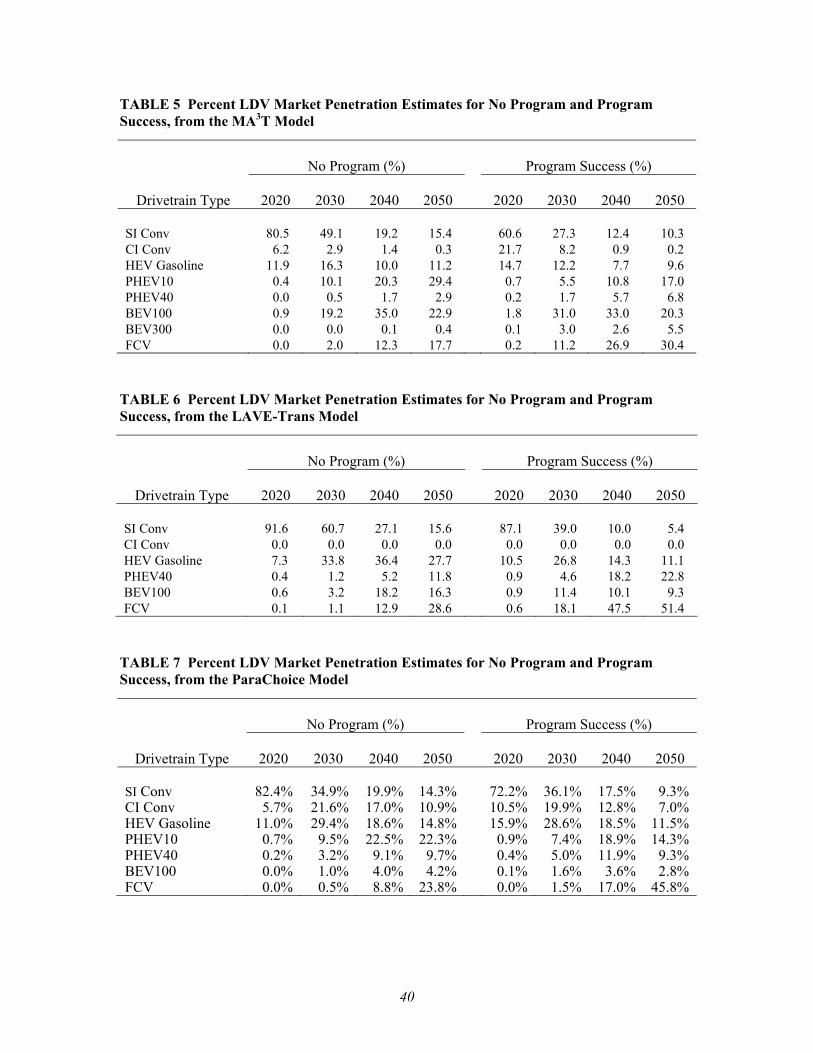
40
TABLE 5 Percent LDV Market Penetration Estimates for No Program and Program Success, from the MA3T Model
No Program (%) Program Success (%)
Drivetrain Type
2020 2030 2040 2050 2020 2030 2040 2050 SI Conv 80.5 49.1 19.2 15.4 60.6 27.3 12.4 10.3 CI Conv 6.2 2.9 1.4 0.3 21.7 8.2 0.9 0.2 HEV Gasoline 11.9 16.3 10.0 11.2 14.7 12.2 7.7 9.6 PHEV10 0.4 10.1 20.3 29.4 0.7 5.5 10.8 17.0 PHEV40 0.0 0.5 1.7 2.9 0.2 1.7 5.7 6.8 BEV100 0.9 19.2 35.0 22.9 1.8 31.0 33.0 20.3 BEV300 0.0 0.0 0.1 0.4 0.1 3.0 2.6 5.5 FCV 0.0 2.0 12.3 17.7 0.2 11.2 26.9 30.4
TABLE 6 Percent LDV Market Penetration Estimates for No Program and Program Success, from the LAVE-Trans Model
No Program (%) Program Success (%)
Drivetrain Type
2020 2030 2040 2050 2020 2030 2040 2050 SI Conv 91.6 60.7 27.1 15.6 87.1 39.0 10.0 5.4 CI Conv 0.0 0.0 0.0 0.0 0.0 0.0 0.0 0.0 HEV Gasoline 7.3 33.8 36.4 27.7 10.5 26.8 14.3 11.1 PHEV40 0.4 1.2 5.2 11.8 0.9 4.6 18.2 22.8 BEV100 0.6 3.2 18.2 16.3 0.9 11.4 10.1 9.3 FCV 0.1 1.1 12.9 28.6 0.6 18.1 47.5 51.4
TABLE 7 Percent LDV Market Penetration Estimates for No Program and Program Success, from the ParaChoice Model
No Program (%) Program Success (%)
Drivetrain Type
2020 2030 2040 2050 2020 2030 2040 2050 SI Conv 82.4% 34.9% 19.9% 14.3% 72.2% 36.1% 17.5% 9.3% CI Conv 5.7% 21.6% 17.0% 10.9% 10.5% 19.9% 12.8% 7.0% HEV Gasoline 11.0% 29.4% 18.6% 14.8% 15.9% 28.6% 18.5% 11.5% PHEV10 0.7% 9.5% 22.5% 22.3% 0.9% 7.4% 18.9% 14.3% PHEV40 0.2% 3.2% 9.1% 9.7% 0.4% 5.0% 11.9% 9.3% BEV100 0.0% 1.0% 4.0% 4.2% 0.1% 1.6% 3.6% 2.8% FCV 0.0% 0.5% 8.8% 23.8% 0.0% 1.5% 17.0% 45.8%

41
TABLE 8 Percent LDV Market Penetration Estimates for No Program and Program Success, from the ADOPT Model
No Program (%) Program Success (%)
Drivetrain Type
2020 2030 2040 2050 2020 2030 2040 2050 SI Conv 90.4 56.1 48.8 44.1 87.2 56.3 50.3 49.5 CI Conv 0.6 0.4 0.4 0.5 0.6 0.4 0.4 0.3 HEV Gasoline 5.8 35.0 40.4 45.0 8.0 32.7 38.0 39.3 PHEV 2.7 5.8 6.2 5.9 3.3 6.2 5.6 5.3 BEV100 0.2 0.3 0.5 0.6 0.7 1.0 1.0 1.0 FCV 0.0 0.4 1.5 2.0 0.0 1.8 2.9 2.8 CNG SI 0.3 2.0 2.1 2.0 0.3 1.8 1.9 1.7
FIGURE 19 LDV Stock by Powertrain Type for No Program (left) and Program Success (right), Projected by the LVCFlex Model
FIGURE 20 LDV Stock by Powertrain type for No Program (left) and Program Success (right), Projected by the MA3T model
0
50
100
150
200
250
300
2015 2025 2035 2045
LDV Stock (milions)
2015 2025 2035 2045
Conv SI
BEV300
BEV100
FCV
PHEV40
PHEV10
HEV
0
50
100
150
200
250
300
350
2015 2025 2035 2045
LDV Stock (milions)
2015 2025 2035 2045
Conv SI
BEV300
BEV100
FCV
PHEV40
PHEV10
HEV
Conv CI
No Program Program Success
No Program Program Success

42
FIGURE 21 LDV stock by powertrain type for No Program (left) and Program Success (right), Projected by the LAVE-Trans model
FIGURE 22 LDV stock by powertrain type for No Program (left) and Program Success (right), Projected by the ParaChoice model
FIGURE 23 LDV stock by powertrain type for No Program (left) and Program Success (right), Projected by the ADOPT model
0
50
100
150
200
250
300
2015 2025 2035 2045
LDV Stock (milions)
2015 2025 2035 2045
Conv SI
BEV100
FCV
PHEV40
HEV
No Program Program Success
0
50
100
150
200
250
300
2015 2025 2035 2045
LDV Stock (milions)
2015 2025 2035 2045
Conv SI
BEV
FCV
PHEV
HEV
Conv CI
No Program Program Success
0
50
100
150
200
250
300
2015 2025 2035 2045
LDV Stock (milions)
2015 2025 2035 2045
Conv SI
BEV
FCV
PHEV40
PHEV10
HEV
Conv CI
No Program Program Success

43
penetration in both cases, and significantly greater FCV market share in Program Success in later years. The LAVE-Trans model also projected high penetration by advanced vehicle types in both Program Success and No Program, with higher penetration by PHEV40 and much higher penetration by FCV in Program Success. Projections from the ParaChoice model for the two cases were more similar, with CI Conv reaching a fairly high sales share in the mid-term (around 2030), but FCV shares were higher in Program Success in the long term. Projections of the ADOPT model, shown in Figures 18 and 23, were quite different from those of the other models. ADOPT used different inputs, which, while based on similar assumptions about component performance, had vehicle attributes that were calculated endogenously. Some vehicle attributes in ADOPT differed significantly from those used in other models. ADOPT also employed different component price models; some (e.g., for fuel cells) were low-production-volume estimates in early years. As a derivative of a mixed multinomial logit model, the structure of the ADOPT model is unlike the other vehicle choice models. The ADOPT model represents vehicles at the make/model/trim level, using data on currently available vehicles to populate vehicle attributes for the first few projected years. Attributes of vehicles can change endogenously, and models that show growth in sales shares are “cloned”: additional vehicle choices are made available with similar attributes. It is not clear how these differences resulted in such different market share projections. The four LDV choice models using inputs based directly on the VTO and FCTO goals for Program Success and inputs established for No Program give quantitatively different market penetration projections, but show similar market penetration by advanced technology vehicles. As described in Section 4.3, the fuel economy of the LDV fleet is projected to increase with significant reductions in petroleum use and GHG emissions. 4.3 AVERAGE LIGHT-DUTY VEHICLE FUEL ECONOMY The fleet-average unadjusted fuel economy for new cars, light trucks, and the entire new LDV fleet Program Success and No Program cases are shown in Figure 24, based on the market share projections of the LVCFlex model. Using projected fuel economy values for new vehicles and the stock model in VISION, with assumed on-road degradation factors, the on-road fleet-average fuel economies were calculated for both cases and are shown in Figure 25. Analogous fuel economy projections are shown in Figures 26 and 27 (MA3T), Figures 28 and 29 (LAVE-Trans), Figures 30 and 31 (ParaChoice), and Figures 32 and 33 (ADOPT). As with the market share projections, there are quantitative differences between projections of the models; but qualitatively they show increasing average fuel economy for the new and on-road fleets. Much higher average fuel economy averages are projected for Program Success, though the increase occurs at different rates depending on the vehicle choice model used. The average fuel economies based on the ADOPT model projections are significantly lower in both cases due to the low market share of PEVs and FCVs and to somewhat lower fuel economies for Conv SI vehicles input into the ADOPT model. However, as noted in Sections 3.1.2 and 4.2, the vehicle attributes assumed in the ADOPT input were different from those used in other vehicle choice models.

44
FIGURE 24 Fleet-Average Fuel Economies of New Cars, Light-Duty Trucks, and LDV Fleet for No Program (dashed lines) and Program Success (solid lines), Based on Market Projections of the LVCFlex Model
FIGURE 25 Average On-Road Fuel Economy of Cars, Light-Duty Trucks, and LDV Fleet for No Program (dashed lines) and Program Success (solid lines), Based on Market Projections of the LVCFlex Model
0
20
40
60
80
100
120
140
160
180
2010 2020 2030 2040 2050
Fuel Economy, Unad
justed
, Combined City/Highway, m
i/gge
Cars, Program Success
LDVs, Program Success
Light trucks, Program Success
Cars, No Program
LDVs, No Program
Light trucks, No Program
0
20
40
60
80
100
120
140
160
180
2010 2020 2030 2040 2050
Fuel Economy, On‐road
, Combined
City/Highway, m
i/gge
Cars, Program Success
LDVs, Program Success
Light trucks, Program Success
Cars, No Program
LDVs, No Program
Light trucks, No Program
LVCFlex New Fleet
Average Fuel Economy
LVCFlex On‐Road Fleet
Average Fuel Economy

45
FIGURE 26 Fleet-Average Fuel Economy of New Cars, Light-Duty Trucks, and LDV Fleet for No Program (dashed lines) and Program Success (solid lines), Based on Market Projections of the MA3T Model
FIGURE 27 Average On-Road Fuel Economy of Cars, Light-Duty Trucks, and LDV Fleet for No Program (dashed lines) and Program Success (solid lines), Based on Market Projections of the MA3T Model
0
20
40
60
80
100
120
140
160
180
2010 2020 2030 2040 2050
Fuel Economy, Unad
justed
, Combined
City/Highway, m
i/gge
Cars, Program Success
LDVs, Program Success
Light trucks, Program Success
Cars, No Program
LDVs, No Program
Light trucks, No Program
0
20
40
60
80
100
120
140
160
180
2010 2020 2030 2040 2050
Fuel Economy, On‐road
, Combined
City/Highway, m
i/gge
Cars, Program Success
LDVs, Program Success
Light trucks, Program Success
Cars, No Program
LDVs, No Program
Light trucks, No Program
MA3T New Fleet
Average Fuel Economy
MA3T On‐Road Fleet
Average Fuel Economy

46
FIGURE 28 Fleet-Average Fuel Economy of New Cars, Light-Duty Trucks, and LDV Fleet for No Program (dashed lines) and Program Success (solid lines), Based on Market Projections of the LAVE-Trans Model
FIGURE 29 Average On-Road Fuel Economy of Cars, Light-Duty Trucks, and LDV Fleet for No Program (dashed lines) and Program Success (solid lines), Based on Market Projections of the LAVE-Trans Model
0
20
40
60
80
100
120
140
160
180
2010 2020 2030 2040 2050
Fuel Economy, Unad
justed
, Combined
City/Highway, m
i/gge
Cars, Program Success
LDVs, Program Success
Light trucks, Program Success
Cars, No Program
LDVs, No Program
Light trucks, No Program
0
20
40
60
80
100
120
140
160
180
2010 2020 2030 2040 2050
Fuel Economy, On‐road
, Combined
City/Highway, m
i/gge
Cars, Program Success
LDVs, Program Success
Light trucks, Program Success
Cars, No Program
LDVs, No Program
Light trucks, No Program
LAVE‐Trans New Fleet
Average Fuel Economy
LAVE‐Trans On‐Road
Fleet Average Fuel
Economy

47
FIGURE 30 Fleet-Average Fuel Economy of New Cars, Light-Duty Trucks, and LDV Fleet for No Program (dashed lines) and Program Success (solid lines), Based on Market Projections of the ParaChoice Model
FIGURE 31 Average On-Road Fuel Economy of Cars, Light-Duty Trucks, and LDV Fleet for No Program (dashed lines) and Program Success (solid lines), Based on Market Projections of the ParaChoice Model
0
20
40
60
80
100
120
140
160
180
2010 2020 2030 2040 2050
Fuel Economy, Unad
justed, Combined
City/Highway, m
i/gge
Cars, Program Success
LDVs, Program Success
Light trucks, Program Success
Cars, No Program
LDVs, No Program
Light trucks, No Program
0
20
40
60
80
100
120
140
160
180
2010 2020 2030 2040 2050
Fuel Economy, On‐road
, Combined
City/Highway, m
i/gge
Cars, Program Success
LDVs, Program Success
Light trucks, Program Success
Cars, No Program
LDVs, No Program
Light trucks, No Program
ParaChoice New Fleet
Average Fuel Economy
ParaChoice On‐Road
Fleet Average Fuel
Economy

48
FIGURE 32 Fleet-Average Fuel Economy of New Cars, Light-Duty Trucks, and LDV Fleet for No Program (dashed lines) and Program Success (solid lines), Based on Market Projections of the ADOPT Model
FIGURE 33 Average On-Road Fuel Economy of Cars, Light-Duty Trucks, and LDV Fleet for No Program (dashed lines) and Program Success (solid lines), Based on Market Projections of the ADOPT Model
0
20
40
60
80
100
120
140
160
180
2010 2020 2030 2040 2050
Fuel Economy, Unad
justed, Combined
City/Highway, m
i/gge
Cars, Program Success
LDVs, Program Success
Light trucks, Program Success
Cars, No Program
LDVs, No Program
Light trucks, No Program
0
20
40
60
80
100
120
140
160
180
2010 2020 2030 2040 2050
Fuel Economy, On‐road
, Combined
City/Highway, m
i/gge
Cars, Program Success
LDVs, Program Success
Light trucks, Program Success
Cars, No Program
LDVs, No Program
Light trucks, No Program
ADOPT New Fleet
Average Fuel Economy
ADOPT On‐Road Fleet
Average Fuel Economy

49
4.4 HEAVY TRUCK MARKET PENETRATION Projections for market penetration of advanced technology HTs in Program Success are given in Table 9 as fractions of total VMT by new trucks in a calendar year. As described in Section 3.2.1, the baseline technology package for each size class represents No Program, and market shares of No Program are all 100% baseline. Market penetration estimates are based on the time it takes for the fuel savings to offset the incremental cost of the technology—a calculation that depends on annual miles of travel. Therefore, fuel-saving technologies are adopted at a higher rate in applications with above-average annual mileage. Since miles traveled correlate with fuel consumption, using a simple percentage of truck sales does not provide an accurate accounting of new-fleet fuel economy. For classes 7–8 combination unit trucks, the BIC platform shows high market penetration in the early years due to the inclusion of relatively inexpensive component technologies. These technologies provide improvements in fuel economy that are very cost effective for the high-mileage trucks in this class. While the 44.1% market penetration in 2015 may seem high, the projections were made for 2010–2050, and some penetration of the BIC platform was seen in years prior to 2015. However, fuel savings and GHG reductions were calculated from 2015 in order to avoid attributing benefits to technologies adopted prior to 2015. The advanced conventional diesel trucks also show significant market share (shown as VMT share in Table 9) for the combination unit trucks in the first year of introduction, but less
TABLE 9 Medium- and Heavy-Duty Truck Market Penetration Estimates for the Target Case, as Percentage of VMT
% VMT
Vehicle
2015 2020 2030 2040 2050 Medium (classes 4–6) diesel
Baseline 83.1 75.1 57.2 38.2 27.3 BIC conventional 16.9 15.3 20.9 27.8 31.8 Advanced conventional 0.0 9.5 19.1 25.6 29.4 Diesel HEV 0.0 0.1 2.8 8.4 11.4
Heavy (classes 7, 8) combination unit
Baseline diesel 55.9 37.6 21.1 11.0 8.2 BIC conventional 44.1 44.6 34.8 35.2 35.3 Advanced conventional 0.0 16.2 27.9 30.1 31.0 Diesel HEV 0.0 1.6 16.2 23.7 25.5
Heavy (classes 7, 8) single unit
Baseline diesel 92.7 88.7 75.7 55.2 43.0 BIC conventional 7.3 9.3 14.2 23.4 27.1 Advanced conventional 0.0 1.8 7.0 13.2 17.9 Diesel HEV 0.0 0.2 3.1 8.1 12.0

50
than the BIC due to higher incremental costs. As this platform becomes more efficient and decreases in cost, it steadily gains VMT share, growing from zero in 2015 to 31% in 2050. Meanwhile, the hybrid truck initially gains only small VMT share, due to high incremental costs and little fuel economy benefit compared with the advanced conventional truck with its long-haul-type driving cycle. However, the hybrid truck realizes greater cost reductions over time due to more manufacturing experience (learning) and higher production volumes. By 2030, the hybrid platform achieves a share of 16.2% of vehicle miles in the combination unit class, growing to 25.5% by 2050. The results for single-unit trucks are quite different because fewer miles are traveled by trucks in this class in a year. The BIC platform initially captures 7.3% of VMT and gradually increases to 27.1% by 2050. The advanced conventional truck platform achieves less than 2% of VMT by 2020 and reaches 17.9% by 2050. Although the hybrid drivetrain provides more fuel consumption benefits for the vocational drive cycle than for the long-haul cycle, the low annual mileage of the single-unit trucks means longer payback periods. As a result, the hybrid platform achieves a 12% share of VMT by 2050. Overall, the advanced technology platforms achieve less penetration into the classes 4–6 diesel truck market than in the classes 7–8 market, reflecting the fact that these trucks see the lowest annual mileage of the classes analyzed. In total, advanced vehicles account for 73% of VMT in 2050. It should be noted that classes 6–8 vehicles are very diverse in their configurations and uses, but are modeled here as a single class, limiting the fidelity of the model. However, the average fuel economy and annual driving distance distributions used as input should adequately capture the fuel use of this range of vehicles. 4.5 AVERAGE HEAVY TRUCK FUEL ECONOMY The projections of new vehicle fleet fuel economy values for medium- and heavy-duty trucks are shown in Figure 34 for Program Success and No Program. Fleet averages are mileage-weighted values. As a result of DOE-supported technologies, the fuel economy of the fleet of all new classes 7 and 8 trucks is projected to reach 1.62 times that of the same trucks in No Program in 2035 and 1.64 times in 2050. Because of the lower annual usage of classes 4–6 trucks, the market penetration is slower, and resulting impact of DOE-funded technologies is somewhat less in these vehicles, with a fuel economy ratio of 1.26 in 2035 and 1.38 in 2050. The average fuel economy of the on-road stock of medium- and heavy-duty trucks of each range of size class analyzed are shown in Figure 35. The on-road fuel economy increases for each size class range. The increase is more rapid for the classes 7 and 8 combination units because advanced technologies are adopted more extensively in these trucks than in other trucks. Additionally, classes 7 and 8 combination unit trucks are replaced at an earlier age, leading to more rapid penetration into the on-road fleet of advanced technologies.

51
FIGURE 34 Fleet-Average Fuel Economy of New Medium- and Heavy-Duty Trucks for No Program (dashed lines) and Program Success (solid lines)
FIGURE 35 Average On-Road Fuel Economy of Medium- and Heavy-Duty Trucks for No Program (dashed lines) and Program Success (solid lines)
5.0
6.0
7.0
8.0
9.0
10.0
11.0
2015 2020 2025 2030 2035 2040 2045 2050
New
Veh
icle Fuel Economy, m
i/gge
7&8 CU No Progr 7&8 CU Progr Success
7&8 SU No Progr 7&8 SU Progr Success
4‐6 Diesel No Progr 4‐6 Diesel Progr Success
5.0
6.0
7.0
8.0
9.0
10.0
11.0
12.0
2015 2020 2025 2030 2035 2040 2045 2050
On‐Road
Stock Fuel Economy,
mi/gge
7&8 CU No Progr 7&8 SU D No Progr
4‐6 Diesel No Progr 7&8 CU Progr Success
7&8 SU D Progr Success 4‐6 Diesel Progr Success

52
5 RESULTS OF MODELING: OVERALL BENEFITS OF THE VEHICLE TECHNOLOGIES
AND FUEL CELL TECHNOLOGIES PROGRAMS Reductions in energy use and GHG emissions attributable to VTO and FCTO program technologies were projected for the entire U.S. fleet (LDVs + HTs) as described in this report. Table 10 quantifies the cumulative energy and emissions savings projected to occur after 2015, energy and emissions reduction rates in each year, and the economic implications projected through 2050.
As described in Sections 3.1.2 and 4.2, reductions in oil consumption and GHG emissions in LDVs were estimated using four different LDV consumer choice models, while only one set of projections was made for HTs. Values for LDVs are therefore shown as ranges, which show considerable uncertainty because of the wide range of market penetration projected for advanced technology LDVs under both No Program and Program Success.
The projected reductions in oil use from successful VTO and FCTO programs are significant: up to 3.1 million bpd in 2035 and 3.7 million bpd in 2050. The oil savings projected for 2035 amount to as much as 18% of the total U.S. petroleum consumption in the same year as projected in the AEO 2014 Reference case. The U.S. transportation sector is oil intensive, with 92% of the energy used by the sector coming from petroleum in 2013. Transportation-sector petroleum consumption represented 67% of total U.S. petroleum consumption, and net imports of petroleum were 33% of the total amount consumed (Davis et al., 2014). Oil security remains important to the U.S. even with increased domestic oil production. An economic value can be assigned to oil security that reflects the potential reduction (as a consequence of the VTO and FCTO programs) in damage done to the U.S. economy by oil supply disruptions. The benefits that can be measured monetarily are:
• Transfer of wealth––the quantity of oil imports at the higher price, multiplied by the difference between the actual price of oil and what the price would have been in a competitive (or undisrupted) market.
• Economic surplus losses––deadweight losses that accompany changes in
prices and the amounts of oil supplied.
• Macroeconomic disruption costs––costs that occur when sudden changes in oil price cause economic dislocations that result in temporary underemployment and misallocation of resources, and thereby a loss of gross domestic product beyond what the higher price level alone would induce. Disruption costs result from job destruction and creation, and they cause a temporary period of increased unemployment and lost productivity.
Oil security costs for No Program and Program Success were estimated from the total oil
consumption projected using the Oil Security Metrics Model at Oak Ridge National Laboratory

53
TABLE 10 Projected Benefits of Vehicle Technologies Office and Fuel Cell Technologies Office Programs
Impact Metric
Year
2025 2030 2035 2050
Energy security
Oil savings, cumulative (billion bbl)
LDVs HTs Total
1.0–1.5 1.3
2.3–2.7
2.9–3.8 2.7
5.5–6.5
5.3–6.8 4.6
9.9–11.4
14.0–19.1 12.3
26.3–31.3 Oil savings, (million bpd)
LDVs HTs Total
0.7–0.9 0.5
1.2–1.4
1.1–1.5 0.8
1.9–2.3
1.4–2.1 1.0
2.4–3.1
1.4–2.2 1.5
2.9–3.7 New vehicle mpg improvement (percent)a
LDVs HTs
51–67% 34%
52–107% 45%
63–129% 52%
57–85% 55%
On-road mpg improvement (percent)a
LDVs HTs
26–32% 20%
38–52% 30%
47–76% 39%
61–98% 47%
Environment CO2 emissions reduction,b
cumulative (million tons CO2 eq) 1,100–1,340 2,670–3,060 4.940–5,360 13,645–15,264
GHG emissions reduction, annual (million tons CO2 eq/yr)
LDVs HTs Total
118–154 88
206–241
201–236 137
338–374
252–320 183
435–504
342–478 266
608–744 Economy Primary energy savings,b
cumulative (quads) 16–20 39–46 72–80 184–212
Primary energy savings, annual (quads/yr)
3.0–3.7 3.1–3.8 6.2–7.1 7.3–9.3
a Improvement relative to baseline (No Program) fleet in the same year. b “Reductions” and “savings” are calculated as the difference between the results from the baseline
(No Program) case (i.e., in which there is no future DOE funding for this technology) and the results from Program Success (i.e., in which requested DOE funding for this technology is received and the program is successful). All cumulative metrics are based on results beginning in 2016.

54
(Greene et al., 2014). Reductions in oil security costs calculated for the projections made using the LAVE-Trans model for LDVs and the HT projections made using the TRUCK and HTEB models as described in Sections 4.2 and 4.4. Due to the unpredictability of the global oil market, the output of the Oil Security Metrics Model includes uncertainty ranges based on stochastic calculations that account for the market uncertainties. Figure 36 shows the projected ranges of oil security cost reductions for Program Success. Oil security cost reductions increase as oil savings increase. The cost reductions range from $72 billion to $221 billion in 2040. The mean value, $125 billion, represents about 0.4% of the gross domestic product as projected by the AEO Reference case. The estimated annual GHG emission benefit in 2035 is up to 500 million metric tons of carbon dioxide equivalent (CO2 eq), as shown in Table 10. These GHG reductions are substantial and will help the nation move toward a lower GHG total in 2035. Various dollar values have been placed on a ton of CO2 (IWG, 2013). Assuming CO2 values ranging from $10 to $100 per metric ton, these estimated carbon reductions would range in value from $5 billion to $50 billion per year (not discounted). Improving fuel economy offers benefits to consumers, who pay lower prices for fuel and transportation-dependent commodities. The fuel economy improvements shown in Table 10 are large, with fuel economy of new LDVs potentially doubling by 2035 (from the No Program case), implying greatly reduced consumer spending on fuel. Likewise, large improvements in HT fuel economy (over a 50% increase in new HT fuel economy by 2030) imply savings in goods transported by truck. In addition to these savings, increased average U.S. fuel economy means that vehicle drivers use fuel more efficiently, depending less on large amounts of petroleum fuel
FIGURE 36 Estimated Reduction in Oil Security Costs Based on Projections of LDV Sales from the LAVE-Trans Model and HT Sales from the TRUCK Model, with Uncertainty Intervals
$ 0
$ 50
$ 100
$ 150
$ 200
$ 250
2015 2020 2025 2030 2035 2040
Oil Security Cost Reduction (billion $)
5% ‐ 95%
+/‐ 1 Std. Dev.
Mean

55
and becoming more insulated from potential oil shocks. Dependency on oil decreases further as consumers move from conventional ICE vehicles to plug-in vehicles powered by both electricity and petroleum and to FCVs powered by hydrogen produced from a variety of primary energy sources. Together, these benefits demonstrate that successful VTO and FCTO programs will significantly reduce (1) oil consumption and oil dependence, (2) GHG emissions, and (3) consumer energy expenditures. Moreover, these programs offer American drivers benefits not captured in Table 10, including increased mobility, and reduced exposure to potential oil price shocks.

56
6 REFERENCES ANL (Argonne National Laboratory), 2014, GREET Model: The Greenhouse Gases, Regulated Emissions, and Energy Use in Transportation Model, Argonne National Laboratory, Argonne, Ill., http://greet.es.anl.gov/, accessed Sept. 21, 2015. ANL (Argonne National Laboratory), 2015a, Autonomie, Argonne National Laboratory, Argonne, Ill., http://www.autonomie.net/index.html, accessed Dec. 10, 2015. ANL (Argonne National Laboratory), 2015b, HTEBdyn Heavy Truck Energy Balance Dynamic Model, Argonne National Laboratory, Argonne, Ill., www.anl.gov/energy-systems/project/ htebdyn-heavy-truck-energy-balance-dynamic-model, accessed Dec. 3, 2015. ANL (Argonne National Laboratory), 2015c, TRUCK Heavy Vehicle Market Penetration Model, Argonne National Laboratory, Argonne, Ill., www.anl.gov/energy-systems/project/truck-heavy-vehicle-market-penetration-model, accessed Dec. 3, 2015. Bandivadekar, A., et al., 2008. On the Road in 2035: Reducing Transportation’s Petroleum Consumption and GHG Emissions, Report No. LFEE 2008-05 RP, Laboratory for Energy and the Environment, Massachusetts Institute of Technology, Cambridge, Mass., http://web.mit.edu/sloan-auto-lab/research/beforeh2/otr2035/ Birky, A., 2015, Modeling for Light and Heavy Vehicle Market Analysis, presented at U.S. Department of Energy Vehicle Technologies Office Annual Merit Review and Peer Evaluation, Washington, D.C., http://energy.gov/eere/vehicles/downloads/vehicle-technologies-office-merit-review-2015-modeling-light-and-heavy, accessed Dec. 10, 2015. Birky, A., and J. Moore, 2013, GPRA 2014 VT Heavy Vehicles Program Benefits Analysis Methodology, memorandum from Birky and Moore/TA Engineering to Tom Stephens/ANL and Jacob Ward/DOE, Jan. 17. Brooker, A., J. Gonder, S. Lopp, and J. Ward, 2015, “ADOPT: A Historically Validated Light Duty Vehicle Consumer Choice Model,” SAE Technical Paper 2015-01-0974. Davis, S.C., S.W. Diegel, and R. G. Boundy, 2014, Transportation Energy Data Book, ORNL-6990, Oak Ridge National Laboratory, Oak Ridge, Tenn. EIA (Energy Information Agency), 2014, Annual Energy Outlook 2014: With Projections to 2040, DOE/EIA-0383(2013), Office of Integrated Analysis and Forecasting, Energy Information Administration, U.S. Department of Energy, Washington, D.C.

57
EPA (U.S. Environmental Protection Agency), 2006, Final Rule: Fuel Economy Labeling of Motor Vehicles: Revisions To Improve Calculation of Fuel Economy Estimates, Federal Register, Dec. 27, 2006, www.federalregister.gov/articles/2006/12/27/06-9749/fuel-economy-labeling-of-motor-vehicles-revisions-to-improve-calculation-of-fuel-economy-estimates, accessed Sept. 21, 2015. EPA (U.S. Environmental Protection Agency), 2011a, Final Rulemaking to Establish Greenhouse Gas Emissions Standards and Fuel Efficiency Standards for Medium- and Heavy-Duty Engines and Vehicles, Regulatory Impact Analysis, EPA-420-R-11-901, Office of Transportation and Air Quality, U.S. Environmental Protection Agency; and National Highway Traffic Safety Administration, U.S. Department of Transportation; August. EPA (U.S. Environmental Protection Agency), 2011b, Greenhouse Gas Emissions Model (GEM) User Guide, EPA-420-B-11-019, Assessment and Standards Division, Office of Transportation and Air Quality, U.S. Environmental Protection Agency, August. EPA and DOE (U.S. Environmental Protection Agency and U.S. Department of Energy), 2011, Where the Energy Goes: Gasoline Vehicles, http://www.fueleconomy.gov/feg/atv.shtml, accessed Feb. 11, 2016. EPA and NHTSA (U.S. Environmental Protection Agency and National Highway Transportation Safety Administration), 2011a, Final Rule: Greenhouse Gas Emissions Standards and Fuel Efficiency Standards for Medium- and Heavy-Duty Engines and Vehicles, Federal Register, Sept. 9, 2011, www.federalregister.gov/articles/2011/09/15/2011-20740/greenhouse-gas-emissions-standards-and-fuel-efficiency-standards-for-medium--and-heavy-duty-engines, accessed Sept. 21, 2015. EPA and NHTSA (U.S. Environmental Protection Agency and National Highway Transportation Safety Administration), 2011b, Draft Joint Technical Support Document: Proposed Rulemaking for 2017-2025 Light-Duty Vehicle Greenhouse Gas Emission Standards and Corporate Average Fuel Economy Standards, EPA-420-D-11-901, www.epa.gov/otaq/climate/documents/ 420d11901.pdf, accessed Sept. 21, 2015. Greene, D.L., 2010, How Consumers Value Fuel Economy: A Literature Review, EPA-410-10-008, Environmental Protection Agency, Washington, D.C., www3.epa.gov/otaq/ climate/regulations/420r10008.pdf, accessed Dec. 3, 2015. Greene, D.L., D.H. Evans, and J. Hiestand, 2013, “Survey Evidence on the Willingness of U.S. Consumers to Pay for Automotive Fuel Economy,” Energy Policy, 61, 1539-1550. Greene, D.L., C. Liu, and P.N. Leiby, 2014, The Oil Security Metric Model: 2014 Update, ORNL/TM-2014/628, Oak Ridge National Laboratory, Oak Ridge, Tenn.

58
IWG (Interagency Working Group on Social Cost of Carbon), 2013, Technical Support Document: Technical Update of the Social Cost of Carbon for Regulatory Impact Analysis Under Executive Order 12866, www.whitehouse.gov/sites/default/files/omb/inforeg/ social_cost_of_carbon_for_ria_2013_update.pdf, accessed Dec. 3, 2015. Kim, H.K., and T.J. Wallington, 2013, “Life Cycle Assessment of Vehicle Lightweighting: A Physics-Based Model of Mass-Induced Fuel Consumption,” Environmental Science and Technology, 47, 14358-14366. Lin, Z., and D.L. Greene, 2010, “A Plug-in Hybrid Consumer Choice Model with Detailed Market Segmentation,” presented at Transportation Research Board 2010 Annual Meeting, TRB 89th Annual Meeting Compendium of Papers, Transportation Research Board, Washington, D.C., http://pubsindex.trb.org/view.aspx?id=910112, accessed Sept. 21, 2015. Lin, Z., and D.L. Greene, 2011, “Promoting the Market for Plug-In Hybrid and Battery Electric Vehicles: The Role of Recharge Availability,” Transportation Research Record, 2252, 49-56, http://trb.metapress.com/content/d5653r026825x6j3/, accessed Sept. 21, 2015. Lin, Z., 2015, MA3T—Modeling Vehicle Market Dynamics with Consumer Segmentation, presented at U.S. Department of Energy Vehicle Technologies Office Annual Merit Review and Peer Evaluation, Washington, D.C., June 11, 2015, http://energy.gov/sites/prod/files/2015/07/ f24/van005_lin_2015_o.pdf, accessed Sept. 21, 2015. Liu, C., 2015, Transportation Energy Transition Modeling and Analysis: The LAVE-Trans Model, presented at U.S. Department of Energy Vehicle Technologies Office Annual Merit Review and Peer Evaluation, Washington, D.C., June 11, 2015, http://energy.gov/eere/vehicles/ downloads/vehicle-technologies-office-merit-review-2015-transportation-energy, accessed Dec. 3, 2015. Manley, D., R. Levinson, G. Barter, and T. West, 2015, ParaChoice: Parametric Vehicle Choice Modeling, presented at U.S. Department of Energy Vehicle Technologies Office Annual Merit Review and Peer Evaluation, Washington, D.C., June 11, 2015, http://energy.gov/eere/vehicles/ downloads/vehicle-technologies-office-merit-review-2015-parachoice-parametric-vehicle, accessed Dec. 3, 2015. Moawad, A., and A. Rousseau, 2012, Impact of Electric Drive Vehicle Technologies on Fuel Efficiency – Final Report, DOT HS 811 668, National Highway Traffic Safety Administration, Washington, D.C., http://www.nhtsa.gov/staticfiles/rulemaking/pdf/cafe/Effect_of_Electric_ Drive_Vehicle_Technologies-811668.pdf, accessed Dec. 3, 2015. Moawad, A., N. Kim, N. Shidore, and A. Rousseau, 2016, Assessment of Vehicle Sizing, Energy Consumption and Cost Through Large Scale Simulation of Advanced Vehicle Technologies, ANL/ESD-15/28, Argonne National Laboratory, Argonne, Ill.

59
NRC (National Research Council), 2010, Technologies and Approaches to Reducing the Fuel Consumption of Medium- and Heavy-Duty Vehicles, National Academies Press, Washington, D.C., www.nap.edu/catalog/12845/technologies-and-approaches-to-reducing-the-fuel-consumption-of-medium-and-heavy-duty-vehicles, accessed Dec. 2, 2015. NRC (National Research Council), 2013a, Review of the Research Program of the U.S. DRIVE Partnership: Fourth Report, National Academies Press, Washington, D.C. NRC (National Research Council), 2013b, Transitions to Alternative Vehicles and Fuels, National Academies Press, Washington, D.C., www.nap.edu/catalog/18264/transitions-to-alternative-vehicles-and-fuels, accessed Dec. 10, 2015. OMB (Office of Management and Budget), 1992, Guidelines and Discount Rates for Benefit-Cost Analysis of Federal Programs, Circular A-94 Revised, Office of Management and Budget, Washington, D.C., www.whitehouse.gov/omb/circulars_a094/, accessed Dec. 10, 2013. Pagerit, S., P. Sharer, and A. Rousseau, 2006, Fuel Economy Sensitivity to Vehicle Mass for Advanced Vehicle Powertrains, Paper 2006-01-0665, Society of Automotive Engineers, Washington, D.C., http://papers.sae.org/2006-01-0665/. Ramsden, T., 2015, Pathway Analysis: Projected Cost, Lifecycle Energy Use and Emissions of Emerging Hydrogen Technologies, presented at U.S. Department of Energy Hydrogen and Fuel Cells Program Annual Merit Review and Peer Evaluation, Washington, D.C., www.hydrogen.energy.gov/pdfs/review15/sa036_ramsden_2015_o.pdf, accessed Dec. 10, 2015. Stephens T., A.K. Birky, and J. Ward, 2014, Vehicle Technologies Program Government Performance and Results Act (GPRA) Report for Fiscal Year 2015, ANL/ESD-14/3, Argonne National Laboratory, Argonne, Ill., www.osti.gov/scitech/biblio/1130740, accessed Dec. 10, 2015. TAE (TA Engineering, Inc.), 2012, DOE SuperTruck Program Benefits Analysis, TA Engineering, Baltimore, Md., Dec. 20. Taylor, C., and J. Moore, 2015, “2016 VTO Baseline and Scenario (BaSce) Analysis Methodology and Summary Results,” memorandum from Taylor and Moore/TA Engineering to Tom Stephens/ANL and Jacob Ward/DOE, June 4 (revised Sept. 10). TIAX, 2009, Assessment of Fuel Economy Technologies for Medium- and Heavy-Duty Vehicles, Final Report, prepared by TIAX, Lexington, Mass., for the National Academy of Sciences, November 19. Winebrake, J. J., E.H. Green, B. Comer, C. Li, S. Froman, and M. Shelby, 2015a, “Fuel price elasticities in the U.S. combination trucking sector,” Transportation Research Part D 38, 166-177.

60
Winebrake, J. J., E.H. Green, B. Comer, C. Li, S. Froman, and M. Shelby, 2015b, “Fuel Price Elasticities for Single-Unit Truck Operations in the United States,” Transportation Research Part D 38, 178-187. Zhou, Y., and A. Vyas, 2014, VISION Model Description and User's Guide: Model Used to Estimate the Impacts of Highway Vehicle Technologies and Fuels on Energy Use and Carbon Emissions to 2100, ANL/ESD-14/1, Argonne National Laboratory, Argonne, Ill., Jan., http://www.osti.gov/scitech/biblio/1130301-vision-model-description-user-guide-model-used-estimate-impacts-highway-vehicle-technologies-fuels-energy-use-carbon-emissions, accessed Mar. 28, 2016.


Argonne National Laboratory is a U.S. Department of Energy laboratory managed by UChicago Argonne, LLC
ENERGYU.S. DEPARTMENT OF
Energy Systems Division9700 South Cass Avenue, Bldg. 362Argonne, IL 60439-4854
www.anl.gov