vehicular lithium-ion battery based on particle swarm
TRANSCRIPT

energies
Article
Parameter Identification of Electrochemical Model forVehicular Lithium-Ion Battery Based on ParticleSwarm Optimization
Xiao Yang 1, Long Chen 1,2, Xing Xu 1,2,*, Wei Wang 1, Qiling Xu 1, Yuzhen Lin 1 andZhiguang Zhou 3
1 School of Automotive and Traffic Engineering, Jiangsu University, Zhenjiang 212013, Jiangsu, China;[email protected] (X.Y.); [email protected] (L.C.); [email protected] (W.W.);[email protected] (Q.X.); [email protected] (Y.L.)
2 Automotive Engineering Research Institute, Jiangsu University, Zhenjiang 212013, Jiangsu, China3 New Energy Development Department Powertrain Technology Center, Chery Automobile Co., Ltd.,
Wuhu 241009, Anhui, China; [email protected]* Correspondence: [email protected]
Received: 23 October 2017; Accepted: 7 November 2017; Published: 9 November 2017
Abstract: The dynamic characteristics of power batteries directly affect the performance of electricvehicles, and the mathematical model is the basis for the design of a battery management system(BMS).Based on the electrode-averaged model of a lithium-ion battery, in view of the solid phaselithium-ion diffusion equation, the electrochemical model is simplified through the finite differencemethod. By analyzing the characteristics of the model and the type of parameters, the solid statediffusion kinetics are separated, and then the cascade parameter identifications are implementedwith Particle Swarm Optimization. Eventually, the validity of the electrochemical model and theaccuracy of model parameters are verified through 0.2–2 C multi-rates battery discharge tests of celland road simulation tests of a micro pure electric vehicle under New European Driving Cycle (NEDC)conditions. The results show that the estimated parameters can guarantee the output accuracy. Inthe test of cell, the voltage deviation of discharge is generally less than 0.1 V except the end; in roadsimulation test, the output is close to the actual value at low speed with the error around ±0.03 V,and at high speed around ±0.08 V.
Keywords: lithium-ion battery; electrochemical model; particle swarm optimization;parameter identification
1. Introduction
Recently, due to advantages of high energy density, high output power, long life, zero pollution,and wide operating temperature range, lithium-ion batteries have been attached great importance tonew energy automotive industry with being the preferred choice. However, the battery applied toautomobile is required not only can provide large energy and power, but also ensure its safety andreliable operation, and the performance will change with time, explosion may even occur in overchargeor harsh conditions. So, real-time monitoring system of on-board power battery is essential.
In management of vehicle power batteries, an exact battery model is usually required to estimatethe state accurately. At present, simple equivalent circuit model (ECM) is widely used because ofits simple structure, rapid calculation, and relatively good battery state of charge (SOC) predictioncapability [1], including classic Rint [1], Resistance-Capacitance Circuits (RC) [1], Thevenin [2], and thePartnership for a New Generation of Vehicles (PNGV) [3] models. A lot of follow-up research has beencarried out on the equivalent circuit model. Z Gao, et al. designed and implemented a smart lithium-ion
Energies 2017, 10, 1811; doi:10.3390/en10111811 www.mdpi.com/journal/energies
Energies 2017, 10, 1811 2 of 16
battery system with real-time fault diagnosis capability for electric vehicles to ensure battery safetyand performance [4]. They also put forward an integrated equivalent circuit and thermal model ofa temperature-dependent LiFePO4 battery in an actual embedded application, which applied a cellbalancing strategy to balance the SOC of each cell to increase the lifespan of the battery [5]. However,the parameters of model cannot correspond to actual physical quantities, and the prediction accuracyof battery state depends largely on the previous experimental data. Unlike ECM, an electrochemicalmodel is established using the physical chemistry and electrochemistry theory, which can reflectthe internal reaction mechanism to make an accurate prediction of internal basic state, such as theconcentration of lithium ion, the potential in electrolyte and solid electrode materials. But owingcomplex structure, numerous parameters, and highly nonlinear, it is hard to meet the operationalspeed of real-time control system. Therefore, model simplification must be carried out first.
So far, literatures on electrochemical model of battery are quite extensive. Newman andTiedemann presented the first electrochemical approach to porous electrodes modeling for batteryapplications [6]. Then, Doyle et al. proposed lithium anode/solid polymer separator/insertioncathode cell model, a full-order model, based on concentrated solution theory [7]. This model waslater widely cited, and many electrochemical models were simplified on the basis of it. Such as themicro-macroscopic coupled model, which introduced by Wang et al. in 1998 [8] with a great dealof research on battery state estimation and energy management [9,10]. In fact, it was presented forNi-MH batteries at the beginning [11]. Then, it was expanded to lithium-ion batteries [12], where thethermal behavior was also described. In addition, Chaturvedi and Klein [13] established a simplersingle particle model (SPM) by assuming the solid diffusion of electrode to be the diffusion within asingle spherical particle. Similarly, the average-electrode model, studied by Di Domenico et al. [14,15],replaces the specific distribution of Li-ion concentration in electrode with the average concentration,greatly pushing the complexity into smaller. Both of them have high accuracy at low to moderateoperating rate, but the latter has higher order with the important diffusion kinetic characteristicsin the solid particles retained. However, these models still have higher complexity than the circuitmodel, which limits their application in the control system. Therefore, the further reduction is alsothe focus. Smith and Wang reduced the diffusion dynamics by using the residue grouping [16].Lee and Filipi obtained the ideal non-uniform discrete mode by Sequential Quadratic Programming(SQP), and reduced the order of the state space model while guaranteeing the accuracy [17]. In recentyears, Zou, Manzie, and Nesic are committed to the simplification techniques for Partial DifferentialEquation (PDE)-based Li-ion battery models [18], and have developed a framework for battery modelsimplification starting from an initial high-order physics-based model [19].
From the introduction above, the research of the equivalent circuit model has been basicallyperfected, and the corresponding battery management technology is generally based on the circuitmodel. But the study of electrochemical models is still in its infancy, and rising stage. Therefore,the research on the electrochemical model of lithium ion and its model reduction method canalso help to promote the application of electrochemical theory in the development of batterymanagement technology.
In addition, the parameters of the model need to be identified after the model is built. For theequivalent circuit model, pulse charging and discharging experiment can be used to perform offlineparameter identification [20]. Many scholars adopt the pulse test at different temperature, current rates,and SOC to improve the accuracy [21,22]. But in practice, the parameters are constantly changing,so the most accurate battery model can only be obtained by real-time online identification. Currently,improved least squares method or extended Kalman filter algorithm are the most widely used. As forthe electrochemical model, offline identification combined with some intelligent algorithms is adoptedmore as a result of numerous electrochemical and complex identification methods.
In this paper, the average electrode model of lithium-ion battery combined with the uniformlydiscrete finite difference method can firstly reduce the complexity of the electrochemical model.Secondly, the electrochemical model characteristics and parameter types of Li-ion batteries are analyzed.

Energies 2017, 10, 1811 3 of 16
The solid phase lithium-ion diffusion kinetics are separated, and the parameters are identified by PSO.Finally, the accuracy of the parameters was verified by the multi-rate discharge test of single cells andthe NEDC cycle experiment of vehicle.
2. Electrochemical Model of Lithium Ion Battery
2.1. Average Electrode Model
Di Domenico et al. proposed the average electrode model of the battery in References [14,15],which was simplified on the basis of the micro-macroscopic coupled battery model advanced in theliterature [8]. In order to reduce the complexity of the model, the electrolyte concentration in theaverage electrode model is considered as a constant value, and the electrode dynamics characteristic ofthe X axis in the cross section is considered only. This approximation (depicted in Figure 1) consists ofthree domains—the positive composite electrode (consist of LiyMn2O4, LiyCoO2, LiyNiO2, or somecombination of metal oxides), separator, and negative composite electrode (with LixC6 active material).During the charging and discharging, the lithium ion is embedded and removed between the positiveand negative electrodes.
Energies 2017, 10, 1811 3 of 16
analyzed. The solid phase lithium-ion diffusion kinetics are separated, and the parameters are identified by PSO. Finally, the accuracy of the parameters was verified by the multi-rate discharge test of single cells and the NEDC cycle experiment of vehicle.
2. Electrochemical Model of Lithium Ion Battery
2.1. Average Electrode Model
Di Domenico et al. proposed the average electrode model of the battery in References [14,15], which was simplified on the basis of the micro-macroscopic coupled battery model advanced in the literature [8]. In order to reduce the complexity of the model, the electrolyte concentration in the average electrode model is considered as a constant value, and the electrode dynamics characteristic of the X axis in the cross section is considered only. This approximation (depicted in Figure 1) consists of three domains—the positive composite electrode (consist of LiyMn2O4, LiyCoO2, LiyNiO2, or some combination of metal oxides), separator, and negative composite electrode (with LixC6 active material). During the charging and discharging, the lithium ion is embedded and removed between the positive and negative electrodes.
Figure 1. Schematic macroscopic (x-direction) cell model with coupled microscopic (r-direction) solid diffusion model.
The electrochemical model is actually based on a series of differential algebraic equations describing the internal potential and ion diffusion. The specific equations and boundary conditions are shown in Table 1 [23], which an ideal model can be constructed from, and the detailed derivation process can be referenced to [14].
Figure 1. Schematic macroscopic (x-direction) cell model with coupled microscopic (r-direction) soliddiffusion model.
The electrochemical model is actually based on a series of differential algebraic equationsdescribing the internal potential and ion diffusion. The specific equations and boundary conditionsare shown in Table 1 [23], which an ideal model can be constructed from, and the detailed derivationprocess can be referenced to [14].

Energies 2017, 10, 1811 4 of 16
Table 1. Equations of electrochemical model for Li-ion batteries.
Kinetic Equations Boundary Condition
Liquid potential
∂φe(x, t)∂x
= − ie(x, t)κe f f
∂ie(x, t)∂x
= jLi
∂φe
∂x
∣∣∣∣x=0, x=L
= 0
∂φe
∂x
∣∣∣∣x=δn , x=δsp
= − IAκe f f
Solid potential
∂φs(x, t)∂x
= − is(x, t)σe f f
∂is(x, t)∂x
= −jLi
∂φs
∂x
∣∣∣∣x=δn , x=δsp
= 0
∂φs
∂x
∣∣∣∣x=0, x=L
= − IAσe f f
Lithium-ion concentrationin Solid phase
∂cs(x, r, t)∂t
=1r2
∂
∂r
(Dsr2 ∂cs(x, r, t)
∂r
)∂cs
∂r
∣∣∣∣r=Rs
= − jLi
asFDs,
∂cs
∂r
∣∣∣∣r=0
= 0
Butler Volmer
jn(x, t) =i0(x, t)
F
[exp
(αaFRT
ηs(x, t))− exp
(−αcF
RTηs(x, t)
)]where:
ηs(x, t) = Φs(x, t)−Φe(x, t)− µ(css(x, t))− FR f jn(x, t)i0(x, t) = re f f ce(x, t)αa ∗ (cs,max − css(x, t))αa css(x, t)αc
css(x, t) ≡ cs(x, Rs, t)
Battery terminal voltage V(t) = η(L, t)− η(0, t) + (φe(L, t)− φe(0, t)) +(Up(cse(L, t))−Un(cse(0, t))
)− R f I
First of all, according to the idea of average electrode, the negative current density jLi of ButlerVolmer is integrated in the direction of X, and combined with the liquid phase current density at the
boundary, and the average value jLin can be deduced.
jLi(t)δ =
∫ δ
0jLi(x′, t
)dx′ = ie(δn, t)− ie(0, t) =
IA− 0 (1)
In formula: δn is negative electrode thickness.Then, the terminal voltage can be simplified as a polynomial expressed by the average values
at the positive and negative electrodes in accordance with the boundary conditions in the table.The specific derivation process can be referred to [14], and the voltage output Equation is:
V(t) = ηp(t)− ηn(t) +(
ϕe,p(t)− ϕe,n(t))
+(Up(cse,p(t)
)−Un(cse,n(t))
)− R f I
(2)
Finally, according to the boundary conditions, the solid-liquid phase potential, the ButlerVolmer kinetic equation, and continuity of physical quantities at the model boundary in Table 1.The terminal voltage of battery can be further written as a function of load current and the averagesolid concentration lithium.
V(t) =RTαaF
lnξn +
√ξ2
n + 1
ξp +√
ξ2p + 1
− I2A
(δn
ke f f + 2δsep
ke f f +δp
ke f f
)+(Up(cse,p(t)
)−Un(cse,n(t))
)− R f I
(3)
In formula: ξn =jLin (t)2aj0
, ξp =jLip (t)
2aj0.
The lithium battery system is a strongly nonlinear distributed dynamical system with strongcoupling. After the simplification above, the model can be represented by lithium-ion concentrationin solid phase in the Table 1 and (3). But it is difficult to solve directly for the partial differentialequation, and further simplification is necessary. In addition, it can be seen from the Formula (3)that in order to obtain the battery terminal voltage, it is also essential to figure out the distribution ofsolid-phase concentration.
Energies 2017, 10, 1811 5 of 16
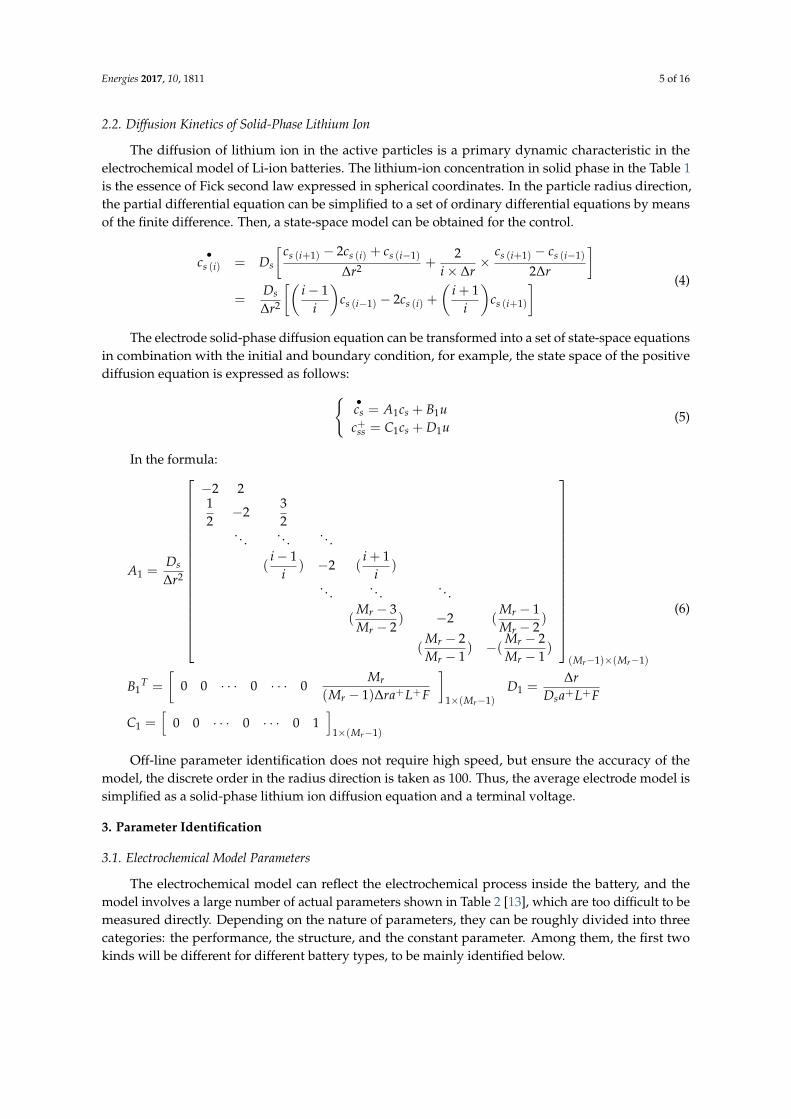
2.2. Diffusion Kinetics of Solid-Phase Lithium Ion
The diffusion of lithium ion in the active particles is a primary dynamic characteristic in theelectrochemical model of Li-ion batteries. The lithium-ion concentration in solid phase in the Table 1is the essence of Fick second law expressed in spherical coordinates. In the particle radius direction,the partial differential equation can be simplified to a set of ordinary differential equations by meansof the finite difference. Then, a state-space model can be obtained for the control.
•cs (i) = Ds
[ cs (i+1) − 2cs (i) + cs (i−1)
∆r2 +2
i× ∆r×
cs (i+1) − cs (i−1)
2∆r
]=
Ds
∆r2
[(i− 1
i
)cs (i−1) − 2cs (i) +
(i + 1
i
)cs (i+1)
] (4)
The electrode solid-phase diffusion equation can be transformed into a set of state-space equationsin combination with the initial and boundary condition, for example, the state space of the positivediffusion equation is expressed as follows:{ •
cs = A1cs + B1uc+ss = C1cs + D1u
(5)
In the formula:
A1 =Ds
∆r2
−2 212−2
32
. . . . . . . . .
(i− 1
i) −2 (
i + 1i
)
. . . . . . . . .
(Mr − 3Mr − 2
) −2 (Mr − 1Mr − 2
)
(Mr − 2Mr − 1
) −(Mr − 2Mr − 1
)
(Mr−1)×(Mr−1)
B1T =
[0 0 · · · 0 · · · 0
Mr
(Mr − 1)∆ra+L+F
]1×(Mr−1)
D1 =∆r
Dsa+L+F
C1 =[
0 0 · · · 0 · · · 0 1]
1×(Mr−1)
(6)
Off-line parameter identification does not require high speed, but ensure the accuracy of themodel, the discrete order in the radius direction is taken as 100. Thus, the average electrode model issimplified as a solid-phase lithium ion diffusion equation and a terminal voltage.
3. Parameter Identification
3.1. Electrochemical Model Parameters
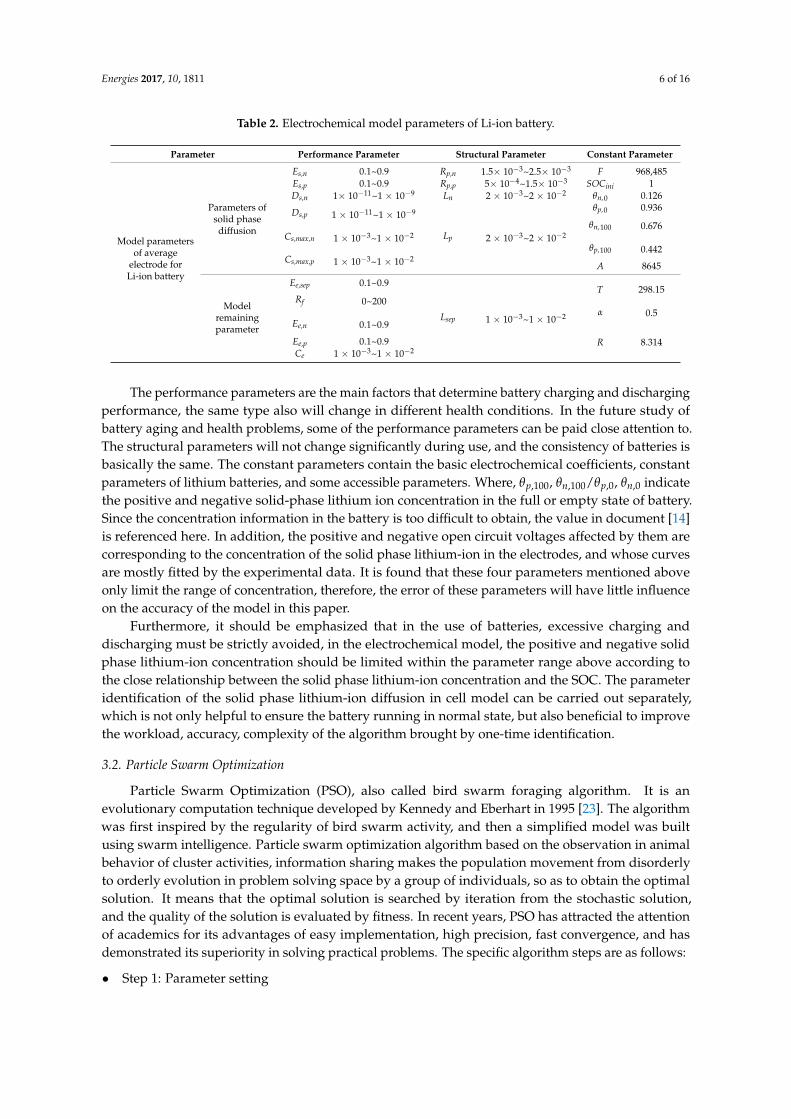
The electrochemical model can reflect the electrochemical process inside the battery, and themodel involves a large number of actual parameters shown in Table 2 [13], which are too difficult to bemeasured directly. Depending on the nature of parameters, they can be roughly divided into threecategories: the performance, the structure, and the constant parameter. Among them, the first twokinds will be different for different battery types, to be mainly identified below.
Energies 2017, 10, 1811 6 of 16
Table 2. Electrochemical model parameters of Li-ion battery.
Parameter Performance Parameter Structural Parameter Constant Parameter
Model parametersof average
electrode forLi-ion battery
Parameters ofsolid phase
diffusion
Es,n 0.1~0.9 Rp,n 1.5× 10⁻³~2.5× 10⁻³ F 968,485Es,p 0.1~0.9 Rp,p 5× 10⁻⁴~1.5× 10⁻³ SOCini 1Ds,n 1× 10⁻¹¹~1 × 10⁻⁹ Ln 2 × 10⁻³~2 × 10⁻² θn,0 0.126
Ds,p 1 × 10⁻¹¹~1 × 10⁻⁹
Lp 2 × 10⁻³~2 × 10⁻²
θp,0 0.936
θn,100 0.676Cs,max,n 1 × 10⁻³~1 × 10⁻²
θp,100 0.442Cs,max,p 1 × 10⁻³~1 × 10⁻²
A 8645
Modelremainingparameter
Ee,sep 0.1~0.9
Lsep 1 × 10⁻³~1 × 10⁻²
T 298.15Rf 0~200
α 0.5Ee,n 0.1~0.9
R 8.314Ee,p 0.1~0.9Ce 1 × 10⁻³~1 × 10⁻²
The performance parameters are the main factors that determine battery charging and dischargingperformance, the same type also will change in different health conditions. In the future study ofbattery aging and health problems, some of the performance parameters can be paid close attention to.The structural parameters will not change significantly during use, and the consistency of batteries isbasically the same. The constant parameters contain the basic electrochemical coefficients, constantparameters of lithium batteries, and some accessible parameters. Where, θp,100, θn,100/θp,0, θn,0 indicatethe positive and negative solid-phase lithium ion concentration in the full or empty state of battery.Since the concentration information in the battery is too difficult to obtain, the value in document [14]is referenced here. In addition, the positive and negative open circuit voltages affected by them arecorresponding to the concentration of the solid phase lithium-ion in the electrodes, and whose curvesare mostly fitted by the experimental data. It is found that these four parameters mentioned aboveonly limit the range of concentration, therefore, the error of these parameters will have little influenceon the accuracy of the model in this paper.
Furthermore, it should be emphasized that in the use of batteries, excessive charging anddischarging must be strictly avoided, in the electrochemical model, the positive and negative solidphase lithium-ion concentration should be limited within the parameter range above according tothe close relationship between the solid phase lithium-ion concentration and the SOC. The parameteridentification of the solid phase lithium-ion diffusion in cell model can be carried out separately,which is not only helpful to ensure the battery running in normal state, but also beneficial to improvethe workload, accuracy, complexity of the algorithm brought by one-time identification.
3.2. Particle Swarm Optimization
Particle Swarm Optimization (PSO), also called bird swarm foraging algorithm. It is anevolutionary computation technique developed by Kennedy and Eberhart in 1995 [23]. The algorithmwas first inspired by the regularity of bird swarm activity, and then a simplified model was builtusing swarm intelligence. Particle swarm optimization algorithm based on the observation in animalbehavior of cluster activities, information sharing makes the population movement from disorderlyto orderly evolution in problem solving space by a group of individuals, so as to obtain the optimalsolution. It means that the optimal solution is searched by iteration from the stochastic solution,and the quality of the solution is evaluated by fitness. In recent years, PSO has attracted the attentionof academics for its advantages of easy implementation, high precision, fast convergence, and hasdemonstrated its superiority in solving practical problems. The specific algorithm steps are as follows:
• Step 1: Parameter setting
Energies 2017, 10, 1811 7 of 16
Determine some basic parameters based on the battery model, including the number of populationsizes, the dimensions of a single particle, and the range of dimensions in operation, which can bedefined according to the range of the cell parameters given in Table 2.
• Step 2: Initializing the particle swarm
Initialize Particle Swarm (population size is n), including random locations and velocities. All setas [0–1] random numbers.
• Step 3: Calculate the fitness of each particle
In the algorithm, each dimension of a single particle represents a complete set of model parameters,and then n particles make up a population. The objective function is set to calculate the correspondingerrors of each set of parameters with the fitness obtained accordingly.
• Step 4: Finding the individual optimum position (pbest)
For each particle, the current adaptation is compared with the adaptive value corresponding toits individual historical best position (pbest). Then, the pbest will be updated with the current positionif the current adaptation value is better.
• Step 5: Finding the global optimum position (gbest)
Similarly, compare the current fitness with the adaptation of the global optimum position (gbest),and update the gbest with the current particle location if the current adaptation value is better.
• Step 6: Update the velocity and position of each particles
Update the velocity and position of the dimension d of the particle i according toFormulas (7) and (8):
vkid = wvk−1
id + c1r1
(pbestid − xk−1
id
)+ c2r2
(pbestd − xk−1
id
)(7)
xkid = xk−1
id + vk−1id (8)
where vkid is the d dimensional component of the velocity vector of particle i in the k iteration and xk
id isthe position vector; c1, c2 is the acceleration constant, adjusting learning maximum step size; r1 and r2
are two random functions, in the range [0, 1] to increase search randomness; w is the inertia weight,a nonnegative number, which regulates the search range of solution space.
• Step 7: Loop iteration to algorithm terminates
Repeat the 3 to 6 steps above until the maximum iteration or the increment of the optimum fitnessis less than a given threshold. The algorithm stops.
Because the electrochemical model studied in this paper is relatively complex, involvingmany parameters, particle swarm optimization (PSO) is exactly suitable for solving such problems.And according to the model structure and parameter division above, we can divide all the parametersinto two parts and identify them in turn.
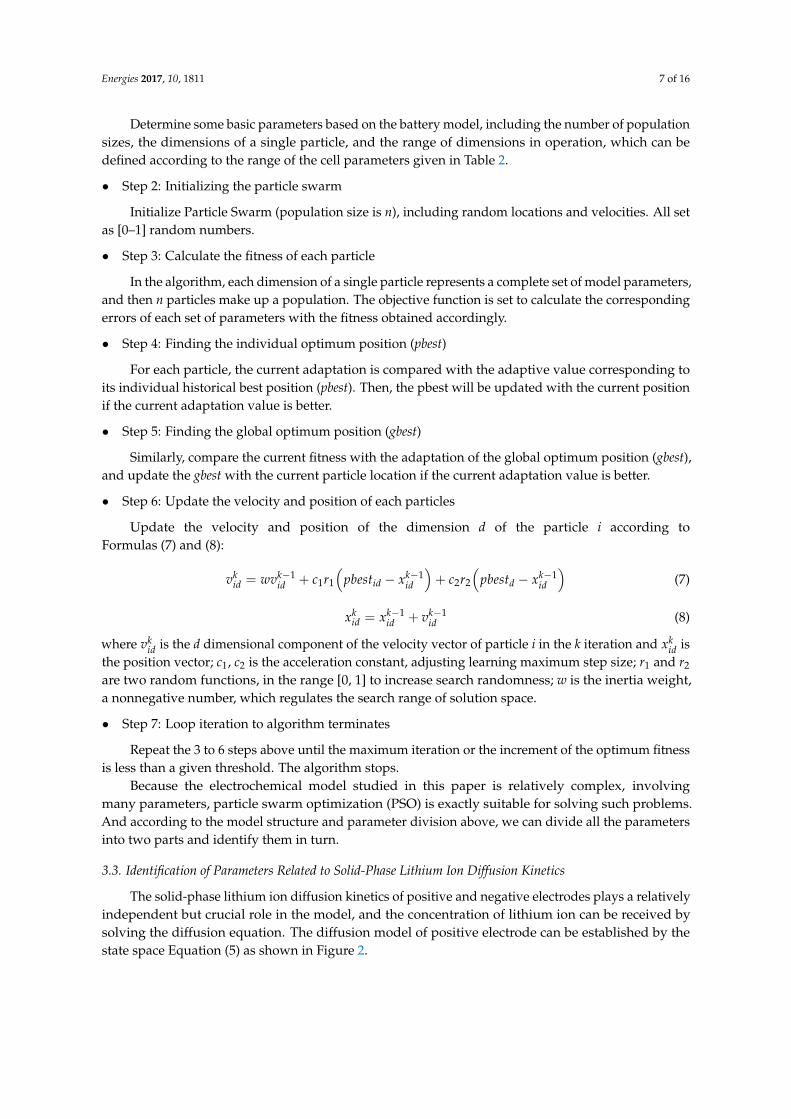
3.3. Identification of Parameters Related to Solid-Phase Lithium Ion Diffusion Kinetics
The solid-phase lithium ion diffusion kinetics of positive and negative electrodes plays a relativelyindependent but crucial role in the model, and the concentration of lithium ion can be received bysolving the diffusion equation. The diffusion model of positive electrode can be established by thestate space Equation (5) as shown in Figure 2.

Energies 2017, 10, 1811 8 of 16
Energies 2017, 10, 1811 8 of 16
Because the electrochemical model studied in this paper is relatively complex, involving many parameters, particle swarm optimization (PSO) is exactly suitable for solving such problems. And according to the model structure and parameter division above, we can divide all the parameters into two parts and identify them in turn.
3.3. Identification of Parameters Related to Solid-Phase Lithium Ion Diffusion Kinetics
The solid-phase lithium ion diffusion kinetics of positive and negative electrodes plays a relatively independent but crucial role in the model, and the concentration of lithium ion can be received by solving the diffusion equation. The diffusion model of positive electrode can be established by the state space Equation (5) as shown in Figure 2.
Figure 2. Solid phase lithium-ion diffusion kinetic model.
Write the parameter identification code based on the algorithm steps described above, the number of population size SwarmSize = 30, the dimension of a particle ParticleSize = 10, the inertia weight w = 0.7, acceleration constant c1 = c2 = 2 and restriction factor a = 0.792. Perform 50 iterations.
In the algorithm, the individual evaluation index is the error function of the positive and negative solid-phase lithium ion concentration at the end of the discharge:
)_()_()( 0,0, pn pabsnabsierror θθθθ −+−= (9)
where, p_θ and n_θ respectively indicates the concentration of solid-phase lithium ion at the end of discharge. On the one hand, the objective function can be used as a calculation index of individual fitness. On the other hand, it can avoid the dangerous state of excessive discharge in simulation.
The algorithm runs as shown in Figure 3. The error decreases gradually with the iterations. The error of the 50th generation is acceptable of 0.0034, and the final identification of parameters is shown in Table 3.
0 10 20 30 40 50
0.0
0.1
0.2
0.3
0.4
0.5
0.6
Err
or
Iterations
0 2 4 6 8 100 2 4 6 8 100 2 4 6 8 10
Figure 3. Optimal solution and performance tracking after 50 iterations.
Table 3. Identification results of kinetic parameters of solid-phase lithium ion diffusion.
Figure 2. Solid phase lithium-ion diffusion kinetic model.
Write the parameter identification code based on the algorithm steps described above, the numberof population size SwarmSize = 30, the dimension of a particle ParticleSize = 10, the inertia weightw = 0.7, acceleration constant c1 = c2 = 2 and restriction factor a = 0.792. Perform 50 iterations.
In the algorithm, the individual evaluation index is the error function of the positive and negativesolid-phase lithium ion concentration at the end of the discharge:
error(i) = abs(θ_n− θn,0) + abs(θ_p− θp,0) (9)
where,θ_p and θ_n respectively indicates the concentration of solid-phase lithium ion at the end ofdischarge. On the one hand, the objective function can be used as a calculation index of individualfitness. On the other hand, it can avoid the dangerous state of excessive discharge in simulation.
The algorithm runs as shown in Figure 3. The error decreases gradually with the iterations.The error of the 50th generation is acceptable of 0.0034, and the final identification of parameters isshown in Table 3.
Energies 2017, 10, 1811 8 of 16
Because the electrochemical model studied in this paper is relatively complex, involving many parameters, particle swarm optimization (PSO) is exactly suitable for solving such problems. And according to the model structure and parameter division above, we can divide all the parameters into two parts and identify them in turn.
3.3. Identification of Parameters Related to Solid-Phase Lithium Ion Diffusion Kinetics
The solid-phase lithium ion diffusion kinetics of positive and negative electrodes plays a relatively independent but crucial role in the model, and the concentration of lithium ion can be received by solving the diffusion equation. The diffusion model of positive electrode can be established by the state space Equation (5) as shown in Figure 2.
Figure 2. Solid phase lithium-ion diffusion kinetic model.
Write the parameter identification code based on the algorithm steps described above, the number of population size SwarmSize = 30, the dimension of a particle ParticleSize = 10, the inertia weight w = 0.7, acceleration constant c1 = c2 = 2 and restriction factor a = 0.792. Perform 50 iterations.
In the algorithm, the individual evaluation index is the error function of the positive and negative solid-phase lithium ion concentration at the end of the discharge:
)_()_()( 0,0, pn pabsnabsierror θθθθ −+−= (9)
where, p_θ and n_θ respectively indicates the concentration of solid-phase lithium ion at the end of discharge. On the one hand, the objective function can be used as a calculation index of individual fitness. On the other hand, it can avoid the dangerous state of excessive discharge in simulation.
The algorithm runs as shown in Figure 3. The error decreases gradually with the iterations. The error of the 50th generation is acceptable of 0.0034, and the final identification of parameters is shown in Table 3.
0 10 20 30 40 50
0.0
0.1
0.2
0.3
0.4
0.5
0.6
Err
or
Iterations
0 2 4 6 8 100 2 4 6 8 100 2 4 6 8 10
Figure 3. Optimal solution and performance tracking after 50 iterations.
Table 3. Identification results of kinetic parameters of solid-phase lithium ion diffusion.
Figure 3. Optimal solution and performance tracking after 50 iterations.
Table 3. Identification results of kinetic parameters of solid-phase lithium ion diffusion.
Parameter Value Parameter Value
Es_n 0.4638 Es_p 0.5186L_n 0.0097 L_p 0.0119
Ds_n 7.1908 × 10⁻¹⁰ Ds_p 1.7080 × 10⁻¹⁰
Rp_n 0.0018 Rp_p 5.8806 × 10⁻⁴
Csmax_n 0.0091 Csmax_p 0.0075

Energies 2017, 10, 1811 9 of 16
3.4. Voltage Curve Fitting of Positive and Negative Electrodes
The battery terminal voltage is divided into four parts in the average electrode model, they areover potential, electrolyte-phase potential, electrode open circuit potential, and potential caused byinternal resistance. The third part in Formula (2) is the battery positive and negative electrode opencircuit potential, usually expressed as a function of the electrode solid-phase lithium ion concentration,which can be obtained by fitting experimental data. But the open circuit potentials will not the samewith different materials, the battery studied in this paper will be just chosen a ternary battery withthe negative electrode material being LixC6, the cathode material being Li(NiCoMn)O2. At present,there is little difference between the anode materials, but cathode materials have many kinds withdifferent corresponding potential curves. Thus, the negative open circuit potential expression of thispaper will refer to the polynomial in the literature [10], the positive expression can be got by fittingexperimental data. The specific formula is as follows. The relation curve between the potential and theconcentration is shown in Figures 4 and 5.
U−(θn) = 0.7222 + 0.1387× θn + 0.029× θn0.5 − 0.0172/θn
+0.0019× θn−1.5 + 0.2808× exp(0.9− 15 ∗ θn)
−0.7984× exp(0.4465× θn − 0.4108)
(10)
U+(θp) = −3336608× θp10 + 2224336× θp
9 − 66321816× θp8
+116462170× θp7 − 133373853× θp
6 + 104078116× θp5
−56042493× θp4 + 20560010× θp
3 − 4917875× θp2
+692535× θp − 43591.6828
(11)
Energies 2017, 10, 1811 9 of 16
Parameter Value Parameter ValueEs_n 0.4638 Es_p 0.5186 L_n 0.0097 L_p 0.0119
Ds_n 7.1908 × 10⁻¹⁰ Ds_p 1.7080 × 10⁻¹⁰ Rp_n 0.0018 Rp_p 5.8806 × 10⁻⁴
Csmax_n 0.0091 Csmax_p 0.0075
3.4. Voltage Curve Fitting of Positive and Negative Electrodes
The battery terminal voltage is divided into four parts in the average electrode model, they are over potential, electrolyte-phase potential, electrode open circuit potential, and potential caused by internal resistance. The third part in Formula (2) is the battery positive and negative electrode open circuit potential, usually expressed as a function of the electrode solid-phase lithium ion concentration, which can be obtained by fitting experimental data. But the open circuit potentials will not the same with different materials, the battery studied in this paper will be just chosen a ternary battery with the negative electrode material being LixC6, the cathode material being Li(NiCoMn)O2. At present, there is little difference between the anode materials, but cathode materials have many kinds with different corresponding potential curves. Thus, the negative open circuit potential expression of this paper will refer to the polynomial in the literature [10], the positive expression can be got by fitting experimental data. The specific formula is as follows. The relation curve between the potential and the concentration is shown in Figures 4 and 5.
0.5
1.5
( ) 0.7222 0.1387 0.029 0.0172 /
0.0019 0.2808 exp(0.9 15* )
0.7984 exp(0.4465 0.4108)
n n n n
n n
n
U θ θ θ θθ θ
θ
−
−
= + × + × −
+ × + × −− × × −
(10)
10 9 8
7 6 5
4 3 2
( ) 3336608 2224336 66321816
116462170 133373853 104078116
56042493 20560010 4917875
692535 43591.6828
p p p p
p p p
p p p
p
U θ θ θ θ
θ θ θ
θ θ θθ
+ = − × + × − ×
+ × − × + ×
− × + × − ×
+ × −
(11)
0.1 0.2 0.3 0.4 0.5 0.6 0.7
0.09
0.12
0.15
0.18
0.21
0.24 Negtive open circuit potential
U-[V
]
Solid lithium concentration Figure 4. Negative open circuit potential. Figure 4. Negative open circuit potential.

Energies 2017, 10, 1811 10 of 16
Energies 2017, 10, 1811 10 of 16
0.4 0.5 0.6 0.7 0.8 0.9
2.5
3.0
3.5
4.0
4.5
Positive open circuit potential
U+[V
]
Solid lithium concentration Figure 5. Positive open circuit potential.
3.5. Model Remaining Parameter Identification
The remaining parameters of the model can also be identified by particle swarm optimization. On the basis of the relevant parameters of the identified solid-phase diffusion kinetics, a complete battery average electrode model is established by Equations (10) and (12), as shown in Figure 6.
Figure 6. Average electrode model of lithium ion battery. OCP: open circuit potential.
The input of model is load current, and output is battery terminal voltage. According to the experimental data of battery, the identification code is written, and all the parameters can be received ultimately. Set the SwarmSize = 20, the ParticleSize = 6, other parameter settings are consistent with the previous ones to carry out 20 iterations. The individual evaluation index is the mean error function of the battery terminal voltage:
( ) ( _ experiment _simulink)error i avg U U= − (12)
Operation results as shown in Figure 7, the error of the 20th generation is 0.0040. And the identification results of the remaining 6 parameters are shown in Table 4.
Figure 5. Positive open circuit potential.
3.5. Model Remaining Parameter Identification
The remaining parameters of the model can also be identified by particle swarm optimization.On the basis of the relevant parameters of the identified solid-phase diffusion kinetics, a completebattery average electrode model is established by Equations (10) and (12), as shown in Figure 6.
Energies 2017, 10, 1811 10 of 16
0.4 0.5 0.6 0.7 0.8 0.9
2.5
3.0
3.5
4.0
4.5
Positive open circuit potential
U+[V
]
Solid lithium concentration Figure 5. Positive open circuit potential.
3.5. Model Remaining Parameter Identification
The remaining parameters of the model can also be identified by particle swarm optimization. On the basis of the relevant parameters of the identified solid-phase diffusion kinetics, a complete battery average electrode model is established by Equations (10) and (12), as shown in Figure 6.
Figure 6. Average electrode model of lithium ion battery. OCP: open circuit potential.
The input of model is load current, and output is battery terminal voltage. According to the experimental data of battery, the identification code is written, and all the parameters can be received ultimately. Set the SwarmSize = 20, the ParticleSize = 6, other parameter settings are consistent with the previous ones to carry out 20 iterations. The individual evaluation index is the mean error function of the battery terminal voltage:
( ) ( _ experiment _simulink)error i avg U U= − (12)
Operation results as shown in Figure 7, the error of the 20th generation is 0.0040. And the identification results of the remaining 6 parameters are shown in Table 4.
Figure 6. Average electrode model of lithium ion battery. OCP: open circuit potential.
The input of model is load current, and output is battery terminal voltage. According to theexperimental data of battery, the identification code is written, and all the parameters can be receivedultimately. Set the SwarmSize = 20, the ParticleSize = 6, other parameter settings are consistent withthe previous ones to carry out 20 iterations. The individual evaluation index is the mean error functionof the battery terminal voltage:
error(i) = avg(U_experiment−U_simulink) (12)
Operation results as shown in Figure 7, the error of the 20th generation is 0.0040. And theidentification results of the remaining 6 parameters are shown in Table 4.

Energies 2017, 10, 1811 11 of 16Energies 2017, 10, 1811 11 of 16
2 4 6 8 10 12 14 16 18 20
0.005
0.010
0.015
0.020
Err
or
Iterations
0 2 4 6 8 10
Figure 7. Optimal solution and performance tracking after 20 iterations.
Table 4. Identification results of model remaining parameters.
Parameter Value Parameter ValueEe_sep 0.4732 Rf 194.8967 Ee_n 0.6626 Ee_p 0.8812 Ce 0.0019 L_sep 0.0053
At this point, the 16 unknown parameters of the average electrode model are identified by two PSO algorithms with the error all in reasonable limits. The battery test used in parameter identification is 0.5 C discharge to the cut-off voltage 2.7 V under constant temperature and current, then hold 15 min. And in this test, the initial SOC is 100%, the ambient temperature is 25 °C. The voltage curve shown in Figure 8 indicates that the terminal voltage of the model output is basically consistent with the experimental data, which shows that the model parameters identified with PSO can meet the precision.
0 2000 4000 6000 80002.6
2.8
3.0
3.2
3.4
3.6
3.8
4.0
4.2
4.4
7400 7600 7800 8000 8200 8400
2.8
2.9
3.0
3.1
Cel
l vol
tage
[Vol
t]
Time[s]
Simulation value Experimental value
0 2 4 6 8 10
Figure 8. Comparison of experiment and simulation results of 0.5 C discharge.
4. Simulation and Experimental Result
Figure 7. Optimal solution and performance tracking after 20 iterations.
Table 4. Identification results of model remaining parameters.
Parameter Value Parameter Value
Ee_sep 0.4732 Rf 194.8967Ee_n 0.6626 Ee_p 0.8812
Ce 0.0019 L_sep 0.0053
At this point, the 16 unknown parameters of the average electrode model are identified by twoPSO algorithms with the error all in reasonable limits. The battery test used in parameter identificationis 0.5 C discharge to the cut-off voltage 2.7 V under constant temperature and current, then hold 15 min.And in this test, the initial SOC is 100%, the ambient temperature is 25 ◦C. The voltage curve shownin Figure 8 indicates that the terminal voltage of the model output is basically consistent with theexperimental data, which shows that the model parameters identified with PSO can meet the precision.
Energies 2017, 10, 1811 11 of 16
2 4 6 8 10 12 14 16 18 20
0.005
0.010
0.015
0.020
Err
or
Iterations
0 2 4 6 8 10
Figure 7. Optimal solution and performance tracking after 20 iterations.
Table 4. Identification results of model remaining parameters.
Parameter Value Parameter ValueEe_sep 0.4732 Rf 194.8967 Ee_n 0.6626 Ee_p 0.8812 Ce 0.0019 L_sep 0.0053
At this point, the 16 unknown parameters of the average electrode model are identified by two PSO algorithms with the error all in reasonable limits. The battery test used in parameter identification is 0.5 C discharge to the cut-off voltage 2.7 V under constant temperature and current, then hold 15 min. And in this test, the initial SOC is 100%, the ambient temperature is 25 °C. The voltage curve shown in Figure 8 indicates that the terminal voltage of the model output is basically consistent with the experimental data, which shows that the model parameters identified with PSO can meet the precision.
0 2000 4000 6000 80002.6
2.8
3.0
3.2
3.4
3.6
3.8
4.0
4.2
4.4
7400 7600 7800 8000 8200 8400
2.8
2.9
3.0
3.1
Cel
l vol
tage
[Vol
t]
Time[s]
Simulation value Experimental value
0 2 4 6 8 10
Figure 8. Comparison of experiment and simulation results of 0.5 C discharge.
4. Simulation and Experimental Result
Figure 8. Comparison of experiment and simulation results of 0.5 C discharge.
Energies 2017, 10, 1811 12 of 16
4. Simulation and Experimental Result
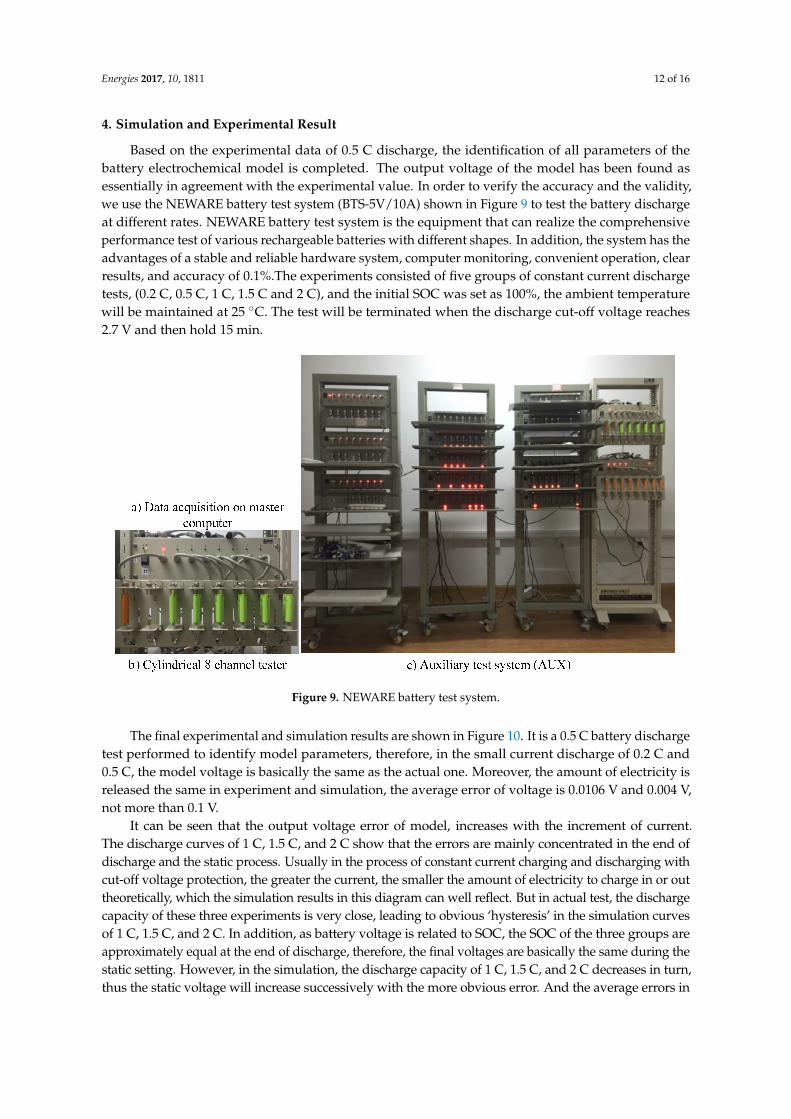
Based on the experimental data of 0.5 C discharge, the identification of all parameters of thebattery electrochemical model is completed. The output voltage of the model has been found asessentially in agreement with the experimental value. In order to verify the accuracy and the validity,we use the NEWARE battery test system (BTS-5V/10A) shown in Figure 9 to test the battery dischargeat different rates. NEWARE battery test system is the equipment that can realize the comprehensiveperformance test of various rechargeable batteries with different shapes. In addition, the system has theadvantages of a stable and reliable hardware system, computer monitoring, convenient operation, clearresults, and accuracy of 0.1%.The experiments consisted of five groups of constant current dischargetests, (0.2 C, 0.5 C, 1 C, 1.5 C and 2 C), and the initial SOC was set as 100%, the ambient temperaturewill be maintained at 25 ◦C. The test will be terminated when the discharge cut-off voltage reaches2.7 V and then hold 15 min.
Energies 2017, 10, 1811 12 of 16
Based on the experimental data of 0.5 C discharge, the identification of all parameters of the battery electrochemical model is completed. The output voltage of the model has been found as essentially in agreement with the experimental value. In order to verify the accuracy and the validity, we use the NEWARE battery test system (BTS-5V/10A) shown in Figure 9 to test the battery discharge at different rates. NEWARE battery test system is the equipment that can realize the comprehensive performance test of various rechargeable batteries with different shapes. In addition, the system has the advantages of a stable and reliable hardware system, computer monitoring, convenient operation, clear results, and accuracy of 0.1%.The experiments consisted of five groups of constant current discharge tests, (0.2 C, 0.5 C, 1 C, 1.5 C and 2 C), and the initial SOC was set as 100%, the ambient temperature will be maintained at 25 °C. The test will be terminated when the discharge cut-off voltage reaches 2.7 V and then hold 15 min.
Figure 9. NEWARE battery test system.
The final experimental and simulation results are shown in Figure 10. It is a 0.5 C battery discharge test performed to identify model parameters, therefore, in the small current discharge of 0.2 C and 0.5 C, the model voltage is basically the same as the actual one. Moreover, the amount of electricity is released the same in experiment and simulation, the average error of voltage is 0.0106 V and 0.004 V, not more than 0.1 V.
It can be seen that the output voltage error of model, increases with the increment of current. The discharge curves of 1 C, 1.5 C, and 2 C show that the errors are mainly concentrated in the end of discharge and the static process. Usually in the process of constant current charging and discharging with cut-off voltage protection, the greater the current, the smaller the amount of electricity to charge in or out theoretically, which the simulation results in this diagram can well reflect. But in actual test, the discharge capacity of these three experiments is very close, leading to obvious ‘hysteresis’ in the simulation curves of 1 C, 1.5 C, and 2 C. In addition, as battery voltage is related to SOC, the SOC of the three groups are approximately equal at the end of discharge, therefore, the final voltages are basically the same during the static setting. However, in the simulation, the discharge capacity of 1 C, 1.5 C, and 2 C decreases in turn, thus the static voltage will increase successively with the more obvious error. And the average errors in discharge stage are 0.0156 V, 0.0146 V, and 0.0216 V, respectively, the maximum deviation is not up to 0.1 V. The final static voltage deviations are 0.149 V, 0.248 V, and 0.26 V.
Figure 9. NEWARE battery test system.
The final experimental and simulation results are shown in Figure 10. It is a 0.5 C battery dischargetest performed to identify model parameters, therefore, in the small current discharge of 0.2 C and0.5 C, the model voltage is basically the same as the actual one. Moreover, the amount of electricity isreleased the same in experiment and simulation, the average error of voltage is 0.0106 V and 0.004 V,not more than 0.1 V.
It can be seen that the output voltage error of model, increases with the increment of current.The discharge curves of 1 C, 1.5 C, and 2 C show that the errors are mainly concentrated in the end ofdischarge and the static process. Usually in the process of constant current charging and discharging withcut-off voltage protection, the greater the current, the smaller the amount of electricity to charge in or outtheoretically, which the simulation results in this diagram can well reflect. But in actual test, the dischargecapacity of these three experiments is very close, leading to obvious ‘hysteresis’ in the simulation curvesof 1 C, 1.5 C, and 2 C. In addition, as battery voltage is related to SOC, the SOC of the three groups areapproximately equal at the end of discharge, therefore, the final voltages are basically the same during thestatic setting. However, in the simulation, the discharge capacity of 1 C, 1.5 C, and 2 C decreases in turn,thus the static voltage will increase successively with the more obvious error. And the average errors in
Energies 2017, 10, 1811 13 of 16
discharge stage are 0.0156 V, 0.0146 V, and 0.0216 V, respectively, the maximum deviation is not up to 0.1 V.The final static voltage deviations are 0.149 V, 0.248 V, and 0.26 V.Energies 2017, 10, 1811 13 of 16
0 2500 5000 7500 10000 12500 15000 17500 20000 22500 25000
2.8
3.2
3.6
4.0
2000 3000 4000 5000
2.8
2.9
3.0
3.1
3.2
3.3
3.4
Cel
l vol
tage
[V]
Time[s]
0.2C_Exp 0.2C_Simu 0.5C_Exp 0.5C_Simu 1C_Exp 1C_Simu 1.5C_Exp 1.5C_Simu 2C_Exp 2C_Simu
0 2 4 6 8 10
Figure 10. Comparison of experiment and Simulation of 0.2 C to 2 C discharge.
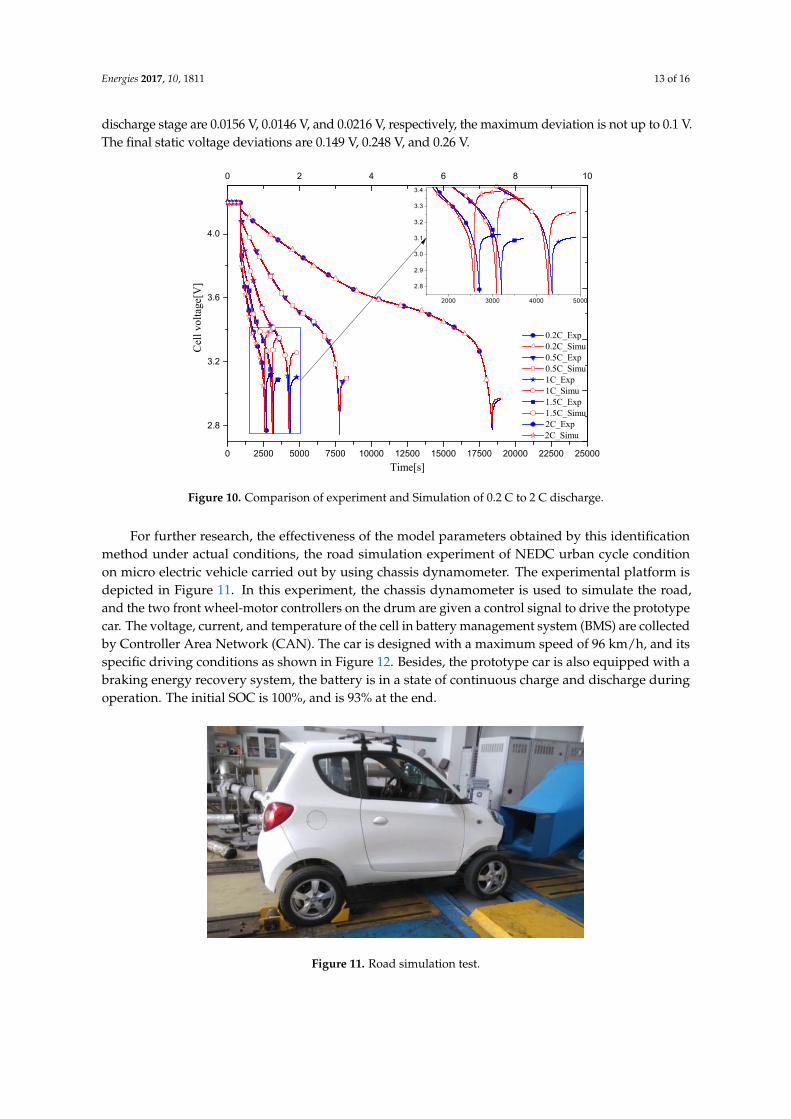
For further research, the effectiveness of the model parameters obtained by this identification method under actual conditions, the road simulation experiment of NEDC urban cycle condition on micro electric vehicle carried out by using chassis dynamometer. The experimental platform is depicted in Figure 11. In this experiment, the chassis dynamometer is used to simulate the road, and the two front wheel-motor controllers on the drum are given a control signal to drive the prototype car. The voltage, current, and temperature of the cell in battery management system (BMS) are collected by Controller Area Network (CAN). The car is designed with a maximum speed of 96 km/h, and its specific driving conditions as shown in Figure 12. Besides, the prototype car is also equipped with a braking energy recovery system, the battery is in a state of continuous charge and discharge during operation. The initial SOC is 100%, and is 93% at the end.
Figure 11. Road simulation test.
Figure 10. Comparison of experiment and Simulation of 0.2 C to 2 C discharge.
For further research, the effectiveness of the model parameters obtained by this identificationmethod under actual conditions, the road simulation experiment of NEDC urban cycle conditionon micro electric vehicle carried out by using chassis dynamometer. The experimental platform isdepicted in Figure 11. In this experiment, the chassis dynamometer is used to simulate the road,and the two front wheel-motor controllers on the drum are given a control signal to drive the prototypecar. The voltage, current, and temperature of the cell in battery management system (BMS) are collectedby Controller Area Network (CAN). The car is designed with a maximum speed of 96 km/h, and itsspecific driving conditions as shown in Figure 12. Besides, the prototype car is also equipped with abraking energy recovery system, the battery is in a state of continuous charge and discharge duringoperation. The initial SOC is 100%, and is 93% at the end.
Energies 2017, 10, 1811 13 of 16
0 2500 5000 7500 10000 12500 15000 17500 20000 22500 25000
2.8
3.2
3.6
4.0
2000 3000 4000 5000
2.8
2.9
3.0
3.1
3.2
3.3
3.4
Cel
l vol
tage
[V]
Time[s]
0.2C_Exp 0.2C_Simu 0.5C_Exp 0.5C_Simu 1C_Exp 1C_Simu 1.5C_Exp 1.5C_Simu 2C_Exp 2C_Simu
0 2 4 6 8 10
Figure 10. Comparison of experiment and Simulation of 0.2 C to 2 C discharge.
For further research, the effectiveness of the model parameters obtained by this identification method under actual conditions, the road simulation experiment of NEDC urban cycle condition on micro electric vehicle carried out by using chassis dynamometer. The experimental platform is depicted in Figure 11. In this experiment, the chassis dynamometer is used to simulate the road, and the two front wheel-motor controllers on the drum are given a control signal to drive the prototype car. The voltage, current, and temperature of the cell in battery management system (BMS) are collected by Controller Area Network (CAN). The car is designed with a maximum speed of 96 km/h, and its specific driving conditions as shown in Figure 12. Besides, the prototype car is also equipped with a braking energy recovery system, the battery is in a state of continuous charge and discharge during operation. The initial SOC is 100%, and is 93% at the end.
Figure 11. Road simulation test. Figure 11. Road simulation test.
Energies 2017, 10, 1811 14 of 16Energies 2017, 10, 1811 14 of 16
Figure 12. Actual speed under NEDC cycle condition.
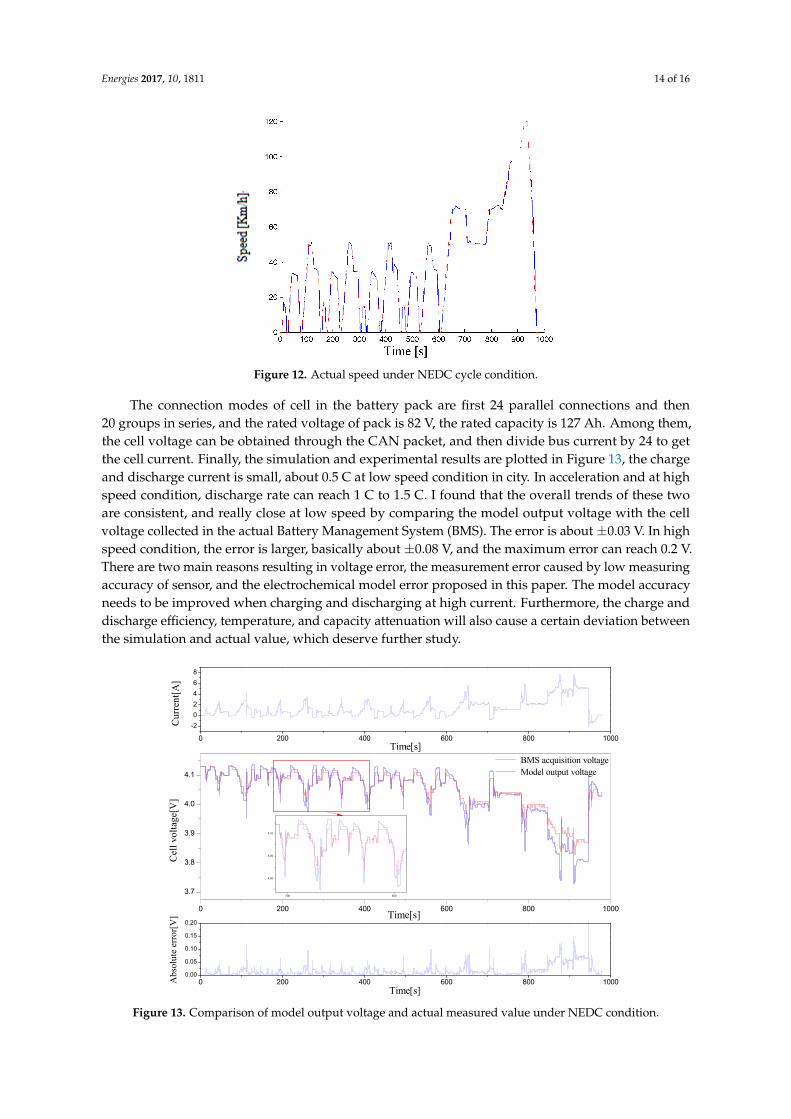
The connection modes of cell in the battery pack are first 24 parallel connections and then 20 groups in series, and the rated voltage of pack is 82 V, the rated capacity is 127 Ah. Among them, the cell voltage can be obtained through the CAN packet, and then divide bus current by 24 to get the cell current. Finally, the simulation and experimental results are plotted in Figure 13, the charge and discharge current is small, about 0.5 C at low speed condition in city. In acceleration and at high speed condition, discharge rate can reach 1 C to 1.5 C. I found that the overall trends of these two are consistent, and really close at low speed by comparing the model output voltage with the cell voltage collected in the actual Battery Management System (BMS). The error is about ±0.03 V. In high speed condition, the error is larger, basically about ±0.08 V, and the maximum error can reach 0.2 V. There are two main reasons resulting in voltage error, the measurement error caused by low measuring accuracy of sensor, and the electrochemical model error proposed in this paper. The model accuracy needs to be improved when charging and discharging at high current. Furthermore, the charge and discharge efficiency, temperature, and capacity attenuation will also cause a certain deviation between the simulation and actual value, which deserve further study.
0 200 400 600 800 1000
-202468
Cur
rent
[A]
Time[s]
0 200 400 600 800 1000
3.7
3.8
3.9
4.0
4.1
Cel
l vol
tage
[V]
Time[s]
BMS acquisition voltage Model output voltage
0 200 400 600 800 10000.00
0.05
0.10
0.15
0.20
Abs
olut
e er
ror[
V]
Time[s]
200 400
4.00
4.05
4.10
Figure 13. Comparison of model output voltage and actual measured value under NEDC condition.
Figure 12. Actual speed under NEDC cycle condition.
The connection modes of cell in the battery pack are first 24 parallel connections and then20 groups in series, and the rated voltage of pack is 82 V, the rated capacity is 127 Ah. Among them,the cell voltage can be obtained through the CAN packet, and then divide bus current by 24 to getthe cell current. Finally, the simulation and experimental results are plotted in Figure 13, the chargeand discharge current is small, about 0.5 C at low speed condition in city. In acceleration and at highspeed condition, discharge rate can reach 1 C to 1.5 C. I found that the overall trends of these twoare consistent, and really close at low speed by comparing the model output voltage with the cellvoltage collected in the actual Battery Management System (BMS). The error is about ±0.03 V. In highspeed condition, the error is larger, basically about ±0.08 V, and the maximum error can reach 0.2 V.There are two main reasons resulting in voltage error, the measurement error caused by low measuringaccuracy of sensor, and the electrochemical model error proposed in this paper. The model accuracyneeds to be improved when charging and discharging at high current. Furthermore, the charge anddischarge efficiency, temperature, and capacity attenuation will also cause a certain deviation betweenthe simulation and actual value, which deserve further study.
Energies 2017, 10, 1811 14 of 16
Figure 12. Actual speed under NEDC cycle condition.
The connection modes of cell in the battery pack are first 24 parallel connections and then 20 groups in series, and the rated voltage of pack is 82 V, the rated capacity is 127 Ah. Among them, the cell voltage can be obtained through the CAN packet, and then divide bus current by 24 to get the cell current. Finally, the simulation and experimental results are plotted in Figure 13, the charge and discharge current is small, about 0.5 C at low speed condition in city. In acceleration and at high speed condition, discharge rate can reach 1 C to 1.5 C. I found that the overall trends of these two are consistent, and really close at low speed by comparing the model output voltage with the cell voltage collected in the actual Battery Management System (BMS). The error is about ±0.03 V. In high speed condition, the error is larger, basically about ±0.08 V, and the maximum error can reach 0.2 V. There are two main reasons resulting in voltage error, the measurement error caused by low measuring accuracy of sensor, and the electrochemical model error proposed in this paper. The model accuracy needs to be improved when charging and discharging at high current. Furthermore, the charge and discharge efficiency, temperature, and capacity attenuation will also cause a certain deviation between the simulation and actual value, which deserve further study.
0 200 400 600 800 1000
-202468
Cur
rent
[A]
Time[s]
0 200 400 600 800 1000
3.7
3.8
3.9
4.0
4.1
Cel
l vol
tage
[V]
Time[s]
BMS acquisition voltage Model output voltage
0 200 400 600 800 10000.00
0.05
0.10
0.15
0.20
Abs
olut
e er
ror[
V]
Time[s]
200 400
4.00
4.05
4.10
Figure 13. Comparison of model output voltage and actual measured value under NEDC condition. Figure 13. Comparison of model output voltage and actual measured value under NEDC condition.

Energies 2017, 10, 1811 15 of 16
5. Conclusions
In this paper, the electrode dynamics of Li ion battery is analyzed, and then the electrochemicalmodel is established by relevant theories. The electrochemical model of the battery is a multi-loopand strongly nonlinear system. In the light of the average electrode in [15–17], the simplified averageelectrode model is finally built by combining the discrete finite difference method. Through the analysisand classification of the parameters, applying the particle swarm optimization (PSO) algorithm, basedon the discharge experiment of 0.5 C, after two times identification, all parameters of the modelare obtained with the error within its reasonable range. By the 0.2–2 C multi-rate battery dischargeexperiment, the parameters on the identification of particle swarm optimization algorithm can ensurethe accuracy of battery model, maximum voltage error is less than 0.1 V, and only occurs in the end oflarge current discharge. For promoting the application of cell electrochemical models in vehicle-usedbattery management systems, the average electrode model put forward in this thesis, the perfection ofmodel simplification, and the output characteristics under different working conditions are the focusof the next research.
Acknowledgments: This work was supported by the National Key R&D Plan of China (No. 2017YFB0103200),the National Natural Science Foundation of China (Grant No. U1664258 and U1564201), the “333” Project of JiangsuProvince (No. BRA2016445), and the Primary Research&Development Plan of Jiangsu Province (No. BE2017129).
Author Contributions: Xiao Yang, Long Chen and Xing Xu conceived and designed the experiments; Xiao Yangand Wei Wang performed the experiments; Xiao Yang, Wei Wang and Qiling Xu analyzed the data; Zhiguang Zhouprovided equipment, technology and financial support; Xiao Yang wrote the paper; Yuzhen Lin helped andmodified translation.
Conflicts of Interest: The authors declare no conflict of interest.
References
1. Johnson, V.H. Battery performance models in ADVISOR. J. Power Sources 2002, 110, 321–329. [CrossRef]2. Salameh, Z.M.; Casacca, M.A.; Lynch, W.A. A mathematical model for lead-acid batteries. IEEE Trans.
Energy Convers. 1992, 7, 93–97. [CrossRef]3. United States Idaho National Engineering & Environmental Laboratory. PNGV Battery Test Manual.
Revision 3, DOE/ID-10597. 2001. Available online: http://avtinlgov/energy_storage_lib.shtml (accessed on31 October 2017).
4. Gao, Z.; Cheng, S.C.; Chiew, J.H.K.; Jia, J.; Zhang, C. Design and Implementation of Smart Lithium-ion BatterySystem with Real-time Fault Diagnosis Capability for Electric Vehicles. Energies 2017, 1, 1503. [CrossRef]
5. Gao, Z.; Cheng, C.; Woo, W.; Jia, J. Integrated Equivalent Circuit and Thermal Model for Simulation ofTemperature-Dependent LiFePO4 Battery in Actual Embedded Application. Energies 2017, 10, 85. [CrossRef]
6. Newman, J.; Tiedemann, W. Porous-Electrode Theory with Battery Applications. AIChE J. 1975, 21, 25–41.[CrossRef]
7. Doyle, M.; Fuller, T.F.; Newman, J. Modeling of Galvanostatic Charge and Discharge of theLithium/Polymer/Insertion Cell. J. Electrochem. Soc. 1993, 140, 1526–1533. [CrossRef]
8. Wang, C.Y.; Gu, W.B.; Liaw, B.Y. Micro-Macroscopic Coupled Modeling of Batteries and Fuel Cells. Part I:Model Development. J. Electrochem. Soc. 1998, 145, 3407–3417. [CrossRef]
9. Barbarisi, O.; Vasca, F.; Glielmo, L. State of Charge Kalman Filter Estimator for Automotive Batteries.Control Eng. Pract. 2006, 14, 267–275. [CrossRef]
10. Santhanagopalan, S.; White, R.E. Online Estimation of the State of Charge of a Lithium Ion Cell. ECS Trans.1985, 19, 57–58.
11. Wang, C.Y.; Gu, W.B.; Liaw, B.Y. Micro-Macroscopic Coupled Modeling of Batteries and Fuel Cells. Part II:Application to Ni-Cd and Ni-MH Cells. J. Electrochem. Soc. 1998, 145, 3418–3427. [CrossRef]
12. Gu, W.B.; Wang, C.Y. Thermal-Electrochemical Coupled Modeling of a Lithium-Ion Cell. J. Electrochem. Soc.2000, 99, 743–762.
13. Chaturvedi, N.A.; Klein, R.; Christensen, J.; Ahmed, J.; Kojic, A. Algorithms for advancedbattery-management systems. IEEE Control Syst. 2010, 30, 49–68. [CrossRef]

Energies 2017, 10, 1811 16 of 16
14. Di Domenico, D.; Stefanopoulou, A.; Fiengo, G. Lithium-Ion Battery State of Charge and Critical SurfaceCharge Estimation Using an Electrochemical Model-Based Extended Kalman Filter. J. Dyn. Syst. Meas. Control2010, 132, 768–778. [CrossRef]
15. Di Domenico, D.; Fiengo, G.; Stefanopoulou, A. Lithium-ion battery state of charge estimation with a Kalmanfilter based on a electrochemical model. In Proceedings of the IEEE International Conference on ControlApplications, San Antonio, TX, USA, 3–5 September 2008; pp. 702–707.
16. Smith, K.A.; Rahn, C.D.; Wang, C.Y. Model order reduction of1Ddiffusionsystemsvia residue grouping.J. Dyn. Syst. Meas. Control 2008, 130, 141–148. [CrossRef]
17. Lee, T.K.; Filipi, Z.S. Electrochemical Li-ion battery modeling for control design with optimal unevendiscretization. In Proceedings of the ASME Dynamic Systems & Control Conference & Bath/ASMESymposium on Fluid Power & Motion Control, Arlington, VA, USA, 31 October–2 November 2011;pp. 493–500.
18. Manzie, C.; Zou, C.; Nesic, D. Simplification techniques for PDE-based Li-ion battery models. In Proceedingsof the IEEE Conference on Decision & Control, Osaka, Japan, 15–18 December 2015; pp. 3913–3921.
19. Zou, C.; Manzie, C.; Nesic, D. A Framework for Simplification of PDE-Based Lithium-Ion Battery Models.IEEE Trans. Control Syst. Technol. 2016, 24, 1594–1609. [CrossRef]
20. Wei, X.Z.; Sun, Z.C.; Tian, J.Q. Parameter identification and state estimation of Li-ion power battery in hybridelectric vehicle. J. Tongji Univ. 2008, 36, 231–235.
21. Luo, Y.T.; Xie, B.; He, X.C. Parameter identification and SOC estimation of lithium-ion battery pack used inelectric vehicles. J. South China Univ. Technol. 2012, 40, 79–85.
22. Niu, L.Y.; Shi, W.; Jiang, J.C.; Zhang, Y.R.; Jiang, J.; Cao, X.M. Model parameters analysis of lithium ironphosphate battery for electric vehicle. Automot. Eng. 2013, 35, 127–132.
23. Eberhart, R.; Kennedy, J. New optimizer using particle swarm theory. In Proceedings of the InternationalSymposium on Micro Machine and Human Science, Nagoya, Japan, 4–6 October 1995; pp. 39–43.
© 2017 by the authors. Licensee MDPI, Basel, Switzerland. This article is an open accessarticle distributed under the terms and conditions of the Creative Commons Attribution(CC BY) license (http://creativecommons.org/licenses/by/4.0/).