velocity
TRANSCRIPT

Charles P. Pinney, et. al.. "Velocity Measurement."
Copyright 2000 CRC Press LLC. <http://www.engnetbase.com>.

© 1999 by CRC Press LLC
Velocity Measurement
16.1 Introduction
16.2 Measurement of Linear Velocity
Reference-Based Measurement • Seismic Devices
16.3 Velocity: Angular
Relative: Tachometer • Absolute: Angular Rate Sensors
16.4 Conclusion
16.1 Introduction
The
linear velocity
of an object, or more correctly a particle, is defined as the time rate of change ofposition of the object. It is a vector quantity, meaning it has a direction as well as a magnitude, and thedirection is associated with the direction of the change in position. The magnitude of velocity is calledthe speed (or pace), and it quantifies how fast an object is moving. This is what the speedometer in acar tells you; thus, the speedometer is well named. Linear velocity is always measured in terms of, orfrom, some reference object. Thus, the speedometer of a car tells how fast one is moving relative to theearth. Usually, linear velocity is identified using only the term “velocity.” Common units for velocityinclude meters per second and miles per hour, but any similar combination of units of length per unitof time is correct.
The
rotational velocity
(or angular velocity) of an object is defined as the time rate of change of angularposition, and it is a measure of how fast an object is turning. It is completely analogous to linear velocity,but for angular motion. Common units are revolutions per minute, but any angular unit of measurementper unit of time can be used. Rotational velocity is a vector quantity also, with the direction of the vectorbeing the same as the direction of the axis about which object is turning. For example, with a car stoppedat a stop light with the motor running, the rotational velocity of the crankshaft of the motor is given bya magnitude (rotational speed), say 800 rpm (rev/min), and a direction associated with the direction inwhich the crankshaft is pointing. The axis of rotation of the object may be moving, rather than fixed aswhen the car is turning a corner. The roll, yaw, or pitch velocity of an airplane would be given in termsof rotational speeds about each of the turning axes in the same manner as for a crankshaft.
Usually, the reference from which linear or rotational velocity is given is understood from the contextof the problem. It is often not stated explicitly. The measurement method used defines the reference.
Applications for velocity measurement include:
1. Controlling the speed at which metal stock is fed into a machine tool. If the metal is fed too quicklythe result could be premature tool wear or it could even lead to machine failure. Feeding thematerial too slowly will reduce the yield of the machine tool.
2. Measuring the approach speed of a robotic tool onto its target.3. Monitoring the speed of a generator in an electric power station.4. An airport radar system measuring the speed of an approaching aircraft using the Doppler effect.5. Measuring an automobile’s wheel speed in order to provide feedback to an antilock brake system.
Charles P. Pinney
Pinney Technologies, Inc.
William E. Baker
University of New Mexico

© 1999 by CRC Press LLC
16.2 Measurement of Linear Velocity
The problem of velocity measurement is somewhat different from that of measurement of other quantitiesin that there is not a large number of transducer types and transducer manufacturers from which tochoose for a given problem. Frequently, the problem is such that the person must use his/her knowledgeof measurement of other quantities and ingenuity to develop a velocity measurement method suitablefor the problem at hand. Velocity is often obtained by differentiation of displacement or integration ofacceleration. As background information for this, the necessary equations are given below.
Figure 16.1 shows a graph that represents the position of an object as a function of time as it movesalong a straight, vertical path (
y
direction). The quantity to be measured could be an average velocity,and its magnitude would then be defined as follows:
(16.1)
for the time interval
t
1
to
t
2
. As the time interval becomes small, the average speed becomes the instan-taneous speed
V
y
, and the definition becomes:
FIGURE 16.1
Position-time function for an object moving on a straight path.
V2
V1y2
y1y(t)
t1 t2 time
Average speed avg= = −−
=Vy y
t t
y
t2 1
2 1
∆∆

© 1999 by CRC Press LLC
(16.2)
which is the slope of the position–time curve. The subscript indicates the
y
component. This speed, whenassociated with the known direction, becomes the velocity.
Since acceleration is defined as the time rate of change of velocity, the speed of an object may also begiven by:
(16.3)
where
a
y
(t)
is the acceleration in the y direction (for Figure 16.1) and
V
i
is the speed at time
t
i
. Each ofthe above equations can be used as a basis for making a velocity measurement. Note that for motion inmore than one dimension, there would be more than one component, and there would be correspondingequations for the other dimensions (
x
and
y
). However, velocity measurements are always done byindividual component.
It is convenient in the discussion of techniques of measuring velocity to divide the methods into twocategories: one will be called “referenced-based methods” and the other “seismic or inertial referencedtransducers.” Referenced-based methods refer to measurements made for which the instrumentation hascomponent(s) on both the moving object and the reference frame for the measurement. The seismictransducers do not require contact with the reference frame. However, they give a speed relative to thetransducer speed at the start of the test. The initial motion must be determined from other considerationsin the test setup and added to the relative speed.
Reference-Based Measurement
Using Equation 16.1, one value of the average speed in a given direction of an object can be determinedfrom the distance traveled in that direction and the time required. Determining the muzzle speed of aprojectile is an example. Having two pickups spaced a known distance apart, and recording the time forthe projectile edge to pass between them is a common way of doing this. Typical pickups would includeproximity transducers (see displacement measurement), laser or collimated light beams with diodesensors, and electric contacts closed (or opened) by the moving object. Measuring the time interval canbe done with an electronic counter or displaying the output of the pickups on an oscilloscope. In designingsuch a system, care must be exercised to minimize or eliminate the effect to the object passing throughthe window on the positions of the sensors and their response. For example, pressure from a muzzleblast can move the sensors on their supports. This could distort the distance between them during themeasurement; but afterwards, the appearance of the setup could be unchanged, so the experimenterwould be unaware of the error.
Using a series of equally spaced pickups can determine the average speed for a sequence of positions.For some applications, illumination of the path of motion of the object with a stroboscope flashing at aknown rate and use of time exposure photography can give a single picture of the object at a sequenceof positions. With knowledge of the length scale and the flash rate, the average speed at a sequence ofpositions can be calculated. If the plane of motion is the same as the plane of the photograph, then twocomponents of the velocity can be determined. A variation of this method is to use video recording ofthe motion and the time base of the video for measurement of time increments. Availability of high-speed video cameras, to 12,000 frames per second, extends the range of applicable velocities, and digitalrecording can enhance the ease and accuracy of making the distance measurements.
Another variation of this method is to use some type of position transducer to record the position–timefunction of the moving object and then differentiate this function to get speed–time. Displacement
Vy
t
dy
dtty = =
→lim∆
∆∆0
V t V a t dt
t
t
y i y
i
( ) = − ( )∫
© 1999 by CRC Press LLC
transducers were discussed in an earlier chapter, and the selection of an acceptable transducer is impor-tant. Range, resolution, and mass loading are important parameters. Because differentiation of experi-mental data is a noise-generating process, particular care must be exercised to reduce the electric noisein the displacement data to a minimum. Also, the calculated speed–time function might require somesmoothing to reduce the numerically introduced noise.
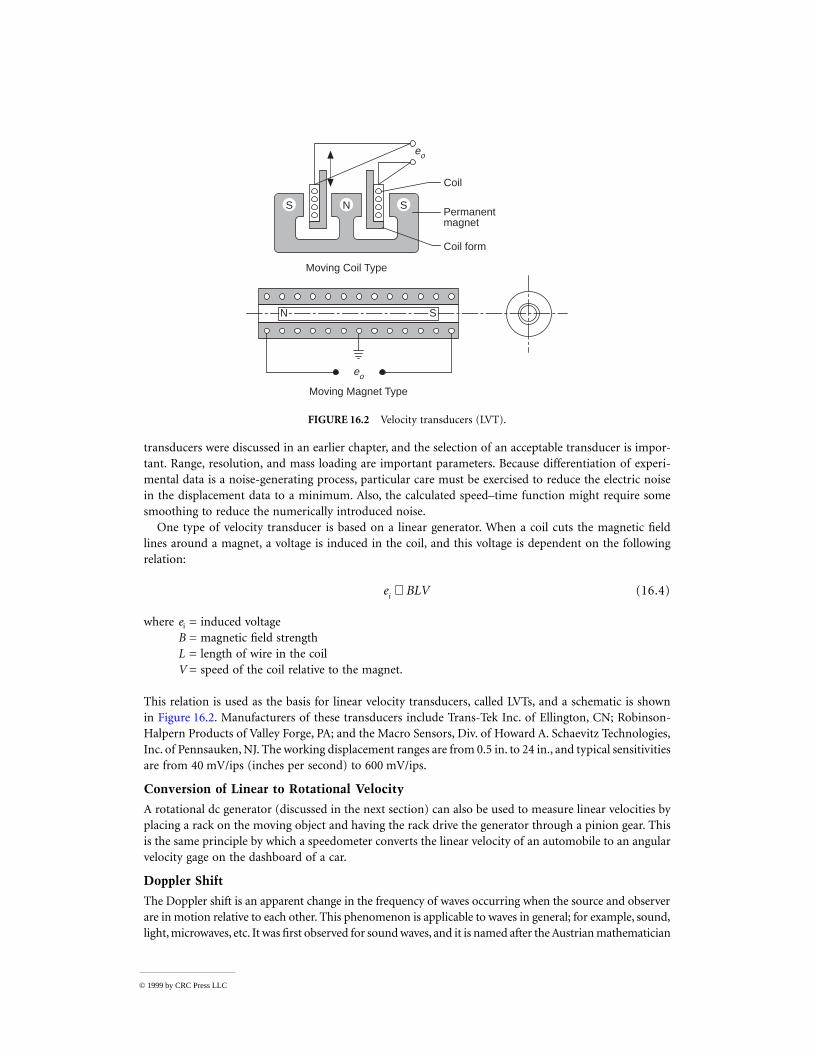
One type of velocity transducer is based on a linear generator. When a coil cuts the magnetic fieldlines around a magnet, a voltage is induced in the coil, and this voltage is dependent on the followingrelation:
(16.4)
where
e
i
= induced voltage
B
= magnetic field strength
L
= length of wire in the coil
V
= speed of the coil relative to the magnet.
This relation is used as the basis for linear velocity transducers, called LVTs, and a schematic is shownin Figure 16.2. Manufacturers of these transducers include Trans-Tek Inc. of Ellington, CN; Robinson-Halpern Products of Valley Forge, PA; and the Macro Sensors, Div. of Howard A. Schaevitz Technologies,Inc. of Pennsauken, NJ. The working displacement ranges are from 0.5 in. to 24 in., and typical sensitivitiesare from 40 mV/ips (inches per second) to 600 mV/ips.
Conversion of Linear to Rotational Velocity
A rotational dc generator (discussed in the next section) can also be used to measure linear velocities byplacing a rack on the moving object and having the rack drive the generator through a pinion gear. Thisis the same principle by which a speedometer converts the linear velocity of an automobile to an angularvelocity gage on the dashboard of a car.
Doppler Shift
The Doppler shift is an apparent change in the frequency of waves occurring when the source and observerare in motion relative to each other. This phenomenon is applicable to waves in general; for example, sound,light, microwaves, etc. It was first observed for sound waves, and it is named after the Austrian mathematician
FIGURE 16.2
Velocity transducers (LVT).
S N S
Coil
eo
Permanentmagnet
Coil form
Moving Coil Type
SN
eo
Moving Magnet Type
e BLVi ∝

© 1999 by CRC Press LLC
and physicist Christian Doppler (1803–1853) who first published a paper on it for light waves in 1842. Thefrequency will increase when the source and observer approach each other (red shift) and decrease whenthey move apart (blue shift). This phenomenon was illustrated by having people listen to the pitch of anoncoming train. The high-pitched whistle would transition to a lower pitch as the train passed the observer.
Radar, which is named for radio detection and ranging, is another technique for detecting the position,motion, and nature of a remote object by means of radio waves reflected from its surface. Pulse radarsystems use a single directional antenna to transmit and receive the waves. They transmit pulses ofelectromagnetic waves (usually microwaves), some of which are reflected by objects in the path of thebeam. Reflections are received by the radar unit, processed electronically, and converted into images ona cathode-ray tube. The antenna must be connected only to the transmitter when sending and only tothe receiver while receiving; this is accomplished by switching from one to the other and back again inthe fraction of a microsecond between pulses. The distance of the object from the radar source isdetermined by measuring the time required for the radar signal to reach the target and return. Thedirection of the object with respect to the radar unit is determined from the direction in which the pulseswere transmitted. In most units, the beam of pulses is continuously rotated at a constant speed, or it isscanned (swung back and forth) over a sector at a constant rate. Pulse radar is used primarily for aircraftand naval navigation and for military applications. In Doppler radar, or continuous-wave radar, twoantennas are used — one to transmit and the other to receive. Because the time a continuous-wave signaltakes to reach the target and return cannot be measured, Doppler radar cannot determine distance. Thevelocity of the object is determined using the Doppler effect. If the object is approaching the radar unit,the frequency of the returned signal is greater than the frequency of the transmitted signal. If the objectis receding, the returned frequency is less; and if the object is not moving relative to the radar unit, thefrequency of the returned signal is the same as the frequency of the transmitted signal.
One value of this Doppler technology is shown on the evening weather broadcast. Radar can measurewind rotation inside a thunderstorm and identify possible tornadoes. The VORAD system by Eaton isan on-board system for vehicle safety. It detects when a dangerous approach to another vehicle is takingplace. It will automatically apply the brakes in an emergency situation.
Light Interference Methods
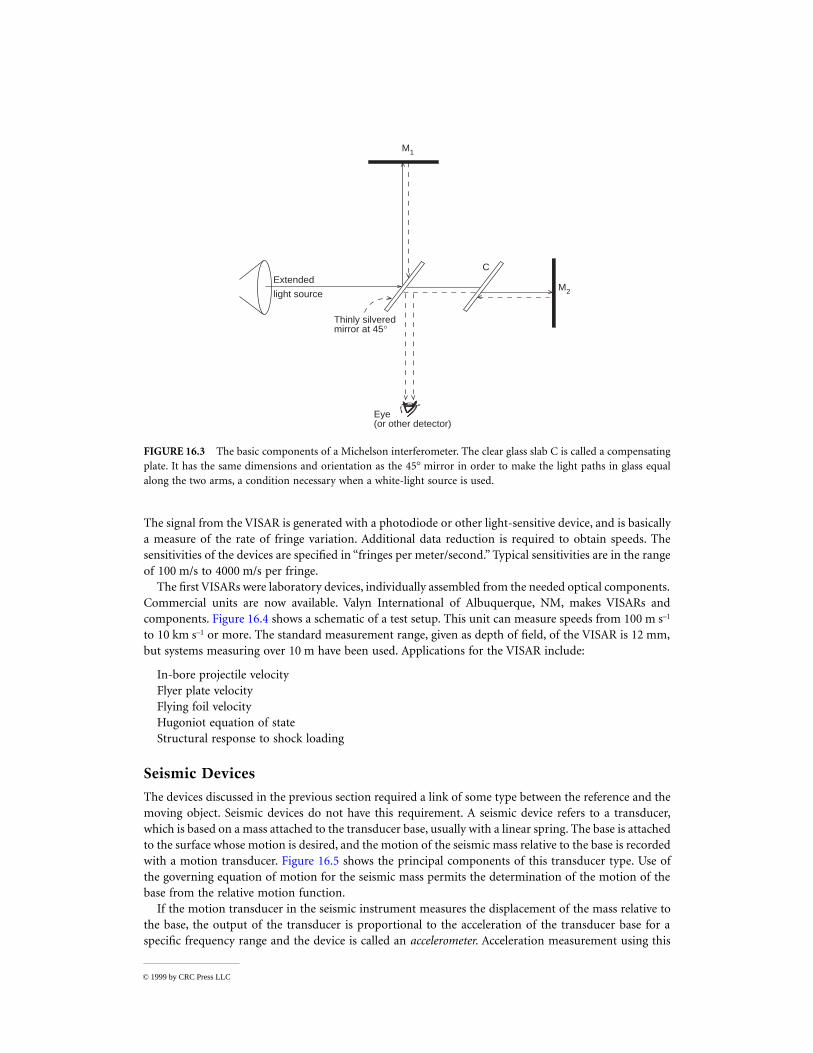
Velocity measurements can be made using light interference principles. Figure 16.3 shows the setup usedby Michelson in the 1890s to demonstrate light interference. A beam of monochromatic light is split intotwo beams. One beam is directed onto a stationary mirror. The other beam is directed onto a movingtarget. The observer sees the superposition of the two beams. As the mirror moves in one direction,summation of the waves of the two beams will alternately reinforce and cancel each other. The amountof motion for one cycle of light intensity variation is the wavelength of the light being used. The frequencyof these light-to-dark transitions is proportional to the velocity of the moving target. Highly accuratemeasurements are available with interferometer techniques. For example 1 m is 1,650,763.73 fringe countsfor the orange light emitted by krypton-86.
Refinements of this principle are needed for convenience of use. Lasers are used as the light source,for example. One commercial supplier of this type of device, commonly called a Laser Doppler Vibro-meter, is Polytec PI, Inc. of Costa Mesa, CA. The basic principle gives velocity parallel to the laser beam,but Polytec PI also has a unit that utilizes scattered laser light which permits measurement of the in-plane velocity. It is called a laser surface velocimeter.
VISAR System
Another application of interferometry to the measurement of velocity–time profiles is a device calledVISAR, for “velocity interference system for any reflector.” Earlier interferometer systems had requiredthat the target have a highly polished reflecting surface and that there be very little surface tilt during atest. The VISAR system functions with either specularly or diffusely reflecting surfaces, and is quiteinsensitive to tilting of the target. It was developed for shock wave research work, and is useful formeasurement of very high speeds. Reference [3] gives a detailed description of the principles of operation.
The signal from the VISAR is generated with a photodiode or other light-sensitive device, and is basicallya measure of the rate of fringe variation. Additional data reduction is required to obtain speeds. Thesensitivities of the devices are specified in “fringes per meter/second.” Typical sensitivities are in the rangeof 100 m/s to 4000 m/s per fringe.
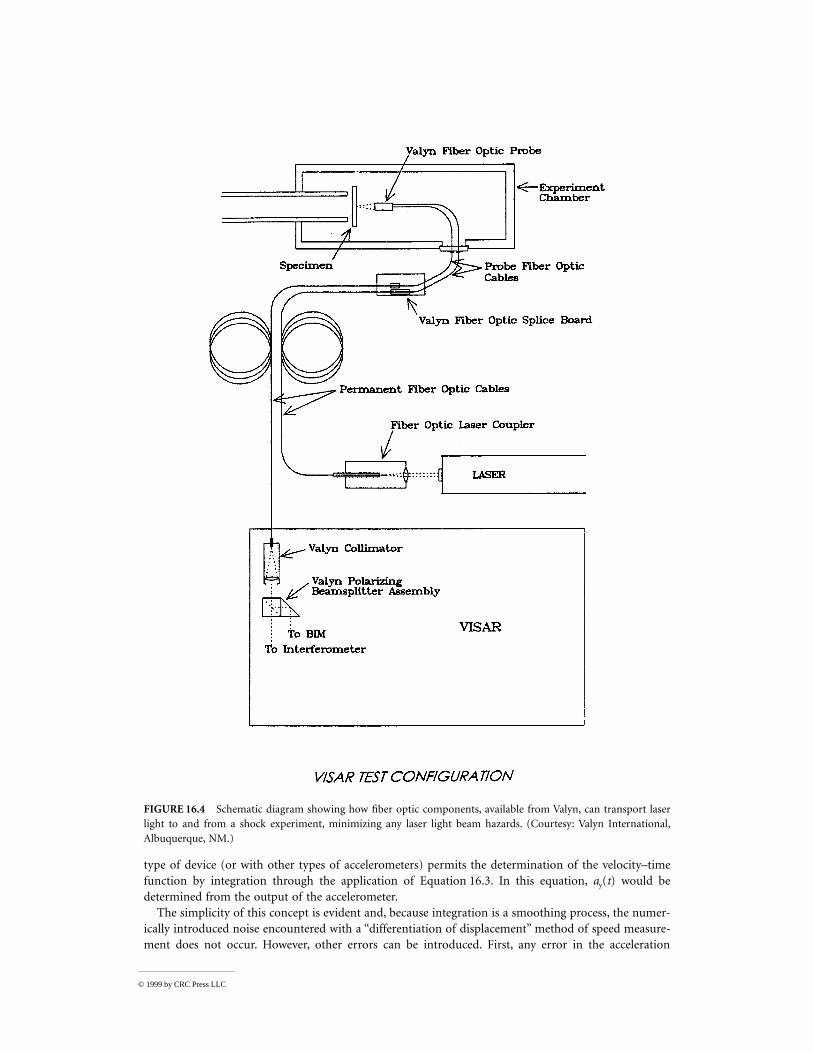
The first VISARs were laboratory devices, individually assembled from the needed optical components.Commercial units are now available. Valyn International of Albuquerque, NM, makes VISARs andcomponents. Figure 16.4 shows a schematic of a test setup. This unit can measure speeds from 100 m s
–1
to 10 km s
–1
or more. The standard measurement range, given as depth of field, of the VISAR is 12 mm,but systems measuring over 10 m have been used. Applications for the VISAR include:
In-bore projectile velocityFlyer plate velocityFlying foil velocityHugoniot equation of stateStructural response to shock loading
Seismic Devices
The devices discussed in the previous section required a link of some type between the reference and themoving object. Seismic devices do not have this requirement. A seismic device refers to a transducer,which is based on a mass attached to the transducer base, usually with a linear spring. The base is attachedto the surface whose motion is desired, and the motion of the seismic mass relative to the base is recordedwith a motion transducer. Figure 16.5 shows the principal components of this transducer type. Use ofthe governing equation of motion for the seismic mass permits the determination of the motion of thebase from the relative motion function.
If the motion transducer in the seismic instrument measures the displacement of the mass relative tothe base, the output of the transducer is proportional to the acceleration of the transducer base for aspecific frequency range and the device is called an
accelerometer
. Acceleration measurement using this
FIGURE 16.3
The basic components of a Michelson interferometer. The clear glass slab C is called a compensatingplate. It has the same dimensions and orientation as the 45
°
mirror in order to make the light paths in glass equalalong the two arms, a condition necessary when a white-light source is used.
M1
M2
C
Eye(or other detector)
Thinly silveredmirror at 45°
Extended
light source
© 1999 by CRC Press LLC
© 1999 by CRC Press LLC
type of device (or with other types of accelerometers) permits the determination of the velocity–timefunction by integration through the application of Equation 16.3. In this equation,
a
y
(
t
) would bedetermined from the output of the accelerometer.
The simplicity of this concept is evident and, because integration is a smoothing process, the numer-ically introduced noise encountered with a “differentiation of displacement” method of speed measure-ment does not occur. However, other errors can be introduced. First, any error in the acceleration
FIGURE 16.4
Schematic diagram showing how fiber optic components, available from Valyn, can transport laserlight to and from a shock experiment, minimizing any laser light beam hazards. (Courtesy: Valyn International,Albuquerque, NM.)

measurement will be carried over. However, additional precautions are necessary to obtain good resultsfor speed measurement. The problem areas include the following:
• The initial speed,
V
i
, must be known at the beginning of the time of interest. Because this quantityis added to the change in speed, an error in it will be a constant on each value.
• A bias, or zero shift, in the accelerometer signal will be included as a constant acceleration, and thusintroduce a linearly increasing error in the calculated values throughout the time interval of interest.This bias may be introduced from electrical or thermal characteristics of the circuit, or, in the caseof measurement of accelerations during impact after a free fall, by the 1
g
acceleration of gravity.
• If the frequency content of the acceleration falls outside the usable bandwidth of the accelerometerand recording circuit, errors in acceleration occur. The low-frequency cutoff depends on the recordingequipment and circuit, and the high frequency cutoff depends on the natural frequency and dampingof the accelerometer, as well as the bandwidth of each piece of equipment in the recording circuit.
• Accelerometer theory is based on harmonic excitation of the system. For many velocity measure-ment applications, the input is a transient. Combination of these two factors can result in inac-curate accelerometer data; for example, ringing may occur, and cause errors in the calculatedspeeds. This problem is accentuated for lightly damped accelerometers.
When this method of speed measurement must be used, a series of check tests should be conductedto evaluate the accuracy of the method for that particular system.
A variation of the above method is to put an integrating circuit in the accelerometer and perform theintegration with an analog circuit. Then, the output of the “velocity” transducer is proportional to thechange in speed. This type of device is subject to all of the potential error sources discussed above. Amanufacturer of this type of transducer is Wilcoxon Research of Gaithersburg, MD.
FIGURE 16.5
Seismic type of motion-measuring instrument.
Secondarytransducer
TransducedOutput
Springs supportingseismic mass. Deflectionconstant = k
Dashpot providingviscous dampingcoefficient, x
Seismicmass, M
Mass motion, Sm
Member whose motionis being measured
Motion of supportSs = SsOcos Wt
Instrument housing
© 1999 by CRC Press LLC
© 1999 by CRC Press LLC
It can be shown that if the electromechanical transducer in a seismic instrument gives an output whichis proportional to the speed on one end relative to the other end, then the output of the seismic transduceris proportional to the speed of the transducer in an inertial reference frame, i.e., relative to the earth, forinput motion frequencies well above the natural period of the seismic mass. Thus, use of a linear velocitytransducer as the motion measurement transducer in a seismic instrument makes it a “seismic velocitytransducer.” This type of device is called several different names, including seismometer, geophone, andvibrometer, as well as velocity transducer.
The natural frequency and damping in these instruments are selected to match the application. As withan accelerometer, the usable bandwidth depends on these two characteristics. The low-frequency limit forthis type of transducer is dependent on the accuracy required in the measurement. The governing equationis given in Doebelin [3]. As an example, it can be used to show that if an accuracy of 5% is required, thelowest data frequency must be 4.6 times the natural frequency of the transducer, and that the upper datafrequency is not limited. In fact, the higher the upper frequency, the more accurate the results.
Seismometers are used for recording and studying motion from earthquakes, and these devices canbe quite large. Natural periods can be in the range of 10 s to 50 s, and damping is normally selected as0.7 of critical to extend the frequency range as much as possible. Geophones are commonly used for oilwell logging and related work. Their natural periods are in the vicinity of 10 s. Manufacturers of thesedevices include Teledyne Brown Engineering and GeoSpace Corporation of Houston, TX.
16.3 Velocity: Angular
Measurement of angular velocity is often applied to rotating machinery such as pumps, engines, andgenerators. The most familiar unit of measurement in rotating machinery applications is revolutions perminute (rpm). In most cases, the measurement of rpm involves the generation of a pulse train or sinewave whose frequency is proportional to angular velocity. The measuring technologies using pulse trainsand waves include ac and dc generator tachometers, optical sensors, variable reluctance sensors, rotatingmagnet sensors, Wiegand effect sensors, stroboscopy, etc.
These types of measurements are taken with respect to the base of the item being measured. They arerelative measurements because one is measuring the motion between two bodies.
Another class of measurement problem is that of moving or inertial bodies. In this case, a measurementof absolute motion is performed. Some fixed reference must be stated or implied. This reference is oftenthe Earth. A universal reference is sometimes required for celestial measurements. These inertial mea-surements are typically taken with gyroscope-type devices.
Relative: Tachometer
Electrical (dc and ac) Tachometer Generator
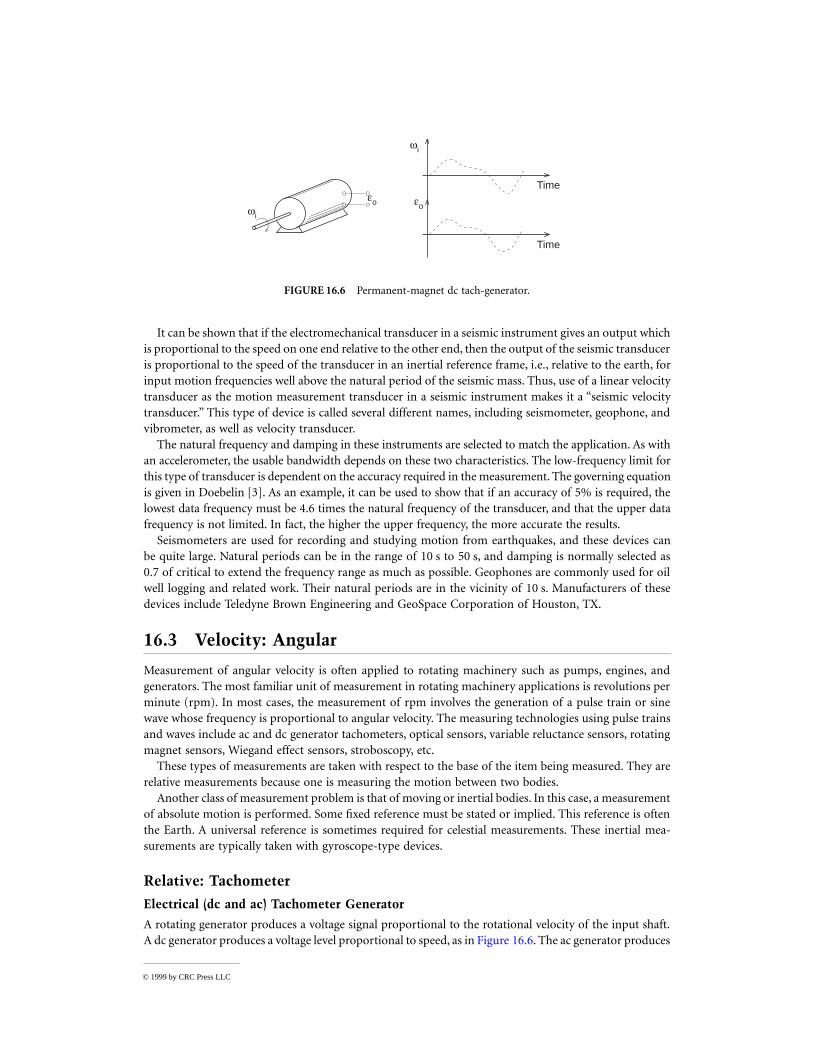
A rotating generator produces a voltage signal proportional to the rotational velocity of the input shaft.A dc generator produces a voltage level proportional to speed, as in Figure 16.6. The ac generator produces
FIGURE 16.6
Permanent-magnet dc tach-generator.
Time
Time
wi
wi
eo eo

an ac voltage output with a frequency proportional to rotational speed, as shown in Figure 16.7. In asimple two-phase motor, the ac voltage is applied to one phase of the motor and the measurement istaken off the other. Typical operating frequencies are 60 Hz and 400 Hz. This carrier frequency shouldbe 5 to 10 times the required frequency response of the ac generator tachometer. The direction of travelis determined by the phase of the signal with opposite directions being 180
°
out of phase. The basic dcgenerator is shown in Figure 16.8.
Sources of tachometer generators include the GE Company of Fairfield, CT; Kollmorgen MotionTechnologies Group of Radford, VA; Sierracin/Magnedyne of Vista, CA; and Micro Mo Electronics ofClearwater, FL.
Counter Types
An entire class of angular velocity measuring techniques exists that uses pulses generated by electrome-chanical interaction. The common thread is a pulse-to-voltage converter giving a voltage output propor-tional to velocity.
Rotating Magnet Sensors
: Passive speed sensors convert mechanical motion to ac voltage without anexternal power source. These self-contained magnetic sensors produce a magnetic field that, when in theproximity of ferrous objects in motion, generates a voltage.
When a magnetic sensor is mounted in the proximity of a ferrous target, such as gear teeth on arotating shaft, the voltage output frequency is directly proportional to the rotational speed of the target.A frequency-to-voltage converter can then convert the signal to a voltage. An engineering unit conversionfrom voltage to velocity then provides an actual velocity measurement.
Typical applications for these types of sensors include:
FIGURE 16.7
Ac tach-generator.
FIGURE 16.8
Generated electromotive force. Moving conductor.
Time
Time
eowi
eex (a-c)
eo (a-c) 180°phase shift
a
N
R
b
Sf
© 1999 by CRC Press LLC

© 1999 by CRC Press LLC
Transmission speedEngine rpmOver/under speedWheel speedPump shaft speedMultiple engine synchronizationFeedback for speed controlCrankshaft position/engine timingComputer peripheral speeds
The typical specifications for magnetic speed sensors are given by a graph of output voltage versussurface speed in inches per second, as in Figure 16.9.
Sources for magnetic sensors include Smith Systems of Brevard, NC; Optek Technology of Carrolton,TX; Allied-Signal of Morristown, NJ; and Baluff of Florence, KY.
Optical Sensors
Optical methods of angular velocity detection employ a light emitter and a light detector. A light-emittingdiode (LED) paired with a light-sensitive diode is the most common arrangement.
A slotted disk is placed in the axis of a rotating shaft. Each slot or slit will allow the light to passthrough the disk. Figure 16.10 shows a typical arrangement. The detector will generate a pulse train witha rate proportional to the angular velocity.
FIGURE 16.9
Magnetic speed sensor output voltage vs. speed. (Courtesy: Smith Systems, Inc., Brevard, NC.)
FIGURE 16.10
A slotted disk provides one pulse output for each rotation.
Light Detector Light Source
Rotating Disk
v
t

© 1999 by CRC Press LLC
The effects of external light sources must be considered in the application of optical sensors.Sources of optical sensor systems include Scientific Technologies of Fremont, CA; Banner Engineering
Corp. of Minneapolis, MN; and Aromat Corp. of New Providence, NJ.
Hall Effect
The Hall effect describes the potential difference that develops across the width of a current-carryingconductor. E.H. Hall first used this effect in 1879 to determine the sign of current carriers in conductors.Hall effect devices are finding their way into many sensing applications. A typical Hall effect sensorapplication is the wheel speed sensor for antilock braking systems in automobiles. The Allegro ATS632LSCgear-tooth sensor, shown in Figure 16.11, is an optimized Hall-effect IC/magnet combination. The sensorconsists of a high-temperature plastic shell that holds together a compound samarium–cobalt magnet,a single-element self-calibrating Hall effect IC, and a voltage regulator. The operation of this circuit isshown in Figure 16.12.
Wiegand Effect
The Wiegand effect is useful for proximity sensing, tachometry, rotary shaft encoding, and speed sensingin applications such as:
Electronic indexing for water, gas, and electric meters and remote metering systemsMeasuring shaft speed in engines and other machineryTachometers, speedometers, and other rotational counting devices
Wiegand effect technology employs unique magnetic properties of specially processed, small-diameterferromagnetic wire. By causing the magnetic field of this wire to suddenly reverse, a sharp, uniformvoltage pulse is generated. This pulse is referred to as a Wiegand pulse. Sensors utilizing this effect requireonly a few simple components to produce sharply defined voltage pulses in response to changes in theapplied magnetic field. These sensors consist of a short length of Wiegand wire, a sensing coil, andalternating magnetic fields that generally are derived from small permanent magnets.
The major advantages of the Wiegand effect based sensors are:
No external power requirementTwo-wire operationNoncontact with no wear20 kHz pulse rateHigh-level voltage output pulseWide operating temperature range (e.g., –40
°
C to +125
°
C)
FIGURE 16.11
Hall-effect gear tooth sensor. (Courtesy: Allegro Microsystems, Inc., Worcester, MA.)

© 1999 by CRC Press LLC
When an alternating magnetic field of proper strength is applied to the Wiegand wire, the magneticfield of the core switches polarity and then reverses, causing the Wiegand pulse to be generated, as shownin Figure 16.13. The magnetic switching action of the Wiegand wire induces a voltage across the pickupcoil of approximately 10
µ
s duration. These alternating magnetic fields are typically produced by magnetsthat are affixed to the rotating or moving equipment, by a stationary read head and moving Wiegandwires, or by an alternating current generated field.
Absolute: Angular Rate Sensors
Gyroscopes
Many absolute angular rate-measuring devices fall under the designation of gyroscope. A mechanicalgyroscope is a device consisting of a spinning mass, typically a disk or wheel, mounted on a base so thatits axis can turn freely in one or more directions and thereby maintain its orientation regardless of anymovement of the base. It is important to make an initial distinction between angular velocity gyros andrate-integrating gyros. Angular velocity gyros are used to measure motion and as signal inputs tostabilization systems. Rate-integrating gyros are used as the basis for highly accurate inertial navigationsystems. They allow a stable platform to maintain a fixed attitude with reference. These devices can bevery complex. Three gyros are often teamed with three double-integrated accelerometers to provide anaccurate measurement of absolute vehicle motion.
Ricardo Dao of Humphrey Inc. provided an excellent comparison of angular rate sensors in an articlein
Measurements & Control
[14]. The five different technologies are summarized below.
FIGURE 16.12
Hall-effect gear tooth sensor circuit. (Courtesy: Allegro Microsystems, Inc., Worcester, MA.)
FIGURE 16.13
Small magnets cause sudden rever-sal in the ferromagnetic wire in a Wiegand sensor.(Courtesy: HID Corporation, North Haven, CT.)

© 1999 by CRC Press LLC
Spinning mass
: The traditional gyro consists of a spinning wheel in a gimbaled frame. The principleof conservation of angular momentum provides the measurement tool.
Fluidic
: A stream of helium gas flows past two thin tungsten wires [14]. The tungsten wires act as twoarms of a Wheatstone bridge. At rest, the gas flow cools the sensing wires equally and the transducer bridgeis balanced with zero output. When angular motion is applied to the sensor, one sensor wire will be subjectedto increased flow while the other will see less flow. The resistance of the two wires will change and the bridgewill be unbalanced. The sensor will produce a voltage output proportional to the angular velocity.
A pump is used to circulate the helium gas. This pump is a piezoelectric crystal circular disk that isexcited with an external circuit. The pump produces a laminar flow of relatively high-velocity gas acrossthe two parallel sensing wires.
Piezoelectric vibration
: A number of angular velocity sensors have been developed that use microma-chined quartz elements. A number of shapes are used, but the operating principle is similar for each.The quartz element vibrates at its natural frequency. Angular motion causes a secondary vibration that,when demodulated, is proportional to angular vibration. A description of one design follows.
The QRS and GyroChip™ family of products uses a vibrating quartz tuning fork to sense angularvelocity [15, 16]. Using the Coriolis effect, a rotational motion about the sensor’s longitudinal axisproduces a dc voltage proportional to the rate of rotation. Figure 16.14 shows that the sensor consists ofa microminiature double-ended quartz tuning fork and supporting structure, all fabricated chemicallyfrom a single wafer of monocrystalline piezoelectric quartz (similar to quartz watch crystals).
Use of piezoelectric quartz material simplifies the active element, resulting in exceptional stability overtemperature and time. The drive tines, being the active portion of the sensor, are driven by an oscillatorcircuit at a precise amplitude, causing the tines to move toward and away from each another at a highfrequency.
Each tine will have a Coriolis force acting on it of: {
F
= 2
m
W
i
×
V
r
} where the tine mass is
m
, theinstantaneous radial velocity is
V
r
, and the input rate is
W
i
. This force is perpendicular to both the inputrate and the instantaneous radial velocity.
The two drive tines move in opposite directions, and the resultant forces are perpendicular to theplane of the fork assembly and in opposite directions. This produces a torque that is proportional to the
FIGURE 16.14
A vibrating quartz tuning fork uses the Coriolis effect to sense angular velocity. (Courtesy: BEISensors and Systems Co., Concord, CA.)

© 1999 by CRC Press LLC
input rotational rate. Since the radial velocity is sinusoidal, the torque produced is also sinusoidal at thesame frequency of the drive tines, and in-phase with the radial velocity of the tine.
The pickup tines, being the sensing portion of the sensor, respond to the oscillating torque by movingin and out of plane, producing a signal at the pickup amplifier. After amplification, those signals aredemodulated into a dc signal that is proportional to the rotation of the sensor.
The output signal of the GyroChip™ reverses sign with the reversal of the input rate since the oscillatingtorque produced by the Coriolis effect reverses phase when the direction of rotation reverses. TheGyroChip™ will generate a signal only with rotation about the axis of symmetry of the fork; that is, theonly motion that will, by Coriolis sensing, produce an oscillating torque at the frequency of the drivetines. This also means that the GyroChip™ can truly sense a zero rate input.
MHD effect
: The magnetohydrodynamic angular rate sensor is used to measure angular vibrations inthe frequency range of 1 Hz to 1000 Hz. It is used where there is a high shock environment and a highrate of angular motion such as 10 to 250 rad s
–1
. It does not measure a constant or dc velocity. It is usedto measure impacts shorter than 1 s duration and vibrations between 1 Hz and 1000 Hz.
The principle of operation is illustrated in Figure 16.15 [17, 18]. A permanent magnet is attached tothe outer case of the sensor. When the case turns, a moving magnetic field is produced (
B
). There is alsoa conductive fluid inside the sensor. When the sensor case turns, the fluid tends to stay in one place,according to Newton’s first law. This produces a relative motion (
U
) between a magnetic field andconductor. This motion will produce a voltage (
E
) across the conductor proportional to relative velocityaccording to Faraday’s law.
Since the fluid is constrained to move in an angular path, the voltage signal will be proportional toangular velocity about the center axis of the sensor. Due to this constraint, the sensor is insensitive tolinear motion. The voltage signal is amplified through a transformer or an amplifier for output to ameasuring device.
Fiber optic/laser
: A beam of light is directed around the axis of rotation. A phase shift of the optical orlaser beam is detected to measure angular velocity. The principle of operation is similar to the Doppler shift.
Differenced and integrated accelerometers
: An array of accelerometers can be used to measure angularmotion. The output of the accelerometers is differenced when they are aligned, or summed when theyare mounted in opposite directions. This differencing will eliminate the linear component of motion. Asshown in Figure 16.16, the magnitude of the differenced signals,
a
1
and
a
2
, is divided by the distancebetween the two sensors,
l
. This gives a measure of angular acceleration. The angular acceleration isintegrated over time to give angular velocity. It is important to address the same concerns in this processas when integration was discussed in the linear section. It is assumed that there is a rigid mountingstructure between the two accelerometers.
This technique is commonly applied to crash testing of anthropomorphic test devices (ATDs). TheATDs are used in automotive crash testing and aerospace egress system testing.
FIGURE 16.15
Magnetohydrodynamic angular rate sensor. (Courtesy: ATA Sensors, Albuquerque, NM.)

© 1999 by CRC Press LLC
16.4 Conclusion
But alas, as Poincaré [20] stated, there is no way to determine absolute velocity.
References
1. J. W. Dally, W. F. Riley, and K. G. McConnell, Instrumentation for Engineering Measurements, NewYork: John Wiley & Sons, 1984.
2. A. Hudson and R. Nelson, University Physics, New York: Harcourt Brace Jovanovitch, 1982.3. E. O. Doebelin, Measurement Systems, 4th ed., New York: McGraw-Hill, 1990.4. Trans-Tek, Inc., [Online], 1998. Available http://transtekinc.com/lvt.htm5. L. M. Barker and R. E. Hollenbach, Laser interferometer for measuring high velocities of any
reflecting surface, J. Appl. Phys., 43(11), 1972.6. Valyn International, [Online], 1998. Available www.valynvisar.com7. L. C. Rodman, J. H. Bell, and R. D. Mehta, A 3-component laser-doppler velocimeter data acqui-
sition and reduction system, NASA contractor report; NASA CR-177390.8. E. A. Loew, Direct and Alternating Currents, 3rd edition, New York: McGraw-Hill, 1946.9. P. Emerald, Low duty cycle operation of hall effect sensors for circuit power conservation, Sensors,
15(3), 1998.10. Allegro MicroSystems, Inc., [Online], 1998. Available http://www.allegromicro.com/11. The Hall effect sensor: basic principles of operation and application, Sensors, May 1988.12. J. B. Scarborough, The Gyroscope: Theory and Applications, New York: Interscience, 1958.13. R. F. Deimel, Mechanics of the Gyroscope: The Dynamics of Rotation, New York: Dover Publications,
1950.14. E. Dao, Fluidic angular rate sensors, Measurements & Control, February 1994, 126-131.15. Systron Donner Inertial Division, [Online], 1998. Available http://www.systron.com16. S. Orloski and B. Zimmerman, Dead reckoning in an emergency vehicle location system using a
quartz rotation sensor and GPS, Proc. Sensor Expo, Chicago, IL, September 1995, Peterborough,NH: Helmers Publishing, 1995.
17. G. Kulikovskiy and G. A. Lyubimov, Magnetohydrodynamics, Reading, MA: Addison-Wesley, 1965.18. Applied Technology Associates, [Online], 1998. Available http://www.aptec.com/bus-opp.html19. G. Unger et al., NASA’s first in-space optical gyroscope: a technology experiment on the X-ray
timing Explorer spacecraft, NASA technical memorandum; 109242.20. R.P. Feynman, R.B. Leighton, and M. Sands, The Feynman Lectures on Physics, Reading, MA:
Addison-Wesley, 1963, 15-5.
FIGURE 16.16 Angular acceleration by differ-encing accelerometers and integration.
a1 a2
ω+
-
ll
l
∫
∫ω =a1 - a2 dt
l