venture capital and banks. financing innovation in italy · venture capital and banks. financing...
TRANSCRIPT
DRAFT
Venture capital and banks.
Financing innovation in Italy
Valerio Vacca1
(this version: January 2013; please do not quote)
Abstract Using a unique dataset, this paper investigates two interconnected questions: whether
Italian venture capital funds actually finance small and innovative firms which can
not be easily assisted by banks and whether they play, on behalf of these firms, a
scouting role towards the banking system. The main findings are that investments by
these specialised investors are only in part devoted to young, small firms from ad-
vanced industries, have a rather short duration and are weakly focused on a few
firms or sectors. Furthermore, young innovative firms receiving private equity capital
are usually also financed by banks, both at the start and the end of the investment,
and the fund’s commitment tends to only weakly reduce the cost of credit. Overall,
an ‘equity-then-credit’ sequence does not clearly emerge in financing strategies of
young and high-tech Italian firms, suggesting that funds play a weak signalling task
towards the banking system.
JEL classification: G21, G24, G28, G32. Keywords: venture capital, SMEs, innovation financing.
1 Bank of Italy, Bari branch, Economic Research Division ([email protected]).
Create PDF files without this message by purchasing novaPDF printer (http://www.novapdf.com)
2
1 Introduction2
Venture capital (VC) is acknowledged to be a key factor for the competitiveness of a coun-try’s entrepreneurial system as it affects the growth of its most dynamic parts. VC funds are mutual private equity funds which receive capital contributions from investors and supply them to small, young, high-technology companies with high growth potential. They are specialized investors which monitor the target firm’s management and participate in strate-gic decision-making. VC funds should provide external finance to firms which are normally excluded from credit market, owing to the characteristics of their business, especially the relative high risk and the lack of credit history; at the same time, the support given by the VC should facilitate the firms’ access to other sources of financing, primarily bank credit, for subsequent expansion.
In spite of its importance, comprehensive evidence on the role played by the VC in-dustry is still insufficient. This is particularly true for the Italian market.
This study tries to fill informative gaps about Italian VC funds addressing two related questions. First, do Italian VC funds actually provide financial support to a crucial segment of firms which can not be easily assisted by banks? Second, when funds target young inno-vative firms, what happens to the financial structure of the targets? The first question en-tails examining the features of investments carried out by VC funds, possibly according to the ownership of the fund (independent, public, or bank-affiliated). The second question will be tackled in particular by assessing whether the fund introduces target firms to the credit market.
The main contribution of the paper is to use fund- and firm-level data which have not yet been employed to describe the VC industry, namely the mandatory reports to the Bank of Italy from financial firms managing the private equity (PE) funds (including VC funds) and the credit data from the Central Credit Register. These data provide a thorough por-trait of the financial operations towards young innovative Italian firms. Previous studies in the field, by contrast, rely on information retrieved through questionnaires submitted to the market players, or through hand-collected data sets.
The rest of the paper is organised as follows. Paragraph 2 briefly surveys the related lit-erature; after a description, in paragraph 3, of the main features of the data employed, para-graph 4 addresses the first question above, describing stylized facts about the VC funds’ in-vestments. Paragraph 5 focuses on the second question, looking at financial structure of innovative firms which obtain external equity in their early stages. Paragraph 6 concludes and suggests future research.
2 The opinions are those of the author and do not involve the Bank of Italy. I am greatly indebted to Maria Lucia Stefani, Andrea Bonaccorsi, Roberto del Giudice, Francesco Franceschi, Giovanni Fusaro, Silvia Magri, Vincenza Marzovillo and participants to two Bank of Italy workshops (September and December 2012) for useful comments, while retaining the responsibility for residual errors.
Create PDF files without this message by purchasing novaPDF printer (http://www.novapdf.com)
3
2 Related literature
Venture capital and in general private equity have been extensively studied in recent years, within the wider framework of the financing of innovative ventures: small innovative firms show a persistent lack of external finance and higher costs of funding, even in financial sys-tems endowed with well-developed venture capital operations (Hall, 2010).
The literature dealing with the features of the VC funds investments has tackled two main issues, the degree of specialization/diversification of their portfolio, and the impact of the fund’s ownership on its operations.
Under the first respect, specialization on a few sectors or industries apparently triggers a higher success rate for target firms, and therefore a better funds’ performance (Cressy et al., 2012; Gompers et al., 2009); excessively diversified funds, in fact, might be unable to ef-fectively monitor target firms due to limited attention. However, Knill (2009) shows that a pure specialization strategy is not necessarily superior to a pure diversification one, as the ability to diversify risk is crucial to the VC effectiveness. Within this framework, paragraph 4 of the paper will deal with the degree of specialization by sectors and concentration by firms of the portfolios of Italian funds.
Heterogeneities also stem from the institutional set-up of funds (independent or cap-tive, the latter having a corporate, public or banking ownership). Fund’s ownership can af-fect the type of targeted firms, the duration or size of the investment. Tykvová (2006) looks at almost 200 PE operations on the German market and finds that, compared to captive ones, independent managers turn out to be more activist in managerial advice towards tar-get companies. Bottazzi et al. (2008) also show that independent funds manage more active-ly their investments and their firms perform better. This leads private funds to be rather focussed of a few industries or firms (Cumming, 2006). According to Andrieu and Groh (2012) an entrepreneur decides to recur to an independent rather than a bank-owned VC fund by trading off the stronger expertise of independent funds against the larger financial capacity of bank-affiliated funds: the latter capacity allows bank-affiliated funds to support the expansion phases of the firm through several rounds of staged financing and to avoid premature divestment forced by the fund’s need to raise fresh funds.
The fund’s ownership, in other words, can affect investment duration, which can also be driven by the firm stage at the time of first investment (Cumming and MacIntosh, 2001). Private funds might have incentives to exit rapidly their investments, both in order to pursue a grandstanding strategy (i.e. to signal to the market a high success rate of their initiatives) and to recover liquidity, since they exclusively rely on funds provided by private investors. Their holding periods would therefore be shorter than for other funds (Gom-pers, 1995). Paragraph 4 will contribute to this literature by singling out the features of portfolios held by differently owned funds.
The link between equity provision to start-up firms (venture capital) and bank financ-ing, which is crucial to this paper, is a still underexplored topic. The focus has traditionally been on the pros and cons of the two forms of financing within the single stage of firm devel-opment. Bank credit might not be consistent with the risk/return profile of an investment
Create PDF files without this message by purchasing novaPDF printer (http://www.novapdf.com)
4
into start-up firms, in particular those operating in high-tech sectors. The typical hindranc-es to bank-borrower relationships (information asymmetries, agency costs, moral hazard) are exacerbated for these firms, which therefore often turn out to be financially constrained (Freel, 2007). These issues are of paramount importance in Italy, where innovation report-edly suffers from stronger constraints than in other countries, and where the banking sys-tem plays a pivotal role in firm financing (Bugamelli et al., 2012). Micucci and Rossi (2012) show that innovation in Italy is fostered by a stable bank-firm relationship, which of course is often out of reach for recently set-up firms.
Based on data about Italian, German and British SMEs, Berger and Schaeck (2011) show that firms address venture capitalists in order to take advantage from greater manag-ers’ expertise compared to multiple banking relationship and perhaps to avoid rent extrac-tion by the main bank. By contrast, according to Ueda (2004) venture capitalists threaten to expropriate the entrepreneur, obliged to disclose projects during the screening phases.
Recent studies investigate the links between credit and VC in subsequent stages of firm growth. A stream of literature explicitly addresses the exploitation of a sequence in the fi-nancing sources, whereby investor’s incentives can lead to strategic behaviours. Hellman et al. (2008) is a pivotal paper in this field: their ‘relationship hypothesis’ states that bank-affiliated VC funds might finance through capital small innovative firms, with a view to building up early relationships. The latter will be exploited through credit extension by group’s banks, in later stages of firm’s life. Therefore, the signalling effect from the VC fund towards the banking system would mainly take place in favour of banks within the same financial group. This relationship hypothesis helps rationalizing from a strategic point of view the pecking order in the sources of financing which is often found in a firm’s life stages.
Summing up, venture capital and banks can coexist within each phase of firm devel-opment, or be mutually exclusive, or else build a natural sequence which supports the young innovative firm during its growth (equity, then bank credit). Paragraph 5 will try to shed light on the issue, looking at the frequency of these three alternatives in the Italian case, with specific attention to intra-group strategies, following Hellman et al. (2008).
The VC-related literature, which is rich for the US market, is also growing for Europe-an market. European VC funds seem to be rather conservative in their investment strate-gies (Revest and Sapio, 2008). The reports from the VICO project have investigated the impact of venture capital on innovation rate, employment creation, growth and competi-tiveness of innovative firms (VICO, 2011). VICO studies take into account the funds’ insti-tutional setting and deal with endogeneity issues, as it is required in this kind of quantitative analysis (see e.g. Puri and Zarutskie, 2010): firms recurring to the VC investment might have ex ante features which make them different from other firms and which are linked to their subsequent performance (Bertoni et al., 2011). Bertoni et al. (2008) point to the posi-tive effects of the fund intervention in the investment activity by the target firms, but show that firms receiving funds by a corporate VC fund keep being constrained by the availabil-ity of internally generated resources.
Create PDF files without this message by purchasing novaPDF printer (http://www.novapdf.com)
5
Against this landscape, this study will focus on the Italian market. Bank of Italy (2009) provides a picture of the Italian private equity industry using a questionnaire submitted to target firms and financial intermediaries, jointly with AIFI (the Italian private equity and venture capital association): against the background of a high frequency of expansion and buy-out operations, genuine venture capital seems to be relatively underdeveloped in Italy; compared to other markets, contracts are less sophisticated, in particular in addressing the profit-sharing agreements between the investor and the investee, and investor’s technical expertise about the sector of the target firm is weaker than in other countries. Granturco and Miele (2011) also focus on Italian PE, by means of a questionnaire submitted to fund managers, and gauge the financial fragility of target firms through balance sheet data.
3 The data
Data employed in this study are primarily retrieved from reports that firms managing Ital-ian closed-end funds must submit to the supervisory authority (the Bank of Italy) on a half-yearly basis.3 The value of this data base stems from the fact that it virtually encompasses all the stakes in a firm held by the Italian PE funds (including the VC funds).
Supervisory reports from fund managers can be jointly analysed with other firm-level information on target firms, namely that from the Italian central balance sheet register (Cerved/Cebi), and data on quantity and cost of credit extended to firms by banks and other financial institutions (from the central credit register, CCR, and the Bank of Italy’s survey data on interest rates). The latter sources allow assessing, for the first time about the Italian market, the effects of a VC operation on the subsequent credit history of the target firm.
During the reference period (December 2003 to June 2012), supervisory data report operations by almost 150 funds, out of which about one tenth can be labelled as venture capital funds. In the next paragraph the focus will be on the features of the investments carried out by these ‘venture capital funds’, compared to investments by ‘other private equity funds’.
However, any such classification is partial and incomplete: some PE funds not labelled as VC funds carry out typical VC investments, albeit on a non-systematic basis. By contrast, as it will become apparent in the next paragraph, VC-labelled funds devote part of their portfolios to non-VC operations, holding stakes in non high-tech, non small or non young companies. In paragraph 5, therefore, attention will switch to the financing of innovative firms in their early stage (seed or start-up) carried out by closed-end Italian funds: these operations can be considered ‘venture capital investments’ from a substantial point of view, re-gardless of the involved investor (i.e. a VC-labelled or a non-VC-labelled fund).
3 For references see the methodological appendix.
Create PDF files without this message by purchasing novaPDF printer (http://www.novapdf.com)
6
4 Where do Italian venture capital funds invest on?
The first question to be tackled is whether Italian VC funds actually address a segment of firms (young, innovative SMEs) which are hardly supported by banks.
Based on AIFI reports, in particular on the yearly Venture Capital Monitor (AIFI, various years), it is possible to identify funds specifically devoted to venture capital. These VC-labelled funds and the other PE funds have been sorted into sub-groups according to the ownership of the capital of their managing firm.4
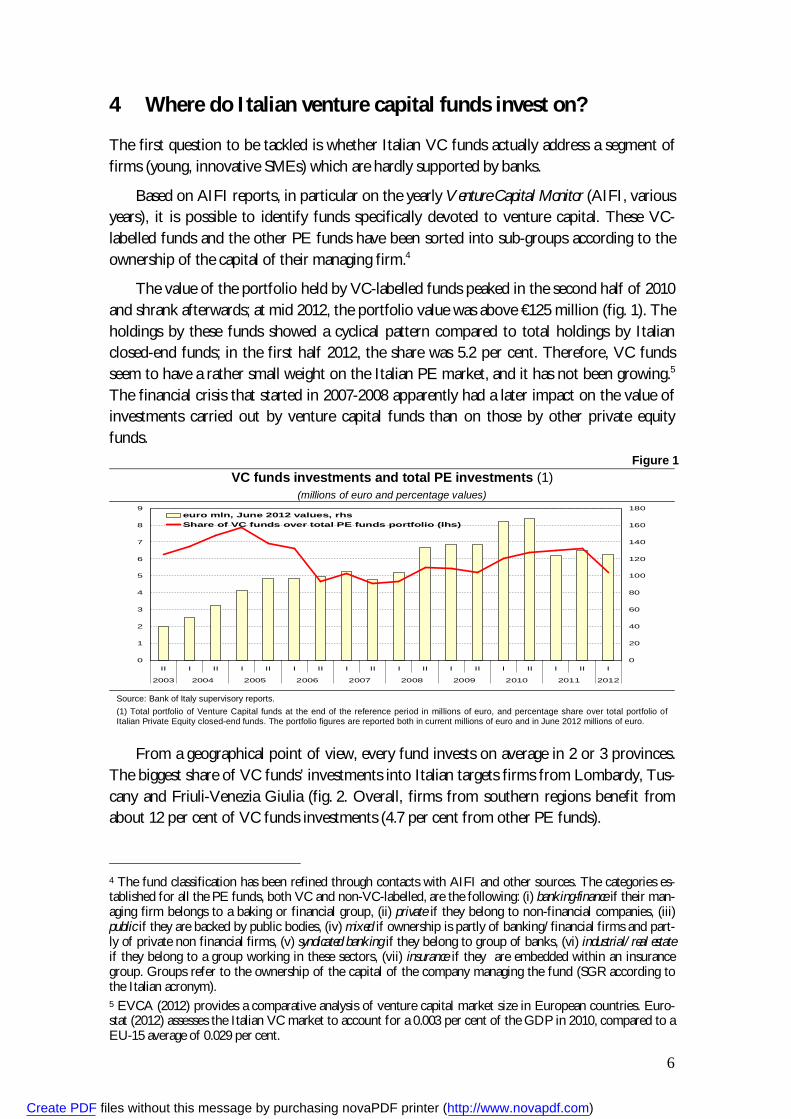
The value of the portfolio held by VC-labelled funds peaked in the second half of 2010 and shrank afterwards; at mid 2012, the portfolio value was above €125 million (fig. 1). The holdings by these funds showed a cyclical pattern compared to total holdings by Italian closed-end funds; in the first half 2012, the share was 5.2 per cent. Therefore, VC funds seem to have a rather small weight on the Italian PE market, and it has not been growing.5 The financial crisis that started in 2007-2008 apparently had a later impact on the value of investments carried out by venture capital funds than on those by other private equity funds.
Figure 1 VC funds investments and total PE investments (1)
(millions of euro and percentage values)
0
1
2
3
4
5
6
7
8
9
II I II I II I II I II I II I II I II I II I
2003 2004 2005 2006 2007 2008 2009 2010 2011 2012
0
20
40
60
80
100
120
140
160
180euro mln, June 2012 values, rhsShare of VC funds over total PE funds portfolio (lhs)
Source: Bank of Italy supervisory reports. (1) Total portfolio of Venture Capital funds at the end of the reference period in millions of euro, and percentage share over total portfolio of Italian Private Equity closed-end funds. The portfolio figures are reported both in current millions of euro and in June 2012 millions of euro.
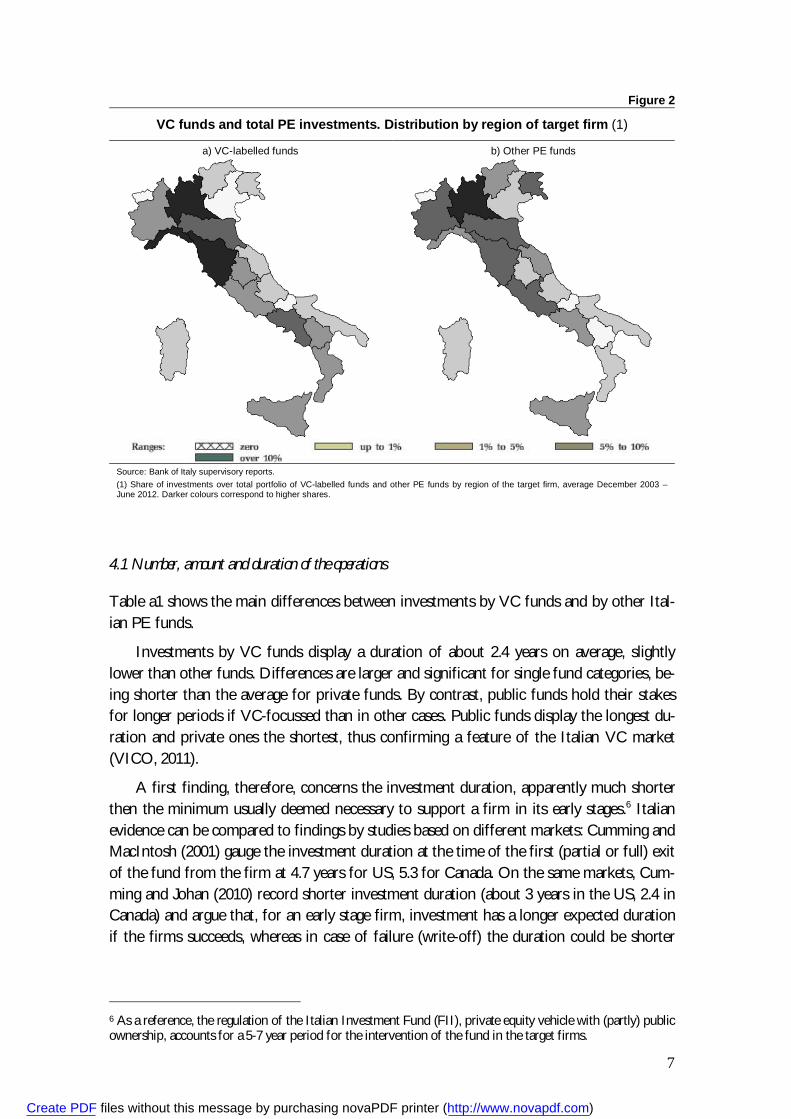
From a geographical point of view, every fund invests on average in 2 or 3 provinces. The biggest share of VC funds’ investments into Italian targets firms from Lombardy, Tus-cany and Friuli-Venezia Giulia (fig. 2. Overall, firms from southern regions benefit from about 12 per cent of VC funds investments (4.7 per cent from other PE funds).
4 The fund classification has been refined through contacts with AIFI and other sources. The categories es-tablished for all the PE funds, both VC and non-VC-labelled, are the following: (i) banking-finance if their man-aging firm belongs to a baking or financial group, (ii) private if they belong to non-financial companies, (iii) public if they are backed by public bodies, (iv) mixed if ownership is partly of banking/financial firms and part-ly of private non financial firms, (v) syndicated banking if they belong to group of banks, (vi) industrial/real estate if they belong to a group working in these sectors, (vii) insurance if they are embedded within an insurance group. Groups refer to the ownership of the capital of the company managing the fund (SGR according to the Italian acronym). 5 EVCA (2012) provides a comparative analysis of venture capital market size in European countries. Euro-stat (2012) assesses the Italian VC market to account for a 0.003 per cent of the GDP in 2010, compared to a EU-15 average of 0.029 per cent.
Create PDF files without this message by purchasing novaPDF printer (http://www.novapdf.com)
7
Figure 2
VC funds and total PE investments. Distribution by region of target firm (1)
a) VC-labelled funds b) Other PE funds
Source: Bank of Italy supervisory reports. (1) Share of investments over total portfolio of VC-labelled funds and other PE funds by region of the target firm, average December 2003 – June 2012. Darker colours correspond to higher shares.
4.1 Number, amount and duration of the operations
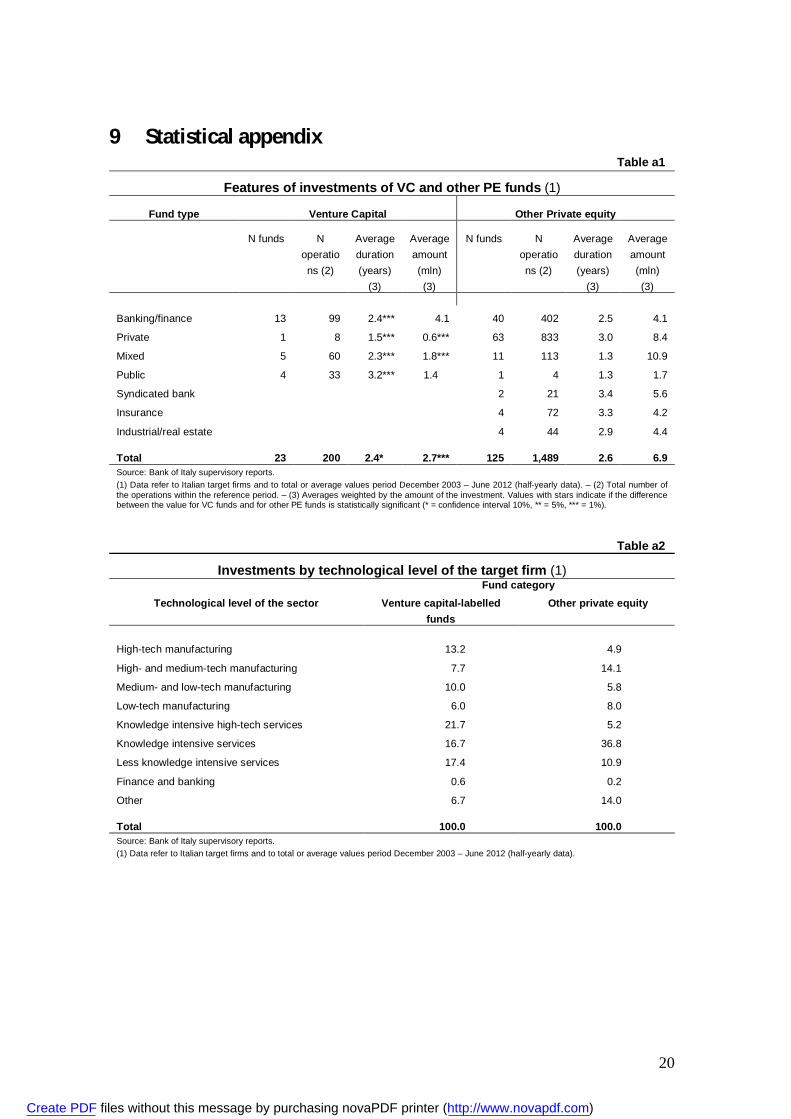
Table a1 shows the main differences between investments by VC funds and by other Ital-ian PE funds.
Investments by VC funds display a duration of about 2.4 years on average, slightly lower than other funds. Differences are larger and significant for single fund categories, be-ing shorter than the average for private funds. By contrast, public funds hold their stakes for longer periods if VC-focussed than in other cases. Public funds display the longest du-ration and private ones the shortest, thus confirming a feature of the Italian VC market (VICO, 2011).
A first finding, therefore, concerns the investment duration, apparently much shorter then the minimum usually deemed necessary to support a firm in its early stages.6 Italian evidence can be compared to findings by studies based on different markets: Cumming and MacIntosh (2001) gauge the investment duration at the time of the first (partial or full) exit of the fund from the firm at 4.7 years for US, 5.3 for Canada. On the same markets, Cum-ming and Johan (2010) record shorter investment duration (about 3 years in the US, 2.4 in Canada) and argue that, for an early stage firm, investment has a longer expected duration if the firms succeeds, whereas in case of failure (write-off) the duration could be shorter
6 As a reference, the regulation of the Italian Investment Fund (FII), private equity vehicle with (partly) public ownership, accounts for a 5-7 year period for the intervention of the fund in the target firms.
Create PDF files without this message by purchasing novaPDF printer (http://www.novapdf.com)
8
than for other investments.7 With reference to Europe, Tykvová (2006) finds similar dura-tions for German market operations.
The shorter duration of VC funds’ investment with respect to ordinary PE operation is to a certain extent an unexpected result, since the financial support should in principle be longer the younger the target venture, in order to gradually overcome the information asymmetries between the firm and the finance provider (Cumming and MacIntosh, 2001). Our data set confirms only in part this hypothesis: the duration of the investment seems to be negatively correlated to the age of the firm at the time of the fund’s intervention (with a -0.44 correlation coefficient, significant at 1 per cent confidence level).
VC funds carry out average investments of about €2.7 million, less than half the aver-age PE operation (the difference is significant). Private funds display the smallest holdings, while mixed and bank-affiliated funds carry out the largest investment, consistently with the more sizable financial resources these funds are usually endowed with. The public VC funds operation stays below the sector average.
Summing up, private fund’s operations are shorter and smaller than the average, con-sistent with the stylised facts found on other markets: privately owned funds have not a captive capital markets to rely upon, and therefore they are likely to divest more rapidly, with a view to recovering financial capability and to certifying to the market a high success rate of their investments (Tykvová, 2006). Banking-finance funds engage in ventures larger than average, as expected, but their commitment is not longer than the average, contrary to what is found on other markets.
4.2 Investing in high-tech industries and in start-up firms
In order to assess to which extent the VC funds portfolio is actually devoted to advanced manufacturing or services, investments have been sorted according to the technological level of the sector to which the target firm belongs, consistently with the OECD taxonomy (see the methodological appendix).
Table a2 shows a stronger focus of VC funds (with respect to other PE funds) towards the more advanced and technological sectors, both in high-tech manufacturing and services firms. however, less knowledge intensive services rank second in VC funds holdings (16.7 per cent). The small presence of VC funds in advanced manufacturing, compared to ser-vices, is consistent with anecdotal opinions by Italian industry players such as start-up in-cubators, science parks, business angels.
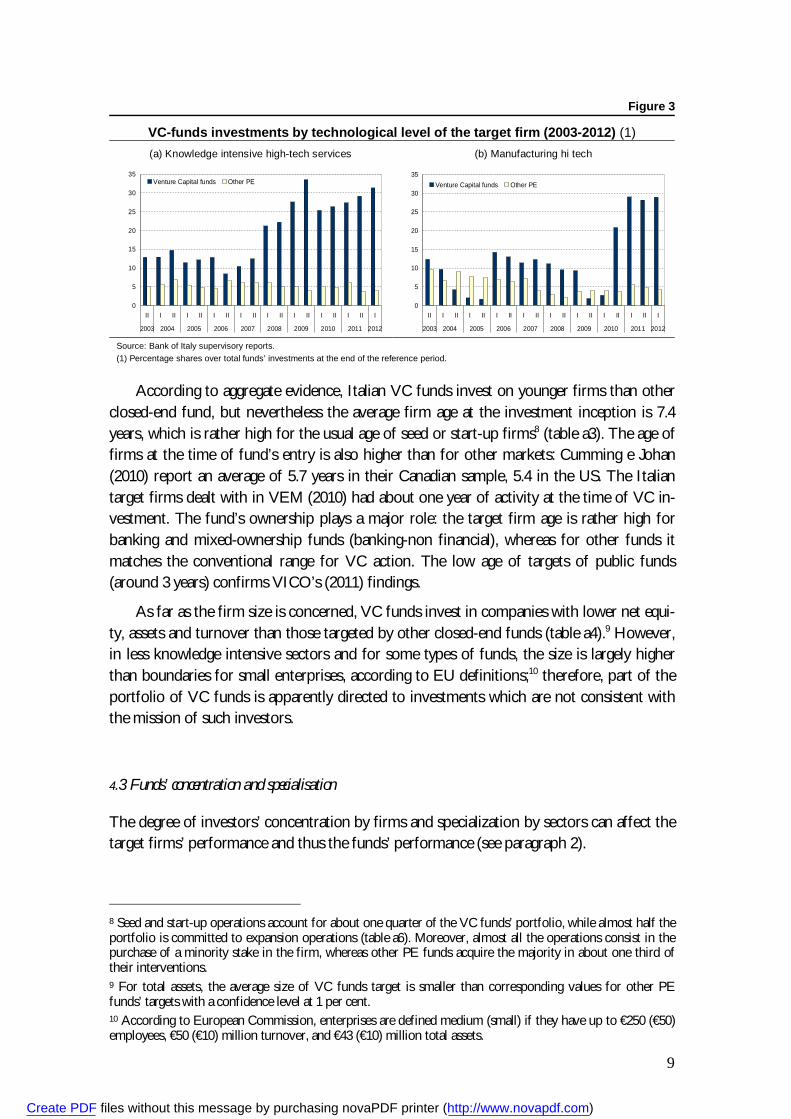
The focus of the VC funds towards the innovative and technological sectors changed over time (fig. 3). Only in mid-2009 the investments into high-tech services rose above one third of the overall portfolio; at mid-2012 they accounted for over 40 per cent. The share directed to high-tech manufacturing reached a sizable share only after mid-2010.
7 The data set used in this study records all the investments, including those with a rapid adverse outcome.
Create PDF files without this message by purchasing novaPDF printer (http://www.novapdf.com)
9
Figure 3
VC-funds investments by technological level of the target firm (2003-2012) (1) (a) Knowledge intensive high-tech services (b) Manufacturing hi tech
0
5
10
15
20
25
30
35
II I II I II I II I II I II I II I II I II I
2003 2004 2005 2006 2007 2008 2009 2010 2011 2012
Venture Capital funds Other PE
0
5
10
15
20
25
30
35
II I II I II I II I II I II I II I II I II I
2003 2004 2005 2006 2007 2008 2009 2010 2011 2012
Venture Capital funds Other PE
Source: Bank of Italy supervisory reports. (1) Percentage shares over total funds’ investments at the end of the reference period.
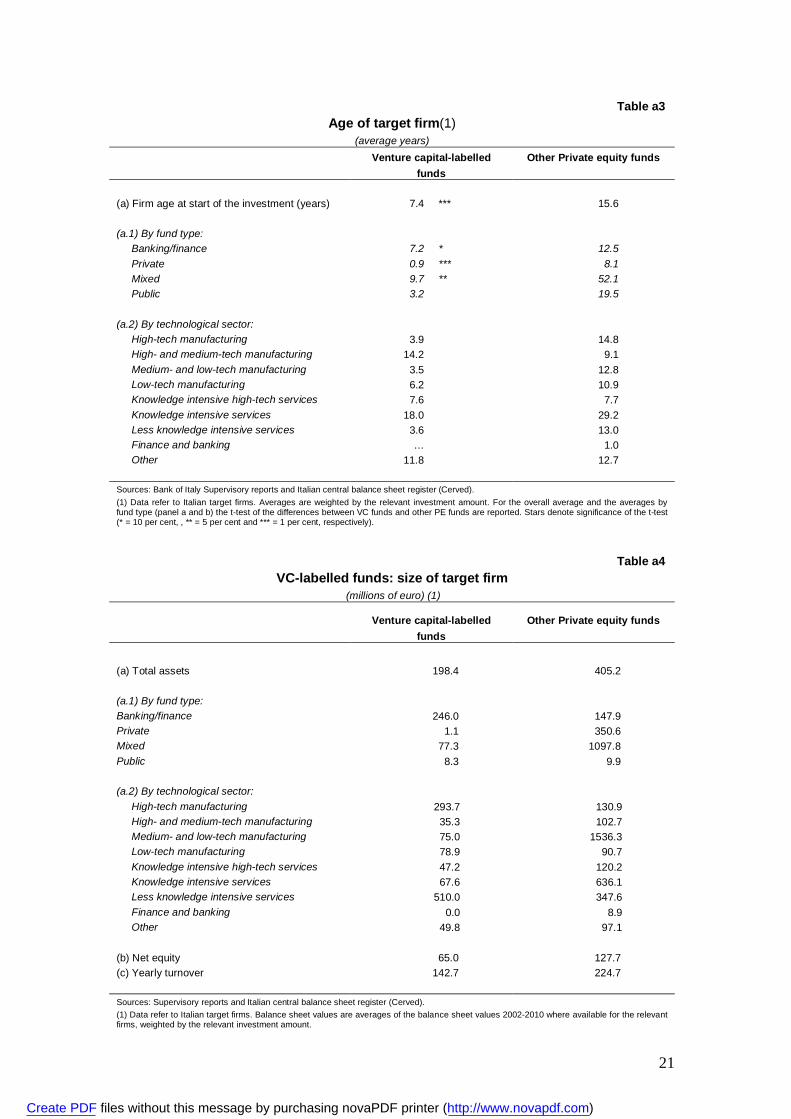
According to aggregate evidence, Italian VC funds invest on younger firms than other closed-end fund, but nevertheless the average firm age at the investment inception is 7.4 years, which is rather high for the usual age of seed or start-up firms8 (table a3). The age of firms at the time of fund’s entry is also higher than for other markets: Cumming e Johan (2010) report an average of 5.7 years in their Canadian sample, 5.4 in the US. The Italian target firms dealt with in VEM (2010) had about one year of activity at the time of VC in-vestment. The fund’s ownership plays a major role: the target firm age is rather high for banking and mixed-ownership funds (banking-non financial), whereas for other funds it matches the conventional range for VC action. The low age of targets of public funds (around 3 years) confirms VICO’s (2011) findings.
As far as the firm size is concerned, VC funds invest in companies with lower net equi-ty, assets and turnover than those targeted by other closed-end funds (table a4).9 However, in less knowledge intensive sectors and for some types of funds, the size is largely higher than boundaries for small enterprises, according to EU definitions;10 therefore, part of the portfolio of VC funds is apparently directed to investments which are not consistent with the mission of such investors.
4.3 Funds’ concentration and specialisation
The degree of investors’ concentration by firms and specialization by sectors can affect the target firms’ performance and thus the funds’ performance (see paragraph 2).
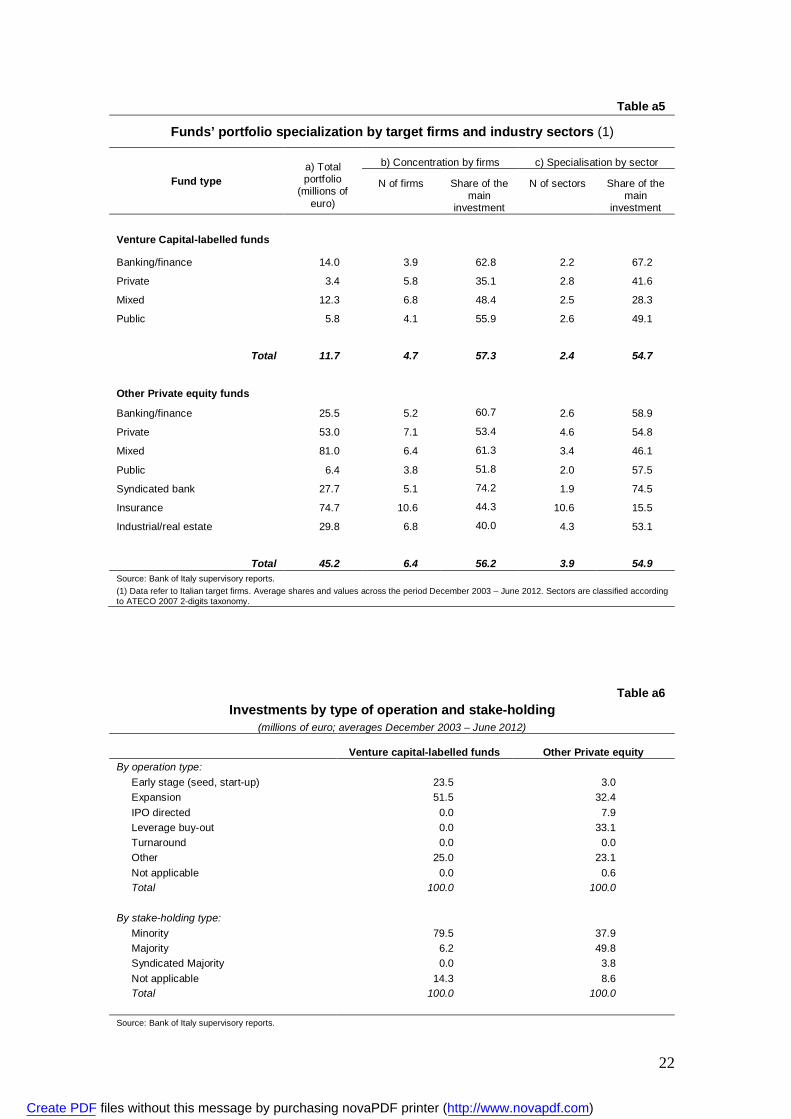
8 Seed and start-up operations account for about one quarter of the VC funds’ portfolio, while almost half the portfolio is committed to expansion operations (table a6). Moreover, almost all the operations consist in the purchase of a minority stake in the firm, whereas other PE funds acquire the majority in about one third of their interventions. 9 For total assets, the average size of VC funds target is smaller than corresponding values for other PE funds’ targets with a confidence level at 1 per cent. 10 According to European Commission, enterprises are defined medium (small) if they have up to €250 (€50) employees, €50 (€10) million turnover, and €43 (€10) million total assets.
Create PDF files without this message by purchasing novaPDF printer (http://www.novapdf.com)
10
In the Italian case, the degree of concentration of VC funds investments is not differ-ent from the average of closed-end funds (table a5). In spite of a smaller portfolio, the number of target firms and the share devoted by VC funds to the main target over the total portfolio are not very different from the average PE fund: the VC funds have usually less than 5 investments running at each moment (over 6 for the other funds), a value which is in the lower bound of the range found in some studies on venture capital market in other countries (Kanniainen and Keuschnigg, 2004). The main target accounts for 57 per cent of the portfolio for VC funds, much the same value as for the other PE funds. The largest portfolios are run by mixed-ownership managing firms, which also carry out, on average, the largest stakes in single firms; banking/finance affiliated funds, whose portfolio is com-mitted for about two thirds to the main investment, are more concentrated, whereas in other countries a higher concentration is found at independent funds (Cumming, 2006).
As far as the target firm’s industry is concerned, each fund invests on average onto 2-3 sectors, and the main sector accounts for about 55 per cent of the total portfolio (table a5). More specialised funds are again those affiliated to banking/finance groups, for which the main sector accounts for close to two thirds of the total portfolio.
A stronger specialisation at some funds jointly stems from a smaller overall size of portfolio and bigger investments in single firms or sectors.11 Specialised funds are active almost exclusively in advanced sectors, with two thirds of portfolio invested in knowledge intensive high-tech services and one third in high-tech manufacturing.
Also for Italian funds, therefore, there is an apparent trade off between specialization and size of the fund, which has been the topic of a wide literature (paragraph 2). There seems to be, in fact, a clear distinction between small VC funds, highly specialised in ad-vanced sectors, and bigger and more diversified funds, with a relatively low share in ad-vanced sectors. This finding apparently confirms, at least indirectly, the lack of managerial and technical skills at some Italian funds, compared to other countries (Bank of Italy, 2009); from another point of view, this might affect the firms’ performance, since these skills are key to foster the entrepreneurial project (Cressy et al., 2012; Gompers et al., 2009).
* * *
The above analysis showed that VC funds display, as expected, a relative focus towards advanced sectors, which is growing in recent years, but which is still limited to services sec-tors, and does not spill over manufacturing. At the same time these funds commit part of their portfolio to goals unrelated to the mission of genuine venture capital: non-technologically advanced sectors absorb a non trivial share of their holdings (about half of total investments) and some investments target large or mature firms (tables a2-a4). Against this background, which is a relevant issue, the next paragraph will focus on ‘true’ venture capital investments, not fully overlapping with the investments by the VC-labelled funds, which have been the matter of this paragraph.
11 Italian funds can be sorted into ‘concentrated/specialised funds’ and ‘other funds’. The specialisation has been defined according to the share of portfolio committed to the main target firm or the main target sector, alternatively: a fund is ‘concentrated/specialised’ if it belongs to the first quartile with respect to that share. The quartiles are separately identified for VC-funds and other PE funds.
Create PDF files without this message by purchasing novaPDF printer (http://www.novapdf.com)
11
5 The firms’ financial structure after the fund intervention
Having established that VC-labelled funds invest only part of their portfolio in young in-novative firms, the next question is whether, when these firms receive private equity capi-tal, they are actually excluded from the credit market, and, if so, whether the fund interven-tion introduces them to the banking system.
The following analysis is based upon a substantial definition of venture capital, which disregards the identity of the investor fund, but rather refer to the features of the invest-ment, per se. It is defined to be a ‘VC investment’ an investment carried out by any Italian closed-end fund, having both the following features: it targets a firm (i) established by less than 5 years and (ii) active in a sector within the ‘manufacturing high-tech’, ‘knowledge in-tensive high-tech services’ or ‘knowledge intensive services’. Applying these firm-related criteria, 118 operations reported within the data base have been classified as ‘venture capital investments’.12 In order to robustly assess the balance sheet performance of VC-backed firms during the investment, a benchmark sample of firms has been retrieved, having fea-tures strictly close to those of each target firm (see methodological appendix for selection criteria).
5.1. The evolution of the financial structure of the target firms during the fund intervention
First, changes in the balance sheet situation of target firms during the period where the fund held capital shares are described, in order to assess the impact of the investor presence on the firm’s financial situation, growth and profitability.
The target firms’ balance sheet ratios can be driven, among other factors, by the in-vestment strategy of the fund: in principle, the fund should exit the firm capital at the time the stake value has been enhanced and made attractive to the market, and therefore when the firm displays a more balanced financial structure and is close to a profitability break even. However, fund’s exit might also take place before these conditions are realised, in case of failure (write off or write down). Granturco and Miele (2011) show that an im-portant share of target firms (about 40 per cent) of closed-end Italian funds displays a shaky financial situation. Furthermore, the comparison of balance sheet indicators between the initial and final investment year is affected by the severe economic downturn after 2007-2008, which could have impacted single firms in different ways, also due to the dif-ferent time span of each investment.
12 A fund investment is defined as a pair ‘target firm - closed-end fund’; if a firm has been targeted by more than one fund during the reference period (end 2003 to end 2011), each pair is treated as a separate invest-ment. A single firm can therefore be included in more than one investment. The overlapping of these opera-tions with those selected according to the nature of the investor (previous paragraph) is not very high: barely above one third (35.2 per cent) of the ‘VC-labelled funds’ investments belong to this category, and about 60 per cent of the ‘VC investments’ are actually carried out by funds which were not labelled as specifically de-voted to venture capital.
Create PDF files without this message by purchasing novaPDF printer (http://www.novapdf.com)

12
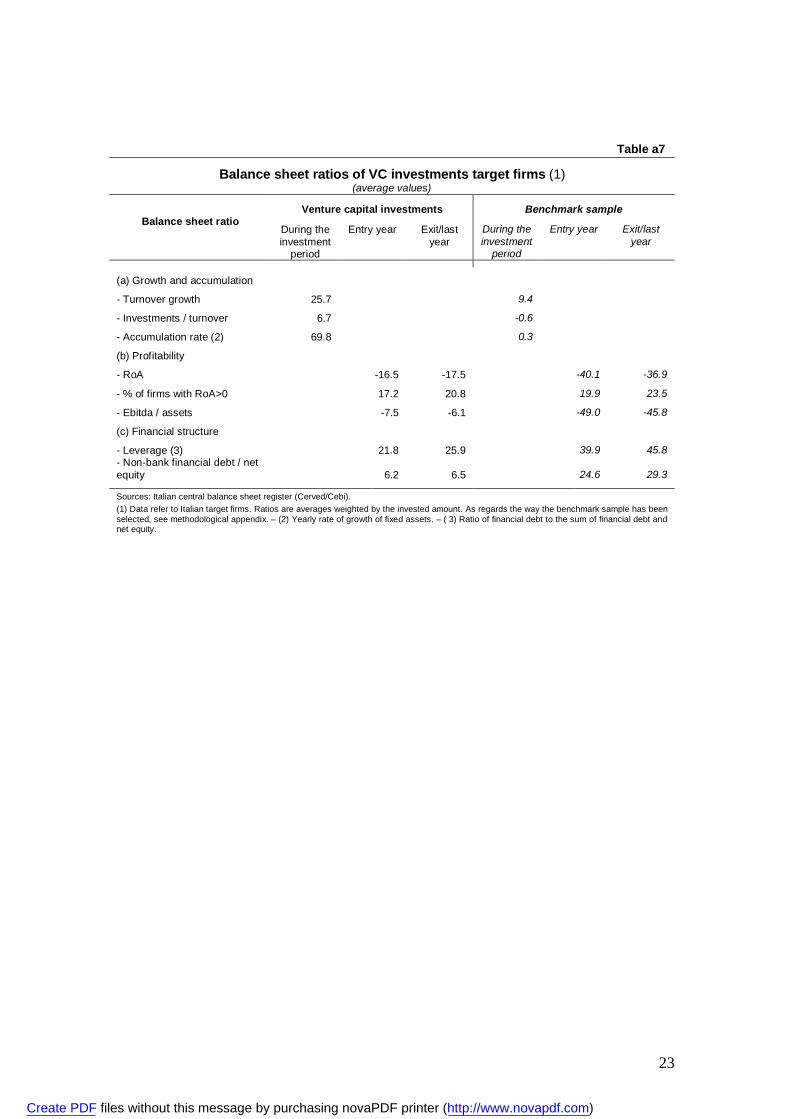
Table a7 summarizes some balance sheet ratios of firms which received VC-type fi-nancing during the period of the closed-end fund presence in their capital.13
Growth indicators display an average turnover increase of 25.7 per cent, compared to less than 10 per cent for the average benchmark firm. In the period of fund commitment, target companies carried out yearly investments for about 6.7 per cent of their turnover, which entailed a rapid growth in fixed assets (both hard and soft). These values must be as-sessed against the initial turnover of the target firms, presumably low in the firm first stag-es, but are higher than corresponding values displayed by similar firms not VC-backed, suggesting milder financial constraints for VC-backed firms.
The profitability of the average firm (operating profit and ebitda over total assets) has been negative both in the initial and the final year. For benchmark non VC-backed firms, the performance was even more negative during the same period; however, differently from benchmark firms, VC-backed companies failed to display significant improvement in profitability ratios between the initial and the final year of the fund’s investment. As a con-sequence, in the exit year or in the last fiscal year for which the balance sheet is available, VC-backed firms were far, on average, from reaching a break even: the percentage of firms which recorded a positive RoA barely grew during the investment period, from 17.2 to 20.8 per cent.
The firms’ financial structure changed only to a limited extent during the fund pres-ence within the capital. The leverage (financial debt over the sum of financial debt and net equity) grew from 21.8 at the time of fund’s entry to 25.9 per cent in the last fiscal year. At the end of the period the leverage of VC-backed firms stayed at about half the average val-ue for similar firms; the latter also had five times more non-bank financial debt. This sug-gests that fund’s equity plays to some extent the role of replacing other forms of non-bank finance, e.g. debt finance provided by firm owners, rather than supplying additional funds.
The rather low leverage of VC-backed firms is consistent with a stronger capitalization. On the other hand, it pushes to investigate the role of fund’s involvement onto the rela-tionships between the target firms and other finance providers, among which banks play a key role.
5.2 The relationships between target firms and the banking system: the amount of credit
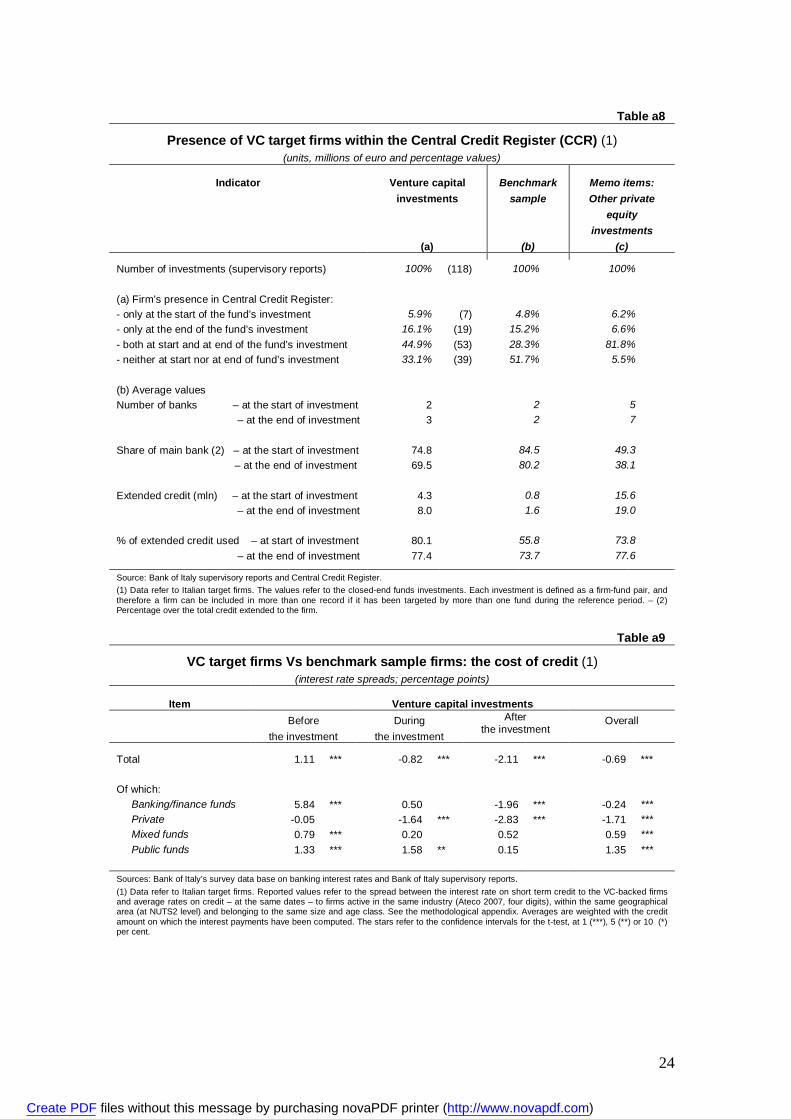
In most cases, young and innovative targets of closed-end funds are not excluded from the credit market. Firms backed by closed-end funds are found within the central credit register in about two thirds of the cases (79 out of 118; table a8, column a).14 These companies had
13 The last balance sheet used for these statistics is in any case not later than the 2010 balance sheet (last full fiscal year available in the Cerved/Cebi database), regardless of whether the investment was still in place after 2010. 14 Firms are found in the CCR database if they have granted or used credit above the CCR recording thresh-old; the threshold for recording a single debtor within the CCR was lowered from €75,000 to €30,000 on 1st January 2009.
Create PDF files without this message by purchasing novaPDF printer (http://www.novapdf.com)

13
a credit relationship at the start or the end of the fund’s venture capital investment, or at both dates.
In a minority of cases (less than one out of six) the firm had been granted credit after the fund intervention, while it was not beforehand. However, it is relatively more frequent the case that the firm already had credit relationships before the fund’s entry. Therefore, there is not strong evidence that VC investment introduces the firm to the credit market, playing a signalling or scouting task. By contrast, the fact that the firm was usually already granted credit before the fund’s entry does lend support to the hypothesis of an ‘inverse signalling’, from the bank towards the fund (Drucker and Puri, 2006).
For the sake of comparison, table a8 displays similar statistics for the benchmark sam-ple of similar, non VC-backed firms (column b), and for other targets of PE investments (column c). In particular, within the benchmark sample, over half of the firms were actually excluded from the credit market, both at the start and the end of the VC investment on the corresponding target firms, a higher percentage than for the VC-backed companies.
Bank relationship’s intensity does not change in a noteworthy way during the venture capital commitment. When target firms had credit relationships, the number of financing banks stayed rather stable (just growing from a value of 2 to 3 banks for the median firm; table a8); as a consequence, the share of the main bank on total credit shrank from 74.8 to 69.5 per cent. The share of the main bank was higher for similar non-VC backed firms, thus indirectly supporting suggestions that VC-backed firms seek to escape hold-up situa-tions (Berger and Schaeck, 2011). The amount of granted credit rose from €4.3 to €8.0 mil-lion, more rapidly than for comparable companies over the same period. During the fund presence, granted bank credit amounted to an average 3.2 times the value of the fund stake., whereas the actual usage of credit lines – a percentage which proxies the financial constraints of the firms – stayed at around 80 per cent.
According to the above evidence, the fund intervention into the capital of a recently established firm active in advanced industries has a weak certification effect towards the banking system, which instead has been suggested by related studies (Bertoni et al., 2008): in spite of growing credit lines, the access to credit by target firms does not markedly im-prove between the start and the end of the investment, as regards the number of financing banks and the role of the main bank. The leverage ratio within the balance sheets of these firms increases only slightly (see above). This would not confirm – as far as the Italian mar-ket is concerned – a clear-cut pecking order in the use of external finance sources whereby the bank credit intervention takes place relatively late during the growth of a new entrepre-neurial venture.
Following Hellmann’s et al. (2008) relationship hypothesis, bank-affiliated venture capi-talists might use capital provision within a strategic framework, with a view to establishing early partnerships with innovative firms, and to exploiting them through subsequent bank credit relationships (see paragraph 2).
Within the VC-type operations, in 25 cases (that is, about 1/3 those for which the firm was found in the CCR at the time of fund’s entry or exit) the target firms turned out to be financed by a bank of the same group as the venture capital fund. The number of these op-
Create PDF files without this message by purchasing novaPDF printer (http://www.novapdf.com)
14
erations is small, but the percentage of group-related finance relationships is not negligible. Therefore, the joint intervention (capital and credit) within the same group emerges as a non infrequent case for this kind of investments.15
The funds and the banks that performed this joint financial support to a firm through credit and capital belonged to five among the main Italian banking groups. For almost all the groups (with just one exception), firms targeted by the VC fund already had credit lines by group banks at the time of the fund entry; for these groups the capital provision seem-ingly takes place simultaneously or subsequently to the extension of bank credit. Therefore, these findings do not lend support to the hypothesis that – for the Italian banking groups – the start of a credit partnership is the prosecution of a customer relationship established through the equity provision in the earlier stages of the firm.
5.3 The relationships between target firms and the banking system: the cost of credit
In addition to the amount of extended credit, the dataset allows to appraise its costs. To this end, interest rates paid by firms which benefited from a venture capital involvement have been compared with the average rates on similar credit lines paid by comparable firms (same industry, geographical location, range of turnover size and age; table a9).16
According to descriptive statistics, VC-backed firms do seem to benefit from the fund’s investment, as far as credit costs are concerned, and this benefit spills over the peri-od subsequent to fund’s presence in the capital. The spread with respect to the cost paid by similar firms during the investment becomes negative and the negative difference widens after the exit of the fund.
Again, the fund’s institutional setup matters. For almost all the types of funds, a de-crease in the rate paid by the firm is apparent from the period before the investment, with respect to comparable firms. However, only for bank-owned and private funds the spread is significantly negative after the fund’s exit. The banking-affiliated funds invest on firms who paid high rates before the investment, and manage to substantially improve the situa-tion, consistent with findings by Hellman et al. (2008). Public funds also leave their targets better off with respect to the ex ante situation, but still with a positive spread. For mixed funds (jointly owned by banks and non financial groups) the performance is poor.
This comparison should be assessed against the idiosyncratic riskiness of firms receiv-ing bank credit, although the benchmark sample has been selected according to features which to a large extent proxy the debtor’s credit quality. The perceived riskiness of the tar-get firm might be affected by the participation itself of the fund into its capital.
15 Hellmann et al. (2008), by means of a probit analysis, conclude that the likelihood that the VC-backed firm gets subsequently credit from a bank of the same group as the VC fund is more frequent than one could ex-pect based on a purely theoretic model assigning to all the possible bank-firm pairs the same ex ante probabil-ity to take place. 16 The comparison was carried out with reference to short-term credit lines, which are easily comparable among firms; this is not the case for commercial operations-related credit lines (which display lower variabil-ity across firms, regardless of their riskiness) and for medium-to-long term operations (which are affected by the duration and the collateralisation of the bank financing).
Create PDF files without this message by purchasing novaPDF printer (http://www.novapdf.com)

15
5.4 Bank credit and its cost. An econometric analysis
A simple econometric analysis substantially confirms a weak signalling effect of mutual funds towards the banking system. The regressions compare target firms to counterparts which largely similar under many respects, and therefore the possible selection bias has been in part taken into account. However, the endogeneity problem has not been directly tackled. Therefore, the results from this exercise should be carefully interpreted as correla-tions between the reception of private equity and the likelihood to receive credit or its cost, rather than as a causal link.
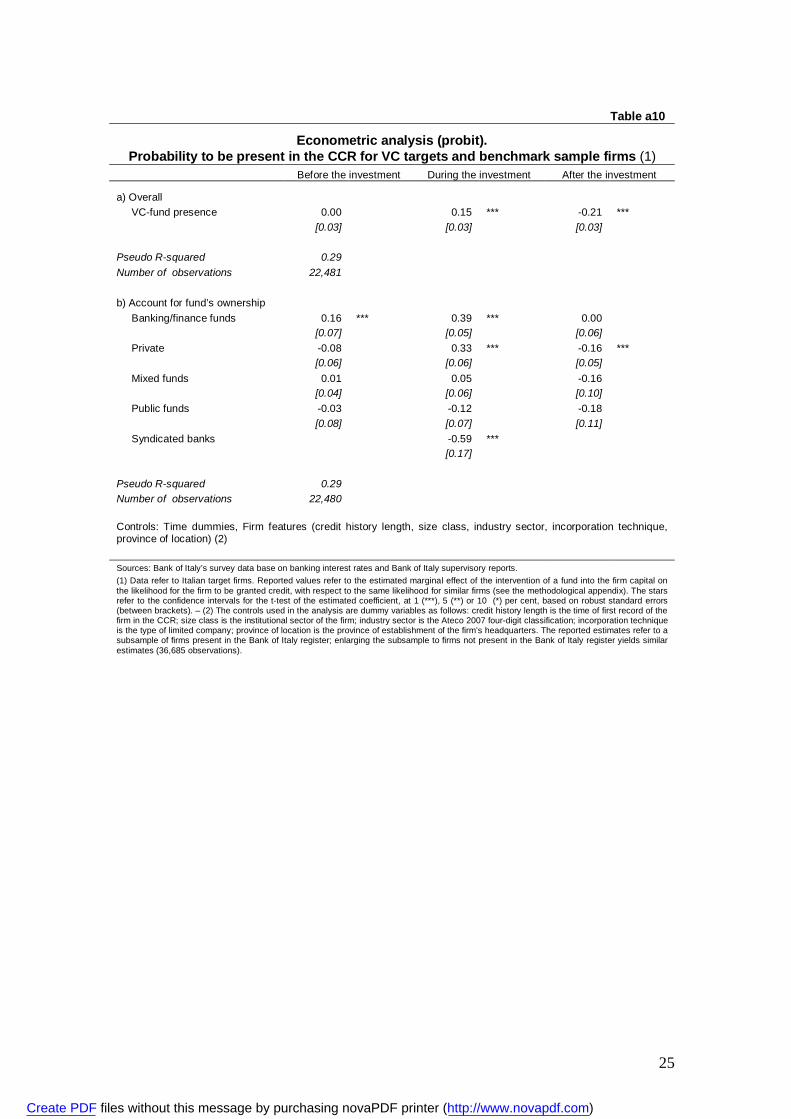
First, a probit model allows to disentangle the effect of the fund’s intervention on the likelihood for a firm to be present in the CCR, while controlling for the firm features (size class, industry, location, incorporation technique, credit history length) and time dummies. The estimated model is as follows.
)'''''()( ,,3,,2,,1,, tjitjitjiittji FAFDFBXTCRP (1)
In equation (1), the probability of a firm to be present in the CCR, i.e. P(CRi,j,t), is ex-plained by time dummies (T), by the features of the firm, like institutional setting, age, sec-tor of activity, size, geographical location (X), and by the fact that the t is a period before, during or after the entry of a PE fund into the firm’s capital (the FB, FD and FA dum-mies, in the order). In order to spot possible ownership-linked heterogeneities, an extended version of the (1) interacts the three dummies of interest with the ownership of the fund (bank-owned, private-owned, etc.).
The likelihood of a VC-backed firm to be granted credit during the fund’s holding pe-riod is higher than for other benchmark firms, as far as private and bank-owned funds are concerned (table a10). However, the same likelihood turns out to be lower than for similar firms when the private fund has left. Bank-affiliated funds usually support firms already present in the CCR. These estimates are not directly comparable to descriptive evidence in table a8: the latter shows firms that have been granted credit at the date of the fund exit, whereas econometric estimates take into account subsequent dates as well.
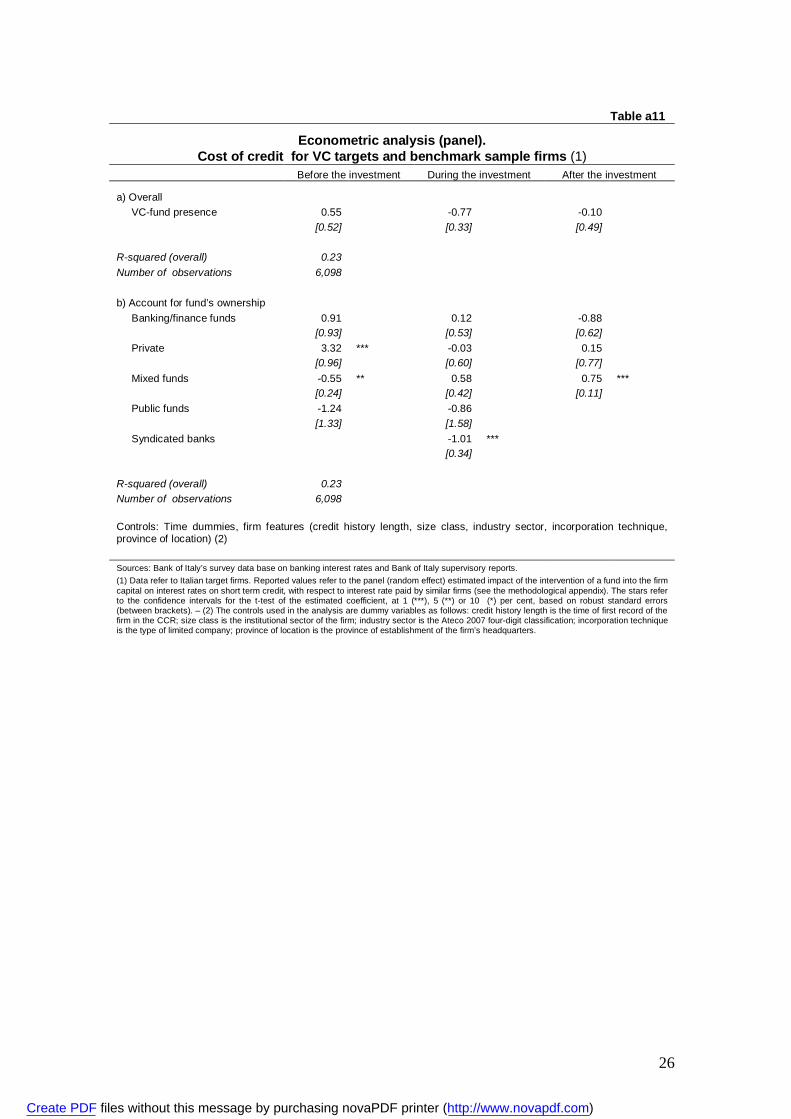
Turning to the cost of credit, in a panel analysis the interest rate paid by target and benchmark companies is explained by the same firm features as above. The panel is unbal-anced, as the data on credit costs (interest rates) are only available for the periods where each firm was granted credit, and has been estimated through a random effects model, i.e. the most general form of a model based on panel data. The estimated relationship is as fol-lows.
tjitjitjiitji FAFDFBXIR ,,3,,2,,1,, '''' (2)
The symbols in equation (2) are as for equation (1). The econometric analysis suggests that the impact of fund presence on bank rates paid by the target firms is weak (table a11). Overall, the VC-backed firms pay a lower rate both during and after the intervention of the fund, while they were charged higher rates beforehand. However, these difference turn out to be negligible, after controlling for observable firm features. Looking at fund ownership, private funds tend to invest on firms which paid relatively high interest rates, and make the spread nil upon intervention. The opposite is true for mixed-owned funds. Only funds
Create PDF files without this message by purchasing novaPDF printer (http://www.novapdf.com)
16
owned by several banks achieve a significant rate advantage for their targets during their participation into capital, which however does not spill over the subsequent period.
6 Conclusions and further research
Using fund-level and firm-level data about Italian venture capital and private equity funds, this paper tried to answer two interconnected questions. First, do Italian VC funds actually provide financial support to young and innovative small enterprises which can not be easily assisted by banks? Second, when funds do actually target this important segment of firms, do they play a signalling or scouting role towards the banking system?
The main findings are that the portfolio of VC funds – which is still small compared to total portfolio of Italian private equity funds – is only in part devoted to innovative, young and small firms. The investment duration just exceeds two years, and is inversely correlated to the age of the firm at the time of fund’s entry (as younger firms need to be financially supported for longer periods). Contrary to what should be expected owing to the intense managerial support needed by target firms, venture capital-labelled funds do not seem more concentrated on a few firms or specialised in a few sectors than other closed-end funds. Some exceptions are represented by a few small funds that are strongly focused on selected high-tech sectors.
Turning to the second question, young and innovative companies targeted by PE funds are present in the credit market more often than their non PE-backed counterparts. However, they usually have a bank relationship already before the fund intervention, so that a clear sequence venture capital-bank credit does not emerge from the financing strategies of young innovative Italian firms. This is also true when credit is provided by a bank belong-ing to the same group as the investor fund; this lends weak support to the hypothesis of a multi-period group strategy built on the overall relationship with the customer firm, both through equity and through credit. Finally, private and banking/finance funds manage to reduce the cost of credit for the target firm, with respect to comparable firms.
Further research will use the same data base in order to investigate more deeply the ef-fect of venture capital on subsequent credit history of the firm, in particular by explicitly testing for Italy the relationship hypothesis put forward by Hellmann et al. (2008); the ef-fects of fund’s intervention on firm performance could be disentangled through a sample matching analysis (e.g. via propensity score matching); finally, the data base allows to assess which features of the funds (e.g. specialisation) lead to a better fund performance.
7 References Andrieu G., Groh A.P. (2012), Entrepreneurs’ financing choice between independ-
ent and bank-affiliated venture capital firms, Journal of Corporate Finance, Vol. 18 (2012) 1143–1167.
Bank of Italy (2009), Private equity and venture capital in Italy, Occasional papers, 41, February 2009.
Create PDF files without this message by purchasing novaPDF printer (http://www.novapdf.com)
17
Berger A.N., Schaeck K. (2011), Small and medium-sized enterprises, bank-relationship strength, and the use of venture capital, Journal of Money, Credit and Banking, Vol. 43, No. 2–3 (March–April 2011).
Bertoni B., Colombo M.G., Croce A. (2008), Venture capital financing and firm’s investments, http://ssrn.com/abstract=1102069.
Bertoni F., Colombo M.G., Grilli L. (2011), Venture capital financing and the growth of high-tech start-ups: Disentangling treatment from selection effects, Research Poli-cy, 40 (2011) 1028–1043.
Bottazzi L., Da Rin M., Hellmann T. (2008), Who are the active investors? Eviden-ce from venture capital, Journal of Financial Economics, 89, 2008, 488–512.
Bugamelli M., Cannari L., Lotti F., Magri S. (2012), Il gap innovativo del sistema produttivo italiano: radici e possibili rimedi, Bank of Italy, Occasional Papers, 121, April 2012.
Cressy R., Malipiero A., Munari F. (2012), Does VC fund diversification pay off? An empirical investigation of the effects of VC portfolio diversification on fund perfor-mance, International Entrepreneurship and Management Journal, 2012.
Cumming D. (2006), The determinants of venture capital portfolio size: Empirical evidence, The Journal of Business, 79(3) (May 2006), 1083–1126.
Cumming D., Johan S. (2010), Venture capital investment duration, Journal of Small Business Management, (2010) 48(2), 228–257.
Cumming D.J., MacIntosh J.G. (2001), Venture capital investment duration in Can-ada and the United States, Journal of Multinational Financial Management, 11 (2001) 445–463.
Drucker and S., Puri M. (2006), Banks in capital markets: A survey, May 2006, in B. Espen Eckbo B.E. (ed), Handbook in Corporate Finance: Empirical Corporate Finance (Else-vier/North-Holland).
Eurostat (2005), Statistics in focus – Science and technology – R&D statistics (Au-gust Götzfried), 4/2005.
Eurostat (2012), High-tech statistics, http://epp.eurostat.ec.europa.eu/ statis-tics_explained/index.php/High-tech_statistics.
EVCA (2012), EVCA Yearbook 2012, Activity data on fundraising, investments and divestments by private equity and venture capital firms in Europe, May 2012.
Freel M.S. (2007), Are small innovators credit rationed?, Small Business Economics (2007) 28:23–35.
Gompers P.A. (1995). Optimal investment, monitoring, and the staging of venture capital, The Journal of Finance, 50(5), Dec. 1995, 1461-1489.
Gompers P.A., Kovner A., Lerner J. (2009), Specialization and success: Evidence from venture capital, Journal of Economics & Management Strategy, 18(3), Fall 2009, 817–844.
Granturco M., Miele M.G. (2011), Il private equity in Italia: una analisi sulle “impre-se target”, Occasional papers, 98, July 2011.
Hall, B. H. (2010), The financing of innovative firms, Review of Economics and Institu-tions, 1(1), Spring 2010, Article 4.
Hellmann T., Lindsey L., Puri M. (2008), Building relationships early: Banks in ven-ture capital, The Review of Financial Studies, 21(2), 2008.
Kanniainen V., Keuschnigg C. (2004), Start-up investment with scarce venture capi-tal support, Journal of Banking & Finance, 28 (2004) 1935–1959.
Create PDF files without this message by purchasing novaPDF printer (http://www.novapdf.com)
18
Knill A. (2009), Should venture capitalists put all their eggs in one basket? Diversi-fication versus pure-play strategies in venture capital, Financial Management, Autumn 2009, 441–486.
Micucci G., Rossi P. (2012), Financing R&D investments: Relationship lending or financial markets?, paper presented to the workshop The transformation of local production sys-tems, Bank of Italy and Department of Economic Sciences, University of Bologna, 31 Janu-ary - 1 February 2012.
OECD (2003), OECD science, technology and industry scoreboard.
Puri M., Zarutskie R. (2010), On the lifecycle dynamics of venture-capital- and non-venture-capital-financed firms, NBER Working Paper Series, 14250.
Revest V., Sapio S. (2008), Financing technology-based small firms in Europe: A review of the empirical evidence, LEM working paper series, Laboratory of Economics and Management Sant’Anna School of Advanced Studies.
Tykvová T. (2006), How do investment patterns of independent and captive private equity funds differ? Evidence from Germany, Financial Markets Portfolio Management, 2006, 20, 399–418.
VEM (2010), Venture capital monitor – Italy report 2009.
VICO (2011), Venture Capital. Policy lessons from the VICO project, 30 Septem-ber 2011, VICO-Financing Entrepreneurial Ventures in Europe, 7th Framework Program.
Create PDF files without this message by purchasing novaPDF printer (http://www.novapdf.com)
19
8 Methodological appendix Supervisory reports by closed-end funds Supervisory reports to Bank of Italy by closed-end funds are regulated by regulation n. 189 on supervisory returns (Manuale delle Segnalazioni Statistiche e di Vigilanza per gli Organismi di Investimento Collettivo del Risparmio; http://www.bancaditalia.it/vigilanza/normativa/norm_bi/circ-reg/stat_oicr).
According to the regulation, a closed-end fund is defined as a mutual fund whose right to the reim-bursement of the shares is allowed to participants only at pre-defined maturities. Managing firms must com-ply with reporting requirements for each managed fund as from the inception of the fund’s operations.
Within the item “holdings” the fund must report the value of the stakes held in listed and unlisted com-panies. Listed companies holdings will be reported at market value. Other holdings, lacking a reference mar-ket prices, are to be valued – taking into account the economic and financial situation of the participated firm – according to the general criteria as per the current regulation by the Bank of Italy.
In the supervisory half-yearly reports about the fund portfolio, the financial instruments are identified through the international codification standard (ISIN code). Through the Italian securities register, the ISIN code allows to single out the majority of the Italian target firms (accounting for about 90 per cent of the total value of the funds’ portfolio towards Italian target firms), and therefore to find out their structural features. For unidentified firms, it is not possible to match data on these investments with those of other data bases (central balance sheet register, central credit register, etc.). This entails therefore a different number of obser-vations for some exhibits in the paper.
Grouping investments by technological level of the target firm Target firms are grouped according to the technological level of their activity, consistently with the taxonomy employed by OECD and Eurostat (OECD, 2003, Eurostat, 2005, 2012).
Based upon ATECO 2007 classification “high-tech manufacturing” encompasses sectors C21, C26; “medium – high tech manufacturing” includes sectors C20 and C27 to C30; “medium – low tech manufactur-ing” includes sectors C19 and C22 to C25; “low tech manufacturing” includes sectors C10 to C18, C31 and C32. “Knowledge intensive services” encompass sectors H50, H51, H53, J58 to J63, K64 to K66, M69 to M75, N77 to N80, N82, O84, P85, Q86 to Q88 and R90 to R93. Among the latter, “knowledge intensive high – tech services” are sectors H50, H53, J58, J61, J62, J63, M72. All services between J45 and T98 (includ-ed) and not mentioned among “knowledge intensive services” are defined “less knowledge intensive services”.
Based upon the ATECO 2002, 2 digits, “high-tech manufacturing” encompasses sectors DL30, DL32, DL33; the “medium – high tech manufacturing” encompasses sectors DG24, DK29, DL31, DM34, DM35; the “medium – low tech manufacturing” encompasses sectors DF23, DH25, DI26, DJ27, DJ28; the “low tech manufacturing” encompasses sectors DA15, DA16, DB17, DB18, DC19, DD20, DE21, DE22, DN36, DN37. The “knowledge intensive services” include sectors ATECO2002: I61, I62, I64, J65 to J67, K70 to K74, M80, N85, 092: among these sectors, I64, K72 and K73 are defined “knowledge intensive high – tech services”.
In the grouping used in this paper, moreover, investments in banks of fund managing firms are separate-ly grouped (“Finance and banking”).
The benchmark sample The benchmark sample matching VC-backed firms consists of about 2,800 firms having simultaneously the following characteristics: they (i) are within the same region, (ii) are within the same sector (ATECO 2007 four digits), (ii) have a turnover in the range of the turnover of the target firm in the initial year of the invest-ment (turnover benchmark = [0.25 ÷ 4] turnover target), and (iv) have about the same age (age benchmark = age target ± 3 years).
The Central Credit Register and the Bank of Italy survey data on bank interest rates The Central Credit Register (CCR) records all the credit lines granted by banks or other financial intermediar-ies to borrowers whose granted or used credit at the reporting institution exceeds a given threshold (€30,000 as from 1st January 2009, €75,000 beforehand). See http://www.bancaditalia.it/statistiche/racc_datser/intermediari/centrarisk for reference. The Bank of Italy survey data on bank interest rates gathers data on interest rates applied by about 200 banks, reporting data on interest rates applied to credit lines referred to borrowers whose total credit towards the reporting bank ex-ceeds a given threshold (€75,000). See the Glossary to the Bank of Italy annual report.
Create PDF files without this message by purchasing novaPDF printer (http://www.novapdf.com)
20
9 Statistical appendix Table a1
Features of investments of VC and other PE funds (1)
Fund type Venture Capital Other Private equity
N funds N operations (2)
Average duration (years)
(3)
Average amount (mln) (3)
N funds N operations (2)
Average duration (years)
(3)
Average amount (mln) (3)
Banking/finance 13 99 2.4*** 4.1 40 402 2.5 4.1
Private 1 8 1.5*** 0.6*** 63 833 3.0 8.4
Mixed 5 60 2.3*** 1.8*** 11 113 1.3 10.9
Public 4 33 3.2*** 1.4 1 4 1.3 1.7
Syndicated bank 2 21 3.4 5.6
Insurance 4 72 3.3 4.2
Industrial/real estate 4 44 2.9 4.4 Total 23 200 2.4* 2.7*** 125 1,489 2.6 6.9 Source: Bank of Italy supervisory reports. (1) Data refer to Italian target firms and to total or average values period December 2003 – June 2012 (half-yearly data). – (2) Total number of the operations within the reference period. – (3) Averages weighted by the amount of the investment. Values with stars indicate if the difference between the value for VC funds and for other PE funds is statistically significant (* = confidence interval 10%, ** = 5%, *** = 1%).
Table a2
Investments by technological level of the target firm (1) Fund category
Technological level of the sector Venture capital-labelled funds
Other private equity
High-tech manufacturing 13.2 4.9
High- and medium-tech manufacturing 7.7 14.1
Medium- and low-tech manufacturing 10.0 5.8
Low-tech manufacturing 6.0 8.0
Knowledge intensive high-tech services 21.7 5.2
Knowledge intensive services 16.7 36.8
Less knowledge intensive services 17.4 10.9
Finance and banking 0.6 0.2
Other 6.7 14.0
Total 100.0 100.0 Source: Bank of Italy supervisory reports. (1) Data refer to Italian target firms and to total or average values period December 2003 – June 2012 (half-yearly data).
Create PDF files without this message by purchasing novaPDF printer (http://www.novapdf.com)
21
Table a3 Age of target firm(1)
(average years) Venture capital-labelled
funds Other Private equity funds
(a) Firm age at start of the investment (years) 7.4 *** 15.6 (a.1) By fund type:
Banking/finance 7.2 * 12.5 Private 0.9 *** 8.1 Mixed 9.7 ** 52.1 Public 3.2 19.5
(a.2) By technological sector:
High-tech manufacturing 3.9 14.8 High- and medium-tech manufacturing 14.2 9.1 Medium- and low-tech manufacturing 3.5 12.8 Low-tech manufacturing 6.2 10.9 Knowledge intensive high-tech services 7.6 7.7 Knowledge intensive services 18.0 29.2 Less knowledge intensive services 3.6 13.0 Finance and banking … 1.0 Other 11.8 12.7
Sources: Bank of Italy Supervisory reports and Italian central balance sheet register (Cerved). (1) Data refer to Italian target firms. Averages are weighted by the relevant investment amount. For the overall average and the averages by fund type (panel a and b) the t-test of the differences between VC funds and other PE funds are reported. Stars denote significance of the t-test (* = 10 per cent, , ** = 5 per cent and *** = 1 per cent, respectively).
Table a4 VC-labelled funds: size of target firm
(millions of euro) (1)
Venture capital-labelled funds
Other Private equity funds
(a) Total assets 198.4 405.2 (a.1) By fund type: Banking/finance 246.0 147.9 Private 1.1 350.6 Mixed 77.3 1097.8 Public 8.3 9.9 (a.2) By technological sector:
High-tech manufacturing 293.7 130.9 High- and medium-tech manufacturing 35.3 102.7 Medium- and low-tech manufacturing 75.0 1536.3 Low-tech manufacturing 78.9 90.7 Knowledge intensive high-tech services 47.2 120.2 Knowledge intensive services 67.6 636.1 Less knowledge intensive services 510.0 347.6 Finance and banking 0.0 8.9 Other 49.8 97.1
(b) Net equity 65.0 127.7 (c) Yearly turnover 142.7 224.7 Sources: Supervisory reports and Italian central balance sheet register (Cerved). (1) Data refer to Italian target firms. Balance sheet values are averages of the balance sheet values 2002-2010 where available for the relevant firms, weighted by the relevant investment amount.
Create PDF files without this message by purchasing novaPDF printer (http://www.novapdf.com)
22
Table a5
Funds’ portfolio specialization by target firms and industry sectors (1)
Fund type a) Total portfolio
(millions of euro)
b) Concentration by firms c) Specialisation by sector
N of firms Share of the main
investment
N of sectors Share of the main
investment
Venture Capital-labelled funds
Banking/finance 14.0 3.9 62.8 2.2 67.2
Private 3.4 5.8 35.1 2.8 41.6
Mixed 12.3 6.8 48.4 2.5 28.3
Public 5.8 4.1 55.9 2.6 49.1
Total 11.7 4.7 57.3 2.4 54.7
Other Private equity funds
Banking/finance 25.5 5.2 60.7 2.6 58.9
Private 53.0 7.1 53.4 4.6 54.8
Mixed 81.0 6.4 61.3 3.4 46.1
Public 6.4 3.8 51.8 2.0 57.5
Syndicated bank 27.7 5.1 74.2 1.9 74.5
Insurance 74.7 10.6 44.3 10.6 15.5
Industrial/real estate 29.8 6.8 40.0 4.3 53.1
Total 45.2 6.4 56.2 3.9 54.9 Source: Bank of Italy supervisory reports. (1) Data refer to Italian target firms. Average shares and values across the period December 2003 – June 2012. Sectors are classified according to ATECO 2007 2-digits taxonomy.
Table a6 Investments by type of operation and stake-holding
(millions of euro; averages December 2003 – June 2012)
Venture capital-labelled funds Other Private equity By operation type:
Early stage (seed, start-up) 23.5 3.0 Expansion 51.5 32.4 IPO directed 0.0 7.9 Leverage buy-out 0.0 33.1 Turnaround 0.0 0.0 Other 25.0 23.1 Not applicable 0.0 0.6 Total 100.0 100.0
By stake-holding type: Minority 79.5 37.9 Majority 6.2 49.8 Syndicated Majority 0.0 3.8 Not applicable 14.3 8.6 Total 100.0 100.0
Source: Bank of Italy supervisory reports.
Create PDF files without this message by purchasing novaPDF printer (http://www.novapdf.com)
23
Table a7
Balance sheet ratios of VC investments target firms (1) (average values)
Venture capital investments Benchmark sample Balance sheet ratio
During the investment
period
Entry year Exit/last year
During the investment
period
Entry year Exit/last year
(a) Growth and accumulation
- Turnover growth 25.7 9.4
- Investments / turnover 6.7 -0.6
- Accumulation rate (2) 69.8 0.3
(b) Profitability
- RoA -16.5 -17.5 -40.1 -36.9
- % of firms with RoA>0 17.2 20.8 19.9 23.5
- Ebitda / assets -7.5 -6.1 -49.0 -45.8
(c) Financial structure
- Leverage (3) 21.8 25.9 39.9 45.8 - Non-bank financial debt / net equity 6.2 6.5 24.6 29.3
Sources: Italian central balance sheet register (Cerved/Cebi). (1) Data refer to Italian target firms. Ratios are averages weighted by the invested amount. As regards the way the benchmark sample has been selected, see methodological appendix. – (2) Yearly rate of growth of fixed assets. – ( 3) Ratio of financial debt to the sum of financial debt and net equity.
Create PDF files without this message by purchasing novaPDF printer (http://www.novapdf.com)
24
Table a8
Presence of VC target firms within the Central Credit Register (CCR) (1) (units, millions of euro and percentage values)
Indicator Venture capital investments
(a)
Benchmark sample
(b)
Memo items: Other private
equity investments
(c) Number of investments (supervisory reports) 100% (118) 100% 100%
(a) Firm’s presence in Central Credit Register: - only at the start of the fund’s investment 5.9% (7) 4.8% 6.2% - only at the end of the fund’s investment 16.1% (19) 15.2% 6.6% - both at start and at end of the fund’s investment 44.9% (53) 28.3% 81.8% - neither at start nor at end of fund’s investment 33.1% (39) 51.7% 5.5% (b) Average values Number of banks – at the start of investment 2 2 5 – at the end of investment 3 2 7 Share of main bank (2) – at the start of investment 74.8 84.5 49.3 – at the end of investment 69.5 80.2 38.1 Extended credit (mln) – at the start of investment 4.3 0.8 15.6 – at the end of investment 8.0 1.6 19.0 % of extended credit used – at start of investment 80.1 55.8 73.8 – at the end of investment 77.4 73.7 77.6
Source: Bank of Italy supervisory reports and Central Credit Register. (1) Data refer to Italian target firms. The values refer to the closed-end funds investments. Each investment is defined as a firm-fund pair, and therefore a firm can be included in more than one record if it has been targeted by more than one fund during the reference period. – (2) Percentage over the total credit extended to the firm.
Table a9
VC target firms Vs benchmark sample firms: the cost of credit (1) (interest rate spreads; percentage points)
Item Venture capital investments Before
the investment During
the investment
After the investment
Overall
Total 1.11 *** -0.82 *** -2.11 *** -0.69 *** Of which:
Banking/finance funds 5.84 *** 0.50 -1.96 *** -0.24 *** Private -0.05 -1.64 *** -2.83 *** -1.71 *** Mixed funds 0.79 *** 0.20 0.52 0.59 *** Public funds 1.33 *** 1.58 ** 0.15 1.35 ***
Sources: Bank of Italy’s survey data base on banking interest rates and Bank of Italy supervisory reports. (1) Data refer to Italian target firms. Reported values refer to the spread between the interest rate on short term credit to the VC-backed firms and average rates on credit – at the same dates – to firms active in the same industry (Ateco 2007, four digits), within the same geographical area (at NUTS2 level) and belonging to the same size and age class. See the methodological appendix. Averages are weighted with the credit amount on which the interest payments have been computed. The stars refer to the confidence intervals for the t-test, at 1 (***), 5 (**) or 10 (*) per cent.
Create PDF files without this message by purchasing novaPDF printer (http://www.novapdf.com)
25
Table a10
Econometric analysis (probit). Probability to be present in the CCR for VC targets and benchmark sample firms (1)
Before the investment During the investment After the investment a) Overall
VC-fund presence 0.00 0.15 *** -0.21 *** [0.03] [0.03] [0.03]
Pseudo R-squared 0.29 Number of observations 22,481 b) Account for fund’s ownership
Banking/finance funds 0.16 *** 0.39 *** 0.00 [0.07] [0.05] [0.06]
Private -0.08 0.33 *** -0.16 *** [0.06] [0.06] [0.05]
Mixed funds 0.01 0.05 -0.16 [0.04] [0.06] [0.10]
Public funds -0.03 -0.12 -0.18 [0.08] [0.07] [0.11]
Syndicated banks -0.59 *** [0.17]
Pseudo R-squared 0.29 Number of observations 22,480
Controls: Time dummies, Firm features (credit history length, size class, industry sector, incorporation technique, province of location) (2) Sources: Bank of Italy’s survey data base on banking interest rates and Bank of Italy supervisory reports. (1) Data refer to Italian target firms. Reported values refer to the estimated marginal effect of the intervention of a fund into the firm capital on the likelihood for the firm to be granted credit, with respect to the same likelihood for similar firms (see the methodological appendix). The stars refer to the confidence intervals for the t-test of the estimated coefficient, at 1 (***), 5 (**) or 10 (*) per cent, based on robust standard errors (between brackets). – (2) The controls used in the analysis are dummy variables as follows: credit history length is the time of first record of the firm in the CCR; size class is the institutional sector of the firm; industry sector is the Ateco 2007 four-digit classification; incorporation technique is the type of limited company; province of location is the province of establishment of the firm’s headquarters. The reported estimates refer to a subsample of firms present in the Bank of Italy register; enlarging the subsample to firms not present in the Bank of Italy register yields similar estimates (36,685 observations).
Create PDF files without this message by purchasing novaPDF printer (http://www.novapdf.com)
26
Table a11
Econometric analysis (panel). Cost of credit for VC targets and benchmark sample firms (1) Before the investment During the investment After the investment
a) Overall VC-fund presence 0.55 -0.77 -0.10
[0.52] [0.33] [0.49]
R-squared (overall) 0.23 Number of observations 6,098 b) Account for fund’s ownership
Banking/finance funds 0.91 0.12 -0.88 [0.93] [0.53] [0.62]
Private 3.32 *** -0.03 0.15 [0.96] [0.60] [0.77]
Mixed funds -0.55 ** 0.58 0.75 *** [0.24] [0.42] [0.11]
Public funds -1.24 -0.86 [1.33] [1.58]
Syndicated banks -1.01 *** [0.34]
R-squared (overall) 0.23 Number of observations 6,098
Controls: Time dummies, firm features (credit history length, size class, industry sector, incorporation technique, province of location) (2) Sources: Bank of Italy’s survey data base on banking interest rates and Bank of Italy supervisory reports. (1) Data refer to Italian target firms. Reported values refer to the panel (random effect) estimated impact of the intervention of a fund into the firm capital on interest rates on short term credit, with respect to interest rate paid by similar firms (see the methodological appendix). The stars refer to the confidence intervals for the t-test of the estimated coefficient, at 1 (***), 5 (**) or 10 (*) per cent, based on robust standard errors (between brackets). – (2) The controls used in the analysis are dummy variables as follows: credit history length is the time of first record of the firm in the CCR; size class is the institutional sector of the firm; industry sector is the Ateco 2007 four-digit classification; incorporation technique is the type of limited company; province of location is the province of establishment of the firm’s headquarters.
Create PDF files without this message by purchasing novaPDF printer (http://www.novapdf.com)