venugopal, basu, and foufoula-georgiou, 2005: new metric for comparing precipitation patterns…...
TRANSCRIPT

Venugopal, Basu, and Foufoula-Georgiou, 2005: New metric for comparing precipitation patterns…
Verification methods reading group
April 4, 2008
D. Ahijevych

Forecast Quality Index
useful for ensembles uses “surrogate fields” accounts for “close” forecasts One number

Outline
Paper overview universal image quality index (UIQI) and modified
UIQI components of forecast quality index (FQI) Geometric examples (from Sukanta and Efi) Perturbed “fake” examples (also from S and E) Cases from SPC Spring 2005
surrogates traditional skill scores expert rankings

Paper overview – forecast ensembles
filter out similar members, and keep just enough to characterize the probability structure of forecast
find “best” member and propagate it forward single measure (like RMSE and EqTh) but
has important additional information

Paper overview - UIQI
R1 and R2 are fields being compared
3 terms: covariance means standard
deviations 3 properties:
correlation brightness (bias) distortion
(variability)
1 2 1 2 1 2
1 2 1 2 1 2
1 2
,
2 2 2 2
( , )
2 2R R R R R R
R R R R R R
UIQI R R

Paper overview – UIQI, Hausdorff
UIQI entirely amplitude-based measure not efficient at telling difference between
displaced patterns and amplitude error Distance-based measures
Hausdorff distance

Paper Overview - Hausdorff
A
B
h(A,B)forward distance
( , ) max minb Ba A
h A B a b

Paper Overview - Hausdorff
A
Bh(B,A)backward distance
( , ) max mina Ab B
h B A a b

Paper Overview - Hausdorff
( , ) max , , ,H A B h A B h B A
A
B
h(B,A)backward distance
h(A,B)forward distance

Paper Overview - Hausdorff
( , ) max , , ,H A B h A B h B A
A
B
H(A,B)

Paper Overview – partial Hausdorff
A
B
h(A,B)
( , ) minth
b Ba Ah A B k percentile a b
?

Paper overview - Hausdorff
A Ba1
a2a3
b1
b2
( , ) max minb Ba A
h A B a b
h(A,B)forward distance

Paper overview - FQI
1 2 1 2
1 2 1 2
1 2
1 2
1 1
2 2 2 2
,
,
,
2 2
k
k
R R R R
R R R R
FQI R R
PHD R R
Mean PHD R Surrogates of R

Paper overview - FQI
normalized [0, ]
modified UIQI [0,1]kPHD
FQI

Paper Overview - surrogates

Paper overview – illustrative example
RMSE EqTh FQI
0 vs 1 68.41 -0.02 0.39
0 vs 2 68.41 -0.02 1.15
01
2


Geometric examples
CSI = 0 for first 4;
CSI > 0 for the 5th
O F O F
O F O F
FO
O F O F
O F O F
O FO F O FO F
O FO F O FO F
FO FO

PHD75
mod. UIQI
mod. UIQI, including
zero pixels


when I did 10 surrogates <HS> = 271 +/-27

Perturbed fake cases
1. 3 pts right, -5 pts up
2. 6 pts right, -10 pts up
3. 12 pts right, -20 pts up
4. 24 pts right, -40 pts up
5. 48 pts right, -80 pts up
6. 12 pts right, -20 pts up, times 1.5
7. 12 pts right, -20 pts up, minus 0.05”


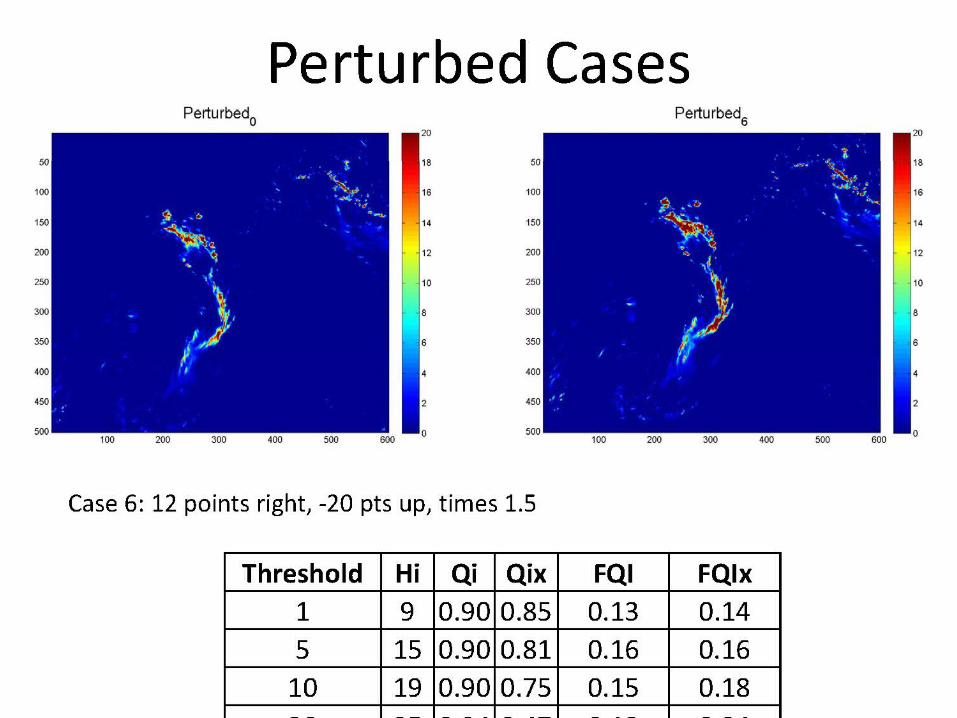


Spring 2005 SPC cases
surrogates pictures example of distribution of forward and
backward Hausdorff distances comparison to traditional methods comparison to expert scores


100 surrogates – distribution of Hausdorff distance, solid/forward, dash/backward
75th percentile
Hausdorff distance (in grid spacing units)
coun
t

standard error
surrogate mean PHD75 mod.
UIQI FQI: 0.47-0.49
PHD75
normalized [0, ]
modified UIQI [0,1]kPHD
FQI

0.26-0.28
0.34-0.370.25-0.27

0.21-0.23
0.30-0.310.22-0.23

0.21
0.240.25

0.30
0.190.31

0.51
0.420.69

0.27
0.370.30

0.37
0.330.40

0.34
0.490.33

0.42
0.540.48
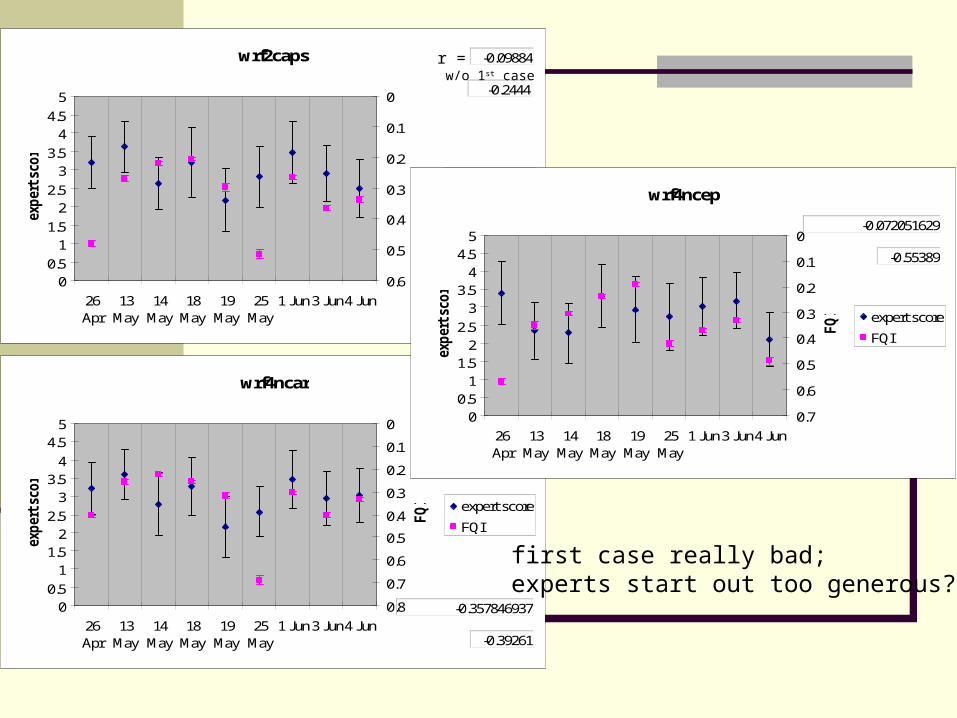
wrf2caps
00.5
11.5
22.5
33.5
44.5
5
26Apr
13May
14May
18May
19May
25May
1 Jun3 Jun4 Jun
exper
t sc
ore
0
0.1
0.2
0.3
0.4
0.5
0.6
FQ
I expert score
FQI
wrf4ncar
00.5
11.5
22.5
33.5
4
4.55
26Apr
13May
14May
18May
19May
25May
1 Jun3 Jun4 Jun
exper
t sc
ore
0
0.1
0.2
0.3
0.4
0.5
0.6
0.7
0.8
FQ
I expert score
FQI
wrf4ncep
00.5
11.5
22.5
33.5
44.5
5
26Apr
13May
14May
18May
19May
25May
1 Jun3 Jun4 Junex
per
t sc
ore
0
0.1
0.2
0.3
0.4
0.5
0.6
0.7
FQ
I expert score
FQI
first case really bad;experts start out too generous?
-0.09884
-0.357846937
-0.072051629
-0.55389
-0.39261
-0.2444
r =w/o 1st case

expert scores vs grid stats
grid stats agree: first case was bad

Pearson correlation coefficient and Spearman rank correlation coefficient

FQI Discussion
application to ensembles adding to MET . . .