vernance insurance and risk management
TRANSCRIPT

JOURNAL OF CORPORATE GOVERNANCE, INSURANCE AND
RISK MANAGEMENT
ISSN: 2757-0983 (Online), Volume 2 Number 3
EDITORS-IN-CHIEF
Igor Todorović - University of Banja
Luka, Faculty of Economics, Bosnia and
Herzegovina
Simon Grima - University of Malta,
Faculty of Economics, Management &
Accountancy, Malta
Ercan Özen - University of Uşak, Faculty
of Economics, Turkey Darko Tipurić - University of Zagreb, Faculty of Economics, Croatia
SECTION EDITOR-IN-CHIEF
Pierpaolo Marano - UNICATT Milan,
Faculty of Insurance and Banking, Italy
Inna Romānova - University of Latvia,
Faculty of Economics, Latvia
Ramona Rupeika-Apoga - University of
Latvia, Faculty of Economics, Latvia
Eleftherios Thalassinos - University of
Piraeus, Faculty of Economics, Greece
Sandra C. Buttigieg - University of Malta,
Faculty of Health Sciences, Malta
Lana Cindrić - University of Zagreb,
Faculty of Economics, Croatia
EDITORIAL BOARD
Ahmet Gökgöz - University of Malta,
Insurance Department, Malta
Aluchna, Maria - Warsaw School of
Economics, Department of Management
Theory Poland
Andrea Imperia - Sapienza Università di
Roma, Department of Social and Economic
Sciences, Italy
Baldacchino, Peter J. - University of
Malta, Faculty of Economics, Management
& Accountancy, Malta
Beata Świecka - University of Szczecin,
Faculty of Economics, Finance and
Management
Bezzina, Frank - University of Malta,
Faculty of Economics, Management &
Accountancy, Malta
Bosetti, Luisa - University of Brescia,
Department of Economics and
Management, Italy
Capasso, Arturo - Università degli Studi
del Sannio, Department of Law,
Economics, Management and Quantitative
Methods (DEMM), Italy
Cassar, Vincent - University of Malta,
Faculty of Economics, Management &
Accountancy, Malta
Daraboš, Maja - University of Zagreb, Faculty of Economics, Croatia
De Beaufort, Viviane - ESSEC Business
School, Public and Private Policy
Department, France
Du Plessis, Jean - Deakin University,
Faculty of Business and Law, Australia
Duh, Mojca - University of Maribor,
Faculty of Business and Economics,
Slovenia
Engin Boztepe - Ardahan University,
Turkey
Esat Saçkes - University of Balıkesir, Turkey
Eser Yeşildağ - University of Uşak, Turkey Fatih Biyikli - Afyon Kocatepe University,
Turkey
Franzoni, Simona - University of Brescia,
Department of Economics and
Management, Italy
Galetić, Fran - University of Zagreb,
Faculty of Economics, Croatia
Gennari, Francesca - University of
Brescia, Department of Economics and
Management, Italy
Hakan Boz - University of Uşak, Turkey

Ilona Kwiecień - Wrocław University of
Economics and Business, Department of
Insurance
Institute of Economics and Finance, Poland
Kletz, Pierre- Ben-Gurion University of
the Negev, Guilford Glazer Faculty of
Business & Management, Israel
Korac Kakabadse, Nada - University of
Reading, Henley Business School, United
Kingdo
Letife Özdemir - Afyon Kocatepe
University, Turkey
Lojpur, Anđelko - University of
Montenegro, Faculty of Economics,
Montenegro
Marta Borda - Wroclaw University of
Economics, Department of Insurance,
Poland
Mihalič, Tanja - University of Ljubljana,
Faculty of Economics, Slovenia
Molina Moreno, Valentin - University of
Granada, Faculty of Economics, Spain
Nichol, Timothy - Liverpool John Moores
University, Liverpool Business School,
United Kingdom
Nyuur, Richard B. - Northumbria
University, Newcastle Business School,
United Kingdom
Omazić, Mislav Ante - University of
Zagreb, Faculty of Economics, Croatia
Pastuszak, Zbigniew - Maria Curie-
Sklodowska University, Faculty of
Economics, Poland
Patrick J Ring - Glasgow Caledonian
University,Department of Finance
Accounting and Risk, Glasgow School for
Business and Society, Scotland
Pucar, Stevo - University of Banja Luka,
Faculty of Economics, Bosnia and
Herzegovina
Rebecca Dalli Gonzi - University of Malta,
Faculty for the Built Environment, Malta
Serap Vurur - Afyon Kocatepe University,
Turkey
Štrukelj Tjaša - University of Maribor,
Faculty of Business and Economics,
Slovenia
Šunje, Aziz - University of Sarajevo,
Faculty of Economics, Bosnia and
Herzegovina
Tehmina Khan - School of Accounting,
Information Systems and Supply Chain.
RMIT University, Melbourne Australia
Tsukanova, Tatyana - St. Petersburg
University, Graduate School of
Management, Russia
Tulus Suryato - University Islam Negeri
Raden Intan Lampung, Faculty of Islamic
Business and Economics, Indonesia
Uvalić, Milica - University of Perugia,
Faculty of Political Sciences, Italy
ISSN: (Online) www.jcgirm.com
Published by:
Centar za istraživanje i razvoj upravljanja
d.o.o.
CIRU - Governance Research and
Development Centre
Kraljevićeva 6, 10000 Zagreb, Croatia
&
University of Malta, Faculty of Economics,
Management and Accountancy
Department of Insurance, Room 218
Msida MSD2080, Malta
All papers in EJEM are published under the terms of
the Creative Commons Attribution (CC BY) license
(www.creativecommons.org/licenses/by/4.0/).
THE JOURNAL OF CORPORATE
GOVERNANCE, INSURANCE AND
RISK MANAGEMENT
This Journal replaces the former
European Journal of Economics and
Management (EJEM) first launched in
2014. The Journal is an international open-
access refereed indexed journal, published
twice Annually.
The aim of the Journal of Corporate
Governance, Insurance and Risk
Management (JCGIRM) is to publish
quantitative and qualitative studies from
selected areas within these disciplines and
other related areas such as Banking,
Accounting, Auditing, Compliance,
Sustainability, Behaviour, Management
and Business Economics.
The main scope of the journal is to
spread original academic, theoretical and
practical insights and studies about these
fields to a national and international
audience, with the widest reach and
spectrum as possible.
The articles to be submitted should be
in English. JCGIRM welcomes articles
from different institutions and countries.
All manuscripts submitted to the JCGIRM
are sent to the referees after the initial
review of the editorial board with respect to
formatting and content. Manuscripts must
be submitted in accordance with the style of
writing specified in the book of “The
Publication Manual of the American
Psychological Association (5th edition).
Focus and Scope
The Journal of Corporate
Governance, Insurance and Risk
Management (JCGIRM) is a peer-reviewed
online journal for scientists, researchers and
academics involved in all aspects of
Corporate Governance, Insurance and Risk
Management to publish their original
research and innovative applications. The
journal welcomes high-quality original
research papers, survey papers, case
studies, review papers, tutorials, technical
notes as well as the discussion papers in the field of Business Economics and Finance.
The Journal focuses on research
articles presented in International
Conferences offering publication
opportunities in the form of collective
volumes, in specific research fields, country
analyses and groups.
The main sub-sectors considering for
publication by the journal are:
• International Economics and Finance
• Insurance, Investments and Banking
• Risk Management
• Management Accounting and Audit Management
• Business Development
• International Financial Services and
Portfolio/Asset Management
• Financial Analysis • Regulation – Market, Insurance, Banking
and Investment
• Risk Analysis
• Corporate Finance
• Financial Markets • Monetary and Fiscal Policy Decision-
Making
• Portfolio and Asset Management
• Risk Management in Real Estate and Health
• Corporate Governance
• Sustainability Risk Management
• Business Continuity and Crisis
Management

Table of Contents
Article Name and Authors Pages
Union activity in subsidiaries of multinational corporations in Republic of Croatia
1
Najla Podrug, Mario Filipović, Valentina Kuča
Destination Competitiveness Analysis for Creative Crafts Industries in Bantul Yogyakarta Indonesia
16
Ratna Roostika, Tri Wahyuningsih, Sigit Haryono
EXAMINING THE RELATIONSHIP BETWEEN SAVINGS AND DEPOSIT RATES 34
Tafirei Mashamba, Rabson Magweva
The Demand for International Reserves in Lesotho 52
Senei Solomon Molapo, Retselisitsoe Isaiah Thamae
An Analysis of Machine Effectiveness on the Production Line by Using Overall Equipment Effectiveness (OEE) Method Based on Total Productive Maintenance (TPM) Principle (A Study Case of Ball Tea Machine in PT Kabepe Chakra)
67
Aysha Herdiwan, Sri Widiyanesti
Analysis of Desktop Browser Positioning Based on Users Perception in Indonesia
80
Osa Omar Sharif, Zaenal Ali Alatas, Dini Turipanam Alamanda, Arif Partono Prasetio
Online Purchase Intention of Tablets (PC): Role of Social Media and Learning Style
91
Bidyanand Jha, Dr.K.V.A.Balaji
Good work ethics and service delivery in public universities in the south- 117

south region of Nigeria
Ushie, E. M., Agba, A. M. Ogaboh
EMPIRICAL ANALYSIS OF BANK RECAPITATLISATION IN NIGERIA (1986-2011)
131
Imahe Godfrey
Conflict resolution analysis using graph model for conflict resolution (GMCR) approach (a case study in conflict and cooperation agreement between IDT and IDMT)
148
Chintya Faradita Putri, Dini Turipanam Alamanda

Pages 1-15
PAGE 1| Journal of Corporate Governance, Insurance, and Risk Management | 2015, VOL. 2, NO. 3
Journal of Corporate Governance, Insurance, and Risk Management (JCGIRM)
2015, Volume 2, Series 3
Union activity in subsidiaries of multinational corporations in
Republic of Croatia
Najla Podruga,*
, Mario Filipovićb, Valentina Kuča
aFaculty of Economics and Business Zagreb, University of Zagreb, J. F. Kennedy 6, 10 000 Zagreb, Croatia bFimar d.o.o. Split, Matice hrvatske 9/a, 21 000 Split, Croatia
A B S T R A C T A R T I C L E I N F O
Multinational corporations as the primary holders of foreign direct
investments have a significant impact on the national economy with a
well-developed and prepared institutional infrastructure, but they have
even stronger impact on the transition economies and developing
countries. Expanding into new markets, multinational corporations create
new jobs; therefore unions have an important role in protecting employees'
rights and their representation towards employers. The role of unions in
the lives of all employees is even more noticeable because the situation on
the labor market is extremely unfavourable and in many countries
employees' rights are threatened. But researches also show that the
proportion of union membership in the developed countries is decreasing,
and also in developing countries and this trend has not bypassed Croatia.
The aim of this paper is to investigate the role of unions in the subsidiaries
of multinational corporations in Croatia. In more than half of the analyzed
subsidiaries of multinational corporations we identified one hundred
percent coverage of employees by collective agreements. We analyzed the
most common reasons for joining the union and evaluated the relationship
between unions and human resource management departments.
Keywords:
union, subsidiary of multinational
corporation, union’s activities,
Republic of Croatia
*Corresponding author:
Article history:
Article Submitted 14-04-2015
Article Accepted 20-06-2015
**Article previously published in
EJEM 2015, vol 2, No. 3
1. INTRODUCTION
In today's global world, multinational corporations play a leading role in the development of
the world economy. They are the drivers of globalization, liberalization, conglomerations,
financial innovations, and new forms of financing. It is known that the developed countries
are those that have the best basis for the development and operations of multinational
corporations, but it's often the case that such corporations also choose developing countries or
countries in transition as a place for the establishment of their new subsidiary. Due to the
fierce competition that is present on today's market, the achievement of organizational goals is
impossible without the joint efforts of employees and managers. Employers are becoming
increasingly aware that the quality of their products and services on the market is not going to
be possible without high-quality and satisfied employees. Also, employees have developed
awareness of the fact that only hard work and education will lead them to the desired position

PAGE 2| Journal of Corporate Governance, Insurance, and Risk Management | 2015, VOL. 2, NO. 3
in the organization. Although it is beyond doubt their mutual need, their goals often differ,
and collective bargaining is a method used to meet their different needs. That is a job of trade
unions whose main purpose is serving the society with their work. It can be said that today's
trade unions are focused on serving the public, development of society and civil values. They
perform a number of tasks on a daily basis for the benefit of its members, but also meet the
interests of the government, the country and the wider community. Basic service that unions
provide to its members is ensuring adequate compensation and working conditions. The
purpose of this study is determining the position of the trade unions and their specific
activities in the subsidiaries of multinational corporations in the Republic of Croatia.
2. MULTINATIONAL CORPORATIONS AND UNIONS
The importance of large corporations goes beyond the framework of partial economic activity
and they become a universal social phenomenon that affects all three dimensions of
sustainable development: social, economic and environmental (Galetić, 2011, p. 6).
According to the United Nations Conference on Trade and Development (UNCTAD), a
multinational corporation is a company that is composed of subsidiaries in more than one
country and operating under a system that allows coherent policy and decision-making.
Subsidiaries are linked by ownership or otherwise so one of them or a couple of them can
affect the other one, and in particular to lead to the exchange of knowledge, resources and
responsibilities. Using internationalization, corporations expand their operations to other
countries and when choosing a foreign market, the following criteria is considered: size and
growth of the market, the existence of attractive consumer groups and the demand for
products or services offered by a corporation (Rahimić and Podrug, 2013, p. 66.) If achieving
efficiency is a motive for internationalization, then the election of the country where the
production will be internationalized is based on the following criteria: the cost of production
in certain countries, the distance from major markets (because it affects the cost of
distribution), the possibility of integrating all processes into a single cross-border process and
availability of resources and suitable suppliers (Dunning and Lundan, 2008, p. 72).
Production costs can differ drastically. For example, labor costs in the production in Norway
are 60% higher than the US average, and are fifty times higher than the costs in China. The
first twelve countries in terms of the amount of labor costs in manufacturing are European
countries, followed by the United States and Australia. It is interesting to note that the growth
of employee income in the production is much faster in China and India than in the US,

PAGE 3| Journal of Corporate Governance, Insurance, and Risk Management | 2015, VOL. 2, NO. 3
however, it is still only 4% of average income in the United States (Rahimić and Podrug,
2013, p. 68).
Methods of expanding multinational corporations around the world are (Norbaeck, 2001, p.
455):
• horizontal integration - the opening of a subsidiary of the parent corporation in the
world that produce the same goods or goods of the same product group, hence using
the same technology and for the same consumer groups.
• vertical integration - subsidiaries abroad are suppliers of raw materials, where are
parent corporation supplies them with factosr of production.
• diversification of multinational corporations - meaning the existence of a subsidiary of
the parent corporation that produce goods different from those produced by parent
corporation. It is usually carried out by acquisitions or mergers.
• conglomerations - opening branches abroad that produce goods or services belonging
to other industrial sectors and there is no similarity with the parent corporation when it
comes to technology, production, marketing and other.
By entering new markets, multinational corporations face many institutional constraints
which are different depending on the country; therefore it is considered subsidiary strategies
are becoming increasingly important for multinational corporations. When a multinational
corporation enters new markets, its success is partialy determined by the possibility of
transfering competitive technologies into the subsidiaries, which is often not easy (Dabić,
2007, pp. 29-42).
Foreign direct investment, besides transfering financial capital, include the transfer of modern
technology and other intangible assets. In this way, foreign corporations can significantly
affect productivity growth and long-term economic growth in the recipient country. This is
the reason why direct investments of multinational corporations are considered one of the
main channels through which developing countries gain access to the latest technologies
which diffusion plays an important role in explaining economic growth (Bilas and Franc,
2006, p. 4).
By entering new markets, multinational corporations bring many positive and negative things.
In bad times and situations multinational corporations are being pointed out because of their
shortcomings, while in times of favorable situations only their their benefits are highlighted.
As an institution, multinational corporation can be a positive force that has a good influence

PAGE 4| Journal of Corporate Governance, Insurance, and Risk Management | 2015, VOL. 2, NO. 3
on the economy or a negative force that is bad for the economy (Tripathi, 2005, pp. 117-131).
The advantage of multinational corporations is reflected in the fact that they have many
resources that help growth and development of certain countries. Some of these resources are
already mentioned technology, management, know-how, skilled labor force, the international
production networks, access to markets and well-known brands. Multinational corporations
also promote development from a traditional point of view, increasing the level of investment
and capital stock in the host country (Bilas and Franc, 2006, p. 6).
Multinational corporations may shift production to the country where laws are more lenient if
laws of the certain country are too restrictive (Ćelić, 2000, pp. 14-15). It is known that
multinational corporations open subsidiaries in those parts of the world which combine cheap
labor and under-protected natural resources. This is the way that they exploit their power and
set conditions that are not always favorable. The entry of multinational corporations into the
market can inflict a heavy blow to domestic enterprises and cause them permanent damage.
Additional costs for the national economy may result in reduced employment and for two
reasons. One is the rationalization of the workforce in the acquired company, and the second
reason is extrusion of unsuccessful domestic companies. Also, the emergence of corporations
may lead to market deregulation in the form of development of oligopolies that reduce
competition and free entrepreneurship. In addition, it can lead to compromising and
diminishing the importance of national culture and national diversity of the so-called "world
culture" in which the dominant position is occupied by customer value, expansion and
deepening the gap between rich and poor countries, calling into question national sovereignty
and endangering country autonomy. Furthermore, it can reduce the amount of "good" and
increase the amount of "bad" jobs (differences in incomes among workers with the same skills
or qualifications are changing due to foreign direct investment and the imperfections of the
labor market). Looking at the macro level that will worsen the current account deficit of the
host country if the corporation resulting from foreign direct investments imports more than it
exports, for example, from their headquarters abroad (Bilas and Franc, 2006, p. 6).
Unions are legally regulated institution established by employees to represent them in the
complex economic and legal relationships with employers and government (Clawson, 1999,
p. 109). According to the Croatian Labour Law (2014) for the establishment of trade unions
there has to be a minimum of ten adult persons with legal capacity. A worker who is a trade
union must be in the same situation as the one that is not in the union. It follows that it is
expressly forbidden (Labour Act, 2014): assembling an employment contract with a worker

PAGE 5| Journal of Corporate Governance, Insurance, and Risk Management | 2015, VOL. 2, NO. 3
on condition that he would not join an union, i.e. on condition that he leaves an union or
cancelling the contract or otherwise put workers in a less favorable position than other
workers because of his union membership or participation in union activities outside working
hours, and with the consent of the employer and in time of the working hours. A worker who
is a union member has the obligation to pay membership fees. It has to be calculated and
withhold from the employee's salary by the employer for the account of the union.
The most important areas trade unions affect are (Marić and Pološki Vokić, 2012, p. 15):
• economic conditions - equitable distribution of wages and benefits,
• working conditions - ensuring humane working conditions relating to hours of work,
equal opportunities for all workers, safety and health in the performance of work,
• participation in decision making - enabling employees to participate in decision
making,
• society - through a fair tax policy and social transfers commitment to a fairer
distribution of wealth.
The role in society is very important area for union activity today. Their main purpose is to
serve society through their work. It can be said that today's unions focus on serving the public
and the development of society and civil values. The process of trade union action is the
following: they invest the resources (financial and human) in order to resolve conflicts
between employers and workers and provide other services to the membership, and it is a
prerequisite for attracting new members.
Unions are complex organizations that perform a number of tasks on a daily basis for the
benefit of its members, but also meet the interests of the government, the country and
ultimately the wider community. To satisfy all interests, activities carried out by unions can
be classified into four basic groups (Independent Union of Research and Higher Education -
NZS):
• union political activities - the management and implementation of trade union policy,
negotiations on wages and collective agreements, initiating and planning of trade
union action, representation, managing intraunion policy, international cooperation;
• administrative-managerial activities - management of the union, management of the
secretariat, managing people and working with personnel, operations of monitoring
and evaluation (management of the organization), extraordinary activities (periodical

PAGE 6| Journal of Corporate Governance, Insurance, and Risk Management | 2015, VOL. 2, NO. 3
jobs and projects, strikes, protests) and regular activities (organizing work of the body,
care for affiliates and members in the secretariat, conduct of business);
• professional activities - legal, economic, informing, propaganda and IT;
• executive jobs - executive and organizational duties, material and financial affairs,
auxiliary, technical, administrative, IT.
After the establishment of the union, it is very important to communicate in order to attract
new members. Today it is very difficult to recruit new members into the union. The most
common reason is ignorance and lack of information. Experts in this field believe that it is
necessary to inform young people who are in the process of job search (Hernaus, 2012, pp.
39-40).
After new members join the union they need to be kept in there. Nowadays that is a complex
job that involves detailed introduction of the new members with the objectives and activities
of unions. The recommendation is having an orientation program which directs new members
in details to the goals and values of the services and activities offered by unions. They should
also be represented to the union representatives responsible for individual segments of
activity. This whole process is called socialization of new members and, if well implemented,
it increases the chances that the new members remain in the union.
Table 1. The benefits for union members and the organization
BENEFITS FOR UNION MEMBERS BENEFITS FOR ORGANIZATION
higher wages and benefits greater work effort and work performance
higher safety and health on work a better relationship with customers
better communication between employees and
management
greater employee involvement in decision-making
related to organizing and carrying out the work
participation in decision making greater loyalty and organizational commitment
higher job satisfaction, motivation and employee
moral
lower fluctuation rates and absenteeism of
employees
greater satisfaction with resolving complaints better management
more additional training, education and
development
better quality of products/services
better standard of living and better quality of life higher productivity, profitability and
organizational effectiveness, hiring the best
employees because of the desirability of employer

PAGE 7| Journal of Corporate Governance, Insurance, and Risk Management | 2015, VOL. 2, NO. 3
Aim of the unions is achieving good working conditions for workers. This is the reason why
they increasingly conflict with employers who are aimed at profitability maximization. The
ideal relationship between them would be a partnership from the start, but it is only the final
result which is formed after the conflict that is very common among them. The reasons for
conflict vary, but they all boil down to the fact that employers and trade unions, as workers'
representatives, have conflicting requirements. Finding resolution includes three parties: labor
unions as representatives of workers, employers and the country.
The unions operate through collective agreement, at the level of organization, on the
compensation of employees. The most important result of their negotiations is the growth of
wages. These are followed by the rest of the results of the negotiations: wages equality,
defining compensation structures and payment systems, establishment of a unified salary
structure, fairness in rewarding employees and increase of the number and value of benefits.
Research shows decreasing proportion of union membership in the developed countries but
also in developing countries as well as those emerging from communism. This trend has not
bypassed Croatia. The consequences are privatization, restructuring and reducing the number
of employees in the public and an increase in the private sector. In fact, once the union
membership was mandatory, and today is voluntary and it is the main reason for reducing the
number of people in unions. The economic crisis that striked the world, including Croatia, led
to unfavorable changes in the negotiation process. The goal became maintain jobs, and in
accordance with that unions and workers needed to be more flexible in the arrangements. It
also revived the question of minimum wages because employers have increasing costs, on the
other hand, the law which stipulates the obligation of payment of the minimum wage.
According to the official records of the Ministry of Labour and Pension System, in Croatia's
state administration offices at the county level in late July 2015, there were 314 registered
unions. Significantly stands out Split-Dalmatia County with 95 unions, followed by Primorje-
goranska with 33 unions and Virovitica-Podravina with 23 unions. The city of Zagreb has 42
registered unions. Regional differences are the result of, on the one hand the difference in the
development of the economy and the number of larger businesses, but apparently also some
other factors such as the level of union awareness and involvement of union leaders.
Trade union confederations in Croatia representative to participate in tripartite bodies at the
national level are (NN, 2013):

PAGE 8| Journal of Corporate Governance, Insurance, and Risk Management | 2015, VOL. 2, NO. 3
• Independent Croatian Trade Unions
• The Alliance of Independent Croatian Unions
• Association of Croatian Trade Unions
• Croatian Association of Trade Unions
Table 2. Number of affiliated unions in the union bisector in the Republic of Croatia
UNION BISECTOR NUMBER OF AFFILIATED UNIONS
(2015)
Independent Croatian Unions 66
The Alliance of Independent Croatian Unions 23
Association of Croatian Trade Unions 11
Croatian Association of Trade Unions 60
3. EMPIRICAL RESEARCH ON UNION ACTIVITIES IN SUBSIDIARIES OF
MULTINATIONAL CORPORATIONS IN THE REPUBLIC OF CROATIA
Empirical research on the role of unions in multinational corporations in the Republic of
Croatia was conducted among union officials and union members employed in subsidiaries of
multinational corporations in the Republic of Croatia. The survey instrument was a
questionnaire that enabled the collection of data on union activities in those corporations. The
sample was made from employees of subsidiaries of multinational corporations operating in
the Republic of Croatia who are union members or union representatives in that subsidiary of
multinational corporation, and who also conduct union activities, are knowledgeable of the
area and have access to the data required for the fulfillment of the relevant questionnaire. The
questionnaire was sent to the address of union representatives in the subsidiaries of
multinational corporations in the Republic of Croatia and the total collected completed
questionnaires were 21.
95.2% of respondents are representatives of unions in the subsidiary of multinational
corporation in which they work, and more than half of them are involved in the subsidiary
union more than ten years. 38.1% of union officials account for more than 32 hours a month
in union activities. They are followed by those who spend more than 8 hours making 23.8%,
while 19% of them spends 4-8 hours or less than 4 hours to union activities.

PAGE 9| Journal of Corporate Governance, Insurance, and Risk Management | 2015, VOL. 2, NO. 3
Analysis of industries in which subsidiaries of multinational corporations operate is shown in
Table 3. Most of the respondents included in the survey work in the subsidiaries of
multinational corporations in the manufacturing industry and trade.
Table 3. The industry in which the subsidiary of the multinational corporation operates
INDUSTRY NUMBER OF
MULTINATIONAL
CORPORATION
SUBSIDIARIES
manufacturing industry 5
wholesale and retail 5
mechanical engineering 2
civil and construction engineering 2
mining 1
agriculture 1
metal industry 1
pharmaceutical industry 1
beverage industry 1
machine industry 1
gaming industry 1
Research has shown that the unions have been operating for many years in the subsidiaries of
multinational corporations. Of all the respondents exceptions are two corporations, and the
reason is actually their late arrival to the Croatian market. The maximum annual rate of
accession of new members is 20% present in only one corporation, while in others the rate
moves below 10%, and is usually 1-5%. Four corporations have 80-90% of employees
involved in the union, while the two corporations have only 0-10% of included employees.
"According to the Croatian Labour Law of 2014, the collective agreement determines the
rights and obligations of the parties that have concluded this agreement, and may include
legal rules by which are determined conclusion, content and termination of labor relations,
social security and other issues arising from employment or in relation to employment." In
more than half of the subsidiaries of multinational corporations coverage of employees by
collective agreement is 100%. But there is the other extreme, where the coverage of
employees by collective agreement is 0-10%.

PAGE 10| Journal of Corporate Governance, Insurance, and Risk Management | 2015, VOL. 2, NO. 3
Chart 1. The coverage of employees by collective agreement
From the analysis of the benefits that employees have from accessing union it can be
concluded that the majority of employees have economic (unions negotiate wages, benefits,
etc.), psychological (result from the sense of belonging to the group and influence on decision
making) and social benefits (as a result of community among members).
The union can promote itself verbally (communication with colleagues - "face-to-face" in the
workplace and outside) and in writing (leaflets to join, magazines, website, e-mail,
publication in a newspaper) or a combination of the two methods. In 57.1% of the analyzed
union promotion is conducted verbally, in writing 14.3%, while the combination of verbal and
written is used by 28.6% of the unions.
Table 4. Areas covered by collective agreement
AREA THE PERCENTAGE OF COVERAGE BY
COLLECTIVE AGREEMENT
paying and rewarding and working time 85.7%
health and safety at work 81%
work environment and work standards 57.1%
education and development 47.6%
disagreements at work 42.9%
job security 38.1%
5
1
2 2
12
0
2
4
6
8
10
12
14
0-10% 20-30% 70-80% 80-90% 100%
NU
MB
ER O
F M
ULT
INA
TIO
NA
L C
OR
PO
RA
TIO
N S
UB
SID
IAR
IES
PERCENTAGE OF COVERAGE

PAGE 11| Journal of Corporate Governance, Insurance, and Risk Management | 2015, VOL. 2, NO. 3
recruitment, promotion and dismissal 28.6%
health and pension insurance 14.3%
Unions provide a variety of additional services, and the most common are the following:
95.2% of them provides advisory services (legal advice, psychological support, etc..), 61.9%
provide reaction services (organizing sports recreation, union sports games), 57.1% financial
services (union savings, union loan, recompense for unemployment in the period between two
jobs), 52.4% social and cultural activities (regular meetings, joint celebration of holidays and
public holidays), 19% services related to holidays (union resorts, organizing tours and trips),
14.3% services related to the health of members (check-ups, discounts for health insurance)
and 4.8% further education (retraining, specialization, etc.).
The most common reasons for joining an union are existential (higher wages and benefits,
better working conditions, social protection, job security, etc.), social reasons (a belief in the
unions, social pressure, the individual needs to be accepted and part of a group) and the
provision of additional benefits (developing knowledge and skills through educational
programs organized by unions, self-fulfillment, free legal advice, etc.).
Lack of confidence in the unions as an organization is a reason for not joining unions in
47.6% of cases. The second reason is ignorance of the purpose and existence of unions, lack
of conviction about the validity of syndicalism as an idea, social pressure on non-
membership. There are employees who do not have any particular reason why they do not
want to be in the union (passive non-accession), and there are those who have clear reasons
why they are against joining the union (active non-accession). Nowadays the more common
cause of passive non-accession is the fact that collective agreement applies to all employees.
The union can consist of various services. The survey showed that 85.7% of the analyzed
unions in subsidiaries of multinational corporations have union office, while the secretariat
and professional and administrative service are represented in the minor quantities. As a part
of the technical and administrative services different departments can be set up. Most unions
have a legal department, collective bargaining department and the department of finance.
In 38.1% subsidiaries of multinational corporations there is a coexistence of unions and
human resources management, according to which the union and the departments of human
resources management function in parallel, but their activities do not intertwine or overlap.
Synergy of unions and human resources management is present in 28.6% of subsidiaries of

PAGE 12| Journal of Corporate Governance, Insurance, and Risk Management | 2015, VOL. 2, NO. 3
multinational corporations. It implies a common care for employees and cooperation of
unions and the department of human resources management. This model is the best for the
employees because it creates a high-quality working environment. There are corporations
where employee care is the duty only of unions or only of departments of human resources
management.
Chart 2. The relationship of union and human resources management
Most respondents believe that more activities customized to young people (social and cultural
events, excursions) would contribute to increase of youth participation in the union. They also
consider a necessity of promotion of unions, increase of communication with young people
through social networks (Facebook, Twitter, etc.) and rejuvenation of leadership. As for the
rejuvenation of management, they find necessary connecting the knowledge of older members
and new ideas and perspectives of young union members and thus increasing the interest of
young people in the union.
6
2
8
5
0
1
2
3
4
5
6
7
8
9
synergy of unionsand humanresources
management
human resourcesmanagement cares
for employees
coexistence ofunions and human
resourcesmanagement
unions care foremployees
NU
MB
ER O
F U
NIO
NS

PAGE 13| Journal of Corporate Governance, Insurance, and Risk Management | 2015, VOL. 2, NO. 3
Chart 3. Changes that would contribute to increase of youth participation in the union
In conclusion, the respondents believe that there is a lack of young people involved in the
union. The reason for this situation is the lack of information and ignorance of youth when it
comes to unions. In order to change the current situation it is necessary to carry out more
activities tailored to the youth, introduce education in final years of the high school and
college, and change the union image and way of communicating with youth.
4. CONCLUSION
Multinational corporations are willing to transfer technology to the countries in transition and
less developed countries and thus help them, but also provide itself with a competitive
advantage and higher profits. They are the holders of foreign direct investment, and they are
particualarly important for relations between the global and national elements. Croatia
represents more and more attractive place for direct foreign investments, i.e. multinational
corporations. Due to the fierce competition that is present on today's market, the achievement
of organizational goals is impossible without the joint efforts of employees and managers.
Employers are becoming increasingly aware that the quality of their products and services on
the market is not going to be possible without high-quality and satisfied employees, and
7
15
9
11 12
0
2
4
6
8
10
12
14
16
rejuvenation ofleadership
more activitiescustomized toyoung people
communicationwith young people
through socialnetworks
change of theimage of unions
promotion ofunions in school
and at university,cultural centers
and youthpromotion of
unions in schooland at university,cultural centers
and youth festivals
BR
OJ
SID
NIK
ATA

PAGE 14| Journal of Corporate Governance, Insurance, and Risk Management | 2015, VOL. 2, NO. 3
considering that number of employees is too big to negotiate on their own behalf, they are
associating in the unions who are their representatives.
This empirical research is of pioneering character and raises many questions for future
research. Certainly, more extensive research with a larger number of subsidiaries of
multinational corporations in the Republic of Croatia would provide a clearer picture of the
status and role of unions. It would also be interesting to make a comparison of the activities of
unions of Croatian companies and subsidiaries of multinational corporations in the Republic
of Croatia. Future research should analyze unions of one selected multinational corporation as
well as the activities of unions in its subsidiaries around the world. It would certainly be
useful to involve other stakeholders in the research, such as employees in order to perform
various other conclusions on the work of unions and their role in the lives of employees.
REFERENCES
Bilas, V., Franc, S. (2006), „Uloga inozemnih izravnih ulaganja i načini poticaja“, Serija
članaka u nastajanju, December, pp. 4-11.
Clawson, D., Clawson, M. A., (1999), „What has happened to the US labor movement? Union
decline and renewal“, Annual Review of Sociology, Vol. 25 No.1, pp. 95-119.
Ćelić, M. (2000), Multinacionalne kompanije i ekonomska integracija, Ekonomist, 7/8, pp.
14-15.
Dabić, M. (2007), Uloga multinacionalnih kompanija u promicanju tehnološkog razvoja
zemalja u tranziciji, Zbornik Ekonomskog fakulteta u Zagrebu, Vol. 5 No.1. pp. 29-42.
Dunning, J., Lundan, S. (2008), Multinational Enterprises and the Global Economy, Second
edition, Edward Elgar Publishing, Cheltenham
Galetić, L. (2011), Organizacija velikih poduzeća, Sinergija, Zagreb
Hernaus, T. (2012), „Cost-benefit sindikata na mikrorazini“, in: Pološki Vokić, N., Obadić, A.
(ed.), Evolucija sindikata: uloga sindikata u suvremenome društvu, Ekonomski fakultet,
Zagreb, pp. 81-96.
PAGE 15| Journal of Corporate Governance, Insurance, and Risk Management | 2015, VOL. 2, NO. 3
Hernaus, T., Pološki Vokić, N. (2012), „Dnevni red sindikata“, in: Pološki Vokić, N., Obadić,
A. (ed.), Evolucija sindikata: uloga sindikata u suvremenome društvu, Ekonomski fakultet,
Zagreb, pp. 37-66.
Marić, I, Pološki Vokić, N. (2012) „Sindikati kao organizacija civilnog društva“, in: Pološki
Vokić, N., Obadić, A. (ed.), Evolucija sindikata: uloga sindikata u suvremenome društvu,
Ekonomski fakultet, Zagreb, pp. 13-36.
Narodne novine (2014.) „Zakon o radu“, Vol. 93, No.14, pp. 42.
Norbaeck, P. J. (2001), Multinational firms, tehnology and location“, Journal of
International Economics, Vol. 54 No. 512, pp. 449-469.
Rahimić, Z., Podrug, N. (2013), Međunarodni menadžment, Ekonomski fakultet u Sarajevu,
Sarajevo
Tripathi, S. (2005), International Regulation of Multinational Corporations, Oxford
Development Studies, Vol.33 No.1, pp. 117-131.

Pages 16-33
PAGE 16| Journal of Corporate Governance, Insurance, and Risk Management | 2015, VOL. 2, NO. 3
Journal of Corporate Governance, Insurance, and Risk Management (JCGIRM)
2015, Volume 2, Series 3
Destination Competitiveness Analysis for Creative Crafts
Industries in Bantul Yogyakarta Indonesia
Ratna Roostikaa,*
, Tri Wahyuningsihb, Sigit Haryono
c
aDepartment of Management, UPN ‘Veteran’ Yogyakarta bDepartment of Management, UPN ‘Veteran’ Yogyakarta cDepartment of Management, UPN ‘Veteran’ Yogyakarta
A B S T R A C T A R T I C L E I N F O
Escalating competition among destinations has become more obvious.
Shopping for handicrafts is one of important activities in tourism.
Handicraft industry is a low technology, labor intensive, and run
dominantly by small medium enterprises (SMEs). Handicraft industry is
one of creative industries sector in Indonesia that promises to accelerate
the growth of the Indonesian economy. To remain competitive,
understanding on the competitive nature of handicrafts market need to be
continuously monitored and adjusted to SMEs strategies. Using partial
least squares path modeling on a cross-sectional sample of 54 SMEs
owners in Bantul Yogyakarta, this study examines relationships among
factors of destination competitiveness with clusters competitiveness and
socio-economic welfare. The predictors assessed include given resources,
created resources, related-supporting factors, demand conditions and
strategy-structure-rivalry. Results indicate that supporting factors and
strategy-structure-rivalry are not significantly impact on cluster
competitiveness. The new final model was found that clusters
competitiveness mediates the relationships between three destination
competitiveness factors and socio-economic welfare. This study enriches
theories on destination competitiveness, particularly in assessing clusters
as the object of the study. The results are also important for policymakers
in strengthening destination competitiveness strategy.
Keywords:
SMEs, creative industry,
destination competitiveness,
economic prosperity
*Corresponding author:
Article history:
Article Submitted 14-04-2015
Article Accepted 20-06-2015
**Article previously published in
EJEM 2015, vol 2, No. 3
1. INTRODUCTION
Since oil and gas exports have decreased in 90th era, Indonesian Government expects to boost
exports from non-oil and gas industry including creative industries. Creative industry is now an
important sector due to its growth rate, capability to generate significant income, and in providing job.
Creative industry in Indonesia has grown at an average rate of GDP up to 9% or amounting US$ 58.5
per year (thejakartapost 2014). There are 14 sub-sectors in Indonesian creative industries and some of
them include handicraft, arts and antique markets, performing arts, movie, fashion, game, culinary,
and designs. The growth of creative industry is highly influenced by the current advanced in
technology, globalization as well as the increase in global income. More people are entering into
middle level of income thus they have better access to education, technology as well as they are more
mobile. The increase of global welfare gives engine to the growth of creative industries.
The growth of creative industries in Indonesia cannot be separated from the growth of tourism
sector as a sector which provides the biggest market for selling creative products and services. When
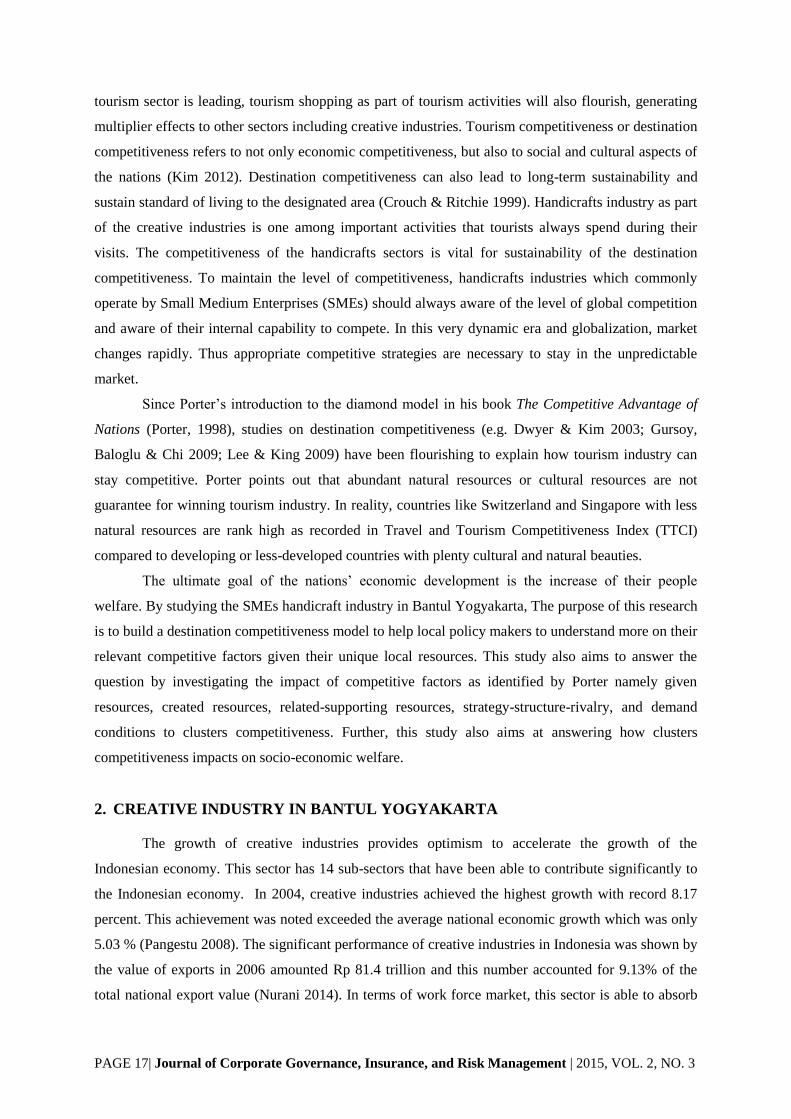
PAGE 17| Journal of Corporate Governance, Insurance, and Risk Management | 2015, VOL. 2, NO. 3
tourism sector is leading, tourism shopping as part of tourism activities will also flourish, generating
multiplier effects to other sectors including creative industries. Tourism competitiveness or destination
competitiveness refers to not only economic competitiveness, but also to social and cultural aspects of
the nations (Kim 2012). Destination competitiveness can also lead to long-term sustainability and
sustain standard of living to the designated area (Crouch & Ritchie 1999). Handicrafts industry as part
of the creative industries is one among important activities that tourists always spend during their
visits. The competitiveness of the handicrafts sectors is vital for sustainability of the destination
competitiveness. To maintain the level of competitiveness, handicrafts industries which commonly
operate by Small Medium Enterprises (SMEs) should always aware of the level of global competition
and aware of their internal capability to compete. In this very dynamic era and globalization, market
changes rapidly. Thus appropriate competitive strategies are necessary to stay in the unpredictable
market.
Since Porter’s introduction to the diamond model in his book The Competitive Advantage of
Nations (Porter, 1998), studies on destination competitiveness (e.g. Dwyer & Kim 2003; Gursoy,
Baloglu & Chi 2009; Lee & King 2009) have been flourishing to explain how tourism industry can
stay competitive. Porter points out that abundant natural resources or cultural resources are not
guarantee for winning tourism industry. In reality, countries like Switzerland and Singapore with less
natural resources are rank high as recorded in Travel and Tourism Competitiveness Index (TTCI)
compared to developing or less-developed countries with plenty cultural and natural beauties.
The ultimate goal of the nations’ economic development is the increase of their people
welfare. By studying the SMEs handicraft industry in Bantul Yogyakarta, The purpose of this research
is to build a destination competitiveness model to help local policy makers to understand more on their
relevant competitive factors given their unique local resources. This study also aims to answer the
question by investigating the impact of competitive factors as identified by Porter namely given
resources, created resources, related-supporting resources, strategy-structure-rivalry, and demand
conditions to clusters competitiveness. Further, this study also aims at answering how clusters
competitiveness impacts on socio-economic welfare.
2. CREATIVE INDUSTRY IN BANTUL YOGYAKARTA
The growth of creative industries provides optimism to accelerate the growth of the
Indonesian economy. This sector has 14 sub-sectors that have been able to contribute significantly to
the Indonesian economy. In 2004, creative industries achieved the highest growth with record 8.17
percent. This achievement was noted exceeded the average national economic growth which was only
5.03 % (Pangestu 2008). The significant performance of creative industries in Indonesia was shown by
the value of exports in 2006 amounted Rp 81.4 trillion and this number accounted for 9.13% of the
total national export value (Nurani 2014). In terms of work force market, this sector is able to absorb
PAGE 18| Journal of Corporate Governance, Insurance, and Risk Management | 2015, VOL. 2, NO. 3
the labor force on average of 5.8% from 2002 to 2006. Handicrafts as a sub-sector of creative
industries ranks the second largest value of GDP contribution (25.51%), employment (31.07%),
number of exporters (33.02%,) and export (32.44%) (Viva 2010).
Yogyakarta is one of major tourist destinations in Indonesia. This province known as special
region of Yogyakarta (DIY) has many ancient cultural heritages, beautiful beaches, and a spectacular
active volcano. Local way of life and culture are of unique potentials for regional development,
especially in the tourism industry. In addition, the city of Yogyakarta carries a number of unique
attributes such as quality of education, quality of crafts makers, and quality of artists. Not only
Yogyakarta is important destination for international visitors, but also Yogyakarta has a strong magnet
for Indonesians to learn knowledge and culture. Lead by Sultan of Yogyakarta, he creates an
atmosphere where creativities can be openly flourished. This special atmosphere motivates the birth of
many artists and many cultural products that attract many Indonesians and foreigners to come to
Yogyakarta. Similarly, creativities in handicrafts productions are also receives positive atmosphere to
develop. It is therefore, when thinking of finding special handicrafts that represents Indonesia, many
have suggested to find them in Yogyakarta.
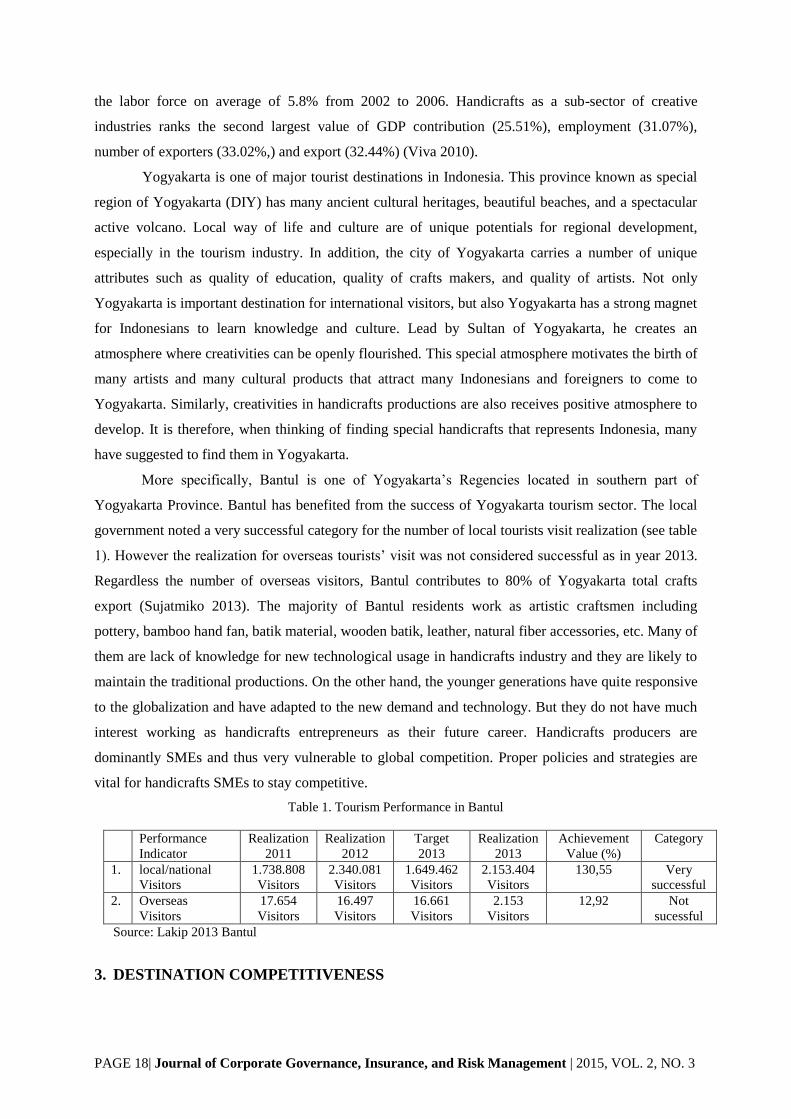
More specifically, Bantul is one of Yogyakarta’s Regencies located in southern part of
Yogyakarta Province. Bantul has benefited from the success of Yogyakarta tourism sector. The local
government noted a very successful category for the number of local tourists visit realization (see table
1). However the realization for overseas tourists’ visit was not considered successful as in year 2013.
Regardless the number of overseas visitors, Bantul contributes to 80% of Yogyakarta total crafts
export (Sujatmiko 2013). The majority of Bantul residents work as artistic craftsmen including
pottery, bamboo hand fan, batik material, wooden batik, leather, natural fiber accessories, etc. Many of
them are lack of knowledge for new technological usage in handicrafts industry and they are likely to
maintain the traditional productions. On the other hand, the younger generations have quite responsive
to the globalization and have adapted to the new demand and technology. But they do not have much
interest working as handicrafts entrepreneurs as their future career. Handicrafts producers are
dominantly SMEs and thus very vulnerable to global competition. Proper policies and strategies are
vital for handicrafts SMEs to stay competitive.
Table 1. Tourism Performance in Bantul
Performance
Indicator
Realization
2011
Realization
2012
Target
2013
Realization
2013
Achievement
Value (%)
Category
1. local/national
Visitors
1.738.808
Visitors
2.340.081
Visitors
1.649.462
Visitors
2.153.404
Visitors
130,55 Very
successful
2. Overseas
Visitors
17.654
Visitors
16.497
Visitors
16.661
Visitors
2.153
Visitors
12,92 Not
sucessful
Source: Lakip 2013 Bantul
3. DESTINATION COMPETITIVENESS
PAGE 19| Journal of Corporate Governance, Insurance, and Risk Management | 2015, VOL. 2, NO. 3
Any industry that does not maintain its competitiveness will be difficult to survive.
Competitiveness issue has becoming more pronounced after Porters book of Nation Competitive
Advantage. Porter in his book focuses competitiveness at the macro level. His concept is also
applicable to regional, industrial and cluster level. Competitiveness itself according to Hughes (1993)
is about efficiency and trade performance (market shares). The Organization for Economic Co-
operation and Development (OECD) defines competitiveness as “the degree to which a country can,
under open market conditions, produce goods and services that meet the test of international markets,
while simultaneously maintaining and expanding the domestic real incomes of its people over the long
term” (OECD 1992, p. 237). Competitiveness is capability in integrating productivity, efficiency, and
profitability, for the purpose of higher standards of living and social welfare (Kim 2012).
The concept of destination competitiveness has evolved from competitiveness in the tourism
sector. Destination competitiveness is the ability of a destination to deliver goods and services that
perform better than other destinations (Dwyer & Kim 2003). Starting in around 1990s, in tourism
context, a growing number of tourism researchers has put attention on destination competitiveness
(e.g. Crouch & Ritchie 1999; Dwyer & Kim 2003; Gooroochurn & Sugiyarto 2005, Gomezelj &
Mihalic 2008). The most comprehensive work on Destination Competitiveness (DC) has been
conducted by Crouch and Ritchie (1999). Crouch and Ritchie (1999) conceptual model was built
based on Porter’s “diamond of national competitiveness”. Crouch and Ritchie DC model was then
known as The Competitive Destination: A sustainable tourism perspective (RC’s model) (Kim 2012).
Crouch and Ritchie contribution in their model was in the comprehensive and multidimensional way
of DC model that includes societal prosperity in a global world. Dwyer and Kim (2003) additionally
also suggest an “integrated model” which represents determinants and indicators of destination
competitiveness. Dwyer and Kim (2003) model (DK’s model) combine the main elements of Porter’s
national competitiveness model and the main elements of destination competitiveness from RC’s
model. DK’s model includes inherited resources, created resources, supporting –related resources,
destination management, situational conditions and demand conditions. Further, DK’s model also
involves socioeconomic prosperity as output of destination competitiveness.
Since the work of RC’s model and DK’s model, a number of studies on DC have increased
significantly (Kim 2012). This research is a combination of competitiveness theory model (Porter,
1990) and DK’s model. More specifically, this study adjusts the model of DC in Indonesian tourism
sector into handicrafts sector. Handicrafts clusters are used as competitive destinations since the
clusters are intensively visited by both tourists and traders. The theory of destination competitiveness
should logically applicable for handicrafts clusters competitiveness.
The focus of this study is similar to common study in DC model that is building a model to
explain how a handicrafts village can improve cluster competitiveness by examining the factors as
identified by Porter and DK’s model. The predictors that are built from Porter and DK’s model are as
follow:
PAGE 20| Journal of Corporate Governance, Insurance, and Risk Management | 2015, VOL. 2, NO. 3
Given Resources: The given resources represent more on the main factor conditions that attract
visitors/buyers in the clusters. As the main raw material resources, it is a critical factor in creating
handicrafts products. This consists of natural and cultural resources, such as Human resources
(qualification level, cost of labor, commitment etc.) and material resources (natural resources,
vegetation, space etc).
Created Resources: The created resources are more dealing with endowed resources such as
government facilities, infrastructure, transportation, telecommunication, training, special events or
festivals, entertainment, shopping and marketplace. This resources are manmade, thus competitiveness
cannot rely merely from comparative advantage. A competitive move by actively building manmade
facilities to support the abundant natural and cultural resources should improve the performance of the
clusters.
Supporting/Related Industries: Is the industries that add value to given resources and created
resources. Supporting/related resources cover industry that complement the handicrafts industries such
as hotel and accommodation, culinary, travel transportation, entertainment, training and education, and
other industries. The growth of supporting/related industries may influence the demand on the
handicrafts industries even though supporting industries are not the main value in the handicrafts value
chain.
Demand Conditions: Demand conditions describe the attractiveness of home demand for products
and services produced in the regions/destinations/nations. Home demand may influence the quality,
innovation and competition on the industry. Porter (1990) argued that, home demand is determined by
three following characteristics namely: the mixture (the mix of customers needs and wants), the scope
and growth rate, and the mechanisms that transmit domestic preferences to foreign markets (Kim
2012). A country can achieve competitive advantages in an industry when clearer and earlier signals of
home demand trends are shown to domestic suppliers than to foreign competitors (Porter 1990, Kim
2012). Normally, the influence of home demand is higher than overseas demand in affecting
organization's ability to compete.
Strategy-Structure-Rivalry: The activities by government, industries, and communities that can
enhance the appeal of the main resources, strengthen the related and supporting industries, and
demand conditions. This factor includes policy, safety, protection, and degree of overcoming rivalry.
Porter (1990) defined strategy-structure-rivalry as the conditions that determine the ability of the
companies to establish, organize, manage, and to determine the characteristics of domestic
competition. Relating to strategy-structure-rivalry, cultural aspects play an important role. Different
places have different cultures and thus management style. Factors like management structures,
working morale, decision making, and people interactions are shaped differently in different places.
Culture can cause advantages and disadvantages for industries’ competitiveness. The nature of
industrial ownership and control, including the family-business based industries that are commonly
associated with SMEs determine the specific nature of strategy-structure-rivalry.

PAGE 21| Journal of Corporate Governance, Insurance, and Risk Management | 2015, VOL. 2, NO. 3
Clusters Competitiveness: Ketels (2015) defines that clusters is regional concentrations of economic
activities with a set of industries related linked by different types of networks. Clusters as define by
Porter (1990) is ‘geographic concentration of inter-connected companies and institutions working in a
common industry’. Within clusters, there are arrays of collaboration and competition of services and
providers that create unique infrastructures. Clusters might also be associated with a specific type of
competitive behaviors (Ketels 2015). Regions with a strong presence of clusters are more likely to
success in achieving economic growth or GDP benefits as compared to region without clusters.
Competition based on quality and unique values in clusters triggers production processes that are more
focused on efficiency (Ketels 2015). Clusters and competitiveness are conceptual frameworks used to
analyze the differences in economic performance across locations. Dynamic clusters contribute to a
location’s competitiveness. Clusters thus provide important information to understand and diagnose
the drivers of a location’s economic performance. Similar to destination competitiveness, clusters
competitiveness can be defined as the ability of a cluster to deliver goods and services that perform
better than other destinations.
Socio-economic prosperity: Socio-economic prosperity is defined as the social ‘welfare’ or ‘well
being’. The Socio-economic prosperity includes economic prosperity as well as the quality of life of
residents in the regions/clusters. The success of clusters should provide more job and activities that
enable to increase local income and buying power. The community around will be more dynamic and
the investors will be more attracted for building better infrastructures and public facilities.
By applying the combination of Porter’s and DK’s model of Destination Competitiveness, this
study will assess the relationships between Determinant of destination competitiveness, clusters
competitiveness and socio-economic welfare. The above discussions form the basis for the following
hypotheses:
Hypothesis 1: A significant positive relationship exists between given resources and clusters
competitiveness.
Hypothesis 2: A significant positive relationship exists between created resources and clusters
competitiveness.
Hypothesis 3: A significant positive relationship exists between related-supporting conditions and
clusters competitiveness.
Hypothesis 4: A significant positive relationship exists between demand conditions and clusters
competitiveness.
Hypothesis 5: A significant positive relationship exists between strategy-structure-rivalry and
cluster competitiveness.
Hypothesis 6: clusters competitiveness mediates the relationships between destination
competitiveness factors and socio-economic welfare.

PAGE 22| Journal of Corporate Governance, Insurance, and Risk Management | 2015, VOL. 2, NO. 3
4. RESEARCH METHODOLOGY
This study tests the structural model explaining the relationship between destination
competitiveness, clusters competitiveness, and socio-economic welfare. The main determinants of
destination competitiveness were built based on Porter’s diamond framework. To assess the structural
relationships, Structural Equation Modeling (SEM) with latent variables, specifically Partial Least
Square (PLS) path modeling, is employed.
4.1. Data Collection and Analysis Tools
In order to be able to analyze the structural model, quantitative research is applied. Data were
collected by survey to SMEs owners in Jipangan, Bantul Yogyakarta. The questionnaire was
developed consisting of a total of 32 questions. Five questions were designed to evaluate given
resources, five questions were for created resources, five questions for related- supporting industries,
six questions were for demand factors, and five questions were for strategy-structure-rivalry. All
questions to measure given resources, created resources, demand conditions, supporting-related
industries and strategy-structure-rivalry were taken from Crouch & Ritchie (2003), Dwyer & Kim
(2003), and Kim (2012). Five questions for clusters competitiveness were developed from Mena
(2006). Six questions on socio-economic welfare were developed from Kim (2012). A five-point
Likert scale was used as scaling method.
4.2. Statistical Population and Statistical Samples
Statistical population of the study consists of all SMEs producing handicrafts residing in
Jipangan Bantul Yogyakarta. Out of 75 questionnaires distributed, 54 questionnaires were valid and
reliable to use as valid data for further multiple regression analysis. The 75 questionnaires were
distributed in within 2 months period using convenient sampling method.
4.3. Descriptive Data Analysis
According to the profile of the respondents collected, it can be described that 64.8% of
respondents are male SMEs owners and 35.28% are female SMEs owners. The respondents’ age range
from 5.6% between 15 - 25 years old, 33.3% between 26 - 35 years old, 35.2% between 36 - 45 years
old, and 25.9% older than 45 years old. Monthly earnings are mostly under Rp. 20 million per month
and only five respondents with income per month exceeding Rp. 20 million per month. The
respondent personal data also reveal that 60.7% respondents went to high school as their highest
formal education achieved. Most SMEs also have run their business over 4 years long. The target

PAGE 23| Journal of Corporate Governance, Insurance, and Risk Management | 2015, VOL. 2, NO. 3
market is still focused on national market. Problems in running business are mostly in the forms of
funding and hiring talented labors.
4.4. Assessment for the Measurement Model
PLS allows the measurement and structural models to be analyzed at the same time (Chin
1998). Analysis using PLS are usually conducted in two stages: 1) the assessment of the measurement
model, which focuses more on the reliability and validity of the measures; and 2) the assessment of the
structural model which is more concerned with the path coefficients, model adequacy and selecting the
best final model (Hulland 1999). These two-step approaches were taken for good psychometric
properties before further conclusions can be drawn. This study will follow the statistical analysis
according to the two-step approaches.
The measurement model in PLS is evaluated by examining: (1) the individual loading of each
item; (2) Internal Composite Reliability (ICR); (3) Average Variance Extracted (AVE); and (4)
discriminant validity (Chin 1998). The measurement model focuses on ensuring the validity and
reliability of the measures. Firstly, the individual loading of each item can be seen from the following
table 2. Each of the loading scores determines the correlation between indicators and their respective
constructs. The loading scores can be used to determine the contribution of each indicator to the
relevance of its respective construct. The higher the loadings indicate the stronger the relationships in
terms of shared variance with the construct. Item loading is also known as item reliability. The higher
loading the higher reliability. The loading of 0.5 or 0.6 may still be acceptable in the early stage of
scale development (Chin 1998). After running the PLS analysis, there are some indicators that have
not met the threshold of the standard minimum loading (< 0.5). These indicators were then dropped
and not included in further analysis. Some indicators which were dropped include: One indicator from
given resources, two indicators from created resources, four indicators from demand conditions, and
four indicators from socio-economic prosperity indicators. In total there were eleven indicators
dropped or not reliable as measures in the variables being investigated.
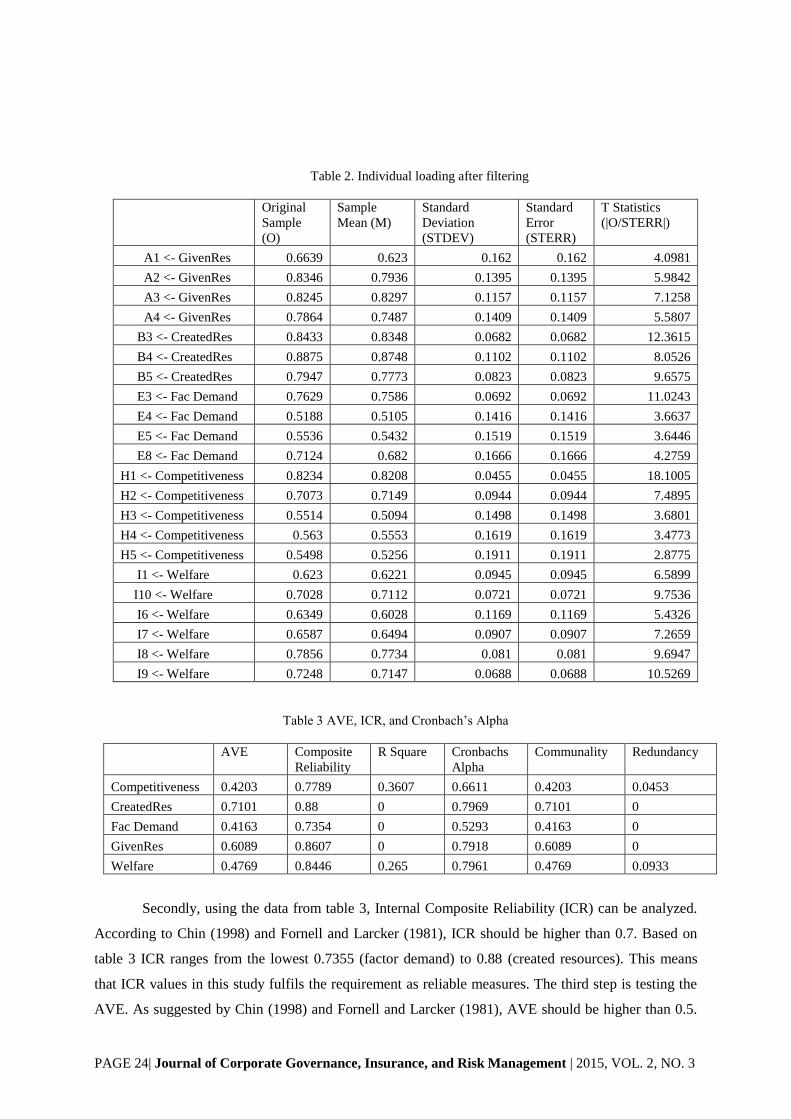
PAGE 24| Journal of Corporate Governance, Insurance, and Risk Management | 2015, VOL. 2, NO. 3
Table 2. Individual loading after filtering
Original
Sample
(O)
Sample
Mean (M)
Standard
Deviation
(STDEV)
Standard
Error
(STERR)
T Statistics
(|O/STERR|)
A1 <- GivenRes 0.6639 0.623 0.162 0.162 4.0981
A2 <- GivenRes 0.8346 0.7936 0.1395 0.1395 5.9842
A3 <- GivenRes 0.8245 0.8297 0.1157 0.1157 7.1258
A4 <- GivenRes 0.7864 0.7487 0.1409 0.1409 5.5807
B3 <- CreatedRes 0.8433 0.8348 0.0682 0.0682 12.3615
B4 <- CreatedRes 0.8875 0.8748 0.1102 0.1102 8.0526
B5 <- CreatedRes 0.7947 0.7773 0.0823 0.0823 9.6575
E3 <- Fac Demand 0.7629 0.7586 0.0692 0.0692 11.0243
E4 <- Fac Demand 0.5188 0.5105 0.1416 0.1416 3.6637
E5 <- Fac Demand 0.5536 0.5432 0.1519 0.1519 3.6446
E8 <- Fac Demand 0.7124 0.682 0.1666 0.1666 4.2759
H1 <- Competitiveness 0.8234 0.8208 0.0455 0.0455 18.1005
H2 <- Competitiveness 0.7073 0.7149 0.0944 0.0944 7.4895
H3 <- Competitiveness 0.5514 0.5094 0.1498 0.1498 3.6801
H4 <- Competitiveness 0.563 0.5553 0.1619 0.1619 3.4773
H5 <- Competitiveness 0.5498 0.5256 0.1911 0.1911 2.8775
I1 <- Welfare 0.623 0.6221 0.0945 0.0945 6.5899
I10 <- Welfare 0.7028 0.7112 0.0721 0.0721 9.7536
I6 <- Welfare 0.6349 0.6028 0.1169 0.1169 5.4326
I7 <- Welfare 0.6587 0.6494 0.0907 0.0907 7.2659
I8 <- Welfare 0.7856 0.7734 0.081 0.081 9.6947
I9 <- Welfare 0.7248 0.7147 0.0688 0.0688 10.5269
Table 3 AVE, ICR, and Cronbach’s Alpha
AVE Composite
Reliability
R Square Cronbachs
Alpha
Communality Redundancy
Competitiveness 0.4203 0.7789 0.3607 0.6611 0.4203 0.0453
CreatedRes 0.7101 0.88 0 0.7969 0.7101 0
Fac Demand 0.4163 0.7354 0 0.5293 0.4163 0
GivenRes 0.6089 0.8607 0 0.7918 0.6089 0
Welfare 0.4769 0.8446 0.265 0.7961 0.4769 0.0933
Secondly, using the data from table 3, Internal Composite Reliability (ICR) can be analyzed.
According to Chin (1998) and Fornell and Larcker (1981), ICR should be higher than 0.7. Based on
table 3 ICR ranges from the lowest 0.7355 (factor demand) to 0.88 (created resources). This means
that ICR values in this study fulfils the requirement as reliable measures. The third step is testing the
AVE. As suggested by Chin (1998) and Fornell and Larcker (1981), AVE should be higher than 0.5.

PAGE 25| Journal of Corporate Governance, Insurance, and Risk Management | 2015, VOL. 2, NO. 3
This study has four factors having AVE below 0.5. All of these factors are maintained since the
content validity has been assessed by experts in the competitiveness study and the measures have been
well developed and tested from previous studies. In addition, AVE is not the only identification for
valid measure. The discriminant validity will be further tested using cross loadings and square root
AVE.
Table 4. Crossloadings
Competitiveness CreatedRes Fac Demand GivenRes Prosperity
A1 0.2155 0.3009 0.027 0.6639 0.0931
A2 0.298 0.1627 0.0902 0.8346 0.0693
A3 0.3986 0.2988 0.1381 0.8245 0.1891
A4 0.2041 0.1996 0.0171 0.7864 0.0466
B3 0.2904 0.8433 0.1183 0.3304 0.338
B4 0.3667 0.8875 0.1934 0.2149 0.4952
B5 0.2704 0.7947 0.042 0.2542 0.4532
E3 0.3363 0.2102 0.7629 0.0578 0.3208
E4 0.1898 0.2405 0.5188 0.0551 0.3925
E5 0.2538 0.0177 0.5536 0.1375 0.3272
E8 0.3418 -0.0323 0.7124 0.0344 0.2224
H1 0.8234 0.3176 0.4515 0.2374 0.4602
H2 0.7073 0.4062 0.292 0.3406 0.3776
H3 0.5514 0.1942 0.2415 0.1709 0.2696
H4 0.563 0.1245 0.1449 0.2421 0.3278
H5 0.5498 0.0135 0.2535 0.2543 0.1427
I1 0.5316 0.3211 0.3774 0.2479 0.623
I10 0.3587 0.4601 0.2428 0.2034 0.7028
I6 0.2665 0.286 0.2312 0.0239 0.6349
I7 0.2222 0.2503 0.3435 -0.1028 0.6587
I8 0.2586 0.4096 0.4259 -0.0692 0.7856
I9 0.2459 0.3349 0.2262 0.0493 0.7248
Table 5 Correlation and AVE square roots.
Competitiveness CreatedRes Fac Demand GivenRes Prosperity
Competitiveness 0.6483 0 0 0 0
CreatedRes 0.3718 0.8430 0 0 0
Fac Demand 0.447 0.1486 0.6452 0 0
GivenRes 0.3812 0.3101 0.1036 0.7803 0
Prosperity 0.5148 0.5123 0.462 0.1426 0.69058
In order to test the discriminant validity, crossloading and AVE square roots will be analyzed.
The discriminant validity is shown when the indicators are better associated with their respective
construct than they are with other constructs. When checking the cross-loadings, researchers must
ensure whether each group of indicators should load higher for its respective construct than indicators
of other constructs (Cunningham 2008). The crossloading matrix of the measures showing the

PAGE 26| Journal of Corporate Governance, Insurance, and Risk Management | 2015, VOL. 2, NO. 3
correlations between all items and constructs are displayed in table 4. Since all indicators that have not
satisfied the item loadings have been dropped, there remained indicators that as shown in table 4 were
well associated with their respective construct. The indicators that associated with their respective
construct load higher than association to other constructs.
In addition, as indicated in Table 5, the square root of the AVE was tested against the
intercorrelations of the construct with the other constructs in the model to ensure discriminant validity
(Chin, 2003, Fornell & Larcker, 1981). All the square root of the AVE exceeded the correlations with
other variables. Thus, the measurement model was considered satisfactory with the evidence of
adequate reliability, convergent validity, and discriminant validity.
4.5. Assessment for the Structural Model
The use of R-squared (R2)
is important in determining the predictive ability of the model. PLS
produces R2
for each of dependent construct in the model. The bigger the R2, the more predictive
power the model implies. As seen in Figure 2, R-squared (R2)
of cluster competitiveness is 37.2% and
socio-economic prosperity is 26.5%. The rule-of-thumb for the significance of R2 of the predicted
variables should be greater than 0.10 (Falk & Miller 1992). Even though they both cluster
competitiveness and socio-economic do not show a strong R2, they are higher than the threshold 0.10.
This study proposes an indirect relationship between destination competitiveness factors and
socio-economic welfare via clusters competitiveness. In assessing indirect relationships, this study
follows the approach suggested by Baron and Kenny’s (1986). Baron and Kenny’s (1986) method is
widely accepted in marketing studies (e.g. Agarwal et al. 2003; Matear et al. 2002). There are three
requirements highlighted to test the mediation effect: 1) the independent variable (X) must affect the
mediating variable (Y); 2) the independent variable (X) must affect the dependent variable (Z); and 3)
the mediating variable (Y) must affect the dependent variable (Z). As can be seen in Figure 1 below,
the impacts of related-supporting industries on clusters competitiveness is not significant with the
coefficient of 0.049. Similarly, the impact of strategy-structure-rivalry to clusters competitiveness is
also not significant with coefficient of 0.093. This means that both factors do not satisfy the
requirements as suggested by Baron and Kenny (1986) for indirect model. These two factors were then
dropped and are not use for further analyses.
Figure 2 shows the final model after related-supporting factors as well as strategy-structure-
rivalry were dropped. Using the result from the final model, it can be concluded that hypothesis three
and hypothesis five were not supported. On the other hand, hypotheses 1, 2, and 4 were supported,
meaning that positive relationship exists between given resources, created resources, and demand
conditions to clusters competitiveness. Hypothesis six is also accepted when dropping related-
supporting industries and strategy-structure-rivalry. This means that clusters competition mediates the
relationships of three destination competitiveness factors and socio-economic welfare. Table 6 shows
the significance of the final structural model of this study.
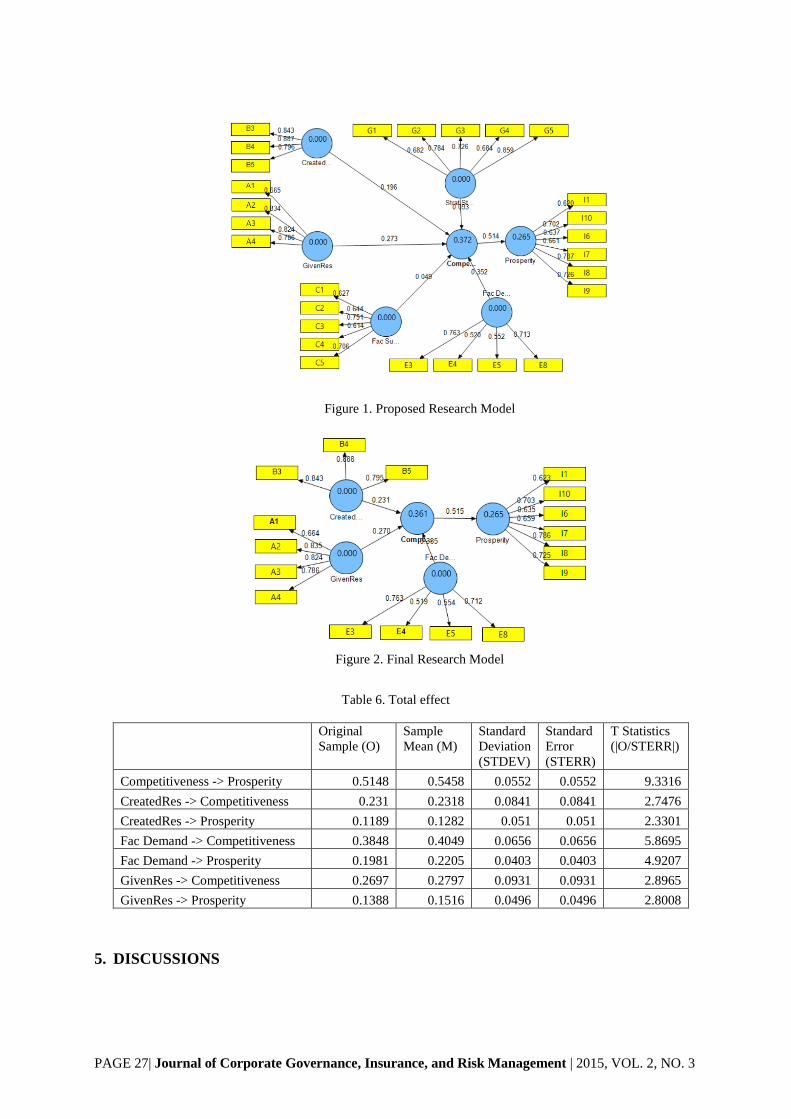
PAGE 27| Journal of Corporate Governance, Insurance, and Risk Management | 2015, VOL. 2, NO. 3
Figure 1. Proposed Research Model
Figure 2. Final Research Model
Table 6. Total effect
Original
Sample (O)
Sample
Mean (M)
Standard
Deviation
(STDEV)
Standard
Error
(STERR)
T Statistics
(|O/STERR|)
Competitiveness -> Prosperity 0.5148 0.5458 0.0552 0.0552 9.3316
CreatedRes -> Competitiveness 0.231 0.2318 0.0841 0.0841 2.7476
CreatedRes -> Prosperity 0.1189 0.1282 0.051 0.051 2.3301
Fac Demand -> Competitiveness 0.3848 0.4049 0.0656 0.0656 5.8695
Fac Demand -> Prosperity 0.1981 0.2205 0.0403 0.0403 4.9207
GivenRes -> Competitiveness 0.2697 0.2797 0.0931 0.0931 2.8965
GivenRes -> Prosperity 0.1388 0.1516 0.0496 0.0496 2.8008
5. DISCUSSIONS
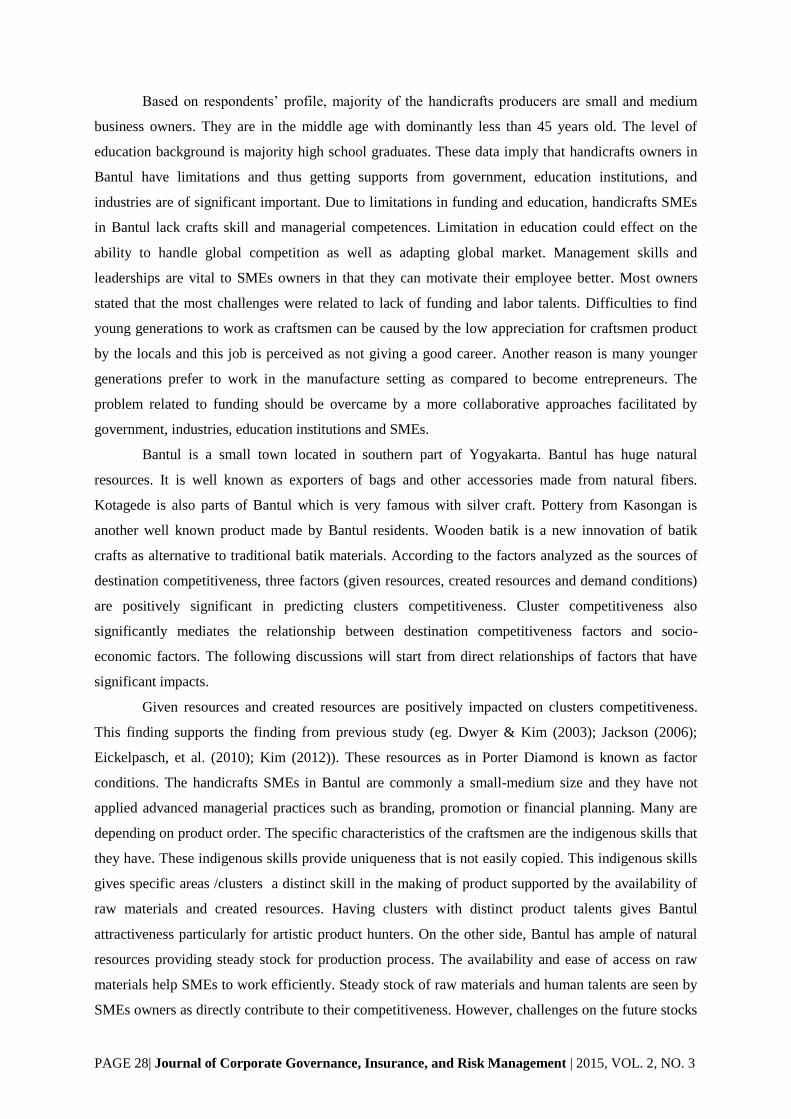
PAGE 28| Journal of Corporate Governance, Insurance, and Risk Management | 2015, VOL. 2, NO. 3
Based on respondents’ profile, majority of the handicrafts producers are small and medium
business owners. They are in the middle age with dominantly less than 45 years old. The level of
education background is majority high school graduates. These data imply that handicrafts owners in
Bantul have limitations and thus getting supports from government, education institutions, and
industries are of significant important. Due to limitations in funding and education, handicrafts SMEs
in Bantul lack crafts skill and managerial competences. Limitation in education could effect on the
ability to handle global competition as well as adapting global market. Management skills and
leaderships are vital to SMEs owners in that they can motivate their employee better. Most owners
stated that the most challenges were related to lack of funding and labor talents. Difficulties to find
young generations to work as craftsmen can be caused by the low appreciation for craftsmen product
by the locals and this job is perceived as not giving a good career. Another reason is many younger
generations prefer to work in the manufacture setting as compared to become entrepreneurs. The
problem related to funding should be overcame by a more collaborative approaches facilitated by
government, industries, education institutions and SMEs.
Bantul is a small town located in southern part of Yogyakarta. Bantul has huge natural
resources. It is well known as exporters of bags and other accessories made from natural fibers.
Kotagede is also parts of Bantul which is very famous with silver craft. Pottery from Kasongan is
another well known product made by Bantul residents. Wooden batik is a new innovation of batik
crafts as alternative to traditional batik materials. According to the factors analyzed as the sources of
destination competitiveness, three factors (given resources, created resources and demand conditions)
are positively significant in predicting clusters competitiveness. Cluster competitiveness also
significantly mediates the relationship between destination competitiveness factors and socio-
economic factors. The following discussions will start from direct relationships of factors that have
significant impacts.
Given resources and created resources are positively impacted on clusters competitiveness.
This finding supports the finding from previous study (eg. Dwyer & Kim (2003); Jackson (2006);
Eickelpasch, et al. (2010); Kim (2012)). These resources as in Porter Diamond is known as factor
conditions. The handicrafts SMEs in Bantul are commonly a small-medium size and they have not
applied advanced managerial practices such as branding, promotion or financial planning. Many are
depending on product order. The specific characteristics of the craftsmen are the indigenous skills that
they have. These indigenous skills provide uniqueness that is not easily copied. This indigenous skills
gives specific areas /clusters a distinct skill in the making of product supported by the availability of
raw materials and created resources. Having clusters with distinct product talents gives Bantul
attractiveness particularly for artistic product hunters. On the other side, Bantul has ample of natural
resources providing steady stock for production process. The availability and ease of access on raw
materials help SMEs to work efficiently. Steady stock of raw materials and human talents are seen by
SMEs owners as directly contribute to their competitiveness. However, challenges on the future stocks

PAGE 29| Journal of Corporate Governance, Insurance, and Risk Management | 2015, VOL. 2, NO. 3
of human talent must be addressed since younger generations are reluctant to work as handicrafts
entrepreneurs and prefer to work in the more formal institutions.
Given resources as sources of comparative advantage will not perfectly work if created
resources are not well provided. The provision of infrastructure, transportation, telecommunication,
and access support to market network should complement given resources. Porter argued that today’s
winning competition is no longer coming from comparative but shifting to competitive advantage.
Both given and created resources are seen by respondents as directly impact on clusters
competitiveness since the capability to produce must be assisted by attractive market place, policy and
regulations, as well as public infrastructures. Government interference in this factor is important. The
provision of marketplace for handicrafts SMEs is not only done by physically providing the market.
But more importantly, the program, the content, and the network fulfilled to the market will be more
useful for SMEs participating in the market. Government should actively encourage SMEs
participations for trade event, organize festivals and assist network building with potential buyers.
This study supports the proposition that demand factors have impact on clusters
competitiveness. Demand conditions represent the attractiveness of home demand and may influence
the quality, innovation and competition on the industry. The significant influence of demand
conditions to clusters competitiveness implies that SMEs respondents admit that handicrafts market
becomes more attractive and competitive when local demand and varieties of demand increase.
Varieties of buyers background whether local or international buyers increase the craftsmen talents
since they have to be able to translate the products required by many different buyers. As tourism and
education centre, Yogyakarta is very open to visitors not only as for tourist but also as for students to
learn new skills/knowledge and as for residents to make a living. The openness and the blend among
people from all over the world makes the interaction on needs, wants, experiences, skills and
education high. The higher sophistication on demand influences the level of competition and
ultimately the level of products’ competitiveness made in Bantul.
The fact that related-supporting industries are not significantly impact on clusters
competitiveness is quite surprising and does not align with previous research findings. However, this
finding can be explained by these following arguments. The handicrafts SMEs are mainly focus on
production activities as compared to doing commercial or marketing activities. They also see that
tourism sectors such as entertainment, cultural performances, culinary, education, hotel, travel agency
as not directly relating to profit in their production processes. This might explain why respondents
who are SMEs owners do not see that supporting-related industries directly impact on clusters
competitiveness. In reality, SMEs handicrafts industry is highly depending on the success of tourism
industry. However, any activities that do not relate to success on production process is not considered
competitive effort as seen by SMEs.
Research on handicrafts SMEs in Bantul has found that strategy-structure-rivalry does not
have impact on clusters competitiveness. This means that this finding is not in align with previous

PAGE 30| Journal of Corporate Governance, Insurance, and Risk Management | 2015, VOL. 2, NO. 3
findings on destination/tourism sectors when using Porter Diamond as predictors of competitiveness.
This factor represents how the industries are established, organized and managed. The different
findings can be explained similar to finding as with supporting-related industries factors. Simply,
respondents are not considering anything that is not directly within internal production processes as
determining their competitiveness. Due to lack of managerial skills and network interactions, SMEs
owners are too focus on internal capability and lack response to external environment. The family
business orientation could be the reason why change is not common. SMEs also majority satisfied
with managing business as far as by depending on order (made to order). They do not proactively
expand and introduce their business proactively. This type of traditional nature of running business
will not survive in facing the global competitors. Government, education institutions, and bigger
industries should take into action in protecting the sustainability of handicrafts SMEs.
Clusters competitiveness was found to influence socio-economic welfare. Clusters
competitiveness also mediates the relationships between created resources, given resources, and
demand conditions to socio-economic welfare. This finding is in align with previous studies by Dwyer
& Kim (2003), Jackson (2006), Eickelpasch, et al. (2010), and Kim (2012). This finding implies that
success in clusters will increase the level of competitiveness. When the cluster is competitive, more
jobs will be created, more supplies will be needed, and the residents will have better buying power. In
this situation, the economy will be more attractive. Simply, the quality of life of the residents within
competitive cluster will increase. As previously stated, regions with a strong presence of clusters are
more likely to success in achieving economic growth or GDP benefits as compared to region without
active clusters. Thus, it is important that cluster approach needs to be adopted in the handicrafts SMEs
since the final goal of all development is residents welfare and the quality of life. Additionally, the
role of clusters competitiveness also vital since it mediates the relationships between three factors of
destination competitiveness to socio-economic welfare. This again confirms that cluster approaches
for handicrafts SMEs need to be adopted so that better collaboration among clusters or among SMEs
are even better and stronger.
6. CONCLUSSION AND RECOMMENDATIONS
The goal of national development is the increase in the quality of residents’ life. In order to
achieve the quality of life, a nation must be competitive. The purpose of this research is to analyze the
application of destination competitiveness in the handicrafts SMEs to see whether the factors of
competitiveness do influence the clusters competitiveness and socioeconomic welfare. After several
steps of statistical analyses, the final model reveals that only three hypotheses supported meaning that
only given resources, created resources, and demand conditions that directly and indirectly effect
socio-economic welfare. Clusters competitiveness also significantly supported as mediating variable.
Hypothesis three and hypothesis five are not supported. Thus, these factors (related/supporting
industries and strategy-structure-rivalry) were not used as analysis in the final model.
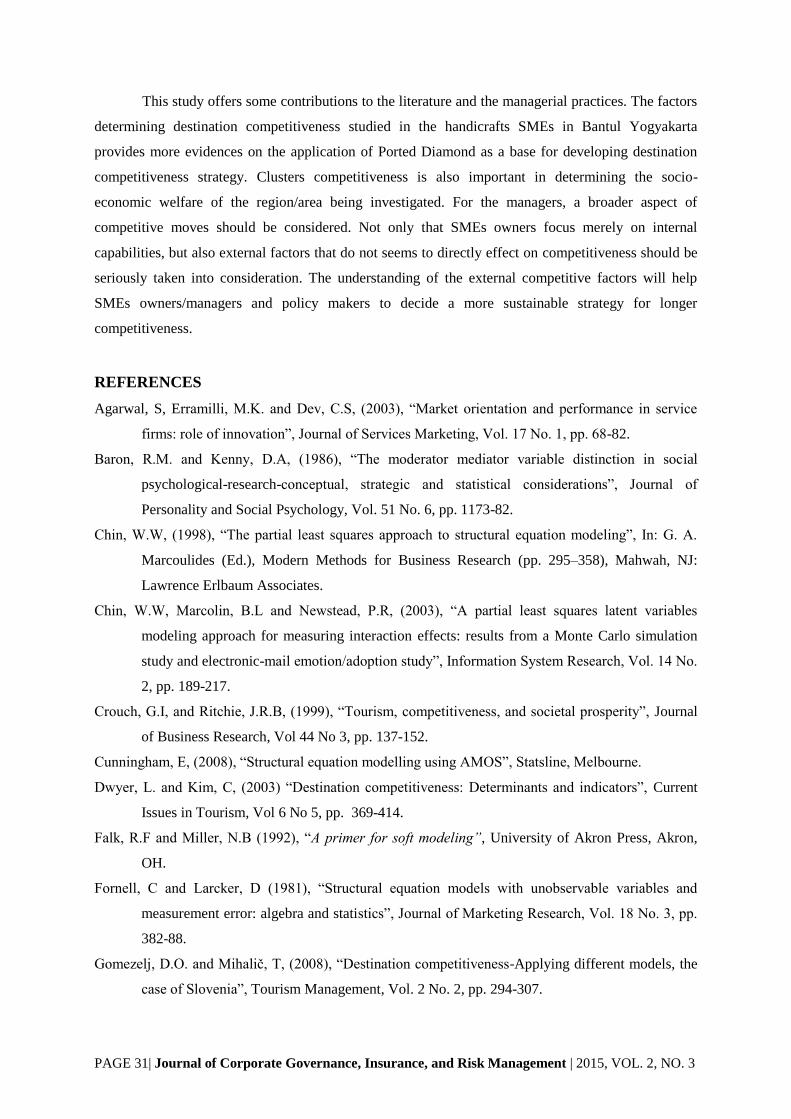
PAGE 31| Journal of Corporate Governance, Insurance, and Risk Management | 2015, VOL. 2, NO. 3
This study offers some contributions to the literature and the managerial practices. The factors
determining destination competitiveness studied in the handicrafts SMEs in Bantul Yogyakarta
provides more evidences on the application of Ported Diamond as a base for developing destination
competitiveness strategy. Clusters competitiveness is also important in determining the socio-
economic welfare of the region/area being investigated. For the managers, a broader aspect of
competitive moves should be considered. Not only that SMEs owners focus merely on internal
capabilities, but also external factors that do not seems to directly effect on competitiveness should be
seriously taken into consideration. The understanding of the external competitive factors will help
SMEs owners/managers and policy makers to decide a more sustainable strategy for longer
competitiveness.
REFERENCES
Agarwal, S, Erramilli, M.K. and Dev, C.S, (2003), “Market orientation and performance in service
firms: role of innovation”, Journal of Services Marketing, Vol. 17 No. 1, pp. 68-82.
Baron, R.M. and Kenny, D.A, (1986), “The moderator mediator variable distinction in social
psychological-research-conceptual, strategic and statistical considerations”, Journal of
Personality and Social Psychology, Vol. 51 No. 6, pp. 1173-82.
Chin, W.W, (1998), “The partial least squares approach to structural equation modeling”, In: G. A.
Marcoulides (Ed.), Modern Methods for Business Research (pp. 295–358), Mahwah, NJ:
Lawrence Erlbaum Associates.
Chin, W.W, Marcolin, B.L and Newstead, P.R, (2003), “A partial least squares latent variables
modeling approach for measuring interaction effects: results from a Monte Carlo simulation
study and electronic-mail emotion/adoption study”, Information System Research, Vol. 14 No.
2, pp. 189-217.
Crouch, G.I, and Ritchie, J.R.B, (1999), “Tourism, competitiveness, and societal prosperity”, Journal
of Business Research, Vol 44 No 3, pp. 137-152.
Cunningham, E, (2008), “Structural equation modelling using AMOS”, Statsline, Melbourne.
Dwyer, L. and Kim, C, (2003) “Destination competitiveness: Determinants and indicators”, Current
Issues in Tourism, Vol 6 No 5, pp. 369-414.
Falk, R.F and Miller, N.B (1992), “A primer for soft modeling”, University of Akron Press, Akron,
OH.
Fornell, C and Larcker, D (1981), “Structural equation models with unobservable variables and
measurement error: algebra and statistics”, Journal of Marketing Research, Vol. 18 No. 3, pp.
382-88.
Gomezelj, D.O. and Mihalič, T, (2008), “Destination competitiveness-Applying different models, the
case of Slovenia”, Tourism Management, Vol. 2 No. 2, pp. 294-307.

PAGE 32| Journal of Corporate Governance, Insurance, and Risk Management | 2015, VOL. 2, NO. 3
Gooroochurn, N. and Sugiyarto, G, (2005), “Competitiveness indicators in the travel and tourism
industry”, Tourism Economics, Vol. 11 No.1, pp. 25-43.
Gursoy, D., Baloglu, S. and Chi, C.G, (2009), “Destination competitiveness of Middle Eastern
countries: An examination of relative positioning”, Anatolia, Vol 20 No. 1, pp. 151-163.
Hughes, K.S, (1993), “European Competitiveness”, Cambridge University Press.
Hulland, J, (1999), “Use of partial least squares (PLS) in strategic management research: A review of
four recent studies”, Strategic Management Journal, Vol. 20 No. 2, pp. 195-204.
Ketels, C, (2015), “Competitiveness and Clusters: Implications for a New European Growth Strategy”,
Work Package 301 MS48, Policy paper: Role of clusters, competitiveness in the new
orientation of the European growth strategy”, Working Paper no 84.
Kim, N, (2012), “Tourism destination competitiveness, globalization, and strategic development from
a development economics perspective”, PhD Dissertation in Recreation, Sport and Tourism
University of Illinois at Urbana-Champaign, USA.
Lakip, (2014), “Laporan Akuntabilitas Kinerja Instansi Pemerintah (Lakip) Kabupaten Bantul Tahun
2013”, Pemerintah Kabupaten Bantul Pemerintah Daerah Istimewa Yogyakarta, available at
http://setda.bantulkab.go.id/documents/20140522103011-lakip-2013.pdf. assessed 5 July 2015
Lee, C.F. and King, B, (2009), “A determination of destination competitiveness for Taiwan’s hot
springs tourism sector using the Delphi technique”, Journal of Vacation Marketing, Vol. 15
No. 3, pp. 243-257.
Mena, M.M, (2006), “Exploring destination competitiveness from a Social development perspectives,
evidence from South East Asia”, PhD Dissertation, The Hongkong Polytechnic University,
School of Hotel and Tourism Management.
Matear, S.M., Osborne, P., Garrett, T.C. and Gray, B.J, (2002), “How does market orientation
contribute to service firm performance? An examination of alternative mechanisms”,
European Journal of Marketing, Vol. 36 No. 9/10, pp. 1058-1075.
Nurani, N, (2014), “The Effectiveness of Act No. 19 Year 2002 Concerning With Copyright
As A Protection of Craft Creative Industry to Increase the Acceleration of Creative
Economic Growth of Indonesia” Journal Of Contemporary Management Sciences, Vol
1 No. 2, pp. 32-45. OECD, (1992), “Technology and the economy the key relationships”, Paris: OECD Publ.
Pangestu, M.E, (2008), “Pengembangan Ekonomi Kreatif Menuju Visi Ekonomi Kreatif Indonesia
2025 - Rencana Pengembangan Ekonomi 14 Sub Sektor Ekonomi Kreatif Indonesia 2009-
2015”, Departemen Perdagangan RI, hlm 1. Available at
http://www.karokab.go.id/koperindag/images/stories/BluePrintEkonomiKreatifIndonesiaBuku
2.pdf, accessed 15 June 2015.
Porter, M.E, (1998), “Competitive Advantage of Nations”, Free Press.
Porter, M.E, (1990), “The Competitive Advantage of Nations”, Harvard Business Review, Vol. 68 No.
2, pp. 73-93.

PAGE 33| Journal of Corporate Governance, Insurance, and Risk Management | 2015, VOL. 2, NO. 3
Ritchie, J.R.B. and Crouch, G.I, (2003), “The Competitive Destination: A sustainable tourism
perspective (First.)”, CABI Publishing, Wallingford, UK.
Sujatmiko, T, (2013), “Disperindagkop Bantul Gelar Pelatihan Ekspor-Impor”, , available at
http://krjogja.com/read/193769/disperindagkop-bantul-gelar-pelatihan-ekspor-impor.kr,
assessed in 15 November 2013
The Jakarta Post, (2014), “Creative Industry Grow 6 percent”, available at
http://www.thejakartapost.com/news/2014/02/14/creative-industry-grow-6-percent.html
(accessed 11 Mei 2014).
Viva (2010), “HIMPI Targetkan Ekspor Kerajinan U$$ 650 juta. Produk Indonesia Yang Inovatif
Banyak Dicari Dan Diekspor Ke Luar Negeri”, available at
http://forum.viva.co.id/indeks/threads/himpi-targetkan-ekspor-kerajinan-us-650-juta.32666/
accessed 18 June 2015.

Pages 34-51
PAGE 34| Journal of Corporate Governance, Insurance, and Risk Management | 2015, VOL. 2, NO. 3
Journal of Corporate Governance, Insurance, and Risk Management (JCGIRM)
2015, Volume 2, Series 3
Destination Competitiveness Analysis for Creative Crafts
Industries in Bantul Yogyakarta Indonesia
Ratna Roostikaa,*
, Tri Wahyuningsihb, Sigit Haryono
c
aDepartment of Management, UPN ‘Veteran’ Yogyakarta bDepartment of Management, UPN ‘Veteran’ Yogyakarta cDepartment of Management, UPN ‘Veteran’ Yogyakarta
A B S T R A C T A R T I C L E I N F O
Escalating competition among destinations has become more obvious.
Shopping for handicrafts is one of important activities in tourism.
Handicraft industry is a low technology, labor intensive, and run
dominantly by small medium enterprises (SMEs). Handicraft industry is
one of creative industries sector in Indonesia that promises to accelerate
the growth of the Indonesian economy. To remain competitive,
understanding on the competitive nature of handicrafts market need to be
continuously monitored and adjusted to SMEs strategies. Using partial
least squares path modeling on a cross-sectional sample of 54 SMEs
owners in Bantul Yogyakarta, this study examines relationships among
factors of destination competitiveness with clusters competitiveness and
socio-economic welfare. The predictors assessed include given resources,
created resources, related-supporting factors, demand conditions and
strategy-structure-rivalry. Results indicate that supporting factors and
strategy-structure-rivalry are not significantly impact on cluster
competitiveness. The new final model was found that clusters
competitiveness mediates the relationships between three destination
competitiveness factors and socio-economic welfare. This study enriches
theories on destination competitiveness, particularly in assessing clusters
as the object of the study. The results are also important for policymakers
in strengthening destination competitiveness strategy.
Keywords:
SMEs, creative industry,
destination competitiveness,
economic prosperity
*Corresponding author:
Article history:
Article Submitted 14-04-2015
Article Accepted 20-06-2015
**Article previously published in
EJEM 2015, vol 2, No. 3
1. INTRODUCTION
Since oil and gas exports have decreased in 90th era, Indonesian Government expects to boost
exports from non-oil and gas industry including creative industries. Creative industry is now an
important sector due to its growth rate, capability to generate significant income, and in providing job.
Creative industry in Indonesia has grown at an average rate of GDP up to 9% or amounting US$ 58.5
per year (thejakartapost 2014). There are 14 sub-sectors in Indonesian creative industries and some of
them include handicraft, arts and antique markets, performing arts, movie, fashion, game, culinary,
and designs. The growth of creative industry is highly influenced by the current advanced in
technology, globalization as well as the increase in global income. More people are entering into
middle level of income thus they have better access to education, technology as well as they are more
mobile. The increase of global welfare gives engine to the growth of creative industries.
The growth of creative industries in Indonesia cannot be separated from the growth of tourism
sector as a sector which provides the biggest market for selling creative products and services. When

PAGE 35| Journal of Corporate Governance, Insurance, and Risk Management | 2015, VOL. 2, NO. 3
tourism sector is leading, tourism shopping as part of tourism activities will also flourish, generating
multiplier effects to other sectors including creative industries. Tourism competitiveness or destination
competitiveness refers to not only economic competitiveness, but also to social and cultural aspects of
the nations (Kim 2012). Destination competitiveness can also lead to long-term sustainability and
sustain standard of living to the designated area (Crouch & Ritchie 1999). Handicrafts industry as part
of the creative industries is one among important activities that tourists always spend during their
visits. The competitiveness of the handicrafts sectors is vital for sustainability of the destination
competitiveness. To maintain the level of competitiveness, handicrafts industries which commonly
operate by Small Medium Enterprises (SMEs) should always aware of the level of global competition
and aware of their internal capability to compete. In this very dynamic era and globalization, market
changes rapidly. Thus appropriate competitive strategies are necessary to stay in the unpredictable
market.
Since Porter’s introduction to the diamond model in his book The Competitive Advantage of
Nations (Porter, 1998), studies on destination competitiveness (e.g. Dwyer & Kim 2003; Gursoy,
Baloglu & Chi 2009; Lee & King 2009) have been flourishing to explain how tourism industry can
stay competitive. Porter points out that abundant natural resources or cultural resources are not
guarantee for winning tourism industry. In reality, countries like Switzerland and Singapore with less
natural resources are rank high as recorded in Travel and Tourism Competitiveness Index (TTCI)
compared to developing or less-developed countries with plenty cultural and natural beauties.
The ultimate goal of the nations’ economic development is the increase of their people
welfare. By studying the SMEs handicraft industry in Bantul Yogyakarta, The purpose of this research
is to build a destination competitiveness model to help local policy makers to understand more on their
relevant competitive factors given their unique local resources. This study also aims to answer the
question by investigating the impact of competitive factors as identified by Porter namely given
resources, created resources, related-supporting resources, strategy-structure-rivalry, and demand
conditions to clusters competitiveness. Further, this study also aims at answering how clusters
competitiveness impacts on socio-economic welfare.
2. CREATIVE INDUSTRY IN BANTUL YOGYAKARTA
The growth of creative industries provides optimism to accelerate the growth of the
Indonesian economy. This sector has 14 sub-sectors that have been able to contribute significantly to
the Indonesian economy. In 2004, creative industries achieved the highest growth with record 8.17
percent. This achievement was noted exceeded the average national economic growth which was only
5.03 % (Pangestu 2008). The significant performance of creative industries in Indonesia was shown by
the value of exports in 2006 amounted Rp 81.4 trillion and this number accounted for 9.13% of the
total national export value (Nurani 2014). In terms of work force market, this sector is able to absorb

PAGE 36| Journal of Corporate Governance, Insurance, and Risk Management | 2015, VOL. 2, NO. 3
the labor force on average of 5.8% from 2002 to 2006. Handicrafts as a sub-sector of creative
industries ranks the second largest value of GDP contribution (25.51%), employment (31.07%),
number of exporters (33.02%,) and export (32.44%) (Viva 2010).
Yogyakarta is one of major tourist destinations in Indonesia. This province known as special
region of Yogyakarta (DIY) has many ancient cultural heritages, beautiful beaches, and a spectacular
active volcano. Local way of life and culture are of unique potentials for regional development,
especially in the tourism industry. In addition, the city of Yogyakarta carries a number of unique
attributes such as quality of education, quality of crafts makers, and quality of artists. Not only
Yogyakarta is important destination for international visitors, but also Yogyakarta has a strong magnet
for Indonesians to learn knowledge and culture. Lead by Sultan of Yogyakarta, he creates an
atmosphere where creativities can be openly flourished. This special atmosphere motivates the birth of
many artists and many cultural products that attract many Indonesians and foreigners to come to
Yogyakarta. Similarly, creativities in handicrafts productions are also receives positive atmosphere to
develop. It is therefore, when thinking of finding special handicrafts that represents Indonesia, many
have suggested to find them in Yogyakarta.
More specifically, Bantul is one of Yogyakarta’s Regencies located in southern part of
Yogyakarta Province. Bantul has benefited from the success of Yogyakarta tourism sector. The local
government noted a very successful category for the number of local tourists visit realization (see table
1). However the realization for overseas tourists’ visit was not considered successful as in year 2013.
Regardless the number of overseas visitors, Bantul contributes to 80% of Yogyakarta total crafts
export (Sujatmiko 2013). The majority of Bantul residents work as artistic craftsmen including
pottery, bamboo hand fan, batik material, wooden batik, leather, natural fiber accessories, etc. Many of
them are lack of knowledge for new technological usage in handicrafts industry and they are likely to
maintain the traditional productions. On the other hand, the younger generations have quite responsive
to the globalization and have adapted to the new demand and technology. But they do not have much
interest working as handicrafts entrepreneurs as their future career. Handicrafts producers are
dominantly SMEs and thus very vulnerable to global competition. Proper policies and strategies are
vital for handicrafts SMEs to stay competitive.
Table 1. Tourism Performance in Bantul
Performance
Indicator
Realization
2011
Realization
2012
Target
2013
Realization
2013
Achievement
Value (%)
Category
1. local/national
Visitors
1.738.808
Visitors
2.340.081
Visitors
1.649.462
Visitors
2.153.404
Visitors
130,55 Very
successful
2. Overseas
Visitors
17.654
Visitors
16.497
Visitors
16.661
Visitors
2.153
Visitors
12,92 Not
sucessful
Source: Lakip 2013 Bantul
3. DESTINATION COMPETITIVENESS

PAGE 37| Journal of Corporate Governance, Insurance, and Risk Management | 2015, VOL. 2, NO. 3
Any industry that does not maintain its competitiveness will be difficult to survive.
Competitiveness issue has becoming more pronounced after Porters book of Nation Competitive
Advantage. Porter in his book focuses competitiveness at the macro level. His concept is also
applicable to regional, industrial and cluster level. Competitiveness itself according to Hughes (1993)
is about efficiency and trade performance (market shares). The Organization for Economic Co-
operation and Development (OECD) defines competitiveness as “the degree to which a country can,
under open market conditions, produce goods and services that meet the test of international markets,
while simultaneously maintaining and expanding the domestic real incomes of its people over the long
term” (OECD 1992, p. 237). Competitiveness is capability in integrating productivity, efficiency, and
profitability, for the purpose of higher standards of living and social welfare (Kim 2012).
The concept of destination competitiveness has evolved from competitiveness in the tourism
sector. Destination competitiveness is the ability of a destination to deliver goods and services that
perform better than other destinations (Dwyer & Kim 2003). Starting in around 1990s, in tourism
context, a growing number of tourism researchers has put attention on destination competitiveness
(e.g. Crouch & Ritchie 1999; Dwyer & Kim 2003; Gooroochurn & Sugiyarto 2005, Gomezelj &
Mihalic 2008). The most comprehensive work on Destination Competitiveness (DC) has been
conducted by Crouch and Ritchie (1999). Crouch and Ritchie (1999) conceptual model was built
based on Porter’s “diamond of national competitiveness”. Crouch and Ritchie DC model was then
known as The Competitive Destination: A sustainable tourism perspective (RC’s model) (Kim 2012).
Crouch and Ritchie contribution in their model was in the comprehensive and multidimensional way
of DC model that includes societal prosperity in a global world. Dwyer and Kim (2003) additionally
also suggest an “integrated model” which represents determinants and indicators of destination
competitiveness. Dwyer and Kim (2003) model (DK’s model) combine the main elements of Porter’s
national competitiveness model and the main elements of destination competitiveness from RC’s
model. DK’s model includes inherited resources, created resources, supporting –related resources,
destination management, situational conditions and demand conditions. Further, DK’s model also
involves socioeconomic prosperity as output of destination competitiveness.
Since the work of RC’s model and DK’s model, a number of studies on DC have increased
significantly (Kim 2012). This research is a combination of competitiveness theory model (Porter,
1990) and DK’s model. More specifically, this study adjusts the model of DC in Indonesian tourism
sector into handicrafts sector. Handicrafts clusters are used as competitive destinations since the
clusters are intensively visited by both tourists and traders. The theory of destination competitiveness
should logically applicable for handicrafts clusters competitiveness.
The focus of this study is similar to common study in DC model that is building a model to
explain how a handicrafts village can improve cluster competitiveness by examining the factors as
identified by Porter and DK’s model. The predictors that are built from Porter and DK’s model are as
follow:

PAGE 38| Journal of Corporate Governance, Insurance, and Risk Management | 2015, VOL. 2, NO. 3
Given Resources: The given resources represent more on the main factor conditions that attract
visitors/buyers in the clusters. As the main raw material resources, it is a critical factor in creating
handicrafts products. This consists of natural and cultural resources, such as Human resources
(qualification level, cost of labor, commitment etc.) and material resources (natural resources,
vegetation, space etc).
Created Resources: The created resources are more dealing with endowed resources such as
government facilities, infrastructure, transportation, telecommunication, training, special events or
festivals, entertainment, shopping and marketplace. This resources are manmade, thus competitiveness
cannot rely merely from comparative advantage. A competitive move by actively building manmade
facilities to support the abundant natural and cultural resources should improve the performance of the
clusters.
Supporting/Related Industries: Is the industries that add value to given resources and created
resources. Supporting/related resources cover industry that complement the handicrafts industries such
as hotel and accommodation, culinary, travel transportation, entertainment, training and education, and
other industries. The growth of supporting/related industries may influence the demand on the
handicrafts industries even though supporting industries are not the main value in the handicrafts value
chain.
Demand Conditions: Demand conditions describe the attractiveness of home demand for products
and services produced in the regions/destinations/nations. Home demand may influence the quality,
innovation and competition on the industry. Porter (1990) argued that, home demand is determined by
three following characteristics namely: the mixture (the mix of customers needs and wants), the scope
and growth rate, and the mechanisms that transmit domestic preferences to foreign markets (Kim
2012). A country can achieve competitive advantages in an industry when clearer and earlier signals of
home demand trends are shown to domestic suppliers than to foreign competitors (Porter 1990, Kim
2012). Normally, the influence of home demand is higher than overseas demand in affecting
organization's ability to compete.
Strategy-Structure-Rivalry: The activities by government, industries, and communities that can
enhance the appeal of the main resources, strengthen the related and supporting industries, and
demand conditions. This factor includes policy, safety, protection, and degree of overcoming rivalry.
Porter (1990) defined strategy-structure-rivalry as the conditions that determine the ability of the
companies to establish, organize, manage, and to determine the characteristics of domestic
competition. Relating to strategy-structure-rivalry, cultural aspects play an important role. Different
places have different cultures and thus management style. Factors like management structures,
working morale, decision making, and people interactions are shaped differently in different places.
Culture can cause advantages and disadvantages for industries’ competitiveness. The nature of
industrial ownership and control, including the family-business based industries that are commonly
associated with SMEs determine the specific nature of strategy-structure-rivalry.

PAGE 39| Journal of Corporate Governance, Insurance, and Risk Management | 2015, VOL. 2, NO. 3
Clusters Competitiveness: Ketels (2015) defines that clusters is regional concentrations of economic
activities with a set of industries related linked by different types of networks. Clusters as define by
Porter (1990) is ‘geographic concentration of inter-connected companies and institutions working in a
common industry’. Within clusters, there are arrays of collaboration and competition of services and
providers that create unique infrastructures. Clusters might also be associated with a specific type of
competitive behaviors (Ketels 2015). Regions with a strong presence of clusters are more likely to
success in achieving economic growth or GDP benefits as compared to region without clusters.
Competition based on quality and unique values in clusters triggers production processes that are more
focused on efficiency (Ketels 2015). Clusters and competitiveness are conceptual frameworks used to
analyze the differences in economic performance across locations. Dynamic clusters contribute to a
location’s competitiveness. Clusters thus provide important information to understand and diagnose
the drivers of a location’s economic performance. Similar to destination competitiveness, clusters
competitiveness can be defined as the ability of a cluster to deliver goods and services that perform
better than other destinations.
Socio-economic prosperity: Socio-economic prosperity is defined as the social ‘welfare’ or ‘well
being’. The Socio-economic prosperity includes economic prosperity as well as the quality of life of
residents in the regions/clusters. The success of clusters should provide more job and activities that
enable to increase local income and buying power. The community around will be more dynamic and
the investors will be more attracted for building better infrastructures and public facilities.
By applying the combination of Porter’s and DK’s model of Destination Competitiveness, this
study will assess the relationships between Determinant of destination competitiveness, clusters
competitiveness and socio-economic welfare. The above discussions form the basis for the following
hypotheses:
Hypothesis 1: A significant positive relationship exists between given resources and clusters
competitiveness.
Hypothesis 2: A significant positive relationship exists between created resources and clusters
competitiveness.
Hypothesis 3: A significant positive relationship exists between related-supporting conditions and
clusters competitiveness.
Hypothesis 4: A significant positive relationship exists between demand conditions and clusters
competitiveness.
Hypothesis 5: A significant positive relationship exists between strategy-structure-rivalry and
cluster competitiveness.
Hypothesis 6: clusters competitiveness mediates the relationships between destination
competitiveness factors and socio-economic welfare.

PAGE 40| Journal of Corporate Governance, Insurance, and Risk Management | 2015, VOL. 2, NO. 3
4. RESEARCH METHODOLOGY
This study tests the structural model explaining the relationship between destination
competitiveness, clusters competitiveness, and socio-economic welfare. The main determinants of
destination competitiveness were built based on Porter’s diamond framework. To assess the structural
relationships, Structural Equation Modeling (SEM) with latent variables, specifically Partial Least
Square (PLS) path modeling, is employed.
4.1. Data Collection and Analysis Tools
In order to be able to analyze the structural model, quantitative research is applied. Data were
collected by survey to SMEs owners in Jipangan, Bantul Yogyakarta. The questionnaire was
developed consisting of a total of 32 questions. Five questions were designed to evaluate given
resources, five questions were for created resources, five questions for related- supporting industries,
six questions were for demand factors, and five questions were for strategy-structure-rivalry. All
questions to measure given resources, created resources, demand conditions, supporting-related
industries and strategy-structure-rivalry were taken from Crouch & Ritchie (2003), Dwyer & Kim
(2003), and Kim (2012). Five questions for clusters competitiveness were developed from Mena
(2006). Six questions on socio-economic welfare were developed from Kim (2012). A five-point
Likert scale was used as scaling method.
4.2. Statistical Population and Statistical Samples
Statistical population of the study consists of all SMEs producing handicrafts residing in
Jipangan Bantul Yogyakarta. Out of 75 questionnaires distributed, 54 questionnaires were valid and
reliable to use as valid data for further multiple regression analysis. The 75 questionnaires were
distributed in within 2 months period using convenient sampling method.
4.3. Descriptive Data Analysis
According to the profile of the respondents collected, it can be described that 64.8% of
respondents are male SMEs owners and 35.28% are female SMEs owners. The respondents’ age range
from 5.6% between 15 - 25 years old, 33.3% between 26 - 35 years old, 35.2% between 36 - 45 years
old, and 25.9% older than 45 years old. Monthly earnings are mostly under Rp. 20 million per month
and only five respondents with income per month exceeding Rp. 20 million per month. The
respondent personal data also reveal that 60.7% respondents went to high school as their highest
formal education achieved. Most SMEs also have run their business over 4 years long. The target
PAGE 41| Journal of Corporate Governance, Insurance, and Risk Management | 2015, VOL. 2, NO. 3
market is still focused on national market. Problems in running business are mostly in the forms of
funding and hiring talented labors.
4.4. Assessment for the Measurement Model
PLS allows the measurement and structural models to be analyzed at the same time (Chin
1998). Analysis using PLS are usually conducted in two stages: 1) the assessment of the measurement
model, which focuses more on the reliability and validity of the measures; and 2) the assessment of the
structural model which is more concerned with the path coefficients, model adequacy and selecting the
best final model (Hulland 1999). These two-step approaches were taken for good psychometric
properties before further conclusions can be drawn. This study will follow the statistical analysis
according to the two-step approaches.
The measurement model in PLS is evaluated by examining: (1) the individual loading of each
item; (2) Internal Composite Reliability (ICR); (3) Average Variance Extracted (AVE); and (4)
discriminant validity (Chin 1998). The measurement model focuses on ensuring the validity and
reliability of the measures. Firstly, the individual loading of each item can be seen from the following
table 2. Each of the loading scores determines the correlation between indicators and their respective
constructs. The loading scores can be used to determine the contribution of each indicator to the
relevance of its respective construct. The higher the loadings indicate the stronger the relationships in
terms of shared variance with the construct. Item loading is also known as item reliability. The higher
loading the higher reliability. The loading of 0.5 or 0.6 may still be acceptable in the early stage of
scale development (Chin 1998). After running the PLS analysis, there are some indicators that have
not met the threshold of the standard minimum loading (< 0.5). These indicators were then dropped
and not included in further analysis. Some indicators which were dropped include: One indicator from
given resources, two indicators from created resources, four indicators from demand conditions, and
four indicators from socio-economic prosperity indicators. In total there were eleven indicators
dropped or not reliable as measures in the variables being investigated.

PAGE 42| Journal of Corporate Governance, Insurance, and Risk Management | 2015, VOL. 2, NO. 3
Table 2. Individual loading after filtering
Original
Sample
(O)
Sample
Mean (M)
Standard
Deviation
(STDEV)
Standard
Error
(STERR)
T Statistics
(|O/STERR|)
A1 <- GivenRes 0.6639 0.623 0.162 0.162 4.0981
A2 <- GivenRes 0.8346 0.7936 0.1395 0.1395 5.9842
A3 <- GivenRes 0.8245 0.8297 0.1157 0.1157 7.1258
A4 <- GivenRes 0.7864 0.7487 0.1409 0.1409 5.5807
B3 <- CreatedRes 0.8433 0.8348 0.0682 0.0682 12.3615
B4 <- CreatedRes 0.8875 0.8748 0.1102 0.1102 8.0526
B5 <- CreatedRes 0.7947 0.7773 0.0823 0.0823 9.6575
E3 <- Fac Demand 0.7629 0.7586 0.0692 0.0692 11.0243
E4 <- Fac Demand 0.5188 0.5105 0.1416 0.1416 3.6637
E5 <- Fac Demand 0.5536 0.5432 0.1519 0.1519 3.6446
E8 <- Fac Demand 0.7124 0.682 0.1666 0.1666 4.2759
H1 <- Competitiveness 0.8234 0.8208 0.0455 0.0455 18.1005
H2 <- Competitiveness 0.7073 0.7149 0.0944 0.0944 7.4895
H3 <- Competitiveness 0.5514 0.5094 0.1498 0.1498 3.6801
H4 <- Competitiveness 0.563 0.5553 0.1619 0.1619 3.4773
H5 <- Competitiveness 0.5498 0.5256 0.1911 0.1911 2.8775
I1 <- Welfare 0.623 0.6221 0.0945 0.0945 6.5899
I10 <- Welfare 0.7028 0.7112 0.0721 0.0721 9.7536
I6 <- Welfare 0.6349 0.6028 0.1169 0.1169 5.4326
I7 <- Welfare 0.6587 0.6494 0.0907 0.0907 7.2659
I8 <- Welfare 0.7856 0.7734 0.081 0.081 9.6947
I9 <- Welfare 0.7248 0.7147 0.0688 0.0688 10.5269
Table 3 AVE, ICR, and Cronbach’s Alpha
AVE Composite
Reliability
R Square Cronbachs
Alpha
Communality Redundancy
Competitiveness 0.4203 0.7789 0.3607 0.6611 0.4203 0.0453
CreatedRes 0.7101 0.88 0 0.7969 0.7101 0
Fac Demand 0.4163 0.7354 0 0.5293 0.4163 0
GivenRes 0.6089 0.8607 0 0.7918 0.6089 0
Welfare 0.4769 0.8446 0.265 0.7961 0.4769 0.0933
Secondly, using the data from table 3, Internal Composite Reliability (ICR) can be analyzed.
According to Chin (1998) and Fornell and Larcker (1981), ICR should be higher than 0.7. Based on
table 3 ICR ranges from the lowest 0.7355 (factor demand) to 0.88 (created resources). This means
that ICR values in this study fulfils the requirement as reliable measures. The third step is testing the
AVE. As suggested by Chin (1998) and Fornell and Larcker (1981), AVE should be higher than 0.5.

PAGE 43| Journal of Corporate Governance, Insurance, and Risk Management | 2015, VOL. 2, NO. 3
This study has four factors having AVE below 0.5. All of these factors are maintained since the
content validity has been assessed by experts in the competitiveness study and the measures have been
well developed and tested from previous studies. In addition, AVE is not the only identification for
valid measure. The discriminant validity will be further tested using cross loadings and square root
AVE.
Table 4. Crossloadings
Competitiveness CreatedRes Fac Demand GivenRes Prosperity
A1 0.2155 0.3009 0.027 0.6639 0.0931
A2 0.298 0.1627 0.0902 0.8346 0.0693
A3 0.3986 0.2988 0.1381 0.8245 0.1891
A4 0.2041 0.1996 0.0171 0.7864 0.0466
B3 0.2904 0.8433 0.1183 0.3304 0.338
B4 0.3667 0.8875 0.1934 0.2149 0.4952
B5 0.2704 0.7947 0.042 0.2542 0.4532
E3 0.3363 0.2102 0.7629 0.0578 0.3208
E4 0.1898 0.2405 0.5188 0.0551 0.3925
E5 0.2538 0.0177 0.5536 0.1375 0.3272
E8 0.3418 -0.0323 0.7124 0.0344 0.2224
H1 0.8234 0.3176 0.4515 0.2374 0.4602
H2 0.7073 0.4062 0.292 0.3406 0.3776
H3 0.5514 0.1942 0.2415 0.1709 0.2696
H4 0.563 0.1245 0.1449 0.2421 0.3278
H5 0.5498 0.0135 0.2535 0.2543 0.1427
I1 0.5316 0.3211 0.3774 0.2479 0.623
I10 0.3587 0.4601 0.2428 0.2034 0.7028
I6 0.2665 0.286 0.2312 0.0239 0.6349
I7 0.2222 0.2503 0.3435 -0.1028 0.6587
I8 0.2586 0.4096 0.4259 -0.0692 0.7856
I9 0.2459 0.3349 0.2262 0.0493 0.7248
Table 5 Correlation and AVE square roots.
Competitiveness CreatedRes Fac Demand GivenRes Prosperity
Competitiveness 0.6483 0 0 0 0
CreatedRes 0.3718 0.8430 0 0 0
Fac Demand 0.447 0.1486 0.6452 0 0
GivenRes 0.3812 0.3101 0.1036 0.7803 0
Prosperity 0.5148 0.5123 0.462 0.1426 0.69058
In order to test the discriminant validity, crossloading and AVE square roots will be analyzed.
The discriminant validity is shown when the indicators are better associated with their respective
construct than they are with other constructs. When checking the cross-loadings, researchers must
ensure whether each group of indicators should load higher for its respective construct than indicators
of other constructs (Cunningham 2008). The crossloading matrix of the measures showing the

PAGE 44| Journal of Corporate Governance, Insurance, and Risk Management | 2015, VOL. 2, NO. 3
correlations between all items and constructs are displayed in table 4. Since all indicators that have not
satisfied the item loadings have been dropped, there remained indicators that as shown in table 4 were
well associated with their respective construct. The indicators that associated with their respective
construct load higher than association to other constructs.
In addition, as indicated in Table 5, the square root of the AVE was tested against the
intercorrelations of the construct with the other constructs in the model to ensure discriminant validity
(Chin, 2003, Fornell & Larcker, 1981). All the square root of the AVE exceeded the correlations with
other variables. Thus, the measurement model was considered satisfactory with the evidence of
adequate reliability, convergent validity, and discriminant validity.
4.5. Assessment for the Structural Model
The use of R-squared (R2)
is important in determining the predictive ability of the model. PLS
produces R2
for each of dependent construct in the model. The bigger the R2, the more predictive
power the model implies. As seen in Figure 2, R-squared (R2)
of cluster competitiveness is 37.2% and
socio-economic prosperity is 26.5%. The rule-of-thumb for the significance of R2 of the predicted
variables should be greater than 0.10 (Falk & Miller 1992). Even though they both cluster
competitiveness and socio-economic do not show a strong R2, they are higher than the threshold 0.10.
This study proposes an indirect relationship between destination competitiveness factors and
socio-economic welfare via clusters competitiveness. In assessing indirect relationships, this study
follows the approach suggested by Baron and Kenny’s (1986). Baron and Kenny’s (1986) method is
widely accepted in marketing studies (e.g. Agarwal et al. 2003; Matear et al. 2002). There are three
requirements highlighted to test the mediation effect: 1) the independent variable (X) must affect the
mediating variable (Y); 2) the independent variable (X) must affect the dependent variable (Z); and 3)
the mediating variable (Y) must affect the dependent variable (Z). As can be seen in Figure 1 below,
the impacts of related-supporting industries on clusters competitiveness is not significant with the
coefficient of 0.049. Similarly, the impact of strategy-structure-rivalry to clusters competitiveness is
also not significant with coefficient of 0.093. This means that both factors do not satisfy the
requirements as suggested by Baron and Kenny (1986) for indirect model. These two factors were then
dropped and are not use for further analyses.
Figure 2 shows the final model after related-supporting factors as well as strategy-structure-
rivalry were dropped. Using the result from the final model, it can be concluded that hypothesis three
and hypothesis five were not supported. On the other hand, hypotheses 1, 2, and 4 were supported,
meaning that positive relationship exists between given resources, created resources, and demand
conditions to clusters competitiveness. Hypothesis six is also accepted when dropping related-
supporting industries and strategy-structure-rivalry. This means that clusters competition mediates the
relationships of three destination competitiveness factors and socio-economic welfare. Table 6 shows
the significance of the final structural model of this study.

PAGE 45| Journal of Corporate Governance, Insurance, and Risk Management | 2015, VOL. 2, NO. 3
Figure 1. Proposed Research Model
Figure 2. Final Research Model
Table 6. Total effect
Original
Sample (O)
Sample
Mean (M)
Standard
Deviation
(STDEV)
Standard
Error
(STERR)
T Statistics
(|O/STERR|)
Competitiveness -> Prosperity 0.5148 0.5458 0.0552 0.0552 9.3316
CreatedRes -> Competitiveness 0.231 0.2318 0.0841 0.0841 2.7476
CreatedRes -> Prosperity 0.1189 0.1282 0.051 0.051 2.3301
Fac Demand -> Competitiveness 0.3848 0.4049 0.0656 0.0656 5.8695
Fac Demand -> Prosperity 0.1981 0.2205 0.0403 0.0403 4.9207
GivenRes -> Competitiveness 0.2697 0.2797 0.0931 0.0931 2.8965
GivenRes -> Prosperity 0.1388 0.1516 0.0496 0.0496 2.8008
5. DISCUSSIONS

PAGE 46| Journal of Corporate Governance, Insurance, and Risk Management | 2015, VOL. 2, NO. 3
Based on respondents’ profile, majority of the handicrafts producers are small and medium
business owners. They are in the middle age with dominantly less than 45 years old. The level of
education background is majority high school graduates. These data imply that handicrafts owners in
Bantul have limitations and thus getting supports from government, education institutions, and
industries are of significant important. Due to limitations in funding and education, handicrafts SMEs
in Bantul lack crafts skill and managerial competences. Limitation in education could effect on the
ability to handle global competition as well as adapting global market. Management skills and
leaderships are vital to SMEs owners in that they can motivate their employee better. Most owners
stated that the most challenges were related to lack of funding and labor talents. Difficulties to find
young generations to work as craftsmen can be caused by the low appreciation for craftsmen product
by the locals and this job is perceived as not giving a good career. Another reason is many younger
generations prefer to work in the manufacture setting as compared to become entrepreneurs. The
problem related to funding should be overcame by a more collaborative approaches facilitated by
government, industries, education institutions and SMEs.
Bantul is a small town located in southern part of Yogyakarta. Bantul has huge natural
resources. It is well known as exporters of bags and other accessories made from natural fibers.
Kotagede is also parts of Bantul which is very famous with silver craft. Pottery from Kasongan is
another well known product made by Bantul residents. Wooden batik is a new innovation of batik
crafts as alternative to traditional batik materials. According to the factors analyzed as the sources of
destination competitiveness, three factors (given resources, created resources and demand conditions)
are positively significant in predicting clusters competitiveness. Cluster competitiveness also
significantly mediates the relationship between destination competitiveness factors and socio-
economic factors. The following discussions will start from direct relationships of factors that have
significant impacts.
Given resources and created resources are positively impacted on clusters competitiveness.
This finding supports the finding from previous study (eg. Dwyer & Kim (2003); Jackson (2006);
Eickelpasch, et al. (2010); Kim (2012)). These resources as in Porter Diamond is known as factor
conditions. The handicrafts SMEs in Bantul are commonly a small-medium size and they have not
applied advanced managerial practices such as branding, promotion or financial planning. Many are
depending on product order. The specific characteristics of the craftsmen are the indigenous skills that
they have. These indigenous skills provide uniqueness that is not easily copied. This indigenous skills
gives specific areas /clusters a distinct skill in the making of product supported by the availability of
raw materials and created resources. Having clusters with distinct product talents gives Bantul
attractiveness particularly for artistic product hunters. On the other side, Bantul has ample of natural
resources providing steady stock for production process. The availability and ease of access on raw
materials help SMEs to work efficiently. Steady stock of raw materials and human talents are seen by
SMEs owners as directly contribute to their competitiveness. However, challenges on the future stocks
PAGE 47| Journal of Corporate Governance, Insurance, and Risk Management | 2015, VOL. 2, NO. 3
of human talent must be addressed since younger generations are reluctant to work as handicrafts
entrepreneurs and prefer to work in the more formal institutions.
Given resources as sources of comparative advantage will not perfectly work if created
resources are not well provided. The provision of infrastructure, transportation, telecommunication,
and access support to market network should complement given resources. Porter argued that today’s
winning competition is no longer coming from comparative but shifting to competitive advantage.
Both given and created resources are seen by respondents as directly impact on clusters
competitiveness since the capability to produce must be assisted by attractive market place, policy and
regulations, as well as public infrastructures. Government interference in this factor is important. The
provision of marketplace for handicrafts SMEs is not only done by physically providing the market.
But more importantly, the program, the content, and the network fulfilled to the market will be more
useful for SMEs participating in the market. Government should actively encourage SMEs
participations for trade event, organize festivals and assist network building with potential buyers.
This study supports the proposition that demand factors have impact on clusters
competitiveness. Demand conditions represent the attractiveness of home demand and may influence
the quality, innovation and competition on the industry. The significant influence of demand
conditions to clusters competitiveness implies that SMEs respondents admit that handicrafts market
becomes more attractive and competitive when local demand and varieties of demand increase.
Varieties of buyers background whether local or international buyers increase the craftsmen talents
since they have to be able to translate the products required by many different buyers. As tourism and
education centre, Yogyakarta is very open to visitors not only as for tourist but also as for students to
learn new skills/knowledge and as for residents to make a living. The openness and the blend among
people from all over the world makes the interaction on needs, wants, experiences, skills and
education high. The higher sophistication on demand influences the level of competition and
ultimately the level of products’ competitiveness made in Bantul.
The fact that related-supporting industries are not significantly impact on clusters
competitiveness is quite surprising and does not align with previous research findings. However, this
finding can be explained by these following arguments. The handicrafts SMEs are mainly focus on
production activities as compared to doing commercial or marketing activities. They also see that
tourism sectors such as entertainment, cultural performances, culinary, education, hotel, travel agency
as not directly relating to profit in their production processes. This might explain why respondents
who are SMEs owners do not see that supporting-related industries directly impact on clusters
competitiveness. In reality, SMEs handicrafts industry is highly depending on the success of tourism
industry. However, any activities that do not relate to success on production process is not considered
competitive effort as seen by SMEs.
Research on handicrafts SMEs in Bantul has found that strategy-structure-rivalry does not
have impact on clusters competitiveness. This means that this finding is not in align with previous

PAGE 48| Journal of Corporate Governance, Insurance, and Risk Management | 2015, VOL. 2, NO. 3
findings on destination/tourism sectors when using Porter Diamond as predictors of competitiveness.
This factor represents how the industries are established, organized and managed. The different
findings can be explained similar to finding as with supporting-related industries factors. Simply,
respondents are not considering anything that is not directly within internal production processes as
determining their competitiveness. Due to lack of managerial skills and network interactions, SMEs
owners are too focus on internal capability and lack response to external environment. The family
business orientation could be the reason why change is not common. SMEs also majority satisfied
with managing business as far as by depending on order (made to order). They do not proactively
expand and introduce their business proactively. This type of traditional nature of running business
will not survive in facing the global competitors. Government, education institutions, and bigger
industries should take into action in protecting the sustainability of handicrafts SMEs.
Clusters competitiveness was found to influence socio-economic welfare. Clusters
competitiveness also mediates the relationships between created resources, given resources, and
demand conditions to socio-economic welfare. This finding is in align with previous studies by Dwyer
& Kim (2003), Jackson (2006), Eickelpasch, et al. (2010), and Kim (2012). This finding implies that
success in clusters will increase the level of competitiveness. When the cluster is competitive, more
jobs will be created, more supplies will be needed, and the residents will have better buying power. In
this situation, the economy will be more attractive. Simply, the quality of life of the residents within
competitive cluster will increase. As previously stated, regions with a strong presence of clusters are
more likely to success in achieving economic growth or GDP benefits as compared to region without
active clusters. Thus, it is important that cluster approach needs to be adopted in the handicrafts SMEs
since the final goal of all development is residents welfare and the quality of life. Additionally, the
role of clusters competitiveness also vital since it mediates the relationships between three factors of
destination competitiveness to socio-economic welfare. This again confirms that cluster approaches
for handicrafts SMEs need to be adopted so that better collaboration among clusters or among SMEs
are even better and stronger.
6. CONCLUSSION AND RECOMMENDATIONS
The goal of national development is the increase in the quality of residents’ life. In order to
achieve the quality of life, a nation must be competitive. The purpose of this research is to analyze the
application of destination competitiveness in the handicrafts SMEs to see whether the factors of
competitiveness do influence the clusters competitiveness and socioeconomic welfare. After several
steps of statistical analyses, the final model reveals that only three hypotheses supported meaning that
only given resources, created resources, and demand conditions that directly and indirectly effect
socio-economic welfare. Clusters competitiveness also significantly supported as mediating variable.
Hypothesis three and hypothesis five are not supported. Thus, these factors (related/supporting
industries and strategy-structure-rivalry) were not used as analysis in the final model.

PAGE 49| Journal of Corporate Governance, Insurance, and Risk Management | 2015, VOL. 2, NO. 3
This study offers some contributions to the literature and the managerial practices. The factors
determining destination competitiveness studied in the handicrafts SMEs in Bantul Yogyakarta
provides more evidences on the application of Ported Diamond as a base for developing destination
competitiveness strategy. Clusters competitiveness is also important in determining the socio-
economic welfare of the region/area being investigated. For the managers, a broader aspect of
competitive moves should be considered. Not only that SMEs owners focus merely on internal
capabilities, but also external factors that do not seems to directly effect on competitiveness should be
seriously taken into consideration. The understanding of the external competitive factors will help
SMEs owners/managers and policy makers to decide a more sustainable strategy for longer
competitiveness.
REFERENCES
Agarwal, S, Erramilli, M.K. and Dev, C.S, (2003), “Market orientation and performance in service
firms: role of innovation”, Journal of Services Marketing, Vol. 17 No. 1, pp. 68-82.
Baron, R.M. and Kenny, D.A, (1986), “The moderator mediator variable distinction in social
psychological-research-conceptual, strategic and statistical considerations”, Journal of
Personality and Social Psychology, Vol. 51 No. 6, pp. 1173-82.
Chin, W.W, (1998), “The partial least squares approach to structural equation modeling”, In: G. A.
Marcoulides (Ed.), Modern Methods for Business Research (pp. 295–358), Mahwah, NJ:
Lawrence Erlbaum Associates.
Chin, W.W, Marcolin, B.L and Newstead, P.R, (2003), “A partial least squares latent variables
modeling approach for measuring interaction effects: results from a Monte Carlo simulation
study and electronic-mail emotion/adoption study”, Information System Research, Vol. 14 No.
2, pp. 189-217.
Crouch, G.I, and Ritchie, J.R.B, (1999), “Tourism, competitiveness, and societal prosperity”, Journal
of Business Research, Vol 44 No 3, pp. 137-152.
Cunningham, E, (2008), “Structural equation modelling using AMOS”, Statsline, Melbourne.
Dwyer, L. and Kim, C, (2003) “Destination competitiveness: Determinants and indicators”, Current
Issues in Tourism, Vol 6 No 5, pp. 369-414.
Falk, R.F and Miller, N.B (1992), “A primer for soft modeling”, University of Akron Press, Akron,
OH.
Fornell, C and Larcker, D (1981), “Structural equation models with unobservable variables and
measurement error: algebra and statistics”, Journal of Marketing Research, Vol. 18 No. 3, pp.
382-88.
Gomezelj, D.O. and Mihalič, T, (2008), “Destination competitiveness-Applying different models, the
case of Slovenia”, Tourism Management, Vol. 2 No. 2, pp. 294-307.

PAGE 50| Journal of Corporate Governance, Insurance, and Risk Management | 2015, VOL. 2, NO. 3
Gooroochurn, N. and Sugiyarto, G, (2005), “Competitiveness indicators in the travel and tourism
industry”, Tourism Economics, Vol. 11 No.1, pp. 25-43.
Gursoy, D., Baloglu, S. and Chi, C.G, (2009), “Destination competitiveness of Middle Eastern
countries: An examination of relative positioning”, Anatolia, Vol 20 No. 1, pp. 151-163.
Hughes, K.S, (1993), “European Competitiveness”, Cambridge University Press.
Hulland, J, (1999), “Use of partial least squares (PLS) in strategic management research: A review of
four recent studies”, Strategic Management Journal, Vol. 20 No. 2, pp. 195-204.
Ketels, C, (2015), “Competitiveness and Clusters: Implications for a New European Growth Strategy”,
Work Package 301 MS48, Policy paper: Role of clusters, competitiveness in the new
orientation of the European growth strategy”, Working Paper no 84.
Kim, N, (2012), “Tourism destination competitiveness, globalization, and strategic development from
a development economics perspective”, PhD Dissertation in Recreation, Sport and Tourism
University of Illinois at Urbana-Champaign, USA.
Lakip, (2014), “Laporan Akuntabilitas Kinerja Instansi Pemerintah (Lakip) Kabupaten Bantul Tahun
2013”, Pemerintah Kabupaten Bantul Pemerintah Daerah Istimewa Yogyakarta, available at
http://setda.bantulkab.go.id/documents/20140522103011-lakip-2013.pdf. assessed 5 July 2015
Lee, C.F. and King, B, (2009), “A determination of destination competitiveness for Taiwan’s hot
springs tourism sector using the Delphi technique”, Journal of Vacation Marketing, Vol. 15
No. 3, pp. 243-257.
Mena, M.M, (2006), “Exploring destination competitiveness from a Social development perspectives,
evidence from South East Asia”, PhD Dissertation, The Hongkong Polytechnic University,
School of Hotel and Tourism Management.
Matear, S.M., Osborne, P., Garrett, T.C. and Gray, B.J, (2002), “How does market orientation
contribute to service firm performance? An examination of alternative mechanisms”,
European Journal of Marketing, Vol. 36 No. 9/10, pp. 1058-1075.
Nurani, N, (2014), “The Effectiveness of Act No. 19 Year 2002 Concerning With Copyright
As A Protection of Craft Creative Industry to Increase the Acceleration of Creative
Economic Growth of Indonesia” Journal Of Contemporary Management Sciences, Vol
1 No. 2, pp. 32-45. OECD, (1992), “Technology and the economy the key relationships”, Paris: OECD Publ.
Pangestu, M.E, (2008), “Pengembangan Ekonomi Kreatif Menuju Visi Ekonomi Kreatif Indonesia
2025 - Rencana Pengembangan Ekonomi 14 Sub Sektor Ekonomi Kreatif Indonesia 2009-
2015”, Departemen Perdagangan RI, hlm 1. Available at
http://www.karokab.go.id/koperindag/images/stories/BluePrintEkonomiKreatifIndonesiaBuku
2.pdf, accessed 15 June 2015.
Porter, M.E, (1998), “Competitive Advantage of Nations”, Free Press.
Porter, M.E, (1990), “The Competitive Advantage of Nations”, Harvard Business Review, Vol. 68 No.
2, pp. 73-93.

PAGE 51| Journal of Corporate Governance, Insurance, and Risk Management | 2015, VOL. 2, NO. 3
Ritchie, J.R.B. and Crouch, G.I, (2003), “The Competitive Destination: A sustainable tourism
perspective (First.)”, CABI Publishing, Wallingford, UK.
Sujatmiko, T, (2013), “Disperindagkop Bantul Gelar Pelatihan Ekspor-Impor”, , available at
http://krjogja.com/read/193769/disperindagkop-bantul-gelar-pelatihan-ekspor-impor.kr,
assessed in 15 November 2013
The Jakarta Post, (2014), “Creative Industry Grow 6 percent”, available at
http://www.thejakartapost.com/news/2014/02/14/creative-industry-grow-6-percent.html
(accessed 11 Mei 2014).
Viva (2010), “HIMPI Targetkan Ekspor Kerajinan U$$ 650 juta. Produk Indonesia Yang Inovatif
Banyak Dicari Dan Diekspor Ke Luar Negeri”, available at
http://forum.viva.co.id/indeks/threads/himpi-targetkan-ekspor-kerajinan-us-650-juta.32666/
accessed 18 June 2015.

Pages 52-66
PAGE 52| Journal of Corporate Governance, Insurance, and Risk Management | 2015, VOL. 2, NO. 3
Journal of Corporate Governance, Insurance, and Risk Management (JCGIRM)
2015, Volume 2, Series 3
The Demand for International Reserves in Lesotho
Senei Solomon Molapoa, Retselisitsoe Isaiah Thamae
b,*
aMinistry of Finance, Government of Lesotho, Maseru 100, Lesotho bDepartment of Economics, National University of Lesotho, P.O. Roma 180, Lesotho
A B S T R A C T A R T I C L E I N F O
The study examines Lesotho’s demand for holding international reserves
and assesses the country’s reserve adequacy position over the period 1981-
2012. The results from the standard reserve adequacy benchmarks reveal
that Lesotho generally has sufficient stock of foreign reserves to satisfy
the minimum adequacy requirements, with the level of reserves in other
periods being relatively higher than what is required. Furthermore, the
estimates of Lesotho’s reserve demand function from the cointegration
analysis suggest that the long-term reserve demand policies for Lesotho
are positively related to average propensity to import, economic growth
and export volatility while negatively associated with exchange rate
volatility and opportunity cost of holding reserves. The former finding
confirms that the precautionary motive plays a significant role in
determining Lesotho’s demand for holding international reserves, while
the latter indicates that reserve accumulation in Lesotho is based on
profitability considerations. The results also show that although the
demand for foreign reserves increased in the years of democracy, the
country sometimes uses part its international reserves to finance
government infrastructure projects.
Keywords:
International Reserves, Reserve
Adequacy, Cointegration,
Lesotho
*Corresponding author:
(Retselisitsoe Isaiah Thamae)
Article history:
Article Submitted 14-04-2015
Article Accepted 20-06-2015
**Article previously published in
EJEM 2015, vol 2, No. 3
1. INTRODUCTION
Over the past three decades, Lesotho has generally experienced an upward trend in international
reserves in an attempt to boost international confidence on domestic economy and smooth out random
fluctuations in external payment imbalances. Since 1981, nominal (real) foreign reserves have
increased from M0.3 (M2.9) billion to M8.5 (M5.1) billion in 2012, reaching a peak of M9 (M6.4)
billion in 2008 (2001) (see figure 1). However, there are observable declines in international reserves
in some periods that could be attributed to the effects of internal or external shocks on reserves. On the
other hand, when compared with other countries within the Southern African Customs Union (SACU)1
for the period 2010-2014, Lesotho has the second highest stock of foreign reserves as a percentage of
GDP with an average of 46%, following Botswana with the average of 55%. On the other hand,
Swaziland, Namibia and South Africa have the averages of 19%, 14% and 12%, respectively (see table
1). As a result, questions arise regarding adequacy and demand drivers for international reserves in
1 SACU member states include Botswana, Lesotho, Namibia, South Africa and Swaziland.

PAGE 53| Journal of Corporate Governance, Insurance, and Risk Management | 2015, VOL. 2, NO. 3
Lesotho. First, what is Lesotho’s position in terms of reserve adequacy? Second, what are the
country’s motives for foreign reserve accumulation?
Figure 1: Trends in real and nominal international reserves (RES) in Lesotho (Million Maloti)
Table 1: International reserves (as % of GDP) in SACU countries (2010-2014)
Country 2010 2011 2012 2013 2014 Average
Botswana 54 58 54 54 54 55
Lesotho 44 42 45 51 51 46
Swaziland 18 16 19 22 19 19
Namibia 14 16 14 13 12 14
South Africa 10 12 12 14 13 12
Source: Own calculations using data from the international financial statistics of the International
Monetary Fund (IMF).
It is against the above background that the study examines Lesotho’s demand for holding
international reserves and assesses the country’s reserve adequacy position. Although studies like that
of Sula (2011), Pina (2011) and Elhiraika and Ndikumana (2007) provide the empirical investigation
of the demand for foreign reserves in developing countries, including Lesotho, they suffer from
methodological problems related to cross-country analyses such as the influence of outliers and the
heterodoxity of sample countries under study. Therefore, this paper contributes to empirical literature
on international reserve holdings by using time series data covering the period 1981-2012 from
Lesotho, which is a small but highly open economy operating under a fixed exchange rate regime.
Furthermore, the findings of this study could help policy-makers in Lesotho to better understand some
of the fundamental developments affecting the country’s motives for foreign reserve accumulation and
may serve as a reference for the design of Lesotho’s international reserve policy. The rest of the paper
0
2,000
4,000
6,000
8,000
10,000
198
2
198
4
198
6
198
8
199
0
199
2
199
4
199
6
199
8
200
0
200
2
200
4
200
6
200
8
201
0
201
2
Real RES Nominal RES

PAGE 54| Journal of Corporate Governance, Insurance, and Risk Management | 2015, VOL. 2, NO. 3
is then organised as follows. Section 2 reviews the literature on the demand for foreign reserves while
section 3 provides Lesotho’s brief economic context and analyses the country’s reserve adequacy
position. Section 4 estimates the reserve demand function for Lesotho and offers the discussion of the
results. The last section concludes the study with implications for further research.
2. LITERATURE REVIEW
International (or foreign) reserves are regarded an indispensable financial resources of an economy
and they exist in every independent economy that is open to international transactions. However, the
amounts of foreign reserves held by the authorities in various economies are different depending on
the array of policy-determined and objective factors. The existing literature thus outlines several
objectives for holding international reserves. These motives are commonly allocated in two
components, namely the precautionary and mercantile motives (see Aizenman and Lee, 2007; Chan,
2007). The former is based on the fact that economies with a high degree of openness are likely to
come across random shocks to their external balance, which builds temporary discrepancies between
international payments and receipts or creates balance of payments (BOP) imbalance. Under such
condition, the foreign reserves can be used as a shock absorber, representing the economy’s ability to
finance the payments deficit without resorting to painful and undesirable adjustments.
Kenen and Yudin (1965) further argue that for countries which borrow heavily abroad to finance
BOP deficits, the foreign reserves informally carry out the function of collateral for external liabilities.
Nonetheless, this function is considered to be notional since the external assets of an economy, which
include the international reserves, are the ultimate resources for settling foreign liabilities in order to
achieve sustainable external balance. Alternatively, international reserves are regarded to play a
central role in enhancing confidence in national currencies of small economies that are in a process of
liberalising their external accounts. This is because the loss of confidence as a result of foreign
reserves falling below a certain band could induce currency-holders to export capital, thus causing
disruption in external balance and monetary stability. Therefore, the precautionary motive directly
links foreign reserve accumulation in different economies to exposure to unanticipated sudden-stop
crises, capital flight and volatility.
On the other hand, the mercantile motive views the accumulation of international reserves as a
foundation for promoting export competitiveness. Under this motive, the country’s reserve
accumulation is considered to facilitate export growth by slowing or preventing the appreciation of
domestic currency against other foreign currencies. In this context, reserve accumulation is therefore
regarded as a residual of an industrial policy aimed at imposing adverse effects on the export
capabilities of other trading partners. Nevertheless, the holding of large foreign reserves – irrespective
PAGE 55| Journal of Corporate Governance, Insurance, and Risk Management | 2015, VOL. 2, NO. 3
of the motive – involves a high degree of risk (see Chan, 2007). First, the appreciation of domestic
currency increases the risk of loss of value of the international reserves and this may require
adjustment mechanisms, which often come with a cost in aggregate income or welfare foregone.
Second, the holding of foreign reserves has an opportunity cost since part of these financial resources
could be used in a number of alternatives ways such as servicing short-term debt or financing
investment projects. According to Mishra and Sharma (2011), this opportunity cost could be high
especially in developing countries where the demand for funds to finance developmental projects
always exceeds the available supply.
Given that there are both benefits and costs in accumulating international reserves, a number of
studies have been undertaken to determine either the adequacy of reserves or their demand in different
countries. For example, Mishra and Sharma (2011), Drummond and Dhasmana (2008) as well as Bird
and Rajan (2003) assess the adequacy of reserves in emerging economies using simple rules of thumb
such as maintaining reserves equivalent to three months of imports, short-term external or total
amount of broad money. The former reserve adequacy measure serves as a guarantee of no hindrance
in external trade transaction even in a case of complete cut-off from foreign inflows while the latter
provides a useful measure of the potential for capital flight from the country. Alternatively, the ratio of
reserves to short-term external debt could be a relevant measure of risks associated with adverse
developments in international capital markets. The use of these traditional reserve adequacy ratios
could therefore help the central banks to follow a rational and cautious approach by not allowing the
reserves to cross beyond the required thresholds while at the same time using them for alternative
purposes to avoid the opportunity costs of holding large amounts of foreign reserves.
On the other hand, the empirical evidence on the demand for reserves from studies like that of Sula
(2011), Mishra and Sharma (2011), Elhiraika and Ndikumana (2007), Badinger (2004) as well as
Aizenman and Marion (2003) has identified the following variables, among others, for inclusion in
estimating the reserve demand function: the size of the international transactions (represented by the
average propensity to import), the standard of living (proxied by the overall economic growth), the
volatility of international receipts and payments (captured by export volatility), and that of nominal
exchange rate (as measures of uncertainty), the opportunity cost of holding reserves (proxied by the
difference between domestic interest rate and yield on foreign reserves) and the size of short-term
external debt. Since most of these variables are found to significantly explain the demand for foreign
reserves not only in developed countries but also in emerging economies, they are therefore suitable to
capture the motives for international reserve holdings in the context of Lesotho.

PAGE 56| Journal of Corporate Governance, Insurance, and Risk Management | 2015, VOL. 2, NO. 3
3. ECONOMIC BACKGROUND AND RESERVE ADEQUACY IN LESOTHO
3.1. Economic Context
Lesotho is a lower-middle income country with a per capita income of about US $1000. It has
experienced an annual GDP growth rate of approximately 4% over the past three decades (Thamae,
2013). The country’s economic progress depends mainly on the developments in the neighbouring
Republic of South Africa (RSA), which surrounds it entirely, through the remittances of workers
employed in the RSA mines as well as the sale of water resources to RSA. Lesotho’s economy is also
anchored by strong performance in the mining and quarrying sector and the existence of a preferential
agreement with the United States (US) under the African Growth and Opportunity Act (AGOA) that
boosts the output in the textile sector (IMF, 2012). Furthermore, Lesotho is a beneficiary of SACU’s
free trade agreement and the SACU receipts account for about half of total government revenues
(Masenyetse and Motelle, 2012). These transfers from SACU constitute the main channel through
which the country accumulates international reserves, especially in a form of Rands from RSA.
Since 1974, Lesotho has also been a member of the Rand Monetary Area (RMA) – now known as
the Common Monetary Area (CMA) from 1986, whereby the currencies of each member state were
100% backed by the RSA Rands and were pegged at par with it. In addition, the country has entered
into a bilateral agreement with RSA, which gives a provision for the RSA Rands to be a legal tender in
Lesotho. According to CBL (2012), about 90% of foreign reserves in the cash balance portfolio are
therefore in RSA Rands, while the remaining 10% is in US Dollars, Euros, British Pounds and other
foreign currencies. This could be expected since RSA is Lesotho’s major trading partner, with Lesotho
importing approximately 80% of its goods and services from RSA (IMF, 2012). On the other hand, the
US Treasury bills dominate Lesotho’s investment portfolio of international reserves, which still
includes the RSA Treasury bills. The last portfolio of Lesotho’s foreign reserves is made up of the
IMF accounts such as IMF quotas, SDR holdings and fund reserve tranche, and the interest accrued on
RSA Rands.
3.2. Reserves in Months of Imports
The study adopts two among various traditional rules of thumb for reserve adequacy to analyse
Lesotho’s position2. The first one examined under this sub-section is the import cover, which is a ratio
of foreign reserves to total imports. It represents number of months for which the country’s reserves
could support its current level of imports, if all other inflows and outflows stop. According to Fischer
2 Only two measures of reserve adequacy are considered due to lack of data on some variables such as short-
term external debt.

PAGE 57| Journal of Corporate Governance, Insurance, and Risk Management | 2015, VOL. 2, NO. 3
(2001), different countries are recommended to hold international reserves that could cover at least 3
to 4 months of their imports. Thus, this ratio postulates that the demand for reserves is expected to
grow with the level of international trade.
Figure 2: International reserves in months of imports
Using the yearly data on international reserves and total imports over the period 1981-20123, figure
3 reveals that Lesotho’s stock of foreign reserves has continuously stayed above the minimum
required level of 3 months of imports except during the period 1986-1994 when it fell below the
required benchmark. Prior to 1993, the level of reserves reached the maximum of 4.5 months of
imports in 1982 and then fell in the subsequent years to a minimum of 2.2 months of imports in 1991.
However, since the beginning of the democratic regime in 1993, Lesotho accumulated sufficient
amount of foreign reserves, peaking 6.2, 7.4 and 6.6 months of imports in 1998, 2001 and 2008,
respectively. Thus, these observed cycles in the import cover could imply that Lesotho holds
international reserves as a buffer stock against external shocks, whereby it accumulates reserves in
times of abundance and depletes them in times of scarcity.
3.3. Reserves as Ratio of Broad Money
The other reserve adequacy benchmark considered under this sub-section is the ratio of reserves to
broad money (M2 in the case of Lesotho), which reflects the country’s exposure to capital flight risk.
Flood and Marion (2001) argue that the risk that domestic liquidity could be converted into foreign
assets is greater for countries with the currency peg than those with the flexible exchange rate regime.
The conventional range of reserves to broad money ratio is said to be 5-15% and its low and falling
figure is a leading indicator of currency crisis (see Kaminsky & Reinhart, 1999).
3 The dataset on reserves and imports is obtained from the Central Bank of Lesotho and the Ministry of
Finance, respectively.
2
3
4
5
6
7
8
198
2
198
4
198
6
198
8
199
0
199
2
199
4
199
6
199
8
200
0
200
2
200
4
200
6
200
8
201
0
201
2
Mo
nth
s o
f Im
po
rt

PAGE 58| Journal of Corporate Governance, Insurance, and Risk Management | 2015, VOL. 2, NO. 3
Figure 3: Ratio of international reserves to broad money (M2)
Figure 3 shows that foreign reserves in Lesotho have been far above the conventional range of 5-
15% of the broad money4 over the entire period, with a minimum of about 100% in 1991 and 2010.
This is expected since Lesotho’s currency needs to be 100% backed by the RSA Rands (which
constitute about 90% of Lesotho’s international reserves in the cash balance portfolio) in order to
maintain the peg under the CMA agreement. Nevertheless, the fact that foreign reserves at times could
reach a peak of about 260% of broad money and 7.4 months of imports (see figure 2), just like in
2001, indicates that there is a need to determine other motives for holding international reserves in
Lesotho.
4. ESTIMATING LESOTHO’S RESERVE DEMAND FUNCTION
4.1. Model Specification and Estimation Strategy
The study follows the works of Mishra and Sharma (2011) as well as Aizenman and Marion (2003)
to assess various motives of demand for foreign reserves in Lesotho. The standard long-run model for
international reserves (RES) is then specified as a function of average propensity to import (API),
economic growth (GDP), export volatility (EXV), exchange rate volatility (ERV) and opportunity cost
(OPC) as follows5:
where is the error term, the ’s are parameters to be estimated, denotes the time period and Z
captures the impact of exogenous conditions on foreign reserves. Given that reserves holding should
4 The dataset on M2 is obtained from the Central Bank of Lesotho for the period 1981 to 2012.
5 The variable on short-term external debt is not included in the model due to unavailability of data.
80
120
160
200
240
280
19
82
19
84
19
86
19
88
19
90
19
92
19
94
19
96
19
98
20
00
20
02
20
04
20
06
20
08
20
10
20
12
Pe
rce
nt
(%)
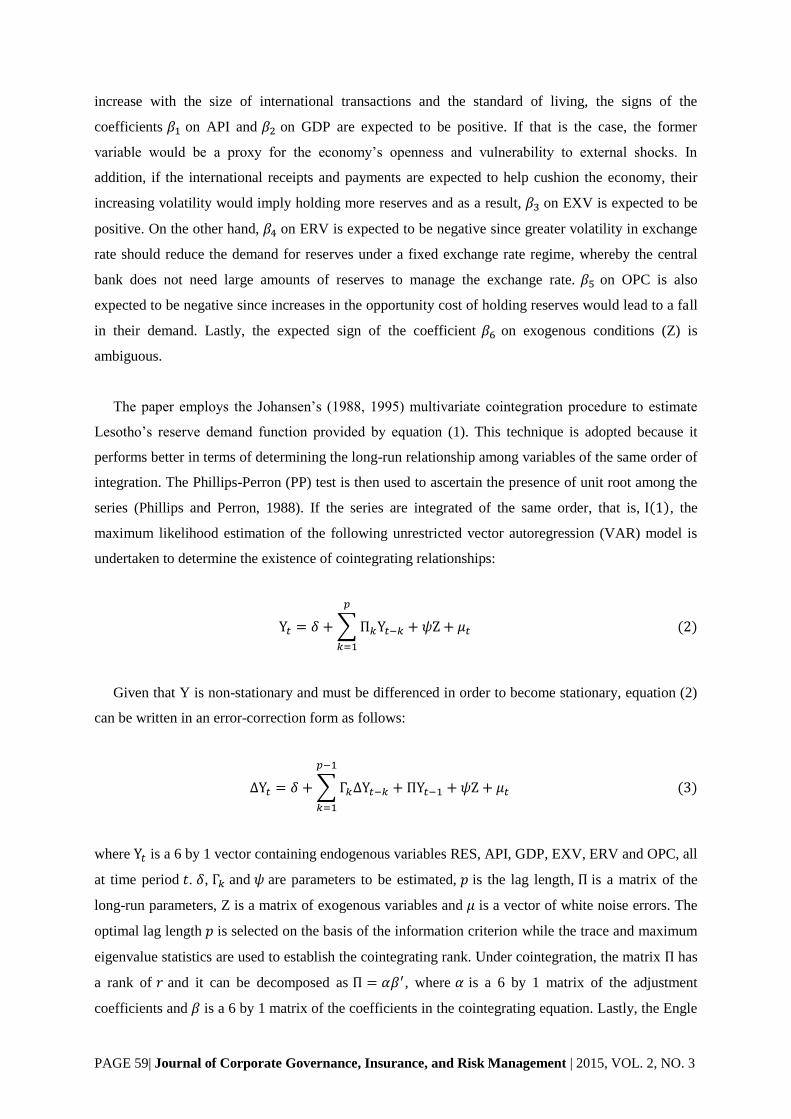
PAGE 59| Journal of Corporate Governance, Insurance, and Risk Management | 2015, VOL. 2, NO. 3
increase with the size of international transactions and the standard of living, the signs of the
coefficients on API and on GDP are expected to be positive. If that is the case, the former
variable would be a proxy for the economy’s openness and vulnerability to external shocks. In
addition, if the international receipts and payments are expected to help cushion the economy, their
increasing volatility would imply holding more reserves and as a result, on EXV is expected to be
positive. On the other hand, on ERV is expected to be negative since greater volatility in exchange
rate should reduce the demand for reserves under a fixed exchange rate regime, whereby the central
bank does not need large amounts of reserves to manage the exchange rate. on OPC is also
expected to be negative since increases in the opportunity cost of holding reserves would lead to a fall
in their demand. Lastly, the expected sign of the coefficient on exogenous conditions (Z) is
ambiguous.
The paper employs the Johansen’s (1988, 1995) multivariate cointegration procedure to estimate
Lesotho’s reserve demand function provided by equation (1). This technique is adopted because it
performs better in terms of determining the long-run relationship among variables of the same order of
integration. The Phillips-Perron (PP) test is then used to ascertain the presence of unit root among the
series (Phillips and Perron, 1988). If the series are integrated of the same order, that is, , the
maximum likelihood estimation of the following unrestricted vector autoregression (VAR) model is
undertaken to determine the existence of cointegrating relationships:
∑
Given that Y is non-stationary and must be differenced in order to become stationary, equation (2)
can be written in an error-correction form as follows:
∑
where is a 6 by 1 vector containing endogenous variables RES, API, GDP, EXV, ERV and OPC, all
at time period . , and are parameters to be estimated, is the lag length, is a matrix of the
long-run parameters, Z is a matrix of exogenous variables and is a vector of white noise errors. The
optimal lag length is selected on the basis of the information criterion while the trace and maximum
eigenvalue statistics are used to establish the cointegrating rank. Under cointegration, the matrix has
a rank of and it can be decomposed as , where is a 6 by 1 matrix of the adjustment
coefficients and is a 6 by 1 matrix of the coefficients in the cointegrating equation. Lastly, the Engle

PAGE 60| Journal of Corporate Governance, Insurance, and Risk Management | 2015, VOL. 2, NO. 3
and Granger (1987) causality test within the vector error-correction model (VECM) is applied to
examine the causal relationship between the endogenous variables included in the model.
4.2. Data and Unit Root Test Results
The study uses annual time-series data for the period 1981-2012, with all real variables in 2004
constant prices. The dataset on total imports and exports as well as economic growth (proxied by real
per capita GDP) is sourced from the Ministry of Finance (MOF) while that on international reserves,
Loti/US Dollar exchange rate and domestic interest rate (proxied by the 91-day Treasury bill rate) is
obtained from the Central Bank of Lesotho (CBL). The yield on foreign reserves is proxied by the
RSA discount rate and the data is obtained from the South African Reserve Bank (SARB). On the
other hand, the volatility of exports and exchange rate is calculated as the conditional variance of the
regression of the trend series of exports and exchange rate. The PP unit root test is then used to
determine the order of integration of the variables included in the model, with the optimal lag length
selected by the Schwarz information criterion (SIC). The null hypothesis states that the series is non-
stationary and failure to reject it indicates that there is a unit root. Table 2 reports the unit root test
results in both levels and first differences. On the basis of the p-values, all variables are found to be
integrated of order one at the 5% level of significance. This implies that a long-run and stable
relationship might exist between the level of international reserves and its determinants in Lesotho.
Table 2: Phillips-Perron (PP) unit root tests
Variable non-stationary in levels non-stationary in first differences
Test statistic p-value Test statistic p-value
RES -1.964 0.597 -3.909 0.024
API -0.753 0.382 -10.04 0.000
GDP -1.981 0.589 -7.354 0.000
EXV -2.386 0.154 -9.522 0.000
ERV -1.989 0.290 -5.441 0.000
OPC -1.454 0.543 -9.205 0.000
Note: All variables except OPC are in logarithmic form.
4.3. Cointegration Test Results
Given that the variables included in the reserve demand function are found to be integrated of the
same order, the Johansen multivariate cointegration method is then applied to determine the presence
of long-run cointegrating relationship among them. Table 3 presents the cointegration test results, with
the optimal lag length of 1 chosen by the SIC. The trace test results in part A of the table confirm the
existence of cointegration among the variables. Part B of the table provides the results for the

PAGE 61| Journal of Corporate Governance, Insurance, and Risk Management | 2015, VOL. 2, NO. 3
estimated parameters of the normalised cointegrating equation as well as their adjustment coefficients
from the restricted VECM. The Lagrange multiplier (LM), the White heteroskedasticity and the
Jarque-Bera diagnostic tests, given at the bottom of the table, indicate that the residuals are
approximately white noise, even at the 10% significance level.
Table 3: Cointegration test results
Part A: Johansen trace test for cointegration
Maximum rank Eigenvalue Trace statistic 0.05 critical value
0 0.823 135.16** 83.94
1 0.644 83.16** 60.06
2 0.569 52.20** 40.17
3 0.484 26.94** 24.28
4 0.208 7.08 12.32
Part B: Normailsed cointegrating coefficients
Variables RES API GDP EXV ERV OPC
-0.442**
(-4.241)
0.069
(1.284)
-
-
-
-
0.962*
(2.119)
-1.869
(-0.704)
1.000
-
-2.191**
(-3.347)
-1.178**
(-24.12)
-0.728**
(-6.665)
0.167*
(2.435)
0.043*
(1.880)
0.867 [0.648]
LM-statistic 327.02 [0.422]
Jarque-Bera statistic 13.24 [0.352]
White test statistic 408.78 [0.643]
Notes: t-statistics in parentheses and p-values in square brackets; ** and * denote significant at 5%
and 10% critical level, respectively.
Since the adjustment coefficients for economic growth and export volatility were highly
insignificant, the model was re-estimated with the restriction of weak exogeneity on these variables.
The p-value of the chi-square test statistic from table 3 justifies that both variables are weakly
exogenous (even at the 10% critical level) and hence, their behaviour is only be explained by the
short-run dynamics. On the other hand, the adjustment coefficient on international reserves has the
expected (negative) sign and it is statistically significant at the 5% level. Thus, about 44% of the
deviation from the equilibrium was corrected within one year. This relatively moderate magnitude of
the speed of adjustment could indicate a rather active reserve management of the CBL. The
cointegration results also show that all the long-run coefficients are significant and have the expected
signs as suggested by the theory. For example, the international reserves are found to be positively

PAGE 62| Journal of Corporate Governance, Insurance, and Risk Management | 2015, VOL. 2, NO. 3
related to average propensity to import, economic growth and export volatility while negatively
associated with exchange rate volatility and opportunity cost of holding reserves.
The positive relationship between foreign reserves and average propensity to import suggests that
the precautionary motive plays a significant role in determining Lesotho’s demand for holding
international reserves. This means that Lesotho holds reserves as buffer stock against external shocks
and that is why it accumulated reserves in times of abundance and depleted them in times of scarcity
(see figures 1 and 2). This is also plausible given the persistent current account deficit faced by the
country over the sample period. Furthermore, the positive coefficient on economic growth indicates
that Lesotho’s demand for foreign reserves is also driven by the standard of living while that on export
volatility points to the country’s dependence on international receipts and payments to help cushion
the economy. These findings are similar to that of Mishra and Sharma (2011) on India and Elhiraika
and Ndikumana (2007) on African countries, who concluded that the reserve demand policies of those
countries depend mainly on the level of international transactions and economic growth.
On the other hand, the uncertainty brought by the exchange rate volatility has a negative effect on
international reserves and this shows that the CBL does not need to hold large amounts of reserves to
manage the exchange rate since it operates under fixed exchange rate regime. Aizenman and Marion
(2003) also found a similar result that greater exchange-rate variability significantly reduces foreign
reserve holdings in developing countries. Lastly, the negative association between foreign reserves and
opportunity cost suggests that the long-run demand for reserves in Lesotho is also based on
profitability considerations. As a result, the CBL seems to resort to other alternative ways of using
international reserves (such as financing developmental projects) when their opportunity cost
increases. This finding therefore contradicts that of Elhiraika and Ndikumana (2007), who reported
that reserve accumulation in African countries (including Lesotho) is not motivated by returns.
4.4. Error-correction and Granger Causality Estimation Results
Along with other long-run determinants of Lesotho’s reserve demand, the study also focuses on the
role played by exogenous conditions such as the years of democracy (since 1993), the political
instability of 1998, the duration of the Phase I of the Lesotho Highlands Water Project (LHWP) (1986-
2002), the 2008 US financial crisis, the 1997 Asian financial crisis and the 1991 Indian economic
crisis. The estimated short-run dynamics of the VECM (provided in table 3) are given in table A1 in
the appendix. It is evident from those results that the years of democracy in Lesotho had a positive and
significant effect on reserves while initiation of the LHWP had a negative and significant impact. The
latter finding confirms that Lesotho sometimes uses part its international reserves to finance

PAGE 63| Journal of Corporate Governance, Insurance, and Risk Management | 2015, VOL. 2, NO. 3
government infrastructure projects. Other exogenous shocks, however, are found to be less important
in influencing Lesotho’s demand for foreign reserves.
Table 4: Granger causality test results
Variables
- 0.047 1.373 0.534 0.339 1.256
0.112 - 2.677 0.302 1.954 0.076
1.728 1.095 - 0.001 2.835* 0.068
0.112 7.946*** 0.093 - 0.873 2.845*
3.582* 1.149 0.264 0.477 - 0.918
0.749 1.756 0.214 4.423** 0.434 -
Notes: Wald statistics are reported; first row (column) presents the dependent (independent) variables;
***, ** and * denote significant at 1%, 5% and 10% critical level, respectively.
On the other hand, table 4 reports the Granger causality test results within the estimated VECM. It
is found that there exists unidirectional causality running from exchange-rate volatility to international
reserves, export volatility to average propensity to import, and economic growth to exchange-rate
volatility, whereas a bi-directional causality exists between opportunity costs and export volatility. The
former finding on exchange-rate volatility, together with its observed positive and significant
immediate effect on reserves (see table A1 in the appendix), indicates that when the uncertainty in
exchange-rate increases, the immediate response of the CBL is to increase foreign reserves. However,
given that the CBL does not need to hold large stockpiles of reserves to manage the peg, this
behaviour disappears in the long-run as shown by a negative and significant coefficient on exchange-
rate volatility from the cointegration results (reported in table 3).
5. CONCLUSION
The paper examines Lesotho’s demand for holding international reserves and assesses the country’s
reserve adequacy position over the period 1981-2012. The results from standard reserve adequacy
benchmarks reveal that Lesotho generally has sufficient stock of foreign reserves to satisfy the
minimum adequacy requirements, with the level of reserves in other periods being relatively higher
than what is required. Furthermore, the estimates of Lesotho’s reserve demand function from the
cointegration analysis suggest that the long-term reserve demand policies for Lesotho are positively
related to average propensity to import, economic growth and export volatility while negatively
associated with exchange rate volatility and opportunity cost of holding reserves. The former finding
confirms that the precautionary motive plays a significant role in determining Lesotho’s demand for
holding international reserves, while the latter indicates that reserve accumulation in Lesotho is based

PAGE 64| Journal of Corporate Governance, Insurance, and Risk Management | 2015, VOL. 2, NO. 3
on profitability considerations. The results also show that although the demand for foreign reserves
increased in the years of democracy, the country sometimes uses part its international reserves to
finance government infrastructure projects. However, the study modelled Lesotho’s demand for
international reserves in isolation from the money market, which can be incorporated in future
research since money disequilibrium could affect reserves in the short-run (see Badinger, 2004).
References
Aizenman, J. and Lee, J. (2007), “International reserves: precautionary versus mercantilist views,
theory and evidence”, Open Economies Review, Vol. 18 No. 2, pp. 191-214.
Aizenman, J. and Marion, N. (2003), “The high demand for international reserves in the Far East:
What is going on?” Journal of the Japanese and International Economics, Vol. 17 No. 3, pp. 370-
400.
Badinger, H. (2004), “Austria’s demand for international reserves and monetary disequilibrium: The
case of a small open economy with a fixed exchange rate regime”, Economica, Vol. 71 No. 281,
pp. 39-55.
Bird, G. and Rajan, R. (2003), “Too much of a good thing? The adequacy of international reserves in
the aftermath of crises”, The World Economy, Vol. 26 No. 6, pp. 873-891.
CBL (2012), Annual Report 2011, Central bank of Lesotho, Maseru, March.
Chan, S. S. (2007), “The basic framework for international reserves and its application to Macao”,
Monetary Research Bulletin No. 2, Monetary Authority of Macao, Macao, January.
Drummond, P. and Dhasmana, A. (2008), “Foreign reserve adequacy in Sub-Saharan Africa”,
Working Paper, International Monetary Fund, Washington, June.
Elhiraika, A. and Ndikumana, L. (2007), “Reserves accumulation in African countries: sources,
motivations, and effects”, Economics Department Working Paper Series, University of
Massachusetts, Amherst, December.
Engle, R.F. and Granger, C. W. J. (1987), “Cointegration and error correction: representation,
estimation, and testing”, Econometrica, Vol. 55 No. 2, pp. 251-276.
Fischer, S. (2001), “Opening remarks”, IMF/World Bank International Reserves: Policy Issues Forum,
Washington, 28 April.
Flood, R. and Marion, P. N. (2001), “Holding international reserves in an era of high capital mobility,”
Collins, S. M. and Rodrik, D., Brookings Trade Forum, Brookings Institution Press, Washington,
pp. 1-68.
IMF (2012), “Kingdom of Lesotho: poverty reduction strategy paper – national strategic development
plan”, Country Report No. 12/102, International Monetary Fund, Washington.
Johansen, S. (1988), “Statistical analysis of cointegration vectors”, Journal of Economic Dynamics
and Control, Vol. 12 No. 2-3, pp. 231-254.

PAGE 65| Journal of Corporate Governance, Insurance, and Risk Management | 2015, VOL. 2, NO. 3
Johansen, S. (1995), “Likelihood-based inference in cointegrated vector autoregressive models”,
Oxford University Press, Oxford.
Kaminsky, G. and Reinhart, C. (1999), “The twin crises: the causes of banking and balance-of-
payments problems”, American Economic Review, Vol. 89 No. 3, pp. 473-500.
Kenen, P. B. and Yudin, E. B. (1965), “The demand for international reserves”, The Review of
Economics and Statistics, Vol. 47 No. 3, pp. 242-250.
Masenyetse, R. F. and Motelle, S. I. (2012), “Government revenue-expenditure nexus in Lesotho: the
decline in SACU revenue”, American Journal of Economics, Vol. 2 No. 1, pp. 8-14.
Mishra, R. K. and Sharma, C. (2011), “India’s demand for international reserve and monetary
disequilibrium: reserve adequacy under floating regime”, Journal of Policy Modeling, Vol. 33 No.
6, 901-919.
Phillips, P. C. B. and Perron, P. (1988), “Testing for a unit root in time series regression”, Biometrika,
Vol. 75 No. 2, pp. 335-346.
Pina, G. (2011), “The recent growth of international reserves in developing economies: A monetary
perspective”, Job Market Paper, Universitat Pompeu Fabra, Barcelona, November.
Sula, O. (2011), “Demand for international reserves in developing nations: A quantile regression
approach”, Journal of International Money and Finance, Vol. 30 No. 5, 764-777.
Thamae, R. I. (2013), “The growth of government spending in Lesotho” Economic Analysis and
Policy, Vol. 43 No. 3, pp. 339-352.
Appendix
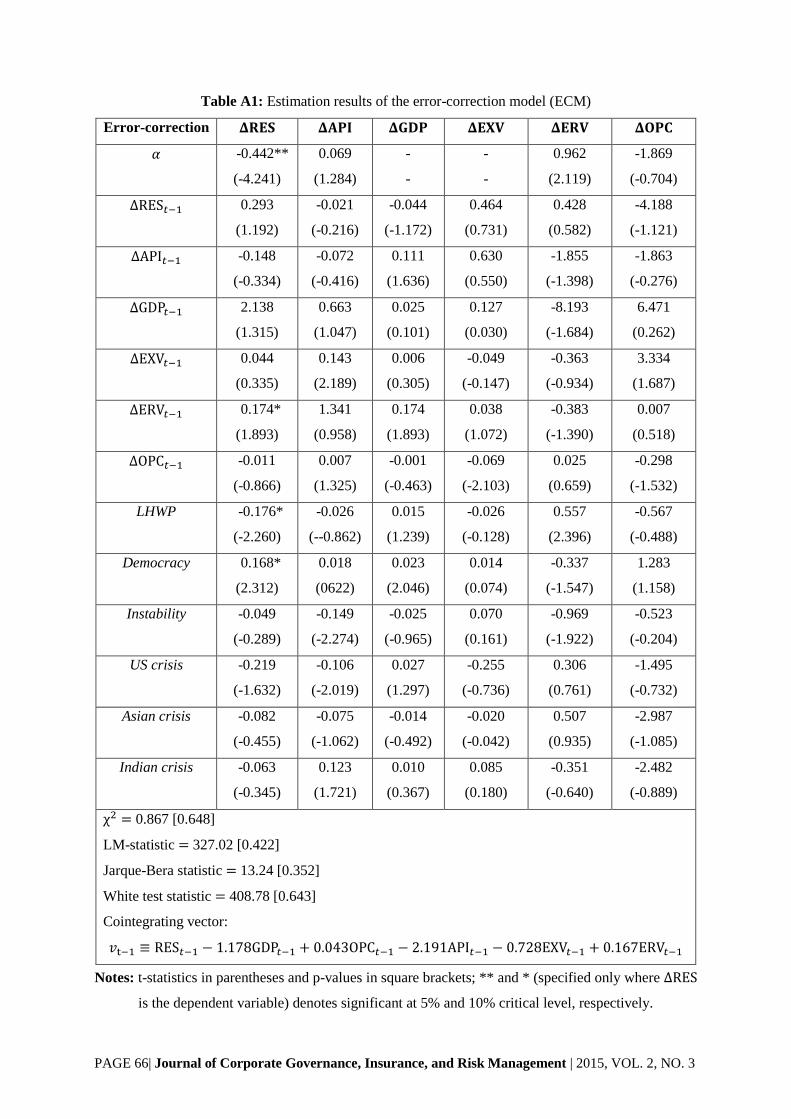
PAGE 66| Journal of Corporate Governance, Insurance, and Risk Management | 2015, VOL. 2, NO. 3
Table A1: Estimation results of the error-correction model (ECM)
Error-correction
-0.442**
(-4.241)
0.069
(1.284)
-
-
-
-
0.962
(2.119)
-1.869
(-0.704)
0.293
(1.192)
-0.021
(-0.216)
-0.044
(-1.172)
0.464
(0.731)
0.428
(0.582)
-4.188
(-1.121)
-0.148
(-0.334)
-0.072
(-0.416)
0.111
(1.636)
0.630
(0.550)
-1.855
(-1.398)
-1.863
(-0.276)
2.138
(1.315)
0.663
(1.047)
0.025
(0.101)
0.127
(0.030)
-8.193
(-1.684)
6.471
(0.262)
0.044
(0.335)
0.143
(2.189)
0.006
(0.305)
-0.049
(-0.147)
-0.363
(-0.934)
3.334
(1.687)
0.174*
(1.893)
1.341
(0.958)
0.174
(1.893)
0.038
(1.072)
-0.383
(-1.390)
0.007
(0.518)
-0.011
(-0.866)
0.007
(1.325)
-0.001
(-0.463)
-0.069
(-2.103)
0.025
(0.659)
-0.298
(-1.532)
LHWP -0.176*
(-2.260)
-0.026
(--0.862)
0.015
(1.239)
-0.026
(-0.128)
0.557
(2.396)
-0.567
(-0.488)
Democracy 0.168*
(2.312)
0.018
(0622)
0.023
(2.046)
0.014
(0.074)
-0.337
(-1.547)
1.283
(1.158)
Instability -0.049
(-0.289)
-0.149
(-2.274)
-0.025
(-0.965)
0.070
(0.161)
-0.969
(-1.922)
-0.523
(-0.204)
US crisis -0.219
(-1.632)
-0.106
(-2.019)
0.027
(1.297)
-0.255
(-0.736)
0.306
(0.761)
-1.495
(-0.732)
Asian crisis -0.082
(-0.455)
-0.075
(-1.062)
-0.014
(-0.492)
-0.020
(-0.042)
0.507
(0.935)
-2.987
(-1.085)
Indian crisis -0.063
(-0.345)
0.123
(1.721)
0.010
(0.367)
0.085
(0.180)
-0.351
(-0.640)
-2.482
(-0.889)
0.867 [0.648]
LM-statistic 327.02 [0.422]
Jarque-Bera statistic 13.24 [0.352]
White test statistic 408.78 [0.643]
Cointegrating vector:
Notes: t-statistics in parentheses and p-values in square brackets; ** and * (specified only where
is the dependent variable) denotes significant at 5% and 10% critical level, respectively.

Pages 67-79
PAGE 67| Journal of Corporate Governance, Insurance, and Risk Management | 2015, VOL. 2, NO. 3
Journal of Corporate Governance, Insurance, and Risk Management (JCGIRM)
2015, Volume 2, Series 3
An Analysis of Machine Effectiveness on the Production Line by
Using Overall Equipment Effectiveness (OEE) Method Based on
Total Productive Maintenance (TPM) Principle (A Study Case of
Ball Tea Machine in PT Kabepe Chakra)
Aysha Herdiwana,*
, Sri Widiyanestib
a Business Management of Telecommunication and Informatics, Faculty of Economics and Business, Telkom University,
Bandung, Indonesia b Business Management of Telecommunication and Informatics, Faculty of Economics and Business,, Telkom University,
Bandung, Indonesia
A B S T R A C T A R T I C L E I N F O
Total Productive Maintenance (TPM) is an approach in Preventive
Maintenance which can be used by a company to evaluate the
effectiveness of the company’s facility. This evaluation is conducted to
improve the facility value of Overall Equipment Effectiveness (OEE) and
to eliminate the main loss known as The Six Big Losses. TPM is a
maintenance approach focusing on the equipment which is suitable to be
implemented on the manufacture company and production industries. This
research is conducted on the Ball Tea machine in PT Kabepe Chakra
which is a production machine to dry tea. The calculation of OEE value is
conducted based on the data in January-December 2014, the calculation
results show that the OEE value is 59.30897433% and it is still under the
World Class standard. The calculation of Six Big Losses shows that the
percentage of the most dominant of machine losses is on the Set-Up and
Adjustment Loss which is 42.6768183%. The research results can be used
to show that the effectiveness of Tea Ball machine still has to be improved
by focusing on the most dominant loss elimination.
Keywords:
Preventive Maintenance, Total
Productive Maintenance, Overall
Equipment Effectiveness, The
Six Big Losses.
*Corresponding author:
(Aysha Herdiwan)
(Sri Widiyanesti)
Article history:
Article Submitted 14-04-2015
Article Accepted 20-06-2015
**Article previously published in
EJEM 2015, vol 2, No. 3
1. INTRODUCTION
Along with the development of technology, today’s production activity is more performed by using
production machines. Moreover, there have been some businessmen who prefer machines for
production (Rusadi, 2013). However, the performance of machine may not be always stable if it is
used continuously in a long term. The industry machine is an important part to smoothen the
production process; it is the reason why maintenance is so important (http://www.vibrasindo.com,
2015). One of the maintenance process methods which are developed to improve the productivity is
Total Productive Maintenance (TPM). The indicator of the success of TPM implementation is
determined by OEE (Overall Equipment Effectiveness) (http://shiftindonesia.com, 2012).
Overall Equipment Effectiveness (OEE) is the best practice metric which identifies the percentage
of production time which is really productive in planning (Vorne Industries, 2013). The OEE value of

PAGE 68| Journal of Corporate Governance, Insurance, and Risk Management | 2015, VOL. 2, NO. 3
100% is a perfect production. The OEE value of 85% is considered as the World Class standard
manufacture. The OEE value of 60% is a typical value for Manufacture Company. The OEE value of
40% is a low value but it is possessed by many manufacture companies. The OEE value can be easily
improved through simple stages of specification (OEE Industry Standard, 2014).
The usage of machine and equipment itself increasingly improves. The very potential markets for
domestic machine industry are food and beverage industry. Food and beverage industry in each year
always purchases the capital goods around 15-20% from its budget to fix the machine (Dharmawan,
2008). The percentage amount of machine repair budget usage shows the low value of machine
effectiveness so that there are still many spaces to repair the machine of food and beverage machine in
Indonesia.
One of food and beverage Industry Company in Indonesia, especially in West Java, tea production
company, PT. Kabepe Chakra. PT Kabepe Chakra uses the production machine technology in
processing the tea. The tea processing consists of several stations; every station processes the average
tea of 91.792,58 kg per month with the highest operational working hours which is in the drying
station using Ball Tea in which it reaches 24 hours per day where it will influence the effectiveness of
the machine (Kabepe Chakra, 2014). Thus, to maintain the performance and the effectiveness of the
machine, the suitable maintenance activity is necessary to be conducted in order to minimize all forms
of losses.
This research aims to find out the effectiveness level of Ball Tea machine used by the company and
the losses of the machine so that the company can focus on the most dominant loss elimination to
improve the OEE value.
2. THEORY AND HYPOTHESIS
2.1 Preventive Maintenance
Maintenance covers all activities related in maintaining the system equipment in order to keep
working. The preventive maintenance covers the routine inspection and maintenance and maintains
the facilities in a good condition. This activity is intended to build a system which will find the
potential failure and to make a change or repair which will prevent the failure. The emphasis on the
preventive maintenance is on the understanding of process and keeping it working without obstacles
(Heizer and Render, 2005).
2.2 Total Productive Maintenance
Total Productive Maintenance (TPM) is a productive maintenance performed by all employees
through a small group activity (Nakajima, 1988). The definition of TPM completely covers five those
elements (Nakajima, 1988):
1. TPM aims to maximize the effectiveness of the equipment (Overall Equipment Effectiveness).

PAGE 69| Journal of Corporate Governance, Insurance, and Risk Management | 2015, VOL. 2, NO. 3
2. TPM makes a detailed system to expand the life of the equipment.
3. TPM is implemented by various departments (machine, operation, maintenance).
4. TPM involves each employee, from the highest management until the lowest level of
employee.
5. TPM is based on the promotion from PM through the motivation management: autonomous small group
activities.
2.3 Overall Equipment Effectiveness
TPM has a measuring tool to consider important points within it, namely Overall Equipment
Effectiveness (OEE). OEE is a result from availability, performance, and quality (Borris, 2006). The
formula of OEE calculation value is:
(1)
Availability Rate is a ration from the amount of time which can be used by the machine to produce
a qualified product divided by the total of time in which the machine works. The mathematic formula
of availability is:
(2)
Performance Efficiency or performance of equipment can be meant as the ratio from the amount of
products divided by the amount of the products which should be produced (Borris, 2006). The formula
of Performance Efficiency is:
(3)
Rate of Quality. The meaning of product quality is a ratio from the amount of the products which
can be accepted divided by the overall amount of the products which are made (including the products
that failed). The formula of Quality Product is:
(4)
OEE Industry Standard is a recognized world class target where each factor of OEE has
different values. It is shown in following table (Vorne Industries, 2008):
Table 1: OEE Industry Standard
OEE Factor World Class
Availability 90.0%
Performance 95.0%

PAGE 70| Journal of Corporate Governance, Insurance, and Risk Management | 2015, VOL. 2, NO. 3
Quality 99.0%
OEE 85.0%
The world class OEE standard forms some hypothesis:
Hypothesis 1. The Availability level of Ball Tea machine used by Chakra Group Company in
2014 met the world class standard which is ≥ 90%.
Hypothesis 2. The Performance Efficiency of Ball Tea machine used by Chakra Group
Company in 2014 met the world class standard which is ≥ 95%.
Hypothesis 3. The Rate of Quality Product of Ball Tea machine used by Chakra Group
Company in 2014 met the world class standard which is ≥ 99%.
Hypothesis 4. The Overall Equipment Effectiveness of Ball Tea machine used by Chakra
Group Company in 2014 met the world class standard which is ≥ 85%.
2.4 The Six Big Losses
Facilities suffer losses from things which prevent them to effectively operate and from problems
caused by the errors and operational problems. TPM seeks to eliminate The Six Big Losses which
become the main obstacles against the effectiveness of equipment to reach OEE (Nakajima, 1988).
Steps of losses calculation refer to previous research (Hasriyono, 2009).
1. Equipment Failure: breakdown
×100 (5)
2. Setup and adjustment: Retooling of the dead machine
(6)
3. Idling and minor stoppages: The abnormal operation from censor, the obstruction of the
machine works, etc.
(7)

PAGE 71| Journal of Corporate Governance, Insurance, and Risk Management | 2015, VOL. 2, NO. 3
4. Reduced speed The difference between the recoroded speed of equipment and the actual
speed.
(8)
5. Defect in Process: The bad record and quality which have to be improved.
(9)
6. Reduced Yield: The needed time from start-up the machine until the stable production
process.
(10)
3. METHODOLOGY
The type of the research is basic research. Basic research is general knowledge as a tool to solve
the practical problem although it does not give the thorough answer for each problem, (Nazir, 2005).
This research is a research which uses a mixed method based on the type of the data and its
processing. The mix method research is an approach of research which combines or associates the
qualitative and quantitative forms (Creswell, 2010). The qualitative approach of this research is used
when the primary data are being collected from the interview to find an idea from the problems that
may occur on the machine that can cause a loss in the production process. The interview is conducted
against three resources (source triangulation) in order that the obtained data are valid. The resources
are selected based on the consideration of their knowledge of machine; production, machine technician
and general affairs. The quantitative approach of this research is used when the secondary data are
being processed to calculate the value of Overall Equipment Effectiveness and the identification of
losses. The needed secondary data are Loading Time, Down Time, Planned Downtime, Number of
Defect (reduced yield/reject and rework component, Output, Theoretical Cycle Time, and Actual
Cycle Time. The used secondary data are the data of Ball Tea machine in 2014. This machine is
selected based on the level of influence of the machine against the product quality, machine usage
frequency, and the damage frequency.
The technique of data analysis which is firstly used is Fishbone Diagram. Fishbone Diagram of his
research is used to process the interview results regarding the condition and the performance of the
machine to dig and learn the cause of the problem which may cause losses against the machine. The
Fishbone Diagram technique refers to the previous research (Hasriyono, 2009; Rinawati and Dewi,

PAGE 72| Journal of Corporate Governance, Insurance, and Risk Management | 2015, VOL. 2, NO. 3
2014). The causes are usually divided into the main cause from methods, material, measurement,
people, equipment, and environment (Besterfield et al., 2003).
The further analysis is conducted by calculating the percentage of OEE by multiplying the three
constituent factors of OEE namely availability, performance, and quality based on each formula.
The calculation results are then compared to the attainment with world class OEE standard. The
calculation of OEE value has been conducted on some previous research (Afefy,2013; Almeanazel,
2010; Hasriyono, 2009; Rinawati and Dewi, 2014).
The further analysis is by calculating the six big losses with each formula based on the theory of
The Six Big Losses. Sorting the percentage of the greatest or the most dominant losses is depicted
through the Pareto diagram so that the causes can be analysed and the repair can be focused on the
losses. The usage of Pareto diagram is for sorting the percentage of the losses, based on the research
(Hasriyono, 2009; Rinawati and Dewi, 2014).
4. RESULTS
4.1 Descriptive Data
The early used data are the results from interviews with some related parties, they are the
production department, the machine technician, and the general Affairs. The interview results data are
then processed by using Fishbone diagram so that the link of the problem becomes clear.
The Fishbone diagram on the picture 1 shows that the root cause of the low value of OEE on the
Ball Tea machine can be identified into four categories: Material/Spare part, Machine, People, and
Method. The problems of Material/Spare part factor are that the spare part suffers the damage because
of the worn-out, the spare part is not original, the spare part is sometimes not available in the company
storage, and the hard tea raw materials can damage the machine.
The problems of machine factor are that the machine has the highest working hours so that it needs
a special treatment, then, the machine has a high delay time so that the existing working hours
becomes less, the technical problems often occurs on the machine where the machine often suffers the
breakdown.
The problems of the people are that the machine operators are still lack of awareness about the
importance of machine inspection, the operator does not check and report to the technician when there
are peculiarities on the machine. The machine operators are also still lack of knowledge, when the
machine suffers the congestion, they tamper the machine without a clear understanding and procedure.
The problems of the processing method are the screening of raw materials with Roll causes a very
strong vibration so that the Roll will be loose sooner or later and its performance decreases, the
machine is also set in a very high temperature to dry the tea leaves so if it is not treated well, the
machine will be easily broken.
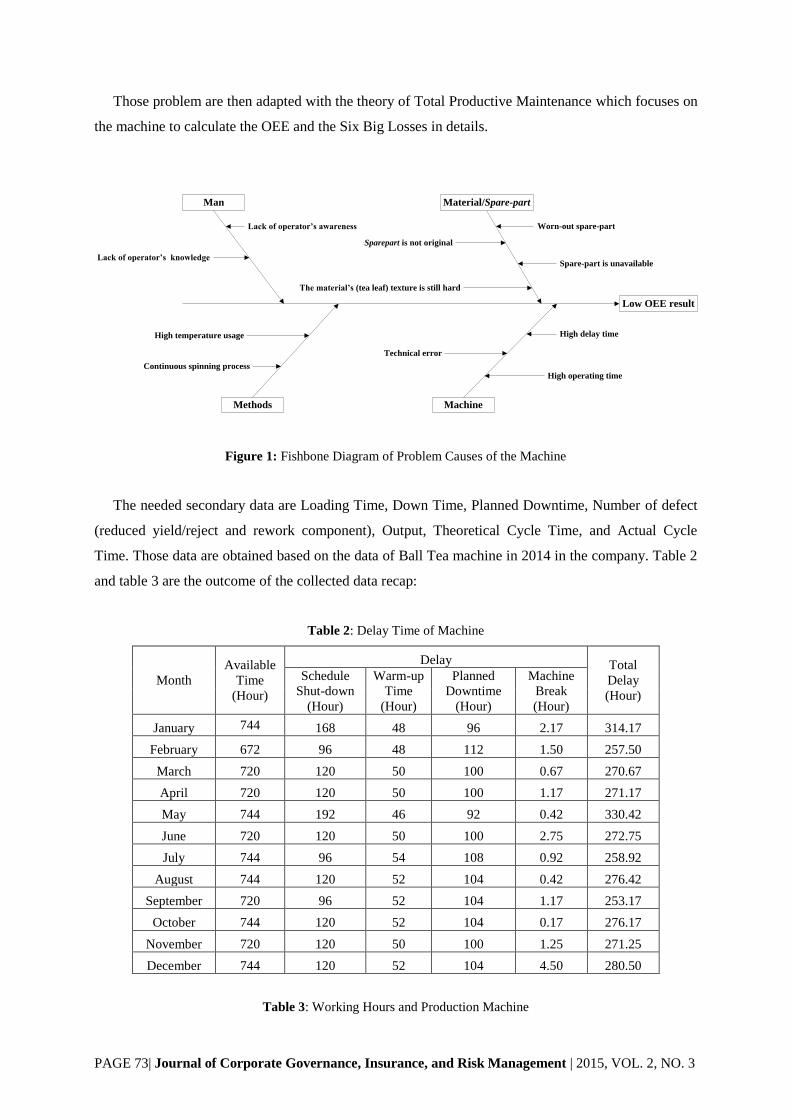
PAGE 73| Journal of Corporate Governance, Insurance, and Risk Management | 2015, VOL. 2, NO. 3
Those problem are then adapted with the theory of Total Productive Maintenance which focuses on
the machine to calculate the OEE and the Six Big Losses in details.
Figure 1: Fishbone Diagram of Problem Causes of the Machine
The needed secondary data are Loading Time, Down Time, Planned Downtime, Number of defect
(reduced yield/reject and rework component), Output, Theoretical Cycle Time, and Actual Cycle
Time. Those data are obtained based on the data of Ball Tea machine in 2014 in the company. Table 2
and table 3 are the outcome of the collected data recap:
Table 2: Delay Time of Machine
Month
Available
Time
(Hour)
Delay Total
Delay
(Hour)
Schedule
Shut-down
(Hour)
Warm-up
Time
(Hour)
Planned
Downtime
(Hour)
Machine
Break
(Hour)
January 744 168 48 96 2.17 314.17
February 672 96 48 112 1.50 257.50
March 720 120 50 100 0.67 270.67
April 720 120 50 100 1.17 271.17
May 744 192 46 92 0.42 330.42
June 720 120 50 100 2.75 272.75
July 744 96 54 108 0.92 258.92
August 744 120 52 104 0.42 276.42
September 720 96 52 104 1.17 253.17
October 744 120 52 104 0.17 276.17
November 720 120 50 100 1.25 271.25
December 744 120 52 104 4.50 280.50
Table 3: Working Hours and Production Machine
Low OEE result
Man
Methods
Material/Spare-part
Machine
Worn-out spare-part
Sparepart is not original
Lack of operator’s awareness
Lack of operator’s knowledge
High delay time
High operating time
Spare-part is unavailable
The material’s (tea leaf) texture is still hard
Continuous spinning process
High temperature usage
Technical error

PAGE 74| Journal of Corporate Governance, Insurance, and Risk Management | 2015, VOL. 2, NO. 3
Month
Item
Loading
Time
(Hour)
Down
Time
(Hour)
Total
Production
(kg)
Good
Product
(kg)
Number Of
Defect (kg)
Theoritical
Cycle Time
(hour/kg)
Actual Cycle
Time
(hour/kg)
January 648 218.17 86,581 85,800 781 0.004323842 0.007484321
February 560 145.5 81,209 79,100 2,109 0.004253391 0.006895787
March 620 170.67 102,946 101,399 1,547 0.003758508 0.006022575
April 620 171.17 107,563 106,600 963 0.003593144 0.005764064
May 652 238.42 101,010 100,500 510 0.003588162 0.006454806
June 620 172.75 101,528 90,800 10,728 0.003793354 0.00610669
July 636 150.92 78,151 77,599 552 0.005305954 0.008138092
August 640 172.42 68,435 66,900 1,535 0.005877414 0.00935194
September 616 149.17 85,762 85,300 462 0.004657027 0.007182668
October 640 172.17 58,374 57,738 636 0.006894028 0.010963785
November 620 171.25 101,357 99,563 1,794 0.003812477 0.006116992
December 640 176.5 128,595 126,901 1,694 0.003100488 0.004976865
4.2 Calculation Results
The analysis of the machine effectiveness is conducted with a calculation by using OEE formula as
well as the losses of the machine which cause the low value of OEE. The calculation of OEE and the
losses of the machine are as elaborated as following:
1. The calculation of Availability, Performance, Quality, and OEE.
Availability Ratio is calculated to find out how much the ratio of the amount of the
time which can be used by the machine to produce products with the total of the time when the
machine works. To calculate the Availability Ration, it needs the data of Loading Time which
has been found out previously and the data of Operation Time.
Performance Efficiency is the performance of the machine which is showed by the
ratio of the products made by the amount of products which should be produced in a cycle.
The calculation of Performance Efficiency uses the data of Good Product Ideal Cycle Time,
and Operation Time of Ball Tea machine.
Rate of Quality Product is calculated to find out the level of product quality which is
produced by the machine. The calculation of Rate of Quality Product uses the data of Good
Product and Total Broke which have been known.
Overall Equipment Effectiveness shows the overall effectiveness value of machine
based on the factors of Availability, Performance Efficiency, and Rate of Quality which have
been obtained.
The calculation results of OEE and the three factors are presented in table 4:

PAGE 75| Journal of Corporate Governance, Insurance, and Risk Management | 2015, VOL. 2, NO. 3
Table 4: The Calculation Results of Availability, Performance, Quality, and OEE
2. The Calculation of The Six Big Losses
Based on the principle of TPM, the losses of the machine are classified into six types
which are called The Six Big Losses. Those Losses are: Equipment Failure Loss, Set-up and
Adjustment Loss, Idling and Minor Stoppage, Reduced Speed, Yield/Scrap Loss, and Rework
(Davis,1995). On the Ball Tea machine which is used by PT Kabepe Chakra to dry the tea, the
losses have been identified in accordance with the theory of The Six Big Losses.
Table 5: The Calculation Results of the Six Big Losses
No Six Big Losses Total Time Loss
(Hour)
Percentage
(%)
Cumulative Percentage
(%)
1 Set up and Adjustment 2,092 42.67681828 42.6768183
2 Idling and Minor
Stoppage 1,845.11
37.64026012 80.3170784
3 Reduced Speed Loss 853.013013 17.40147292 97.7185513
4 Scrap/Yield Loss 94.72567189 1.932404534 99.6509559
5 Equipment Failure Loss 17.11 0.349044149 100
6 Rework Loss 0 0 100
Total 4,902
5. DISCUSSION
Month Availability
(%)
Performance
Efficiency (%)
Rate Of Quality
Product (%) OEE (%)
January 66.3317901 86.3098526 99.08974359 56.72974056
February 74.0178571 81.1684437 97.33375474 58.47728541
March 72.4725807 84.81716947 98.47434393 60.5313831
April 72.3919355 85.33948307 99.09662289 61.22080705
May 63.4325153 87.19239741 99.49253731 55.02766172
June 72.1370968 77.01207446 88.18502203 48.99054936
July 76.2704403 84.88017506 99.28865063 64.27796641
August 73.059375 84.09234144 97.70553064 60.02767816
September 75.7840909 85.09401146 99.45838218 64.138446
October 73.0984375 85.08376934 98.89847241 61.5098119
November 72.3790323 84.58643272 98.19812581 60.11968285
December 72.421875 84.88780454 98.66510114 60.65667939
Average 71.98308554 84.20532961 97.82385727 59.30897433

PAGE 76| Journal of Corporate Governance, Insurance, and Risk Management | 2015, VOL. 2, NO. 3
5.1 Overall Equipment Effectiveness
The calculation results show that the value of Availability is only around 63.43251534% until
76.27044025%, the average of the level of available machine (availability) in 2014 is 71.98308554%
which is still under the world class standard which is 90%. The Performance Efficiency value is
around 77.01207446% until 87.19239741%, the average of the level of performance efficiency in
2014 is 84.20532961%, and this value is still under the world class standard which is 95%. The
Quality value of the machine is around 88.18502203% until 99.49253731%, although in January,
April, May, and September, the value of machine Quality has met the world class standard which is
over 99%, however, when it is averaged in a year, the value of Quality becomes 97.82385727% that
has not met the standard by 99%. The combination of those three factors produces an average value of
OEE which is 59.30897433%. This value has not met the world class standard of 85% and it still
needs to improve, however, according to Vorne Industries (2013), the OEE value has been good
enough for the standard of industry since the average of industrial machine commonly still produces
the OEE value of 35% until 45%.
The compliance of OEE value criteria on the Ball Tea machine in 2014 at PT Kabepe Chakra has
been obtained based on the calculation is as following:
Table 6:The Comparison of OEE Value
OEE Factors
Results
World Class
Meet or does not meet
the standard
Availability 71.98308554% 90% Does not
Performance Efficiency 84.20532961% 95% Does not
Rate Of Quality 97.82385727% 99% Does not
OEE 59.30897433% 85% Does not
The OEE value and those three factors are in table 5, thus, the conformity with the proposed
hypothesis are:
Hypothesis 1 that is “the level of Availability of Ball Tea machine which is used by Chakra
Group Company in 2014 met the world class standard which is ≥ 90%” is rejected.
Hypothesis 2 that is “the level of Performance Efficiency of Ball Tea machine which is used by
Chakra Group Company in 2014 met the world class standard which is ≥ 95%” is rejected.
Hypothesis 3 that is “the level of Rate of Quality Product if Ball Tea machine which is used by
Chakra Group Company in 2014 met the world class standard which is ≥ 99%” is rejected.
Hypothesis 4 that is “the level of Overall Equipment Effectiveness of Ball Tea machine which is
used by Chakra Group Company in 2014 met the world class standard which is ≥ 85%” is
rejected.
5.2 The Six Big Losses
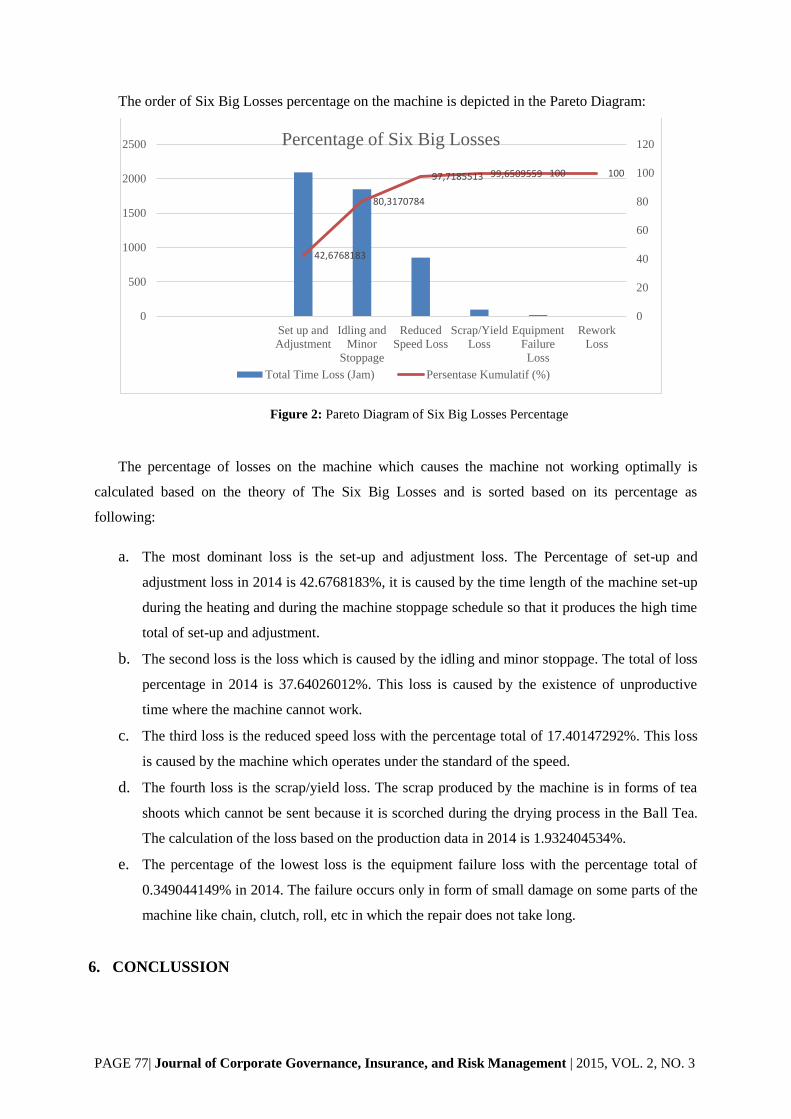
PAGE 77| Journal of Corporate Governance, Insurance, and Risk Management | 2015, VOL. 2, NO. 3
The order of Six Big Losses percentage on the machine is depicted in the Pareto Diagram:
Figure 2: Pareto Diagram of Six Big Losses Percentage
The percentage of losses on the machine which causes the machine not working optimally is
calculated based on the theory of The Six Big Losses and is sorted based on its percentage as
following:
a. The most dominant loss is the set-up and adjustment loss. The Percentage of set-up and
adjustment loss in 2014 is 42.6768183%, it is caused by the time length of the machine set-up
during the heating and during the machine stoppage schedule so that it produces the high time
total of set-up and adjustment.
b. The second loss is the loss which is caused by the idling and minor stoppage. The total of loss
percentage in 2014 is 37.64026012%. This loss is caused by the existence of unproductive
time where the machine cannot work.
c. The third loss is the reduced speed loss with the percentage total of 17.40147292%. This loss
is caused by the machine which operates under the standard of the speed.
d. The fourth loss is the scrap/yield loss. The scrap produced by the machine is in forms of tea
shoots which cannot be sent because it is scorched during the drying process in the Ball Tea.
The calculation of the loss based on the production data in 2014 is 1.932404534%.
e. The percentage of the lowest loss is the equipment failure loss with the percentage total of
0.349044149% in 2014. The failure occurs only in form of small damage on some parts of the
machine like chain, clutch, roll, etc in which the repair does not take long.
6. CONCLUSSION
42,6768183
80,3170784
97,7185513 99,6509559 100 100
0
20
40
60
80
100
120
0
500
1000
1500
2000
2500
Set up and
Adjustment
Idling and
Minor
Stoppage
Reduced
Speed Loss
Scrap/Yield
Loss
Equipment
Failure
Loss
Rework
Loss
Percentage of Six Big Losses
Total Time Loss (Jam) Persentase Kumulatif (%)

PAGE 78| Journal of Corporate Governance, Insurance, and Risk Management | 2015, VOL. 2, NO. 3
The average of the effectiveness level of Ball Tea machine in January-December 2014 is
59.30897433%, this average of the effectiveness level of Ball Tea machine is still under the world
class standard which is 85%. The effectiveness of Ball Tea machine which does not meet the standard
is caused by those three factors, they are availability, performance, and quality by which each of them
does not meet the world class standard. It shows that the Ball Tea machine has the total of loss which
is 40.69102567% which means that there are still many things which have to be improved in order that
the performance is getting better. It is in accordance with the aim of TPM that is to improve OEE by
eliminating the loss suffered by the machine.
The identification of the loss on the Ball Tea machine in 2014 is Set-up and Adjustment
(42.67681828%), Idling and Minor Stoppage (37.64026012%), Reduced Speed (17.40147292%),
Scrap/Reduced Yield (1.932404534%), and Equipment Failure Loss (0.349044149%). Those losses
are caused by the amount of delay time and defect product. The Six Big Losses which are not
identified is re-work loss. The company can improve the OEE value by focusing on the most dominant
loss elimination which is on the Set-Up and Adjustment. The management of maintenance which can
be applied to reduce the loss in the machine based on the TPM principle is education and training, the
autonomous maintenance principle, planned maintenance, and focused improvement.
REFERENCES
Afefy, I. H. (2013), ''Implementation of Total Productive Maintenance and Overall Equipment
Effectiveness Evaluation'',International Journal of Mechanical & Mechatronics Engineering, 13
(1), 69-75
Almeanazel, O. T. R. (2010), ''Total Productive Maintenance Review and Overall Equipment
Effectiveness Measurement'', Jordan Journal of Mechanical and Industrial Engineering, 4 (4),
517-522.
Besterfield, D. H, et al. (2003), Total Quality Management, Pearson Education, New Jersey
Borris, S. (2006),Total Productive Maintenance, McGraw-Hill, United States of America
Creswell, J. W. (2010), Research Design : Pendekatan Kualitatif, Kuantitatif, dan Mixed.Pustaka
Pelajar, Yogyakarta
Davis, R. K. (1995), Productivity Improvements Through TPM, Prentice Hall, United Kingdom
Dharmawan, T. (2008),''Pakai Mesin Lokal Dapat Insentif'', available at:
http://bisniskeuangan.kompas.com/read/2008/12/03/19554088/Pakai.Mesin.Lokal.Dapat.Insentif
(accesed 17 Maret 2015)
Hasriyono, M. (2009). “Evaluasi Efektivitas Mesin Dengan Penerapan Total Productive Maintenance
(TPM) di PT Hadi Baru”, Tugas Akhir Sarjana pada Fakultas Teknik Universitas
Sumatera Utara.
Heizer, J and Barry, R. (2005), Manajemen Operasi (edisi 7), Salemba Empat, Jakarta

PAGE 79| Journal of Corporate Governance, Insurance, and Risk Management | 2015, VOL. 2, NO. 3
Kabepe Chakra, (2014), “About Us”, available at:
http://www.chakratea.com/index.php?option=com_content&view=article&id=1&Itemid=3(acce
sed 29 November 2014)
Nakajima, S. (1988),Introduction to TPM Total Productive Maintenance, Productivity Press,
Cambridge.
Nazir, M. (2005), Metode Penelitian. Ghalia Indonesia, Bogor
OEE Industry Standard (2014), “OEE – Overall Equipment Effectiveness: The OEE Industry
Standard”, available at:http://oeeindustrystandard.oeefoundation.org/, (accessed 29 November
2014)
Rinawati, D.I dan Nadia C. D. (2014), ''Analisis Penerapan Total Productive Maintenance (TPM)
Menggunakan Overall Equipment Effectiveness (OEE) dan Six Big Losses Pada Mesin Cavitec
di PT. Essentra Surabaya'', Jurnal Penelitian pada Fakultas Teknik Universitas Diponegoro, 978-
602-1180-04-4, 21-26.
Rusadi, I. (2013), “Upah Buruh Naik, Pengusaha Beralih ke Mesin Hindari Kerugian”, available at:
http://www.merdeka.com/uang/upah-buruh-naik-pengusaha-beralih-ke-mesin-hindari-
kerugian.html,(accessed 30 Oktober 2014)
Shift Indonesia (2012),“Mengenal Total Productive Maintenance (TPM) Sebagai Metode Perbaikan
Praktis”available at: http://shiftindonesia.com/lean-manufacturingmengenal-total-productive-
maintenance-tpm-sebagai-metode-perbaikan-praktis/, (accessed 29 November 2014)
Vibrasindo (2015),“Manajemen Pemeliharaan Mesin Pabrik”, available at:
http://www.vibrasindo.com/blogvibrasi/detail/26/manajemen-pemeliharaan-mesin-pabrik ,
(accessed 17 Maret 2015)
Vorne Industries (2008), The Fast Guide to OEE. United State of America: Vorne Industries.
Vorne Industries (2013)“Overall Equipment Effectiveness”, available
at:http://www.leanproduction.com/oee.html, (accessed 29 November 2014)
Pages 80-90
PAGE 80| Journal of Corporate Governance, Insurance, and Risk Management | 2015, VOL. 2, NO. 3
Journal of Corporate Governance, Insurance, and Risk Management (JCGIRM)
2015, Volume 2, Series 3
Analysis of Desktop Browser Positioning Based on Users
Perception in Indonesia
Osa Omar Sharifa, Zaenal Ali Alatas
b, Dini Turipanam Alamanda
c, Arif Partono Prasetio
d
a, c, d Lecturer of Economics and Business Faculty, Telkom University b Management Program Study, Faculty of Economics and Business, Telkom University
A B S T R A C T A R T I C L E I N F O
The increasing of internet users affecting the choice of browsers and for
now, desktop users still dominate the usage. The research’s goal is to
analyze the well-known browser such as Mozilla Firefox, Google Chrome,
Internet Explorer, Opera, and Safari from the Indonesian customer point of
view. The variables used in the analysis are the speed to display HTML,
the speed of executing ECMA Script, the browser security, the need of
hardware resource, and the general feature of each browser. We distribute
questionnaire to 400 users of the five browsers in Indonesia. The
multivariate statistics of multidimensional scaling used to process the data.
The research found that Mozilla Firefox is the best browser on speed
criteria when displaying the HTML and general feature, as the Google
Chrome win the heart of Indonesian users on the speed criteria when
executing ECMA Script. As usual, the Apple Safari excels on the security
and the hardware resources consumption (KHR1). The Internet Explorer
considered the best on the hardware resources consumption criteria.
Keywords:
Desktop Browsers, Positioning,
Perceptual Map,
Multidimensional Scaling
*Corresponding author:
(Osa Omar Sharif)
Article history:
Article Submitted 14-04-2015
Article Accepted 20-06-2015
**Article previously published in
EJEM 2015, vol 2, No. 3
1. INTRODUCTION
The increasing internet users especially in Asia had form an internet culture. The Asian has huge
population which reach 3,9 billion people and 44.8% of them already using internet (Worldstats,
2013). The dawn of the internet drive the growth of the website which provide enormous information,
then followed by the development of the browsing application to enhance the experience of surfing the
internet. The application called web browser or just simply browser. In business terms, browsing is a
store leisure activity whose motives are mainly recreational (Lombart, 2004). Kim and Kim (2008)
stated that if consumers having high shopping enjoyment, they are more likely to be browsers. The
internet and the countless thousands of website provide information for the user. In fact people now
accustom to find the information from the internet. This development is supported by the browsers
which act as the gateway to the information. Browsers, now is not just an application to open the
websites but also function as the hub for the internet users. This affects the emergences of various
browser applications. The developers try to offer the browsers which provide easier access, ease of
use, better navigation and the appearance.
Browser can be accessed from several gadgets. Besides the old ways using the desktop computer,
now user can use their browser from notebook, phone, or tablet. They become more mobile. The
PAGE 81| Journal of Corporate Governance, Insurance, and Risk Management | 2015, VOL. 2, NO. 3
figure from Net Application find that the majority of the user using the browser from the desktop
which reach 88%. Compare to the smartphone and other mobile browsing which consist of 11.4%.
This clearly prove that the desktop is still become the choice for the internet users.
In 1995, Microsoft released Internet Explorer which then become pioneer in the browser wars. At the
end, Microsoft win the market and the closest rival, Netscape try to made their browser as open-source
with the new name, Mozilla on 1998. In the mid 90’s, the Opera shown up as the new browser
(Grosskurth and Godfrey, 2011).
There are five web browsers which very well known by the users. top five in The most widely used
is the Google Chrome which represent 34,88% of users. The next in line is the Internet Explorer (IE)
with 32% users, Mozilla Firefox with 22,47% users, Safari with 7,54% users, and Opera with 1,49%
users. The other browser represent only 1,62% users. Those ranking based on the Statcounter (2013)
which measure the web popularity by the hits from each browsers. From the same sources, the internet
users in Indonesia on 2013 show the differences of the browsers popularity. The first choice is the
Mozilla Firefox with 63,5% users, followed by Google Chrome with 26,95% users. The Microsoft
Internet Explorer (IE) on the third place with 3,02% users, next is Safari with 2,49% users, and Opera
placed fifth with 2,08% users, while other browser consist only 1,96% users.
Hawkins et al. (2000) investigate the awareness of the Internet security in various industries
ranging from the public and private sectors. Pentina et al. (2011) confirmed that browser satisfaction
have a mediating role to increase sales and traffic for online business. Further research by Iwata et al.
(2010) examined the children-oriented web browser, which ultimate aims is to keep children’s interest
on pages and help them to easily understand the contents of the pages. Other research regarding
browsing experience conducted by Nsairi (2012) whose analyzed the browsing experience in retail
stores through perceived value. To expand the discussion about the browser management, we analyzed
the Indonesia customer perception based on the browser superiority. This research analyzed the
browser positioning using different method compare to Statcounter (2013). At the end, we also
compare each browsers superiority using the perceptual mapping method.
2. LITERATURE REVIEW
2.1 Brand Positioning
The word ‘Positioning’ is related with the activities to shape or influence the preferences of
consumers. In the end this effort aimed to ahieve high consumer loyalty, consumer-derived brand
equity, and customer willingness to search for the certain brand (Keller, 2003; Schiffman and Kanuk,
2010). The brand positioning relatively similar to the brand image construct, which is defined as “the
concept of a brand that is held by the consumer. This concept inside the customer mind is largely a
subjective and perceptual phenomenon that is formed through consumer experience and interpretation,
whether reasoned or emotional” (Dobni and Zinkhan, 1990).

PAGE 82| Journal of Corporate Governance, Insurance, and Risk Management | 2015, VOL. 2, NO. 3
In Kotler’s theory, segmentation, targeting and positioning is described as a sequential process
(Laforet, 2010). Kotler and Keller (2012) define brand positioning as the “act of designing a
company’s offering and image to occupy a distinctive place in the minds of the target market. This
mean that the company deliberately create the image of their product, then they make effort to implant
this image into the customer mind. They want their customer feel, think their product is the ultimate
solution for their certain problems. Peter & Olson (2008) discussed several categories of brand
positioning:
(1) product attributes (consumers seek benefit from product features such as quality and price);
(2) uses or applications of the product;
(3) product user (such as based on consumer lifestyles);
(4) product class (a product could be substituted); and
(5) competitors such as position to be a market leader.
Fill (1999) states that the successful positioning can only be achieved by adopting a customer’s
perspective and by understanding how customers perceive products in the class, and how they attach
importance to particular attributes that can be grouped under a construct (Sweeney & Soutar, 2001).
The end result of the positioning is the creation of a customer-focused value proposition. As we all
know, the value proposition become the strong reason why the target market should buy the product”
(Kotler, 2003, p. 308).
2.2 Consumer Attitude and Perception
There are several definition regarding the “Attitude.” One of them came from Schiffman and
Kanuk (2010). They regard attitude as a learned predisposition to behave in a consistently favorable or
unfavorable manner with respect to a given object.” Solomon et al. (2002) argue that attitudes exist
simply because of the fact that they perform a particular function to a person; this means that they are
determined by motives of an individual. Individuals with good feelings may have favorable ad
attitudes (Edell and Burke, 1987). In fact, consumer attitude itself is becoming one subset of feelings,
and the traditional marketing paradigm with the optimal function as the ultimate objective is turning
into a new one with stress more on feelings and relationships (Hirschman and Holbrook, 1982).
According to Suryani (2012), a perception process initiated by a stimuli that our senses know.
Stimuli can lead to the perception of a variety of shapes, like everything that can be smelled, seen,
heard, touched. These stimuli would be the sensory organ called sensory receptor. Direct or immediate
response from the sensory receptor organs is called sensation. The level of sensitivity in sensation
between one individual with another individual is different. The difference in sensitivity occurs
because of the ability of the receptor among individuals that are not the same. In addition to the
sensitivity factor, other factors that influence the intensity of the stimuli. The conceptual framework is
describes on Figure 1.

PAGE 83| Journal of Corporate Governance, Insurance, and Risk Management | 2015, VOL. 2, NO. 3
Figure 1: Conceptual Framework
2.3 Browser Profile
Mozilla Firefox is the free platform browser which developed by Mozilla and hundred of the
volunteer. Firefox can run on various operating system let say Microsoft Windows, Linux, Mac OS X,
dan FreeBSD. The newest version is 24.0, which released on August 24 Agustus 2013 with of course
several improvement and bug fixes. On the other hand, Google Chrome is the simple, speed, and
secure browser. Chrome specially design for the modern websites. And already prove what is
intended for. Chrome speed start right after we open the browser, then when web pages loading.
Equipped with useful personal setting, Chrome easily enrich with its application, extension and
themes. The user can get them through the Web Store Chrome. One of the strength is if you open
Chrome using your ID, then you have the exact Chrome setting. So you do not have to be worry about
your bookmark. They appear the same on every computer you log on.
As the default browser, Internet Explorer (IE) of course freely distributed alongside the released of
Windows operating system. IE start its operation in 1995 and currently the newest version is IE 9
which is available if you using Windows 7, Windows Vista, dan Windows Server 2008. The next web
browser was initially design for mobile, The Opera web browser. Opera was developed by the Opera
Software from Oslo, Norwegia. Opera can also run in various operating system such as Microsoft
Windows, Mac OS X, Solaris, FreeBSD dan Linux. Opera introduce the vector graphics library called
Vega, which able to manage the browser rendering. Our next browser is exclusively develop and used
for Apple system, the Safari. Its initial intend purpose was for Mac Computer. Now, Safari Browser
can run on Mac, iPad, iPhone, dan iPod touch. Safari began its service for Mac OS since 1997. Now,
Safari can also run on Windows operating system and the recent version is 5.1.7.
The speed to display
HTML
The speed of executing
ECMA Script
The browser security
The need of hardware
resource
Stimuli
Receptor Selection
Organization
Interpretation
Positioning of
Desktop Web
Browsers

PAGE 84| Journal of Corporate Governance, Insurance, and Risk Management | 2015, VOL. 2, NO. 3
3. METHODOLOGY
This study analyze the Indonesian customer’s perception toward the top five brands of web
browsers based on Statcounter (2013) which are Mozilla Firefox, Google Chrome, Internet Explorer,
Safari and Opera. Online questionnaire was conducted in five-month period, from September 2013-
Maret 2014. Using non-purposive probability sampling, the total sample size of our survey was 400
respondents. Items measurement was measured with five-point Likert-type scale.
3.2 Identification of Variable
Based on the theory from Limantara (Sopyani, 2012) about the general feature of the browser
and Matamaya (Sopyani, 2012) about the browser performance measurement, we use the operating
variables such as:
a. The speed of displaying the HTML (KBH): displaying speed can be measured by calculating
time needed by the browser to open the certain size of an HTML file. The browser speed than
compare with the speed of other browser.
b. The speed when executing the ECMAScript (KME). ECMAScript is the official name of
Javascript (needed to play video and music media). Javascript developed by ECMA (European
Computer Manufactures Association). The test which frequently used to measured the speed
of executing ECMAScript is the SunSpider online test.
c. The browser security (KB): as we all know, there are not any software which bugs-free. Bug
in a browser can be used by the web designer and hackers to seek the crack in computer
security. They usually done that to steal or to trasnfer the virus. That is why the browser
security is very important.
d. Hardware Resource requirement. This kind of performance measure the amount of hardware
consumption needed by the browser. The requirement can be identify from several factors; the
size of the installer package, the space needed after installation, (KRH 1), and the amount of
memory used when operating the browser (KRH 2).
3.2 Statistical Technique Used (Multidimensional Scaling)
Multidimensional Scaling (MDS) is a technique for the analysis of similarity or
dissimilarity data on a set of object. One of the purpose of MDS, it represents (dis) similarity data
as distances in a low-dimensional space in order to make these data accessible to visual
inspection and exploration. The most frequently used and the most natural distance function is the
Euclidean distance (Ed) which represent by the formula (Borg and Groenen, 2005):
( ) √ ( ) ( )
For technical reasons, most MDS algorithms, like the Alternating Least‐Squares Scaling (ALSCAL)
algorithm in the Statistical Package for the Social Sciences (SPSS), are more efficient with
PAGE 85| Journal of Corporate Governance, Insurance, and Risk Management | 2015, VOL. 2, NO. 3
dissimilarity measures. As such, data collected with the intention of subsequent MDS analyses is
generally dissimilarity data.
4. RESULT AND ANALYSIS
4.1 Respondent’s Profile
We gather 400 respondents which 62% of them were male and the 38% were female. The age
distribution of the respondent is 22% below 20 years, 32% between 20-25 years, 27% between 25-30
years and 19% above the 30 years. Respondent’s profession dominated by the 49% of students, 18%
civil servant, 22% private company employees, 8% entrepreneur, and other profession such as
housewives and BUMN employees for 3%. The reason for using the internet are 33% of information
searching, 11% using internet to communicate, 6% for gaming, 12% for business, and 38% to get
some entertainment (Movie/video and music).
4.2 Perceptual Map
The analysis was conducted by calculating the euclidean distance of each position of web
browsers on the related dimensions. In concept, euclidean distance, the closer the web browsers
toward the related dimensions, the better the web browsers position based on the dimensions. The
calculation of web browsers based on dimensions and Euclidean distance are presented on Table 1 and
Figure 2.

PAGE 86| Journal of Corporate Governance, Insurance, and Risk Management | 2015, VOL. 2, NO. 3
Table 1: Euclidean Distance of Web Browser
Internet users regards that speed of displaying the HTML is very important. The faster the HTML
file displayed on the browser, the easier the users can get access to the information, entertainment, and
surfing the web. This facts correspond with the Matamaya (Sopyani, 2012), which argue that the speed
of displaying the HTML is one of dimension which consider as an advantage in the browser
performance. To display the HTML faster every browser have their own unique system which can
support the best performance.
As for the ECMA Script which is the official name for the Javascript (needed to access the media
such as video and music) developed by ECMA. This dimension is required especially by the users
who actively access the video and audio content. The faster one browser can display the content, the
more content the user can access in certain time. Matamaya (Sopyani, 2012) explained that the speed
to execute the ECMA Script is one of the important dimension if we are going to measure the browser
performance. The result showed that Google Chrome has the advantage when executing the ECMA
Script.
Desktop Browser merely a software run on computer to access the internet. As software, Browser
also exposed to bugs. Browser with bugs can be used by the web developers or hackers to track and
steal the user information. This is related with the security. This make the security as the next
important thing a browser should consider. A good browser will have the high end security which can
guarantee their users. They need to become immune to the virus and others hacking methods.
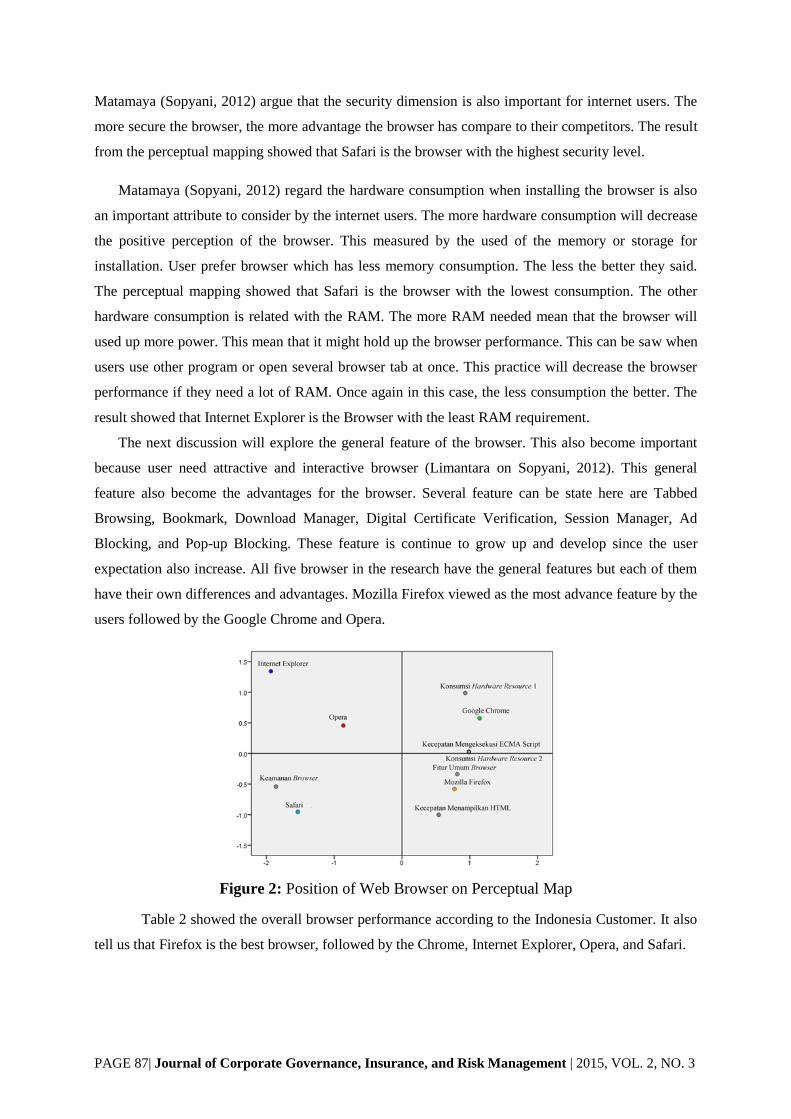
PAGE 87| Journal of Corporate Governance, Insurance, and Risk Management | 2015, VOL. 2, NO. 3
Matamaya (Sopyani, 2012) argue that the security dimension is also important for internet users. The
more secure the browser, the more advantage the browser has compare to their competitors. The result
from the perceptual mapping showed that Safari is the browser with the highest security level.
Matamaya (Sopyani, 2012) regard the hardware consumption when installing the browser is also
an important attribute to consider by the internet users. The more hardware consumption will decrease
the positive perception of the browser. This measured by the used of the memory or storage for
installation. User prefer browser which has less memory consumption. The less the better they said.
The perceptual mapping showed that Safari is the browser with the lowest consumption. The other
hardware consumption is related with the RAM. The more RAM needed mean that the browser will
used up more power. This mean that it might hold up the browser performance. This can be saw when
users use other program or open several browser tab at once. This practice will decrease the browser
performance if they need a lot of RAM. Once again in this case, the less consumption the better. The
result showed that Internet Explorer is the Browser with the least RAM requirement.
The next discussion will explore the general feature of the browser. This also become important
because user need attractive and interactive browser (Limantara on Sopyani, 2012). This general
feature also become the advantages for the browser. Several feature can be state here are Tabbed
Browsing, Bookmark, Download Manager, Digital Certificate Verification, Session Manager, Ad
Blocking, and Pop-up Blocking. These feature is continue to grow up and develop since the user
expectation also increase. All five browser in the research have the general features but each of them
have their own differences and advantages. Mozilla Firefox viewed as the most advance feature by the
users followed by the Google Chrome and Opera.
Figure 2: Position of Web Browser on Perceptual Map
Table 2 showed the overall browser performance according to the Indonesia Customer. It also
tell us that Firefox is the best browser, followed by the Chrome, Internet Explorer, Opera, and Safari.

PAGE 88| Journal of Corporate Governance, Insurance, and Risk Management | 2015, VOL. 2, NO. 3
Table 2: Web Browser’s Position Based On All Dimensions
5. CONCLUSION AND FURTHER RESEARCH
5.1 Conclusion
From the discussion it clearly visible that Mozilla Firefox is the best browser in the category of
HTML speed display. For this dimension, Safari, Opera, and Internet Explorer still left behind. The
Firefox only has close competition from Google Chrome. The second attribute, the speed of executing
the ECMA Script, Google Chrome thriumph as the best browser in the category. While Opera, Safari,
and Internet Explorer is left too far behind, the Mozilla Firefox become the closest competitor for the
Google Chrome. On the third attribute, the browser security, the Apple’s browser, Safari succeded to
become the most trusted browser. The second place won by the Opera which beat Interent Explorer,
Mozilla Firefox, and Google Chrome altogether. On the next attribute, the hardware consumption
(KHR1), Safari once again win the contest followed by the Internet Explorer, then by the Opera,
Mozilla Firefox, and Google Chrome. On the hardware resource consumption (KHR2), the Internet
Explorer become the first choice of the Indonesia users. Safari took the second place, while Opera,
Mozilla Firefox, and Google Chrome respectively follow. On the last attribute, the general feature,
Mozilla Firefox regard as the best by the Indonesian users. The Chrome on the second place and
followed by Opera, Safari, and Internet Explorer.
5.2 Further Research
Based on the result, it is difficult to choose which one of the five browser which can fulfill the
user expectation. Each have their advantages and disadvantages. That’s why we urge that the further
research can be explore more about this. Further research also can be conducted based on the strategy
from the developer when introducing their browser. This will help us to understand the positioning
targeted by the company. The next research also can be conducted using new dimensions which then
can help enhance the depth of the user perception analysis toward their preffered browser.

PAGE 89| Journal of Corporate Governance, Insurance, and Risk Management | 2015, VOL. 2, NO. 3
REFERENCES
Aggarwal, G., Burszten, E., Jackson, C., and Boneh, D. (2010). An Analysis of Private
Browsing Modes in Moderns Browsers. Journal Stanford University. Vol 1(1). Retrieved from
TechRepublic Stanford University.
Borg, I., and Groenen, P. J. F. (2005). Modern Multidimensional Scalling. Theory and
Applications. Second Edition. Spinger.
Dobni, D., and Zinkhan, G.M. (1990). In search of brand image: a foundation analysis.
Advances in Consumer Research. Vol. 17, pp. 110-19.
Edell, J.A., and Burke, M. C. (1987). The power of feelings in understanding advertising
effects. Journal of Consumer Research, Vol. 14 No. 4, pp. 421-33.
Fishbein, M., and Ajzen, I. (1975). Belief, Attitude, Intention and Behavior: An Introduction to
Theory and Research. Reading, MA: Addison - Wesley.
Fill, C. (1999). Marketing communications, context, contents and strategies 2nd edition.
Hemel Hempstead, UK: Prentice-Hall.
Grosskurth, A., and Godfrey, M. (2011). A Reference Architecture for Web Browsers.
Computer Sciene, Vol 1(1). Retrieved from University of Toronto.
Hair, Jr., J. F., Black, W. C., Babin, B. J., and Anderson, R. E. (2010). Multivariate Data
Analysis (7th ed.). New Jersey: Pearson.
Hawkins, D., and Mothersbaugh, D. (2010). Consumer Behavior: Building Marketing Strategy.
New York: McGraw-Hill Irwin.
Hawkins, D. C., Yen D., and Chou. (2000). Awareness and challenges of Internet security.
Information Management and Computer Security, Vol. 8 Iss 3 pp. 131 – 143.
Hirschman, E. C., and Holbrook, M. B. (1982). Hedonic consumption: emerging concepts,
methods and propositions. Journal ofMarketing. Vol. 46 No. 3, pp. 92-101.
Iwata, M., Arase, Y., Hara, T., and Nishio., S. (2010). Web browser for children using
bubblemetaphor. International Journal of Web Information Systems. Vol. 6 Iss 1 pp. 55 – 73.
Keller, K. L. (2003). Strategic Brand Management, 2nd ed., Prentice-Hall, Englewood Cliffs,
NJ.
Kim, H. Y., and Kim, Y. K. (2008). Shopping enjoyment and store shopping modes: the
moderating influence of chronic time pressure. Journal of Retailing and Consumer Services. Vol. 15
No. 5, pp. 410-9.
Kotler, P. (2003). Marketing Management, 11th ed., Prentice-Hall, Englewood Cliffs, NJ.
Kotler, P., and Keller, K. L. (2012). Marketing Management (14th ed.). New Jersey: Pearson.
Laforet, S. (2010). Managing Brands – A Contemporary Perspective, McGraw-Hill,
Maidenhead.
Lee, Gwo-Guang and Lin, Hsiu-Fen. (2005). Customer Perceptions of E-Service Quality in
Online Shopping. International Journal of Retail and Distribution Management. Vol. 33(2), 161-176.
Retrieved from Emerald Insight.
Lombart, C. (2004). Browsing behaviour in retail store: an opportunity for retailers. European
Retail Digest. Vol. 43, pp. 58-64.
Malhotra, N. K. (2010). Marketing Research An Applied Orientation (6th ed.). New Jersey:
Pearson.

PAGE 90| Journal of Corporate Governance, Insurance, and Risk Management | 2015, VOL. 2, NO. 3
Nsairi, Z. B. (2012). Managing browsing experience in retail stores through perceived value:
implications for retailers. International Journal of Retail and Distribution Management. Vol. 40 Iss 9
pp. 676 - 698
Pentina, I., Amialchuk, A., and Taylor, D. G. (2011). Exploring effects of online shopping
experiences on browser satisfaction and e-tail performance. International Journal of Retail and
Distribution Management. Vol. 39 Iss 10 pp. 742 - 758
Peter, J. P., and Olson, J. C. (2008). Understanding Consumer Behaviour, Irwin, Boston, MA
Poturak and Goksu. (2012). Usage of the Multidimensional Scaling in Exploring a Firm's Image
and Competitiveness. Advanced Research in Scientific Areas, 2012 December, 3-7.
Schiffman, L., and Kanuk, L. (2010). Consumer Behavior (9th ed.). New Jersey: Pearson.
Sekaran, U., and Bougie, R. (2010). Research Methods for Business: a Skill Building Approach
(5th ed.). United Kingdom: John Wiley and Sons Ltd.
Shukla, D. and Singhai, R. (2011). Analysis of Users Web Browsing Behavior Using Markov
chain Model. Int. J. Advanced Networking and Applications. Vol 2(5), 824-830. Retrieved from
Cornell University Library.
Solomon, M., Bamossy, G., and Askegaard, S. (2002). Consumer Behaviour: A Europien
Perspective. Prentice Hall.
Sopyani, G. R. (2012). Analisis Perbandingan Performansi and Pengembangan Pemilihan Web
Browser. Journal Universitas Siliwangi Tasikmalaya. Vol 1(1). Retrieved from Universitas Siliwangi
Tasikmalaya.
StatCounter. (2013). Top 5 Browsers from Oct 2011 to Oct 2013. [Online] http://gs.
statcounter.com/#browser-ww-monthly-201110-201310-bar.
Sweeney, J. C., and Soutar, G. N. (2001). Consumer Perceived Value: The Development
of A Multiple Item Scale. Journal of Retailing, 77, 203-20.
Worldstats. (2013). World Internet Users and Population Stats. [Online] http://www.
internetworldstats.com/stats.htm.
Zikmund, W. G., Babin, B. J., Carr, J. C., and Griffin, M. (2010). Business Research Methods
(8th ed.). Canada: South-Western, Cengage Learning.

Pages 91-116
PAGE 91| Journal of Corporate Governance, Insurance, and Risk Management | 2015, VOL. 2, NO. 3
Journal of Corporate Governance, Insurance, and Risk Management (JCGIRM)
2015, Volume 2, Series 3
Online Purchase Intention of Tablets (PC): Role of Social Media
and Learning Style
Bidyanand Jha,*, Dr.K.V.A.Balaji
b
a Kirloskar Institute of Advanced Management Studies, Gut No. 356, 357, Near Tata Foundry, Dhamane, Maval Taluka,
Pune- 410506, Maharashtra, India
b Srijayachamarajendra College of Engineering, Campus Road, Mysore -570006, Karnataka, India
A B S T R A C T A R T I C L E I N F O
The present study attempts to investigate the relations between the
communications on the social network platforms and its effect on the
purchase intentions of the consumers and more specifically the young
adolescents. Further, this study also attempts to investigate how these
relationships vary across young people possessing different learning
styles. This study analysed the data in three part. The initial was an
exploratory study which consisted of maintaining and excluding those
items which enabled the analysis of other dimensions or factors with a
suitable degree of reliability or uni-dimensionality. The second part was
an exploratory and confirmatory factor analysis and the third being the
structural equation modelling, which discarded those items which did not
enable suitable dimensionality for the entire construct in the model.
Confirmatory Factor Analysis (CFA) and Structural Equation Modelling
(SEM) was used to test the present model using AMOS 21 software and
basic calculations in statistics such as mean, standard deviation, factor
analysis, correlation will be performed using SPSS 21. The study shows
that the social media communication influence brand attitude and image
leading to purchase intention.
Keywords:
Social Media Communication,
User Generated Social Media
Communication, Firm Generated
Social Media Communication,
Brand Attitude, Brand Image,
Purchase Intention.
*Corresponding author:
(Bidyanand Jha)
Article history:
Article Submitted 14-04-2015
Article Accepted 20-06-2015
**Article previously published in
EJEM 2015, vol 2, No. 3
1. INTRODUCTION
Since the internet and other media have been adopted and integrated into the daily lives of an
increasing number of young adolescents in most of the countries, scholars and commentators are
debating the impact of these new media on the activities, social relationships, and worldviews of the
younger generations. Controversies about whether technology shapes values, attitudes, and patterns of
social behaviour are not new. In the recent past, the rapid expansion of television stimulated similar
discussions of its cultural and social effects.

PAGE 92| Journal of Corporate Governance, Insurance, and Risk Management | 2015, VOL. 2, NO. 3
The websites of Social media provide an opportunity for companies to engage, actively involve and
interact, network with the potential and current consumers, to encourage an increased sense of
confidence of the customer relationship, and build all important meaningful relationships with
consumers by winning their trust (Mersey, et al 2010) especially in today’s business situation when
consumer loyalty can be wiped out at the smallest mistake, which can additionally have online
negative broadcast of their unfortunate experience with a particular product, service, brand or
company.
The emergence of online social networks influences people in various ways and moreover, the effect is
predicted to be high on the young adolescents wherein it is found that target group who is more
exposed themselves to the online social media. It is believed that the social networks influence the
purchase intentions and therefore it is important to study the potential impact online social
networks may have in this field. The present study attempts to investigate the relations between the
communications on the social network platforms and its effect on the purchase intentions of the
consumers and more specifically the young adolescents. Further, this study also attempts to investigate
how these relationships vary across young people possessing different learning styles.
2. Literature Review
2.1 Firm generated social media communication
In compare to traditional sources of firm-created communication, social media communications have
been acknowledged as bulk phenomena with widespread demographic demand (Kaplan and
Heinlein 2010). This acceptance of the implementation of social media communication among
companies can be explained by the viral broadcasting of information via the Internet on social media
websites (Li and Bernoff 2011) and the larger capacity to reach to the local public when matched with
the traditional media (Keller 2009).
Brand always aim at presenting their company in a positive direction, communication through
traditional media and firm-created social media communication – both fully organised by the marketer
– will always lead to positive brand-based communication content and positive review. Thus, it is
anticipated that a positive assessment of the traditional tools of marketing communications and firm-
created communication will positively influence brand consciousness, awareness, functional, and to
brand image.
PAGE 93| Journal of Corporate Governance, Insurance, and Risk Management | 2015, VOL. 2, NO. 3
2.2 User Generated Social Media Communication
User-generated content abbreviated as (ugc) is a speedily growing factor for brand conversations
and consumer perceptions (Christodoulides et al, 2012). From the study conducted by the Anindya et
al, (2012) the concept of User-generated content on social media platforms and product search
engines is fluctuating the way customers buy for products online.
2.3 Brand Equity
The concept of brand equity is a strategic marketing strength (Styles and Ambler 1995) that can build
a relationship that discriminates the links between a company and its costumer and that
encourages long-term purchasing behaviour (Keller 2013). The study the understanding of brand
equity and its development increases competitive obstacles and pushes brand prosperity (Yoo,
Donthu, and Lee 2000). Although research and studies has been carried out extensively in the field
of brand equity, the literature review on this topic is disjointed and inadequate (George
Christodoulides and De Chernatony 2010).
The measurement of brand equity has been come up from two major viewpoints in the literature.
Some studies has focused on the financial aspects of brand equity (Simon and Sullivan 1993),
whereas other studies have highlighted the customer-based aspects (Aaker 1991; Keller 1993; Yoo
and Donthu 2001). Thus, the main stream of study has been grounded in reasoning psychology,
concentrating on memory arrangement (Aaker 1991; Keller 1993).
2.4 Brand attitude
Olson and Mitchell (1981) defines brand attitude is identified as a “purchaser’s overall assessment of a
brand”. Brand attitude is normally conceptualized as a world-wide evaluation that is based on positive
or negative reactions to brand-related motivations or philosophies (Murphy and Zajonc 1993) research
work contribute to the fact that the central factor to be considered in consumer-based brand equity and
interpersonal exchanges (Lane and Jacobson 1995; Morgan and Hunt 1994).
Brand attitude is included in the proposed conceptual framework in this study which aims to
enhance the understanding of the effects of social media communication on consumer
perceptions of brands.

PAGE 94| Journal of Corporate Governance, Insurance, and Risk Management | 2015, VOL. 2, NO. 3
2.5 Learning Style
Kolb (1984) developed the experiential learning model abbreviated as (ELM) is connected with the
different learning style which takes the information processing method to learning. Fundamentally, the
ELM is a four phase’s cyclical process, where students who learn meritoriously will experience all
four phases at different times in the learning procedure and can interchange backward and forward
through the phases, depending on what is being taught and the technique used. However, the learner
will generally have a predilection for one particular style and, as their learning progresses, which
changes the preference of the learner to adopt different style (McCarthy2010).
It is proposed in the model below that User Generated and Firm Generated Communication will
influence the Brand attitude and Brand equity. Further, brand equity and brand attitude affects the
purchase decision of the consumer. The integrated model also suggests that the learning styles acts as
the moderating variable.
Fig 1 : SMBM Model
3. Development of Research Hypothesis

PAGE 95| Journal of Corporate Governance, Insurance, and Risk Management | 2015, VOL. 2, NO. 3
3.1 Social network Effects on brand equity
From the literature review supports the concept that branding communication influences brand equity
by increasing the likelihood that a brand will be combined into a consumer’s consideration set,
thus assisting in the process of brand decision making and in the process of the choice becoming a
habit (Yoo, Donthu, and Lee 2000). Nielsen (2009) study states that 70% of internet users believe the
evaluations of consumers in the form of review on social media platforms.
In this study it was assume that a positive evaluation of firm created social media brand
communication will positively influence brand equity. Thus, the following hypothesis formulated
which states:
H1a. Firm-created social media communication positively influences brand equity.
From the effect of user-generated social media communication on brand equity, it must be
standardised that UGC is not normally guided by marketing involvement or company control over the
market (George Christodoulides and Jevons 2011). If the consumers review is positive content carry
information about a product/brand or company that can be mostly useful for consumers in relations to
consumer-based brand equity. Additionally, the effects of UGC on social media can lead to growth
about the brand consciousness and brand associations, hence influencing the overall assessment of a
brand. Consequently, leads to hypothesize as follows:
H2a. User-generated social media communication positively influences brand equity.
As per the effect of user-generated communication on serviceable and hedonic profits can be both
positive and negative. In the situation of functional advantage, the impact of user-generated
communication relates to content handling and mainly with the quality characteristics of the brand that
can be arbitrated in both forms positively or negatively by consumers, thus prompting functional brand
image either satisfactorily or disapprovingly. The same rational applies to the influence on a brand’s
hedonic advantage.
Nevertheless, brand attitude may also comprise of the affect that is not apprehended in
measurable characteristics, even when a large set of features is involved. Researchers conducting
study on Brand building multi-attribute models of customer inclination have incorporated a general
constituent of brand attitude that is not clarified by the brand attribute standards (Srinivasan 1979).
Supposing that positive brand assessments of consumers can reproduce perceptions of exclusiveness,
which add to brand equity, leads to following stated hypothesis;
H3. Brand attitude positively influences brand equity.

PAGE 96| Journal of Corporate Governance, Insurance, and Risk Management | 2015, VOL. 2, NO. 3
3.2 Social Network Effects on brand attitude
It’s expected that firm-created and user-generated social media communication to positively affect
brand attitude. Because firm-created social media communication is proposed to be positive and to
intensify brand awareness (Li and Bernoff 2011) and because positive user-generated social
media communication, thus also intensify brand consciousness and brand associations (Burmann
and Arnhold 2008), the following hypotheses is presented:
H1b. Firm-created social media communication positively influences the brand attitudes of
consumers.
H2b. User-generated social media communication positively influences the brand attitudes of
consumers.
3.3 Brand Attitude and Equity Effects on purchase intention
The study conducted by Farquhar (1989) opinions that there are three elements that are important in
structuring a strong brand with the user: positive brand assessment, positive brand attitude, and a
reliable brand image. From the research of De Chernatony et al. (2005, 2006) found that
organizational culture and workers’ values are likely to impact the group of values user perceive as
constituting a service brand.
This indicates that positive attitudes are likely to endorse brand purchase, which is an outcome of
brand equity. Faithful users tend to purchase more than moderately faithful or newly joined
costumers (Yoo, Donthu, and Lee 2000). A positive attitude toward a brand impact a
customer’s decision making and purchase intention (Keller and Lehmann 2003). This also
includes more positive costumer perceptions of the superiority of a brand are related with stronger
purchase intentions and decision making (Aaker 1991). Thus, the following hypothesis:
H4. Brand attitude positively influences purchase intention.
H5. Brand equity positively influences purchase intention.
3.4 Learning Styles as the Moderating Variable Affecting the Social Media and Brand
Communication Relationships
To purchase online is the decisions which are usually made by the user based on the information and
display provided by electronic catalogues available for choice online or the communications that takes
place on the social network platform through chats and reviews. There are few studies carried out

PAGE 97| Journal of Corporate Governance, Insurance, and Risk Management | 2015, VOL. 2, NO. 3
which emphasis on the impact of brand communication role in consumer learning on online shopping,
the presentation, display of the products, designs and formats of these communications play an
important role in preventing or enabling the decision –making to buy online (Li et al. 2003).
Social networks and websites can provide a high degree of interactivity, to satisfy consumers learning
needs, and influence their purchasing decisions to buy product online. It is thus hypothesised that the
learning styles influences the above listed hypothesis numbered H1 to H5.
4. RESEARCH METHODOLOGY
The instrument development involved structured interviews followed by a pilot study. Different
statistical techniques were used to assess and validate the constructs selected for the study. Subjective
content validity (based on structured interviews), Reliability tests (using Cronbach α) and
confirmatory factor analysis (CFA) for evaluating the factor structure and initial validity were used for
the investigation.
A two phased research methodology was adopted for this study. In the first phase, the definitions of
the constructs as well as the measurement items for each construct were established. This phase
provided tentative indications of reliability and validity.
The second part was an exploratory and confirmatory factor analysis and the third being the structural
equation modelling, which discarded those items which did not enable suitable dimensionality for the
entire construct in the model.
Confirmatory Factor Analysis (CFA) and Structural Equation Modelling (SEM) was used to test the
present model using AMOS 21 software and basic calculations in statistics such as mean, standard
deviation, factor analysis, correlation will be performed using SPSS 21.
The questionnaire items were based on the studies conducted earlier by Hong (2012), Schivinski and
Dąbrowski (2013), Rehmani and Khan (2011), Kolb (1985) and modified based on the experts
commands. The questionnaire had three parts, Part A, B and C. Part A captured the basic descriptive
details from the respondents on the personal information, their social media preferences, usage and
perceptions on the purchase made using the social media information.
Part B captured the information on the five main constructs for apparels used in the study model viz.,
company generated social media communication, user generated social media communication, brand
attitude, brand equity and brand purchase intention. The last part, PART C was aimed to collect the

PAGE 98| Journal of Corporate Governance, Insurance, and Risk Management | 2015, VOL. 2, NO. 3
information pertaining to the learning styles of the respondents. It was based on the methodology
proposed by Kolb (1985).
The sample size selected for the study was 301 students presently pursuing their business education
from Mumbai and Bangalore. For each category, the respondent will be required to indicate a
brand that he or she has “Liked” on social media from the selected three product categories. It
was assumed that consumers have been exposed to social media communication from both
companies and users from brands that they have “Liked” on any social media platform. The product
categories and wide array of brands also reflect an extensive set of consumer products and
should provide research generalizability.
As a requisite for the study, the respondents were required to receive news feeds both from the
company and from other users with respect to the brand that they had previously “Liked” on the social
network site and have developed a purchase intention. Each respondent was required to complete one
version of the questionnaire evaluating only one brand. He had to fill different questionnaire for
different brands.
As sample size depends on statistical tool as structural equation modelling (SEM) is used in this study.
Sample size is decided based on two conditions: (N > p), where N is number of sample and p is
observed variables (Schermelleh-Engel, and Moosbrugger, 2003); and with three more indicator per
factor sample of 301 is sufficient for convergence and proper solution (Lacobucci, 2010). Hence total
sample size of 301 respondents are considered, as number of observed variable for product category is
18 and makes a total of 54 variables for model testing.
The selected respondents represented 65% Male students and the other 35% female students. 21.5%
percent of the respondents belonged to the commerce stream, 15.2% from Science, 27.9 % from
Management and 24% from Engineering background. In terms of the present interaction with
reference to the time spent on the social networking sites. Care was taken to have a representative
distribution of the sample respondents. No respondent was selected for the study who doesn’t spend
any time on these networks. Almost 65% of the selected respondents spent more than 7 hours per
week on the social media sites.
RESEARCH FINDING
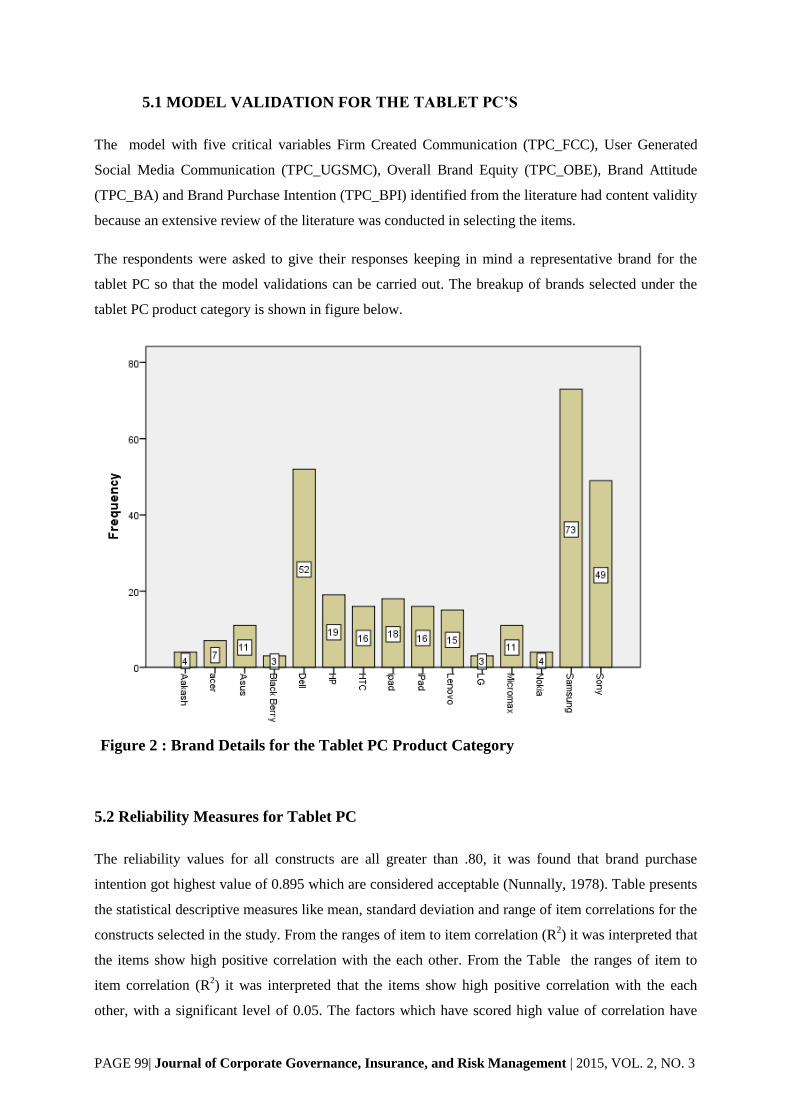
PAGE 99| Journal of Corporate Governance, Insurance, and Risk Management | 2015, VOL. 2, NO. 3
5.1 MODEL VALIDATION FOR THE TABLET PC’S
The model with five critical variables Firm Created Communication (TPC_FCC), User Generated
Social Media Communication (TPC_UGSMC), Overall Brand Equity (TPC_OBE), Brand Attitude
(TPC_BA) and Brand Purchase Intention (TPC_BPI) identified from the literature had content validity
because an extensive review of the literature was conducted in selecting the items.
The respondents were asked to give their responses keeping in mind a representative brand for the
tablet PC so that the model validations can be carried out. The breakup of brands selected under the
tablet PC product category is shown in figure below.
Figure 2 : Brand Details for the Tablet PC Product Category
5.2 Reliability Measures for Tablet PC
The reliability values for all constructs are all greater than .80, it was found that brand purchase
intention got highest value of 0.895 which are considered acceptable (Nunnally, 1978). Table presents
the statistical descriptive measures like mean, standard deviation and range of item correlations for the
constructs selected in the study. From the ranges of item to item correlation (R2) it was interpreted that
the items show high positive correlation with the each other. From the Table the ranges of item to
item correlation (R2) it was interpreted that the items show high positive correlation with the each
other, with a significant level of 0.05. The factors which have scored high value of correlation have

PAGE 100| Journal of Corporate Governance, Insurance, and Risk Management | 2015, VOL. 2, NO.
3
shown considerable positive range of correlation amongst themselves. The percentage of variance is a
popular and intuitive index of goodness of fit in multivariate data analysis the higher the percentage of
variance a proposed model manages to explain, the more valid the model seems to be from the above
table all the constructs are showing higher percentage of variance ranging between 72 to 82%.
Table 1 : Descriptive Statistics and Reliability Analysis for Tablet PC
Constructs
(For Tablet
PC)
Initial
Items
Item
Droppe
d
based
on
Expert
s
Opinio
n
Mean
Value
(N=301)
S.D.
Range of Item
to Item
Correlation
Cronbac
h’s
Alpha
(α)
Score
% of
Variance
Firm Created
Communication
(TPC_FCC)
4 - 3.4203 1.08389 .507** - .714** 0.879 73.777
User Generated
Social Media
Communication
(TPC_UGSMC)
4 - 3.4726 1.02305 .582** - .697** 0.874 72.759
Overall Brand
Equity(TPC_O
BE)
4 - 3.5889 1.13659 .554** - .753** 0.885 74.689
Brand
Attitude(TPC_B
A)
3 -
3.6213 1.16823
.612** - .781** 0.860 78.245
Brand Purchase
Intention
(TPC_BPI)
3 - 3.5072 1.28593 .720** - .772** 0.895 82.622
Total items 18 0
**Correlation is significant at 0.01 level (2-tailed). *Correlation is significant at 0.05 level (2-tailed).

PAGE 101| Journal of Corporate Governance, Insurance, and Risk Management | 2015, VOL. 2, NO.
3
5.3 SMBM Model for Tablet PC Brands
Structural Equation Modelling (SEM) was used to test the relationship between the five constructs at α
= 0.05, Firm Created Communication (TPC_FCC), User Generated Social Media Communication
(TPC_UGSMC), Overall Brand Equity (TPC_OBE), Brand Attitude (TPC_BA) and Brand Purchase
Intention (TPC_BPI)
Table below presents the regression weights for the various relationships. The relationships were
found to be highly significant across all the selected constructs. It is found that the model fit is
satisfactory. The model is accepted as good model with CFI = 0.802, GFI = 0.862, NFI = 0.881, RMR
= 0.028, Cmin/Df = 5.141.
These relationships are depicted in graphical form as given by the AMOS output in the following
figure.
Fig 3: AMOS Output , Regression weight of various variables.
It is found that the model fit is satisfactory though the cut off values are relatively low based on
meeting the above standards used by the researchers for SEM, still the model is accepted as good
model with CFI = 0.802, GFI = 0.862, NFI = 0.881, RMR = 0.028, Cmin/Df = 5.141. The significant

PAGE 102| Journal of Corporate Governance, Insurance, and Risk Management | 2015, VOL. 2, NO.
3
relationships between the various constructs and the items used for defining the constructs can be
found from the table given below.
Table 2:Performance fit Indices for Tablet PC Brands
CMIN/ DF 5.141
RMR 0.028
CFI 0.802
NFI 0.881
GFI 0.862
Acronyms:
CMIN/ DF: Relative chi-square. RMR: Root Mean Square Residual. GFI:
Goodness of Fit Index CFI: Comparative Fit Index
NFI: Normed Fit Index. James Mulaik & Brett (1982) parsimony adjustment to
NFI.
5.4 Learning Styles as the moderating variable on the Relationship between the social
media communication, brand effects and purchase intentions
The findings of the first phase revealed that majority of the respondents (almost 50% of them)
followed the concrete learning style followed by reflective learning style and active learning styles.
Surprisingly none of the student were identified to fall in the category of Abstract learning styles. This
shows that the MBA students, when interacting on the social networking are highly action oriented
and believe in either experiencing, reflecting or doing, then thinking.

PAGE 103| Journal of Corporate Governance, Insurance, and Risk Management | 2015, VOL. 2, NO.
3
Figure 4: Profile of Learning Styles Identified in the Study
5.5.LEARNING STYLE AS THE MODERATING VARIABLE ON THE SMBM
MODEL-TABLET PC BRANDS
Structural Equation Modeling was used to test the effect of learning styles on the SMBM model. The
model was run for the three groups identified in our study namely. Concrete Learning Style, Reflective
Learning Styles and Active Learning Style. The regression weights estimated for the three groups are
shown in Table a, b and c. the significant tested model with modifications are presented in figure a, b
and c.
Table 3: Regression Weights Concrete Learning Style- Tablet PC Brands
Constructs Estimate S.E. C.R. P
Brand_Attitude <--- FirmCre_Comm .794 .110 7.186 ***
Brand_Attitude <--- UserGen_Comm .333 .086 3.893 ***
Brand_Equity <--- FirmCre_Comm .335 .082 4.085 ***
Brand_Equity <--- UserGen_Comm .220 .062 3.547 ***
Brand_Equity <--- Brand_Attitude .447 .083 5.413 ***
Purchase_Intention <--- Brand_Equity .561 .161 3.484 0.05
Purchase_Intention <--- Brand_Attitude .739 .114 6.500 ***
TPC_FCC4 <--- FirmCre_Comm 1.000
TPC_FCC3 <--- FirmCre_Comm 1.117 .115 9.695 ***
0
20
40
60
80
100
120
140
160
Concrete Learning Style Reflective Learning Style Active Learning Style Abstract Learning Style

PAGE 104| Journal of Corporate Governance, Insurance, and Risk Management | 2015, VOL. 2, NO.
3
TPC_FCC2 <--- FirmCre_Comm 1.103 .109 10.092 ***
TPC_FCC1 <--- FirmCre_Comm 1.150 .123 9.325 ***
TPC_UGSMC4 <--- UserGen_Comm 1.000
TPC_UGSMC3 <--- UserGen_Comm .898 .095 9.469 ***
TPC_UGSMC2 <--- UserGen_Comm 1.039 .090 11.479 ***
TPC_UGSMC1 <--- UserGen_Comm .853 .081 10.484 ***
TPC_OBE2 <--- Brand_Equity 1.318 .145 9.082 ***
TPC_OBE3 <--- Brand_Equity 1.203 .145 8.317 ***
TPC_BA3 <--- Brand_Attitude 1.000
TPC_BA2 <--- Brand_Attitude .753 .078 9.633 ***
TPC_BA1 <--- Brand_Attitude .879 .069 12.795 ***
TPC_BPI1 <--- Purchase_Intention 1.000
TPC_BPI2 <--- Purchase_Intention .991 .074 13.357 ***
TPC_BPI3 <--- Purchase_Intention .873 .080 10.848 ***
TPC_OBE1 <--- Brand_Equity 1.000
TPC_OBE4 <--- Brand_Equity 1.406 .161 8.760 ***
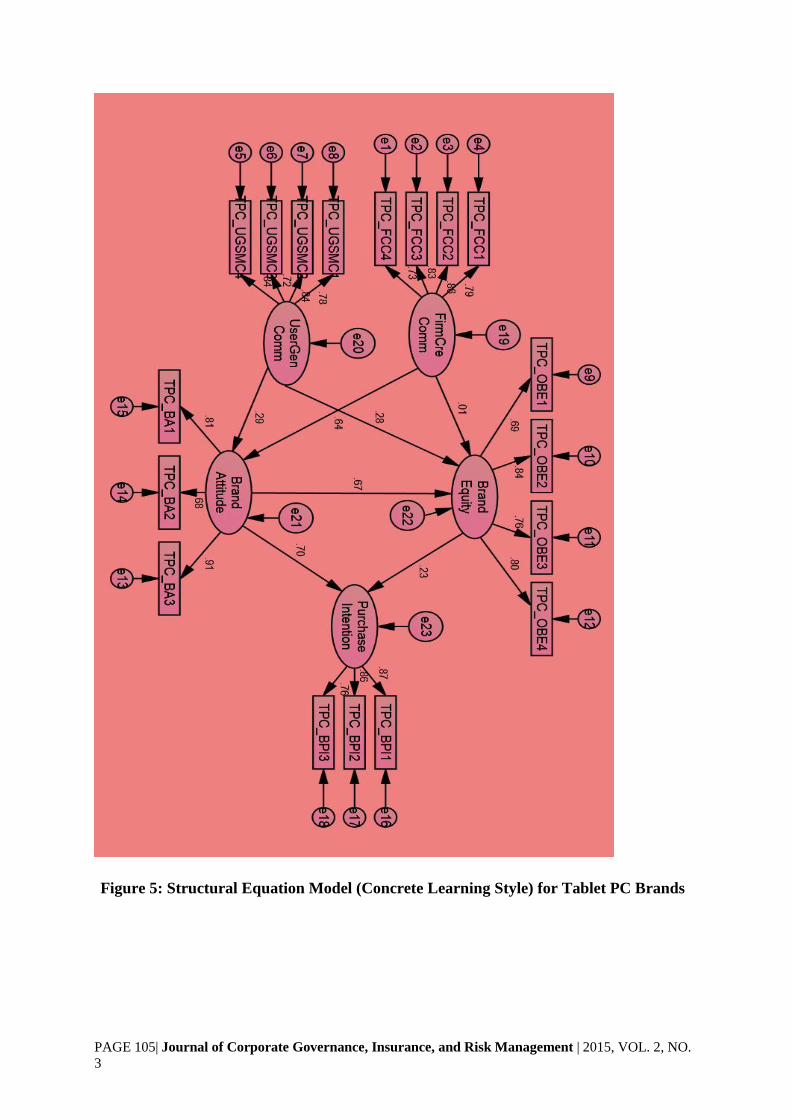
PAGE 105| Journal of Corporate Governance, Insurance, and Risk Management | 2015, VOL. 2, NO.
3
Figure 5: Structural Equation Model (Concrete Learning Style) for Tablet PC Brands
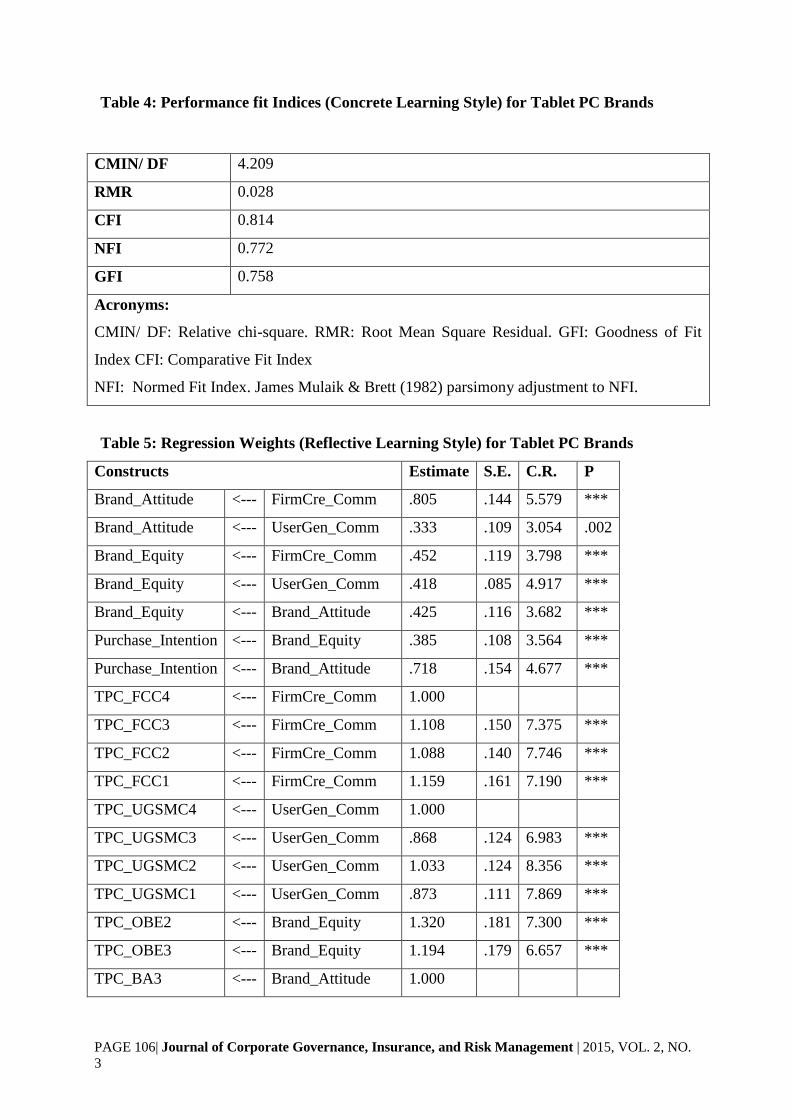
PAGE 106| Journal of Corporate Governance, Insurance, and Risk Management | 2015, VOL. 2, NO.
3
Table 4: Performance fit Indices (Concrete Learning Style) for Tablet PC Brands
CMIN/ DF 4.209
RMR 0.028
CFI 0.814
NFI 0.772
GFI 0.758
Acronyms:
CMIN/ DF: Relative chi-square. RMR: Root Mean Square Residual. GFI: Goodness of Fit
Index CFI: Comparative Fit Index
NFI: Normed Fit Index. James Mulaik & Brett (1982) parsimony adjustment to NFI.
Table 5: Regression Weights (Reflective Learning Style) for Tablet PC Brands
Constructs Estimate S.E. C.R. P
Brand_Attitude <--- FirmCre_Comm .805 .144 5.579 ***
Brand_Attitude <--- UserGen_Comm .333 .109 3.054 .002
Brand_Equity <--- FirmCre_Comm .452 .119 3.798 ***
Brand_Equity <--- UserGen_Comm .418 .085 4.917 ***
Brand_Equity <--- Brand_Attitude .425 .116 3.682 ***
Purchase_Intention <--- Brand_Equity .385 .108 3.564 ***
Purchase_Intention <--- Brand_Attitude .718 .154 4.677 ***
TPC_FCC4 <--- FirmCre_Comm 1.000
TPC_FCC3 <--- FirmCre_Comm 1.108 .150 7.375 ***
TPC_FCC2 <--- FirmCre_Comm 1.088 .140 7.746 ***
TPC_FCC1 <--- FirmCre_Comm 1.159 .161 7.190 ***
TPC_UGSMC4 <--- UserGen_Comm 1.000
TPC_UGSMC3 <--- UserGen_Comm .868 .124 6.983 ***
TPC_UGSMC2 <--- UserGen_Comm 1.033 .124 8.356 ***
TPC_UGSMC1 <--- UserGen_Comm .873 .111 7.869 ***
TPC_OBE2 <--- Brand_Equity 1.320 .181 7.300 ***
TPC_OBE3 <--- Brand_Equity 1.194 .179 6.657 ***
TPC_BA3 <--- Brand_Attitude 1.000

PAGE 107| Journal of Corporate Governance, Insurance, and Risk Management | 2015, VOL. 2, NO.
3
TPC_BA2 <--- Brand_Attitude .764 .109 7.001 ***
TPC_BA1 <--- Brand_Attitude .913 .097 9.454 ***
TPC_BPI1 <--- Purchase_Intention 1.000
TPC_BPI2 <--- Purchase_Intention .985 .098 10.057 ***
TPC_BPI3 <--- Purchase_Intention .903 .103 8.775 ***
TPC_OBE1 <--- Brand_Equity 1.000
TPC_OBE4 <--- Brand_Equity 1.326 .194 6.840 ***

PAGE 108| Journal of Corporate Governance, Insurance, and Risk Management | 2015, VOL. 2, NO.
3
Figure Pogreška! U dokumentu nema teksta navedenog stila.: Structural Equation Model
(Reflective Learning Style) for Tablet PC Brands
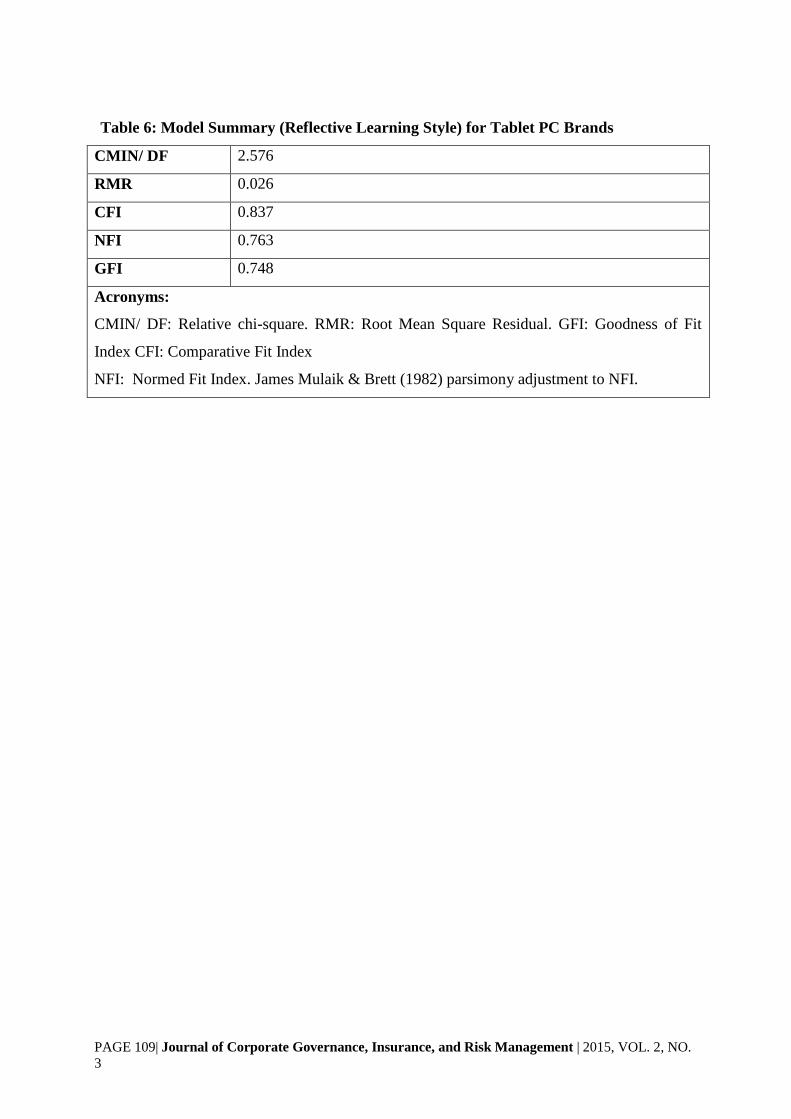
PAGE 109| Journal of Corporate Governance, Insurance, and Risk Management | 2015, VOL. 2, NO.
3
Table 6: Model Summary (Reflective Learning Style) for Tablet PC Brands
CMIN/ DF 2.576
RMR 0.026
CFI 0.837
NFI 0.763
GFI 0.748
Acronyms:
CMIN/ DF: Relative chi-square. RMR: Root Mean Square Residual. GFI: Goodness of Fit
Index CFI: Comparative Fit Index
NFI: Normed Fit Index. James Mulaik & Brett (1982) parsimony adjustment to NFI.

PAGE 110| Journal of Corporate Governance, Insurance, and Risk Management | 2015, VOL. 2, NO.
3
Table 7: Regression Weights (Active Learning Style) for Tablet PC Brands
Constructs Estimate S.E. C.R. P
Brand_Attitude <--- FirmCre_Comm .716 .183 3.920 ***
Brand_Attitude <--- UserGen_Comm .471 .163 2.888 .004
Brand_Equity <--- FirmCre_Comm .590 .126 4.682 ***
Brand_Equity <--- UserGen_Comm .432 .114 3.789 ***
Brand_Equity <--- Brand_Attitude .513 .123 4.170 ***
Purchase_Intention <--- Brand_Equity .555 .120 4.625 ***
Purchase_Intention <--- Brand_Attitude .710 .173 4.098 ***
TPC_FCC4 <--- FirmCre_Comm 1.000
TPC_FCC3 <--- FirmCre_Comm 1.250 .199 6.297 ***
TPC_FCC2 <--- FirmCre_Comm 1.199 .182 6.578 ***
TPC_FCC1 <--- FirmCre_Comm 1.259 .209 6.033 ***
TPC_UGSMC4 <--- UserGen_Comm 1.000
TPC_UGSMC3 <--- UserGen_Comm 1.179 .171 6.888 ***
TPC_UGSMC2 <--- UserGen_Comm 1.104 .150 7.350 ***
TPC_UGSMC1 <--- UserGen_Comm 1.042 .150 6.941 ***
TPC_OBE2 <--- Brand_Equity 1.176 .178 6.601 ***
TPC_OBE3 <--- Brand_Equity 1.045 .176 5.925 ***
TPC_BA3 <--- Brand_Attitude 1.000
TPC_BA2 <--- Brand_Attitude .670 .114 5.903 ***
TPC_BA1 <--- Brand_Attitude .852 .094 9.025 ***
TPC_BPI1 <--- Purchase_Intention 1.000
TPC_BPI2 <--- Purchase_Intention .981 .109 9.019 ***
TPC_BPI3 <--- Purchase_Intention .886 .119 7.447 ***
TPC_OBE1 <--- Brand_Equity 1.000
TPC_OBE4 <--- Brand_Equity 1.341 .199 6.728 ***
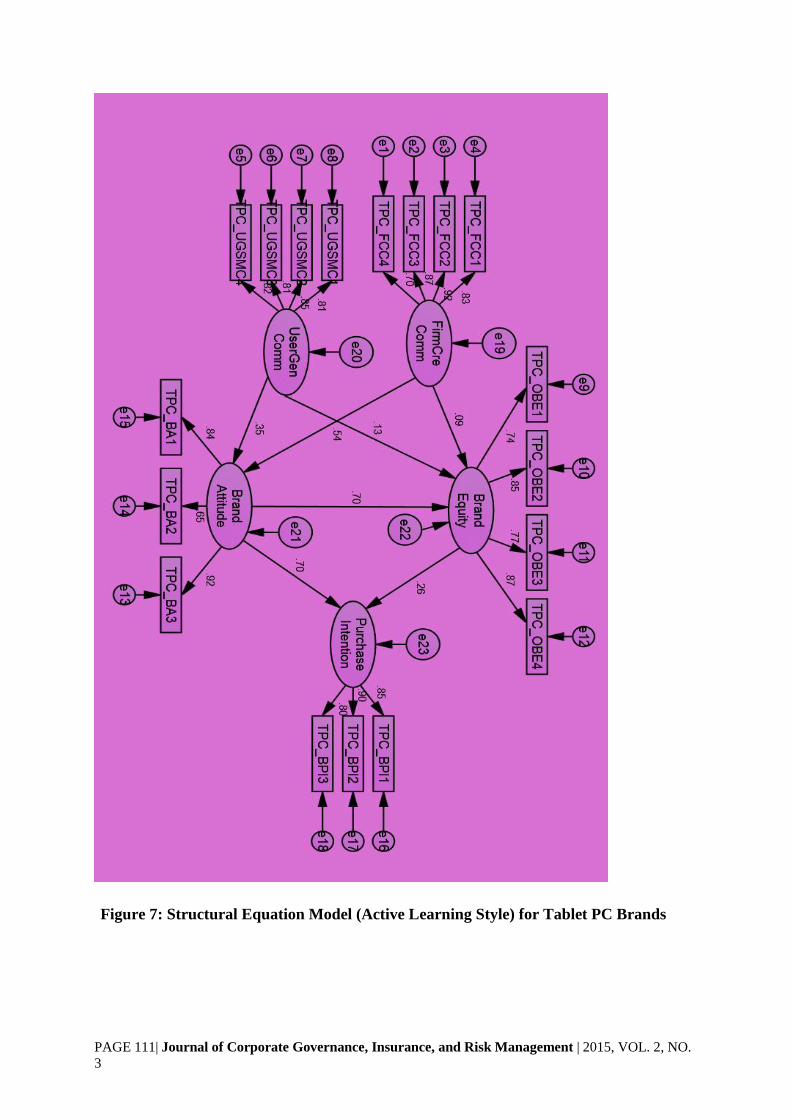
PAGE 111| Journal of Corporate Governance, Insurance, and Risk Management | 2015, VOL. 2, NO.
3
Figure 7: Structural Equation Model (Active Learning Style) for Tablet PC Brands

PAGE 112| Journal of Corporate Governance, Insurance, and Risk Management | 2015, VOL. 2, NO.
3
Table 8 :Model Summary (Reflective Learning Style) for Tablet PC Brands
CMIN/ DF 2.081
RMR 0.031
CFI 0.854
NFI 0.757
GFI 0.718
Acronyms:
CMIN/ DF: Relative chi-square. RMR: Root Mean Square Residual. GFI: Goodness of Fit
Index CFI: Comparative Fit Index
NFI: Normed Fit Index. James Mulaik & Brett (1982) parsimony adjustment to NFI.
6. Major Findings for Tablet PC Brands
The following observations are made from the findings presented in the above tables:
Concrete Learning Style
All the relationships were found to be statistically significant with the Firm Generated
Communication having the maximum effect (0.794) on the brand attitude compared to the effect of
the User generated Communication on the brand image.
Reflective Learning Style
Surprisingly in this case also it was found that the All the relationships were found to be
statistically significant with the Firm Generated Communication having the maximum effect
(0.805) on the brand attitude compared to the effect of the User generated Communication on the
brand image.
Active Learning Style
In this group also the Firm generated communication helped to have a very strong influence (0.716)
on the brand attitude as compared to the influence of the User Generated communication directly
on the brand equity.
Overall we can say that the Firm generated information plays a very important role in developing a
brand attitude leading to brand equity and purchase intentions irrespective of the learning styles
adopted by the person.

PAGE 113| Journal of Corporate Governance, Insurance, and Risk Management | 2015, VOL. 2, NO.
3
7. Discussion &Managerial Implications
The result reported in this paper contribute to the literature on the influence of firm created social
media communication & user generated social media communication on brand attitude which in turn
influence brand equity and subsequently purchase intention by making explicit the
mediating/moderating role of learning style on the antecedents of brand attitude. Thus the following
suggestions can be extracted for the practitioners.
Companies should engage with multiple blogs, forums and wikis covering issues relating to their
product or brand. There has to be frequent comment and should try to create a dialogue with the social
media users. This will help to form a chain reaction on the internet and may lead viewers of other blog
back to your blog or the media company is using. It is required that the marketers should have the
detailed twitter profile included on the company URL. Company should strive to tweet minimum
twice a day and aim to increase the follow up with the online viewers. It is also recommended to have
a YouTube channel which points to the blog and twitter and should sponsor or develop webcasts to
help the college students with any areas they are struggling with related to the product or brand.
Videos should be uploaded regularly.
Companies don’t necessarily need to engage with the people who have the largest number of apparent
connections. These people might not necessarily have the greatest number of strong relationship
amongst their connections. Monitoring their blogs, status updates and forum entries will give a good
idea of how they interact within their social circle.
Company also needs to consider their people inside the organization. They need to identify
evangelists, enthusiasts, pragmatists and any detractors inside the organization. These are the people
who might have already be speaking publically about the brand. Make sure that they are prepared to
communicate externally with an effective, practical and workable social media policy.
8. CONCLUSION , LIMITATIONS AND DIRECTIONS FOR FUTURE RESEARCH
The rapid rise of social media may be the most important evolution to impact marketing in decades. It
has changed almost everything. It enables businesses to influence new buyers (rather than sell to
them), interact and engage with customers (instead of having a one-way dialogue), and it puts the
consumer in control of shaping and influencing a brand (not marketers).

PAGE 114| Journal of Corporate Governance, Insurance, and Risk Management | 2015, VOL. 2, NO.
3
Around the world. Social networks, blogs, media aggregators, and dozens of different types of digital
media provide channels for consumers to have their voices heard. This has changed the entire
landscape of marketing, and the bottom line is that power has shifted to consumers who now have the
ability to interact and influence brands. Consumers can influence how fast a new product is adopted
and liked, and they can bring a company to its knees when they set out to damage a brand. When
videos like the “Comcast sleeping technician” are posted and shared, it’s easy to see how the power of
one consumer-generated video can affect a brand.
Consumer-generated media is everywhere. YouTube gives users power and control to upload,
download, post, and share videos to inform, persuade, educate, and entertain others. Media sites like
Digg and Stumblupon give consumers the power to review and vote on content they believe is the
most important or interesting. On sites like Wikipedia, content is completely created by a community
of users. What drives the popularity of consumer-generated media? At the most basic level is the
emotional need to be heard. People that feel “wronged” want to be heard as much as they want to
evangelize what they love. The Internet and social media is so accessible and easy to use, it provides a
platform for those that want to connect, communicate, and drive change.
o Because of time limitation and to keep the model at a manageable size, this research did not
consider the factors inhibiting the use of social media on the teens and youngsters like age
restrictions, restrictions by the parents to use social media etc. future studies may address
these issues.
o Future study may develop additional measurement constructs in the model such as
demographic profiles of the users or the effect of technology adoption like perceived
usefulness or ease of use components of the social media. Even it would be interesting to
evaluate the effect of peer pressure in using the social media and its effect on the purchase
decisions.
o It would also be interesting to carry out the research both in developing countries and
developed countries and study the implications for social media on the brand managers in
these economies, specific to the product categories selected in this study.
o The social media landscape and practices are changing with the competitive environment as
discussed in the previous section and hence with changing times it is required to get the
selected practices and the measures validated from the practitioners.

PAGE 115| Journal of Corporate Governance, Insurance, and Risk Management | 2015, VOL. 2, NO.
3
REFERENCES
Aaker, D. (1996). Measuring brand equity across products and markets. California Management
Review, 38(3), 102–119.
Aaker, D.A. 1991. Managing Brand Equity: Capitalizing on the Value of a Brand Name. New York,
New York, USA: The Free Press.
Aaker, D.A., and K.L. Keller. 1990. Consumer Evaluations of Brand Extensions. Journal of
Marketing54, no. 1: 27–41.
Christodoulides, G. 2009. Branding in the Post-internet Era. Marketing Theory 9, no. 1 (March
1):141–144.
Daugherty, T., M. Eastin, and L. Bright. 2008. Exploring Consumer Motivations for Creating
Usergenerated Content. Journal of Interactive Advertising 8, no. 2: 1–24.
Bambauer-Sachse, S., and S. Mangold. 2011. Brand Equity Dilution through Negative Online Wordof-
mouth Communication. Journal of Retailing and Consumer Services 18, no. 1 (January): 38–45.
Chang H H and Liu Y M (2009), “The Impact of Brand Equity on Brand Preference and Purchase
Intentions in the Service Industries”, The Service Industries Journal, Vol. 29, No. 12, pp. 1687-
1706.
Christodoulides, George, C. Jevons, and J. Bonhomme. 2012. Memo to Marketers: Quantitative
Evidence for Change. How User-Generated Content Really Affects Brands. Journal of
Advertising Research 52, no. 1: 53.
Cuming, L., 2008. Engaging Consumers Online: The Impact of Social Media on Shopping Behaviour
Through Internet: the Malaysian Case. Australian Journal of Basic and Applied Sciences, 3(4),
pp. 3452-3463.
Diffley, S., Kearns, J., Bennett, W., & Kawalek, P. (2011). Consumer behaviour in social networking
sites: implications for marketers. Irish Journal Of Management, 30(2), 47-65.
Farquhar P H (1989), “Managing Brand Equity”, Marketing Research, Vol. 1, No. 3, pp. 24-33.
Fauser, S.G. Wiedenhofer, J. and Lorenz, M., 2011. “Touchpoint social web”: an explorative study
about using the social web for influencing high involvement purchase decisions. Problems and
Perspectives in Management, 9(1), pp.39-45.
Hong Hu (2012), The effects of online shopping attributes on satisfaction–purchase intention link: a
longitudinal study International Journal of Consumer Studies 36 (2012) 327–334 © 2011
Blackwell Publishing Ltd.
Kaplan AM, & Heanlein M, (2010). Users of the world unite: The challenges and opportunities of
social media. Business Horizons, Vol. 53, P 59-68.

PAGE 116| Journal of Corporate Governance, Insurance, and Risk Management | 2015, VOL. 2, NO.
3
Keller, E., & Libai, B. (2009). A Holistic Approach to the Measurement of WOM. Paper presented at
ESOMAR Worldwide Media Measurement Conference, May 4-6, in Stockholm.
Keller, K.L. 1993. Conceptualizing, Measuring, and Managing Customer-Based Brand Equity. Journal
of Marketing 57, no. January: 1–22.
Kolb, D. A. 1985. Learning Style Inventory. TRG hay/McBer, Training Resoruces Group. 116
Huntington Avenue, Boston, MA 02116. Retrieved from trg_mcber@ haygroup.com.
Li, C., and J. Bernoff. 2011. Groundswell: Winning in a World Transformed by Social Technologies.
Boston M.A.: Harvard Business Review Press.
McCarthy, M. (2010). Experiential learning theory: From theory to practice. Journal of Business &
Economics Research, 8(5), 131–139.
Mersey, R. D., Malthouse, E. C., & Calder, B. J. (2010). Engagement with Online Media. Journal of
Media Business Studies, 7(2), 39-56.
Murphy, S.T., and R.B. Zajonc. 1993. Affect, Cognition, and Awareness: Affective Priming with
Optimal and Suboptimal Stimulus Exposures. Journal of Personality and Social Psychology 64,
no. 5 (May): 723–39.
Rehmani, M and Khan, M (2011), The Impact of E-Media on Customer Purchase Intention,
International Journal of Advanced Computer Science and Applications, Vol. 2, No.3,
Rehmani. M and Khan. M. 2011. The Impact of E-Media on Customer Purchase Intention.
International Journal of Advanced Computer Science and Applications, Vol. 2, No.3, March
2011.
Srinivasan, V. 1979. Network Models for Estimating Brand-specific Effects in Multi-attribute
Marketing Models. Management Science 25, no. 1: 11–21.
Styles, C., and T. Ambler. 1995. Brand Management. Pitman, London: Financial times handbook of
management.

Pages 117-130
PAGE 117| Journal of Corporate Governance, Insurance, and Risk Management | 2015, VOL. 2, NO.
3
Journal of Corporate Governance, Insurance, and Risk Management (JCGIRM)
2015, Volume 2, Series 3
Good work ethics and service delivery in public universities in the
south-south region of Nigeria
1 Ushie, E. M. (Ph.D).
2Agba, A. M. Ogaboh (Ph.D)
1 & 2 Lecturers, Department of Sociology, Faculty of Social Sciences, University of Calabar, Calabar.
Nigeria. E-mail: [email protected].
ABSTRACT ARTICLE INFO
The Nigerian University administration is a collection of specialized academic
faculties established by law, financed by private and public funds, and staffed
by professionals in various disciplines for the purpose of achieving their overall
goal (teaching, research, and community service) of service delivery. Since
good work ethics represents a critical determinant of effectiveness and
productivity vis-à-vis service delivery in all formal organizations, this paper
utilizes the “person-situation” theoretical model to assess the level of service
delivery in selected public universities in the South-south geo-political region
of Nigeria. The present investigation adopted the survey research design. Six
hundred and sixty (660) academic and non-academic staff and three hundred
(300) students were purposively and randomly sampled respectively. The
instrument used for data collection was titled: “good work ethics and service
delivery questionnaire”. Data was analyzed using population t-test, multiple
regression and Pearson product moment correlation. The study revealed that
almost all the public universities under consideration have witnessed poor
service delivery in terms of delay in the release of students’ results, delay in the
preparation of transcript, failure to adhere to time-tables (crash programme) –
leading to frustration by students. The overall consequences of this have been
the poor rating of these universities. It was recommended among other things
that effort should be made to address the poor work ethics (in terms of
initiative, dedication, high standard of responsibility, loyalty, accountability,
and self-discipline) among staff and students in the selected universities with a
view to strengthening its performance index and therefore service delivery.
Keywords:
Work ethics, Services
delivery, South-South, public
universities, Nigeria.
Corresponding author:
E-mail:
[email protected] Ushie, Ekwuore Monday Department of Sociology,
Faculty of Social Sciences,
University of Calabar,
Calabar, Nigeria.
Phone: +2348023612599
Article history:
Article Submitted 14-04-
2015
Article Accepted 20-06-
2015
**Article previously
published in EJEM 2015, vol
2, No. 3
PAGE 118| Journal of Corporate Governance, Insurance, and Risk Management | 2015, VOL. 2, NO.
3
1 INTRODUCTION
Work, whether paid or unpaid connotes the carrying out of tasks requiring the
expenditure of mental and physical effort, which has as its objectives the production of goods
and services that cater to human needs (Gidens, 2009). However, how a given employee
perceive the above conception depends on his/her orientation to work. That is, the aspirations
and goals which workers hope to fulfill in their place of work. These aspirations and goals are
assured to have evolved from needs created by situational factors within the work and non
work spheres of life (Aluko, 2008). Experience have shown that attitude to work which
moderate such situational variables is critical in determining the effectiveness or otherwise of
an organization. Okoh (2003) see attitude as the feeling, habits and beliefs that affect the
individuals’ behaviour to work. Some beliefs, habits, feelings and motives are supportive of
positive work ethics while others do not.
The work attitude affects the way a worker relates to, conceives and views his job. It
shows how committed, dedicated, hard working and performing a worker is in relation to the
objective of the organization. Implying from the above therefore, workers imbued with
positive work ethics world be seen to be highly committed, dedicated and hardworking
leading to the achievement of the vision and mission of their respective organization. The
reverse could also be the case.
In more general terms, work ethics involve being personally accountable and
responsible for the work that one does or how one feel about the job he/she does. If one may
ask, with particular reference to the Nigeria public universities, are the workers accountable
and responsible for the work that they do? How do they generally feel about their work? Have
they been able to live up their expectations in terms of satisfying the vision and mission of
their institution vis-à-vis service delivery? Questions such as these should provoke our
imagination and begging for answers.
The university administration (especially public universities) have made headlines in
recent times of its inability to render specific services to its immediate beneficiaries. Like
Alubo (2014) puts it, “Nigeria’s Tertiary Educational Institutions (TEIs) have hugged the
headlines at most continuously for the past two years, albeit for the wrong reasons”.
According to him, rather than any earthshaking piece of research or cutting edge discovery,
PAGE 119| Journal of Corporate Governance, Insurance, and Risk Management | 2015, VOL. 2, NO.
3
the reportage is replete with clashes between rival cults groups, campus prostitution…. There
are also issues of admission racketeering, sometimes complete with business offices, and
sorting as the trading in grades between lecturers and students is known (Alubo, 2014). These
activities (Alubo, 2014) concluded put TEIs in bad light not just because of the malfeasance
which they represent but more because their presence raises basic questions about the raison
d’être of the TEIs.
What could definitely explain this bizarre situation in our public university system?
Could it be that the workers in these institutions do not perceive work in a positive light or do
not seen to derive self worth from their work? This paper therefore seeks to espouse the
implication of this supposedly poor work ethics among university workers on their ability to
achieve the tripartite mandate of teaching, research and community service. Most specifically,
it is also intended to find out whether such perceived poor work ethics have any impact on the
workers ability to render prescribed service to their major stakeholder (students) in term of
prompt release of results/transcripts. Also the study seeks to evaluate the extent to which the
Nigerian Public Universities adhere to official time table in terms of teaching and
administration of examination. Finally, to find out if there exists a relationship between
workers poor work ethics and the overall rating of Nigerian Public Universities.
1.1 Study area
The data reported here were obtained from a field survey on staff and students
perception of work ethics and service delivery in Nigerian Public Universities. The survey
was carried out in selected public universities in the south – south Geo-political Zone of
Nigeria (SSGPZN). The SSGPZN comprised of six states including Akwa Ibom, Bayelsa,
Cross River, Delta, Edo and Rivers (Agba, Ikoh, Ushie and Bassey, 2010). SSGPZN has a
total population of 21,014,655 (National Population Census, NPC, 2006) and occupies 85,303
square kilometers.
SSGPZN forms significant part of the Niger Delta Region of Nigeria and is one of the
commercial nerves of the country, providing over 90 percent of the Nations Foreign earning
(Ushie, Agba & Plang, 2015). The Zone is home to a number of public university (State and
Federal) with a huge workforce, a number of those who are working in these public
universities earn income that Agba and Ushie (2013) describes as starvation wages. This
largely explains the supposedly poor work attitude among workers in these institutions with
concomitant effect on service delivery.
PAGE 120| Journal of Corporate Governance, Insurance, and Risk Management | 2015, VOL. 2, NO.
3
Those owned by the Federal Government of Nigeria Include:
(i.) University of Calabar, Calabar, Cross River State.
(ii.) University of Uyo, Uyo, Akwa Ibom State.
(iii.) University of Port Harcourt, Port Harcourt, Rivers State.
(iv.) Federal University of Petroleum Resources, Effurun, Delta State.
(v.) Federal University, Otuoke, Bayelsa State.
The ones’ run solely by State Government in the region, however with subvention
from the Federal Government;
(i.) Cross River University of Technology, Calabar, Cross River State.
(ii.) Akwa Ibom State University.
(iii.) Delta State University, Abraka.
(iv.) River State University of Science and Technology
(v.) Niger Delta University, Bayelsa State. Thus, the sample for the study is
drawn from the huge population of staff and students in six of these
universities to access their perception of work ethics and service delivery
in these public universities.
2 LITERATURE REVIEW
A review of relevant literature on good work ethics and service delivery in the Nigeria
University System will serve as a usual background and theoretical perspective to this study.
Reeves (2015) maintained that defining the specifics of good work ethics is essentially a
subjective practice, but employers usually agree as to the characteristics of “good” work
ethics looked for in their employees. He defined personal ethics as moral objectives or values
that you believe in and practice as part of your life’s philosophy (Reeves, 2015). When it
comes to work, your ethics also encompass your overall attitude about work. Reeves sees
good work ethics as a person who shows up on time with the willingness to do what it takes to
get the job done without complain (Reeves, 2015). He presented some characteristics of
“good” work ethics to include: honesty, personal integrity, responsibility, optimism, self-
motivation and being a team player, commenting on personal integrity, Reeves (2015) say
that “a person with personal integrity is trustworthy”. He or she carries through with what
he/she promises. For instance, if he or she cannot meet a deadline because of other demands
that arise, he/she communicates this immediately to his or her supervisor. Personal integrity
PAGE 121| Journal of Corporate Governance, Insurance, and Risk Management | 2015, VOL. 2, NO.
3
also means that you don’t blame someone else or make excuses for what you didn’t do or
mistakes you have made.
Also Schreiner (2015) contended that “people who posses a strong work ethic embody
certain principles that guide their work behavior, leading them to produce high-quality work
consistently and without the prodding that some individuals require to stay on track”. Five of
such principles advanced by him include: reliability, dedication, productivity, cooperation and
character (Schreiner, 2015). According to Schreiner, (2015) reliability goes hand in hand with
a good work ethic. For instance, if individuals with a good work ethic say they are going to
attend a work function or arrive at a certain time, they do, as they value punctuality.
Individuals with a strong work ethic often want to appear dependable, showing their
employers that they are workers to whom they can turn. Because of this, he said, “they put
effort into portraying and proving this dependability by being reliable and performing
consistently (Schreiner, 2015).
In the view of Jenkins (2015) “a strong work ethic is vital to a company achieving its
goals”. According to him, certain factors come together to create a strong work ethic. These
include: integrity, sense of responsibility, emphasis on quality, discipline and sense of
teamwork. For instance Jenkins (2015) explained that an employee with a high sense of
teamwork helps a team meet its goals and deliver quality work. These employees respect their
peers and help where they can, making collaborations go smoother for the attainment of set
goals.
Strengthening service delivery in the University Educational System is a key strategy
to achieve its vision and mission as far as her obligation to the major stakeholders (students)
is concerned. Currently, the literature pertaining to service delivery/quality in the higher
education sector is significantly undeveloped (Beaumont, 2012). Traditionally, many
researchers have focused their efforts on commercial services (Sultan and Wong, 2010).
However, it is crystal clear that Nigerian public universities do not operates on ‘‘commercial
services”, it has because increasingly apparent that institutions operating in higher education
sector, previously not regarded as “profit making organizations”, are attempting to gain a
competitive advantage over their competition (Oldfield and Bren, 2000). As a result,
universities (especially public universities) must consider themselves as a “profit-making
organization” that is operating in a competitive market place.
PAGE 122| Journal of Corporate Governance, Insurance, and Risk Management | 2015, VOL. 2, NO.
3
In the light of the current economic climate, funding cuts and potential future
decreases in students’ numbers, Universities must realize that they are business entities,
competing for resources and students both in the local and international market (Paswan and
Ganesh, 2009). This means that University should be continually looking for appropriate
ways of gaining a competitive advantage. Accordingly, the higher education sector must
strive to deliver a high quality of service and satisfy its students, who some may term
‘participating customers’, to achieve sustainability in a competitive service environment. Like
Beaumont (2012) puts it, ‘‘universities can only be successful as long as their students are
being offered something that they wish to buy, at a quality they feel is acceptable”. The
students here are seen as raw material. Therefore, the core activities are structured to process,
sustain or change them to state that they become useful to the society. Are students really
getting these services in our university system today? What could be responsible for students’
inability to assess the required services?
There is no gain saying that Nigerian University System have in recent time faced
series of challenges ranging from poor infrastructures (Okebukola, 2002), mass exodus of
many brilliant lecturers (Akinnaso, 2012), inadequate funding and socio-political generated
tensions (Olujuwon, 2004). Akinnaso (2012) maintained that it is not poor funding alone that
has contributed to the present state of underachievement, but rather, the anti-intellectual
stance of corrupt and valueless federal and state governments since the days of the military
administration has also eroded ethical values and academic standards in the universities.
Olujuwon (2004) does not see universities performing the role they were set for, According to
him:
The tertiary institutions that are established to promote
intellectual excellence, good virtues etc. have deviated…the
majority of these institutions have misplaced their goals and
allowed social, political factors of their environment to create
crisis in their academic community (Olujuwon, 2004 p. 6).
A combination of these problems Akinnaso (2012) contended, “have led to the weakening of
university administration; poor teaching and learning outcomes; diminishing research and
consultancy traditions; and questionable service to the community”.
Another dimension of the problem affecting service delivery in the university system
is the poor or near absence of record keeping. This scenario in turn affects preparation and

PAGE 123| Journal of Corporate Governance, Insurance, and Risk Management | 2015, VOL. 2, NO.
3
release of results and transcripts. Alubo (2014) for instance decry the spite of poor record
keeping in Tertiary Educational Institutions (TEIs) when he said; “in most TEIs records are
poorly kept such that the issuance of academic transcript is a tug of war”. He lamented many
instances in which students wait months and years for transcripts which may never be issued.
The challenges according to him relate to the analogue system of records keeping, poor work
attitude and muddled up filing system, (Alubo, 2014).
In the face of these challenges, one would like to find out whether the students or
graduates of our universities are actually benefiting from a robust education and training
programmes to prepare them for work and life. In fact, have the universities been able to
achieve their tripartite mandate of teaching, research and community service? These and
many more is what this research paper seeks to unravel.
2.1 Theoretical perspective
The theoretical framework adopted for this study is basically the person - situational
perspective to explain workplace behaviour. Significant research endeavours on workplace
ethics have focused on the long standing “person-situation” debate (Allport, 1937; Mischel,
1968 and Baker, Hunt and Andrews, 2006). Those who are inclined to the individual (person)
difference perspective believe that one’s values, motives and traits determine ethical behavior.
In the same vein, those who are inclined to the situational perspective maintain that the
characteristics of the situation or organizational environment account for variances in ethical
behavior. For instance study conducted by Stanley Milgram on obedience that used fake
electric shocks to study how people react to being asked to cause harm to others (Milgram
Experiment), found correlations of situations and behaviors to be around .40. Moreover
survey studies that compare the effects of situational variables on behavior show that the
correlation between situation and behavior are also around the .30-.40 range (Epstein and
O’Brien, 1985).
What can be logically inferred from the above is that a combination of individual
attitude which has to do with his feelings, habit and beliefs couple with the cultural
background of the worker affects his ethical behavior. That is, the way and manner the worker
in the Nigerian University System behaves is a function of a given situation. Also, the value
system of the individual worker in relation to the organizational environment and job
requirements can positively or negatively affect the individual’s behavior to work. For
instance, if a worker in the Nigerian Public University System holds a negative orientation

PAGE 124| Journal of Corporate Governance, Insurance, and Risk Management | 2015, VOL. 2, NO.
3
about the university environment in which he/she work, it will most likely affects his/her job
performance and therefore service delivery. In other words, work attitude affects the way and
manner a worker relates to, conceives and view his/her job.
3 METHODOLOGY
Survey design was adopted for this study; it was opted for because it is cheap as
compared to other research design. It allows for objectivity and the sampling of opinions for
workers. It allows for rational and objective establishment of relationships among variables.
Agba et al (2010) observe that survey design samples allows for proper elucidation of
respondents feelings, attitude and opinions over a given phenomenon. The study gathered
information from purposively selected respondents from public universities in the Zone.
Participants were selected from among the staff and students in six of the public universities
with homogenous characteristics. Purposive method was used to select 660 staff and 300
students respectively.
Data was elicited from respondents using structured questionnaire, different
questionnaire was used for staff (teaching and non-teaching) and students, the questionnaire
was divided into two sections. Section A elicited the demographic data of respondents while
Section B was used to collect data on workers perception of work ethics and service delivery
in Nigeria Public Universities. Cronbach alpha reliability procedure was used in establishing
the reliability of each of the sub-scale in the two instruments. Cronbach alpha reliability is one
of the methods of measuring internal consistency. It depicts the degree to which the items in
the instrument are internally consistent in measuring the variables of interest. The derived
values ranged from .59 to .825. The Data elicited from respondents were coded for various
response options as shown in Table 1.
Table 1: Coding of Variables
Response Option Positive Negative
Strongly agree (SA) 4 1
Agree (A) 3 2
Disagree (D) 2 2
Strongly disagree (SD) 1 4
Source: Kerlinger and Lee (2000)

PAGE 125| Journal of Corporate Governance, Insurance, and Risk Management | 2015, VOL. 2, NO.
3
As noted in Table 1, Positive response to a positive question is ranked highest (4), that is, for
strongly agree (SD). While negative response to negative answer received the highest score of
four (4) for strongly disagree. Other score follows the same sequence
3.1 Research hypothesis
The following hypotheses were derived from the afore mentioned objectives of the study.
1. Work ethics among workers in public university is not significantly high
2. There is no significant relationship between workers work ethics and the delivery of
service in terms of prompt release of students results/transcripts in Public Universities.
3. Adhering to time table does not significantly relates to work ethics of workers in
public universities.
4 RESULTS AND DISCUSSION
Hypothesis one
Work ethics among workers in public university is not significantly high. There is only one
variable in this hypothesis, therefor population t-test was employed to test this hypothesis at p
<.05, the result is presented in table 2.
Table 2: Population t-test of Work ethics among workers
Variable N Df Mean SD t-value Sig.
Sample mean 660 659 26.97 2.92
180.918
.000
Population mean 25.00
Population mean is calculated thus (4+3+2+1) x 10 / 4 = 25.00
Source: Data from fieldwork
The result presented in Table 2 is to assess Work ethics among workers. The sample
mean of 26.97 is greater than the population mean of 25.00 at p <.05; df = 659. By this result
the null hypothesis is rejected while the alternate hypothesis is upheld. It can be inferred that
workers in public universities work ethics is statistically significantly high. This result
collaborate Jenkins (2015) who asserted that a strong work ethic is vital to a company
achieving its goals. According to him, certain factors come together to create a strong work
ethic. These include: integrity, sense of responsibility, emphasis on quality, discipline and
sense of teamwork, and all these and many more is exhibited by staff (teaching and non-
teaching) in the universities sampled.
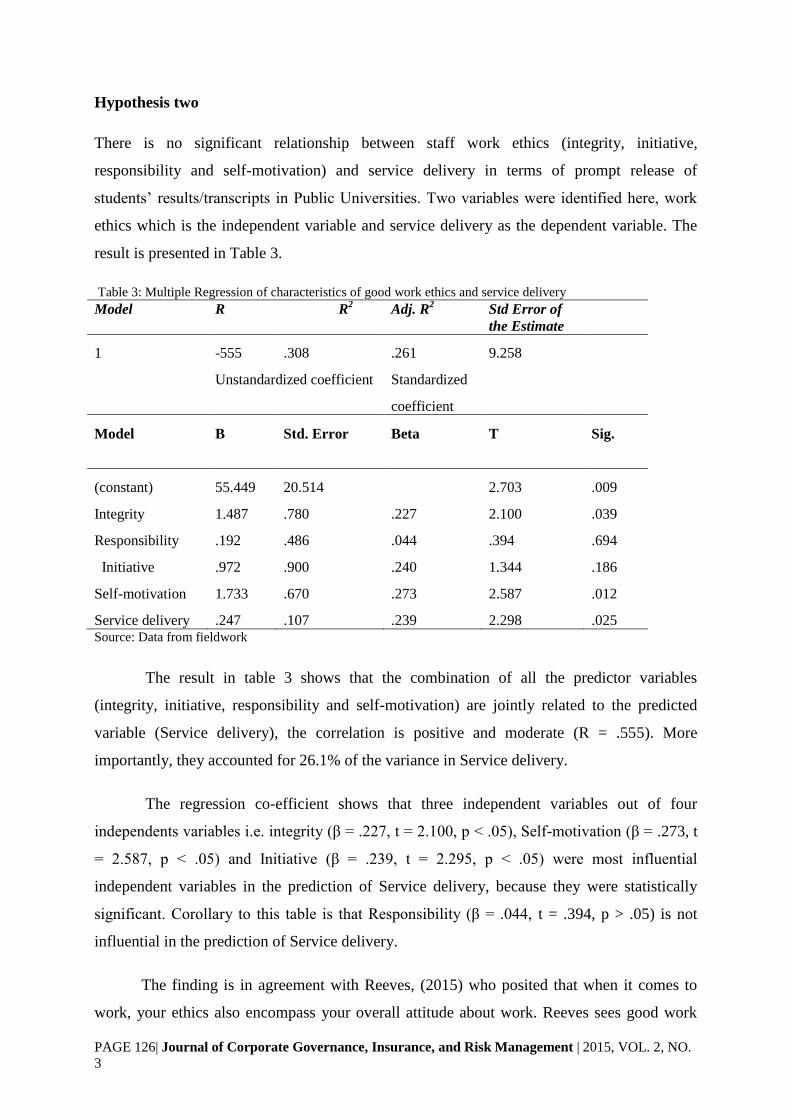
PAGE 126| Journal of Corporate Governance, Insurance, and Risk Management | 2015, VOL. 2, NO.
3
Hypothesis two
There is no significant relationship between staff work ethics (integrity, initiative,
responsibility and self-motivation) and service delivery in terms of prompt release of
students’ results/transcripts in Public Universities. Two variables were identified here, work
ethics which is the independent variable and service delivery as the dependent variable. The
result is presented in Table 3.
Table 3: Multiple Regression of characteristics of good work ethics and service delivery
Model R R2 Adj. R
2 Std Error of
the Estimate
1 -555 .308 .261 9.258
Unstandardized coefficient Standardized
coefficient
Model B
Std. Error Beta T Sig.
(constant) 55.449 20.514 2.703 .009
Integrity 1.487 .780 .227 2.100 .039
Responsibility .192 .486 .044 .394 .694
Initiative .972 .900 .240 1.344 .186
Self-motivation 1.733 .670 .273 2.587 .012
Service delivery .247 .107 .239 2.298 .025 Source: Data from fieldwork
The result in table 3 shows that the combination of all the predictor variables
(integrity, initiative, responsibility and self-motivation) are jointly related to the predicted
variable (Service delivery), the correlation is positive and moderate (R = .555). More
importantly, they accounted for 26.1% of the variance in Service delivery.
The regression co-efficient shows that three independent variables out of four
independents variables i.e. integrity (β = .227, t = 2.100, p < .05), Self-motivation (β = .273, t
= 2.587, p < .05) and Initiative (β = .239, t = 2.295, p < .05) were most influential
independent variables in the prediction of Service delivery, because they were statistically
significant. Corollary to this table is that Responsibility (β = .044, t = .394, p > .05) is not
influential in the prediction of Service delivery.
The finding is in agreement with Reeves, (2015) who posited that when it comes to
work, your ethics also encompass your overall attitude about work. Reeves sees good work

PAGE 127| Journal of Corporate Governance, Insurance, and Risk Management | 2015, VOL. 2, NO.
3
ethics as a person who shows up on time with the willingness to do what it takes to get the job
done without complain. He presented some characteristics of “good” work ethics to include:
honesty, personal integrity, responsibility, optimism, self-motivation and being a team player.
Also with regards to prompt release of result the study also confirms Alubo (2014) who
reported the spite of poor record keeping in Tertiary Educational Institutions (TEIs) when he
said; “in more TEIs records are poorly kept such that the issuance of academic transcript is a
tug of war”. He lamented many instances in which students wait months and years for
transcripts which may never be issued. The challenges according to him relate to the analogue
system of records keeping, poor work attitude and muddled up filling system. This to a large
extent is responsible for the poor service delivery witnessed in most of the public universities.
Hypothesis three
Adhering to time table does not significantly affect service delivery among workers in public
universities. Two variables were identified here. Staff adhering to time table which is the
independent variable and service delivery as the dependent variable. The result is presented in
Table 4.
Table 4: Pearson product moment correlation of staff adhering to time table and service delivery
Variables N Mean SD r-value Sig.
Staff adhering to time table 960 14.73 2.52
-0.693
.000
Service delivery 960 24.50 3.80
*significant at P < .05; critical r-value = 0.138; df = 958.
Source: Data from fieldwork
Pearson product moment correlation analysis was employed to investigate the
relationship between staff adhering to time table and service delivery. As presented in Table 3
the calculated r-value of -0.693 is greater than the critical r-value of 0.138 with 958 degree of
freedom, this result therefore implies that, the null hypothesis is rejected. It therefore mean
that staff adhering to time table statistically significantly affects service delivery among
workers in public universities. The negative correlation value shows that while one variable is
increasing (not adhering to time table) the other variable is decreasing (service delivery). The
finding lends credence to Schreiner, (2015) assertion that reliability goes hand in hand with a
good work ethic. For instance, if individuals with a good work ethic say they are going to
attend a work function or arrive at a certain time, they do, as they value punctuality.
Individuals with a strong work ethic often want to appear dependable, showing their

PAGE 128| Journal of Corporate Governance, Insurance, and Risk Management | 2015, VOL. 2, NO.
3
employers that they are workers to whom they can turn. Because of this, he said, “they put
effort into portraying… and proving...this dependability by being reliable and performing
consistently. A cursory look at the work environment in our public universities depicts a very
poor work ethics among staff in these institutions. For instance, both teaching and non-
teaching staff (including management) are often used to observing what is called “African
Time” in carrying out their daily work assignment with concomitant negative implication on
their overall performance and therefore service delivery.
5 CONCLUSION
It can be concluded that good work ethics can be achieved only with dedicated and
committed leadership. The public universities in Nigeria are faced with series of challenges
ranging from poor infrastructures, mass exodus of many brilliant lecturers, inadequate
funding and socio-political generated tensions, anti-intellectual stance of corrupt and
valueless federal and state governments among others has eroded ethical values and
academic standards in the universities. It is therefore suggested that federal institutions must
put in place mechanism that encourages good work ethics. Leadership in Nigeria public
university should be people-centered. This is because human are central in the university
system and the focus is on service rather than product and therefore the students should be
seen as raw materials. In addition staff should be encourage to imbue the culture of creative
thinking (initiative) and learn to speak with one voice. Further more in other to promote best
practices management should encourage and motivate staff to fully realize their potentials
and contribute positively to service delivery in our public universities. Finally, there should
be flexible service delivery so as to help universities deliver and sustain transformational
change and improvement, including real efficiency savings as well as other measurable
strategic and educational value through the streamlined flexible provision of administrative
and students services.
PAGE 129| Journal of Corporate Governance, Insurance, and Risk Management | 2015, VOL. 2, NO.
3
References
Abga, A. M. O. & Ushie, E. M. (2013). Wage differentials and industrial disputes in
Nigeria Hospitals. IOSR journal of Business and Management. 11 (5), 01-12.
Abga, A. M. O., Ikoh, M., Ushie, E. M. & Bassey, A. O. (2010). Telecommunication
Revolution: Implication on criminality and family crises in the South-south
states of Nigeria. International Journal of Computer and Information Science,
3 (1) 42 – 51.
Akinnaso, N. (2012). University Education in Nigeria: problems and solutions. Punch,
March 13, 2012.
Allport, G. W. (1937). Personality; A psychological interpretation. New York: H.Holt
and Company.
Alubo, O. (2004) Transparency, accountability and ethical values in the management
of Nigeria tertiary educational institutions. Journal of Social Issues, 7 (1) 1 –
17.
Aluko, M. A. O. (2008). Major concepts in the study of work behaviour. In Olakunle
A. Ounbameru & Oribabor, E. P. (eds.), Industrial Sociology. Ibadan:
Penthouse publications (Nig)
Baker, T. L., Hunt, T. G. & Andrews, M. C. (2006) promoting ethical behavior and
organizational citizenship behaviours: the influence of corporate ethical values.
Journal of Business and Research, 59 (2006) 849 – 857.
Beaumont, D. J. (2012). Service Quality in higher education: the students’ viewpoint.
A dissertation submitted to the University of Manchester for the degree of
Bachelor of Science in the Faculty of Humanities (ug
handbook.portals.mbs.ac.uk)
Epstein, S. & O’Brien, E. J. (1985). The person-situation Debate in Historical and
current perspective. Psychological Bulletin, 98 (3), 513 -537.
Gidens, A. (2009). Sociology (6th
edition) UK: polity press.
Kerlinger, F. N. & Lee, H. B. (2000). Foundations of behavioural research (4th
edition). New York: Wadsworth Publisher.
Milgram, S. (1975). Obedience to authority. New York: Harper & Row.
Mischel, W. (1968). Personality and assessment. New York: Wiley.
Okebukola, P. (2002). The status of university education in Nigeria. National
University Commission, Abuja, Nigeria.
Okoh, A. O. (2003). Enhancing productivity through improved work attitude in the
new millennium. Enterprise, 5 (1). 1 – 13.
Okojie, J. (2013). Quality Assurance and the challenges of mandate delivery in
Nigerian Universities. Being convocation lecture presented during the 18th
convocation of Lagos State University, Lagos, Nigeria. February 19, 2013.

PAGE 130| Journal of Corporate Governance, Insurance, and Risk Management | 2015, VOL. 2, NO.
3
Oldfield, B. M. & Bren, S. (2000). Students perceptions of service quality in Uk
university business and management faculty. Quality assurance in Education,
8 (2), 85 -95
Olujawon, O. T. (2004). Education in Nigeria: a futuristic perspective. Central
Educational Service, Lagos Nigeria.
Paswan, A. & Ganesh, G. (2009). Higher education institutes: satisfaction and loyalty
among international students. Journal of Marketing for Higher Education, 19
(1), 65 – 84.
Poppola, D. (1986). Nigeria workers and work Ethics. In Damachi G. U. and
Fashoyin T. (eds.) Contemporary problems in Nigerian Industrial Relations.
Lagos; Development Press Limited.
Reeves, L. (2015). What are good work ethics? Online available at:
http://woman.thenest.com/good-work-ethics-2725.html (retrieved 5/03/2015)
Schreiner, E. (2015). Five characteristics of a good work ethics. Online available at:
http://smallbusiness.hron.com/five-characteristics-geo-work-ethic. (retrieved
5/03/15)
Sultan, P., & Wong, H. Y. (2010) Service quality in Higher Education- a review and
research agenda. International Journal of Quality and Service Sciences, 2 (2),
259 – 272.
Ushie, E. M., Agba, A. M. O. & Plang, J. P. (2015). Determinants of moonlighting
among Nigeria workers: A within and external comparative analysis.
Australian Journal of Humanities and Social Studies, 02(1)21 – 39.
Pages 131-147
PAGE 131| Journal of Corporate Governance, Insurance, and Risk Management | 2015, VOL. 2, NO.
3
Journal of Corporate Governance, Insurance, and Risk Management (JCGIRM)
2015, Volume 2, Series 3
EMPIRICAL ANALYSIS OF BANK RECAPITATLISATION IN
NIGERIA (1986-2011)
Imahe Godfreya,*
,
a College of Education, Igueben, Edo State, Nigeria
A B S T R A C T A R T I C L E I N F O
In 1986, Nigeria introduced a structural adjustment programme (SAP) and
one of the policy implications of the programme was the deregulation of
the economy. And so the banking sector was also deregulated. This led to
sudden increase in the number of banks. However, distress soon hit the
financial sector of the economy. In order to avoid the bitter consequences
of bank failure, the government established the Nigeria Deposit Insurance
Corporation (NDIC) to augment the regulatory power of Central Bank of
Nigeria (CBN) as a watch dog over banks and ensure stable, safe and
sound system of the banking sector. Various attempts aimed at revamping
the banking sector, ranging from recapitalization to outright liquidation
failed.In July 2004, a new method aimed at salvaging the banking sector
was announced by the CBN. This method includes banking sector reform
and bank consolidation. The main thrust of this study is to examine the
impact of consolidation on Nigeria economy. To achieve this, SPSS
Version 19 econometric software package regression method was adopted.
The ordinary least squares (OLS) analytical technique was applied to
estimate the empirical relationship between the dependent and
independent variables. The study also carried out chow test in order to
determine the structural stability of the regression. The study revealed that
Nigeria bank consolidation has not impacted significantly on Nigeria’s
economic growth under the study period. The study therefore
recommended that banking regulations such as bank consolidation needs
to be a component of total reform framework of monetary authority to
ensure effectiveness in Nigeria banking sector performance.
Keywords:
Bank Recapitalization, Nigeria
*Corresponding author:
(Imahe Godfrey)
Article history:
Article Submitted 14-04-2015
Article Accepted 20-06-2015
**Article previously published in
EJEM 2015, vol 2, No. 3
1. INTRODUCTION
The banking sector is the nerve Centre of any modern economy, being the repository of
people’s wealth and supplier of credit which lubricates the engine of growth of the entire
economic system. However, the lingering problem of bank distress and its attendant effects
had remain one of the most disturbing features of the Nigeria banking sector in recent times.
While concerted efforts are being made to address the menace, the magnitude and depth of
distress in the system has remained an issue of concern to the government, the regulatory
authorities, bankers as well as the general public.

PAGE 132| Journal of Corporate Governance, Insurance, and Risk Management | 2015, VOL. 2, NO.
3
Although these reforms efforts in the banking sector have been acclaimed to be
necessary for Nigeria’s economic growth, the Nigerian financial sector is still being
characterized by low mobilization of savings to the real sector of the economy (Balogun,
2007). However, this study intends to examine the impact of bank consolidation on the
Nigerian economy.
Conceptual issues
It is pertinent at this juncture to explore the relevant concepts which underpin this study in
what follows below. This is with a view to clearly demonstrating their referents in the study.
(a) Bank Recapitalization
Several methods had been prescribed for the arrest of the distress syndrome that
pervaded the Nigerian banking industry. In 1997, Federal Government budget seemed to have
directed that every commercial and merchant banks to beef up its paid up share capital to
N500 million not later than 31st December 1998, the objective was to achieve recapitulation
of banks as one of the method prescribed for the arrest of widespread distress in the Nigeria
banking industries.Maduka and Onwuka (2013) opined that financial reforms in Nigeria dates
back to 1952, when the Banking Ordinances was enacted. At the inception of the 1987
financial reforms, the banking system was highly repressed. According to Emenuga (2005)
interest rate controls, selective credit guidelines, exchange rate regulations, ceiling on credit
expansion and use of reserve requirements and otherdirect monetary control instruments
characterized the reforms. Entry into the banking system was also restricted.
Consequently, the reform package of this era was to dismantle the regulation of
interest rates, introduce liberalization and the establishment of a market based autonomous
foreign exchange market, among others.
Maduka and Onwuka (2013) asserted that this reform was also introduced to enable
Nigerian banks to become active domestic and global players in the financial markets.
(b) Consolidation and Convergence
To consolidate is to make solid or strong. According to new English Oxford
dictionary, it means solidification, making solid or strong.According to Iganiga and France
(2006), consolidation and convergence are interrelated since they are both achieved through
mergers and acquisition. A merger is the combination of two or more separate firms into a
simple firm, the resulting firm taking either acquire or new identity; while acquisition on the
other hand takes place where a company takes over the controlling shareholding interests of
another with two separate companies evolving at the end. The target company either becomes
a division or subsidiary of the acquiring company.Bank consolidation is viewed as the
reduction in the number of banks and other deposit taking institutions with a simultaneous
increase in size and concentration of the consolidated entities in the sector (BIS 2001). It is
mostly motivated by technological innovations, deregulation of financial services enhancing

PAGE 133| Journal of Corporate Governance, Insurance, and Risk Management | 2015, VOL. 2, NO.
3
intermediation and increase emphasis on shareholders’ value, privatization and international
competition (Berger et al 1999 and De Nicolo et al 2003).Berger (1998) differentiated
consolidation from convergence, while consolidation involves mergers and acquisition
between/among ‘same’ forms e.g. banks, convergence involve the consolidation of similar
firms like banks and other financial institutions. A “newer” concept of consolidation views
bank merger as not just about adjusting inputs to affect costs but also involves adjusting input
(product mixes) to enhance revenues.
(c) Conclusion
This study is carried out to assess the impact of bank consolidation on a developing economy.
That is to examine whether bank consolidation has worsened competition in Nigeria.
2. METHOD OF DATA ANALYSIS
The research techniques adopted for this study is the ordinary least squares (OLS) analytical
techniques which was used to estimate the empirical relationship between the dependent and
independent variables. The stability of the parameter was also carried out using Chow test.
Model Specification:
The model of the study considering pre consolidation (1986-2003), consolidation (2004-
2008) and the pool period (1986-2011) bearing in mind the objectives of the study, we
specify our model thus:
LGDP = a0 + a1Log M2/GDP + a2LogINR + a3LogCRR + a4LogTNB + a5LogBC +
a6LogCPS + U.
A prior expectation: a1>0, a2<0, a3<0, a4>0, a5>0, and a6>0.
Where:
GDP = Growth in real gross domestic products
M2/GDP = Ratio of broad money to gross domestic product (Financial deepening)
INR = Interest rate margin
CRR = Cash reserve ratio
TNB = Total numbers of Banks
BC = Bank Consolidation (proxy by financial bank capitalization)
CPS = Credit to private sectors
U = Error term

PAGE 134| Journal of Corporate Governance, Insurance, and Risk Management | 2015, VOL. 2, NO.
3
3. DATA PRESENTATION
Annual time series data for the period 1986 to 2011 were employed for the empirical
analysis. The time frame is divided into three periods that is pre – bank consolidation 1986 to
2003, bank consolidation period 2004 to 2008 and the pool period 1986 to2011. These data
reflect the variables in the model specified in chapter three. The data fitted into the model are
shown in the table below.
Table 4.1: GDP and Financial Indicators
YEARS GDP
N’M
INT
(%)
CPS
N’M
M2/GDP
(%)
TNB CRR
(%)
BC
N’M
1986 69147 10.5 18299.9 39.6 29 1.7 6794.8
1987 105222.8 17.5 21892.5 32 34 1.4 8297.6
1988 139085.3 16.5 25472.5 32.7 42 2.1 10020.8
1989 216797.5 26.8 29643.9 21.7 47 2.9 12848.6
1990 267550 25.5 35436.6 25.7 58 2.9 16358.4
1991 312139.7 20.01 42079 28 65 2.9 23125.0
1992 532613.8 29.8 79958.9 24.2 65 4.4 31272.6
1993 683869.8 18.32 95529.7 29 66 6 47436.1
1994 899863.2 21 151000.3 29.7 65 5.7 663680
1995 1933212 20.81 211358.6 16.5 64 5.8 180305.1
1996 2702719 19.74 260613.5 13.7 64 7.5 281815.8
1997 2,801,973 13.54 319512.2 15.3 64 7.8 281887.2
1998 2708430 18.29 372574.1 19.4 54 8.3 262517.3
1999 3194015 21.32 455205.2 21.9 54 11.7 300041.1
2000 4582127 17.98 596001.5 22.6 54 9.8 472290.0
2001 4725086 18.29 854999.3 27.8 90 10.8 662561.3
2002 6912381 24.4 955765.1 23.1 90 10.6 764975.8
2003 8487032 20.48 1211993 23.4 90 10 1359274.2
2004 11411067 19.15 1534448 19.8 89 8.6 2112549.6
2005 14572239 17.85 20073356 19.3 25 9.7 2900062.1
2006 18564595 17.95 2650822 21.7 25 2.6 5120000
2007 2065,251 16.94 5056721 28.1 25 2.8 13294059
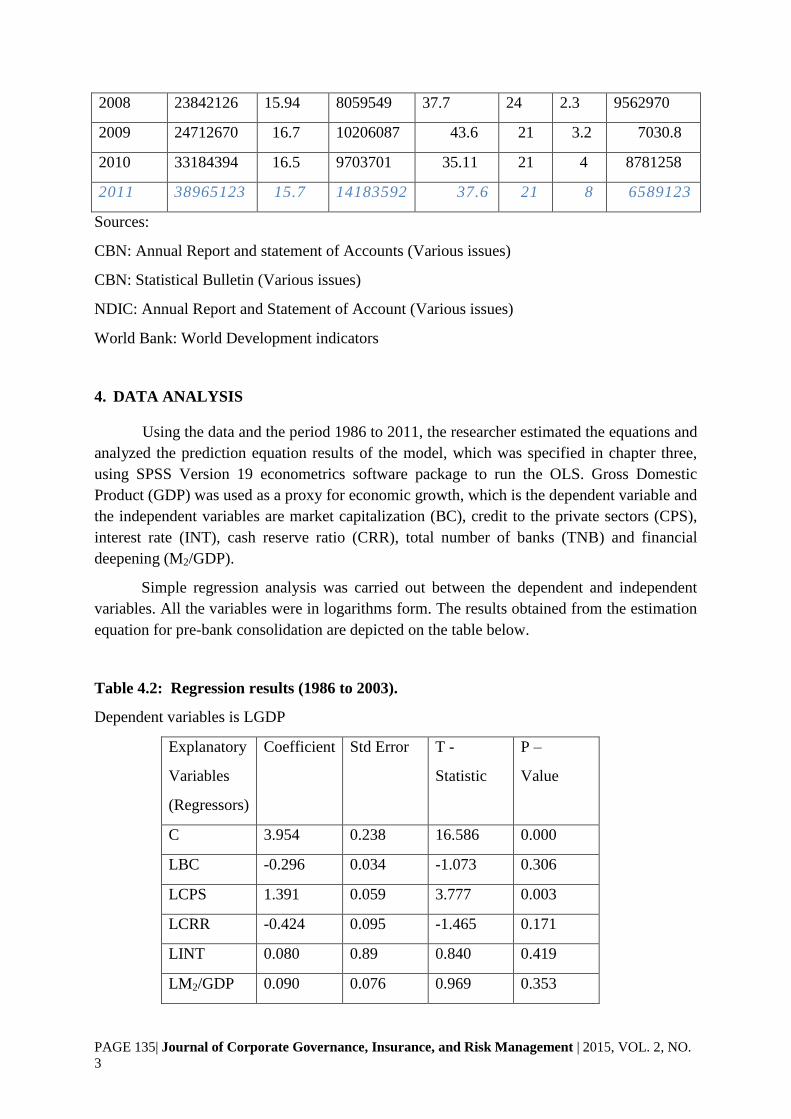
PAGE 135| Journal of Corporate Governance, Insurance, and Risk Management | 2015, VOL. 2, NO.
3
2008 23842126 15.94 8059549 37.7 24 2.3 9562970
2009 24712670 16.7 10206087 43.6 21 3.2 7030.8
2010 33184394 16.5 9703701 35.11 21 4 8781258
2011 38965123 15.7 14183592 37.6 21 8 6589123
Sources:
CBN: Annual Report and statement of Accounts (Various issues)
CBN: Statistical Bulletin (Various issues)
NDIC: Annual Report and Statement of Account (Various issues)
World Bank: World Development indicators
4. DATA ANALYSIS
Using the data and the period 1986 to 2011, the researcher estimated the equations and
analyzed the prediction equation results of the model, which was specified in chapter three,
using SPSS Version 19 econometrics software package to run the OLS. Gross Domestic
Product (GDP) was used as a proxy for economic growth, which is the dependent variable and
the independent variables are market capitalization (BC), credit to the private sectors (CPS),
interest rate (INT), cash reserve ratio (CRR), total number of banks (TNB) and financial
deepening (M2/GDP).
Simple regression analysis was carried out between the dependent and independent
variables. All the variables were in logarithms form. The results obtained from the estimation
equation for pre-bank consolidation are depicted on the table below.
Table 4.2: Regression results (1986 to 2003).
Dependent variables is LGDP
Explanatory
Variables
(Regressors)
Coefficient Std Error T -
Statistic
P –
Value
C 3.954 0.238 16.586 0.000
LBC -0.296 0.034 -1.073 0.306
LCPS 1.391 0.059 3.777 0.003
LCRR -0.424 0.095 -1.465 0.171
LINT 0.080 0.89 0.840 0.419
LM2/GDP 0.090 0.076 0.969 0.353

PAGE 136| Journal of Corporate Governance, Insurance, and Risk Management | 2015, VOL. 2, NO.
3
LTNB 0.345 0.105 2.429 0.033
R – Squard = 0.939
Adjusted R – squard = 0.906
F – Statistic = 28.399
Prob. (F-Statistics) = 0.000
Durbin – Watson statistic = 1.659
RSS1 = 0.10
DF = 11
The regression results show a negative relationship between Gross Domestic Product and
market capitalization. The result does not conform to the a priori expectation. The value of the
coefficient LBC is -0.296. This implies that 1 percent increase in Bank consolidation will lead
to 0.296 percent decrease in economic growth when other factors are held constant. The
variable was not statistically significant at 10 percent level since the T – statistic calculated
value of 1.073 is less than the T – statistic value of 1.796. Therefore, we accept the null
hypothesis that market capitalization has no significant impact on economic growth in
Nigeria. Under capitalization has not promotes economic growth during the pre-banking
consolidation.
The coefficient of credit to the private sector (LCPS) is positively signed. This
indicates that a direct relationship exists between credit to the private sector and economic
growth. This is in line with the a priori expectation. The value of the coefficient is 1.391. This
implies that 1 percent increase in credit to the private sector will lead to 1.391 percent
increase in economic growth, when other factors are held constant. The variable LCPs was
also statistically significant at 1 percent level of significant, since the T – statistic calculated
value of 3.777 is greater than the T-statistic table value of 3.106. Therefore, we accept the
alternate hypothesis that financial bank credit to the private sector has a significant impact on
economic growth during the pre-consolidation period. This implies that credit to the private
sector has the potential to grow the Nigeria economy during the pre-consolidation all things
being equal.
The coefficient of cash reserve ratio (LCRR) is -0.424. This implies that an inverse
relationship exists between cash reserve ratio and economic growth. This is in line with the a
priori expectation such that 1 percent increase in CRR will lead to 0.424 percent decrease in
economic growth, when other factors are held constant. The variable CRR was not
statistically significant at any level. So, we accept the null hypothesis that cash reserve ratio
has no significant impact on economic growth in Nigeria under the reference period. This
result indicates that increase in cash reserve ratio is used by the monetary authority to curtail
the amount of loans that the banks can make and hence negatively affects economic growth
during the pre-consolidation period.

PAGE 137| Journal of Corporate Governance, Insurance, and Risk Management | 2015, VOL. 2, NO.
3
The coefficient of interest rate (LINT) is 0.080. This indicates that direct relationship
exists between interest rate and economic growth. This is not consistent to the a priori
expectation hence 1 percent increase in interest rate will lead to 0.080 percent increase in
economic growth when other variables are held constant. The variable LINT was not
statistically significant at any level. Hence, we accept the null hypothesis that interest rate has
no significant impact on economic growth in Nigeria during the pre-consolidation. The non-
significance of this variable is as a result of structural inefficiencies, market imperfections or
government interference in the interaction of market forces that characterized the Nigerian
money market during the pre-consolidation period.
The regression result shows that positive relationship exists between financial
deepening and economic growth. This is consistent to the apriori expectation. The value of the
coefficient of financial deepening (LM2/GDP) is 0.090. This implies that 1 percent increase in
financial deepening will lead to 0.090 percent increase in economic growth. The variable was
not statistically significant at level of significance with t-statistic calculated value of 0.969
which is less than t-statistic table of 1.796. Therefore, we accept the null hypothesis that
financial deepening has no significant impact on economic growth in Nigeria during the pre-
consolidation period. This result indicates that financial development does not enhance
growth in the Nigerian economy pro the consolidation.
The regression result shows that a positive relationship exists between total number of
banks and economic growth. This is consistent to the a priori expectation. The coefficient of
total number of bank (LTNB) is 0.345. This implies that 1 percent increase in LTNB will lead
to 0.345 percent increase in economic growth when other factors are held constant. The
variable was also statistically significant 5% percent level of significance with a t – statistic
calculated value of 2.429 which is greater than t-statistic table value of 2.201. Thus, we accept
the alternate hypothesis that total number of banks has a significant impact on economic
growth in Nigeria.
The coefficient of determination (R2) from our results is given as 0.939. This implies
that 94 percent of the variation in Nigeria economic growth is accounted for by the included
explanatory variables during pre-bank consolidation while 6 percent is unexplained due to
error terms. The adjusted coefficient of determination (R-2
) is given as 0.906. The means that
precisely 91 percent of the variations in economic growth of Nigeria are accounted for by the
included variables after the co-efficient of determination is been adjusted to make it intensive
to the number of included variables while 9 percent is unaccounted for due to error terms.
Also the statistical test for joint significance of the parameter estimate (i.e. F statistic)
using 95% confidence interval and 6, 11 degree of freedom gives the figure 3.09 from the
statistical table. And since the calculated F – statistics from our result gives 28.393, which is
higher than that from the table, we reject the null hypothesis and accept the alternate
hypothesis, concluding that the joint influence of all included explanatory variables is
significant and therefore cannot be ignored in explaining economic growth in Nigeria.
The D.W statistic value 1.659 indicates absence of auto-correlation in the analysis,
which means that the estimate is unbiased, consistent and reliable for prediction and policy
formulation.

PAGE 138| Journal of Corporate Governance, Insurance, and Risk Management | 2015, VOL. 2, NO.
3
In summary, based on the above, it can be deducted that consistent with the
hypothesized relations, credit to the private sector and total number of banks are some of the
significant financial indicators that determine economic growth in Nigeria during the pre-
bank consolidation period.
The results obtained from the estimation equation for bank consolidation are depicted
in the table below.

PAGE 139| Journal of Corporate Governance, Insurance, and Risk Management | 2015, VOL. 2, NO.
3
Table 4.3: Regression results (1986-2011).
Dependent variables is LGDP
Explanatory
Variables
(Regressor)
Coefficient
Std
Error
T –
Statistics
P –
Value
C 30.375 44.681 0.680 0.567
LBC 0.231 0.353 0.571 0.626
LCPS 1.024 1.936 1.073 0.396
LCRR 1.067 1.966 1.771 0.219
LINT -0.379 24.559 -0.356 0.756
LM2/GDP 0.655 4.064 1.041 0.407
LTNB 1.289 3.321 1.295 0.325
R – Squared = 0.857
Adjusted R – Squared = 0.426
F – Statistic = 1.990
Prob. (F - Statistics) = 0.370
Durbin – Watson statistic = 2.356
RSS2 = 0.876
DF = 2 (DF = N – K, Where N = No of observation and K explanatory variable).
The regression results show a positive relationship between Gross Domestic Product and
market capitalization. The result conforms to the a priori expectation. The value of the
coefficient LBC is 0.231. This implies that 1 percent increase in Bank consolidation will lead
to 0.231 percent increase in economic growth when other factors are held constant. The
variable was not statistically significant at 10 percent level of significant since the T – statistic
calculated value of 0.571 is less than the T – statistic value of 1.796. Therefore, we accept the
null hypothesis that market capitalization has no significant impact on economic growth in
Nigeria under the bank consolidation period. The result indicates that increased in market
capitalization has not promotes economic growth during the banking consolidation but the
positive nature of the variable means that it has the tendency to grow the Nigeria economy.
The coefficient of credit to the private sector (LCPS) is positively signed. This
indicates that a direct relationship exists between credit to the private sector and economic
growth. This is in line with the a priori expectation. The value of the coefficient is 1.024. This
implies that 1 percent increase in credit to the private sector will lead to 1.024 percent
increase in economic growth, when other factors are held constant. The variable was not
statistically significant at 10 percent level of significance since the T-statistic calculated value
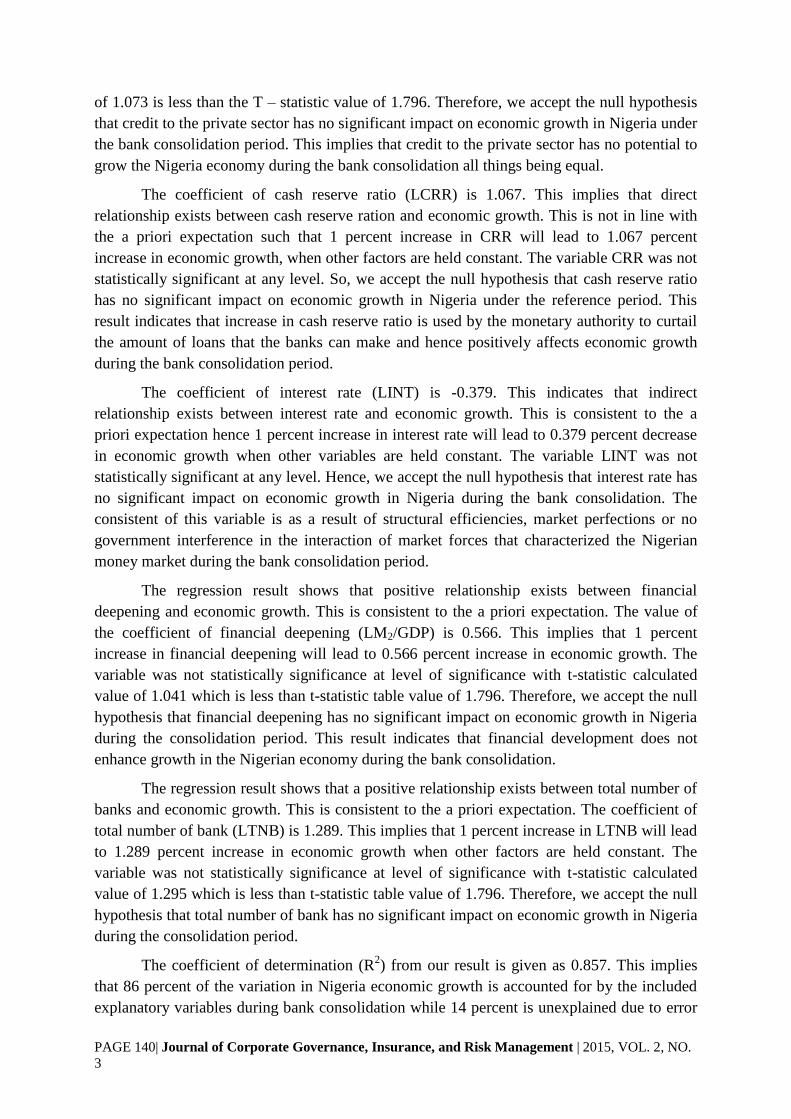
PAGE 140| Journal of Corporate Governance, Insurance, and Risk Management | 2015, VOL. 2, NO.
3
of 1.073 is less than the T – statistic value of 1.796. Therefore, we accept the null hypothesis
that credit to the private sector has no significant impact on economic growth in Nigeria under
the bank consolidation period. This implies that credit to the private sector has no potential to
grow the Nigeria economy during the bank consolidation all things being equal.
The coefficient of cash reserve ratio (LCRR) is 1.067. This implies that direct
relationship exists between cash reserve ration and economic growth. This is not in line with
the a priori expectation such that 1 percent increase in CRR will lead to 1.067 percent
increase in economic growth, when other factors are held constant. The variable CRR was not
statistically significant at any level. So, we accept the null hypothesis that cash reserve ratio
has no significant impact on economic growth in Nigeria under the reference period. This
result indicates that increase in cash reserve ratio is used by the monetary authority to curtail
the amount of loans that the banks can make and hence positively affects economic growth
during the bank consolidation period.
The coefficient of interest rate (LINT) is -0.379. This indicates that indirect
relationship exists between interest rate and economic growth. This is consistent to the a
priori expectation hence 1 percent increase in interest rate will lead to 0.379 percent decrease
in economic growth when other variables are held constant. The variable LINT was not
statistically significant at any level. Hence, we accept the null hypothesis that interest rate has
no significant impact on economic growth in Nigeria during the bank consolidation. The
consistent of this variable is as a result of structural efficiencies, market perfections or no
government interference in the interaction of market forces that characterized the Nigerian
money market during the bank consolidation period.
The regression result shows that positive relationship exists between financial
deepening and economic growth. This is consistent to the a priori expectation. The value of
the coefficient of financial deepening (LM2/GDP) is 0.566. This implies that 1 percent
increase in financial deepening will lead to 0.566 percent increase in economic growth. The
variable was not statistically significance at level of significance with t-statistic calculated
value of 1.041 which is less than t-statistic table value of 1.796. Therefore, we accept the null
hypothesis that financial deepening has no significant impact on economic growth in Nigeria
during the consolidation period. This result indicates that financial development does not
enhance growth in the Nigerian economy during the bank consolidation.
The regression result shows that a positive relationship exists between total number of
banks and economic growth. This is consistent to the a priori expectation. The coefficient of
total number of bank (LTNB) is 1.289. This implies that 1 percent increase in LTNB will lead
to 1.289 percent increase in economic growth when other factors are held constant. The
variable was not statistically significance at level of significance with t-statistic calculated
value of 1.295 which is less than t-statistic table value of 1.796. Therefore, we accept the null
hypothesis that total number of bank has no significant impact on economic growth in Nigeria
during the consolidation period.
The coefficient of determination (R2) from our result is given as 0.857. This implies
that 86 percent of the variation in Nigeria economic growth is accounted for by the included
explanatory variables during bank consolidation while 14 percent is unexplained due to error

PAGE 141| Journal of Corporate Governance, Insurance, and Risk Management | 2015, VOL. 2, NO.
3
terms. The adjusted coefficient of determination (R-2
) is given as 0.426. This means that
precisely 43 percent of the variations in economic growth of Nigeria are accounted for by the
included variables after the co-efficient of determination is been adjusted to make it intensive
to the number of included variables while 57 percent is unaccounted for due to error terms.
Also the statistical test for joint significance of the parameter estimate (i.e. F statistic)
using 95% confidence interval and 6, 2 degree of freedom gives the figure 19.2 from the
statistical table. And since the calculated F-statistics from our result gives 1.990, which is
lesser than that from the table, we accept the null hypothesis and reject explanatory variable
since is not significant. This implies that the financial indicator perform poorly to Nigeria’s
economic growth during the consolidation era in the Nigerian financial sector.
The D.W statistic value 2.356 indicates absence of auto-correlation in the analysis,
which means that the estimate is unbiased, consistent and reliable for prediction and policy
formulation.
In summary, based on the above, it can be deduced that consistent with the
hypothesized relations that the entire variables were consistent to the a priori expectation but
none was significant at any level. The F statistic shows that bank consolidation has not
impacted significantly on Nigeria economic growth under the study period.
The results obtained from the estimation equation are depicted in the table below.
Table 4.4: Regression results (1986 - 2011)
Dependent variables is LGDP
Explanatory
Variables
(Regressors)
Coefficient Std
Error
T –
Statistic
P –
Value
C 2.108 2.303 0.915 0.371
LBC 0.284 0.133 1.307 0.207
LCPS 0.638 0.214 2.063 0.053
LCRR -0.282 0.576 -1.150 0.265
LINT 0.092 1.018 0.644 0527
LM2/GDP 0.362 0.825 2.234 0.037
LTNB 0.360 0.788 1.371 0.186
R – Squared = 0.724
Adjusted R – squared = 0.636
F – Statistic = 8.295
Prob. (F-Statistics) = 0.0000
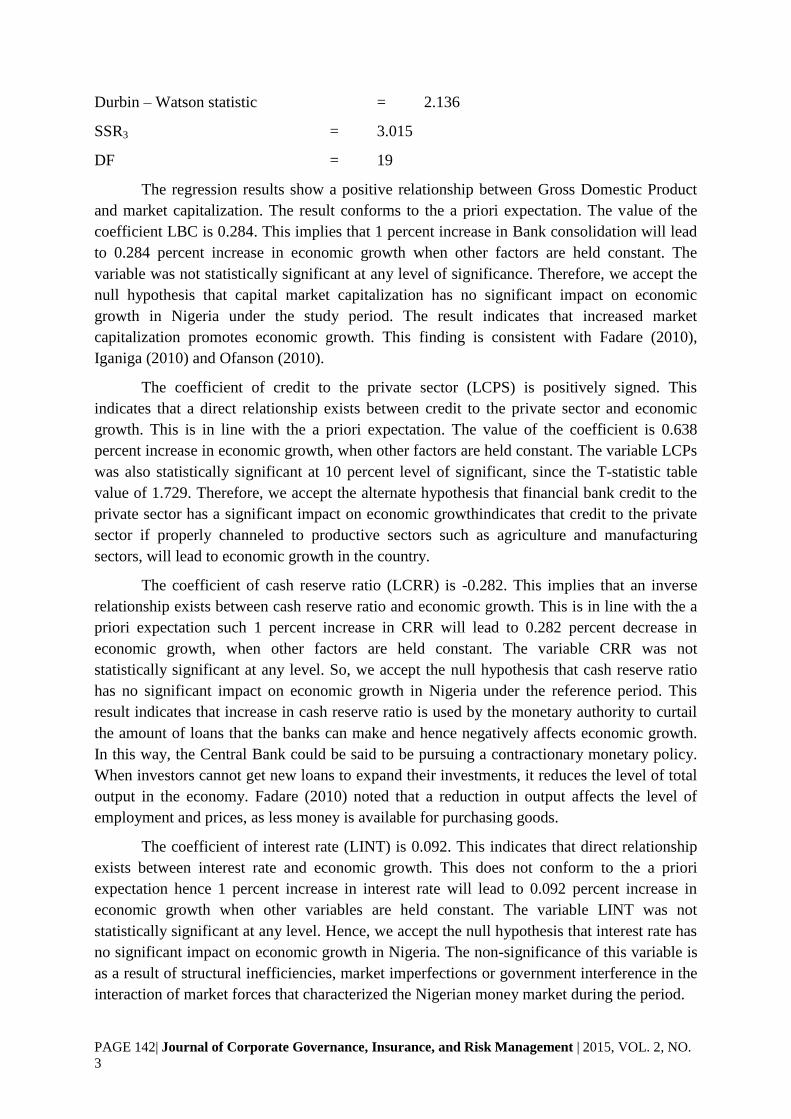
PAGE 142| Journal of Corporate Governance, Insurance, and Risk Management | 2015, VOL. 2, NO.
3
Durbin – Watson statistic = 2.136
SSR3 = 3.015
DF = 19
The regression results show a positive relationship between Gross Domestic Product
and market capitalization. The result conforms to the a priori expectation. The value of the
coefficient LBC is 0.284. This implies that 1 percent increase in Bank consolidation will lead
to 0.284 percent increase in economic growth when other factors are held constant. The
variable was not statistically significant at any level of significance. Therefore, we accept the
null hypothesis that capital market capitalization has no significant impact on economic
growth in Nigeria under the study period. The result indicates that increased market
capitalization promotes economic growth. This finding is consistent with Fadare (2010),
Iganiga (2010) and Ofanson (2010).
The coefficient of credit to the private sector (LCPS) is positively signed. This
indicates that a direct relationship exists between credit to the private sector and economic
growth. This is in line with the a priori expectation. The value of the coefficient is 0.638
percent increase in economic growth, when other factors are held constant. The variable LCPs
was also statistically significant at 10 percent level of significant, since the T-statistic table
value of 1.729. Therefore, we accept the alternate hypothesis that financial bank credit to the
private sector has a significant impact on economic growthindicates that credit to the private
sector if properly channeled to productive sectors such as agriculture and manufacturing
sectors, will lead to economic growth in the country.
The coefficient of cash reserve ratio (LCRR) is -0.282. This implies that an inverse
relationship exists between cash reserve ratio and economic growth. This is in line with the a
priori expectation such 1 percent increase in CRR will lead to 0.282 percent decrease in
economic growth, when other factors are held constant. The variable CRR was not
statistically significant at any level. So, we accept the null hypothesis that cash reserve ratio
has no significant impact on economic growth in Nigeria under the reference period. This
result indicates that increase in cash reserve ratio is used by the monetary authority to curtail
the amount of loans that the banks can make and hence negatively affects economic growth.
In this way, the Central Bank could be said to be pursuing a contractionary monetary policy.
When investors cannot get new loans to expand their investments, it reduces the level of total
output in the economy. Fadare (2010) noted that a reduction in output affects the level of
employment and prices, as less money is available for purchasing goods.
The coefficient of interest rate (LINT) is 0.092. This indicates that direct relationship
exists between interest rate and economic growth. This does not conform to the a priori
expectation hence 1 percent increase in interest rate will lead to 0.092 percent increase in
economic growth when other variables are held constant. The variable LINT was not
statistically significant at any level. Hence, we accept the null hypothesis that interest rate has
no significant impact on economic growth in Nigeria. The non-significance of this variable is
as a result of structural inefficiencies, market imperfections or government interference in the
interaction of market forces that characterized the Nigerian money market during the period.

PAGE 143| Journal of Corporate Governance, Insurance, and Risk Management | 2015, VOL. 2, NO.
3
The regression result shows that positive relationship exists between financial
deepening and economic growth. This is consistent to the a priori expectation. The value of
the coefficient of financial deepening (LM2/GDP) is 0.362. This implies that 1 percent
increase in financial deepening will lead to 0.362 percent increase in economic growth. The
variable was also statistically significance at 5 percent level of significance with t-statistic
calculated value of 2.238 which is greater than t-statistic table value of 2.093. Therefore, we
accept the alternate hypothesis that financial deepening has a significant impact on economic
growth in Nigeria. This result indicates that financial development is as a result of persistent
policies initiated by the monetary authority to liberalized the financial sector in order to
enhancing growth in the economy.
The regression result shows that a positive relationship exists between total number of
banks and economic growth. This is consistent to the a priori expectation. The coefficient of
total number of bank (LTNB) is 0.360. This implies that 1 percent increase in LTNB will lead
to 0.360 percent increase in economic growth when other factors are held constant. The
variable was not statistically significant at 10 percent level of significance with a t-statistic
calculated value of 1.371 which is less than t-statistic table value of 1.729. Thus, we accept
the null hypothesis that total number of banks has no significant impact on economic growth
in Nigeria. However, the non-significance nature of the variable indicate that the number of
banks services to various economic units and hence insignificant in Nigerian economic
growth.
The coefficient of determination (R2) from our result is given as 0.724. This implies
that 72 percent of the variation in Nigeria economic growth is accounted for by the included
explanatory variables while 28 percent is unexplained due to error terms. The adjusted
coefficient of determination (R2) is given as 0.636. This means that precisely 64 percent of the
variations in economic growth of Nigeria are accounted for by the included variables after the
co-efficient of determination is been adjusted to make it intensive to the number of included
variables while 36 is unaccounted for due to error terms.
Also the statistical test for joint significance of the parameter estimate (i.e. F statistic)
using 95% confidence interval and 6, 19 degree of freedom gives the figure 2.60 from the
statistical table. And since the calculated F- statistics from our result gives 8.295, which is
higher than that from the table, we reject the null hypothesis and accept the alternate
hypothesis, concluding that the joint influence of all included explanatory variables is
significant and therefore cannot be ignored in explaining economic growth in Nigeria.
The D.W statistic value 2.136 indicates absence of auto-correlation in the analysis,
which means that the estimate is unbiased, consistent and reliable for prediction and policy
formulation.
In summary, based on the above, it can be deduced that consistent with the
hypothesized relations, credit to the private sector and financial deepening are some of the
significant financial indicators that determine economic growth in Nigeria under the reference
period.

PAGE 144| Journal of Corporate Governance, Insurance, and Risk Management | 2015, VOL. 2, NO.
3
5. THE CHOW TEST
When we use a regression model involving time series data, it may happen that there is
a structural change, we mean that the values of the parameter of the model do not remain the
same through the entire time period (Gujarati 2006). Sometime, structural change may be due
to external force or due to policy change. In order to carry out this test in our study, our
regression was divided in two samples and obtained the residual sum of square from the
various sample i.e. pre-bank consolidation and consolidation and pool period.
However, for our sample from regression result RSS3 = 3.01 and DF = 19
RSS1 = 0.10 and DF = 11
RSS2 = 0.876 and DF = 12
Where
RSS3 is the restricted residual sum of squares (pool period)
RSS1 is the residual sum of squares of pre-bank consolidation
RSS2 is the residual sum of squares of bank consolidation
Since the two sets of samples are deemed independent, we can add RSS1 and RSS2 to obtain
unrestricted residual sum of squares (RSSUR) i.e.
RSSUR = RSS1 + RSS2 with DF (n1 + n2 – 2k)
RSSUR = 0.010 + 0.876 = 0.886
Therefore, the chow test F ratio = (RSSR + RSSRU)/K
RSSUR/(n1 + n2 – 2k)
Where, K is number of parameters estimated
= (3.015 – 0.886)/6
= 0.886/13
= 0.3773
0.0683 = 5.500
From the F statistic tables, we find that for 6 and 19 DF the 5 percent critical F value is 2.63.
This is less than the calculated value of 5.50. This implies that banking sector in Nigeria has
under gone structural change within the study period. The implication of this result is that the
regression for pre bank consolidation is different from consolidation period and the result
obtained from the pooled period is dubious. It cannot be relied upon.
6. SUMMARY, CONCLUSION AND RECOMMENDATIONS
Summary

PAGE 145| Journal of Corporate Governance, Insurance, and Risk Management | 2015, VOL. 2, NO.
3
From the findings of the study, the following can be inferred.
i. Bank consolidation has no significant impact on economic growth in Nigeria
under the study period.
ii. Credit to private sector has direct and significant impact on economic growth
during pre-bank consolidation period but it was insignificant during consolidation
iii. Cash reserved ratio has an inverse, but insignificant impact on economic growth
during pre-bank consolidation but has a direct impact on economic growth during
bank consolidation. This is an indication that the central bank is pursuing a
contractionary monetary policy.
iv. The interest rate has an insignificant influence on Nigeria economic growth under
the pre and bank consolidation period
v. The financial deepening has positive and significant effect on Nigeria economic
growth during the pre-consolidation period but in significant during bank
consolidation. This finding indicates that there is a financial development in the
country which enhances her economic growth under the pre-bank consolidation
period.
vi. The total number of bank has direct and significant impact on economic growth in
Nigeria during pre-bank consolidation but insignificant during bank consolidation
period.
vii. The chow test indicates that there was a structural change during the study period.
This structural shift is due to the recapitalization of bank in the Nigerian economy.
PAGE 146| Journal of Corporate Governance, Insurance, and Risk Management | 2015, VOL. 2, NO.
3
Conclusion
The general conclusion that emerges from this study is that financial market
capitalization, financial deepening and reforms on the provision of bank credit to the private
sectors have the potential to induce Nigeria’s economic growth and development during the
study period.
Recommendations
Based on findings of the study, the following recommendations are suggested.
i. Banking regulations such as bank consolidation needs to be a component of total
reform framework of monetary authority to ensure effectiveness.
In particular, other parameters of bank financial health like the quality of corporate
governance, ethics, product development and return rendition should be included in
any banking reform for significant result.
ii. Apart from infrastructural deficit, other problems retarding economic growth in
Nigeria are the stunted real sector development. With the rising volume of
financial resources at the disposal of Nigeria banks as a result of consolidation,
necessary strategies should be perfected to design enabling credit facilities whose
tenor and terms will provide a symbolic benefit to both the sector business and the
banks.
REFERENCES
Balogun, Emmanuel Dele (2007). Banking Sector Reforms and the Nigerian Economy:
Performance, pitfalls and future policy options, Euro journal 12(45):14
Berger, A.N; R.S Demsetz an P.E Straham (1999). “The Consolidation of Financial services
Industry: Causes, consequences and implications for the future: Journal of Banking
and Finance 23, 135-194
Berger, N Allen (1998). “The Efficiency Effects of Bank Mergers and Acquisition: A
preliminary look at the 1990. Data: In bank Mergers and Acquisitions eds. Y Amihud
and a Miller. Amsterdamik Academic Publishers.
BIS (2001). Risk Management Principle for Electronic Banking: A bases committee
publication 2001.
Damoda, N.G (2007). Basic Econometrics (4th
edition). Tata, M.C Grawattillpaffreshing
company, New Delhi
Iganiga, B.O. (2010) Evaluation of the Nigerian financial sector Reforms using behavioural
models. Ambrose Alli University, Ekpoma, Nigeria.

PAGE 147| Journal of Corporate Governance, Insurance, and Risk Management | 2015, VOL. 2, NO.
3
Iganiga, B.O. and Frances Ngoi Obafemi (2006). The dynamics of the Nigerian Financial
bystan structure, product and reforms. Amfitop prints and computers. Lagos.
John Black (2003). Oxford Dictionary of Economics, Oxford University Press, New York
Macro-economics. Impact of Bank Capital Requirements in Emerging Economics

Pages 148-157
PAGE 148| Journal of Corporate Governance, Insurance, and Risk Management | 2015, VOL. 2, NO.
3
Journal of Corporate Governance, Insurance, and Risk Management (JCGIRM)
2015, Volume 2, Series 3
CONFLICT RESOLUTION ANALYSIS USING GRAPH
MODEL FOR CONFLICT RESOLUTION (GMCR)
APPROACH (A CASE STUDY IN CONFLICT AND
COOPERATION AGREEMENT BETWEEN IDT AND IDMT)
Chintya Faradita Putria,*
, Dini Turipanam Alamandab
a Telecommunication and Informatics Business Management Program Study, Faculty of Economics and Business, Telkom
University b A lecture of Economics and Business Faculty, Telkom University
A B S T R A C T A R T I C L E I N F O
This study uses the Graph Model for Conflict Resolution (GMCR) as an
approach to describe the optimal solution for resolving the conflict which
happened between IDT and its subsidiary IDMT. This conflict arose when
IDMT used IDT’s 2.1 frequency band.
The main players in the conflict is IDT with its subsidiaries namely
IDMT. The other parties involved in the conflict were KTI NGO, Central
Jakarta District Court, Attorney General's Office and Policy Institute
(MCIT and Administrative Court). The method used in this research is
qualitative research that uses literature review as a tool for data collection
Based on the stability analysis, The equilibrium scenario for all the parties
in frame I and frame II was the first scenario. The first scenario happened
when, KTI NGO reported that there was an alleged misuse of mobile
cellular network in the frequency of 2.1 GHz / 3G conducted by IDT and
IDMT. IDT and IDMT sent out a counter report stating that they had been
extorted by KTI NGO. The Central Jakarta District Court then concluded
that KTI NGO had been guilty of extorting IDT and IDMT. However the
Attorney General's Office continued their investigation on IDT and IDMT
because of their suspected misuse of mobile cellular network and on the
Policy Institute who defended IDT and IDMT. Based on the outcome of
the conflict as reported on online news portals, it can be concluded there is
correlation between the outcome of the conflict and the stable solution
(equilibrium) generated through the GCMR approach. The implications of
this study can be used as a reference for the Indonesian government and
stakeholders in the telecommunications industry to resolve similar conflict
in the telecommunications cooperation agreement.
Keywords:
Conflict Resolution, Graph
Model for Conflict Resolution,
Telecommunications
*Corresponding author:
(Chintya Faradita Putri)
Article history:
Article Submitted 14-04-2015
Article Accepted 20-06-2015
**Article previously published in
EJEM 2015, vol 2, No. 3
1. INTRODUCTION
Based on the survey conducted by the Association of Indonesian Internet Service Provider (APJII)
together with the Central Statistics Bureau (BPS) in early 2014 revealed that the number of Internet
users in Indonesia has reached 71.19 million people by the end of 2013. That number grew 13 percent
compared to the record in late 2012 which is 63 million people. With this amount compared with the
total population of the population of Indonesia, the Internet penetration percentage in Indonesia is
about 28 percent. APJII judging by these results Indonesian intention to adjust to the demands of the
Millennium Development Growth (MDGs) which also agreed with International Telecom Union

PAGE 149| Journal of Corporate Governance, Insurance, and Risk Management | 2015, VOL. 2, NO.
3
(ITU), that in 2015 the population of the earth is to be internet savvy 50 percent has not yet achieved.
Then there are two more years to catch up to achieve these targets. (http://www.apjii.or.id accessed on
October 3, 2014).
Based on that, there are some stakeholder who can play an active role to make it happen such as the
players in Telecom Industry as a network and service provider and also supported by the Government
and people of Indonesia itself. In accordance with Article 33 paragraph (2) of the Telecommunications
Act number 36 of 1999 which explains that the Internet Service Provider (ISP) can use a network
provider's network (both wired network and mobile network) (http://apjii.or.id accessed at dated
October 3, 2014). These are reasons for supports and cooperation between providers of
telecommunications networks and telecommunications service providers to be able to create an
internet savvy society.
One of the form of cooperation agreements that support the provision of internet for internet literacy
will be done by IDT as a provider of telecommunications networks and IDMT as telecommunications
service providers. Indar Atmanto as the Director of IDMT on 24 November 2006 signed the
cooperation agreement between IDT and IDMT on internet access through 3G networks. However, the
cooperation agreement turn into a conflict when the KTI NGO led by Denny AK on October 6, 2011
reported allegations of corruption made by IDT and IDMT on the misuse of mobile cellular network
3G radio frequency band to the West Java High Court (http : //news.detik.com accessed on October 3,
2014).
Conflict occurs when there is a disagreement between an individual or group that has a different
perception of things. In this case, law enforcement agencies in Indonesia, the Attorney General's
Office stated that the cooperation agreement made by IDT and IDMT is not valid in the eyes of the
law that set 5 suspects, former Director of IDMT (Indar Atmanto), former Director of IDT (Jhonny
Swandi Sjam and Hari Sasongko), and two corporations IDT and IDMT (http://news.liputan6.com
accessed on October 3, 2014). It is inversely proportional to the statements and information given by
the telecom regulator, namely the Ministry of Communications and Information Technology
(Communications) whose are not considered by law enforcement agencies during the judicial process
takes place which states that IDT and IDMT cooperation agreement is in accordance with the
Telecommunications Act, and there is no obligation to pay IDMT frequency rights fee due to the
obligation is IDT’s and it has been paid. This is confirmed by the issuance of a letter 65 /
M.KOMINFO / 02/2012 by the Communications and Information Technology as telecommunications
regulator stating that there is no violation of law, crimes committed, and losses that result from an
agreement between IDT and the IDMT. Furthermore, the Minister of Communications and
Information Technology (MCIT) also sent a letter to Attorney General's Office directly stating that

PAGE 150| Journal of Corporate Governance, Insurance, and Risk Management | 2015, VOL. 2, NO.
3
both IDT and IDMT does not violate any rules and cooperation between IDT and IDMT is legal under
the rules and regulations in force, and is a common practice in the telecommunications industry.
(Annual Report 2013 PT.IDT Tbk accessed on October 3, 2014).
The stipulation has become a major step back for Indonesian intention to adjust to the demands of the
Millennium Development Growth (MDGs) which also agreed by International Telecom Union (ITU),
that in 2015 the population of the earth is to be 50% internet savvy and has not yet achieved. On the
other hand conflict arises when Telecommunications Industry itself still lacks clarity related to their
rules. Even in the near future, the Internet in Indonesia is threatened to stop completely. Because the
whole internet service provider or ISP in this country do not want to suffer the same fate as Indar
Atmanto. They think that what Indar has done is in compliance with the rules and has been deemed
lawfully correct by the telecommunications regulator. But in fact, Indar is imprisoned on an agreement
which was ruled not appropriate by law enforcement agencies in Indonesia. Conflicts occured with an
alleged illegal use over an IDT’s 2.1 frequency band by IDMT based on a cooperation agreement
between the IDMT represented by Indar Atmanto as the former Director of IDMT with IDT that has
go on since 2011, so it can be created a model of resolution to this conflict that can serve as a lesson
and won’t harm any parties.
There are many ways that can be used in an effort to generate a resolution model of a conflict; one of
them is using game theory approach (Game Theory). In line with the development of science, Fang,
Hipel and Kilgour (1993) used game theory to model conflict resolution with the known Graph Model
for Conflict Resolution (GMCR) which is a new breakthrough to the approach to game theory. GMCR
is a methodology for framing an interactive decision or conflict situations, in which the stability
analysis can be generated as well as an assessment tool of the best strategies for conflict resolution. In
Indonesia, GMCR has been used in a variety of case studies Handayati et al (2011), Alamanda et al
(2010,2011,2012,2014), Ariyanto (2013), Husnayain and Alamanda (2014).
In this study, GMCR is used to describe the optimal solution obtained in a conflict that has happened
in the agreement between IDT and IDMT seen from the preferences of each party involved in the
conflict. The combination of the preferences of each party will result in scenarios which are shadows
on the steps taken by each party in a state of conflict. As known by the previous explanation that the
conflict of this agreement has resulted in the enactment of five suspects, former Director of IDMT
(Indar Atmanto), former Director of IDT (Jhonny Swandi Sjam and Hari Sasongko), and two
corporations IDT and IDMT. After going through the process GMCR approach, the correspondence
between the steps that should be taken based on the GMCR approach and steps that occur in the real
world are taken by each player on this conflict. Therefore, the final results are to know how the
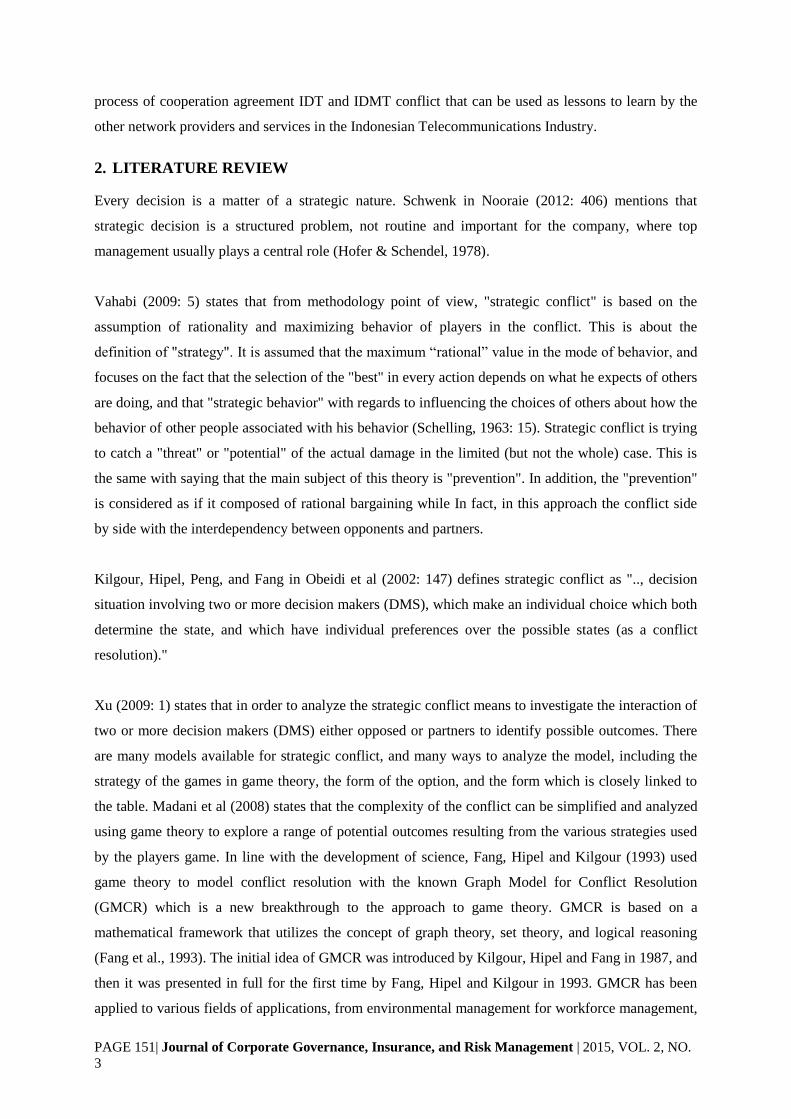
PAGE 151| Journal of Corporate Governance, Insurance, and Risk Management | 2015, VOL. 2, NO.
3
process of cooperation agreement IDT and IDMT conflict that can be used as lessons to learn by the
other network providers and services in the Indonesian Telecommunications Industry.
2. LITERATURE REVIEW
Every decision is a matter of a strategic nature. Schwenk in Nooraie (2012: 406) mentions that
strategic decision is a structured problem, not routine and important for the company, where top
management usually plays a central role (Hofer & Schendel, 1978).
Vahabi (2009: 5) states that from methodology point of view, "strategic conflict" is based on the
assumption of rationality and maximizing behavior of players in the conflict. This is about the
definition of "strategy". It is assumed that the maximum “rational” value in the mode of behavior, and
focuses on the fact that the selection of the "best" in every action depends on what he expects of others
are doing, and that "strategic behavior" with regards to influencing the choices of others about how the
behavior of other people associated with his behavior (Schelling, 1963: 15). Strategic conflict is trying
to catch a "threat" or "potential" of the actual damage in the limited (but not the whole) case. This is
the same with saying that the main subject of this theory is "prevention". In addition, the "prevention"
is considered as if it composed of rational bargaining while In fact, in this approach the conflict side
by side with the interdependency between opponents and partners.
Kilgour, Hipel, Peng, and Fang in Obeidi et al (2002: 147) defines strategic conflict as ".., decision
situation involving two or more decision makers (DMS), which make an individual choice which both
determine the state, and which have individual preferences over the possible states (as a conflict
resolution)."
Xu (2009: 1) states that in order to analyze the strategic conflict means to investigate the interaction of
two or more decision makers (DMS) either opposed or partners to identify possible outcomes. There
are many models available for strategic conflict, and many ways to analyze the model, including the
strategy of the games in game theory, the form of the option, and the form which is closely linked to
the table. Madani et al (2008) states that the complexity of the conflict can be simplified and analyzed
using game theory to explore a range of potential outcomes resulting from the various strategies used
by the players game. In line with the development of science, Fang, Hipel and Kilgour (1993) used
game theory to model conflict resolution with the known Graph Model for Conflict Resolution
(GMCR) which is a new breakthrough to the approach to game theory. GMCR is based on a
mathematical framework that utilizes the concept of graph theory, set theory, and logical reasoning
(Fang et al., 1993). The initial idea of GMCR was introduced by Kilgour, Hipel and Fang in 1987, and
then it was presented in full for the first time by Fang, Hipel and Kilgour in 1993. GMCR has been
applied to various fields of applications, from environmental management for workforce management,
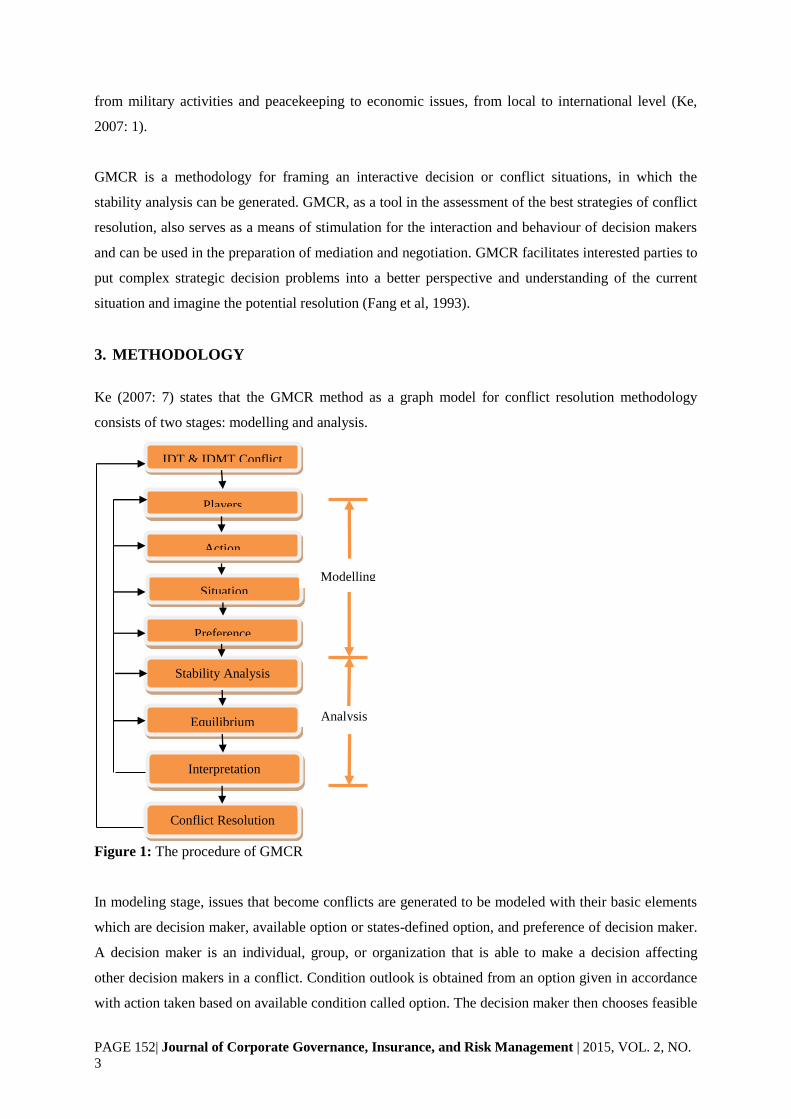
PAGE 152| Journal of Corporate Governance, Insurance, and Risk Management | 2015, VOL. 2, NO.
3
from military activities and peacekeeping to economic issues, from local to international level (Ke,
2007: 1).
GMCR is a methodology for framing an interactive decision or conflict situations, in which the
stability analysis can be generated. GMCR, as a tool in the assessment of the best strategies of conflict
resolution, also serves as a means of stimulation for the interaction and behaviour of decision makers
and can be used in the preparation of mediation and negotiation. GMCR facilitates interested parties to
put complex strategic decision problems into a better perspective and understanding of the current
situation and imagine the potential resolution (Fang et al, 1993).
3. METHODOLOGY
Ke (2007: 7) states that the GMCR method as a graph model for conflict resolution methodology
consists of two stages: modelling and analysis.
Figure 1: The procedure of GMCR
In modeling stage, issues that become conflicts are generated to be modeled with their basic elements
which are decision maker, available option or states-defined option, and preference of decision maker.
A decision maker is an individual, group, or organization that is able to make a decision affecting
other decision makers in a conflict. Condition outlook is obtained from an option given in accordance
with action taken based on available condition called option. The decision maker then chooses feasible
Players
IDT & IDMT Conflict
Action
Situation
Preference
Stability Analysis
Equilibrium
Interpretation
Conflict Resolution
Modelling
Analysis

PAGE 153| Journal of Corporate Governance, Insurance, and Risk Management | 2015, VOL. 2, NO.
3
state based on the collected options. Feasible state is a chosen scenario among a number of scenarios
that may happen. The number of scenarios obtained is defined as 2n, where 2 is the probability of
“Yes” (Y) and “No” (N) and n is filled by a number of available options. However, not all of states
may be appropriate. Therefore, modeling stage is important to eliminate states that are not appropriate.
Those options are then ranked based on the likeable things preferred by the decision maker, which is
called preference of decision maker. The information will be used in the next stage, which is analysis
stage (Ke: 2007)
In analysis stage, the stability of each condition is calculated based on each decision maker’ view.
Afterwards, the whole stability of stable conditions can be obtained. The preference is important
information required as input for the stability analysis using a variety of solution concepts. The
concepts of the solution used are indicated using the letters (r) for Nash stable scenario and (s) for
stable sequential scenario and (u) for unstable scenarios. Next step is to see any scenario that is
eventually equilibrium for all those indicated by the letter (E).
After the stability being analyzed, the next stage will be sensitivity analysis. Sensitivity analysis is an
analysis for finding out what will happen to the decision makers if they move from one state (usually
from state status quo) to another. In several application somebody may use sensitivity to decide how
the preference of decision maker must change to deliver the more wanted equilibria for other decision
makers. The result can be said as equilibria if it is a stable condition for all parties. With interpretation
and sensitivity analysis, decision makers or other interested parties can understand the meaning of the
resolution of conflicts in the real world. To be noticed is that the presence of feedback is allowed on
GMCR procedure. Feedback means any stage, either at the modeling stage or analysis stage, can go
back to the previous point, if found new information. These characteristics make GMCR more flexible
and practical (Ke: 2007).
4. DISCUSSION & RESULT
Based on secondary data sources adapted to the purpose of this study which is to determine how the
process of conflict and cooperation agreement between IDT and IDMT that can be used as a lessons
learn for the network providers and services in the Indonesian telecommunications industry, the last
status (status quo) on conflict of cooperation agreement between IDT and IDMT is presented in Table
1 below:
Table 1. Status Quo
Frame Players Oprtion
I KTI NGO Reporting suspected abuse of mobile cellular network
frequency of 2.1 GHz / 3G conducted by IDT and IDMT
Y
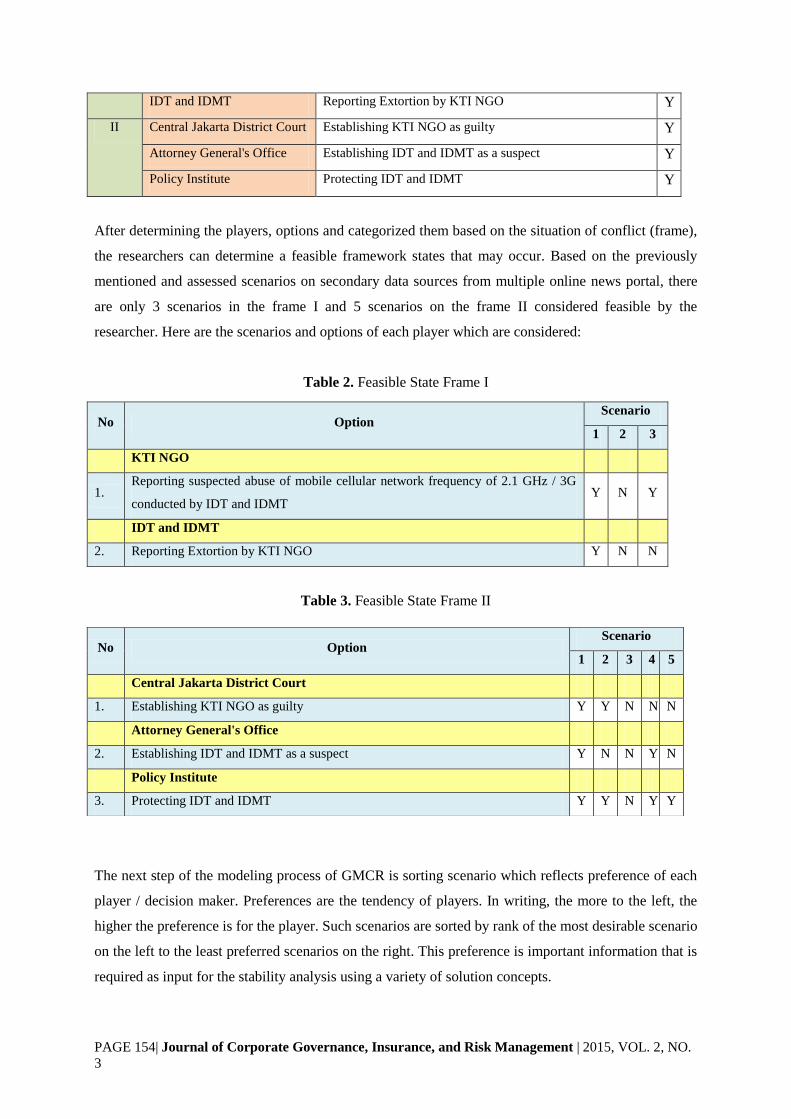
PAGE 154| Journal of Corporate Governance, Insurance, and Risk Management | 2015, VOL. 2, NO.
3
After determining the players, options and categorized them based on the situation of conflict (frame),
the researchers can determine a feasible framework states that may occur. Based on the previously
mentioned and assessed scenarios on secondary data sources from multiple online news portal, there
are only 3 scenarios in the frame I and 5 scenarios on the frame II considered feasible by the
researcher. Here are the scenarios and options of each player which are considered:
Table 2. Feasible State Frame I
Table 3. Feasible State Frame II
The next step of the modeling process of GMCR is sorting scenario which reflects preference of each
player / decision maker. Preferences are the tendency of players. In writing, the more to the left, the
higher the preference is for the player. Such scenarios are sorted by rank of the most desirable scenario
on the left to the least preferred scenarios on the right. This preference is important information that is
required as input for the stability analysis using a variety of solution concepts.
IDT and IDMT Reporting Extortion by KTI NGO Y
II Central Jakarta District Court Establishing KTI NGO as guilty Y
Attorney General's Office Establishing IDT and IDMT as a suspect Y
Policy Institute Protecting IDT and IDMT Y
No Option Scenario
1 2 3
KTI NGO
1. Reporting suspected abuse of mobile cellular network frequency of 2.1 GHz / 3G
conducted by IDT and IDMT Y N Y
IDT and IDMT
2. Reporting Extortion by KTI NGO Y N N
No Option Scenario
1 2 3 4 5
Central Jakarta District Court
1. Establishing KTI NGO as guilty Y Y N N N
Attorney General's Office
2. Establishing IDT and IDMT as a suspect Y N N Y N
Policy Institute
3. Protecting IDT and IDMT Y Y N Y Y

PAGE 155| Journal of Corporate Governance, Insurance, and Risk Management | 2015, VOL. 2, NO.
3
Furthermore, it is checked which scenarios are the equilibrium or stable and acceptable to all parties
that can be used as a conflict resolution of cooperation agreement conflict between IDT and IDMT and
is marked with the letter E. A state is considered stable for decision makers if and only if (IFF)
decision makers are not tempted to move away from their uniterally. A state is said equlibrium, or
resolution may be a solution of choice concept, if all the decision makers find stability under the
concept of solution. The concept of stability analysis used in this study is only nash stable (r),
sequential stable (s) and unstable (u) because only those three conditions occur during the stability
analysis. Nash stable occurs when a player does not change position due to other positions are not
higher than its payoff in the current position. Sequential stable occurs when a player does not change
position due to considering the steps of the opponent, and the opponent is not much better than its
payoff in the current position. The unstable occurs when players switch positions to better position that
has a higher payoff than its current position.
Here are the results of stability analysis on conflict and cooperation agreement between IDT and
IDMT presented in Table 4:
Tabel 4. Results of Stability Analysis
FRAME I FRAME II
KTI NGO Central Jakarta District Court
E E
Stability r u r Stability r r u u r
State Ranking 3 2 1 State Ranking 1 2 4 5 3
Uis 3 Uis 1 2
IDT and IDMT Attorney General's Office
E E
Stability r r u Stability r r u u r
State Ranking 2 1 3 State Ranking 1 4 2 5 3
Uis 1 Uis 1 4
Policy Institute
E
Stability r r s r r
State Ranking 2 5 3 1 4
Uis 5
In Table 4 it can be seen that the equilibrium scenario for all parties in the frame I is the scenario 1
when KTI NGO reports alleged misuse of mobile cellular network frequency of 2.1 GHz / 3G
conducted by IDT and IDMT followed by IDT and IDMT that also report extortion by KTI NGO.
PAGE 156| Journal of Corporate Governance, Insurance, and Risk Management | 2015, VOL. 2, NO.
3
While in the frame II, the equilibrium scenario for all parties is the scenario 1 when the Central Jakarta
District Court sets KTI NGO guilty, Attorney General’s Office sets IDT and IDMT as suspect and
Policy Institute that defends IDT IDMT.
The next step is sensitivity analysis used to answer the question "what if?" In some applications, one
may use sensitivity analysis to determine how the preferences of decision makers should be changed
in order to produce a more desirable equilibria for other decision makers. These results can be said as
equilibria if it is a stable situation for all parties. Or in other words, a sensitivity analysis is conducted
when there are two or more equilibrium scenarios to find which one is the best scenario for all parties.
And in this study, as it has been obtanined previously in the analysis of the stability that equilibrium or
stable scenarioes on the basis of nash for all parties in the frame I and the frame II is scenario 1 so it
can be concluded that it is not necessary to have a sensitivity analysis because there is only one
equilibrium scenario.
5. CONCLUSION
Based on the results of the analysis it is indicated that the stability of the equilibrium scenario for all
parties in the frame I is the scenario I when KTI NGO report alleged misuse of mobile cellular
network frequency of 2.1 GHz / 3G conducted by IDT and IDMT and followed by IDT and IDMT
reporting extortion conducted by NGO KTI. While in the frame II, the equilibrium scenario for all
parties is the scenario 1 when Central Jakarta District Court sets KTI NGO guilty, Attorney General's
Office sets IDT and IDMT as suspect and also Policy Institute that defend IDT and IDMT.
In this research, GMCR is used to describe the optimal solution obtained in a conflict that has
happened in the agreement between IDT and IDMT viewed from the options and preferences of each
party involved in this conflict. Therefore, after going through the process of GMCR approach, it will
be seen the correspondence between the steps that should be taken based on the results of the approach
of GMCR method and steps occur in the real world taken by the respective players based on the
outcome of the conflict as reported on online news portals. The implications of this study can be used
as a reference for the Indonesian government and stakeholders in the telecommunications industry to
resolve similar conflict in the telecommunications cooperation agreement.
REFERENCES
Annual Report IDT 2012-2013[Accessed: September. 23, 2014]
Asosisasi Penyelenggara Jasa Internet Indonesia, “Klarifikasi Status Kerjasama ISP dan
Penyelenggara Jaringan”. www.apjii.or.id, September. 23, 2014. [Online]. Available:
http://apjii.or.id/v2/upload/Arsip/Surat%20APJII_Kominfo_Kasus%20IDMT.pdf [Accessed:
September. 28, 2014]
PAGE 157| Journal of Corporate Governance, Insurance, and Risk Management | 2015, VOL. 2, NO.
3
Fang, L., Keith, W. H., & Marc, K. (1993). Interactive Decision Making – The Graph Model for
Conflict Resolution, New York: Wiley.
Ferdinan (June. 13, 2014), “Pledoi Mantan Dirut IDMT Singgung Laporan Bermotif Pemerasan”
www.detik.com [Online]. Available:
http://news.detik.com/read/2013/06/13/104944/2272157/10/forum.detik.com/pledoi-mantan-dirut-
IDMT-singgung-laporan-bermotif-pemerasan [Accessed: September. 28, 2014]
Husnayain, A. Ihdal dan Dini Alamanda Turipanam (2014). Plan’s Conflict in Gedebage Bandung
Using Graph Model For Conflict Resolution (GMCR). Emerging Trends In Academic Research
ETAR (C) Global Illuminators, Bali, Indonesia [Online].
Available:http://www.globalilluminators.org/wp-content/uploads/2014/12/ETAR-14-285.pdf
[Accessed: February. 11, 2014]
Ke, Yi Ginger (2007). Preference Elicitation in The Graph Model for Conflict Resolution. Tesis
Program Magister University of Waterloo, Ontario, Canada.
Madani, Kaveh., David Rheinheimer, Laila Elimam, dan Christina Connel-Buck (2009). A Game
Theory Approach to Understanding the Nile River Basin Conflict. International Journal of World
Environmental and Water Resources Congress
Merdeka.com (January. 15, 2014). Jumlah Pengguna Internet Indonesia capai 71,19 juta pada 2013.
www.apjii.or.id [Online]. Available:http://www.apjii.or.id/v2/read/article/apjii-at-
media/219jumlah-pengguna-internet-indonesia-capai-7119-juta.html [Accessed: September. 28,
2014]
Noorie, Mahmood (2012). Factors Influencing Strategic Decision-Making Processes, International
Journal of Academic Research in Business and Social Sciences July 2012, Vol. 2, No. 7, 406-
407.
Pangabean, Edward (September. 16, 2014). Jaksa Eksekusi Eks Dirut IDMT ke Penjara Sukamiskin.
news.liputan6.com [Online]. Available: http://news.liputan6.com/read/2106174/jaksa-eksekusi-
eks-dirut-IDMT-ke-penjara-sukamiskin [Accessed: December. 11, 2014]
Suryadhi, Ardhi (February. 7, 2013). Gugat BPKP PTUN Kabulkan Permohonan IDT IDMT.
inet.detik.com [Online]. Available:
http://inet.detik.com/read/2013/02/07/171018/2164137/328/gugat-bpkp-ptun-kabulkan-
permohonan-IDT--IDMT [Accessed: September. 19, 2014]
Suryadi, Ardhi (May. 1, 2014). PTUN Audit BPKP di Kasus IDMT IDT Cacat Hukum inet.detik.com
[Online]. Available: http://inet.detik.com/read/2013/05/01/133920/2235171/328/ptun-audit-bpkp-
di-kasus-IDMT-IDT-cacat-hukum [Accessed: September. 19, 2014]
Vahabi, Mehrdad (2012). A Critical Review of Strategic Conlict Theory and Socio-political Instability
Models, A paraître dans Revue d’Economie Politique, Vol. 119, No. 6, 2009, 5