version: 19.11 - avangard malz...land country sommergerste spring barley 1000 ha braugerste malting...
TRANSCRIPT
Version: 19.11.2019
Anbauflächen Europa
Acreage in Europe Qualität Europa Überblick
Quality Europe Overview
Qualität Deutschland
Quality Germany
Qualität Dänemark
Quality Denmark
Qualität Frankreich
Quality France
Fusarien /Gushing
Fusarium / Gushing
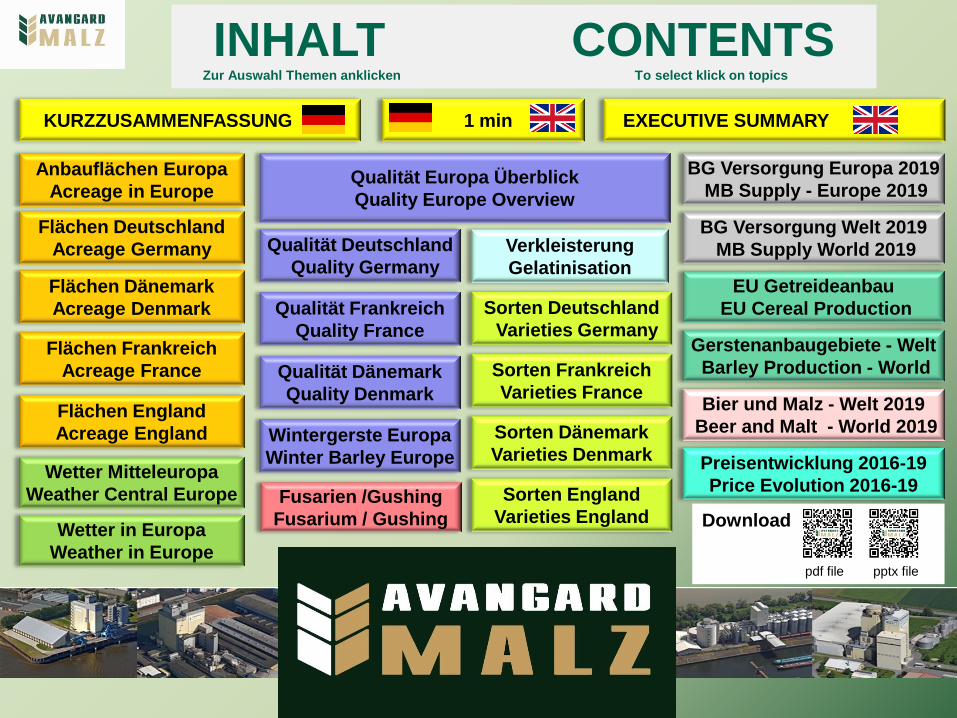
INHALT CONTENTS Zur Auswahl Themen anklicken To select klick on topics
Flächen Deutschland
Acreage Germany
Flächen Dänemark
Acreage Denmark
Flächen Frankreich
Acreage France
Wintergerste Europa
Winter Barley Europe Wetter Mitteleuropa
Weather Central Europe
Wetter in Europa
Weather in Europe
Flächen England
Acreage England
KURZZUSAMMENFASSUNG EXECUTIVE SUMMARY 1 min
Verkleisterung
Gelatinisation
Sorten Deutschland
Varieties Germany
Sorten Dänemark
Varieties Denmark
Sorten Frankreich
Varieties France
Sorten England
Varieties England
BG Versorgung Europa 2019
MB Supply - Europe 2019
Bier und Malz - Welt 2019
Beer and Malt - World 2019
BG Versorgung Welt 2019
MB Supply World 2019
EU Getreideanbau
EU Cereal Production
Gerstenanbaugebiete - Welt
Barley Production - World
Preisentwicklung 2016-19
Price Evolution 2016-19
Download
pdf file pptx file
Land
Country
Sommergerste
Spring Barley
1000 ha
Braugerste
Malting
Barley*
1000 t
Hauptsorten
Main Varieties
Neue
Sorten
New
Varieties
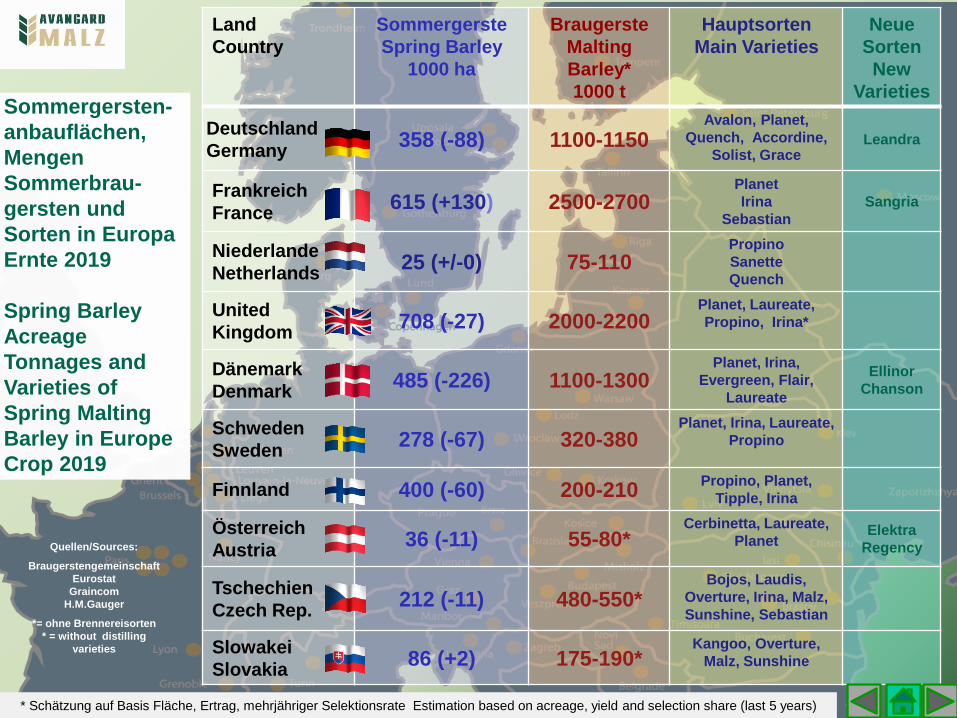
Deutschland
Germany 358 (-88) 1100-1150
Avalon, Planet,
Quench, Accordine,
Solist, Grace Leandra
Frankreich
France 615 (+130) 2500-2700
Planet
Irina
Sebastian
Sangria
Niederlande
Netherlands 25 (+/-0) 75-110
Propino
Sanette
Quench
United
Kingdom 708 (-27) 2000-2200
Planet, Laureate,
Propino, Irina*
Dänemark
Denmark 485 (-226) 1100-1300
Planet, Irina,
Evergreen, Flair,
Laureate
Ellinor
Chanson
Schweden
Sweden 278 (-67) 320-380
Planet, Irina, Laureate,
Propino
Finnland 400 (-60) 200-210 Propino, Planet,
Tipple, Irina
Österreich
Austria 36 (-11) 55-80*
Cerbinetta, Laureate,
Planet Elektra
Regency
Tschechien
Czech Rep. 212 (-11) 480-550*
Bojos, Laudis,
Overture, Irina, Malz,
Sunshine, Sebastian
Slowakei
Slovakia 86 (+2) 175-190*
Kangoo, Overture,
Malz, Sunshine
Sommergersten-
anbauflächen,
Mengen
Sommerbrau-
gersten und
Sorten in Europa
Ernte 2019
Spring Barley
Acreage
Tonnages and
Varieties of
Spring Malting
Barley in Europe
Crop 2019
Quellen/Sources:
Braugerstengemeinschaft
Eurostat
Graincom
H.M.Gauger
*= ohne Brennereisorten
* = without distilling
varieties
* Schätzung auf Basis Fläche, Ertrag, mehrjähriger Selektionsrate Estimation based on acreage, yield and selection share (last 5 years)

Land
Country
Braugerste
(Menge)*
Malting
Barley
(Tonnage)*
Erträge
Yields
Protein Vollgerste
Screening
Deutschland N
Germany North -* -* -* Deutschland W
Germany West - - - Deutschland S
Germany South - - - Frankreich Ost
France East - - Frankreich Mitte
France Centre -** - England Süd
England South - - Dänemark
Denmark Schweden
Sweden Österreich
Austria - - - Tschechien/Slowakei
Czech Rep./ Slovakia - - -
Sommer-Braugerste
Mengen, Erträge und
Qualitäten in Europa
Ernte 2019
Spring Malting Barley
Amounts,Yields and
Quality in Europe
Crop 2019
Quellen/Sources:
H.M.Gauger
Braugerstengemeinschaft
RMI Analytics
Schlechter
als der Durchschnitt der
letzten Jahre
Schlechte Qualitätswerte
Worse than average of
previous years
Bad quality
entspricht dem
Durchschnitt der letzten Jahre
Normale Qualitätswerte
Similar to average values of
previous years
Normal quality
Über dem Durchschnitt der
letzten Jahre
Gute Qualitätswerte
Better than average of
previous years
Good quality
* bei beregneten Flächen/ at
irrigated acres
** sehr niedriges
Protein/Protein very low

Mengen, Flächen und Qualität der Sommer- und
Winterbraugerste in Europa Ernte 2019
Quellen/Sources:
H.M.Gauger
Braugerstengemeinschaft
Graincom Hamburg
SBG = Sommerbraugerste
WBG = Winterbraugerste
DEUTSCHLAND
Sommergerstenfläche 10% unter Vorjahr,
Ertrag sehr stark unterschiedlich schwach
bis normal, Erntemenge SG 1.1-1.2 Mio t,
WG 0.090 Mio t
Importbedarf 1.0-1.1 Mio t* SG+WG
Qualität SBG: uneinheitlich, Eiweiß und
Vollkorn normal bis hoch, Auswuchs und
Schimmel sehr selten,
DON niedrig bis normal
Gushing: sehr geringes Risiko
Qualität WBG: Eiweiß niedrig, Sortierung
normal, kein Auswuchs,
DON niedrig und kein Gushing
DÄNEMARK
Sommergerstenfläche 30% unter
Vorjahr, Ertrag normal bis hoch,
Erntemenge SBG 1.1-1.3 Mio t
Überschuss 0.8-1.0 Mio t SBG
Qualität SBG: Eiweiß normal,
kein Auswuchs oder Schimmel
DON niedrig bis normal
Gushing: selten
FRANKREICH
Sommergerstenfläche 12% über
Vorjahr, normaler bis hoher Ertrag,
Erntemenge SBG 2.5-2.6 Mio t
WBG 2.5-2.6 Mio t
Überschuss: 1.6-1.7 Mio t SG
1.6-1.7 Mio t WG
Qualität SBG: Eiweiß niedrig bis
normal, kein Auswuchs und
Schimmel,
DON und Gushing: noch keine Werte
Qualität WBG: Eiweiß normal,
Sortierung normal, kein Auswuchs
DON und Gushing: noch keine Werte
UNITED KINGDOM
Sommergerstenfläche 14% unter
Vorjahr, Ertrag normal bis hoch
Erntemenge SBG 2.0-2.2Mio t
WBG 0.3 Mio t
Überschuss: SBG 0.5-0.6 Mio t
WBG 0 t
Qualität SBG: Im Süden Eiweiß
normal, kein Auswuchs oder
Schimmel,
DON und Gushing: noch keine
Werte
Qualität WBG: noch unbekannt
EU TOTAL
Sommergerste
Fläche: 6,95 Mio ha
Ertrag: 4.02 t/ha
Produktion SBG: 9.73 Mio t
Wintergerste
Fläche: 5.31 Mio ha
Ertrag: 5.90 t/ha
Produktion WBG: 3.46 Mio t
Überschuss SBG 0.8-1.0 Mio t
Überschuss WBG 0.7-0.8 Mio t mit carry in/out
* Bitte beachten: Alle Zahlen
sind Schätzungen. Und
basieren auf den üblichen
Annahmegrenzen für Eiweiß.
SLOWAKEI / TSCHECHIEN
Sommergerstenfläche 10% unter Vorjahr,
Ertrag normal bis sehr niedrig,
Erntemenge SBG 0.70-0.75 Mio t*,
WBG: 0.05 Mio t
Importbedarf 0.10-0.20 Mio t*
Qualität: Eiweiß normal bis sehr hoch,
schwaches Vollkorn, Auswuchs und
Schimmel in Spätdruschgebieten,
DON und Gushing: noch keine Werte
ÖSTERREICH
Sommergerstenfläche 25% unter Vorjahr, Ertrag niedrig bis
sehr niedrig, Erntemenge SG 0.055-0.080 Mio t*
Importbedarf: 0.14-0.18 Mio t
Qualität SBG: Eiweiß normal bis sehr hoch, Vollkorn normal
bis schwach, kein Auswuchs und moulds,
DON und Gushing: noch keine Werte
SCHWEDEN
Sommergerstenfläche 20% unter
Vorjahr, Ertrag normal
Erntemenge SG 0.32-0.40 Mio t
Überschuss 0.05-0.13 Mio t
Qualität SBG: Eiweiß normal, kein
Auswuchs und moulds
DON und Gushing: noch keine
Werte
FINNLAND
Sommergerstenfläche 15% unter
Vorjahr, Ertrag normal Erntemenge
SG 0.20 Mio t
Überschuss 0.10 Mio t
Qualität SBG: Eiweiß normal
DON und Gushing: noch keine
Werte
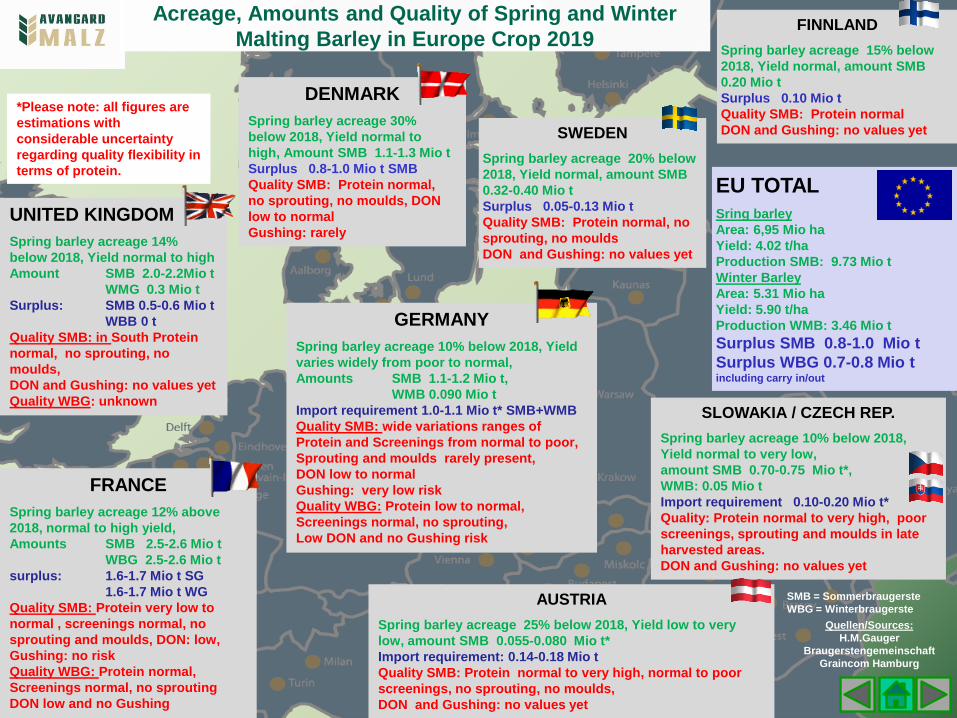
Acreage, Amounts and Quality of Spring and Winter
Malting Barley in Europe Crop 2019
Quellen/Sources:
H.M.Gauger
Braugerstengemeinschaft
Graincom Hamburg
SMB = Sommerbraugerste
WBG = Winterbraugerste
GERMANY
Spring barley acreage 10% below 2018, Yield
varies widely from poor to normal,
Amounts SMB 1.1-1.2 Mio t,
WMB 0.090 Mio t
Import requirement 1.0-1.1 Mio t* SMB+WMB
Quality SMB: wide variations ranges of
Protein and Screenings from normal to poor,
Sprouting and moulds rarely present,
DON low to normal
Gushing: very low risk
Quality WBG: Protein low to normal,
Screenings normal, no sprouting,
Low DON and no Gushing risk
DENMARK
Spring barley acreage 30%
below 2018, Yield normal to
high, Amount SMB 1.1-1.3 Mio t
Surplus 0.8-1.0 Mio t SMB
Quality SMB: Protein normal,
no sprouting, no moulds, DON
low to normal
Gushing: rarely
FRANCE
Spring barley acreage 12% above
2018, normal to high yield,
Amounts SMB 2.5-2.6 Mio t
WBG 2.5-2.6 Mio t
surplus: 1.6-1.7 Mio t SG
1.6-1.7 Mio t WG
Quality SMB: Protein very low to
normal , screenings normal, no
sprouting and moulds, DON: low,
Gushing: no risk
Quality WBG: Protein normal,
Screenings normal, no sprouting
DON low and no Gushing
UNITED KINGDOM
Spring barley acreage 14%
below 2018, Yield normal to high
Amount SMB 2.0-2.2Mio t
WMG 0.3 Mio t
Surplus: SMB 0.5-0.6 Mio t
WBB 0 t
Quality SMB: in South Protein
normal, no sprouting, no
moulds,
DON and Gushing: no values yet
Quality WBG: unknown
EU TOTAL
Sring barley
Area: 6,95 Mio ha
Yield: 4.02 t/ha
Production SMB: 9.73 Mio t
Winter Barley
Area: 5.31 Mio ha
Yield: 5.90 t/ha
Production WMB: 3.46 Mio t
Surplus SMB 0.8-1.0 Mio t
Surplus WBG 0.7-0.8 Mio t including carry in/out
SLOWAKIA / CZECH REP.
Spring barley acreage 10% below 2018,
Yield normal to very low,
amount SMB 0.70-0.75 Mio t*,
WMB: 0.05 Mio t
Import requirement 0.10-0.20 Mio t*
Quality: Protein normal to very high, poor
screenings, sprouting and moulds in late
harvested areas.
DON and Gushing: no values yet
AUSTRIA
Spring barley acreage 25% below 2018, Yield low to very
low, amount SMB 0.055-0.080 Mio t*
Import requirement: 0.14-0.18 Mio t
Quality SMB: Protein normal to very high, normal to poor
screenings, no sprouting, no moulds,
DON and Gushing: no values yet
SWEDEN
Spring barley acreage 20% below
2018, Yield normal, amount SMB
0.32-0.40 Mio t
Surplus 0.05-0.13 Mio t
Quality SMB: Protein normal, no
sprouting, no moulds
DON and Gushing: no values yet
FINNLAND
Spring barley acreage 15% below
2018, Yield normal, amount SMB
0.20 Mio t
Surplus 0.10 Mio t
Quality SMB: Protein normal
DON and Gushing: no values yet
*Please note: all figures are
estimations with
considerable uncertainty
regarding quality flexibility in
terms of protein.

Februar
February
März
March
April Mai
May
Juni
June
Juli
July
D/Germany N ++ + + - ++ +
D/Germany W ++ + + - ++ +
D/Germany S + + + - ++ +
D/Germany E ++ + + - ++ +
F/France E ++ + - - + +
F/France Cent ++ + + - + ++
S/Sweden + + + - + -
DK/Denmark ++ + + - + + / -
England S + + + + / - + +
A/Austria + + + -- ++ +
CZ Czech Rep. + + + -- ++ +
Wetter in Europa 2019 Höchsttemperatur im Vergleich zum langjährigen Mittel
Weather in Europe 2019 Maximum temperature relative to long term average
Abweichungen der Monatsmittelwerte gegenüber dem langjährigen Mittel in °C
Deviation of monthly average - related to long term average values in °Celsius
- kälter als Mittel colder than average
+ wärmer als Mittel warmer than average
April März Februar Mai Juni Juli
Quelle/Source:
Wetter-online.de

Wetter in Europa 2019 Niederschläge im Vergleich zum langjährigen Mittel
Weather in Europe - 2019 Precipitation relative to Long Term Average
Juli
Februar
February
März
March
April Mai
May
Juni
June
Juli
July
D/Germany N -- + - - - -
D/Germany W -- + + / - + - --
D/Germany S + / - + / - - + -- +/-
D/Germany E - + - - -- -
F/France E -- + + / - - - --
F/France Cent - - - - + --
S/Sweden - + -- + - -
DK/Denmark + / - + - + / - + -
England S - + + / - - + -
A/Austria - + / - - + -- +
CZ Czech Rep. - - - + -- -
Abweichungen der Monatsmittelwerte gegenüber dem langjährigen Mittel in mm
Deviation of monthly average - related to long term average values in mm
-- weit unter Mittel far below average
- unter Mittel, below average
+ über Mittel above average
Quelle/Source:
Wetter-online.de
Februar März April Mai Juni Juli

Temperaturverlauf und
Niederschläge in Europa
Herbst-Sommer 2018/19
Temperature and
Precipitation in Europe
Autumn-Summer 2018/19
Quelle/source: wetter-online.de
Bitte beachten:Die y-Achsen haben unterschiedliche Skalierungen!
Please note: The y-axes have various scales
Deutschland Nord
Germany North
Süddeutschland
South Germany
Dänemark/Denmark
South England
Schweden/Sweden
Österreich/Austria
Deutschland West
Germany West
Frankreich-Ost
East France
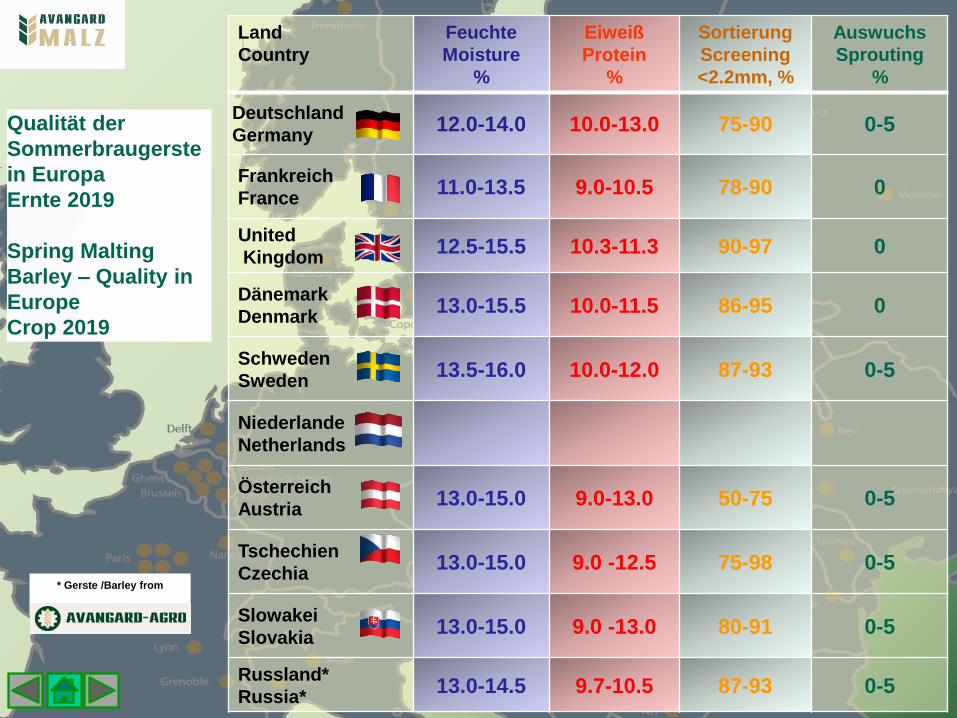
Land
Country
Feuchte
Moisture
%
Eiweiß
Protein
%
Sortierung
Screening
<2.2mm, %
Auswuchs
Sprouting
%
Deutschland
Germany 12.0-14.0 10.0-13.0 75-90 0-5
Frankreich
France 11.0-13.5 9.0-10.5 78-90 0
United
Kingdom 12.5-15.5 10.3-11.3 90-97 0
Dänemark
Denmark 13.0-15.5 10.0-11.5 86-95 0
Schweden
Sweden 13.5-16.0 10.0-12.0 87-93 0-5
Niederlande
Netherlands
Österreich
Austria 13.0-15.0 9.0-13.0 50-75 0-5
Tschechien
Czechia 13.0-15.0 9.0 -12.5 75-98 0-5
Slowakei
Slovakia 13.0-15.0 9.0 -13.0 80-91 0-5
Russland*
Russia* 13.0-14.5 9.7-10.5 87-93 0-5
Qualität der
Sommerbraugerste
in Europa
Ernte 2019
Spring Malting
Barley – Quality in
Europe
Crop 2019
* Gerste /Barley from

0,0
1,0
2,0
3,0
4,0
5,0
6,0
7,0
0
200
400
600
800
1000
19
90
19
91
19
92
19
93
19
94
19
95
19
96
19
97
19
98
19
99
20
00
20
01
20
02
20
03
20
04
20
05
20
06
20
07
20
08
20
09
20
10
20
11
20
12
20
13
20
14
20
15
20
16
20
17
20
18
20
19
*
1000 ha
dt/ha
Trend Flaeche Area
Trend Ertrag/Yield
Anbaufläche in 1000haAcreage in 1000 ha
ErtragYield t/ha
t/ha
Sommergerste – Anbaufläche und Ertrag in Deutschland 1990-2019
Spring Barley – Acreage and Yield in Germany 1990 - 2019
Quelle/Source: Braugerstengemeinschaft e.V., München, Saatenstandbericht Nr. 2/2019 28.06.2019 und Eurostat
*=Schätzung/Estimated
Der langfristige Trend des Flächenrückgangs ist seit 2009 beendet. Offenbar stabilisiert sich der Anteil
an der Ackerfläche. Gegenüber 2018 gab es in 2019 einen deutlichen Rückgang der Fläche. Die große
Anbaufläche in 2018 war eine Folge des nassen Herbstes 2017 der die Winteraussaat behindert hat. In
2019 Der Ertrag ist eher niedrig.
The long term trend of shrinking acreage seems to have stopped since 2009. Obviously the share in
acreage stabilizes. Compared to 2018 a marked decrease in acreage can be observed, owing to poor
weather conditions in autumn 2017 which hampered the drilling of winter cultivars. The yield is
relatively low.
Mittelwert 2010-19
ohne 2012 und 18
Average area 2010-19
without 2010 and 18
358000ha
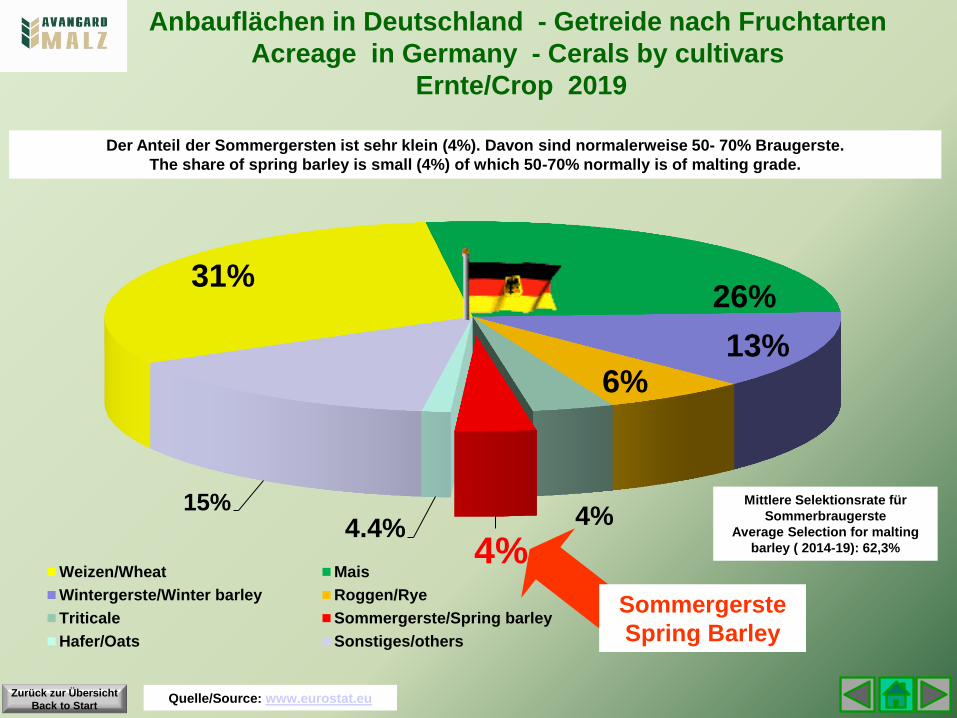
31% 26%
13% 6%
4%
4% 4.4%
15%
Weizen/Wheat Mais
Wintergerste/Winter barley Roggen/Rye
Triticale Sommergerste/Spring barley
Hafer/Oats Sonstiges/others
Anbauflächen in Deutschland - Getreide nach Fruchtarten
Acreage in Germany - Cerals by cultivars
Ernte/Crop 2019
Quelle/Source: www.eurostat.eu
Der Anteil der Sommergersten ist sehr klein (4%). Davon sind normalerweise 50- 70% Braugerste.
The share of spring barley is small (4%) of which 50-70% normally is of malting grade.
Zurück zur Übersicht
Back to Start
Mittlere Selektionsrate für
Sommerbraugerste
Average Selection for malting
barley ( 2014-19): 62,3%
Sommergerste
Spring Barley

DEUTSCHLAND -
SOMMERGERSTE ERNTE 2019
FLÄCHEN, SORTEN
GERMANY - SPRING BARLEY
ACREAGE AND VARIETIES
CROP 2019
NORDRHEIN-
WESTFALEN
AVALON
LEANDRA
9.000 ha
-7.100 ha
3.000 ha
+/-0 ha
20 + 2
THUERINGEN
31.600 ha
- 400 ha
29.000 ha
+/-0 ha
110 - 30
QUENCH
AVALON
PLANET
SOLIST
HAUPTSORTEN MAIN VARIETIES NEUESORTEN NEW VARIETIES
ha: Sommergerstenfläche
ha: Spring barley acreage
+/-: Veränderung/change gg./vs. 2017 ha: Braugerstenfläche malting barley area +/-: Veränderung /change gg./vs 2017 t: Braugerstenmenge / tonnage of malting barley in 1000t Zahlen/figures: Braugerstengemeinschaft e.V. Erntebericht über die Braugerstenernte 2019 in Deutschland
BADEN-
WUERTTEM-
BERG
AVALON
PLANET
ACCORDINE
60.700 ha
+5200 ha
40.000 ha
+/- 0 ha
237 +37
RHEINLAND-PFALZ
SAARLAND
AVALON
CATAMARAN
LEANDRA
38.500 ha
+2600 ha
35.800 ha
+3500 ha
115 -69
Die Sommergerstenanbaufläche in Deutschland hat im
Vergleich zum Vorjahr deutlich abgenommen. Die
Flächen in 2018 waren wegen der schlechten
Aussaatbedingungen im Herbst 2017 stark angestiegen.
Die Sommergerstenfläche liegt auf dem mehrjährigen
Durchschnittswert. Der Anteil der Braugerstenfläche an
der Sommergerstenfläche beträgt ca. 84%. Der Ertrag ist
stark unterschiedlich in Abhängigkeit von den
Wetterbedingungen, im Mittel aber deutlich höher als im
Vorjahr.
Dominierende Sorten sind Planet und Avalon.
Catamaran, Grace, Quench und Solist laufen aus.
Newcomer ist Leandra.
Spring barley area in Germany has markedly decreased
compared to 2018. The acreage of spring barley has
increased drastically in 2018 owed to the bad conditions
for sowing of winter cereals, which were replaced by
spring barley. Thus the acreage has come down to a
normal average value in 2019 again. The share of malting
barley is ca. 84%. Yields vary widely ,depending on
regional weather conditions, but in general they are
higher than in 2018. The dominant varieties are Planet
and Avalon. Catamaran, Grace, Quench and Solist will
further decline. Newcomer is Leandra.
BAYERN
101.300 ha
-6700 ha
98.000 ha
-7000 ha
300-350
AVALON
PLANET
SOLIST
ACCORDINE
GRACE
MECKLENBURG-
VORPOMMERN,
SCHLESWIG-
HOLSTEIN
12.800 ha
-38.000 ha
5000 ha (?)
-1000 ha
15 +3 (?)
PLANET
ACCORDINE
QUENCH
HESSEN
19.200 ha
+/- 0 ha
18.000 ha
+1.000 ha
87 +12
AVALON
PLANET
NIEDER-
SACHSEN
QUENCH
AVALON
LEANDRA
43.400ha
-41.600 ha
33.000 ha
-2.700 ha
125 -45
SACHSEN,
SACHSEN-
ANHALT
QUENCH
PLANET
SOLIST
AVALON
35.800 ha
+1.200 ha
32.800 ha
- 4.600 ha
113 - 13
Hessen
Nord
Niedersachsen
Thüringen
Main-
Tauber
Lechfeld
Schwäbische
Alb Schwarzwald
Baar
Pfalz
Hessen Süd
Westerwald
Eifel
Hunsrück
Kölner
Bucht
Mecklenburg
Kraichgau
Sachsen
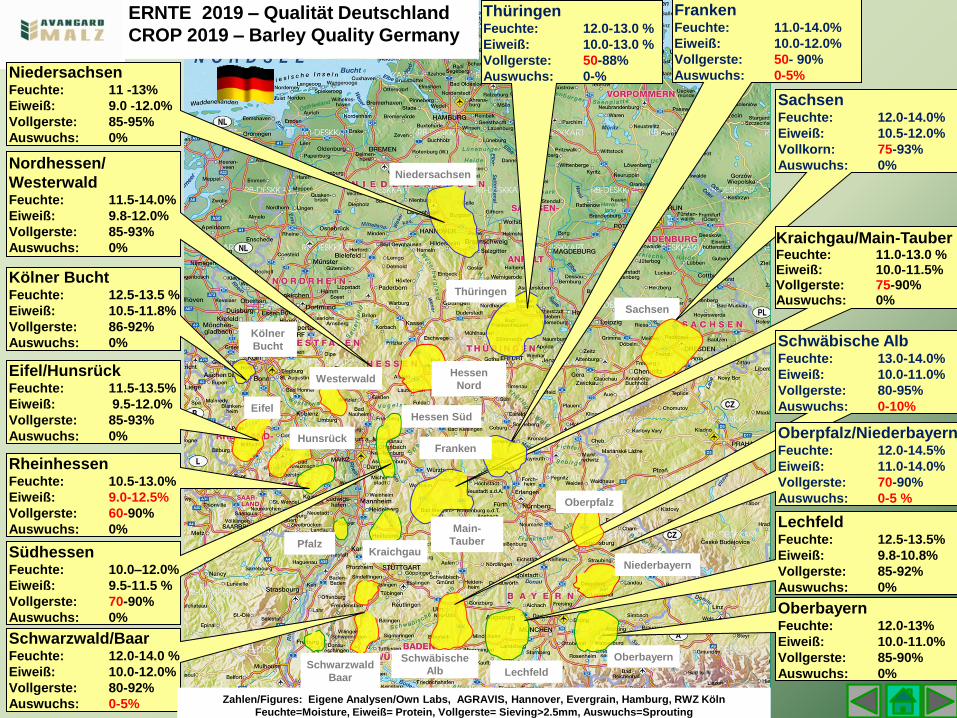
Rheinhessen Feuchte: 10.5-13.0%
Eiweiß: 9.0-12.5%
Vollgerste: 60-90%
Auswuchs: 0%
Südhessen Feuchte: 10.0–12.0%
Eiweiß: 9.5-11.5 %
Vollgerste: 70-90%
Auswuchs: 0%
Schwarzwald/Baar Feuchte: 12.0-14.0 %
Eiweiß: 10.0-12.0%
Vollgerste: 80-92%
Auswuchs: 0-5%
Kölner Bucht Feuchte: 12.5-13.5 %
Eiweiß: 10.5-11.8%
Vollgerste: 86-92%
Auswuchs: 0%
Thüringen Feuchte: 12.0-13.0 %
Eiweiß: 10.0-13.0 %
Vollgerste: 50-88%
Auswuchs: 0-%
Nordhessen/
Westerwald Feuchte: 11.5-14.0%
Eiweiß: 9.8-12.0%
Vollgerste: 85-93%
Auswuchs: 0%
Lechfeld Feuchte: 12.5-13.5%
Eiweiß: 9.8-10.8%
Vollgerste: 85-92%
Auswuchs: 0%
Oberbayern Feuchte: 12.0-13%
Eiweiß: 10.0-11.0%
Vollgerste: 85-90%
Auswuchs: 0%
Eifel/Hunsrück Feuchte: 11.5-13.5%
Eiweiß: 9.5-12.0%
Vollgerste: 85-93%
Auswuchs: 0%
ERNTE 2019 – Qualität Deutschland
CROP 2019 – Barley Quality Germany
Franken Feuchte: 11.0-14.0%
Eiweiß: 10.0-12.0%
Vollgerste: 50- 90%
Auswuchs: 0-5%
Sachsen Feuchte: 12.0-14.0%
Eiweiß: 10.5-12.0%
Vollkorn: 75-93%
Auswuchs: 0%
Oberbayern
Zahlen/Figures: Eigene Analysen/Own Labs, AGRAVIS, Hannover, Evergrain, Hamburg, RWZ Köln
Feuchte=Moisture, Eiweiß= Protein, Vollgerste= Sieving>2.5mm, Auswuchs=Sprouting
Niedersachsen Feuchte: 11 -13%
Eiweiß: 9.0 -12.0%
Vollgerste: 85-95%
Auswuchs: 0%
Kraichgau/Main-Tauber Feuchte: 11.0-13.0 % Eiweiß: 10.0-11.5% Vollgerste: 75-90% Auswuchs: 0%
Schwäbische Alb Feuchte: 13.0-14.0%
Eiweiß: 10.0-11.0%
Vollgerste: 80-95%
Auswuchs: 0-10%
Franken
Niederbayern
Oberpfalz/Niederbayern Feuchte: 12.0-14.5%
Eiweiß: 11.0-14.0%
Vollgerste: 70-90%
Auswuchs: 0-5 % Oberpfalz
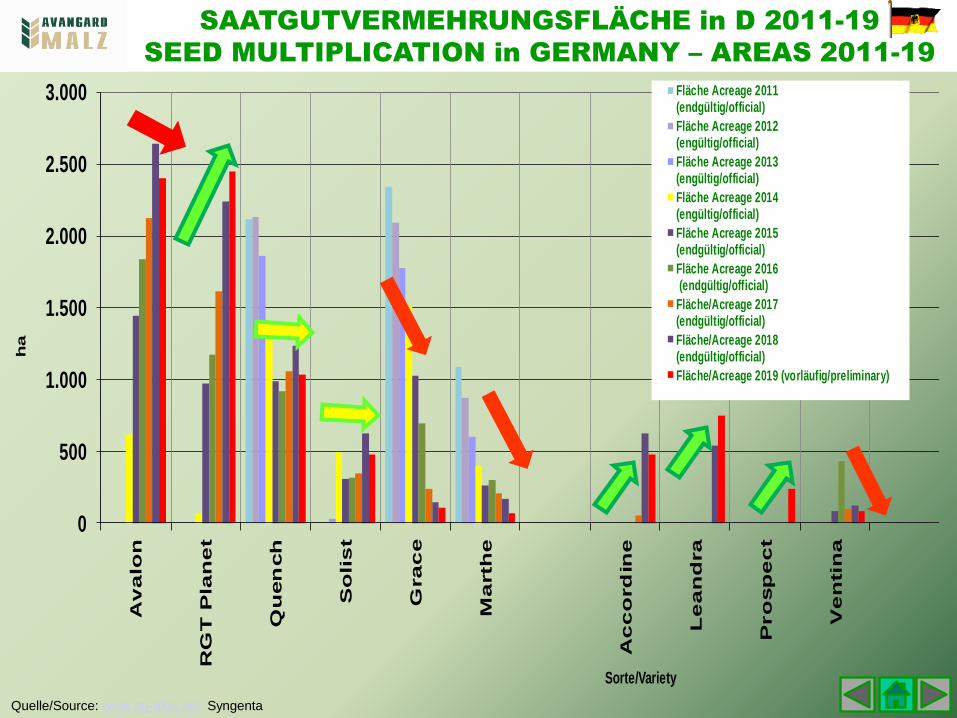
SAATGUTVERMEHRUNGSFLÄCHE in D 2011-19
SEED MULTIPLICATION in GERMANY – AREAS 2011-19
0
500
1.000
1.500
2.000
2.500
3.000
Av
alo
n
RG
T P
lan
et
Qu
en
ch
So
lis
t
Gra
ce
Ma
rth
e
Ac
co
rd
ine
Le
an
dra
Pro
sp
ec
t
Ve
ntin
a
ha
Sorte/Variety
Fläche Acreage 2011(endgültig/official)
Fläche Acreage 2012(engültig/official)
Fläche Acreage 2013(engültig/official)
Fläche Acreage 2014(engültig/official)
Fläche Acreage 2015(endgültig/official)
Fläche Acreage 2016 (endgültig/official)
Fläche/Acreage 2017(endgültig/official)
Fläche/Acreage 2018(endgültig/official)
Fläche/Acreage 2019 (vorläufig/preliminary)
Quelle/Source: www.ag-akst.de/ Syngenta

NEUE SORTEN IM BERLINER PROGRAMM
VARIETIES APPROVED BY BERLINER
PROGRAMM 2007 - 2018
Quellen/sources: www.Braugerstengemeinschaft.de, www.Baywa.de, www.ig-pflanzenzucht.de, www3.syngenta.com
Im Rahmen des BERLINER PROGRAMMS geprüfte und empfohlene Sorten:
Varieties tested and recommended by BERLINER PROGRAMM:
Nach den Praxistests in 2018 erhielt die Sorte LEANDRA die Empfehlung des Berliner Programms.
Aus den Neuzulassungen des Bundessortenamt vom Dezember 2018 ist Prospect (Saatzucht Streng) für die
großtechnischen Versuche des Berliner Programms in 2019 ausgewählt worden.
Following industrial scale trials in 2018, the variety LEANDRA was awarded with the status of recommended variety.
From the varieties newly approved by the German authorities in 2018 Prospect ( breeder: Streng) was selected for the final
industrial scale trials, within the „Berliner Programm“ in 2019.
(Veröffentlichung unter / Published by: www.braugerstengemeinschaft.de)
STREIF
SUNSHINE KWS
BAMBINA
CATAMARAN
AVALON
SOLIST
PASSENGER
VENTINA
CERVINIA
ACCORDINE
LEANDRA

NEU ZUGELASSENE SORTEN 2018 in D
NEWLY APPROVED VARIETIES in GERMANY 2018
Zurück zur Übersicht
Back to Start Quelle/Source:www.braugerstengemeinschaft.de
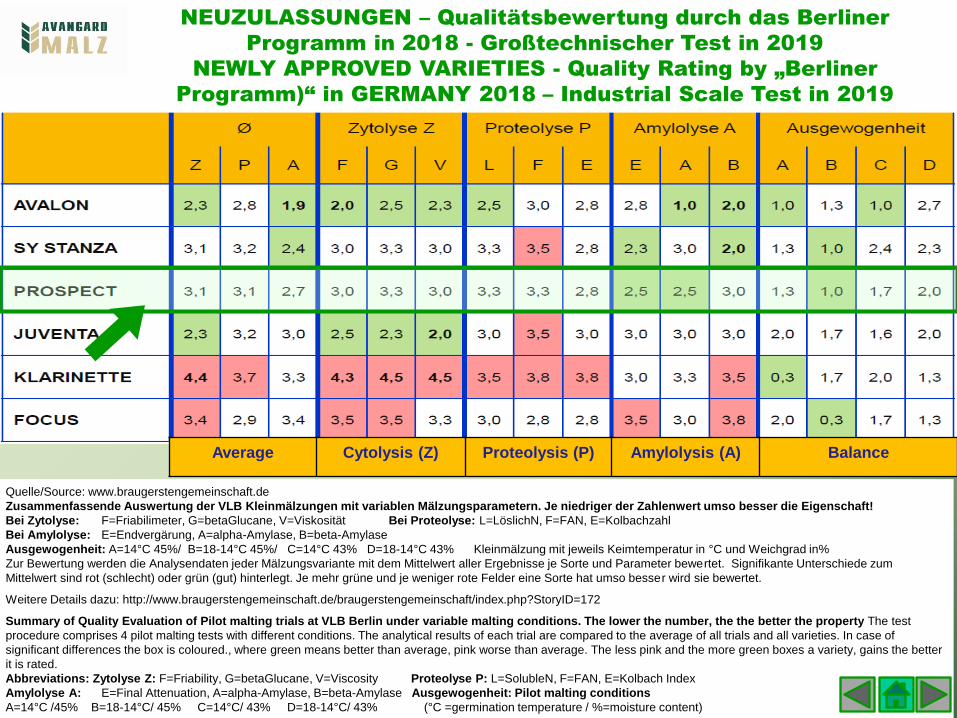
NEUZULASSUNGEN – Qualitätsbewertung durch das Berliner
Programm in 2018 - Großtechnischer Test in 2019
NEWLY APPROVED VARIETIES - Quality Rating by „Berliner
Programm)“ in GERMANY 2018 – Industrial Scale Test in 2019
Quelle/Source: www.braugerstengemeinschaft.de
Zusammenfassende Auswertung der VLB Kleinmälzungen mit variablen Mälzungsparametern. Je niedriger der Zahlenwert umso besser die Eigenschaft!
Bei Zytolyse: F=Friabilimeter, G=betaGlucane, V=Viskosität Bei Proteolyse: L=LöslichN, F=FAN, E=Kolbachzahl
Bei Amylolyse: E=Endvergärung, A=alpha-Amylase, B=beta-Amylase
Ausgewogenheit: A=14°C 45%/ B=18-14°C 45%/ C=14°C 43% D=18-14°C 43% Kleinmälzung mit jeweils Keimtemperatur in °C und Weichgrad in%
Zur Bewertung werden die Analysendaten jeder Mälzungsvariante mit dem Mittelwert aller Ergebnisse je Sorte und Parameter bewertet. Signifikante Unterschiede zum
Mittelwert sind rot (schlecht) oder grün (gut) hinterlegt. Je mehr grüne und je weniger rote Felder eine Sorte hat umso besser wird sie bewertet.
Weitere Details dazu: http://www.braugerstengemeinschaft.de/braugerstengemeinschaft/index.php?StoryID=172
Summary of Quality Evaluation of Pilot malting trials at VLB Berlin under variable malting conditions. The lower the number, the the better the property The test
procedure comprises 4 pilot malting tests with different conditions. The analytical results of each trial are compared to the average of all trials and all varieties. In case of
significant differences the box is coloured., where green means better than average, pink worse than average. The less pink and the more green boxes a variety, gains the better
it is rated.
Abbreviations: Zytolyse Z: F=Friability, G=betaGlucane, V=Viscosity Proteolyse P: L=SolubleN, F=FAN, E=Kolbach Index
Amylolyse A: E=Final Attenuation, A=alpha-Amylase, B=beta-Amylase Ausgewogenheit: Pilot malting conditions
A=14°C /45% B=18-14°C/ 45% C=14°C/ 43% D=18-14°C/ 43% (°C =germination temperature / %=moisture content)
Average Cytolysis (Z) Proteolysis (P) Amylolysis (A) Balance

38,7
33,0 6,7 6,1
11,2
4,3
Weizen/Wheat Sommergerste/Spring barley Roggen/Rye Wintergerste/Winter barley Mais/Maize Sonstige/others
Quelle/Source: Eurostat Zahlen in % der Getreidefläche Figures in% of the total cereal acreage
Der Anteil der Sommergerstenfläche ist sehr groß (33%). Gegenüber
2018 ist die Fläche um 30% gesunken.
Die kleinere Fläche bedeutet aber, wegen der über den Normalwerten
liegenden niedrigen Erträge, keine geringere Braugerstenmenge.
The share of spring barley acreage is very high (33%). Compared to
2018 acreage decreased by 30%. The decreased area does not result
in a lower amount of malting barley owing to higher than normal
yields.
Anbauflächen in Dänemark nach Fruchtarten
Acreage by cultivars in Denmark
Ernte/Crop 2019
Sommergerste
Spring Barley
Mittlere Selektionsrate für
Sommerbraugerste
Average selection rate for
malting barley
( 2014-19): 39,0%

SORTENANTEIL AN ZERTIFIZIERTEM SAATGUT in DK
SHARES OF VARIETIES FROM CERTIFIED SEED in DENMARK
2015-19
0
1000
2000
3000
4000
5000
6000
7000
8000P
lan
et
Fla
ir
Irin
a
Ev
erg
re
en
Ell
ino
r
La
ure
ate
Ch
an
so
n
Fa
nte
x
Sorte/Variety
Fläche Acreage 2015 in ha
Fläche Acreage 2016 in ha
Fläche Acreage 2017 in ha
Fläche Acreage 2018 in ha
Fläche Acreage 2019 in ha
Quelle/Source: Danish Agro/Syngenta
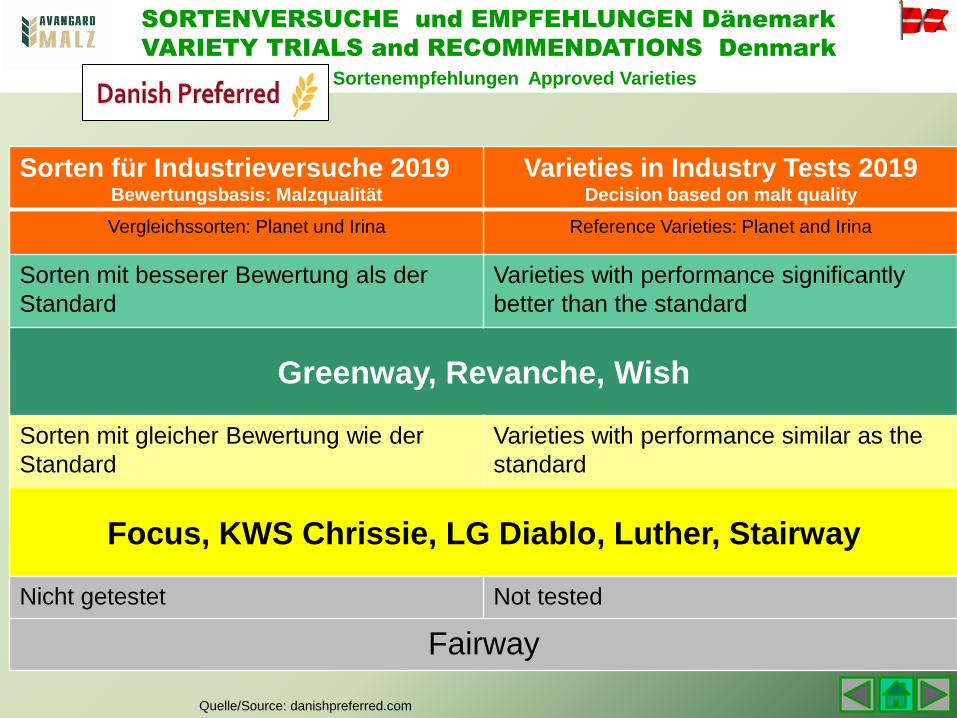
SORTENVERSUCHE und EMPFEHLUNGEN Dänemark
VARIETY TRIALS and RECOMMENDATIONS Denmark
Sortenempfehlungen Approved Varieties
Quelle/Source: danishpreferred.com
Empfohlene Sorten Approved Varities Sorten für Industrieversuche 2019 Bewertungsbasis: Malzqualität
Varieties in Industry Tests 2019 Decision based on malt quality
Vergleichssorten: Planet und Irina Reference Varieties: Planet and Irina
Sorten mit besserer Bewertung als der
Standard
Varieties with performance significantly
better than the standard
Greenway, Revanche, Wish
Sorten mit gleicher Bewertung wie der
Standard
Varieties with performance similar as the
standard
Focus, KWS Chrissie, LG Diablo, Luther, Stairway
Nicht getestet Not tested
Fairway
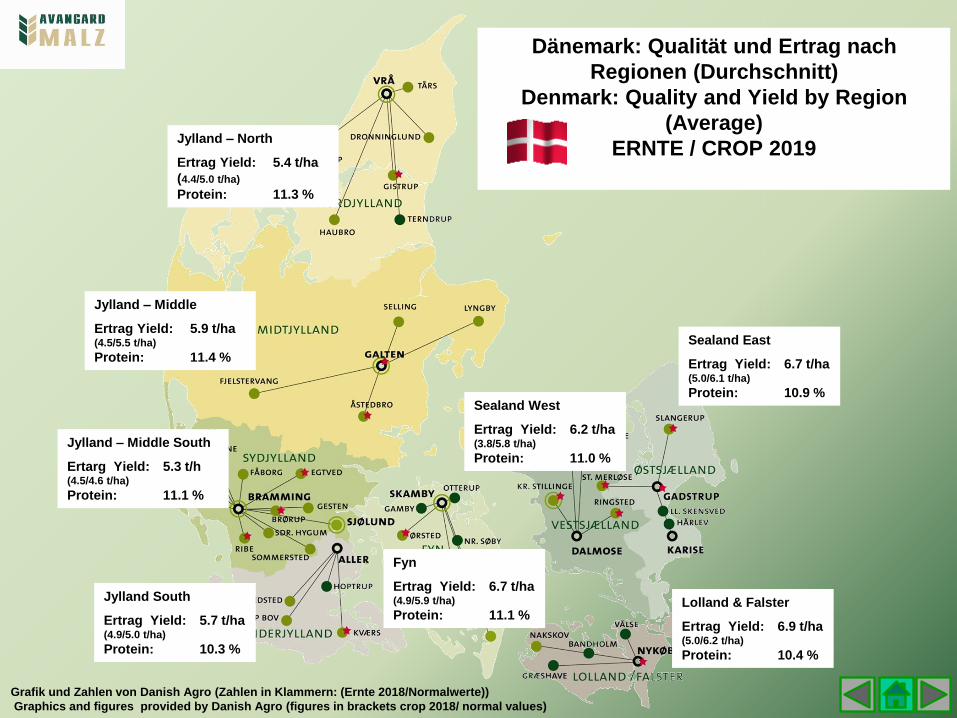
Dänemark: Qualität und Ertrag nach
Regionen (Durchschnitt)
Denmark: Quality and Yield by Region
(Average)
ERNTE / CROP 2019
Lolland & Falster
Ertrag Yield: 6.9 t/ha (5.0/6.2 t/ha)
Protein: 10.4 %
Sealand East
Ertrag Yield: 6.7 t/ha (5.0/6.1 t/ha)
Protein: 10.9 % Sealand West
Ertrag Yield: 6.2 t/ha (3.8/5.8 t/ha)
Protein: 11.0 %
Fyn
Ertrag Yield: 6.7 t/ha (4.9/5.9 t/ha)
Protein: 11.1 %
Jylland South
Ertrag Yield: 5.7 t/ha (4.9/5.0 t/ha)
Protein: 10.3 %
Jylland – Middle South
Ertarg Yield: 5.3 t/h (4.5/4.6 t/ha)
Protein: 11.1 %
Jylland – Middle
Ertrag Yield: 5.9 t/ha (4.5/5.5 t/ha)
Protein: 11.4 %
Jylland – North
Ertrag Yield: 5.4 t/ha
(4.4/5.0 t/ha)
Protein: 11.3 %
Grafik und Zahlen von Danish Agro (Zahlen in Klammern: (Ernte 2018/Normalwerte))
Graphics and figures provided by Danish Agro (figures in brackets crop 2018/ normal values)
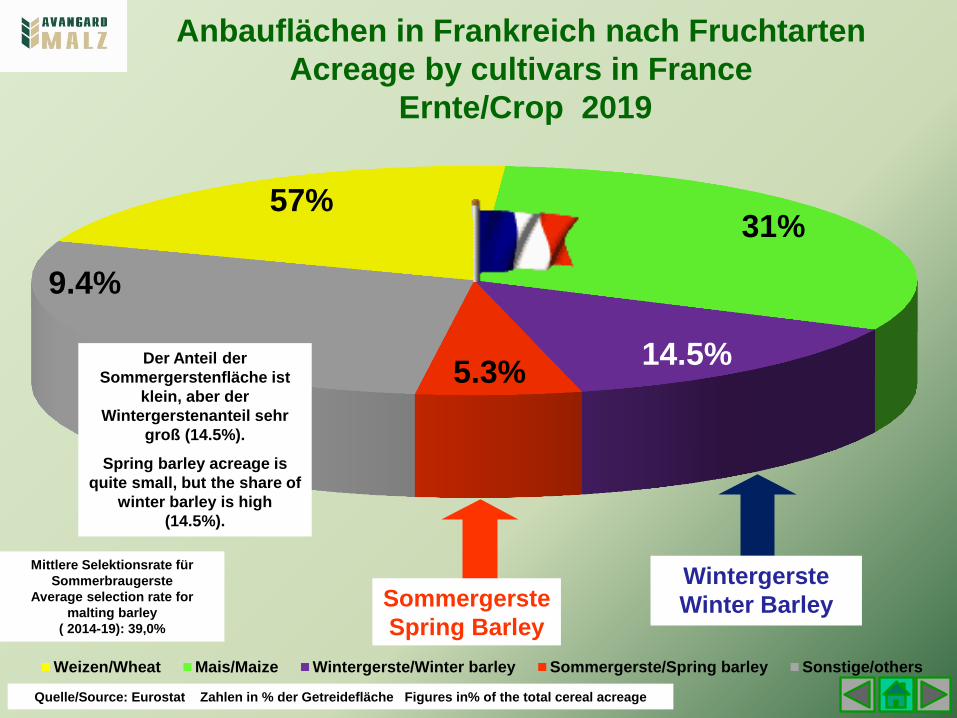
57% 31%
14.5% 5.3%
9.4%
Weizen/Wheat Mais/Maize Wintergerste/Winter barley Sommergerste/Spring barley Sonstige/others
Wintergerste
Winter Barley
Der Anteil der
Sommergerstenfläche ist
klein, aber der
Wintergerstenanteil sehr
groß (14.5%).
Spring barley acreage is
quite small, but the share of
winter barley is high
(14.5%).
Anbauflächen in Frankreich nach Fruchtarten
Acreage by cultivars in France
Ernte/Crop 2019
Sommergerste
Spring Barley
Quelle/Source: Eurostat Zahlen in % der Getreidefläche Figures in% of the total cereal acreage
Mittlere Selektionsrate für
Sommerbraugerste
Average selection rate for
malting barley
( 2014-19): 39,0%

SAATGUTVERMEHRUNGSFLÄCHE in F 2013-19
SEED MULTIPLICATION in FRANCE – AREAS 2013-19
0
1.000
2.000
3.000
4.000
5.000
6.000
7.000
RGT Planet KWSFantex Fandaga Focus Explorer Laureate KWS Irina KWS Chrissie Sangria Sebastian
ha
Sorte/Variety
Fläche Acreage 2013
Fläche Acreage 2014
Fläche Acreage 2015
Fläche Acreage 2016
Fläche Acreage 2017
Fläche Acreage 2018
Fläche Acreage 2019
Quelle/Source: Syngenta Seeds

25 Empfohlene Braugerstensorten Frankreich Ernte 2019
Recommended Barley Varieties France Crop 2019
www.malteursdefrance.fr
In commercial and industrial observation:
Etape/Step 1: Varieties which have successfully passed the IFBM pilot tests and
subjected to industrial tests in order to check that all functional Malting and Brewing
expectations are fulfilled. This period should allow commercial development of the
variety.
Etape/Step 2: Varieties under industrial tests in order to check that all functional
Malting and Brewing expectations are fulfilled. They must be multiplied over 150
hectares and must have an interest for a maltster and a brewer.
Admitted in technological validation: New registered varieties on Brewery orientation
list of CTPS and proposed by CBMO to IFBM pilot tests.
Limited use: Variety adapted to certain specifications which commercial output has
to be secured.
Versuche mit relevanten Sorten:
Etape 1: Sorten die in der IFBM Kleinmälzung erfolgreich getetest wurden und
im Großmaßstab getetstet werden sollen um die Malz-Qualität und die
Verarbeitbarkeit in der Brauerei unter Praxisbedingungen zu prüfen. In dieser
Zeit soll die Sorte eine kommerziellen Bedeutung entwickeln.
Etape 2: Sorten die im Großmaßstab auf Mälzungseigenschaften und
Verabeitbarkeit in der Brauerei getestet werden. Sie müssen auf mindestens
150ha vermehrt werden und für Mälzereien und Brauereien interessant sein.
Neu zugelassene Sorten, die für Versuche bei IFBM durch CMBO
vorgeschlagen sind.
Sorten mit beschränkter Verwendung und besonderen Eigenschaften für
Vertragsanbau.
3
1
2
3
1
2
3
4
4 4

26
Frankreich
Qualität der
Sommerbraugerste
Ernte 2019
Details (Protein, Feuchte,
Sortierung und Ertrag)
France
Quality of Spring
Malting Barley
Crop 2019
Details (Protein, Moisture,
Screening and Yield)
Vollkorn,Screening>2.5mm ,% Ertrag, Yield, dt/ha
Protein, % Feuchte, Moisture, %
Grafik/Graphs:
SGS.com
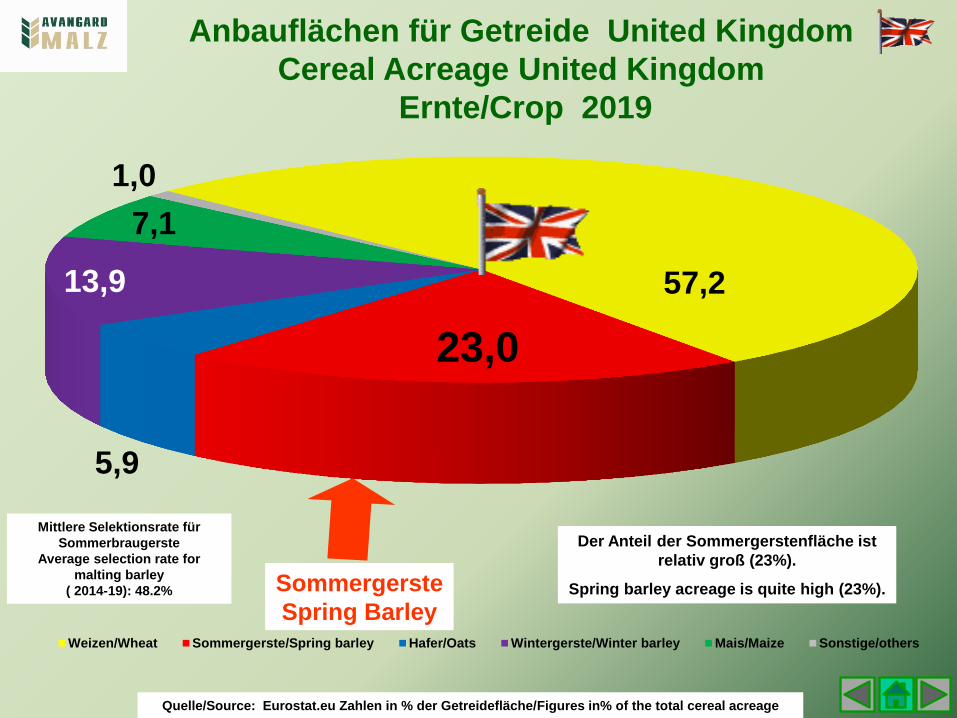
57,2
23,0
5,9
13,9
7,1
1,0
Weizen/Wheat Sommergerste/Spring barley Hafer/Oats Wintergerste/Winter barley Mais/Maize Sonstige/others
Sommergerste
Spring Barley
Quelle/Source: Eurostat.eu Zahlen in % der Getreidefläche/Figures in% of the total cereal acreage
Der Anteil der Sommergerstenfläche ist
relativ groß (23%).
Spring barley acreage is quite high (23%).
Anbauflächen für Getreide United Kingdom
Cereal Acreage United Kingdom
Ernte/Crop 2019
Mittlere Selektionsrate für
Sommerbraugerste
Average selection rate for
malting barley
( 2014-19): 48.2%
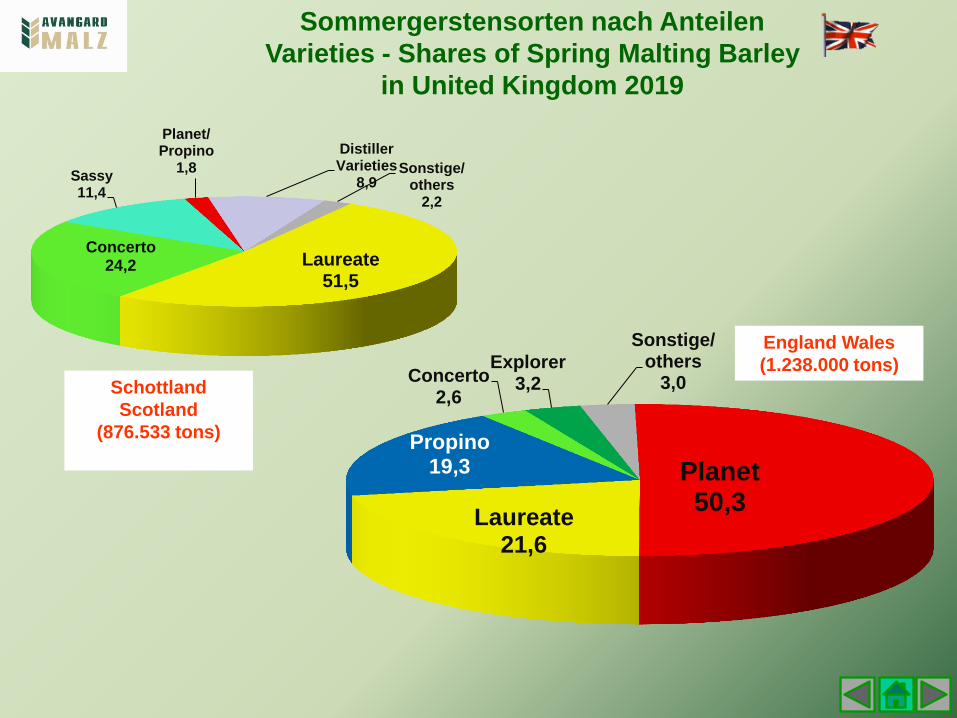
Laureate 51,5
Concerto 24,2
Sassy 11,4
Planet/ Propino
1,8
Distiller Varieties
8,9 Sonstige/
others 2,2
Schottland
Scotland
(876.533 tons)
Sommergerstensorten nach Anteilen
Varieties - Shares of Spring Malting Barley
in United Kingdom 2019
Planet 50,3
Laureate 21,6
Propino 19,3
Concerto 2,6
Explorer 3,2
Sonstige/ others
3,0
England Wales
(1.238.000 tons)

SAATGUTVERMEHRUNGSFLÄCHE in UK 2013-19
SEED MULTIPLICATION in UK – AREAS 2013-19
0
1000
2000
3000
4000
5000
6000
Laureate RGT Planet LGDiablo* Propino KWS Sassy* Sienna* Explorer Concerto KWS Irina
ha
Sorte/Variety
Fläche Acreage 2013 Fläche Acreage 2014
Fläche Acreage 2015 Fläche Acreage 2016
Fläche Acreage 2017 Fläche Acreage 2018
Fläche Acreage 2019
Quelle/Source: Syngenta Seeds
* Für Brennerei/for distilling only

Frankreich
France Etincel
KWS Faro
Isocel
Salamandre Eiweiß/Protein: 9.8-10.8%
Vollgerste/>2.5mm: 84-90%
Feuchte/Moisture: 12.0-13.0%
1.266.000 ha
- 20.000ha
2.600.000t
United Kingdom Pearl
Flagon
SY Venture
Craft
422.000 ha
+41.000 ha
219.000 t
Winterbraugerste: Sorten und Qualitäten - Ernte 2019
Winter Malting Barley: Varieties and Qualities – Crop 2019
Deutschland
Germany Joy
Teepee
Liga
Somerset Eiweiß/Protein: 9.5-11.0%
Vollgerste/>2.5mm: 83-91 %
Feuchte/Moisture: 12.0-14.0%
1.363.000 ha
+147.000ha
80.000-100.000t
Erklärung/Explanation:
Schwarz/black: 2-zeilige Sorten/2-row varieties
Blau/blue: 6-zeilige Sorten/ 6-row varieties
Anbaufläche in ha (Wintergerste)/
Acreage in ha (winter barley)
Grün/green: Winterbraugerste in t/ Winter malting barley in t
Zahlen/Figures: H.M.Gauger GmbH, Eurostat, SGS, Graincom

Frankreich
Qualität der
Wintergerste
Ernte 2019
Details (Protein, Feuchte,
Sortierung und Ertrag)
France
Quality of Winter
Barley
Crop 2019
Details (Protein, Moisture,
Screening and Yield)
Hektoliter Gewicht , hectoliter weight, % Ertrag, Yield, dt/ha
Feuchte, Moisture, %
Grafik/Graphs:
SGS.com
Protein, %

SAATGUTVERMEHRUNGSFLÄCHE in D 2013-19
für zweizeilige Winterbraugerste
SEED MULTIPLICATION in GERMANY – AREAS 2013-19
2 row winter Malting Barley
0
50
100
150
200
250
300
350
400
450K
WS
Lig
a
SY
Te
ep
ee
KW
S
So
me
rs
et
KW
S J
oy
KW
S D
on
au
Win
tm
alt
ha
Sorte/Variety
Fläche Acreage 2013(endgültig/official)Fläche Acreage 2014(engültig/official)Fläche Acreage 2015(engültig/official)Fläche Acreage 2016(engültig/official)Fläche Acreage 2017 (endgültig/official)Fläche/Acreage 2018(endgültig/official)Fläche/Acreage 2019 (vorläufig/preliminary)
Quelle/Source: www.ag-akst.de/

0
50
100
150
200
250
300
165 251 161 64 10 0
0-10 10,1-20 20,1-30 30,1 -40 40,1-50 >50
An
zah
l/N
um
ber
Anzahl/Number Fusarienbefall/Fusarium Contamination in %
Gelsenkirchen BremenKoblenz Lechfeld
Fusarienbelastung Videometerwerte Ernte 2019
Fusarium Contamination by Videometer Crop 2019
Geringer Fusarienbefall -> kein Gushing
Low Fusarium contamination -> no Gushing
0
50
100
150
200
250
300
350
400
450
500
88 168 456 262 42 4
0-10 10,1-20 20,1-30 30,1 -40 40,1-50 >50
Anzahl/Number
Fusarienbefall/Fusarium Contamination in %
An
zah
l/N
um
ber
Lechfeld Muster/Samples
Lechfeld
Koblenz
Bremen
Gelsenkirchen
2012
2017
Erhöhter Fusarienbefall -> Vielleicht Gushing
High Fusarium contamination -> Gushing possible
Stand/last update 03.12.2019
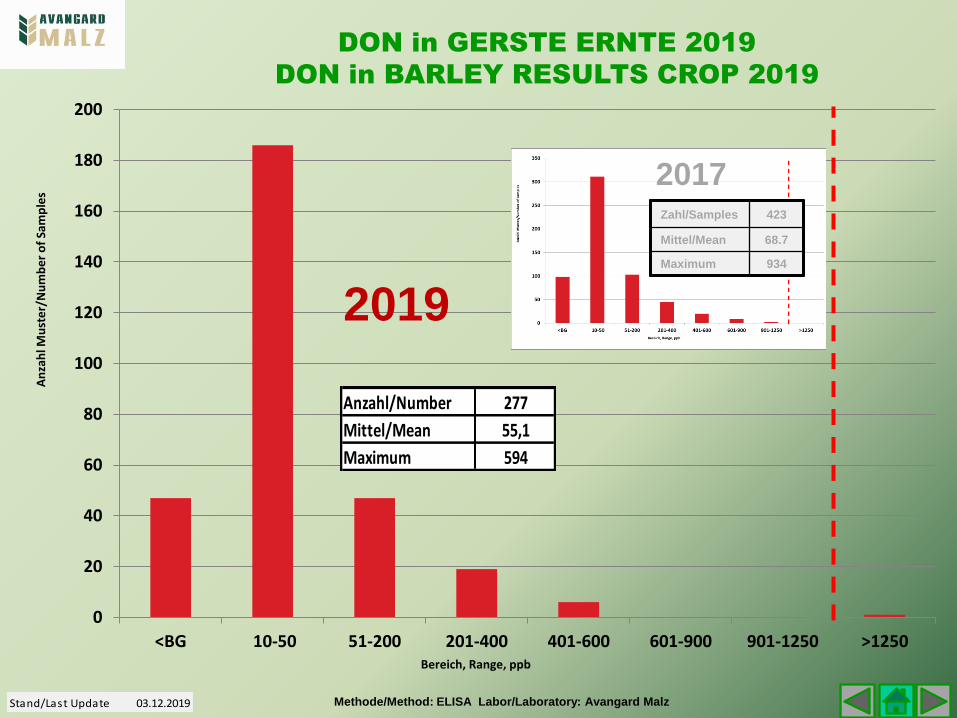
0
20
40
60
80
100
120
140
160
180
200
<BG 10-50 51-200 201-400 401-600 601-900 901-1250 >1250
An
zah
l Mu
ste
r/N
um
be
r o
f Sa
mp
les
Bereich, Range, ppb
DON in GERSTE ERNTE 2019
DON in BARLEY RESULTS CROP 2019
2019
Methode/Method: ELISA Labor/Laboratory: Avangard Malz
2017 Zahl/Samples 423
Mittel/Mean 68.7
Maximum 934
Anzahl/Number 277
Mittel/Mean 55,1
Maximum 594
Stand/Last Update 03.12.2019

227
7 4 4 3 0 0
50
100
150
200
250
0-5 6-25 26-50 51-100 101-150 >150Überschäumvolumen,
g/Flasche Overfoaming, g/botlle
Anzahl/Samples
GUSHING ERNTE 2019
GUSHING RESULTS CROP 2019
29 306 6 13
16 9 4 7 5
939
0
200
400
600
800
0-5 6-25 26-50 51-100 101-150 >150
Anzahl/Samples
Überschäumvolumen, g/Flasche
Overfoaming, g/botlle
a
Ernte/Crop 2013
0
200
400
600
800
1000
0-5 6-25 26-50 51-100 101-150 >150
Anzahl/Samples
Überschäumvolumen, g/Flasche
Overfoaming, g/botlle
Ernte/Crop 2012
Stand/last update 03.12.2019

GUSHING DEUTSCHLAND (in %)
GUSHING RESULTS GERMANY (in %)
NiSa = Niedersachsen, BY = Bayern, NRW = Nordrhein-Westfalen, RLP = Rheinland-Pfalz, BW = Baden-Württemberg SA =Sachsen
METHODE: Modifizierter Carlsberg Gushing Test METHOD: Modified Carlsberg Gushing Test
0
10
20
30
40
50
60
70
80
90
100
4 89 0 34 14 0
Nisa BY NRW RLP BW SA
% Anteil Proben je Klasse Percentage of samples per class
Bundesland/Region Anzahl Ergebnisse gesamt/Number of total results
0-5g 6-25g 26-50g 51-100g 101-150g >150g
Überschäumvolumen/Flasche Overfoaming/bottle
Stand/last update 03.12.2019
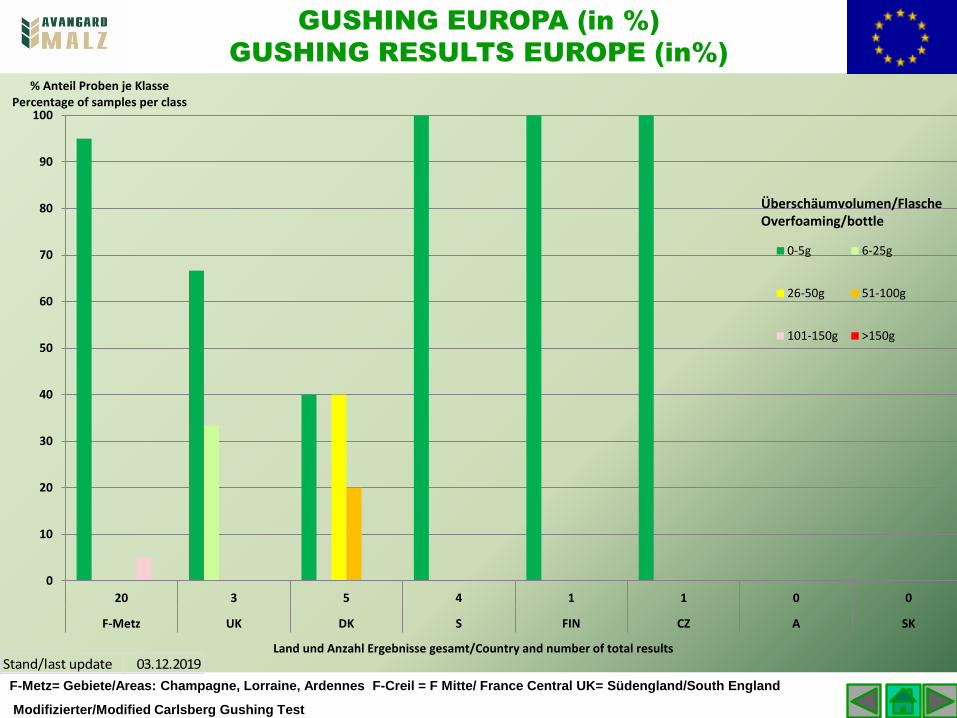
GUSHING EUROPA (in %)
GUSHING RESULTS EUROPE (in%)
F-Metz= Gebiete/Areas: Champagne, Lorraine, Ardennes F-Creil = F Mitte/ France Central UK= Südengland/South England
Modifizierter/Modified Carlsberg Gushing Test
Stand/last update 03.12.2019
0
10
20
30
40
50
60
70
80
90
100
20 3 5 4 1 1 0 0
F-Metz UK DK S FIN CZ A SK
% Anteil Proben je Klasse Percentage of samples per class
Land und Anzahl Ergebnisse gesamt/Country and number of total results
0-5g 6-25g
26-50g 51-100g
101-150g >150g
Überschäumvolumen/Flasche Overfoaming/bottle

GUSHING – WINTERGERSTE und WEIZEN (in%)
GUSHING – WHEAT and WINTER BARLEY(in%)
WEI = Weizen/Wheat Wi = Wintergerste/winter barley D=Deutschland/Germany: CZ=Tschechien/Czech Rep., Sonst=Sonstige Herkunft/Other
origins METHODE: Modifizierter Carlsberg Gushing Test METHOD: Modified Carlsberg Gushing Test
0
10
20
30
40
50
60
70
80
90
100
18 22 0 1 29 0 0
WiD WiF WiSonst. WiCZ WeiD WeiCZ WeiSonst.
% Anteil Proben je Klasse Percentage of samples per class
Land und Anzahl Ergebnisse gesamt/Country and number of total results
0-5g 6-25g
26-50g 51-100g
101-150g >150g
Überschäumvolumen/Flasche Overfoaming/bottle
Stand/last update 03.12.2019
Frankreich
Südwest
-
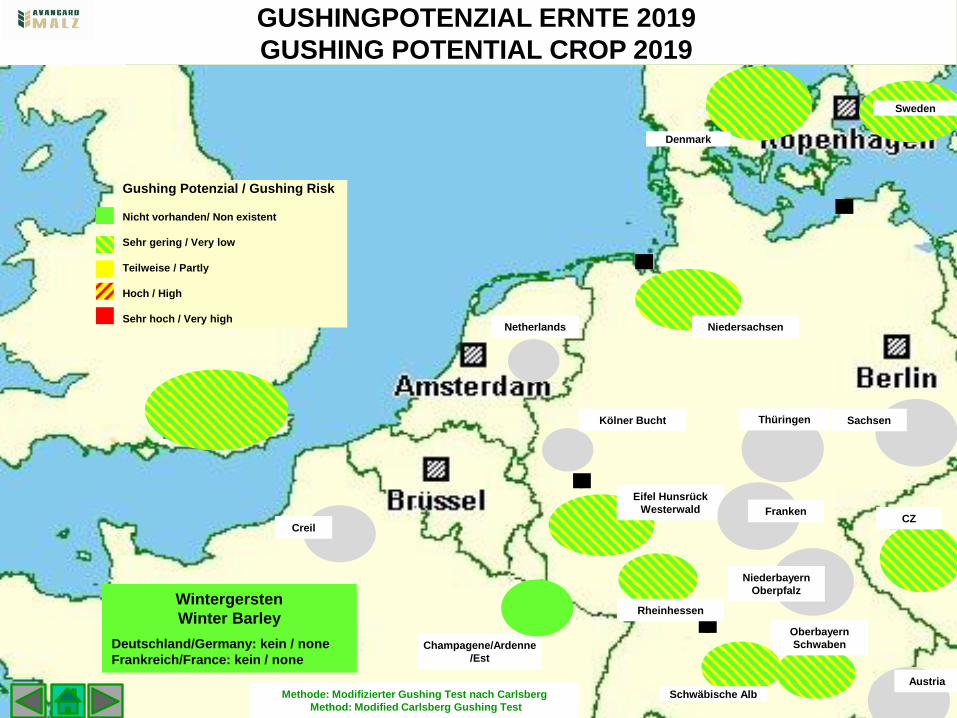
Methode: Modifizierter Gushing Test nach Carlsberg
Method: Modified Carlsberg Gushing Test
GUSHINGPOTENZIAL ERNTE 2019
GUSHING POTENTIAL CROP 2019
Netherlands
Wintergersten
Winter Barley
Deutschland/Germany: kein / none
Frankreich/France: kein / none
Gushing Potenzial / Gushing Risk
Nicht vorhanden/ Non existent
Sehr gering / Very low
Teilweise / Partly
Hoch / High
Sehr hoch / Very high
Austria
CZ
Rheinhessen
Champagene/Ardenne
/Est
Oberbayern
Schwaben
Kölner Bucht
Creil
Eifel Hunsrück
Westerwald
Schwäbische Alb
Niedersachsen
Denmark
Sweden
Sachsen Thüringen
Niederbayern
Oberpfalz
Franken
Lechfeld
Schwäbische Alb
Oberbayern
Rheinhessen
Denmark
Frankreich
Südwest
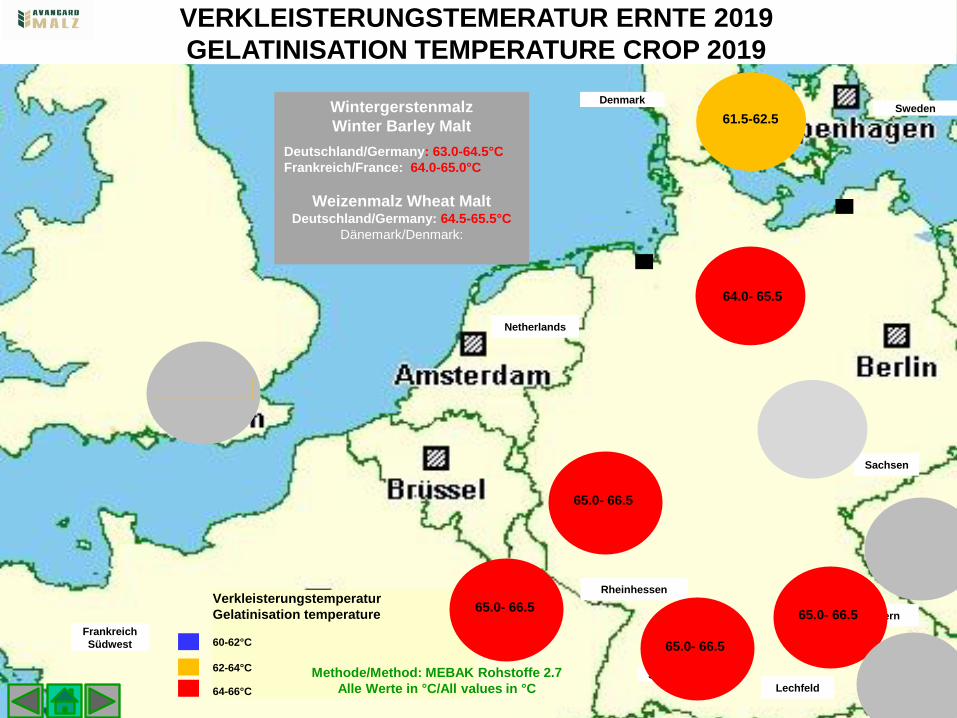
Verkleisterungstemperatur
Gelatinisation temperature
60-62°C
62-64°C
64-66°C
Sweden
-
Methode/Method: MEBAK Rohstoffe 2.7
Alle Werte in °C/All values in °C
VERKLEISTERUNGSTEMERATUR ERNTE 2019
GELATINISATION TEMPERATURE CROP 2019
Netherlands
Sachsen
Wintergerstenmalz
Winter Barley Malt
Deutschland/Germany: 63.0-64.5°C
Frankreich/France: 64.0-65.0°C
Weizenmalz Wheat Malt Deutschland/Germany: 64.5-65.5°C
Dänemark/Denmark:
65.0- 66.5
61.5-62.5
65.0- 66.5
65.0- 66.5
65.0- 66.5
64.0- 65.5
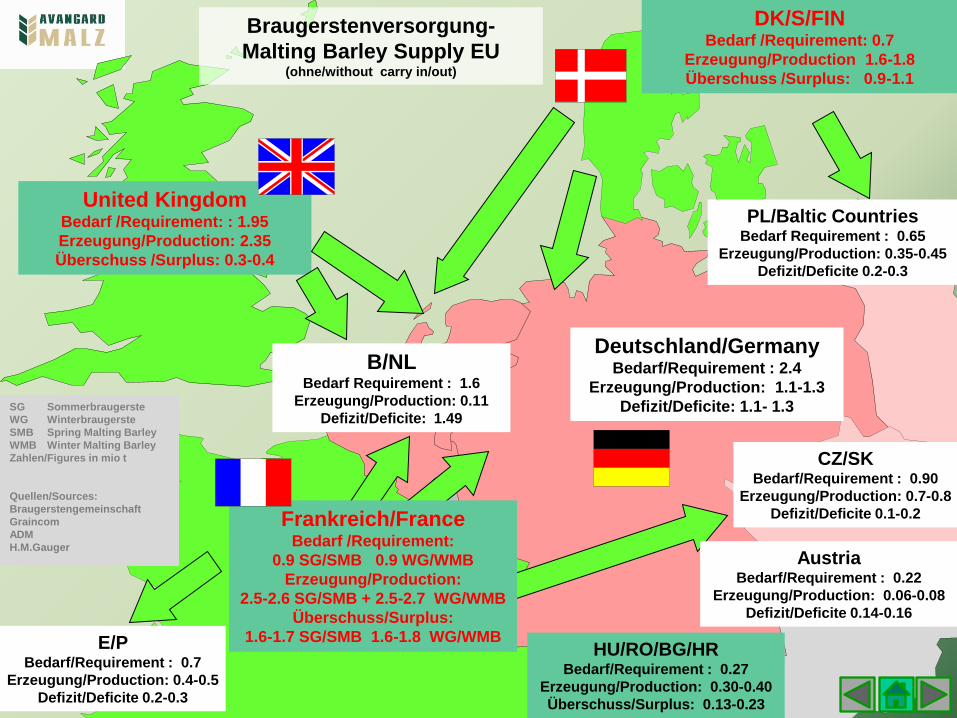
Braugerstenversorgung-
Malting Barley Supply EU (ohne/without carry in/out)
Deutschland/Germany Bedarf/Requirement : 2.4
Erzeugung/Production: 1.1-1.3
Defizit/Deficite: 1.1- 1.3
United Kingdom Bedarf /Requirement: : 1.95
Erzeugung/Production: 2.35
Überschuss /Surplus: 0.3-0.4
SG Sommerbraugerste
WG Winterbraugerste
SMB Spring Malting Barley
WMB Winter Malting Barley
Zahlen/Figures in mio t
Quellen/Sources:
Braugerstengemeinschaft
Graincom
ADM
H.M.Gauger
B/NL Bedarf Requirement : 1.6
Erzeugung/Production: 0.11
Defizit/Deficite: 1.49
PL/Baltic Countries Bedarf Requirement : 0.65
Erzeugung/Production: 0.35-0.45
Defizit/Deficite 0.2-0.3
E/P Bedarf/Requirement : 0.7
Erzeugung/Production: 0.4-0.5
Defizit/Deficite 0.2-0.3
CZ/SK Bedarf/Requirement : 0.90
Erzeugung/Production: 0.7-0.8
Defizit/Deficite 0.1-0.2
Austria Bedarf/Requirement : 0.22
Erzeugung/Production: 0.06-0.08
Defizit/Deficite 0.14-0.16
HU/RO/BG/HR Bedarf/Requirement : 0.27
Erzeugung/Production: 0.30-0.40
Überschuss/Surplus: 0.13-0.23
DK/S/FIN Bedarf /Requirement: 0.7
Erzeugung/Production 1.6-1.8
Überschuss /Surplus: 0.9-1.1
Frankreich/France Bedarf /Requirement:
0.9 SG/SMB 0.9 WG/WMB
Erzeugung/Production:
2.5-2.6 SG/SMB + 2.5-2.7 WG/WMB
Überschuss/Surplus:
1.6-1.7 SG/SMB 1.6-1.8 WG/WMB

Getreideanbauflächen in EU Ländern
Cereal Acreage in EU Countries
2009-2019
Quelle/source:eurosta.com
Bitte beachten/:Die y-Achsen haben
unterschiedliche Skalierungen!
Please note: The y-axes have various scales

Saatgutvermehrungsflächen für Sommergerste EU 2019
Top 15 Braugersten Sorten
Seed Multiplication Acreage of Spring Barley– EU 2019
Top 15 Malting Barley Varieties
Quelle/Source: Syngenta
19,3
9,5
5,5
3,1 2,7 2,3 2,1
2,0 1,8
1,6 1,3
1,2
1,0
1,0
1,0
Anteil/Share, % RGT Planet
Laureate
KWS Irina
Flair
Avalon
Bojos
KWS Fantex
Ellinor
Evergreen
Propino
Overture
Leandra
Laudis 550
Quench
Fandaga
Die Gesamtläche für Saatgutvermehrung von Sommergerstein Europa ist ca. 110.000ha. Die Top 15 Braugersten-
-Sorten nehmen ca. 55% davon ein. Planet ist mit weitem Abstand die bedeutendste Sorte .
Total acreage or spring barley seed multiplication in Europe is ca. 110,000 ha. The Top 15 malting barley varieties
account for 55% of the area. Planet is by far the dominant variety.
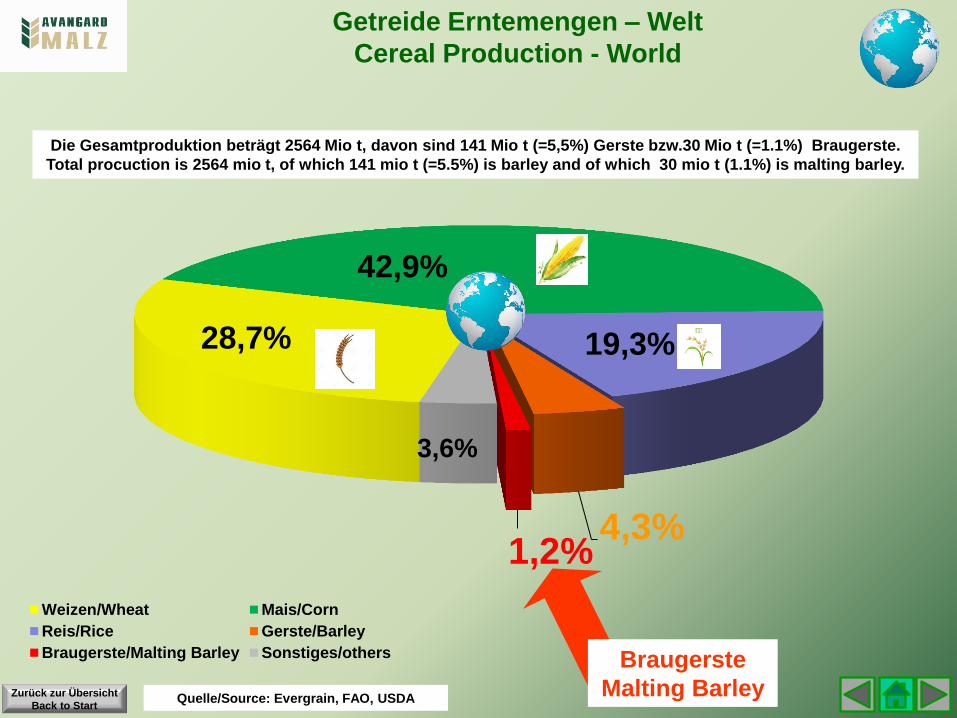
28,7%
42,9%
19,3%
4,3% 1,2%
3,6%
Weizen/Wheat Mais/Corn
Reis/Rice Gerste/Barley
Braugerste/Malting Barley Sonstiges/others
Getreide Erntemengen – Welt
Cereal Production - World
Quelle/Source: Evergrain, FAO, USDA
Die Gesamtproduktion beträgt 2564 Mio t, davon sind 141 Mio t (=5,5%) Gerste bzw.30 Mio t (=1.1%) Braugerste.
Total procuction is 2564 mio t, of which 141 mio t (=5.5%) is barley and of which 30 mio t (1.1%) is malting barley.
Zurück zur Übersicht
Back to Start
Braugerste
Malting Barley

Braugerstenproduktion Erntemengen – Welt
Malting Barley Production - World
Quelle/Source: Evergrain, FAO, USDA
Die EU liefert den mit weitem Abstand größten Teil der Braugerste weltweit.
The EU countries produce by far the biggest amount of malting barley, world wide.
Zurück zur Übersicht
Back to Start
14,0 13,6 12,4
11,4 12,7 13,0 13,4 13,6
11,6 11,8 12,5
2,3 1,8
1,3 1,7
1,8 1,8 2,4 2,2
2,3 1,8 2,2
3,2 3,5
2,8 2,3
2,3 2,4
3,0 2,1
2,4 2,5 2,0
1,5 0,9
1,8 2,8
3,1 3,0
1,8 3,1
2,1 2,3 2,8
2,6
2,5
2,6 2,3
2,4 2,9 2,8
2,9
3,4 2,7
2,9
0,0
5,0
10,0
15,0
20,0
25,0
2008/09 2009/10 2010/11 2011/12 2012/13 2013/14 2014/15 2015/16 2016/17 2017/18 2018/19
Mio
to
n
Australia Argentina Canada Russland/Russia EU

Source: Evergrain
Äquator Equator
Hauptanbauregionen für Gerste in der Welt Main Barley Producing Regions Worldwide

Source: Evergrain
47 Preisentwicklung Brau- und Futtergerste 2016-2019 Evolution of Prices for Malting and Feed Grade Barley 2016 -19
€ 120,00
€ 140,00
€ 160,00
€ 180,00
€ 200,00
€ 220,00
€ 240,00
€ 260,00
2rs malting barley Creil 6rs malting barley Creil Feed Barley
Crop 16 Crop 17 Crop 18 Crop 19
SEP 16 SEP 17 SEP 18 SEP 19
SPREAD 2rs vs 6rs
High 40.00 €
Average 21.00 €
Low 0.00 €
SPREAD 2rs vs Feed
High 65.00 €
Average 35.00 €
Low 6.50 €
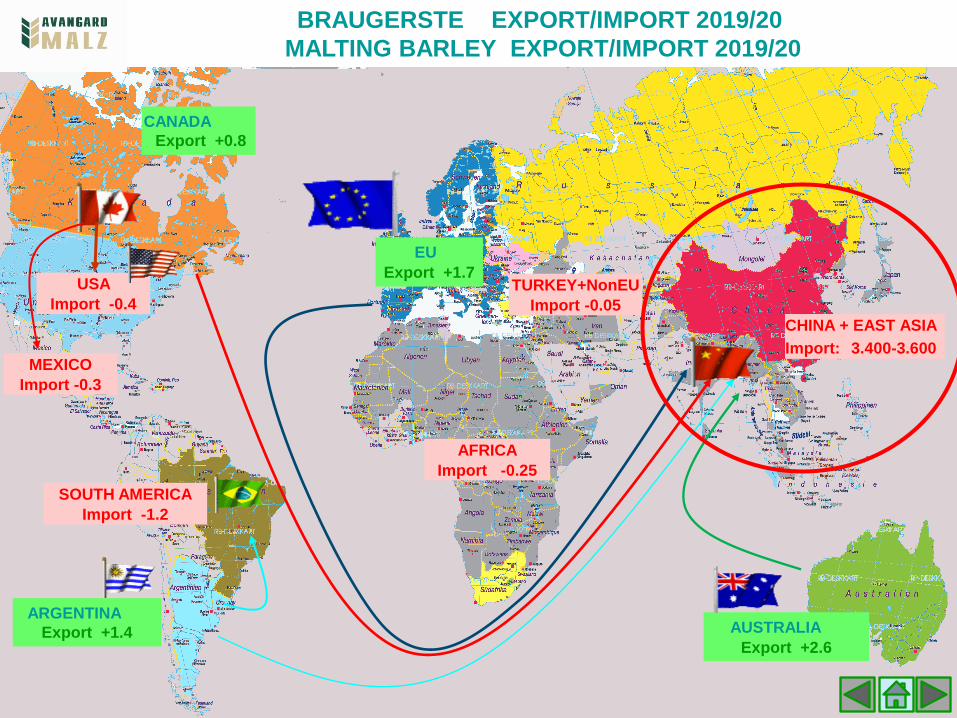
BRAUGERSTE EXPORT/IMPORT 2019/20
MALTING BARLEY EXPORT/IMPORT 2019/20
CANADA
Export +0.8
EU
Export +1.7
AUSTRALIA
Export +2.6
ARGENTINA
Export +1.4
SOUTH AMERICA
Import -1.2
AFRICA
Import -0.25
TURKEY+NonEU
Import -0.05
USA
Import -0.4
MEXICO
Import -0.3
CHINA + EAST ASIA
Import: 3.400-3.600

Zahlen/Figures: Barth Haas Group Barth Report 1991-2018
11
50
11
50
11
60
12
00
12
30
12
50
12
90
13
20
13
50
13
90
13
90
14
20
14
80
15
20
1550
1610 1
787
18
30
18
30
18
46
19
29
19
51
19
72
19
63
19
33
19
51
19
42
19
05
600
800
1000
1200
1400
1600
1800
2000
2200
199
1
199
2
199
3
199
4
199
5
199
6
199
7
199
8
199
9
200
0
200
1
200
2
200
3
200
4
200
5
200
6
200
7
200
8
200
9
201
0
201
1
201
2
201
3
201
4
201
5
201
6
201
7
201
8
Mio hl
BIER PRODUKTION WELT 1999 -2018
BEER PRODUCTION WORLD 1999- 2018

381
215
141
120 94 78 53
42 41 43
38
452
China USA Brazil Mexico Germany Russia Japan
UK Poland Vietnam Spain South Africa Netherlands Nigeria
India Phillipines Canada Colombia France CZ Rest
BIER PRODUKTION WELT 2018 nach Ländern
BEER PRODUCTION WORLD 2018 by Country
Quelle/Source: Barth Report 2018
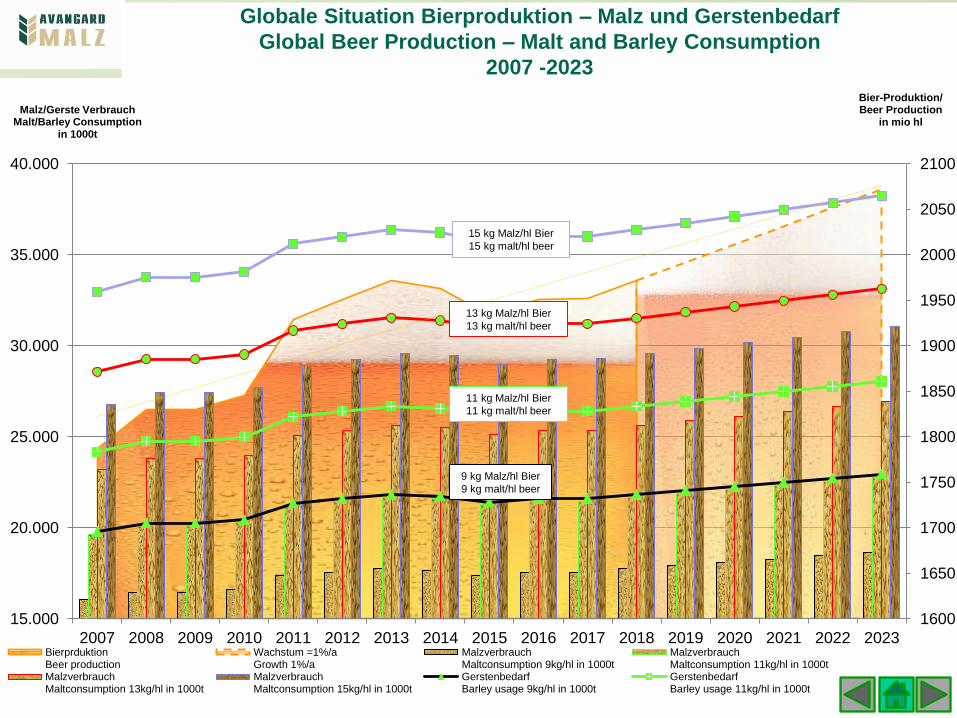
Globale Situation Bierproduktion – Malz und Gerstenbedarf
Global Beer Production – Malt and Barley Consumption
2007 -2023
Zurück zur Übersicht
Back to Start
Quellen/Sources:
1600
1650
1700
1750
1800
1850
1900
1950
2000
2050
2100
15.000
20.000
25.000
30.000
35.000
40.000
2007 2008 2009 2010 2011 2012 2013 2014 2015 2016 2017 2018 2019 2020 2021 2022 2023
Bier-Produktion/ Beer Production
in mio hl Malz/Gerste Verbrauch
Malt/Barley Consumption in 1000t
BierprduktionBeer production
Wachstum =1%/aGrowth 1%/a
MalzverbrauchMaltconsumption 9kg/hl in 1000t
MalzverbrauchMaltconsumption 11kg/hl in 1000t
MalzverbrauchMaltconsumption 13kg/hl in 1000t
MalzverbrauchMaltconsumption 15kg/hl in 1000t
GerstenbedarfBarley usage 9kg/hl in 1000t
GerstenbedarfBarley usage 11kg/hl in 1000t
9 kg Malz/hl Bier
9 kg malt/hl beer
11 kg Malz/hl Bier
11 kg malt/hl beer
13 kg Malz/hl Bier
13 kg malt/hl beer
15 kg Malz/hl Bier
15 kg malt/hl beer

Malz und Gerstenbedarf für die Weltbierproduktion und Kapazitäten der
Mälzereien weltweit
Malt and Barley Demand for Global Beer Production and Annual capacity of
malt houses worldwide
Quellen/Sources: Barth Report
Malzeinsatz
Malt per hl
8kg/hl 10 kg/hl 12 kg/hl 14 kg/hl
Malz, t
Malt, t
15.616.000 19.520.000 23.240.000 27.328.000
Gerste, t
Barley, t
19.520.000 24.400.000 29.280.000 34.160.000
Die Top 20 Mälzereien haben ca. 16 Mio Tonnen Kapazität (Inklusive Neubauten in
Holland 110000t/a , Belgien 250000t/a und Deutschland 35.000t/a).
In naher Zukunft gehen weitere 100000 t/a in Vietnam und 200.00t in Australien in Betrieb.
In den USA wurden 400.000 t/a stillgelegt.
Weltweit gesehen ist die Mälzereikapazität gerade ausreichend.
The Top 20 malting companies have a capacity of 16 mln. Tons. This includes extensions
in Holland (100000t), Belgium (250000t) and Germany (35000t).
In the near future additional capacity in Vietnam (100000t) and Australia (200000t) will be
ready. In USA 400000t capacity has been closed down.
In total the capacity is just big enough.
Malz- und Gerstenbedarf für Weltbierproduktion in Abhängigkeit von Malzschüttung
Malt and Barley Requirement for World beer production depending on specific use in brewing

0
500
1000
1500
2000
2500
3000
3500A
xe
rea
l (+
Ca
rg
ill)
So
uff
let
Ma
lte
uro
p+
IMC
Gra
in C
orp
Su
perti
me
Ava
ng
ard
Ma
lz/A
gro
Co
fco
Da
lia
n
Vik
ing
Ma
lt
Rah
r
Cri
sp
Ag
raria
IRE
KS
Ho
llan
d M
alt
Sim
ps
on
Th
e M
alt
Co
Erfu
rte
r M
alz
Mu
nto
ns
Fu
gls
an
g
Bes
t M
alz
1000 m
t/a
Germany, Austria F, B, NL
UK, IRL E, P,I,GR
DK, S, FIN East Europe/Baltic
Russia/Ukraine/CIS USA/Canada
China/India Australia/New Zealand
South America under construction
53 Zahlen/Figures: 10 2019 Axereal = Greencore+Boortmalt+Cargill Grain Corp= Great Western, Canada Malting, Bairds
Mälzereikapazitäten – Weltweit 2019
Malt House Capacities – Worldwide 2019