vertebrate codon bias indicates a highly gc-rich...
TRANSCRIPT
Gene xxx (2013) xxx–xxx
GENE-38291; No. of pages: 7; 4C:
Contents lists available at SciVerse ScienceDirect
Gene
j ourna l homepage: www.e lsev ie r .com/ locate /gene
Vertebrate codon bias indicates a highly GC-rich ancestral genome
Maryam Nabiyouni a,1, Ashwin Prakash a,b,2, Alexei Fedorov a,b,⁎a Program in Bioinformatics and Proteomics/Genomics, University of Toledo, Health Science Campus, Toledo, OH 43614, USAb Department of Medicine, University of Toledo, Health Science Campus, Toledo, OH 43614, USA
Abbreviations: A, Adenosine; BGC, Biased Gene Convbias; CBI, Codon Bias Index; G, Guanosine; GC3, G or CSNP, Single Nucleotide Polymorphism; T, Thymidine.⁎ Corresponding author at: Department ofMedicine, Uni
Campus, Toledo, OH 43614, USA. Tel.: +1 419 383 5270; fE-mail addresses: [email protected]
[email protected] (A. Prakash), Alexei.fedorov@u1 Current address: Biomedical Engineering, College of En
Toledo, OH 43606, USA.2 Current address: Department of Biomedical Enginee
School of Medicine, Baltimore, MD 21205, USA.
0378-1119/$ – see front matter © 2013 Elsevier B.V. Allhttp://dx.doi.org/10.1016/j.gene.2013.01.033
Please cite this article as: Nabiyouni, M., et al10.1016/j.gene.2013.01.033
a b s t r a c t
a r t i c l e i n f oArticle history:Accepted 17 January 2013Available online xxxx
Keywords:BioinformaticsGenomicsEvolutionIntronComputational biology
Two factors are thought to have contributed to the origin of codon usage bias in eukaryotes: 1) genome-widemutational forces that shape overall GC-content and create context-dependent nucleotide bias, and 2) positiveselection for codons thatmaximize efficient and accurate translation. Particularly in vertebrates, these two expla-nations contradict each other and cloud the origin of codon bias in the taxon. On the one hand, mutational forcesfail to explain GC-richness (~60%) of third codon positions, given the GC-poor overall genomic compositionamong vertebrates (~40%). On the other hand, positive selection cannot easily explain strict regularities incodon preferences. Large-scale bioinformatic assessment, of nucleotide composition of coding and non-codingsequences in vertebrates and other taxa, suggests a simple possible resolution for this contradiction. Specifically,we propose that the last common vertebrate ancestor had a GC-rich genome (~65% GC). The data suggest thatwhole-genome mutational bias is the major driving force for generating codon bias. As the bias becomes prom-inent, it begins to affect translation and can result in positive selection for optimal codons. The positive selectioncan, in turn, significantly modulate codon preferences.
© 2013 Elsevier B.V. All rights reserved.
1. Introduction
Synonymous codons are nucleotide triplets that are translated intothe same amino acid. Codon bias – an unequal frequency usage of thecodons from the same synonymous group – is a general phenomenoncharacteristic to all organisms from bacteria to multicellular eukaryotes.The codon having the highest frequency within its synonymous group isreferred to as optimal or preferred. Usually, closely related species havevery similar spectrum of codon biases. For instance, all mammals havesimilar codon usage frequencies. Evenmore distantly related vertebrateshave about the same sets of optimal codons (for example compareTables 1 and S1). In contrast, codon usage drastically differs amongevolutionary distant species, such as human, fruit fly, worm, yeast, andArabidopsis (see Codon Usage Database which represents codon fre-quencies for thousands of species (Nakamura et al., 2000)). Various ex-planations for the creation of codon bias have been proposed (Duret,2002; Hershberg and Petrov, 2008; Plotkin and Kudla, 2011). After a
ersion; C, Cytidine; CB, Codonat the third codon position;
versity of Toledo, Health Scienceax: +1 419 383 3102.o.edu (M. Nabiyouni),toledo.edu (A. Fedorov).gineering, University of Toledo,
ring, Johns Hopkins University
rights reserved.
., Vertebrate codon bias indica
comprehensive examination of codon frequencies in prokaryotes, asdescribed by Chen et al. (2004), a consensus view was established thatthe whole-genome nucleotide composition bias is the primary causefor codon bias in bacteria. However, this explanation is much more con-troversial for eukaryotes. Two recent reviews on this issue propoundedtwo main forces that could be responsible for the creation and mainte-nance of codon bias (Hershberg and Petrov, 2008; Plotkin and Kudla,2011). The authors suggest that in addition to the genome-wide muta-tional force, as seen in bacteria, positive selection for optimal codonsdue to benefits in translational efficiency and fidelity is a major propo-nent. This notion is supported by bioinformatic analysis of the influenceof surrounding nucleotides on codon preferences in various eukaryoticspecies. Particularly, in about half of the cases, the context-dependentcodon bias could not be explained by genome-wide mutational forces(Fedorov et al., 2002). Also, Chamary and co-authors reviewed evidencethat variable sites in synonymous codons are important in mRNA stabil-ity and proper splicing (Chamary et al., 2006). Thus, these synonymoussitesmight not only be under the selection for accuracy and effectivenessof protein synthesis, but also under extra selection forces.
Despite significant progress in this field over a number of years,there is no consensus on the predominant force behind eukaryoticcodon bias. There are several strong arguments in support of each ofthe two forces for the leading role. We attempt to resolve this dilem-ma for vertebrates by re-assessment of extensive genomic datasets.
The uncertainty in explaining codon bias partially exists because thisphenomenon is gene-specific. In other words, within the same genomeone group of genes could have very strong codon bias, while anothergroup may have a more balanced distribution of all synonymous
tes a highly GC-rich ancestral genome, Gene (2013), http://dx.doi.org/
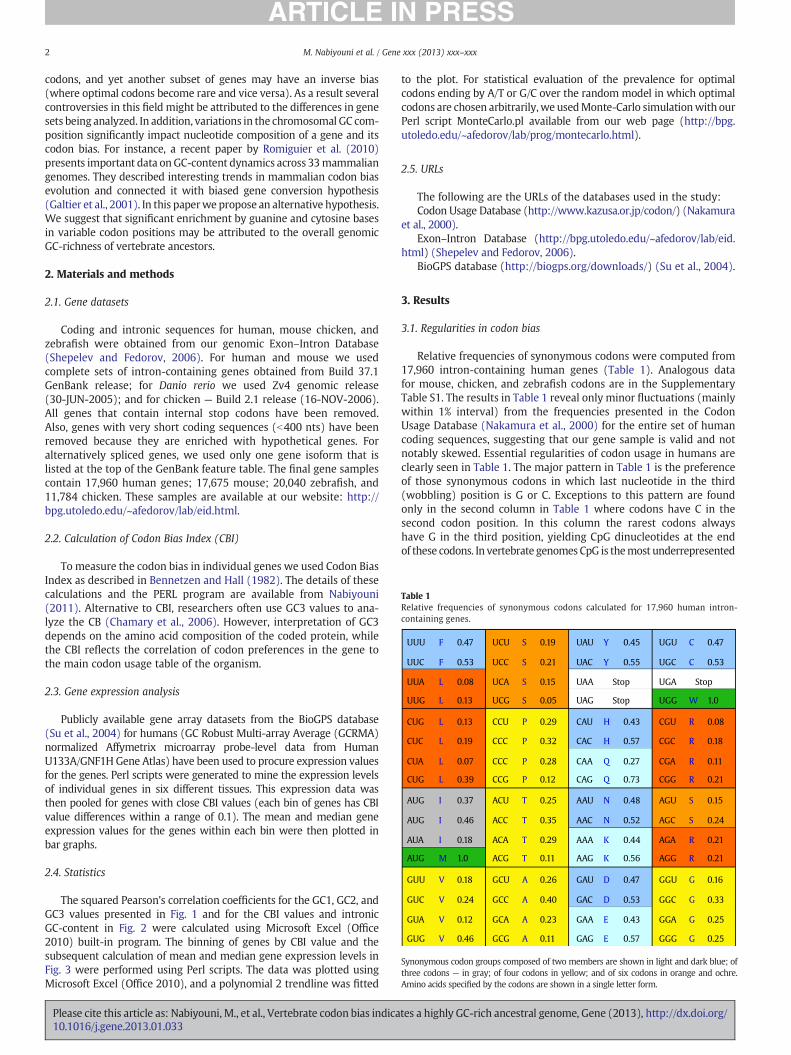
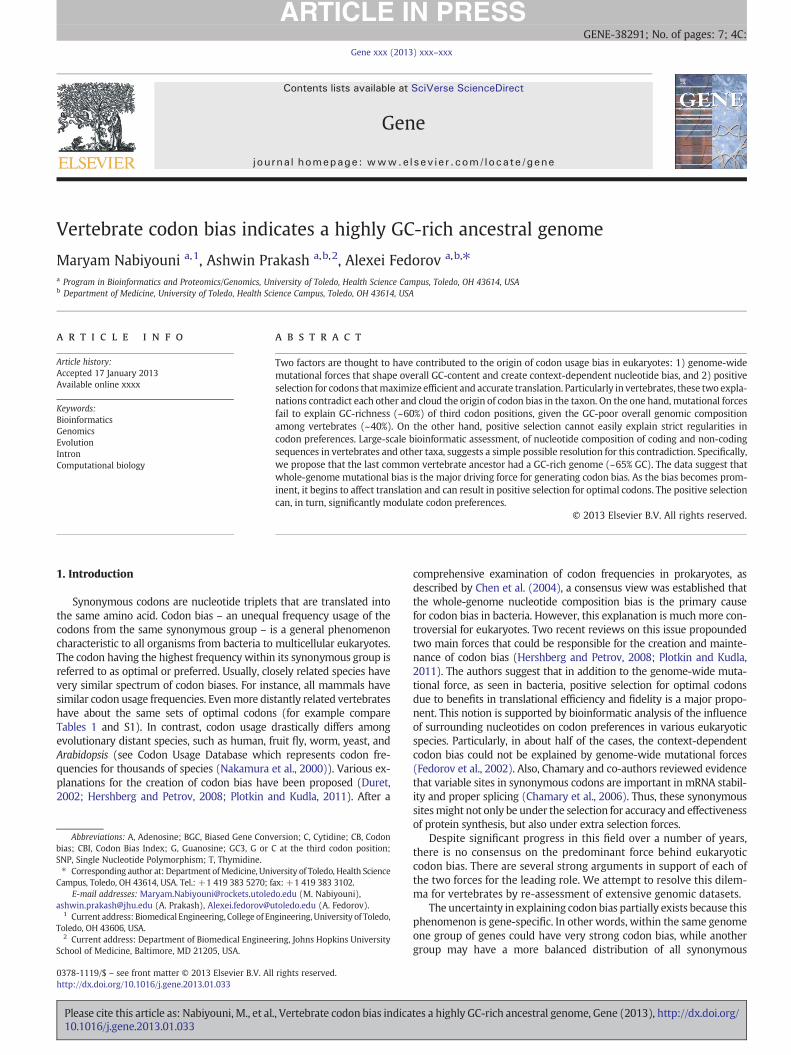
Table 1Relative frequencies of synonymous codons calculated for 17,960 human intron-containing genes.
UUU
UUC
UUA
UUG
CUG
CUG
CUC
CUA
AUG
AUG
AUG
GUU
GUC
GUA
GUG
AUA
F
F
L
L
L
L
L
L
I
I
I
M
V
V
V
V
0.47
0.53
0.08
0.13
0.13
0.19
0.07
0.39
0.37
0.46
0.18
0.18
0.24
0.12
0.46
1.0
UCU
UCC
UCA
UCG
CCU
CCC
CCG
CCC
ACU
ACC
ACA
ACG
GCU
GCC
GCA
GCG
S
S
S
S
P
P
P
P
T
T
T
T
A
A
A
A
0.19
0.21
0.15
0.05
0.29
0.32
0.28
0.12
0.25
0.35
0.29
0.11
0.26
0.40
0.23
0.11 GAG
GAA
GAC
GAU
AAG
AAA
AAC
AAU
CAG
CAA
CAU
UAG
UAA
UAC
UAU Y
Y
Stop
Stop
H
H
Q
Q
CAC
N
N
K
K
D
D
E
E
0.45
0.55
0.43
0.57
0.27
0.73
0.48
0.52
0.44
0.56
0.47
0.53
0.43
0.57
UGU
UGC
UGA
UGG
CGU
CGC
CGA
CGG
AGU
AGC
AGA
AGG
GGU
GGC
GGA
GGG G
G
G
G
R
R
R
R
R
R
S
S
W
Stop
0.53
0.47C
C
1.0
0.08
0.18
0.11
0.21
0.15
0.24
0.21
0.21
0.16
0.33
0.25
0.25
Synonymous codon groups composed of two members are shown in light and dark blue; ofthree codons — in gray; of four codons in yellow; and of six codons in orange and ochre.Amino acids specified by the codons are shown in a single letter form.
2 M. Nabiyouni et al. / Gene xxx (2013) xxx–xxx
codons, and yet another subset of genes may have an inverse bias(where optimal codons become rare and vice versa). As a result severalcontroversies in this field might be attributed to the differences in genesets being analyzed. In addition, variations in the chromosomal GC com-position significantly impact nucleotide composition of a gene and itscodon bias. For instance, a recent paper by Romiguier et al. (2010)presents important data onGC-content dynamics across 33mammaliangenomes. They described interesting trends in mammalian codon biasevolution and connected it with biased gene conversion hypothesis(Galtier et al., 2001). In this paperwe propose an alternative hypothesis.We suggest that significant enrichment by guanine and cytosine basesin variable codon positions may be attributed to the overall genomicGC-richness of vertebrate ancestors.
2. Materials and methods
2.1. Gene datasets
Coding and intronic sequences for human, mouse chicken, andzebrafish were obtained from our genomic Exon–Intron Database(Shepelev and Fedorov, 2006). For human and mouse we usedcomplete sets of intron-containing genes obtained from Build 37.1GenBank release; for Danio rerio we used Zv4 genomic release(30-JUN-2005); and for chicken — Build 2.1 release (16-NOV-2006).All genes that contain internal stop codons have been removed.Also, genes with very short coding sequences (b400 nts) have beenremoved because they are enriched with hypothetical genes. Foralternatively spliced genes, we used only one gene isoform that islisted at the top of the GenBank feature table. The final gene samplescontain 17,960 human genes; 17,675 mouse; 20,040 zebrafish, and11,784 chicken. These samples are available at our website: http://bpg.utoledo.edu/~afedorov/lab/eid.html.
2.2. Calculation of Codon Bias Index (CBI)
To measure the codon bias in individual genes we used Codon BiasIndex as described in Bennetzen and Hall (1982). The details of thesecalculations and the PERL program are available from Nabiyouni(2011). Alternative to CBI, researchers often use GC3 values to ana-lyze the CB (Chamary et al., 2006). However, interpretation of GC3depends on the amino acid composition of the coded protein, whilethe CBI reflects the correlation of codon preferences in the gene tothe main codon usage table of the organism.
2.3. Gene expression analysis
Publicly available gene array datasets from the BioGPS database(Su et al., 2004) for humans (GC Robust Multi-array Average (GCRMA)normalized Affymetrix microarray probe-level data from HumanU133A/GNF1H Gene Atlas) have been used to procure expression valuesfor the genes. Perl scripts were generated to mine the expression levelsof individual genes in six different tissues. This expression data wasthen pooled for genes with close CBI values (each bin of genes has CBIvalue differences within a range of 0.1). The mean and median geneexpression values for the genes within each bin were then plotted inbar graphs.
2.4. Statistics
The squared Pearson's correlation coefficients for the GC1, GC2, andGC3 values presented in Fig. 1 and for the CBI values and intronicGC-content in Fig. 2 were calculated using Microsoft Excel (Office2010) built-in program. The binning of genes by CBI value and thesubsequent calculation of mean and median gene expression levels inFig. 3 were performed using Perl scripts. The data was plotted usingMicrosoft Excel (Office 2010), and a polynomial 2 trendline was fitted
Please cite this article as: Nabiyouni, M., et al., Vertebrate codon bias indica10.1016/j.gene.2013.01.033
to the plot. For statistical evaluation of the prevalence for optimalcodons ending by A/T or G/C over the random model in which optimalcodons are chosen arbitrarily,we usedMonte-Carlo simulationwith ourPerl script MonteCarlo.pl available from our web page (http://bpg.utoledo.edu/~afedorov/lab/prog/montecarlo.html).
2.5. URLs
The following are the URLs of the databases used in the study:Codon Usage Database (http://www.kazusa.or.jp/codon/) (Nakamura
et al., 2000).Exon–Intron Database (http://bpg.utoledo.edu/~afedorov/lab/eid.
html) (Shepelev and Fedorov, 2006).BioGPS database (http://biogps.org/downloads/) (Su et al., 2004).
3. Results
3.1. Regularities in codon bias
Relative frequencies of synonymous codons were computed from17,960 intron-containing human genes (Table 1). Analogous datafor mouse, chicken, and zebrafish codons are in the SupplementaryTable S1. The results in Table 1 reveal only minor fluctuations (mainlywithin 1% interval) from the frequencies presented in the CodonUsage Database (Nakamura et al., 2000) for the entire set of humancoding sequences, suggesting that our gene sample is valid and notnotably skewed. Essential regularities of codon usage in humans areclearly seen in Table 1. The major pattern in Table 1 is the preferenceof those synonymous codons in which last nucleotide in the third(wobbling) position is G or C. Exceptions to this pattern are foundonly in the second column in Table 1 where codons have C in thesecond codon position. In this column the rarest codons alwayshave G in the third position, yielding CpG dinucleotides at the endof these codons. In vertebrate genomes CpG is themost underrepresented
tes a highly GC-rich ancestral genome, Gene (2013), http://dx.doi.org/
3M. Nabiyouni et al. / Gene xxx (2013) xxx–xxx
dinucleotide, occurring about four times belowexpectations, because CpGdinucleotides are hot-spots for C→T mutations due to methylation→deamination of the cytosines within this context. Hypermutability ofCpG dinucleotides is one of the major causes of codon substitution inmammalian genes (Misawa and Kikuno, 2011). The footprint of thisCpG→TpG transition is clearly visible in Table 1. For instance, thealanine codon GCG has the lowest relative frequency (11%) among allsynonymous groups comprising four members. Due to recurrent mu-tation of 5meC into T, this codon should be repeatedly converted intoa valine GTG codon, which has the highest relative frequency (46%)among all synonymous groups composed of four triplets. This exampleof the deficit of NCG codons testifies that genome-wide mutationalforces robustly influence codon bias. Due to the observed patterns insynonymous codons preferences, the GC-percentage of the thirdcodon positions (so-called GC3-content) of human genes is 58.6%,despite the fact that the overall GC-composition in the entire humangenome is significantly lower—40.9% (see Table 2). Table 2 demonstratesthe same trend for all mammals and vertebrates: species from thistaxon have GC3 composition significantly higher than their genomicGC-composition. However, if we consider other branches of eukaryoteswith considerably lower genomic GC-composition, their optimalcodons end predominantly by A or T. This observation is correct for allbut two synonymous codon groups for such organisms as Plasmodiumfalciparum (genome GC-content 19.4%), Dictyostelium discoideum(25.7%), Saccharomyces cerevisiae (38.3%), Arabidopsis thaliana (36%),and Caenorhabditis elegans (36%) (see Codon Usage Database(Nakamura et al., 2000)). The only two exceptions to this rule forthe aforementioned five species are the following: 1) in the C. elegansgenome the phenylalanine optimal codon is UUC (relative frequency50.6% among two synonymous codons) and 2) in S. cerevisiae genomethe leucine optimal codon is UUG (relative frequency 28.6% among sixsynonymous codons). Monte-Carlo simulation shows that in case theoptimal codons are chosen randomly, the chance to have the observedlevel of prevalence for optimal codons ending by A or T is less than10−12. On the other hand, organisms with GC-rich genomes likeChlamydomonas reinhardtii (64%), Leishmania major (60%), Nocardiafarcinica (71%), and Acidiphilium cryptum (68%) have opposite codonbias regularities: codons ending with G and C are drastically moreabundant than those ending with A or T. In fact, each optimal codonof these four species ends by G or C. Monte-Carlo simulation showsthat in case the optimal codons are chosen randomly, the chance tohave the observed level of prevalence for optimal codons ending byC or G is less than 10−12. Taken all together, we observe for the king-dom of eukaryotes a global regularity that organisms with extremelyhigh genomic GC-content also have high GC3-composition while or-ganisms with low genomic GC-content have low GC3-composition.Vertebrates present a notable exception from this rule (as well asDrosophila originally considered in Duret and Mouchiroud (1999)).Vertebrate genomic composition is rather GC-poor (in the range37–46% (Costantini et al., 2009)), in contrast to their much higher GC3content (ranges between 56 and 64%, see Table 2). Even special geno-mic regions of mammals and birds with the highest GC-composition(so-called H-isochores) have lower GC-content than GC3. For example,in humans the most GC-rich isochore (H3) has a GC-composition of53–57% (Costantini et al., 2009), while the overall human GC3 is58.6%. According to Fig. 3 of Duret and Galtier (2009), the GC3-composition is much higher (about 75–80%) inside the GC-richest(H3) regions of the human genome. Moreover, according to genome-wide computations of Zhao and Jiang, currently the human GC3 valueis decreasing (Zhao and Jiang, 2010). This notion implies that humanGC3 value was even higher in the past.
Transition of preferable synonymous codons in non-vertebrateeukaryotes from GC3-rich ones in GC-rich genomes to GC3-poor pref-erable codons in AT-rich genomes perfectly fits into the model ofmutational origin of codon bias. This view is concordant with Chenat al. (2004), who concluded that bacterial codon bias is explainable
Please cite this article as: Nabiyouni, M., et al., Vertebrate codon bias indica10.1016/j.gene.2013.01.033
by genome-wide nucleotide composition “with surprising accuracy”.On the other hand, mutational theory is totally helpless in the caseof vertebrates, where GC3-content is well above whole-genomeGC-content. In this case a selectionist view is much plausible(Chamary et al., 2006).
In order to get an insight into this problem we considered otherpreferences in coding sequences. Fig. 1 illustrates correlations inGC-composition between the first, second, and third codon positions(known as GC1, GC2 and GC3 indices respectively) for a wide spec-trum of prokaryotic and eukaryotic species. Strict linear correlationsbetween the GC1, GC2, and GC3 values exist in bacteria (Fig. 1, rightcolumn). Prokaryotic GC1, GC2, and GC3 indices are also in directproportion to the overall genomic GC-content (Nabiyouni, 2011).Similarly eukaryotes also have linear correlations between GC1,GC2, and GC3 albeit with significantly higher fluctuations from thetrend line (Fig. 1, left column). Some of the fluctuations from thetrend in eukaryotes may be explained by the presence of unusualamino acid abundances in particular species (Nabiyouni, 2011). Thedescribed regularities in Fig. 1 suggest that impact of genome-wideGC-content on gene nucleotide composition is very strong. It influencesthe GC3-content (and thus, codon bias) and also it affects the GC1 andGC2-contents (and thus, amino acid composition of proteins). Suchimpacts were previously reported for bacteria (Warnecke et al., 2009).
3.2. Codon bias in individual genes
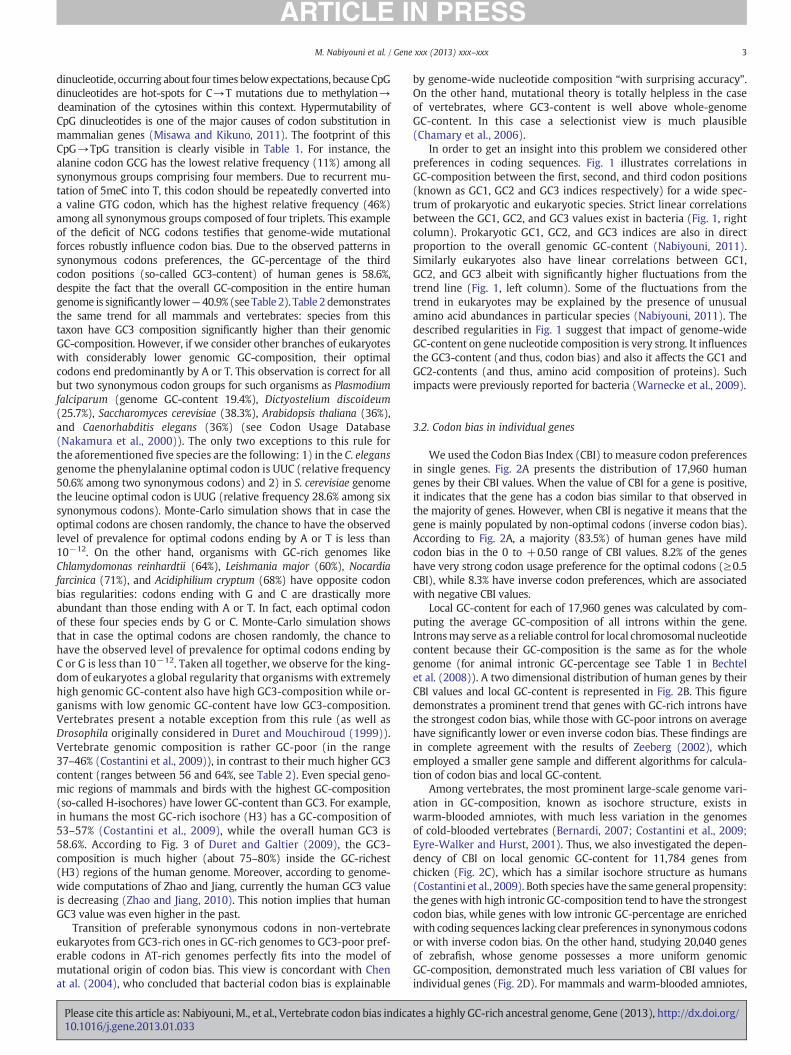
We used the Codon Bias Index (CBI) to measure codon preferencesin single genes. Fig. 2A presents the distribution of 17,960 humangenes by their CBI values. When the value of CBI for a gene is positive,it indicates that the gene has a codon bias similar to that observed inthe majority of genes. However, when CBI is negative it means that thegene is mainly populated by non-optimal codons (inverse codon bias).According to Fig. 2A, a majority (83.5%) of human genes have mildcodon bias in the 0 to +0.50 range of CBI values. 8.2% of the geneshave very strong codon usage preference for the optimal codons (≥0.5CBI), while 8.3% have inverse codon preferences, which are associatedwith negative CBI values.
Local GC-content for each of 17,960 genes was calculated by com-puting the average GC-composition of all introns within the gene.Intronsmay serve as a reliable control for local chromosomal nucleotidecontent because their GC-composition is the same as for the wholegenome (for animal intronic GC-percentage see Table 1 in Bechtelet al. (2008)). A two dimensional distribution of human genes by theirCBI values and local GC-content is represented in Fig. 2B. This figuredemonstrates a prominent trend that genes with GC-rich introns havethe strongest codon bias, while those with GC-poor introns on averagehave significantly lower or even inverse codon bias. These findings arein complete agreement with the results of Zeeberg (2002), whichemployed a smaller gene sample and different algorithms for calcula-tion of codon bias and local GC-content.
Among vertebrates, the most prominent large-scale genome vari-ation in GC-composition, known as isochore structure, exists inwarm-blooded amniotes, with much less variation in the genomesof cold-blooded vertebrates (Bernardi, 2007; Costantini et al., 2009;Eyre-Walker and Hurst, 2001). Thus, we also investigated the depen-dency of CBI on local genomic GC-content for 11,784 genes fromchicken (Fig. 2C), which has a similar isochore structure as humans(Costantini et al., 2009). Both species have the samegeneral propensity:the geneswith high intronic GC-composition tend to have the strongestcodon bias, while genes with low intronic GC-percentage are enrichedwith coding sequences lacking clear preferences in synonymous codonsor with inverse codon bias. On the other hand, studying 20,040 genesof zebrafish, whose genome possesses a more uniform genomicGC-composition, demonstrated much less variation of CBI values forindividual genes (Fig. 2D). For mammals and warm-blooded amniotes,
tes a highly GC-rich ancestral genome, Gene (2013), http://dx.doi.org/
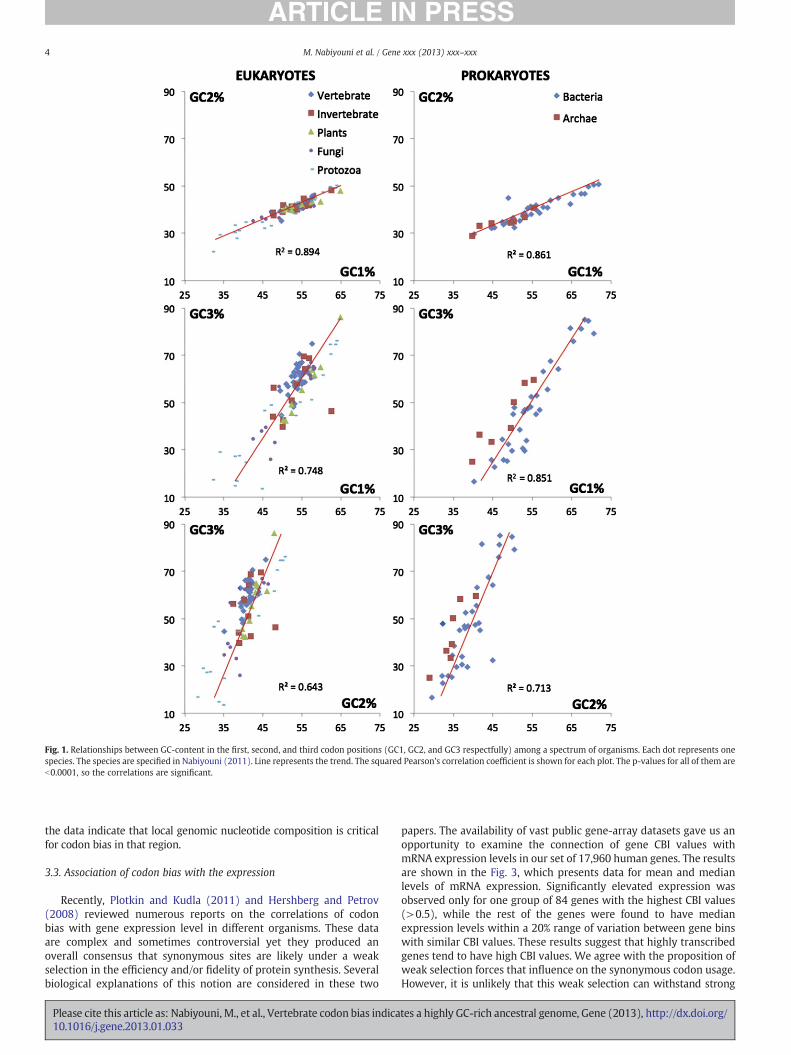
Fig. 1. Relationships between GC-content in the first, second, and third codon positions (GC1, GC2, and GC3 respectfully) among a spectrum of organisms. Each dot represents onespecies. The species are specified in Nabiyouni (2011). Line represents the trend. The squared Pearson's correlation coefficient is shown for each plot. The p-values for all of them areb0.0001, so the correlations are significant.
4 M. Nabiyouni et al. / Gene xxx (2013) xxx–xxx
the data indicate that local genomic nucleotide composition is criticalfor codon bias in that region.
3.3. Association of codon bias with the expression
Recently, Plotkin and Kudla (2011) and Hershberg and Petrov(2008) reviewed numerous reports on the correlations of codonbias with gene expression level in different organisms. These dataare complex and sometimes controversial yet they produced anoverall consensus that synonymous sites are likely under a weakselection in the efficiency and/or fidelity of protein synthesis. Severalbiological explanations of this notion are considered in these two
Please cite this article as: Nabiyouni, M., et al., Vertebrate codon bias indica10.1016/j.gene.2013.01.033
papers. The availability of vast public gene-array datasets gave us anopportunity to examine the connection of gene CBI values withmRNA expression levels in our set of 17,960 human genes. The resultsare shown in the Fig. 3, which presents data for mean and medianlevels of mRNA expression. Significantly elevated expression wasobserved only for one group of 84 genes with the highest CBI values(>0.5), while the rest of the genes were found to have medianexpression levels within a 20% range of variation between gene binswith similar CBI values. These results suggest that highly transcribedgenes tend to have high CBI values. We agree with the proposition ofweak selection forces that influence on the synonymous codon usage.However, it is unlikely that this weak selection can withstand strong
tes a highly GC-rich ancestral genome, Gene (2013), http://dx.doi.org/
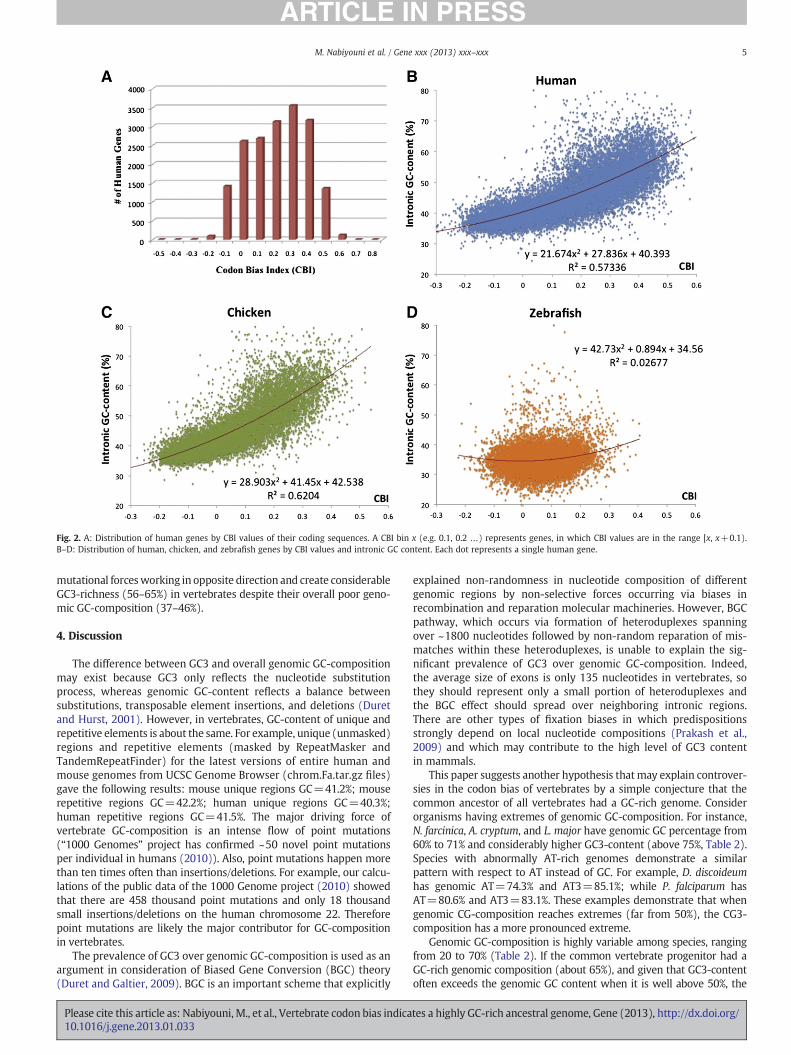
Fig. 2. A: Distribution of human genes by CBI values of their coding sequences. A CBI bin x (e.g. 0.1, 0.2 …) represents genes, in which CBI values are in the range [x, x+0.1).B–D: Distribution of human, chicken, and zebrafish genes by CBI values and intronic GC content. Each dot represents a single human gene.
5M. Nabiyouni et al. / Gene xxx (2013) xxx–xxx
mutational forcesworking in opposite direction and create considerableGC3-richness (56–65%) in vertebrates despite their overall poor geno-mic GC-composition (37–46%).
4. Discussion
The difference between GC3 and overall genomic GC-compositionmay exist because GC3 only reflects the nucleotide substitutionprocess, whereas genomic GC-content reflects a balance betweensubstitutions, transposable element insertions, and deletions (Duretand Hurst, 2001). However, in vertebrates, GC-content of unique andrepetitive elements is about the same. For example, unique (unmasked)regions and repetitive elements (masked by RepeatMasker andTandemRepeatFinder) for the latest versions of entire human andmouse genomes from UCSC Genome Browser (chrom.Fa.tar.gz files)gave the following results: mouse unique regions GC=41.2%; mouserepetitive regions GC=42.2%; human unique regions GC=40.3%;human repetitive regions GC=41.5%. The major driving force ofvertebrate GC-composition is an intense flow of point mutations(“1000 Genomes” project has confirmed ~50 novel point mutationsper individual in humans (2010)). Also, point mutations happen morethan ten times often than insertions/deletions. For example, our calcu-lations of the public data of the 1000 Genome project (2010) showedthat there are 458 thousand point mutations and only 18 thousandsmall insertions/deletions on the human chromosome 22. Thereforepoint mutations are likely the major contributor for GC-compositionin vertebrates.
The prevalence of GC3 over genomic GC-composition is used as anargument in consideration of Biased Gene Conversion (BGC) theory(Duret and Galtier, 2009). BGC is an important scheme that explicitly
Please cite this article as: Nabiyouni, M., et al., Vertebrate codon bias indica10.1016/j.gene.2013.01.033
explained non-randomness in nucleotide composition of differentgenomic regions by non-selective forces occurring via biases inrecombination and reparation molecular machineries. However, BGCpathway, which occurs via formation of heteroduplexes spanningover ~1800 nucleotides followed by non-random reparation of mis-matches within these heteroduplexes, is unable to explain the sig-nificant prevalence of GC3 over genomic GC-composition. Indeed,the average size of exons is only 135 nucleotides in vertebrates, sothey should represent only a small portion of heteroduplexes andthe BGC effect should spread over neighboring intronic regions.There are other types of fixation biases in which predispositionsstrongly depend on local nucleotide compositions (Prakash et al.,2009) and which may contribute to the high level of GC3 contentin mammals.
This paper suggests another hypothesis thatmay explain controver-sies in the codon bias of vertebrates by a simple conjecture that thecommon ancestor of all vertebrates had a GC-rich genome. Considerorganisms having extremes of genomic GC-composition. For instance,N. farcinica, A. cryptum, and L. major have genomic GC percentage from60% to 71% and considerably higher GC3-content (above 75%, Table 2).Species with abnormally AT-rich genomes demonstrate a similarpattern with respect to AT instead of GC. For example, D. discoideumhas genomic AT=74.3% and AT3=85.1%; while P. falciparum hasAT=80.6% and AT3=83.1%. These examples demonstrate that whengenomic CG-composition reaches extremes (far from 50%), the CG3-composition has a more pronounced extreme.
Genomic GC-composition is highly variable among species, rangingfrom 20 to 70% (Table 2). If the common vertebrate progenitor had aGC-rich genomic composition (about 65%), and given that GC3-contentoften exceeds the genomic GC content when it is well above 50%, the
tes a highly GC-rich ancestral genome, Gene (2013), http://dx.doi.org/
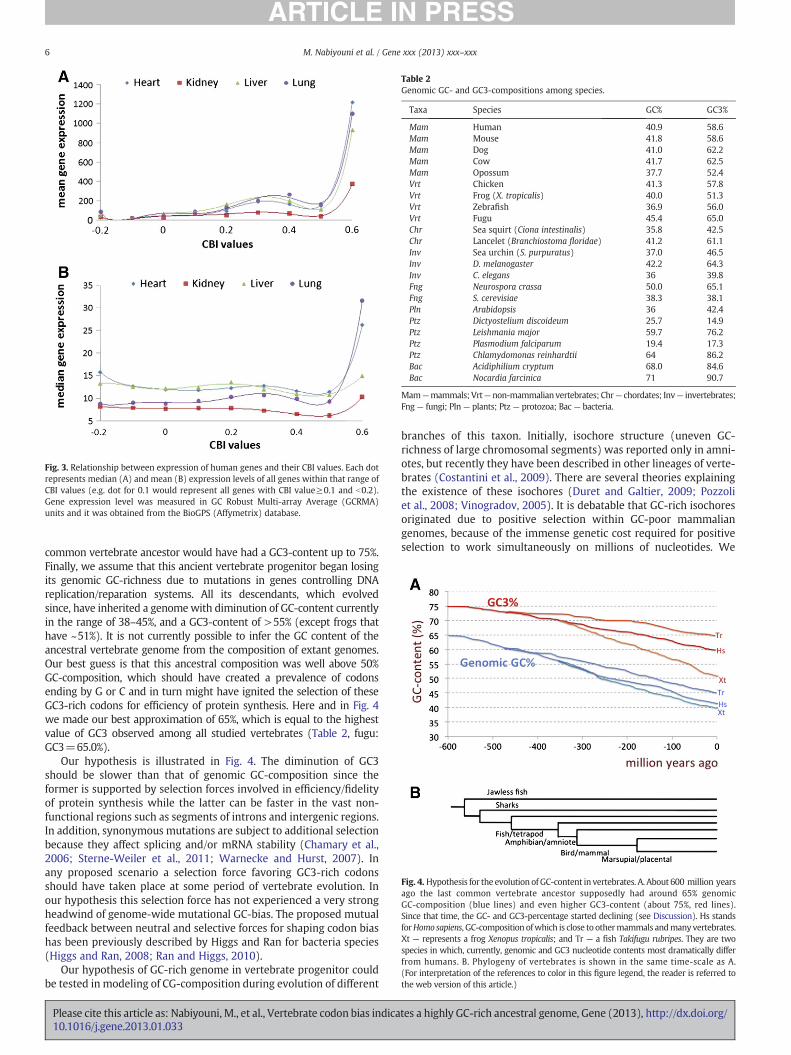
Fig. 3. Relationship between expression of human genes and their CBI values. Each dotrepresents median (A) and mean (B) expression levels of all genes within that range ofCBI values (e.g. dot for 0.1 would represent all genes with CBI value≥0.1 and b0.2).Gene expression level was measured in GC Robust Multi-array Average (GCRMA)units and it was obtained from the BioGPS (Affymetrix) database.
Table 2Genomic GC- and GC3-compositions among species.
Taxa Species GC% GC3%
Mam Human 40.9 58.6Mam Mouse 41.8 58.6Mam Dog 41.0 62.2Mam Cow 41.7 62.5Mam Opossum 37.7 52.4Vrt Chicken 41.3 57.8Vrt Frog (X. tropicalis) 40.0 51.3Vrt Zebrafish 36.9 56.0Vrt Fugu 45.4 65.0Chr Sea squirt (Ciona intestinalis) 35.8 42.5Chr Lancelet (Branchiostoma floridae) 41.2 61.1Inv Sea urchin (S. purpuratus) 37.0 46.5Inv D. melanogaster 42.2 64.3Inv C. elegans 36 39.8Fng Neurospora crassa 50.0 65.1Fng S. cerevisiae 38.3 38.1Pln Arabidopsis 36 42.4Ptz Dictyostelium discoideum 25.7 14.9Ptz Leishmania major 59.7 76.2Ptz Plasmodium falciparum 19.4 17.3Ptz Chlamydomonas reinhardtii 64 86.2Bac Acidiphilium cryptum 68.0 84.6Bac Nocardia farcinica 71 90.7
Mam—mammals; Vrt—non-mammalian vertebrates; Chr— chordates; Inv— invertebrates;Fng— fungi; Pln— plants; Ptz— protozoa; Bac— bacteria.
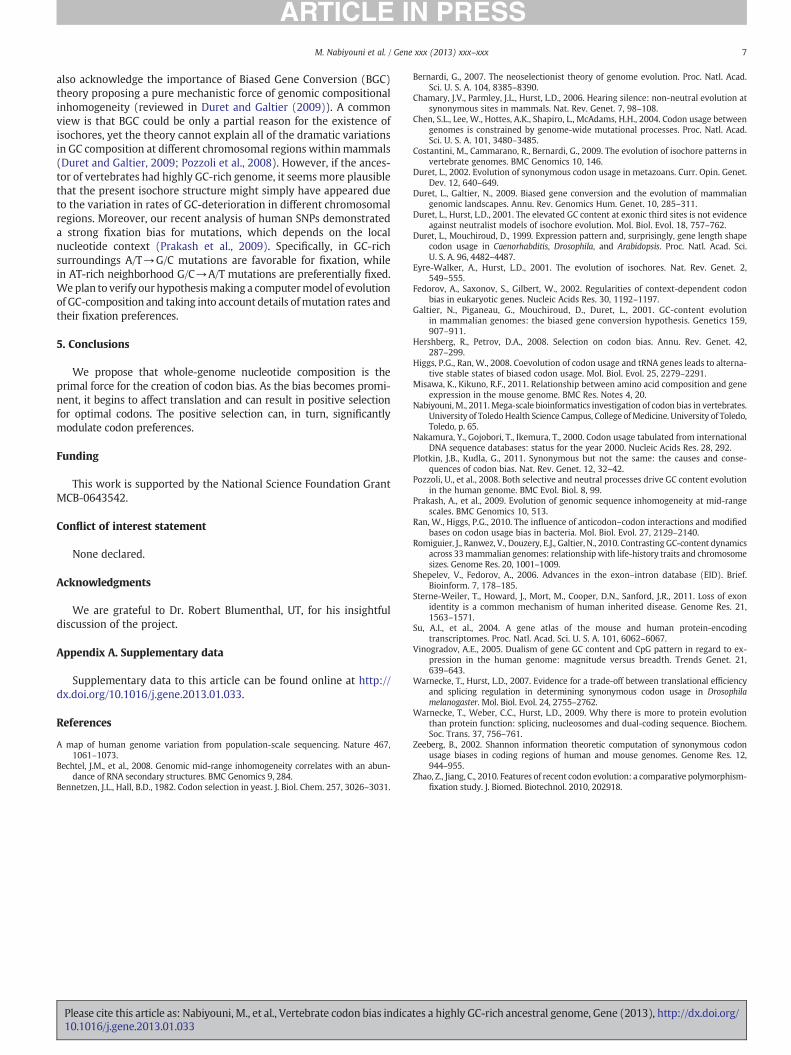
Fig. 4. Hypothesis for the evolution ofGC-content in vertebrates. A. About 600 million yearsago the last common vertebrate ancestor supposedly had around 65% genomicGC-composition (blue lines) and even higher GC3-content (about 75%, red lines).Since that time, the GC- and GC3-percentage started declining (see Discussion). Hs standsforHomo sapiens, GC-composition ofwhich is close to othermammals andmanyvertebrates.Xt — represents a frog Xenopus tropicalis; and Tr — a fish Takifugu rubripes. They are twospecies in which, currently, genomic and GC3 nucleotide contents most dramatically differfrom humans. B. Phylogeny of vertebrates is shown in the same time-scale as A.(For interpretation of the references to color in this figure legend, the reader is referred tothe web version of this article.)
6 M. Nabiyouni et al. / Gene xxx (2013) xxx–xxx
common vertebrate ancestor would have had a GC3-content up to 75%.Finally, we assume that this ancient vertebrate progenitor began losingits genomic GC-richness due to mutations in genes controlling DNAreplication/reparation systems. All its descendants, which evolvedsince, have inherited a genomewith diminution of GC-content currentlyin the range of 38–45%, and a GC3-content of >55% (except frogs thathave ~51%). It is not currently possible to infer the GC content of theancestral vertebrate genome from the composition of extant genomes.Our best guess is that this ancestral composition was well above 50%GC-composition, which should have created a prevalence of codonsending by G or C and in turn might have ignited the selection of theseGC3-rich codons for efficiency of protein synthesis. Here and in Fig. 4we made our best approximation of 65%, which is equal to the highestvalue of GC3 observed among all studied vertebrates (Table 2, fugu:GC3=65.0%).
Our hypothesis is illustrated in Fig. 4. The diminution of GC3should be slower than that of genomic GC-composition since theformer is supported by selection forces involved in efficiency/fidelityof protein synthesis while the latter can be faster in the vast non-functional regions such as segments of introns and intergenic regions.In addition, synonymous mutations are subject to additional selectionbecause they affect splicing and/or mRNA stability (Chamary et al.,2006; Sterne-Weiler et al., 2011; Warnecke and Hurst, 2007). Inany proposed scenario a selection force favoring GC3-rich codonsshould have taken place at some period of vertebrate evolution. Inour hypothesis this selection force has not experienced a very strongheadwind of genome-wide mutational GC-bias. The proposed mutualfeedback between neutral and selective forces for shaping codon biashas been previously described by Higgs and Ran for bacteria species(Higgs and Ran, 2008; Ran and Higgs, 2010).
Our hypothesis of GC-rich genome in vertebrate progenitor couldbe tested in modeling of CG-composition during evolution of different
Please cite this article as: Nabiyouni, M., et al., Vertebrate codon bias indica10.1016/j.gene.2013.01.033
branches of this taxon. Initially, isochore structure (uneven GC-richness of large chromosomal segments) was reported only in amni-otes, but recently they have been described in other lineages of verte-brates (Costantini et al., 2009). There are several theories explainingthe existence of these isochores (Duret and Galtier, 2009; Pozzoliet al., 2008; Vinogradov, 2005). It is debatable that GC-rich isochoresoriginated due to positive selection within GC-poor mammaliangenomes, because of the immense genetic cost required for positiveselection to work simultaneously on millions of nucleotides. We
tes a highly GC-rich ancestral genome, Gene (2013), http://dx.doi.org/
7M. Nabiyouni et al. / Gene xxx (2013) xxx–xxx
also acknowledge the importance of Biased Gene Conversion (BGC)theory proposing a pure mechanistic force of genomic compositionalinhomogeneity (reviewed in Duret and Galtier (2009)). A commonview is that BGC could be only a partial reason for the existence ofisochores, yet the theory cannot explain all of the dramatic variationsin GC composition at different chromosomal regions within mammals(Duret and Galtier, 2009; Pozzoli et al., 2008). However, if the ances-tor of vertebrates had highly GC-rich genome, it seemsmore plausiblethat the present isochore structure might simply have appeared dueto the variation in rates of GC-deterioration in different chromosomalregions. Moreover, our recent analysis of human SNPs demonstrateda strong fixation bias for mutations, which depends on the localnucleotide context (Prakash et al., 2009). Specifically, in GC-richsurroundings A/T→G/C mutations are favorable for fixation, whilein AT-rich neighborhood G/C→A/T mutations are preferentially fixed.We plan to verify our hypothesismaking a computermodel of evolutionof GC-composition and taking into account details ofmutation rates andtheir fixation preferences.
5. Conclusions
We propose that whole-genome nucleotide composition is theprimal force for the creation of codon bias. As the bias becomes promi-nent, it begins to affect translation and can result in positive selectionfor optimal codons. The positive selection can, in turn, significantlymodulate codon preferences.
Funding
This work is supported by the National Science Foundation GrantMCB-0643542.
Conflict of interest statement
None declared.
Acknowledgments
We are grateful to Dr. Robert Blumenthal, UT, for his insightfuldiscussion of the project.
Appendix A. Supplementary data
Supplementary data to this article can be found online at http://dx.doi.org/10.1016/j.gene.2013.01.033.
References
A map of human genome variation from population-scale sequencing. Nature 467,1061–1073.
Bechtel, J.M., et al., 2008. Genomic mid-range inhomogeneity correlates with an abun-dance of RNA secondary structures. BMC Genomics 9, 284.
Bennetzen, J.L., Hall, B.D., 1982. Codon selection in yeast. J. Biol. Chem. 257, 3026–3031.
Please cite this article as: Nabiyouni, M., et al., Vertebrate codon bias indica10.1016/j.gene.2013.01.033
Bernardi, G., 2007. The neoselectionist theory of genome evolution. Proc. Natl. Acad.Sci. U. S. A. 104, 8385–8390.
Chamary, J.V., Parmley, J.L., Hurst, L.D., 2006. Hearing silence: non-neutral evolution atsynonymous sites in mammals. Nat. Rev. Genet. 7, 98–108.
Chen, S.L., Lee, W., Hottes, A.K., Shapiro, L., McAdams, H.H., 2004. Codon usage betweengenomes is constrained by genome-wide mutational processes. Proc. Natl. Acad.Sci. U. S. A. 101, 3480–3485.
Costantini, M., Cammarano, R., Bernardi, G., 2009. The evolution of isochore patterns invertebrate genomes. BMC Genomics 10, 146.
Duret, L., 2002. Evolution of synonymous codon usage in metazoans. Curr. Opin. Genet.Dev. 12, 640–649.
Duret, L., Galtier, N., 2009. Biased gene conversion and the evolution of mammaliangenomic landscapes. Annu. Rev. Genomics Hum. Genet. 10, 285–311.
Duret, L., Hurst, L.D., 2001. The elevated GC content at exonic third sites is not evidenceagainst neutralist models of isochore evolution. Mol. Biol. Evol. 18, 757–762.
Duret, L., Mouchiroud, D., 1999. Expression pattern and, surprisingly, gene length shapecodon usage in Caenorhabditis, Drosophila, and Arabidopsis. Proc. Natl. Acad. Sci.U. S. A. 96, 4482–4487.
Eyre-Walker, A., Hurst, L.D., 2001. The evolution of isochores. Nat. Rev. Genet. 2,549–555.
Fedorov, A., Saxonov, S., Gilbert, W., 2002. Regularities of context-dependent codonbias in eukaryotic genes. Nucleic Acids Res. 30, 1192–1197.
Galtier, N., Piganeau, G., Mouchiroud, D., Duret, L., 2001. GC-content evolutionin mammalian genomes: the biased gene conversion hypothesis. Genetics 159,907–911.
Hershberg, R., Petrov, D.A., 2008. Selection on codon bias. Annu. Rev. Genet. 42,287–299.
Higgs, P.G., Ran, W., 2008. Coevolution of codon usage and tRNA genes leads to alterna-tive stable states of biased codon usage. Mol. Biol. Evol. 25, 2279–2291.
Misawa, K., Kikuno, R.F., 2011. Relationship between amino acid composition and geneexpression in the mouse genome. BMC Res. Notes 4, 20.
Nabiyouni, M., 2011.Mega-scale bioinformatics investigation of codon bias in vertebrates.University of ToledoHealth Science Campus, College ofMedicine. University of Toledo,Toledo, p. 65.
Nakamura, Y., Gojobori, T., Ikemura, T., 2000. Codon usage tabulated from internationalDNA sequence databases: status for the year 2000. Nucleic Acids Res. 28, 292.
Plotkin, J.B., Kudla, G., 2011. Synonymous but not the same: the causes and conse-quences of codon bias. Nat. Rev. Genet. 12, 32–42.
Pozzoli, U., et al., 2008. Both selective and neutral processes drive GC content evolutionin the human genome. BMC Evol. Biol. 8, 99.
Prakash, A., et al., 2009. Evolution of genomic sequence inhomogeneity at mid-rangescales. BMC Genomics 10, 513.
Ran, W., Higgs, P.G., 2010. The influence of anticodon–codon interactions and modifiedbases on codon usage bias in bacteria. Mol. Biol. Evol. 27, 2129–2140.
Romiguier, J., Ranwez, V., Douzery, E.J., Galtier, N., 2010. Contrasting GC-content dynamicsacross 33mammalian genomes: relationshipwith life-history traits and chromosomesizes. Genome Res. 20, 1001–1009.
Shepelev, V., Fedorov, A., 2006. Advances in the exon–intron database (EID). Brief.Bioinform. 7, 178–185.
Sterne-Weiler, T., Howard, J., Mort, M., Cooper, D.N., Sanford, J.R., 2011. Loss of exonidentity is a common mechanism of human inherited disease. Genome Res. 21,1563–1571.
Su, A.I., et al., 2004. A gene atlas of the mouse and human protein-encodingtranscriptomes. Proc. Natl. Acad. Sci. U. S. A. 101, 6062–6067.
Vinogradov, A.E., 2005. Dualism of gene GC content and CpG pattern in regard to ex-pression in the human genome: magnitude versus breadth. Trends Genet. 21,639–643.
Warnecke, T., Hurst, L.D., 2007. Evidence for a trade-off between translational efficiencyand splicing regulation in determining synonymous codon usage in Drosophilamelanogaster. Mol. Biol. Evol. 24, 2755–2762.
Warnecke, T., Weber, C.C., Hurst, L.D., 2009. Why there is more to protein evolutionthan protein function: splicing, nucleosomes and dual-coding sequence. Biochem.Soc. Trans. 37, 756–761.
Zeeberg, B., 2002. Shannon information theoretic computation of synonymous codonusage biases in coding regions of human and mouse genomes. Genome Res. 12,944–955.
Zhao, Z., Jiang, C., 2010. Features of recent codon evolution: a comparative polymorphism-fixation study. J. Biomed. Biotechnol. 2010, 202918.
tes a highly GC-rich ancestral genome, Gene (2013), http://dx.doi.org/