vertical and horizontal computing architectures -hfoxwell/ec511/superg2003.v.h.tja...by tom atwood...
TRANSCRIPT
by Tom AtwoodEnterprise Systems Products, Sun MicrosystemsSUPerG Berlin, May 2003
Vertical and HorizontalComputing Architectures - Trends and Attributes
Whitepaper Vertical and Horizontal Computing Architectures - Trends and Attributes On the Web sun.com
SUN™ Copyright 2003 Sun Microsystems, Inc., 4150 Network Circle, Santa Clara, California, 95054, U.S.A. All rights reserved.
RESTRICTED RIGHTS LEGEND: Use, duplication, or disclosure by the government is subject to restrictions as set forth in subparagraph (c)(1)(ii)of the Rightsin Technical Data and Computer Software clause at DFARS 252.227-7013 and FAR 52.227-19.
Sun Microsystems, Inc. has intellectual property rights relating to technology described in this document. In particular, and without limitations, theseintellectual property rights may include one or more patents or pending patent applications in the U.S.or other countries.
Sun, Sun Microsystems, the Sun logo, Sun Fire, and Sun Enterprise are trademarks or registered trademarks of Sun Microsystems,Inc. in the UnitedStates and other countries.
All SPARC trademarks are used under license and are trademarks or registered trademarks of SPARC International, Inc. in the United States and othercountries.Products bearing SPARC trademarks are based upon an architecture developed by Sun Microsystems, Inc.
UNIX is a registered trademark in the United States and other countries, exclusively licensed through X/Open Company, Ltd.
THIS PUBLICATION IS PROVIDED “AS IS ” WITHOUT WARRANTY OF ANY KIND, EITHER EXPRESS OR IMPLIED, INCLUDING, BUT NOT LIMITED TO, THE IMPLIEDWARRANTIES OF MERCHANTABILITY, FITNESS FOR A PARTICULAR PURPOSE, OR NON-INFRINGEMENT.
THIS PUBLICATION COULD INCLUDE TECHNICAL INACCURACIES OR TYPOGRAPHICAL ERRORS. CHANGES ARE PERIODICALLY ADDED TO THE INFORMATIONHEREIN; THESE CHANGES WILL BE INCORPORATED IN NEW EDITIONS OF THE PUBLICATION. SUN MICROSYSTEMS, INC. MAY MAKE IMPROVEMENTS AND/ORCHANGES IN THE PRODUCT(S) AND/OR THE PROGRAM(S) DESCRIBED IN THIS PUBLICATION AT ANY TIME.
P2 © 2003 Sun Microsystems, Inc.
Table of Contents
Industry Trends . . . . . . . . . . . . . . . . . . . . . . . . . . . . . . . . . . . . . . . . . . . . . . . . . . . . . . . 1
Architectural Characteristics of Vertical and Horizontal Computing . . . . . . . . . . . . . . . . 2
Performance Implications . . . . . . . . . . . . . . . . . . . . . . . . . . . . . . . . . . . . . . . . . . . . . . . 6
Processors and System Interconnect . . . . . . . . . . . . . . . . . . . . . . . . . . . . . . . . . . . 6
Input and Output . . . . . . . . . . . . . . . . . . . . . . . . . . . . . . . . . . . . . . . . . . . . . . . . . 6
Operating System . . . . . . . . . . . . . . . . . . . . . . . . . . . . . . . . . . . . . . . . . . . . . . . . . 6
System Availability . . . . . . . . . . . . . . . . . . . . . . . . . . . . . . . . . . . . . . . . . . . . . . . . . 6
Optimized Applications . . . . . . . . . . . . . . . . . . . . . . . . . . . . . . . . . . . . . . . . . . . . . 7
Application Size . . . . . . . . . . . . . . . . . . . . . . . . . . . . . . . . . . . . . . . . . . . . . . . . . . . . . . . 7
Database Layer Performance . . . . . . . . . . . . . . . . . . . . . . . . . . . . . . . . . . . . . . . . . 8
Application Layer Performance . . . . . . . . . . . . . . . . . . . . . . . . . . . . . . . . . . . . . . 10
Presentation Layer Performance . . . . . . . . . . . . . . . . . . . . . . . . . . . . . . . . . . . . . 11
TCO Implications of Vertical and Horizontal Architectures . . . . . . . . . . . . . . . . . . . . . . 11
Availability Implications . . . . . . . . . . . . . . . . . . . . . . . . . . . . . . . . . . . . . . . . . . . . . . . 15
Consolidation . . . . . . . . . . . . . . . . . . . . . . . . . . . . . . . . . . . . . . . . . . . . . . . . . . . . . . . 17
Summary . . . . . . . . . . . . . . . . . . . . . . . . . . . . . . . . . . . . . . . . . . . . . . . . . . . . . . . . . . . 17
Vertical and Horizontal Computing Architectures - Trends and Attributes P3


Abstract
This paper is intended to provide information to help readers decide when to select ahorizontal computing architecture and when to select a vertical computing architecturewhile deploying a new application environment. Market trends are analyzed in order todemonstrate where the industry is headed. Both technical and business aspects of horizontaland vertical computing are discussed in detail. Understanding the technical differencesbetween the two architectures and the resulting technical implications is important toselect the appropriate architecture for a specific environment. Understanding the businessimplications is also critical in application deployment in terms of total cost of ownership(TCO).
Chapter 1
Industry Trends
Contrary to media reports that medium to large servers are being rapidly replaced by racksand clusters of smaller servers, market data seems to indicate otherwise. Figure 1. shows thepercentage of the total server market revenue comprised of servers priced above $500,000.These servers are all medium to large SMP (symmetric multiprocessing or shared-memoryprocessing) servers. From 2000 to 2002 the percentage of server revenue that can beattributed to servers in this price group has increased from 38% to 52%.
Vertical and Horizontal Computing Architectures - Trends and Attributes P1
Figure 1% Servers priced above $500K(midrange to high-end servers)
SourceDataquest Q4 and Annual WorldwideServer Market Share Report, Feb 2003
60
40
20
0
2000 2002
Perc
enta
ge o
f Tot
al S
erve
r Sa
les
Other data from IDC indicates that there is also growth, at least in number of unitsshipped, in the smaller (2 CPU) servers. IDC also predicts that in 2005 the dominant serverOperating System (OS) for servers costing between $50,000 and $3 million will be UNIX®.When combined, this data indicates that midrange to high-end UNIX servers will continue tobe the dominant data center platform but will also be complemented by increasing numbersof smaller (mainly 2 CPU) servers.
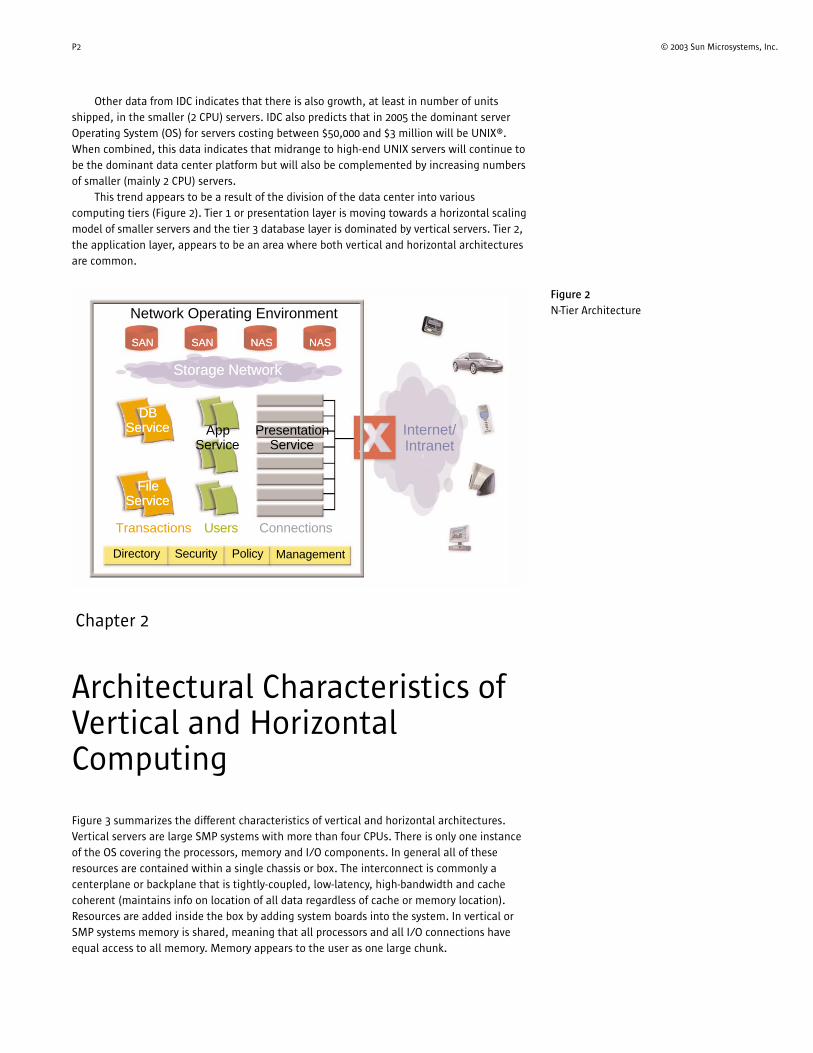
This trend appears to be a result of the division of the data center into variouscomputing tiers (Figure 2). Tier 1 or presentation layer is moving towards a horizontal scalingmodel of smaller servers and the tier 3 database layer is dominated by vertical servers. Tier 2,the application layer, appears to be an area where both vertical and horizontal architecturesare common.
Chapter 2
Architectural Characteristics ofVertical and HorizontalComputing
Figure 3 summarizes the different characteristics of vertical and horizontal architectures.Vertical servers are large SMP systems with more than four CPUs. There is only one instanceof the OS covering the processors, memory and I/O components. In general all of theseresources are contained within a single chassis or box. The interconnect is commonly acenterplane or backplane that is tightly-coupled, low-latency, high-bandwidth and cachecoherent (maintains info on location of all data regardless of cache or memory location).Resources are added inside the box by adding system boards into the system. In vertical orSMP systems memory is shared, meaning that all processors and all I/O connections haveequal access to all memory. Memory appears to the user as one large chunk.
P2 © 2003 Sun Microsystems, Inc.
Figure 2N-Tier ArchitectureNetwork Operating Environment
SANSAN SANSAN NASNAS NASNAS
Storage NetworkStorage Network
DBDBServiceService
FileFileServiceService
AppService
PresentationService
Directory Security Policy Management
Transactions Users Connections
Internet/Intranet
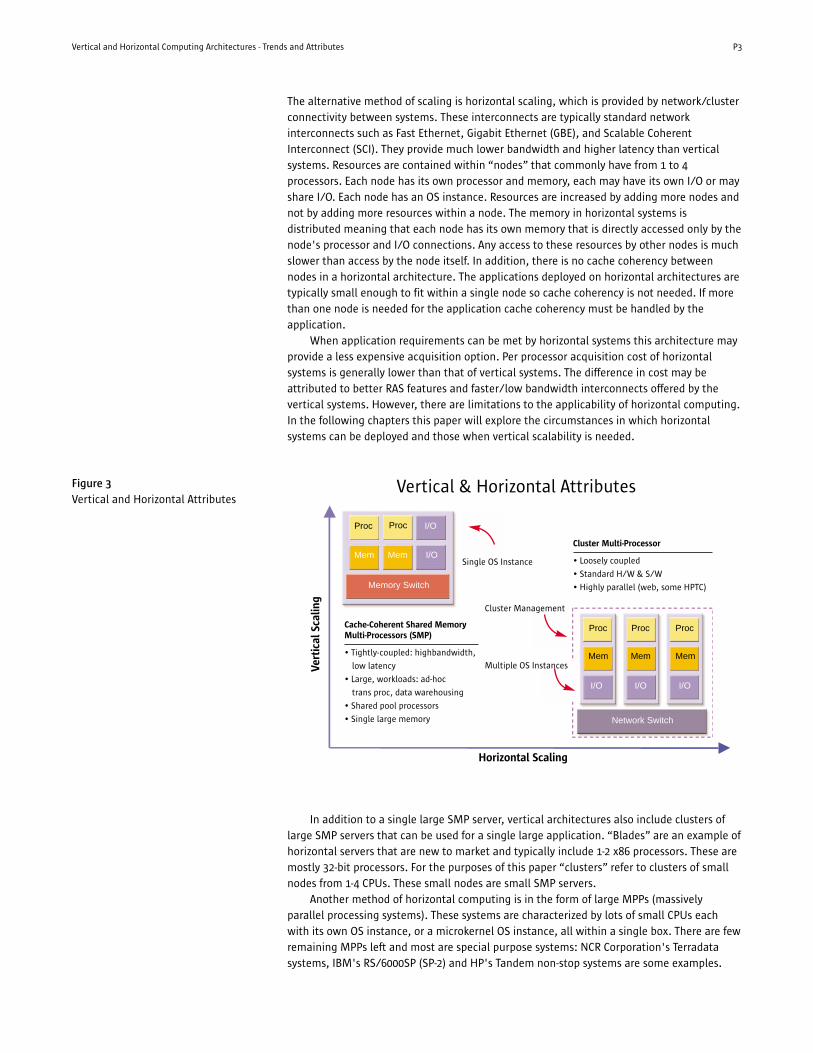
The alternative method of scaling is horizontal scaling, which is provided by network/clusterconnectivity between systems. These interconnects are typically standard networkinterconnects such as Fast Ethernet, Gigabit Ethernet (GBE), and Scalable CoherentInterconnect (SCI). They provide much lower bandwidth and higher latency than verticalsystems. Resources are contained within “nodes” that commonly have from 1 to 4processors. Each node has its own processor and memory, each may have its own I/O or mayshare I/O. Each node has an OS instance. Resources are increased by adding more nodes andnot by adding more resources within a node. The memory in horizontal systems isdistributed meaning that each node has its own memory that is directly accessed only by thenode's processor and I/O connections. Any access to these resources by other nodes is muchslower than access by the node itself. In addition, there is no cache coherency betweennodes in a horizontal architecture. The applications deployed on horizontal architectures aretypically small enough to fit within a single node so cache coherency is not needed. If morethan one node is needed for the application cache coherency must be handled by theapplication.
When application requirements can be met by horizontal systems this architecture mayprovide a less expensive acquisition option. Per processor acquisition cost of horizontalsystems is generally lower than that of vertical systems. The difference in cost may beattributed to better RAS features and faster/low bandwidth interconnects offered by thevertical systems. However, there are limitations to the applicability of horizontal computing.In the following chapters this paper will explore the circumstances in which horizontalsystems can be deployed and those when vertical scalability is needed.
In addition to a single large SMP server, vertical architectures also include clusters oflarge SMP servers that can be used for a single large application. “Blades” are an example ofhorizontal servers that are new to market and typically include 1-2 x86 processors. These aremostly 32-bit processors. For the purposes of this paper “clusters” refer to clusters of smallnodes from 1-4 CPUs. These small nodes are small SMP servers.
Another method of horizontal computing is in the form of large MPPs (massivelyparallel processing systems). These systems are characterized by lots of small CPUs eachwith its own OS instance, or a microkernel OS instance, all within a single box. There are fewremaining MPPs left and most are special purpose systems: NCR Corporation's Terradatasystems, IBM's RS/6000SP (SP-2) and HP's Tandem non-stop systems are some examples.
Vertical and Horizontal Computing Architectures - Trends and Attributes P3
Proc
Memory Switch
Proc
Mem
I/O
Mem I/O
Proc
Network Switch
Proc
Mem
I/O
Mem
I/O
Proc
Mem
I/O
Cache-Coherent Shared MemoryMulti-Processors (SMP)
• Tightly-coupled: highbandwidth,
low latency
• Large, workloads: ad-hoc
trans proc, data warehousing
• Shared pool processors
• Single large memory
Cluster Multi-Processor
• Loosely coupled
• Standard H/W & S/W
• Highly parallel (web, some HPTC)
Vertical & Horizontal Attributes
Vert
ical
Sca
ling
Horizontal Scaling
Single OS Instance
Cluster Management
Multiple OS Instances
Figure 3Vertical and Horizontal Attributes
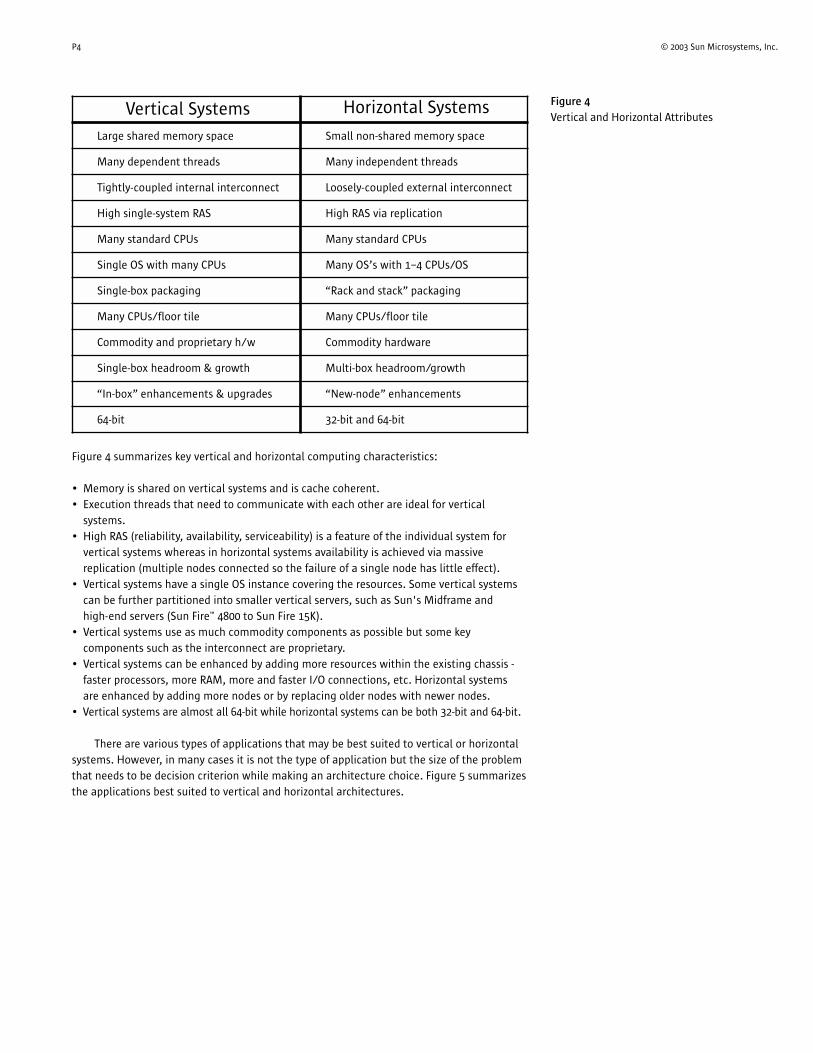
Figure 4 summarizes key vertical and horizontal computing characteristics:
• Memory is shared on vertical systems and is cache coherent. • Execution threads that need to communicate with each other are ideal for vertical
systems. • High RAS (reliability, availability, serviceability) is a feature of the individual system for
vertical systems whereas in horizontal systems availability is achieved via massivereplication (multiple nodes connected so the failure of a single node has little effect).
• Vertical systems have a single OS instance covering the resources. Some vertical systemscan be further partitioned into smaller vertical servers, such as Sun's Midframe and high-end servers (Sun Fire™ 4800 to Sun Fire 15K).
• Vertical systems use as much commodity components as possible but some keycomponents such as the interconnect are proprietary.
• Vertical systems can be enhanced by adding more resources within the existing chassis -faster processors, more RAM, more and faster I/O connections, etc. Horizontal systems are enhanced by adding more nodes or by replacing older nodes with newer nodes.
• Vertical systems are almost all 64-bit while horizontal systems can be both 32-bit and 64-bit.
There are various types of applications that may be best suited to vertical or horizontalsystems. However, in many cases it is not the type of application but the size of the problemthat needs to be decision criterion while making an architecture choice. Figure 5 summarizesthe applications best suited to vertical and horizontal architectures.
P4 © 2003 Sun Microsystems, Inc.
Vertical Systems Horizontal Systems
Large shared memory space Small non-shared memory space
Many dependent threads Many independent threads
Tightly-coupled internal interconnect Loosely-coupled external interconnect
High single-system RAS High RAS via replication
Many standard CPUs Many standard CPUs
Single OS with many CPUs Many OS’s with 1–4 CPUs/OS
Single-box packaging “Rack and stack” packaging
Many CPUs/floor tile Many CPUs/floor tile
Commodity and proprietary h/w Commodity hardware
Single-box headroom & growth Multi-box headroom/growth
“In-box” enhancements & upgrades “New-node” enhancements
64-bit 32-bit and 64-bit
Figure 4Vertical and Horizontal Attributes
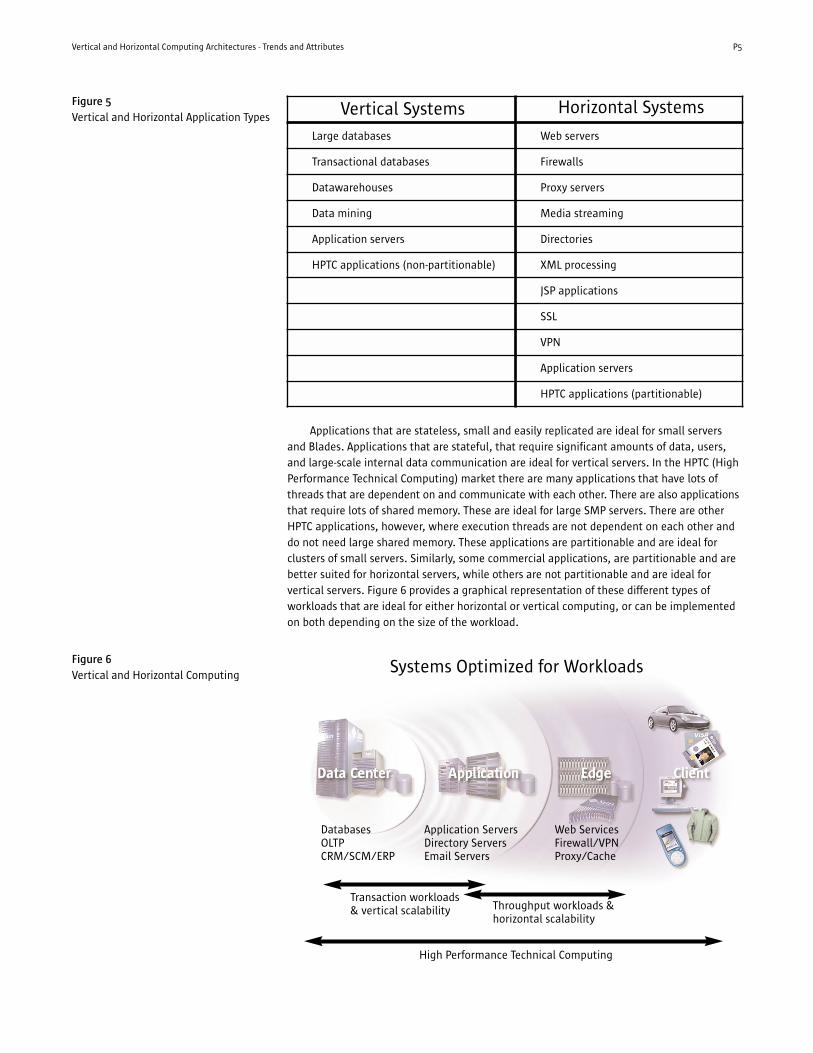
Applications that are stateless, small and easily replicated are ideal for small serversand Blades. Applications that are stateful, that require significant amounts of data, users,and large-scale internal data communication are ideal for vertical servers. In the HPTC (HighPerformance Technical Computing) market there are many applications that have lots ofthreads that are dependent on and communicate with each other. There are also applicationsthat require lots of shared memory. These are ideal for large SMP servers. There are otherHPTC applications, however, where execution threads are not dependent on each other anddo not need large shared memory. These applications are partitionable and are ideal forclusters of small servers. Similarly, some commercial applications, are partitionable and arebetter suited for horizontal servers, while others are not partitionable and are ideal forvertical servers. Figure 6 provides a graphical representation of these different types ofworkloads that are ideal for either horizontal or vertical computing, or can be implementedon both depending on the size of the workload.
Vertical and Horizontal Computing Architectures - Trends and Attributes P5
Vertical Systems Horizontal Systems
Large databases Web servers
Transactional databases Firewalls
Datawarehouses Proxy servers
Data mining Media streaming
Application servers Directories
HPTC applications (non-partitionable) XML processing
JSP applications
SSL
VPN
Application servers
HPTC applications (partitionable)
Figure 5Vertical and Horizontal Application Types
Figure 6Vertical and Horizontal Computing
Systems Optimized for Workloads
DatabasesOLTPCRM/SCM/ERP
Application ServersDirectory ServersEmail Servers
Web ServicesFirewall/VPNProxy/Cache
Transaction workloads & vertical scalability Throughput workloads &
horizontal scalability
High Performance Technical Computing
Chapter 3
Performance Implications
All large data center systems are parallel computers. Even clusters are types of parallelsystems. To get good delivered performance a balanced system is needed with fastprocessors, fast interconnect, fast I/O, scalable OS, optimized applications and high RAS.
Processors and System InterconnectProcessors are important but they are only part of the equation. What is more important isto make the processors run at their maximum capacity. A fast processor running at 50% ofcapacity may be slower in terms of delivered performance than a slower processor runningat 80% capacity.
Additionally, as the number of processors in a parallel system increases the lessimportant processors become. What becomes more significant is the system interconnect.
The system interconnect is what moves data from disk, memory and network to theprocessors. In a cluster environment the interconnect is the network connections such asFast Ethernet or Gigabit Ethernet. Cluster interconnects move data between nodes whilesystem interconnects move data within individual systems. If the interconnect is too slowthen the processors will sit idle awaiting data.
The system interconnect is also used to move data addresses, a task that is critical inmaintaining cache coherency. If the system interconnect has slow address bandwidth thenthe processor will be idle awaiting data because it needs to know the location of the databefore it can access it. A fast interconnect has high bandwidth (the size of the data “hose”)and low latency (short delay before the data starts moving after it has been requested).
The key technical difference between horizontal and vertical systems is the bandwidthand latency of the respective interconnects. Cluster interconnects range in bandwidth from125MB/sec for Fast Ethernet up to 200MB/sec for SCI (scalable coherent interconnect).Latencies range from 100,000ns for GBE to 10,000ns for SCI. Infiniband promises a fasterinterconnect with peaks ranging from about 250MB/sec in early implementations up to apossible peak of 3GB/sec. Sun Fire Link™, which is available on the Sun Fire 6800-15K servershas a bandwidth of up to 1.2GB/sec and a latency of about 4000ns.
SMP interconnect speeds are much faster, ranging from 9.6GB/sec for smaller Sun Fireservers up to an aggregate peak bandwidth of 172GB/sec for the Sun Fire 15K server. Latencyfor Sun Fire servers ranges from about 200ns to 450ns.
Input and OutputFast I/O (input and output) is a necessity to get data from the disks and the network to theinterconnect and to the processors. An I/O bottleneck can adversely affect even the fastestinterconnect and processors.
Operating SystemThe best hardware can be ineffective if the OS is not scalable. The first 64-processorSolaris™/SPARC® SMP server (called CS6400) was delivered in 1993 by the Cray Researchdivision that was later purchased by Sun and subsequently delivered the popular SunEnterprise™ 10000 server. Sun has since been optimizing Solaris for increased performance and scalability. OS scalability is less of a requirement for horizontal systems because individualnodes or individual instances of the OS are usually 4 processors or less.
System AvailabilityAs will be discussed in Chapter 6 in greater detail, the architecture type has importantimplications on system availability. In summary, in large SMPs high-RAS is built into thesystem and augmented with 2-4 node failover. In horizontal systems the nodes themselvesmay have low RAS but by replicating the nodes many times high RAS can be achieved.
P6 © 2003 Sun Microsystems, Inc.
Optimized Applications
Applications need to be optimized for the computing architecture. SMP systems are theeasiest platforms to write and optimize applications for. Key commercial applications havebeen optimized for and developed on SMP systems. This is why SMPs have dominated themidrange and high-end market for the last 10 years.
Chapter 4
Application Size
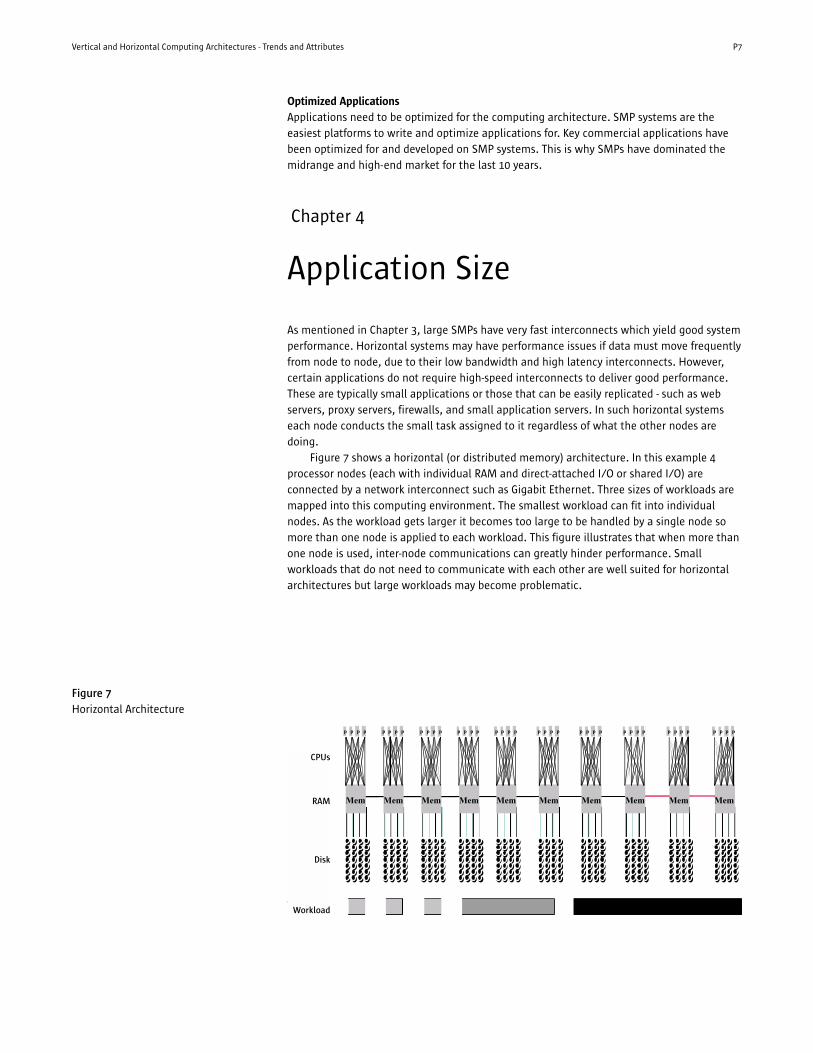
As mentioned in Chapter 3, large SMPs have very fast interconnects which yield good systemperformance. Horizontal systems may have performance issues if data must move frequentlyfrom node to node, due to their low bandwidth and high latency interconnects. However,certain applications do not require high-speed interconnects to deliver good performance.These are typically small applications or those that can be easily replicated - such as webservers, proxy servers, firewalls, and small application servers. In such horizontal systemseach node conducts the small task assigned to it regardless of what the other nodes aredoing.
Figure 7 shows a horizontal (or distributed memory) architecture. In this example 4processor nodes (each with individual RAM and direct-attached I/O or shared I/O) areconnected by a network interconnect such as Gigabit Ethernet. Three sizes of workloads aremapped into this computing environment. The smallest workload can fit into individualnodes. As the workload gets larger it becomes too large to be handled by a single node somore than one node is applied to each workload. This figure illustrates that when more thanone node is used, inter-node communications can greatly hinder performance. Smallworkloads that do not need to communicate with each other are well suited for horizontalarchitectures but large workloads may become problematic.
Vertical and Horizontal Computing Architectures - Trends and Attributes P7
Figure 7Horizontal Architecture
Workload
p p p p
Mem
p p p p
Mem
p p p p
Mem
p p p p
Mem
p p p p
Mem
p p p p
Mem
p p p p
Mem
p p p p
Mem
p p p p
Mem
p p p p
Mem
CPUs
RAM
Disk
Workload
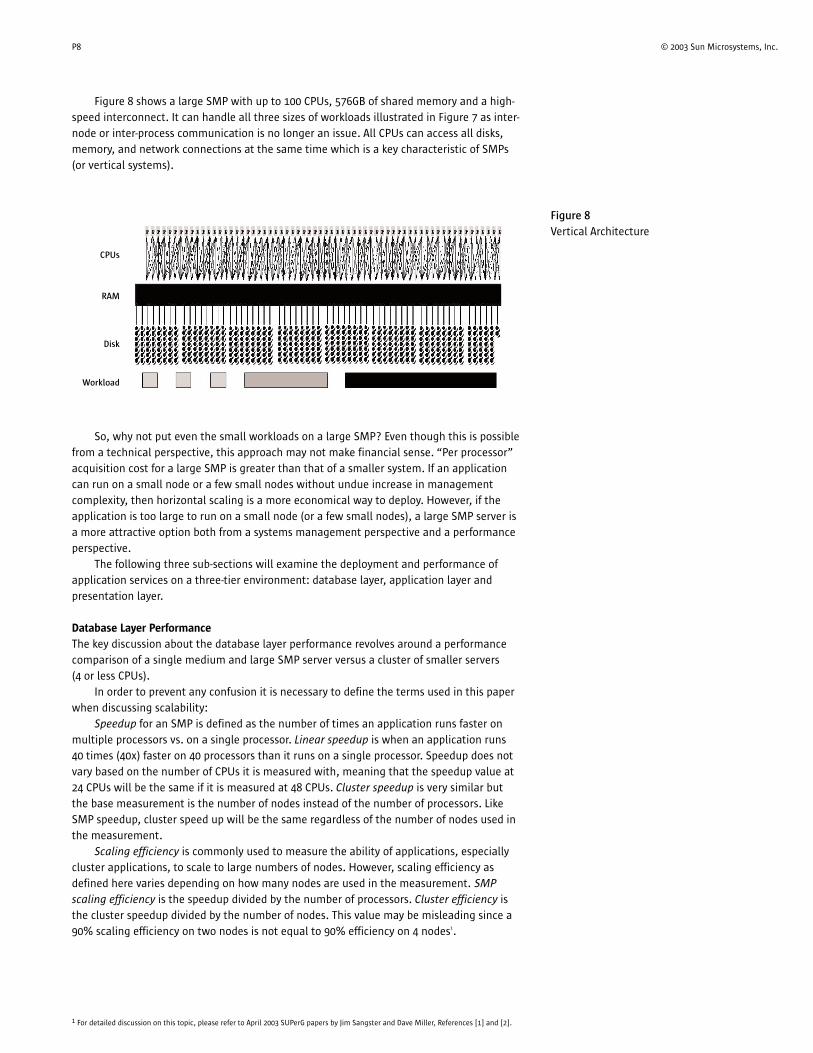
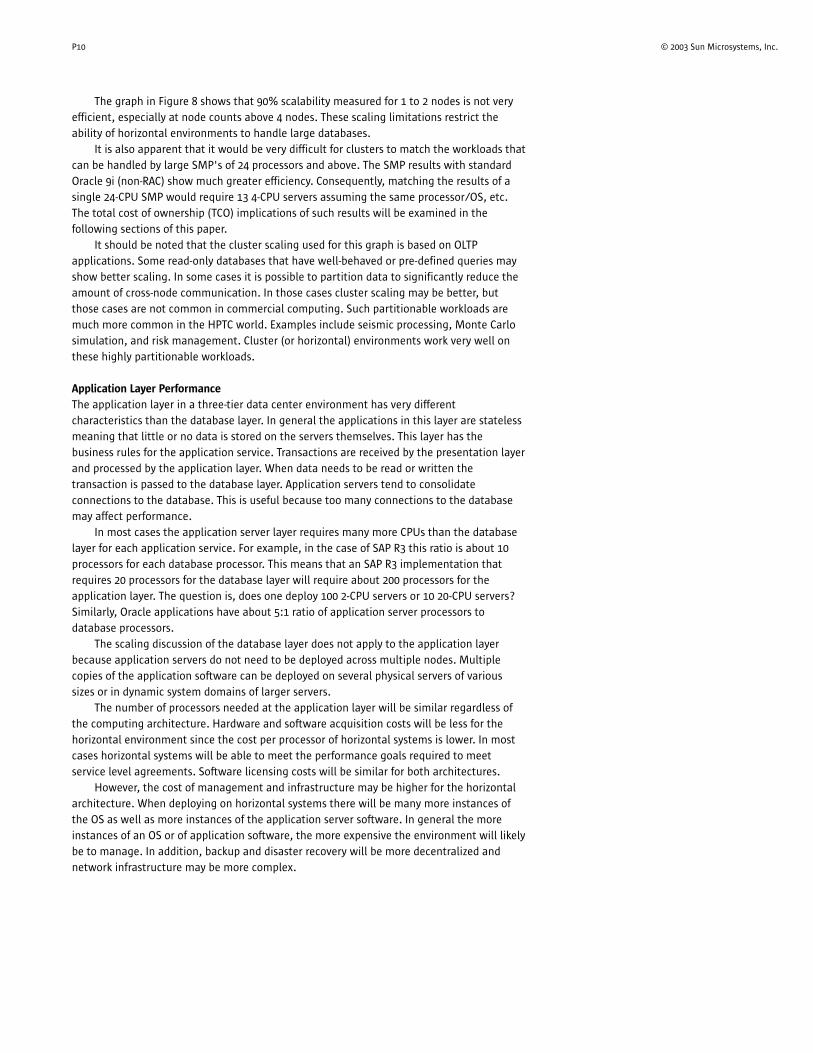
Figure 8 shows a large SMP with up to 100 CPUs, 576GB of shared memory and a high-speed interconnect. It can handle all three sizes of workloads illustrated in Figure 7 as inter-node or inter-process communication is no longer an issue. All CPUs can access all disks,memory, and network connections at the same time which is a key characteristic of SMPs (or vertical systems).
So, why not put even the small workloads on a large SMP? Even though this is possiblefrom a technical perspective, this approach may not make financial sense. “Per processor”acquisition cost for a large SMP is greater than that of a smaller system. If an applicationcan run on a small node or a few small nodes without undue increase in managementcomplexity, then horizontal scaling is a more economical way to deploy. However, if theapplication is too large to run on a small node (or a few small nodes), a large SMP server is a more attractive option both from a systems management perspective and a performanceperspective.
The following three sub-sections will examine the deployment and performance ofapplication services on a three-tier environment: database layer, application layer andpresentation layer.
Database Layer Performance
The key discussion about the database layer performance revolves around a performancecomparison of a single medium and large SMP server versus a cluster of smaller servers (4 or less CPUs).
In order to prevent any confusion it is necessary to define the terms used in this paperwhen discussing scalability:
Speedup for an SMP is defined as the number of times an application runs faster onmultiple processors vs. on a single processor. Linear speedup is when an application runs 40 times (40x) faster on 40 processors than it runs on a single processor. Speedup does notvary based on the number of CPUs it is measured with, meaning that the speedup value at24 CPUs will be the same if it is measured at 48 CPUs. Cluster speedup is very similar but the base measurement is the number of nodes instead of the number of processors. LikeSMP speedup, cluster speed up will be the same regardless of the number of nodes used inthe measurement.
Scaling efficiency is commonly used to measure the ability of applications, especiallycluster applications, to scale to large numbers of nodes. However, scaling efficiency asdefined here varies depending on how many nodes are used in the measurement. SMPscaling efficiency is the speedup divided by the number of processors. Cluster efficiency isthe cluster speedup divided by the number of nodes. This value may be misleading since a90% scaling efficiency on two nodes is not equal to 90% efficiency on 4 nodes1.
P8 © 2003 Sun Microsystems, Inc.
Figure 8Vertical Architecture
CPUs
RAM
Disk
Workload
1 For detailed discussion on this topic, please refer to April 2003 SUPerG papers by Jim Sangster and Dave Miller, References [1] and [2].
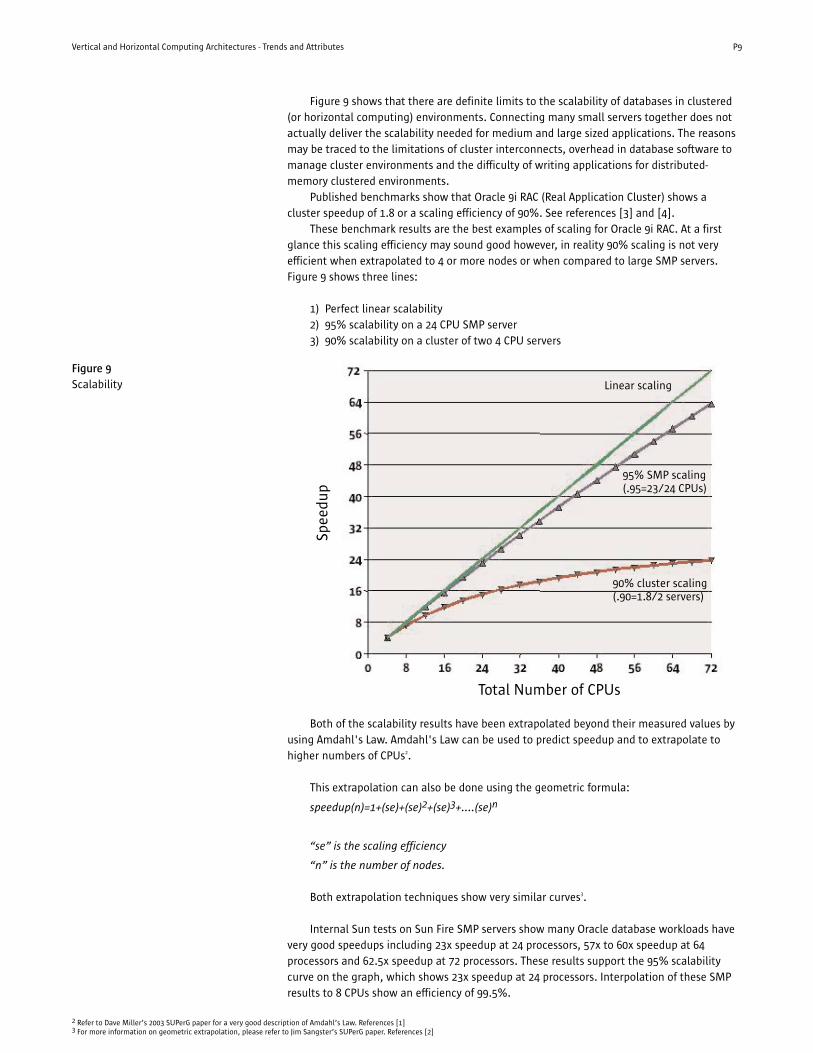
Figure 9 shows that there are definite limits to the scalability of databases in clustered(or horizontal computing) environments. Connecting many small servers together does notactually deliver the scalability needed for medium and large sized applications. The reasonsmay be traced to the limitations of cluster interconnects, overhead in database software tomanage cluster environments and the difficulty of writing applications for distributed-memory clustered environments.
Published benchmarks show that Oracle 9i RAC (Real Application Cluster) shows acluster speedup of 1.8 or a scaling efficiency of 90%. See references [3] and [4].
These benchmark results are the best examples of scaling for Oracle 9i RAC. At a firstglance this scaling efficiency may sound good however, in reality 90% scaling is not veryefficient when extrapolated to 4 or more nodes or when compared to large SMP servers.Figure 9 shows three lines:
1) Perfect linear scalability2) 95% scalability on a 24 CPU SMP server3) 90% scalability on a cluster of two 4 CPU servers
Both of the scalability results have been extrapolated beyond their measured values byusing Amdahl's Law. Amdahl's Law can be used to predict speedup and to extrapolate tohigher numbers of CPUs2.
This extrapolation can also be done using the geometric formula:
speedup(n)=1+(se)+(se)2+(se)3+....(se)n
“se” is the scaling efficiency
“n” is the number of nodes.
Both extrapolation techniques show very similar curves3.
Internal Sun tests on Sun Fire SMP servers show many Oracle database workloads havevery good speedups including 23x speedup at 24 processors, 57x to 60x speedup at 64processors and 62.5x speedup at 72 processors. These results support the 95% scalabilitycurve on the graph, which shows 23x speedup at 24 processors. Interpolation of these SMPresults to 8 CPUs show an efficiency of 99.5%.
Vertical and Horizontal Computing Architectures - Trends and Attributes P9
Figure 9Scalability
Total Number of CPUs
95% SMP scaling(.95=23/24 CPUs)
Linear scaling
90% cluster scaling(.90=1.8/2 servers)
Spee
dup
2 Refer to Dave Miller’s 2003 SUPerG paper for a very good description of Amdahl’s Law. References [1]3 For more information on geometric extrapolation, please refer to Jim Sangster’s SUPerG paper. References [2]
The graph in Figure 8 shows that 90% scalability measured for 1 to 2 nodes is not veryefficient, especially at node counts above 4 nodes. These scaling limitations restrict theability of horizontal environments to handle large databases.
It is also apparent that it would be very difficult for clusters to match the workloads thatcan be handled by large SMP's of 24 processors and above. The SMP results with standardOracle 9i (non-RAC) show much greater efficiency. Consequently, matching the results of asingle 24-CPU SMP would require 13 4-CPU servers assuming the same processor/OS, etc.The total cost of ownership (TCO) implications of such results will be examined in thefollowing sections of this paper.
It should be noted that the cluster scaling used for this graph is based on OLTPapplications. Some read-only databases that have well-behaved or pre-defined queries mayshow better scaling. In some cases it is possible to partition data to significantly reduce theamount of cross-node communication. In those cases cluster scaling may be better, butthose cases are not common in commercial computing. Such partitionable workloads aremuch more common in the HPTC world. Examples include seismic processing, Monte Carlosimulation, and risk management. Cluster (or horizontal) environments work very well onthese highly partitionable workloads.
Application Layer Performance
The application layer in a three-tier data center environment has very differentcharacteristics than the database layer. In general the applications in this layer are statelessmeaning that little or no data is stored on the servers themselves. This layer has thebusiness rules for the application service. Transactions are received by the presentation layerand processed by the application layer. When data needs to be read or written thetransaction is passed to the database layer. Application servers tend to consolidateconnections to the database. This is useful because too many connections to the databasemay affect performance.
In most cases the application server layer requires many more CPUs than the databaselayer for each application service. For example, in the case of SAP R3 this ratio is about 10processors for each database processor. This means that an SAP R3 implementation thatrequires 20 processors for the database layer will require about 200 processors for theapplication layer. The question is, does one deploy 100 2-CPU servers or 10 20-CPU servers?Similarly, Oracle applications have about 5:1 ratio of application server processors todatabase processors.
The scaling discussion of the database layer does not apply to the application layerbecause application servers do not need to be deployed across multiple nodes. Multiplecopies of the application software can be deployed on several physical servers of varioussizes or in dynamic system domains of larger servers.
The number of processors needed at the application layer will be similar regardless ofthe computing architecture. Hardware and software acquisition costs will be less for thehorizontal environment since the cost per processor of horizontal systems is lower. In mostcases horizontal systems will be able to meet the performance goals required to meetservice level agreements. Software licensing costs will be similar for both architectures.
However, the cost of management and infrastructure may be higher for the horizontalarchitecture. When deploying on horizontal systems there will be many more instances ofthe OS as well as more instances of the application server software. In general the moreinstances of an OS or of application software, the more expensive the environment will likelybe to manage. In addition, backup and disaster recovery will be more decentralized andnetwork infrastructure may be more complex.
P10 © 2003 Sun Microsystems, Inc.
The cost of systems management is hard to measure. Typically, the models that comparehorizontal and vertical implementations for application servers, show that managing fewerand larger servers (vertical servers) is less expensive than managing many smaller servers.When deciding on the type of architecture that will be used to deploy services on theapplication layer, IT managers should analyze in detail both the cost of management andthe cost of hardware acquisition.
Presentation Layer Performance
The presentation layer or tier 1 is the access point to application services. The presentationlayer is dominated by applications such as webservers, VPN servers, proxy servers, firewalls,etc. These applications are stateless, they pass transactions from the user community to theapplication layer. Little scalability is found in these applications. Each instance of thesepresentation layer applications are essentially the same making deployment andmanagement on a horizontal architecture relatively straightforward. Vertical systems caneasily run the many different types of applications deployed in the presentation layer but thecost of acquisition of the larger vertical systems is generally greater than the cost savingsachieved by reducing management costs. Therefore, the architecture recommended for thepresentation layer is horizontal.
Chapter 5
TCO Implications of Vertical andHorizontal Architectures
Deploying databases in a horizontal architecture requires the use of a clustered database.The most common clustered database used with Solaris systems is Oracle 9i RAC. In theprevious section we have discussed some of the scalability issues associated with usingOracle 9i RAC (referred to as RAC). This section analyzes the effect of these scalabilitylimitations on total cost of ownership. To make the analysis easier to quantify the analysis isrestricted to total cost of acquisition (TCA). TCA as discussed here includes the cost ofsoftware licenses, the cost of servers, and cluster interconnects. Storage cost is not included.
The use of Oracle 9i RAC requires a different license scheme than using standard Oracle9i, the non-clustered version. For any system regardless of the size, RAC requires that theuser pay $40,000 per processor for the database4. This license fee is the same for standardOracle 9i (non-RAC). Next, the user has to pay $20,000 per processor for the RAC option.Lastly, the user has the option of paying $10,000 per processor for the capability to partitiondata. While the $10,000 is optional tests show that data partitioning will provide betterscalability. This totals to $70,000 per processor for RAC license fees as compared to $40,000per processor license fees for standard Oracle 9i.
Andrew Harrison of Sun has created a facts-based tool to calculate and compare the TCAof a single SMP system running Oracle 9i versus a cluster environment running Oracle 9i RACand delivering the same performance.
This tool called the RAC Calculator is not a model but simply an aid in calculating TCA.All of the key input parameters are user-provided so the user can test various scenarios andassumptions. The tool itself is not based on assumptions.
Vertical and Horizontal Computing Architectures - Trends and Attributes P11
4 All prices provided are U.S. List prices in April 2003.
The user inputs the following information: Name/model of target SMP serverNumber of processors of the target SMP serverList price of the target SMP server Name/model of the cluster node Number of the cluster nodes Performance ratio of the processors used in the cluster node vs the SMP systemPer processor price of Oracle 9iPer processor price of RAC optionPer processor price of partitioning optionSMP discount percentageCluster node discount percentageOracle discount percentageScalability percentagePercentage decay from one node to the next
The RAC Calculator first calculates the number of cluster nodes and identifies thenumber of processors required to match the performance of the single SMP system.
Please note that the RAC Calculator uses a slightly different method to extrapolateperformance, given two-node speedup, than the method explained earlier. The calculatoruses a more straight line decay. The input “scalability percentage” (sp) is the percentage ofextra performance benefit that the second provides. The decay (de) is applied to eachsuccessive node to reduce that node's contribution to the total result. The formula is thus:
speedup(n)=1+(sp)+(sp-de)+(sp-2de)+...(sp-(n-2)de)5
Since the decay is the same per node at some point the contribution of more nodesbecomes zero. The number of nodes(n) that contribute to increased performance in a clusteris n=sp/de so the smaller the “de” or the larger the “sp” the more nodes will contribute.
After the number of cluster nodes and processors are calculated the tool calculates theTCA for both configurations using the user supplied pricing data and discounts. Lastly, thetool plots the TCA for both solutions and breaks out the amount of the TCA in terms ofhardware, software and cluster interconnect costs as applicable. There is an option to add inthe cost of SAN connections but for the purposes of this paper that cost was assumed zero inall cases.
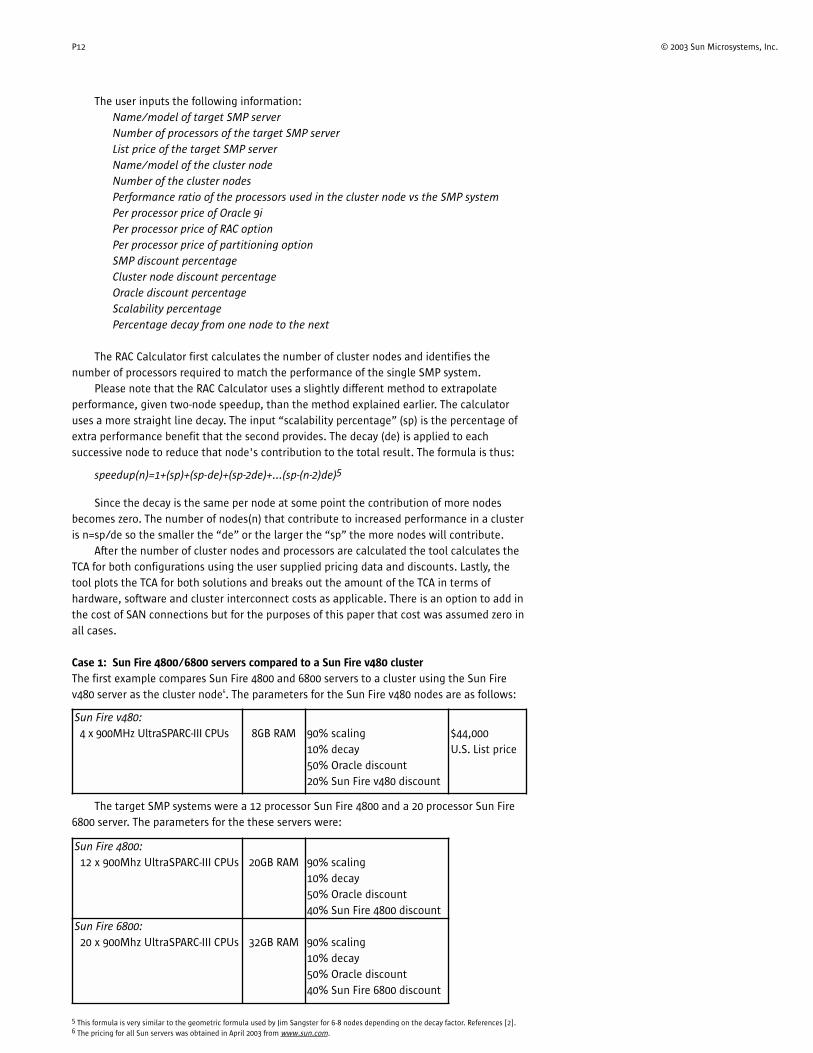
Case 1: Sun Fire 4800/6800 servers compared to a Sun Fire v480 cluster
The first example compares Sun Fire 4800 and 6800 servers to a cluster using the Sun Firev480 server as the cluster node6. The parameters for the Sun Fire v480 nodes are as follows:
The target SMP systems were a 12 processor Sun Fire 4800 and a 20 processor Sun Fire6800 server. The parameters for the these servers were:
P12 © 2003 Sun Microsystems, Inc.
5 This formula is very similar to the geometric formula used by Jim Sangster for 6-8 nodes depending on the decay factor. References [2].6 The pricing for all Sun servers was obtained in April 2003 from www.sun.com.
Sun Fire v480:4 x 900MHz UltraSPARC-III CPUs 8GB RAM 90% scaling
10% decay50% Oracle discount20% Sun Fire v480 discount
$44,000U.S. List price
Sun Fire 4800:12 x 900Mhz UltraSPARC-III CPUs 20GB RAM 90% scaling
10% decay50% Oracle discount40% Sun Fire 4800 discount
Sun Fire 6800:20 x 900Mhz UltraSPARC-III CPUs 32GB RAM 90% scaling
10% decay50% Oracle discount40% Sun Fire 6800 discount
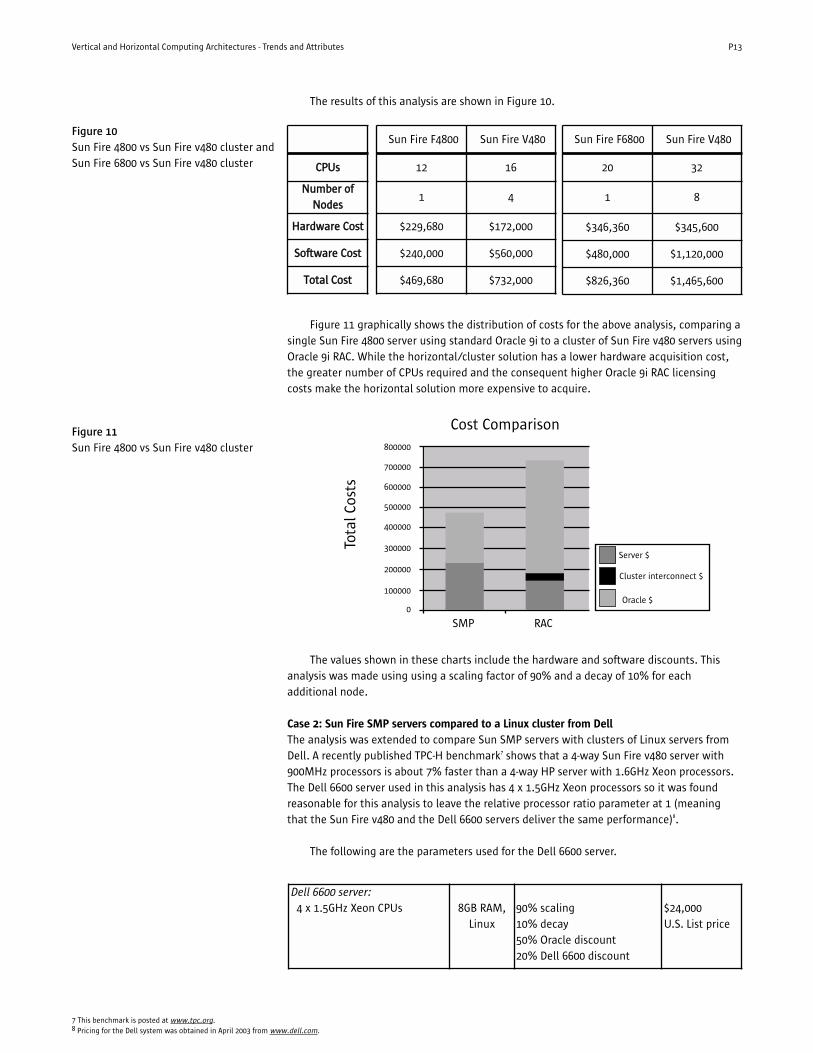
The results of this analysis are shown in Figure 10.
Figure 11 graphically shows the distribution of costs for the above analysis, comparing asingle Sun Fire 4800 server using standard Oracle 9i to a cluster of Sun Fire v480 servers usingOracle 9i RAC. While the horizontal/cluster solution has a lower hardware acquisition cost,the greater number of CPUs required and the consequent higher Oracle 9i RAC licensingcosts make the horizontal solution more expensive to acquire.
The values shown in these charts include the hardware and software discounts. Thisanalysis was made using using a scaling factor of 90% and a decay of 10% for eachadditional node.
Case 2: Sun Fire SMP servers compared to a Linux cluster from Dell
The analysis was extended to compare Sun SMP servers with clusters of Linux servers fromDell. A recently published TPC-H benchmark7 shows that a 4-way Sun Fire v480 server with900MHz processors is about 7% faster than a 4-way HP server with 1.6GHz Xeon processors.The Dell 6600 server used in this analysis has 4 x 1.5GHz Xeon processors so it was foundreasonable for this analysis to leave the relative processor ratio parameter at 1 (meaningthat the Sun Fire v480 and the Dell 6600 servers deliver the same performance)8.
The following are the parameters used for the Dell 6600 server.
Vertical and Horizontal Computing Architectures - Trends and Attributes P13
Figure 10Sun Fire 4800 vs Sun Fire v480 cluster andSun Fire 6800 vs Sun Fire v480 cluster CCPPUUss
NNuummbbeerr ooffNNooddeess
HHaarrddwwaarree CCoosstt
SSooffttwwaarree CCoosstt
TToottaall CCoosstt
Figure 11Sun Fire 4800 vs Sun Fire v480 cluster
Sun Fire F6800 Sun Fire V480
20 32
1 8
$346,360 $345,600
$480,000 $1,120,000
$826,360 $1,465,600
7 This benchmark is posted at www.tpc.org.8 Pricing for the Dell system was obtained in April 2003 from www.dell.com.
Sun Fire F4800 Sun Fire V480
12 16
1 4
$229,680 $172,000
$240,000 $560,000
$469,680 $732,000
800000
700000
600000
500000
400000
300000
200000
100000
0Oracle $
Cluster interconnect $
Server $
Cost Comparison
Tota
l Cos
ts
SMP RAC
Dell 6600 server:4 x 1.5GHz Xeon CPUs 8GB RAM,
Linux90% scaling10% decay50% Oracle discount20% Dell 6600 discount
$24,000 U.S. List price

The results are shown in Figures 12 and 13.
In all four cases above the single vertical Sun Fire server had a lower TCA than the Dellcluster even though the hardware costs for the horizontal solution was generally less.
Figure 14 graphically shows the results of the Sun Fire 4800 server vs the Dell 6600cluster.
P14 © 2003 Sun Microsystems, Inc.
CCPPUUss
NNuummbbeerr ooffNNooddeess
HHaarrddwwaarree CCoosstt
SSooffttwwaarree CCoosstt
TToottaall CCoosstt
Figure 12Sun Fire v880 vs Dell 6600 cluster andSun Fire v1280 vs Dell 6600 cluster
Figure 13Sun Fire 4800 vs Dell 6600 cluster andSun Fire 6800 vs Dell 6600 cluster
Figure 14Sun Fire 4800 vs Dell 6600 cluster
Sun Fire V1280 Dell 6600
12 16
1 4
$140,000 $108,800
$240,000 $560,000
$380,000 $668,800
Sun Fire V880 Dell 6600
8 12
1 3
$80,000 $81,600
$160,000 $420,000
$240,000 $501,600
CCPPUUss
NNuummbbeerr ooffNNooddeess
HHaarrddwwaarree CCoosstt
SSooffttwwaarree CCoosstt
TToottaall CCoosstt
Sun Fire F6800 Dell 6600
20 32
1 8
$346,360 $217,600
$480,000 $1,120,000
$826,360 $1,337,600
Sun Fire F4800 Dell 6600
12 16
1 4
$229,680 $108,800
$240,000 $560,000
$469,680 $668,800
700000
650000
600000
550000
500000
450000
400000
350000
300000
250000
200000
150000
100000
50000
0
Cost Comparison
Tota
l Cos
ts
SMP RAC
Oracle $
Cluster interconnect $
Server $
Chapter 6
Availability Implications
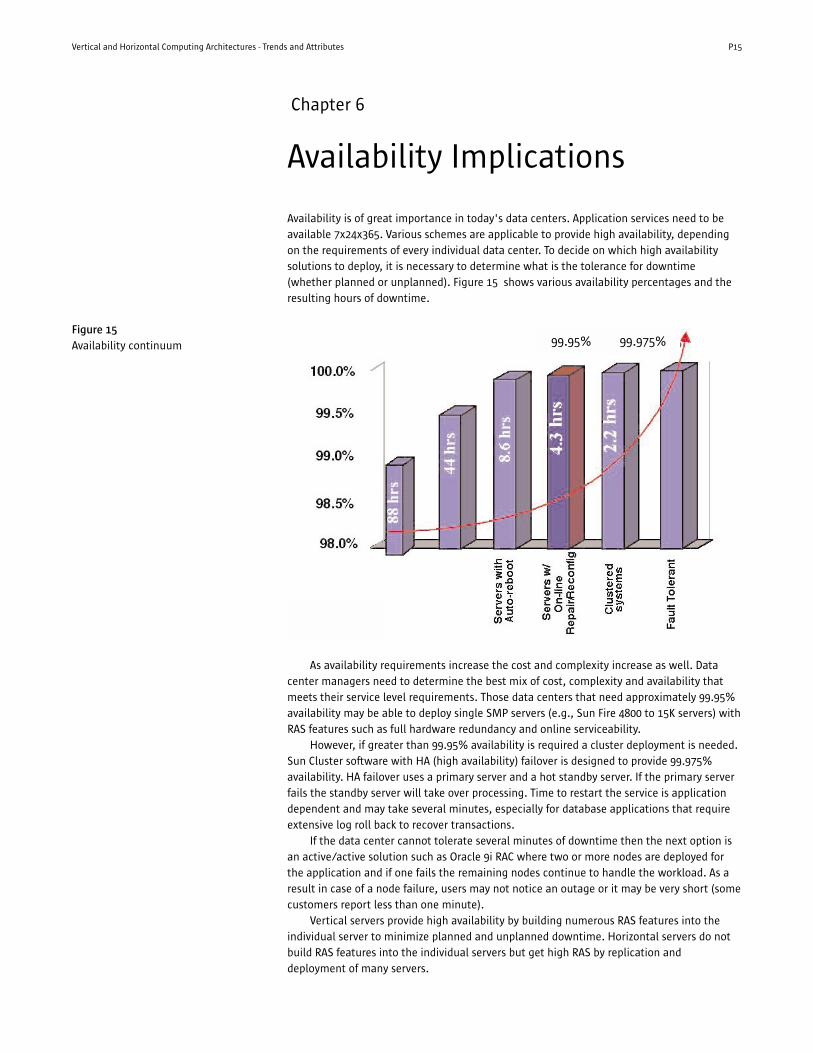
Availability is of great importance in today's data centers. Application services need to beavailable 7x24x365. Various schemes are applicable to provide high availability, dependingon the requirements of every individual data center. To decide on which high availabilitysolutions to deploy, it is necessary to determine what is the tolerance for downtime(whether planned or unplanned). Figure 15 shows various availability percentages and theresulting hours of downtime.
As availability requirements increase the cost and complexity increase as well. Datacenter managers need to determine the best mix of cost, complexity and availability thatmeets their service level requirements. Those data centers that need approximately 99.95%availability may be able to deploy single SMP servers (e.g., Sun Fire 4800 to 15K servers) withRAS features such as full hardware redundancy and online serviceability.
However, if greater than 99.95% availability is required a cluster deployment is needed.Sun Cluster software with HA (high availability) failover is designed to provide 99.975%availability. HA failover uses a primary server and a hot standby server. If the primary serverfails the standby server will take over processing. Time to restart the service is applicationdependent and may take several minutes, especially for database applications that requireextensive log roll back to recover transactions.
If the data center cannot tolerate several minutes of downtime then the next option isan active/active solution such as Oracle 9i RAC where two or more nodes are deployed forthe application and if one fails the remaining nodes continue to handle the workload. As aresult in case of a node failure, users may not notice an outage or it may be very short (somecustomers report less than one minute).
Vertical servers provide high availability by building numerous RAS features into theindividual server to minimize planned and unplanned downtime. Horizontal servers do notbuild RAS features into the individual servers but get high RAS by replication anddeployment of many servers.
Vertical and Horizontal Computing Architectures - Trends and Attributes P15
Figure 15Availability continuum 99.95% 99.975%
The difference in RAS, as well as the difference in interconnects are the primary reasonswhy horizontal servers are generally lower cost per unit of processing power.
In the three-tier architecture, a good example of horizontal high availability is thedeployment of web servers. It is possible to deploy many small servers each with a copy ofthe web server software. If one web server fails the transactions are routed to one of thesurviving servers. In the case of application servers both horizontal and vertical servers maybe deployed and replication again can provide high availability. Whether a few large SMP'sor many smaller servers are deployed, replication is the main technique for high RAS in theapplication layer.
However, the database layer is different. Databases are stateful and by nature require inmost cases that the data is shared and accessible among all processors/nodes. This meansthat to provide the replication necessary for high availability, cluster software such as SunCluster or Oracle 9i RAC (for very high availability) are needed.
So far we have analyzed the TCA and performance implications of vertical vs horizontal(non-RAC vs RAC) deployments. However, what if the availability requirements demand RACregardless of the possible performance issues? Assuming that RAC is necessary to meet themost demanding availability requirements, is it better to cluster fewer big SMP's or manysmaller horizontal servers?
Case 3: Cluster of two 12-CPU Sun Fire 6800 servers compared to a cluster of eight 4-CPU Sun
Fire v480 servers
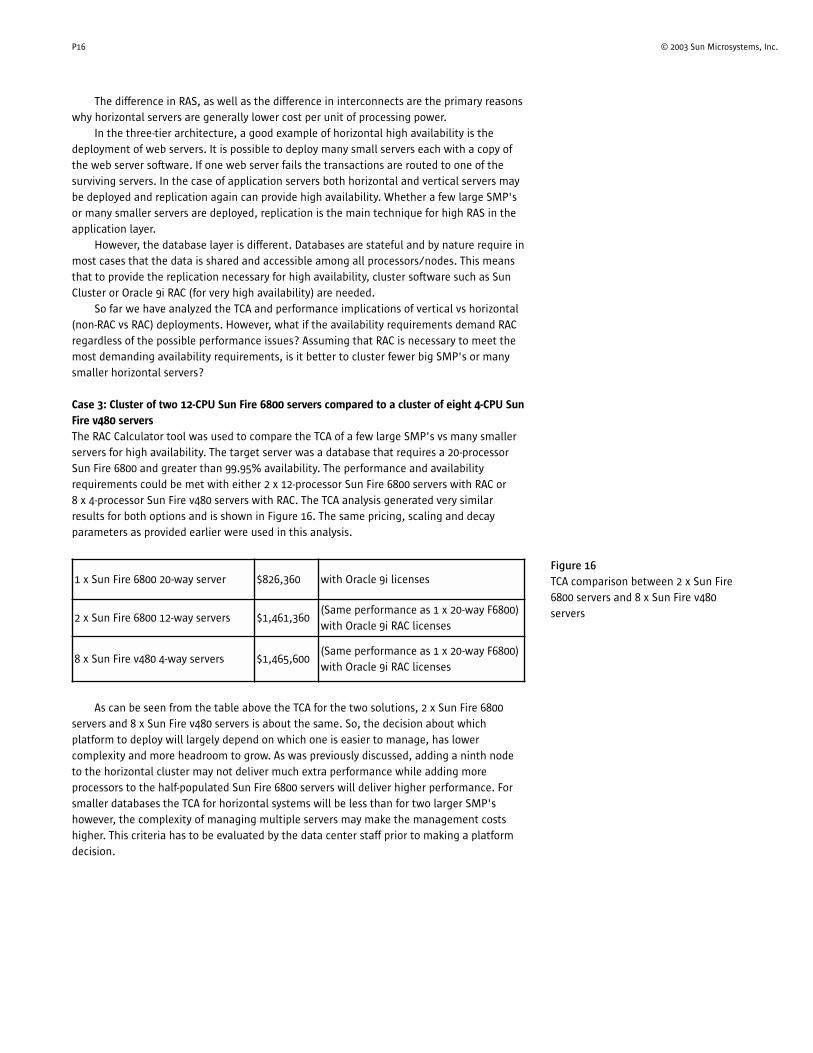
The RAC Calculator tool was used to compare the TCA of a few large SMP's vs many smallerservers for high availability. The target server was a database that requires a 20-processorSun Fire 6800 and greater than 99.95% availability. The performance and availabilityrequirements could be met with either 2 x 12-processor Sun Fire 6800 servers with RAC or 8 x 4-processor Sun Fire v480 servers with RAC. The TCA analysis generated very similarresults for both options and is shown in Figure 16. The same pricing, scaling and decayparameters as provided earlier were used in this analysis.
As can be seen from the table above the TCA for the two solutions, 2 x Sun Fire 6800servers and 8 x Sun Fire v480 servers is about the same. So, the decision about whichplatform to deploy will largely depend on which one is easier to manage, has lowercomplexity and more headroom to grow. As was previously discussed, adding a ninth nodeto the horizontal cluster may not deliver much extra performance while adding moreprocessors to the half-populated Sun Fire 6800 servers will deliver higher performance. Forsmaller databases the TCA for horizontal systems will be less than for two larger SMP'showever, the complexity of managing multiple servers may make the management costshigher. This criteria has to be evaluated by the data center staff prior to making a platformdecision.
P16 © 2003 Sun Microsystems, Inc.
Figure 16TCA comparison between 2 x Sun Fire6800 servers and 8 x Sun Fire v480servers
1 x Sun Fire 6800 20-way server $826,360 with Oracle 9i licenses
2 x Sun Fire 6800 12-way servers $1,461,360(Same performance as 1 x 20-way F6800)with Oracle 9i RAC licenses
8 x Sun Fire v480 4-way servers $1,465,600(Same performance as 1 x 20-way F6800)with Oracle 9i RAC licenses
Chapter 7
Consolidation
This papers focus is on availability, performance and the resulting TCA implications ofmaking an infrastructure choice. However, a very important area of discussion whilecomparing vertical or horizontal architectures is the issue of consolidation. Consolidationcan take on many forms but the ultimate goal and the end result is reduced cost andcomplexity.
In the case of vertical servers, technologies such as dynamic system domains, SolarisResource Manager, and processor sets can be used to run many applications on a singlesystem and lead to higher system utilization. For horizontal servers technologies such asFlash and JumpStart can help consolidate resources and procedures to lower costs.
For more in-depth information on consolidation please refer to the Sun BluePrint book“Consolidation in the Data Center” by David Hornby and Ken Pepple. See References [5].
Chapter 8
Summary
Both vertical and horizontal architectures have their place in today's data center. Whilemuch of the media attention is focused on new technologies such as Blades and paralleldatabase technology, the market remains strong for midrange and high-end servers.
Vertical and horizontal systems may use the same software, the same operating systemand even the same processors. The key difference that affects both price and performance isthe interconnect used with each architecture. Horizontal servers use a loosely-coupledexternal interconnect. Vertical servers use a tightly-coupled internal interconnect thatmakes data communications faster.
For the presentation tier (tier 1), horizontal servers are the ideal solution in terms ofperformance, total cost of acquisition and availability. For the application layer (tier 2) bothvertical and horizontal architectures can be used effectively. The database tier (tier 3) isbetter served by vertical servers regardless of the level of availability required.
No matter what type of deployment is preferred, Sun can provide the best of breedproducts for both architectures, all running the robust Solaris Operating Environment.
References
[1] “Oracle 9i RAC Performance and Best Practices”, David J. Miller, SUPerG, Berlin, 2003.[2] “Deploying Oracle in the SunPlex™ Environment”, Jim Sangster, SUPerG, Berlin, 2003.[3] Oracle Applications Scalability:
www.oracle.com/ip/deploy/database/theme_pages/index.html?rac_01242003.html[4] SAP R3 Scalability:
www.sap.com/benchmark/others.htm#Round%Robin[5] “Consolidation in the Data Center”, David Hornby and Ken Pepple:
http://www.sun.com/solutions/blueprints/pubs.html[6] Sun hardware pricing: www.sun.com[7] Dell hardware pricing: www.dell.com[8] TPC-H results: www.tpc.org
Vertical and Horizontal Computing Architectures - Trends and Attributes P17

Sun Worldwide Sales Offices: Argentina +5411-4317-5600, Australia +61-2-9844-5000, Austria +43-1-60563-0, Belgium +32-2-704-8000, Brazil +55-11-5187-2100, Canada +905-477-6745, Chile +56-2-3724500, Colombia +571-629-2323,Commonwealth of Independent States +7-502-935-8411, Czech Republic +420-2-3300-9311, Denmark +45 4556 5000, Egypt +202-570-9442, Estonia +372-6-308-900, Finland +358-9-525-561, France +33-134-03-00-00, Germany +49-89-46008-0, Greece +30-1-618-8111, Hungary +36-1-489-8900, Iceland +354-563-3010, India–Bangalore +91-80-2298989/2295454; New Delhi +91-11-6106000; Mumbai +91-22-697-8111, Ireland +353-1-8055-666, Israel +972-9-9710500, Italy +39-02-641511, Japan +81-3-5717-5000, Kazakhstan +7-3272-466774, Korea +822-2193-5114, Latvia +371-750-3700, Lithuania +370-729-8468, Luxembourg +352-49 11 33 1, Malaysia +603-21161888, Mexico+52-5-258-6100, The Netherlands +00-31-33-45-15-000, New Zealand–Auckland +64-9-976-6800; Wellington +64-4-462-0780, Norway +47 23 36 96 00, People's Republic of China–Beijing +86-10-6803-5588; Chengdu +86-28-619-9333;Guangzhou +86-20-8755-5900; Shanghai +86-21-6466-1228; Hong Kong +852-2202-6688, Poland +48-22-8747800, Portugal +351-21-4134000, Russia +7-502-935-8411, Saudi Arabia +9661 273 4567, Singapore +65-6438-1888, SlovakRepublic +421-2-4342-94-85, South Africa +27 11 256-6300, Spain +34-91-596-9900, Sweden +46-8-631-10-00, Switzerland–German 41-1-908-90-00; French 41-22-999-0444, Taiwan +886-2-8732-9933, Thailand +662-344-6888, Turkey+90-212-335-22-00, United Arab Emirates +9714-3366333, United Kingdom +44-1-276-20444, United States +1-800-555-9SUN OR +1-650-960-1300, Venezuela +58-2-905-3800, or Online at sun.com/store
Whitepaper Vertical and Horizontal Computing Architectures - Trends and Attributes On the Web: sun.com
Sun Microsystems, Inc., 4150 Network Circle, Santa Clara, CA 95054 USA Phone 1-650-960 -1300 or 1-800-555-9sun Web sun.com