vertical profiles of environmental factors within tropical
TRANSCRIPT
J. For. Res. 6 : 2 5 7 - 2 6 4 (2001)
Vertical Profiles of Environmental Factors within Tropical Rainforest, Lambir Hills National Park, Sarawak, Malaysia
Tomo'omi Kumagai, *l, 1 Koichiro Kuraji, .2' 2 Hironori Noguchi, .3' 3 Yuri Tanaka, .2
Katsunori Tanaka .4 and Masakazu Suzuki .3
* 1University Forest in Miyazaki, Kyushu University, 949 Ohkawachi, Shiiba, Higashi-usuki, Miyazaki 883-0402, Japan. *2Interdisciplinary Graduate School of Science and Engineering, Tokyo Institute of Technology, Yokohama 226-8502, Japan. *3Graduate School of Agricultural and Life Sciences, The University of Tokyo, Tokyo 113-8657, Japan. *4Frontier Research System for Global Change, Yokohama 236-0001, Japan.
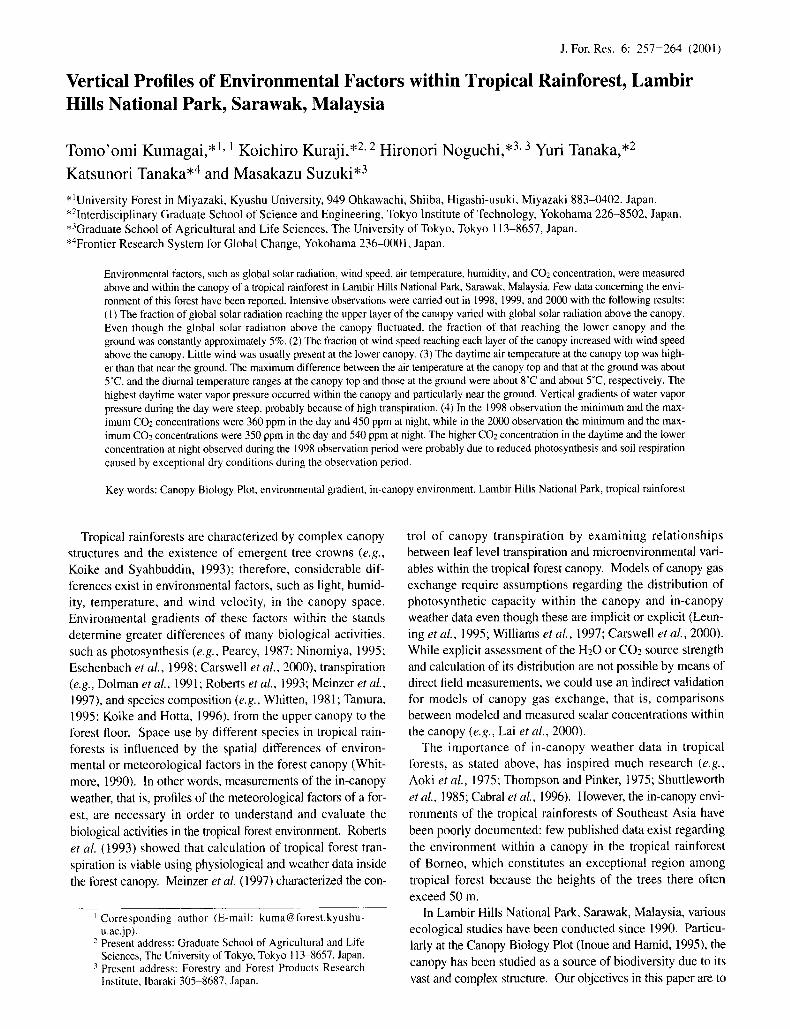
Environmental factors, such as global solar radiation, wind speed, air temperature, humidity, and CO2 concentration, were measured above and within the canopy of a tropical rainforest in Lambir Hills National Park, Sarawak, Malaysia. Few data concerning the envi- ronment of this forest have been reported. Intensive observations were carried out in 1998, 1999, and 2000 with the following results: ( 1 ) The fraction of global solar radiation reaching the upper layer of the canopy varied with global solar radiation above the canopy. Even though the global solar radiation above the canopy fluctuated, the fraction of that reaching the lower canopy and the ground was constantly approximately 5%. (2) The traction of wind speed reaching each layer of the canopy increased with wind speed above the canopy. Little wind was usually present at the lower canopy. (3) The daytime air temperature at the canopy top was high- er than that near the ground. The maximum difference between the air temperature at the canopy top and that at the ground was about 5°C, and the diurnal temperature ranges at the canopy top and those at the ground were about 8°C and about 5°C, respectively. The highest daytime water vapor pressure occurred within the canopy and particularly near the ground. Vertical gradients of water vapor pressure during the day were steep, probably because of high transpiration. (4) In the 1998 observation the minimum and the max- imum CO2 concentrations were 360 ppm in the day and 450 ppm at night, while in the 2000 observation the minimum and the max- imum CO2 concentrations were 350 ppm in the day and 540 ppm at night. The higher CO_, concentration in the daytime and the lower concentration at night observed during the 1998 observation period were probably due to reduced photosynthesis and soil respiration caused by exceptional dry conditions during the observation period.
Key words: Canopy Biology Plot, environmental gradient, in-canopy environment, Lambir Hills National Park, tropical rainforest
Tropical rainforests are characterized by complex canopy structures and the existence of emergent tree crowns (e.g., Koike and Syahbuddin, 1993); therefore, considerable dif- ferences exist in environmental factors, such as light, humid- ity, temperature, and wind velocity, in the canopy space. Environmental gradients of these factors within the stands
determine greater differences of many biological activities, such as photosynthesis (e.g., Pearcy, 1987; Ninomiya, 1995; Eschenbach et al., 1998; Carswell et al., 2000), transpiration (e.g., Dolman et aL, 1991; Roberts et al., 1993; Meinzer et aL, 1997), and species composition (e.g., Whitten, 1981 ; Tamura, 1995; Koike and Hotta, 1996), from the upper canopy to the forest floor. Space use by different species in tropical rain- forests is influenced by the spatial differences of environ- mental or meteorological factors in the forest canopy (Whit-
more, 1990). In other words, measurements of the in-canopy
weather, that is, profiles of the meteorological factors of a for-
est, are necessary in order to understand and evaluate the
biological activities in the tropical forest environment. Roberts
et al. (1993) showed that calculation of tropical forest tran-
spiration is viable using physiological and weather data inside
the torest canopy. Meinzer et al. (1997) characterized the con-
I Corresponding author (E-mail: [email protected] u.ac.jp).
2 Present address: Graduate School of Agricultural and Life Sciences, The University of Tokyo, Tokyo I13-8657, Japan. Present address: Forestry and Forest Products Research Institute, Ibaraki 305-8687, Japan.
trol of canopy t ranspirat ion by examining relat ionships between leaf level transpiration and microenvironmental vari- ables within the tropical forest canopy. Models of canopy gas exchange require assumptions regarding the distribution of photosynthetic capacity within the canopy and in-canopy weather data even though these are implicit or explicit (Leun-
ing et al., 1995; Williams et at., 1997; Carswell et al., 2000). While explicit assessment of the H20 or CO2 source strength and calculation of its distribution are not possible by means of direct field measurements, we could use an indirect validation for models of canopy gas exchange, that is, comparisons between modeled and measured scalar concentrations within
the canopy (e.g., Lai et al., 2000). The importance of in-canopy weather data in tropical
forests, as stated above, has inspired much research (e.g., Aoki et al., 1975; Thompson and Pinker, 1975; Shuttleworth
et aL, 1985; Cabral et aL, 1996). However, the in-canopy envi-
ronments of the tropical rainforests of Southeast Asia have
been poorly documented: few published data exist regarding
the environment within a canopy in the tropical rainforest
of Borneo, which constitutes an exceptional region among
tropical forest because the heights of the trees there often
exceed 50 m. In Lambir Hills National Park, Sarawak, Malaysia, various
ecological studies have been conducted since 1990. Particu- larly at the Canopy Biology Plot (Inoue and Hamid, 1995), the
canopy has been studied as a source of biodiversity due to its
vast and complex structure. Our objectives in this paper are to

258 J. For. Res. 6 (4) 2001:
describe a preliminary analysis of the micrometeorological conditions in the forest canopy and to provide basic infor- mation regarding the in-canopy environment for research on canopy biology in the forest of Lambir Hills National Park. Therefore, we present here data describing the great envi- ronmental gradients of tropical rainforests of Southeast Asia where the tree height can exceed 50 m. Micro-meteorologi- cal and environmental factors were measured during January 16-22, 1998, January 7-15, 1999, and January 10-15, 2000. Data regarding the environments within and above the canopy measured during these intensive observations are described.
Site and Measurements This study was made at the Canopy Biology Plot in Lambir
Hills National Park, Sarawak, Malaysia (4°N, 114°E). Lam- bir Hills National Park lies about 30 km south of Miri, the cap- ital of the Fourth Division, Sarawak. The climate is constantly wet and monsoonal due to distinct shifts in prevailing winds. The mean annual rainfall at Miri is about 3,200 mm and is dis- tributed evenly throughout the year. The mean annual tem- perature is about 27°C with a small seasonal variation. The rain forest in this park consists of two types of original vege- tation common to the whole of Borneo, i.e., mixed dipterocarp forest and tropical heath forest (Yamakura et aL, 1995). The former containing various dipterocarp trees, especially, covers 85% of the total park area.
The Canopy Biology Plot includes a canopy observation system at its center that is comprised of two tree towers and nine spans of aerial walkways. Our studies were made using one of these tree towers. The tree tower used for observations
(a)
k I Pr°file observation
'¢• Hygrothermometer ~ '
V [~ Infrared thermometer ~ 1"-3 Thermometer ~ // "~ V
) Inlet of sample air
Wet and dry bulb X
I I I Tensiometer " V
i,: A
is 49.5 m high and is on the top of a small hill. The continu- ous canopy height of the forest surrounding it is approxi- mately 50 m, but the height of emergent trees reaches 60 m.
Figure 1 shows a schematic representation of the tree tower, adjacent trees, and the installation employed for taking the measurements used in this paper, as well as the vertical dis- tribution of leaf area density estimated using a plant canopy analyzer. Profile observations above and within the canopy including CO2 concentration measurements were conducted at heights of 49.5, 36.0, 23.5, 13.5, and 1.0 m.
The air temperature and relative humidity of the air above the canopy were measured using a hygrothermometer. An infrared thermometer measured the canopy surface tempera- ture. Global solar radiations above and within the canopy were measured using three solarimeters. The outputs of these measurements were converted to analog signals (volt- age), and were recorded using logging devices at 10-rain intervals. Wind speeds above and within the canopy were measured using cup-anemometers, and data loggers counted the pulse signals from them. The 10-min average wind speeds were estimated as the values corresponding to cumu- lative pulse signals for 10 min. The anemometer threshold used in this measurement was 0.2 m s - ~. However, even though wind speeds corresponding to cumulative pulse signals for 10 min fell below 0.2 m s l, we assumed these values to be the 10-min average wind speeds. The wind speeds and the global solar radiations were continuously measured at the top of the tower and at the lower two levels. The instru- ments at the lower levels (36.0 and 23.5 m) were moved to other levels (13.5 and 1.0 m) after an observation period of
(b)
y ,-, 30 E v ! / • 1- 20
10
0.1 0.2 0.3 Estimated leaf area density (m21m ~)
Fig. 1 Schematic representation of the tree tower, adjacent trees and the installation of instruments (a). Estimated leaf area density profile (b).
Kumagai et al. 259
several days to obtain their time-averaged vertical profiles using the limited number of instruments. The ratios of wind speed and solar radiation at a lower level to those at the tower top were estimated from a series of observations. A thermometer with a logging device measured the air tem- perature at 1.5 m. Soil moisture values at depths of 0.1,0.3, and 0.6 m were measured as pressure heads using tensiome- ters. Daily readings of the soil moisture were made using a manual indicator.
Diurnal variations in the air temperature and water vapor pressure profiles were measured manually every l-h using a wet and dry bulb thermometer at each height of the tree tower. To obtain diurnal variations of CO2 concentration profiles within the canopy, air was sampled through plastic tubes at six levels at 2-h intervals. As only one CO2 analyzer (LI-COR, LI-6262) was available, the sample air was first col- lected into plastic bags at each inlet position, and was then analyzed using the CO2 analyzer placed on the ground. In the day when the CO2 concentration profiles were measured, soil respiration was measured using the chamber method (Inoue, 1986), whose system consists of a pump, a closed chamber, and plastic tubes.
Plant silhouette area density, a value analogous to leaf area density, was measured vertically using a pair of plant canopy analyzers (LI-COR, LAI-2000). The total leaf area index for the stand measured by LAI-2000 was 5.1 (m 2 m -2) in the 2000 observation. In the present study, the leaf area density was high in the lower stratum, and a similar canopy structure has been reported in other tropical rainforests (e.g.,
Koike and Hotta, 1996).
Results and Discussion 1 Radiation
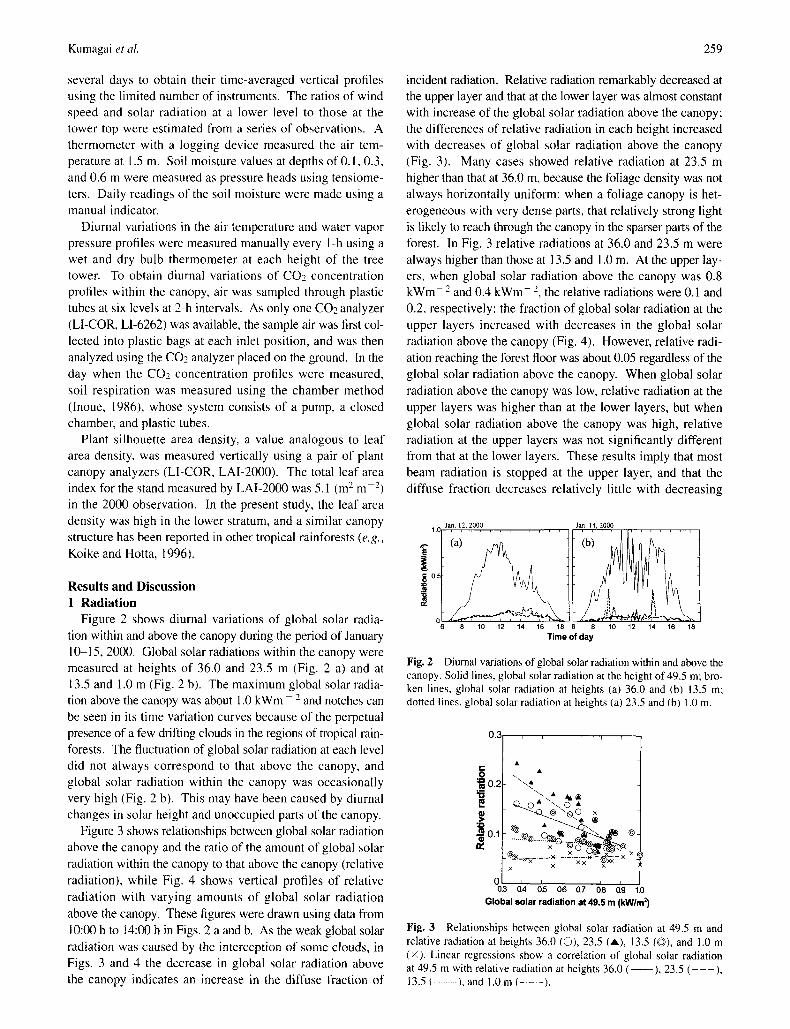
Figure 2 shows diurnal variations of global solar radia- tion within and above the canopy during the period of January 10-15.2000. Global solar radiations within the canopy were measured at heights of 36.0 and 23.5 m (Fig. 2 a) and at 13.5 and 1.0 m (Fig. 2 b). The maximum global solar radia- tion above the canopy was about 1.0 kWm - 2 and notches can be seen in its time variation curves because of the perpetual presence of a few drifting clouds in the regions of tropical rain- forests. The fluctuation of global solar radiation at each level did not always correspond to that above the canopy, and global solar radiation within the canopy was occasionally very high (Fig. 2 b). This may have been caused by diurnal changes in solar height and unoccupied parts of the canopy.
Figure 3 shows relationships between global solar radiation above the canopy and the ratio of the amount of global solar radiation within the canopy to that above the canopy (relative radiation), while Fig. 4 shows vertical profiles of relative radiation with varying amounts of global solar radiation above the canopy. These figures were drawn using data from 10:00 h to 14:00 h in Figs. 2 a and b. As the weak global solar radiation was caused by the interception of some clouds, in Figs. 3 and 4 the decrease in global solar radiation above the canopy indicates an increase in the diffuse fraction of
incident radiation. Relative radiation remarkably decreased at the upper layer and that at the lower layer was almost constant with increase of the global solar radiation above the canopy; the differences of relative radiation in each height increased with decreases of global solar radiation above the canopy (Fig. 3). Many cases showed relative radiation at 23.5 m higher than that at 36.0 m, because the foliage density was not always horizontally uniform: when a foliage canopy is het- erogeneous with very dense parts, that relatively strong light is likely to reach through the canopy in the sparser parts of the forest. In Fig. 3 relative radiations at 36.0 and 23.5 m were always higher than those at 13.5 and 1.0 m. At the upper lay- ers, when global solar radiation above the canopy was 0.8 kWm 2 and 0.4 k W m - 2, the relative radiations were 0.1 and 0.2, respectively: the fraction of global solar radiation at the upper layers increased with decreases in the global solar radiation above the canopy (Fig. 4). However, relative radi- ation reaching the forest floor was about 0.05 regardless of the global solar radiation above the canopy. When global solar radiation above the canopy was low, relative radiation at the upper layers was higher than at the lower layers, but when global solar radiation above the canopy was high, relative radiation at the upper layers was not significantly different from that at the lower layers. These results imply that most beam radiation is stopped at the upper layer, and that the diffuse fraction decreases relatively little with decreasing
Jan. 12, 2000 1.(
8 10 12 14 16 18 6
Jan. 14, 2000
10 12 14 16 18
Time of day
Fig. 2 Diurnal variations of global solar radiation within and above the canopy. Solid lines, global solar radiation at the height of 49.5 m: bro- ken lines, global solar radiation at heights (a) 36.0 and (b) 13.5 m: dotted lines, global solar radiation at heights (a) 23.5 and (b) 1.0 m.
0.2
c- O ~ o . 2
~OA
x " . . ~
Q o • \ \ 0 • ~-@...@ \ ® 0 x
x x x
% 3 014 0.5 (1,6 017 01.8 0.9 1.0 Global solar radiation at 49.5 m (kWlm 2)
Fig. 3 Relationships between global solar radiation at 49.5 m and relative radiation at heights 36.0 (O), 23.5 (A), 13.5 (©), and 1.0 m (×). Linear regressions show a correlation of global solar radiation at 49.5 m with relative radiation at heights 36.0 ( ), 23.5 ( - - - ) , 13.5 ( .......... ), and 1.0 m (- - -).
260 J. For. Res. 6 (4) 2001:
50
40
A
30
#- 2o
1 0
i i , i i i
I I I I i i i I
0.5 1 . 0
Relative radiation
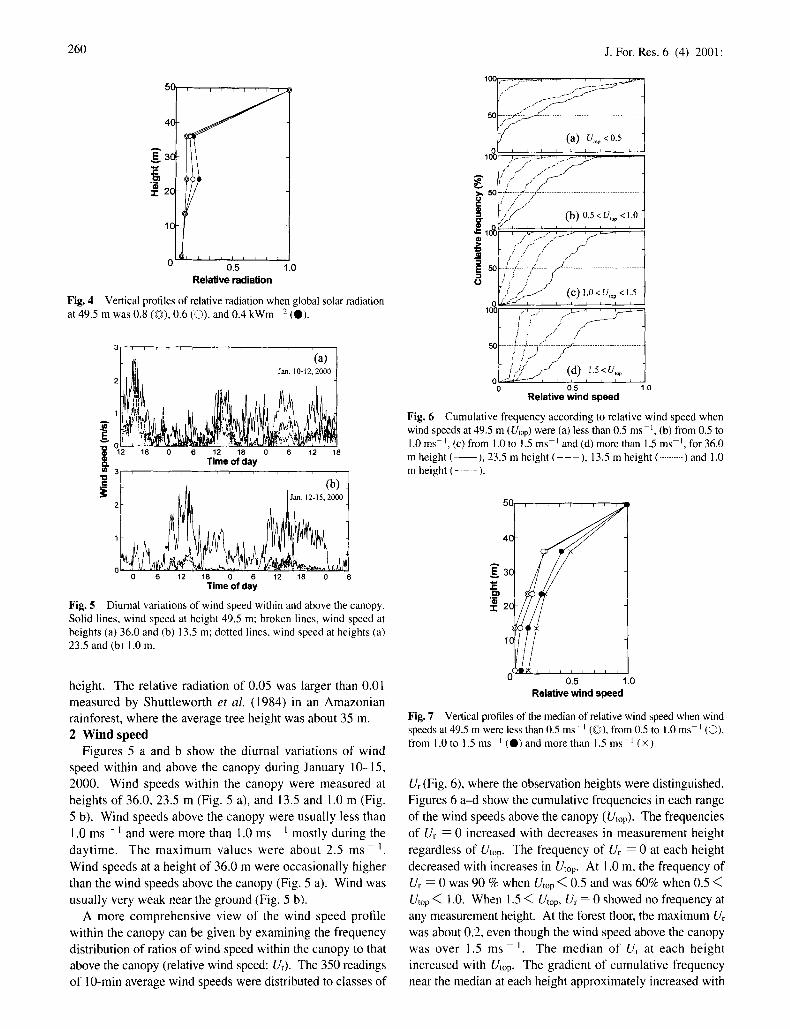
Fig. 4 Vertical profiles of relative radiation when global solar radiation at 49.5 m was 0.8 (©), 0.6 (O), and 0.4 kWm 2 (O).
! I 02 ,O 0 6 T i 1 2 e o ; ~ a y 0 6 12 18
W 3 , , , , , , , , , , , , , , , , , ,
2 0 0 0 2
0 6 12 18 0 6 12 18 0
Time of day
Fig. 5 Diurnal variations of wind speed within and above the canopy. Solid lines, wind speed at height 49.5 m; broken lines, wind speed at heights (a) 36.0 and (b) 13.5 m; dotted lines, wind speed at heights (a) 23.5 and (b) 1.0 m.
height. The relative radiation of 0.05 was larger than 0.01 measured by Shuttleworth et al. (1984) in an Amazonian rainforest, where the average tree height was about 35 m. 2 Wind s p e e d
Figures 5 a and b show the diurnal variations of wind speed within and above the canopy during January 10-15, 2000. Wind speeds within the canopy were measured at heights of 36.0, 23.5 m (Fig. 5 a), and 13.5 and 1.0 m (Fig. 5 b). Wind speeds above the canopy were usually less than 1.0 m s - I and were more than 1.0 ms ~ mostly during the daytime. The max imum values were about 2.5 ms i Wind speeds at a height of 36.0 m were occasionally higher than the wind speeds above the canopy (Fig. 5 a). Wind was usually very weak near the ground (Fig. 5 b).
A more comprehensive view of the wind speed profile within the canopy can be given by examining the frequency distribution of ratios of wind speed within the canopy to that above the canopy (relative wind speed: Ur). The 350 readings of 10-min average wind speeds were distributed to classes of
. . . . . . . . . . . . . . . . . . . . . . . .
~" (a) u,o~ < 0.5 10~01 i i i i i I i i i
! / ' , J
5o ./:-- - ~ ....................
i f = 1001 , /u-..!..- ¢i~ , j~- ----~
L | / / f ; ' ~ ( ; ' , . . .
S '° t :r ; ; ....... / .................................. o I,"/ / ~'
I j / / ~ (~) 1.0 < V,o, < 15 o L , ' j ~ , ~ , , - , , , ,
1o01 , / , .., , , _ _ , , , ! F (~
,: I
50 ,; :' s
,s .~, (d) 15 < O O
0 0 .5 1 .0
Relative wind speed
Fig. 6 Cumulative frequency according to relative wind speed when wind speeds at 49.5 m (Utop) were (a) less than 0.5 m s - 1 (b) from 0.5 to 1.0 ms - l, (c) from 1.0 to 1.5 ms i and (d) more than 1.5 ms I, for 36.0 m height ( ), 23.5 m height ( - - - ) , 13.5 m height ( .......... ) and 1.0 m height ( . . . . . ).
40
0 . 5 1 . 0
Relative wind speed
Fig, 7 Vertical profiles of the median of relative wind speed when wind speeds at 49.5 m were less than 0.5 ms ] (©), from 0.5 to 1.0 ms ~ (©), from 1.0 to 1.5 ms -I ( I ) and more than 1.5 ms i (×).
Ur (Fig. 6), where the observation heights were distinguished. Figures 6 a-d show the cumulative frequencies in each range of the wind speeds above the canopy (Utop). The frequencies of Ur = 0 increased with decreases in measurement height regardless of Utop. The frequency of Ur = 0 at each height decreased with increases in Utop. At 1.0 m, the frequency of U~ = 0 was 90 % when Utop < 0.5 and was 60% when 0.5 < Utop < 1.0. When 1.5 < Utop, Ur = 0 showed no frequency at any measurement height. At the forest floor, the maximum U~ was about 0.2, even though the wind speed above the canopy was over 1.5 m s - i The median of Ur at each height increased with Utop. The gradient of cumulative frequency near the median at each height approximately increased with
Kumagai et al. 261
Utop, implying that Ur tended to concentrate on the median when Utop increased. Figure 7 shows vertical profiles of the median of relative wind speeds when Utop < 0.5, 0.5 < Utop < 1.0, 1.0 < Utop < 1.5, and 1.5 < Utop. Relative wind speeds tended to increase at all heights with Utop and little wind was measured at the lower canopy when Utop was small. As all wind speed values less than the anemometer threshold for measurement interval of 10 min were dealt with as 0, Ur was apt to be underestimated when Utop was small. The dependence of U~ on Utop (Fig. 7) may be due in part to this. 3 A i r t e m p e r a t u r e a n d h u m i d i t y
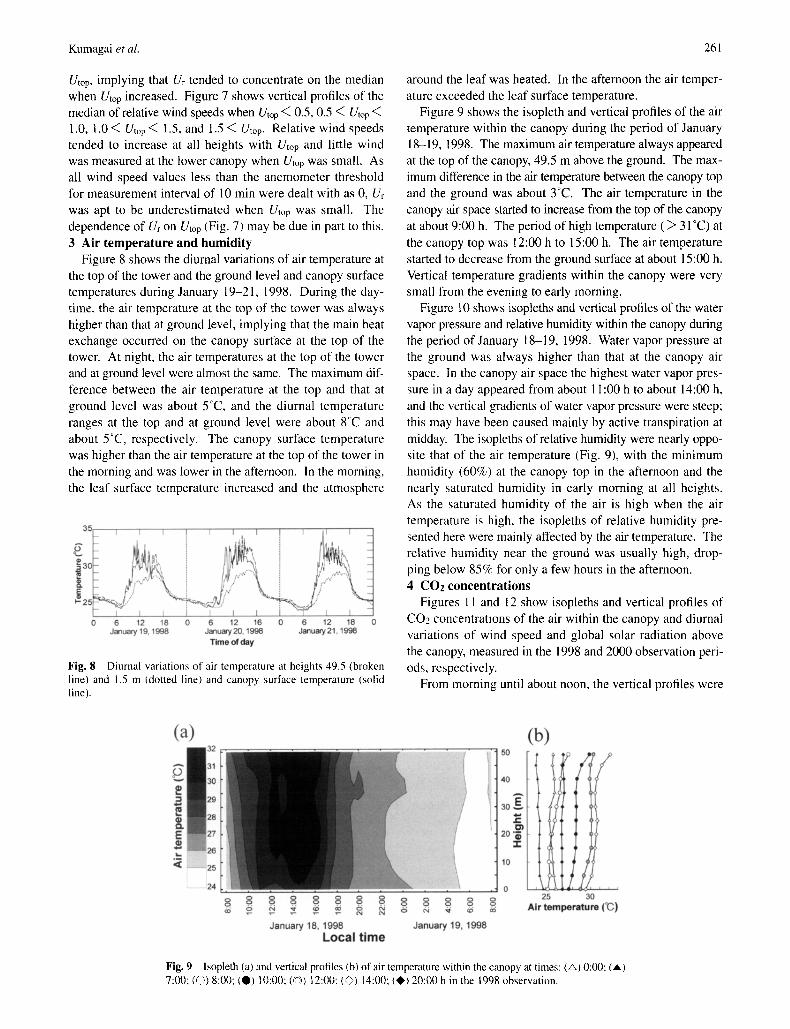
Figure 8 shows the diurnal variations of air temperature at the top of the tower and the ground level and canopy surface temperatures during January 19-21, 1998. During the day- time, the air temperature at the top of the tower was always higher than that at ground level, implying that the main heat exchange occurred on the canopy surface at the top of the tower. At night, the air temperatures at the top of the tower and at ground level were almost the same. The maximum dif- ference between the air temperature at the top and that at ground level was about 5°C, and the diurnal temperature ranges at the top and at ground level were about 8oc and about 5°C, respectively. The canopy surface temperature was higher than the air temperature at the top of the tower in the morning and was lower in the afternoon. In the morning, the leaf surface temperature increased and the atmosphere
3.'
oC i i I I I , i I jl I ~
6 12 18 0 6 12 16 6 12 18 0 January 19, 1998 January 20, 1 9 9 8 Janua~/21, 1998
Time of day
Fig. 8 Diurnal variations of air temperature at heights 49.5 (broken line) and 1.5 m (dotted line) and canopy surface temperature (solid line).
around the leaf was heated. In the afternoon the air temper- ature exceeded the leaf surface temperature.
Figure 9 shows the isopleth and vertical profiles of the air temperature within the canopy during the period of January 18-19, 1998. The maximum air temperature always appeared at the top of the canopy, 49.5 m above the ground. The max- imum difference in the air temperature between the canopy top and the ground was about 3°C. The air temperature in the canopy air space started to increase from the top of the canopy at about 9:00 h. The period of high temperature ( > 31 °C) at the canopy top was 12:00 h to 15:00 h. The air temperature started to decrease from the ground surface at about 15:00 h. Vertical temperature gradients within the canopy were very small from the evening to early morning.
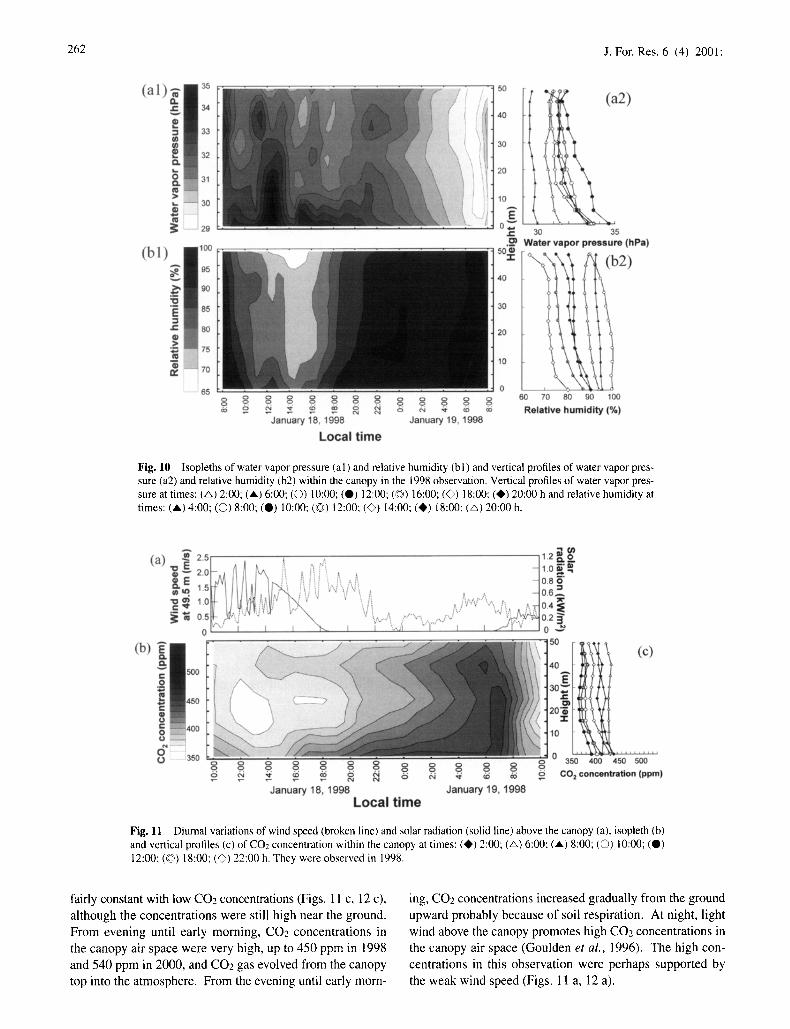
Figure 10 shows isopteths and vertical profiles of the water vapor pressure and relative humidity within the canopy during the period of January 18-19, 1998. Water vapor pressure at the ground was always higher than that at the canopy air space. In the canopy air space the highest water vapor pres- sure in a day appeared from about 1 I:00 h to about 14:00 h, and the vertical gradients of water vapor pressure were steep; this may have been caused mainly by active transpiration at midday. The isopleths of relative humidity were nearly oppo- site that of the air temperature (Fig. 9), with the minimum humidity (60%) at the canopy top in the afternoon and the nearly saturated humidity in early morning at all heights. As the saturated humidity of the air is high when the air temperature is high, the isopleths of relative humidity pre- sented here were mainly affected by the air temperature. The relative humidity near the ground was usually high, drop- ping below 85% for only a few hours in the afternoon. 4 CO2 concentrations
Figures 11 and 12 show isopleths and vertical profiles of CO2 concentrations of the air within the canopy and diurnal variations of wind speed and global solar radiation above the canopy, measured in the 1998 and 2000 observation peri- ods, respectively.
From morning until about noon, the vertical profiles were
(a)
B 32
' °
~ 29
~ 28
<: ',---- 25 24
. . . . 1111
g 8 ~ 8 g g g g 8 g g g g
January 18, 1998 January 19, 1998 Loca l t i m e
,5O
+ 4O
30
2 0
10
0
(b)
IglI
I r , i i r
25 30 Air temperature (°C)
Fig. 9 Isopleth (a) and vertical profiles (b) of air temperature within the canopy at times: (A} 0:00; (A) 7:00; (O) 8:00: (0) 10:00: (G) 12:00, (~) 14:00" (0) 20:00 h in the 1998 observation.
262 J. For. Res. 6 (4) 2001:
(al )~ a3 ~as
31
(b~)
65
i ~ / // 50 2)
40
30
20'
10
.1= 30 35
.O} Water v= mr pressure (hPa) sot:
40
30
20
10
0 60 70 80 ~ g ~ ~ ~ ~ 8 ~ o ° o ° o ° 8
~ ~ ~ ~ ~ ~ ~ " ,.ki ,~/ ~ ~ Relative humidi ty (%) January 18, 1998 January 19, 1998
L o c a l t i m e
2)
90 100
Fig. 10 Isopleths of water vapor pressure (al) and relative humidity (bl) and vertical profiles of water vapor pres- sure (a2) and relative humidity (b2) within the canopy in the 1998 observation. Vertical profiles of water vapor pres- sure at times: (&) 2:00; (A) 6:00; (©) 10:00; (0) 12:00; (©) 16:00; (£>) 18:00: (i1~) 20:00 h and relative humidity at times: (',) 4:00; (0) 8:00; (0) 10:00; (~©) 12:00: (@) 14:00; (I)) 18:00; (~) 20:00 h.
2 . , . , . , , . 2 ~ t (.) , , ~ . . . .
• l ~ / l / ) / ~ , / ~ - , , -I08 =_
I January 18, 1998 January 19, 1998
L o c a l t i m e
( c )
350 400 450 500
CO 2 concentration (pprn)
Fig. 11 Diurnal variations of wind speed (broken line) and solar radiation (solid line) above the canopy (a), isopleth (b) and vertical profiles (c) of CO2 concentration within the canopy at times: (41,) 2:00; (A) 6:00: (A) 8:00; (©) 10:00; (@) 12:00; (©3) 18:00; (~) 22:00 h. They were observed in 1998.
fairly constant with low CO2 concentrations (Figs. 11 c, 12 c), although the concentrations were still high near the ground. From evening until early morning, CO2 concentrations in the canopy air space were very high, up to 450 ppm in 1998 and 540 ppm in 2000, and CO2 gas evolved from the canopy top into the atmosphere. From the evening until early morn-
ing, CO2 concentrations increased gradually from the ground upward probably because of soil respiration. At night, light wind above the canopy promotes high CO2 concentrations in the canopy air space (Goulden et al., 1996). The high con- centrations in this observation were perhaps supported by the weak wind speed (Figs. 11 a, 12 a).

Kumagai et al. 263
A (a) 1= ~ 2.5
~,~ 2.0 &E ~m 1.5 • 0 m 1.0 ~ ; o,~
500
4 5 0
;350
|1.2 ~Q 0 ¢~
/~V'~!. ~Jl o.8 6"
....... :.', ...... /,,:....: v- ~o.2 3 - " , , • '.., ,f', /',,i"i / "~ '." :""..F I
s s ~ ~ ' s 'o "o "
January 14, 2000 January 15, 2000 Local time
50 ~ (¢)
1~ 3[0'~00~4~50 500 c o z concentration (ppm)
Fig. 12 Diurnal variations of wind speed (broken line) and solar radiation (solid line) above the canopy (a), isopleth (b) and vertical profiles (c) of CO2 concentration within the canopy at times: (0) 2:00; (/x) 6:00; (A) 8:00; (C)) 10:00: (O) 12:00: (Q>) 18:00; (O) 22:00 h. They were observed in 2000.
CO2 concentrations in the canopy air space were high at night and in early morning and decreased before noon due to photosynthesis. The minimum CO2 concentrations in the 1998 and the 2000 observations were about 360 ppm, mea- sured from 12:00 h to 14:00 h, and about 350 ppm, measured from 15:00 h to 16:00 h, respectively. Kruijt et al. (1996) reported that in their observation of a tropical forest of 40 m height the minimum and the maximum CO2 concentrations were about 350 ppm from 15:00 h to 18:00 h and about 500 ppm at 6:00 h, respectively. The minimum CO2 concentra- tions and the times in which they showed their maximum and minimum levels were similar to those of our 2000 obser- vation.
The differences between Fig. 11 b and 12 b are that both the depletion of CO2 concentrations in the midday and their increase in the evening were more remarkable in the 2000 observation than in the 1998 observation. CO2 concentrations above the 15 m height during the midday were about 10 ppm lower in the 2000 observation than in the 1998. Moreover, CO2 concentrations at 6:00 h at 5 m and at 25 m height were about 100 ppm and about 50 ppm higher, respectively, in the 2000 observation than in the 1998 observation (Figs. 11 c, 12 c). In the 1998 observation, a source of CO2 gas existed in the canopy air space (40 m height above the ground) and from this position CO2 gas flowed upward and downward (Fig. 11 b). This source appeared at about 13:00 h, but did not appear during the day in the 2000 observation. The depletion of CO2 concentration during midday and its increase at night in the canopy air space were perhaps caused by active pho- tosynthesis during midday and soil respiration, respectively. Although few remarkable differences in global solar radiation and wind speed above the canopy existed between the 1998 and 2000 observations, a great difference was seen in soil moisture (Fig. 13). As soil moisture in the 1998 observation
i
J
o 20
( a l ) ~ ' '
- 8 0 O - B O O
(a2)
Soil respiration ( × 10 ~ kgCO-#m2s) 4.0 6.0 0 2 0 4.0 6.0
. . . . ~ ~ (b l) P r e s s u r e head (cmH=O)
,-200 0 ~ 0 0 - ~ 0 -200 0 1(]0 i i i i i i i i i [ i
_o.1(b2) -0.2
-0 .3~
Z -0.4
-0.5
January 2000 0.6
Fig. 13 Soil respiration observed in 1998 (al) and 2000 (bl) and vertical profiles of pressure head of soil moisture observed in 1998 (a2) and 2000 (b2).
was much lower than that in 2000, soil respiration in 1998 was markedly reduced (Fig. 13). Moreover, we presume that the reduced photosynthesis observed during the 1998 observation might have been caused by heavy dry soils. These depletions of photosynthesis and soil respiration in 1998 might have caused the increase of the minimum CO2 concentration in the canopy air space and the depletion of the maximum level in the 1998 observation compared with that of the 2000 obser- vation.
Conclusions The microenvironment within a forest canopy seems to
affect plant and animal life. Therefore, an understanding of meteorological factors in the canopy leads to a deeper under-

264 J. For. Res. 6 (4) 2001
standing of the life within the lorest canopy. These findings
may be important especially in regard to areas of very tall veg-
e ta t ion because of their great e n v i r o n m e n t a l gradients .
Notwithstanding the l imited number of replications, the lim-
ited observation period, and deficiencies in the measurements
instruments, the study reported here can provide basic infor-
mation to describe the env i ronment within the canopy of a
tropical ra inforest con ta in ing trees over 50 m high. For
example, in-canopy microcl imate data can provide a tool for
the est imation of the transpiration rates for complex forest
types, such as a tropical rain forest (e.g., Roberts et al., 1993;
Cabral et al., 1996). In order to describe the global solar radi-
ation and wind speeds within the canopy, we presented their
values relative to the values above the canopy. These relative
values (relative radiation and relative wind speed) may be par- ticularly valuable for extending limited measurements, such as
the measurements carried out at only one reference point,
because we can estimate in-canopy weather data based on
above-canopy weather data.
We express sincere thanks to Dr. H.S. Lee, Forest Department Sarawak, and Prof. K. Ogino, University of Shiga Prefecture, for their kind arrangement of the observation research in Lambir Hills National Park, Sarawak. This study was partly supported by a Japan Ministry of Education, Science and Culture Grant in Aid for Scientific Research (#07041106 and #10041219, Leader: Prof. K. Musiake, University of Tokyo) and a Core Research for Evolutional Science and Technology, Japan Science and Technology Corporation (Leader: Prof. T. Naka- shizuka, Kyoto University).
Literature cited Aoki, M., Yabuki, K., and Koyama, H. (1975) Micrometeorology and
assessment of primary production of a tropical rain forest in West Malaysia. J. Agric. Meteorol. 31 : l 15-124.
Cabral, O.MR., McWilliam, A.-L.C., and Roberts, J.M. (1996) In- canopy microclimate of Amazonian forest and estimates of transpi- ration. In Amazonian deforestation and climate. Gash, J.H.C., Nobre, C.A., Roberts, J.M., and Victoria, R.L. (eds.), 61 lpp, John Wiley & Sons, New York, 207-219.
Carswell, F.E., Meir, P., Wandelli, E.V., Bonates, L.C.M., Kruijt, B., Barbosa, E.M., Nobre, A.D., Grace, J., and Jarvis, P.G. (2000) Pho- tosynthetic capacity in a central Amazonian rain forest. Tree Physiol. 20: 179-186.
Dolman, A.J., Gash, J.H.C., Roberts, J., and Shuttleworth, W.J. (1991) Stomatal and surface conductance of tropical rainforest. Agric. For. Meteorol. 54:303-318.
Eschenbach, C., Glauner, R., Kleine, M., and Kappen, L. (1998) Pho- tosynthesis rates of selected tree species in lowland dipterocarp rain- forest of Sabah, Malaysia. Trees 12: 356-365.
Goulden, M.L., Munger, J.W., Fan, S.M., Daube, B.C., and Wofsy, S.C. (1996) Measurements of carbon sequestration by long-term eddy covariance: Methods and a critical evaluation of accuracy. Global Change Biol. 2: 169-182.
Inoue, K. (1986) Chamber method for measuring CO2 flux from soil sur- face. J. Agric. Meteorol. 42: 225-230. (in Japanese with English summary)
Inoue, T. and Hamid, A.A. (1995) Introduction to the canopy biology program in Sarawak. In Reports of new program for promotion of basic sciences: Studies of global environmental changes with special reference to Asia and Pacific regions. Vol.II-3. Long term ecological research of tropical rain forest in Sarawak. Lee, H.S., Ashton, P.S., and
Ogino, K. (eds.), 228pp, Ehime University, Matsuyama, 120-131. Koike, F. and Hotta, M. (19%) Foliage-canopy structure and height dis-
tribution of woody species in climax forests. J. Plant Res. 109: 53-60.
Koike, F. and Syahbuddin (1993) Canopy structure of a tropical rain for- est and the nature of an unstratified upper layer. Funct. Ecol. 7: 230-235.
Kruijt, B., Lloyd, J., Grace, J., Mclntyre, J.A., Farquhar, G.D., Miranda, A.C., and McCracken, P. (1996) Sources and sinks of CO2 in Ron- donia tropical rainforest. In Amazonian deforestation and climate. Gash, J.H.C., Nobre, C.A., Roberts, J.M., and Victoria, R.L. (eds.), 61 lpp, John Wiley & Sons, New York, 319-329.
Lai, C.-T., Kutal, G., Ellsworth, D., and Oren, R. (2000) Modelling veg- etation-atmosphere CO2 exchange by a coupled eulerian-lagrangian approach. Boundary-Layer Meteorol. 95:91-122.
Leuning, R., Kelliher, F.M., de Pury, D.G.G., and Schulze, E.-D. (1995) Leaf nitrogen, photosynthesis, conductance and transpiration: Scaling from leaves to canopies. Plant Ceil Environ. 18: I 183-1200.
Meinzer, F.C., Andrade, J.L., Goldstein, G., Holbrook, N.M., Cavelier. J., and Jackson, P. (1997) Control of transpiration from the upper canopy of a tropical forest: The role of stomatal, boundary layer and hydraulic architecture components. Plant Cell Environ. 20: 1242-1252.
Ninomiya, I. (1995) Photosynthesis of canopy tree species in a Sarawak rain forest. Tropics 4: 297-305. (in Japanese with English summary)
Pearcy, R.W. (1987) Photosynthetic gas exchange responses of Aus- tralian tropical forest trees in canopy, gap and understory micro- environments. Funct. Ecol. 1: 169-178.
Roberts, J.M., Cabral, O.M.R., Fish, G., Molion, UC.B., Moore, C.J., and Shuttleworth, W.J. (1993) Transpiration from an Amazonian rainforest calculated from stomatal conductances measurements. Agric. For. Meteorol. 65: 175-196.
Shuttleworth, W.J., Gash, J.H.C., Lloyd, C.R., Moore, C.J., Roberts, J.M., Marques Filho, A. de O., Fisch, G., Silva Filho, V. de P.. Ribeiro, M. de N.G., Molion, L.C.B., de Abreu Sa, L.D., Nobre, C.A., Cabral, O.MR., Patel, S.R., and de Moraes, J.C. (1984) Obser- vations of radiation exchange above and below Amazonian forest. Q.J. R. Meteorol. Soc. 110:1163-1169.
Shunleworth, W.J., Gash, J.H.C., Lloyd, C.R., Moore, C.J., Roberts, J.M., Marques Filho, A. de O., Fisch, G.. Silva Filho, V. de P., Ribeiro, M. de N.G., Molion, L.C.B., de Abreu Sa, L.D., Nobre. C.A., Cabral, O.M.R., Patel, S.R., and de Moraes, J.C. (1985) Daily variations of temperature and humidity within and above Amazonian forest. Weather 40: 102-108.
Tamura, N. (1995) Space use by sympatric tree squirrels in Malaysian tropical tbrests. Tropics 4: 337-343. (in Japanese with English sum- mary)
Thompson, O.E. and Pinker, R.T. (1975) Wind and temperature profile characteristics in a tropical evergreen forest in Thailand. Tellus 27: 562-573.
Whitmore, T.C. (1990) An introduction to tropical rain forests. 224pp, Oxford University Press, Oxford.
Whitten, J.E.J. ( 1981 ) Ecological separation of three diurnal squirrels in tropical rainforest on Siberut Island, Indonesia. J. Zool. 193: 405-420.
Williams, M., Rastetter, E.B., Fernandes, D.N.,Goulden, M.L., Wofsy, S.C., Shaver, G.R., Melillo, J.M., Munger, J.W., Fan, S.-M., and Nadelhoffer, K.J. (1997) Modelling the soil-plant-atmosphere con- tinuum in a Querr'us-Acer stand at Harvard Forest: The regulation of stomatal conductance by light, nitrogen and soil/plant hydraulic properties. Plant Cell Environ. 19:911-927.
Yamakura, T., Kanzaki, M., ltoh, A., Ohkubo, T., Ogino, K., Chai, E.O. K., Lee, H.S., and Ashton, P.S. (1995) Forest architecture of Lambir rain forest revealed by a large-scale research plot. hz Reports of new program for promotion of basic sciences: Studies of global envi- ronmental changes with special reference to Asia and Pacific regions. Vol.II-3. Long term ecological research of tropical rain forest in Sarawak. Lee, H.S., Ashton, P.S., and Ogino, K. (eds.), 228 pp, Ehime University, Matsuyama, 2-20.
(Accepted July 6, 2001)