vertically aligned and interconnected graphene networks ... · supporting information vertically...
TRANSCRIPT
Supporting Information
Vertically Aligned and Interconnected
Graphene Networks for High Thermal
Conductivity of Epoxy Composites with
Ultralow Loading
Gang Lian,*,†, ‡ Chia-Chi Tuan,‡ Liyi Li,‡ Shilong Jiao,† Qilong Wang,□ Deliang Cui,*,† and
Ching-Ping Wong,*, ‡
Outline: Scheme S1. Optimizing process of parameters to prepare vertically aligned graphene
interconnected networks.
Scheme S2. Schematic illustration of preparing double-layer sample.
Scheme S3. Schematic illustration of the single-layer and double-layer modes for
thermal diffusivity measurement.
Figure S1. Disordered GO network obtained by liquid-nitrogen freezing method
under a GO concentration of 20 mg mL-1
.
Figure S2. Optical image of GO foam obtained under a concentration of 30 mg mL-1
. Figure S3. SEM images of graphene foam microstructures after flame reduction.
Figure S4. SEM and optical images of thin VAIGN-epoxy composite.
Figure S5. Thermal conductivity of random porous graphene network composites.
Table S1. K and CTE value comparisons at different loading fraction.
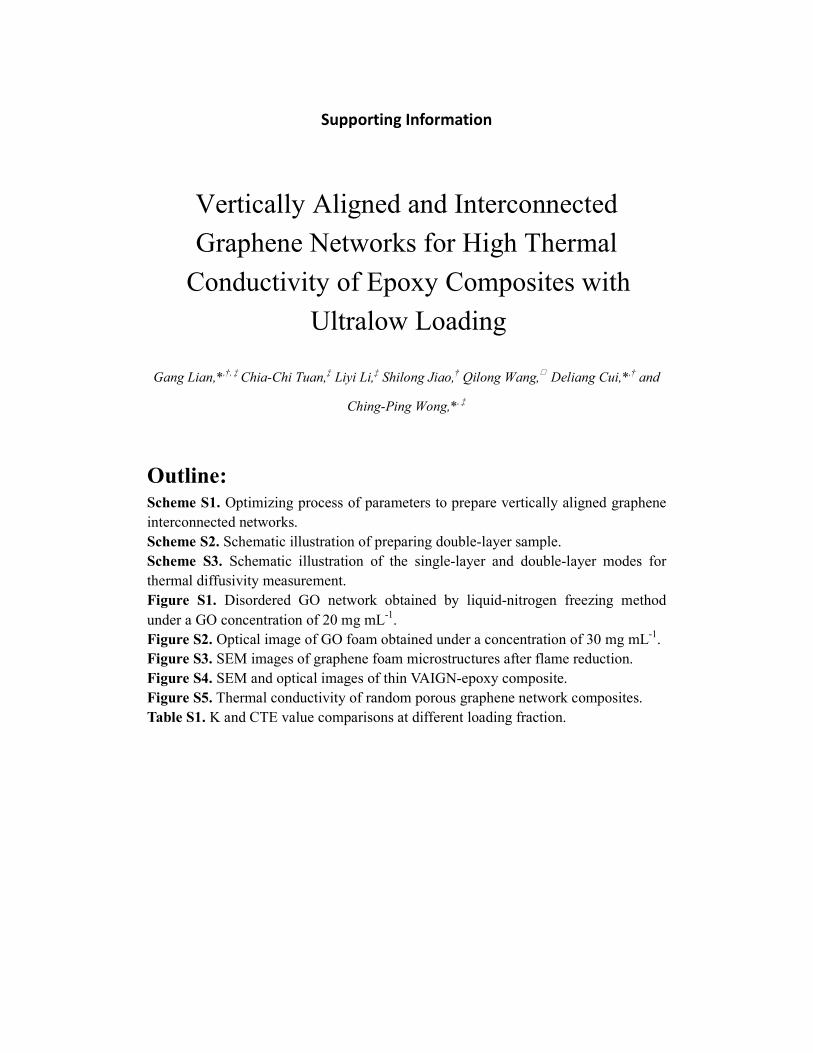
Scheme S1. Optimizing process of parameters to prepare vertically aligned graphene
interconnected networks.
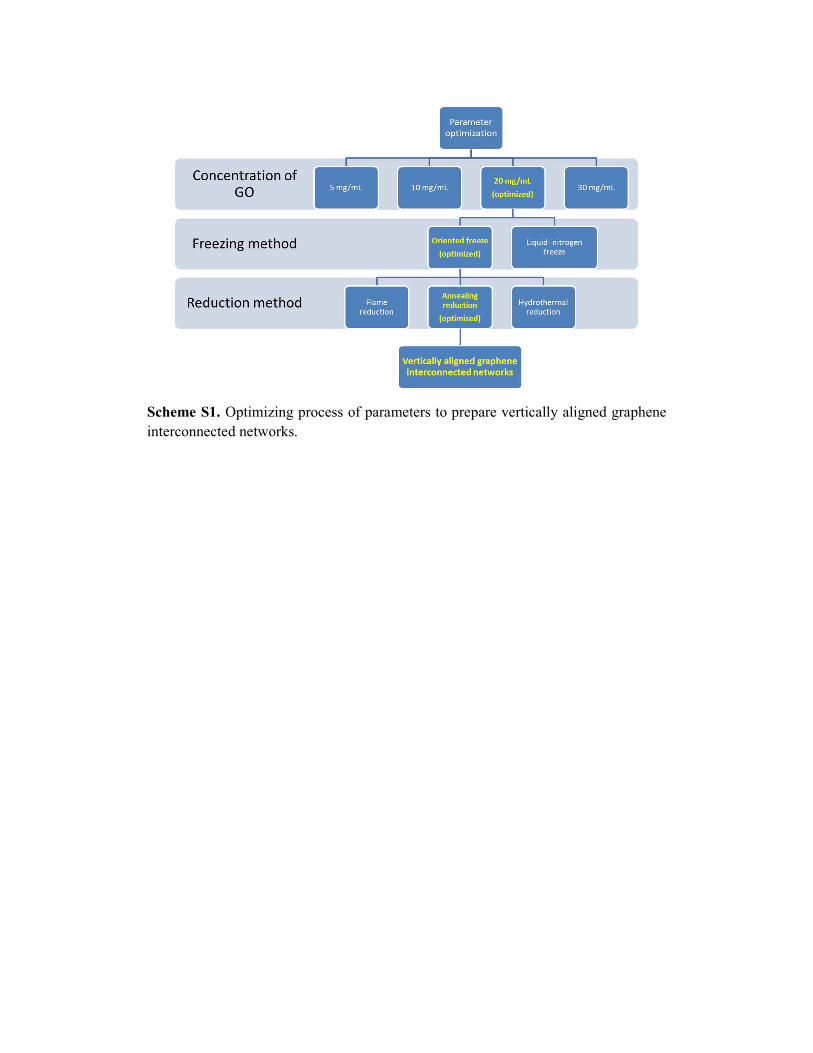
Scheme S2. Schematic illustration of preparing double-layer sample.
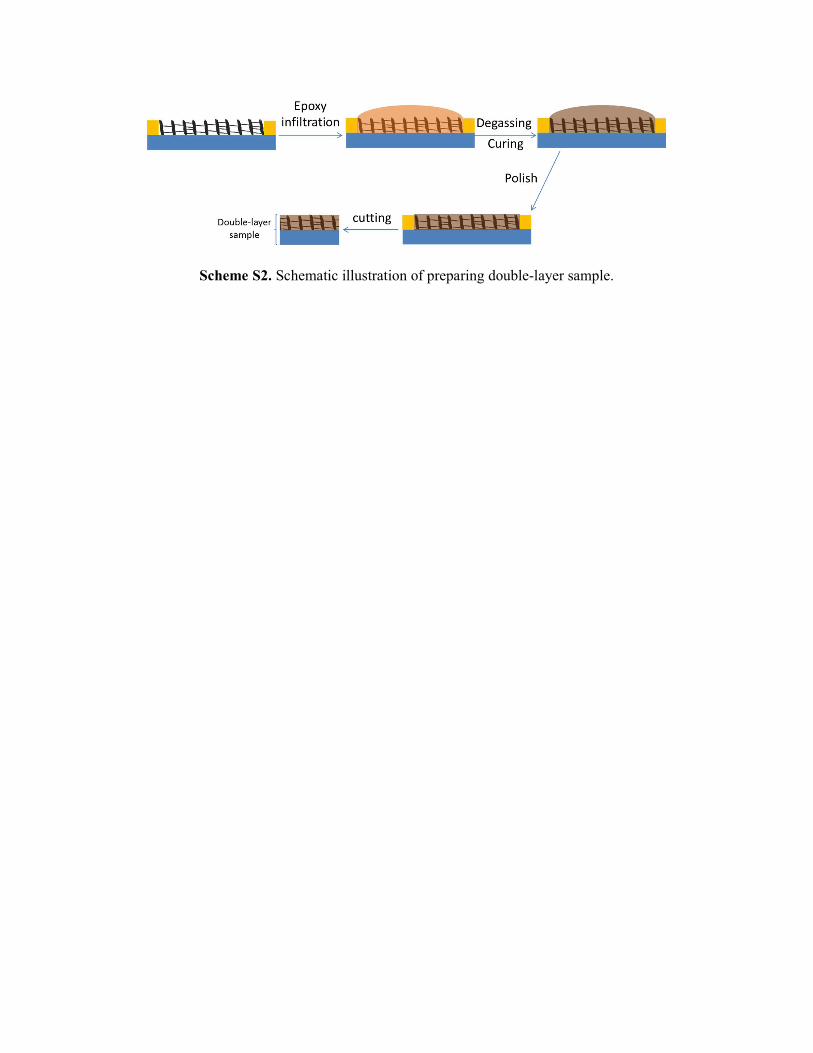
Scheme S3. Schematic illustration of the (a) single-layer and (b) double-layer modes
for thermal diffusivity measurement. Generally, the single-layer mode is used to test
the thermal diffusivity of the composites. However, when the composites are very thin,
some substrates are essential to support the composites in preparing the composites
process. Then we need to use double-layer mode to test the thermal diffusivity of
these composites. Herein, the first layer is the glass slide and the second layer is the
thin composite.
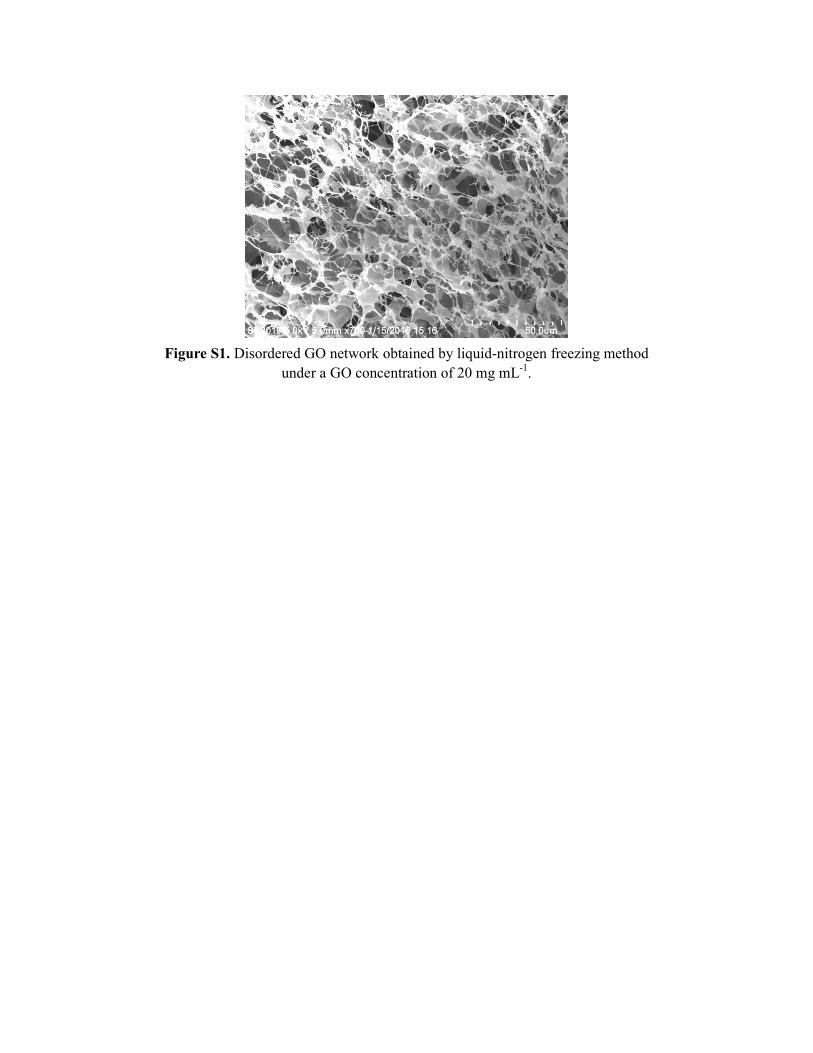
Figure S1. Disordered GO network obtained by liquid-nitrogen freezing method
under a GO concentration of 20 mg mL-1
.
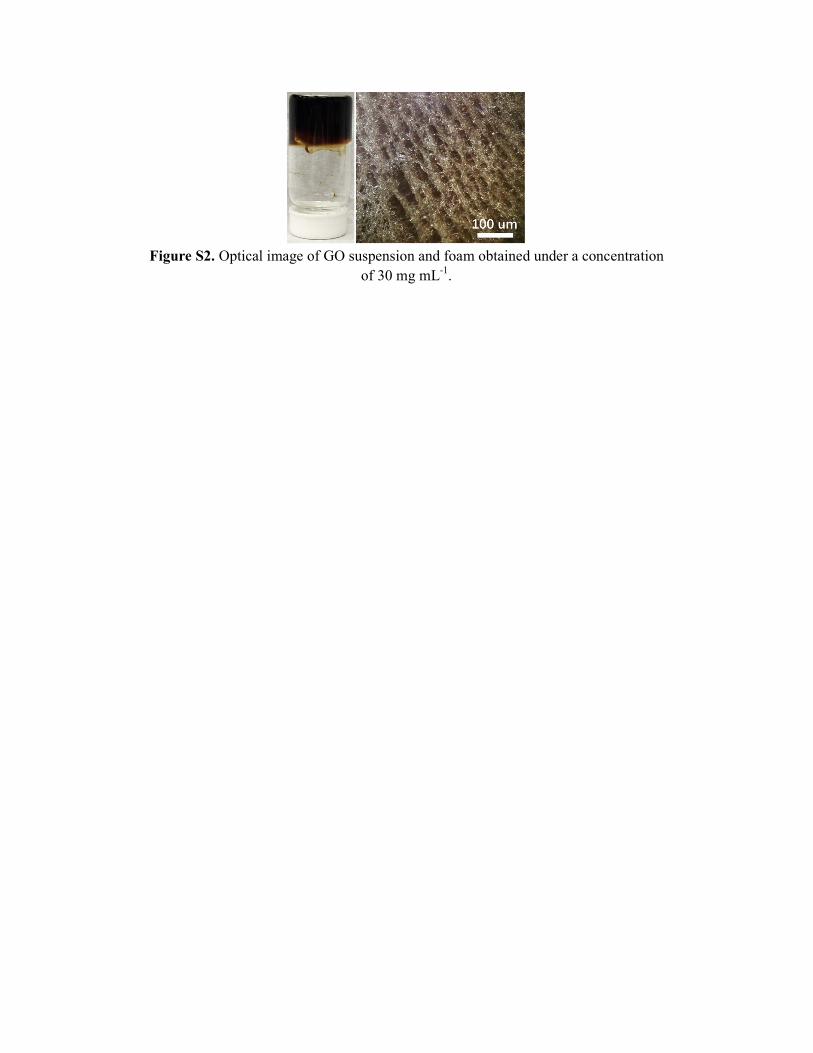
Figure S2. Optical image of GO suspension and foam obtained under a concentration
of 30 mg mL-1
.
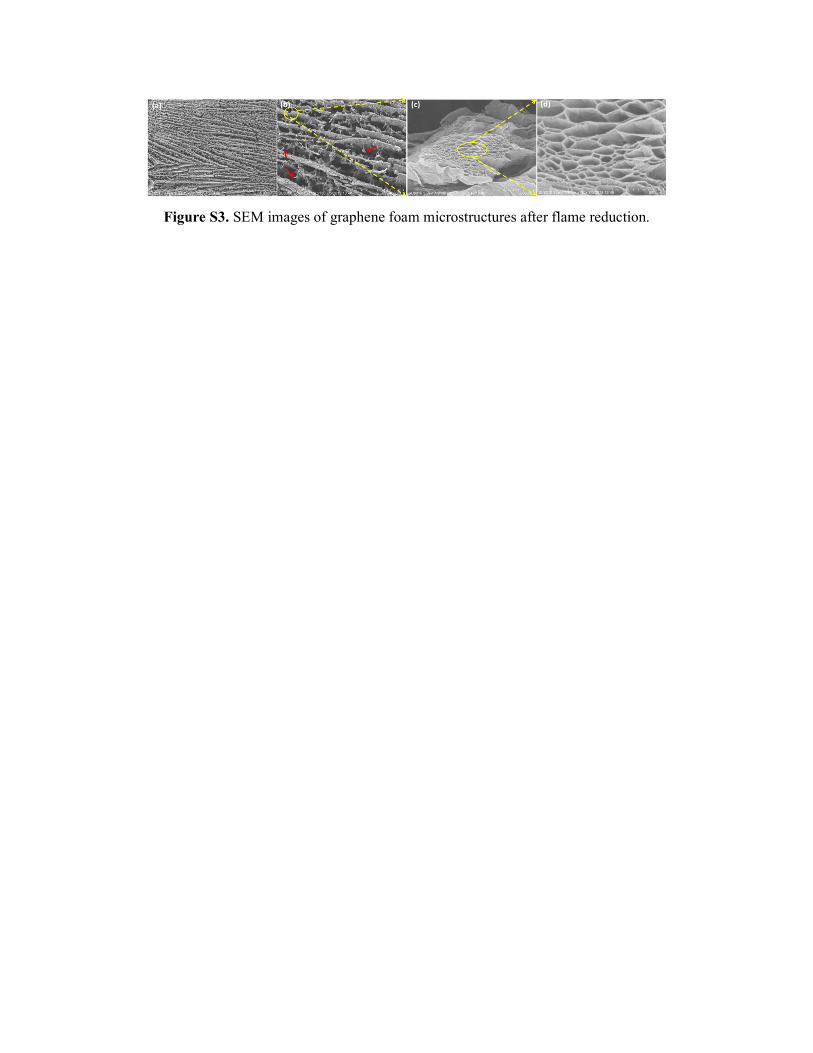
Figure S3. SEM images of graphene foam microstructures after flame reduction.
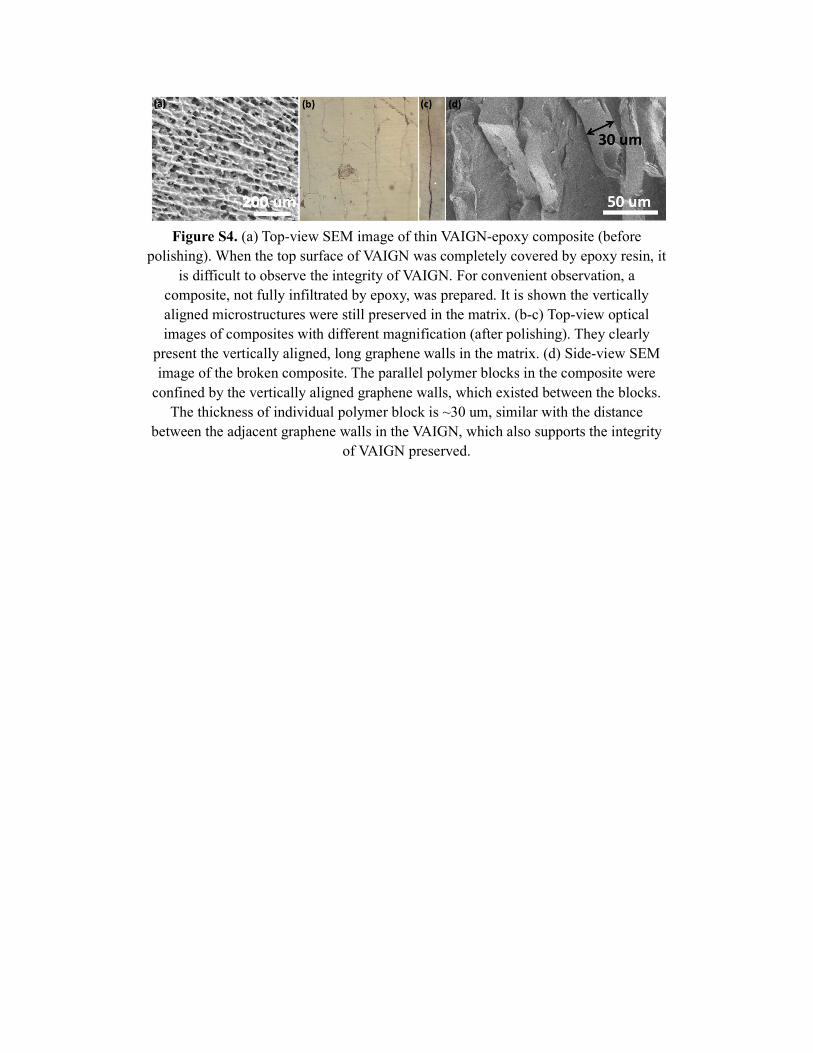
Figure S4. (a) Top-view SEM image of thin VAIGN-epoxy composite (before
polishing). When the top surface of VAIGN was completely covered by epoxy resin, it
is difficult to observe the integrity of VAIGN. For convenient observation, a
composite, not fully infiltrated by epoxy, was prepared. It is shown the vertically
aligned microstructures were still preserved in the matrix. (b-c) Top-view optical
images of composites with different magnification (after polishing). They clearly
present the vertically aligned, long graphene walls in the matrix. (d) Side-view SEM
image of the broken composite. The parallel polymer blocks in the composite were
confined by the vertically aligned graphene walls, which existed between the blocks.
The thickness of individual polymer block is ~30 um, similar with the distance
between the adjacent graphene walls in the VAIGN, which also supports the integrity
of VAIGN preserved.
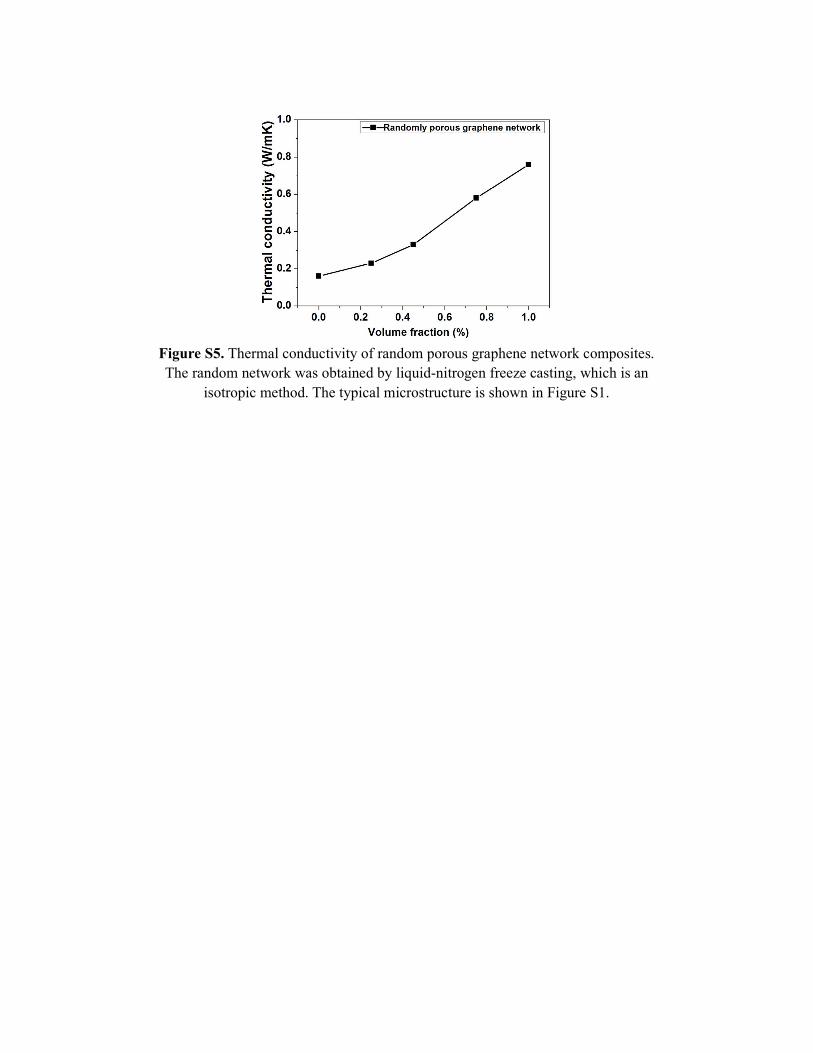
Figure S5. Thermal conductivity of random porous graphene network composites.
The random network was obtained by liquid-nitrogen freeze casting, which is an
isotropic method. The typical microstructure is shown in Figure S1.
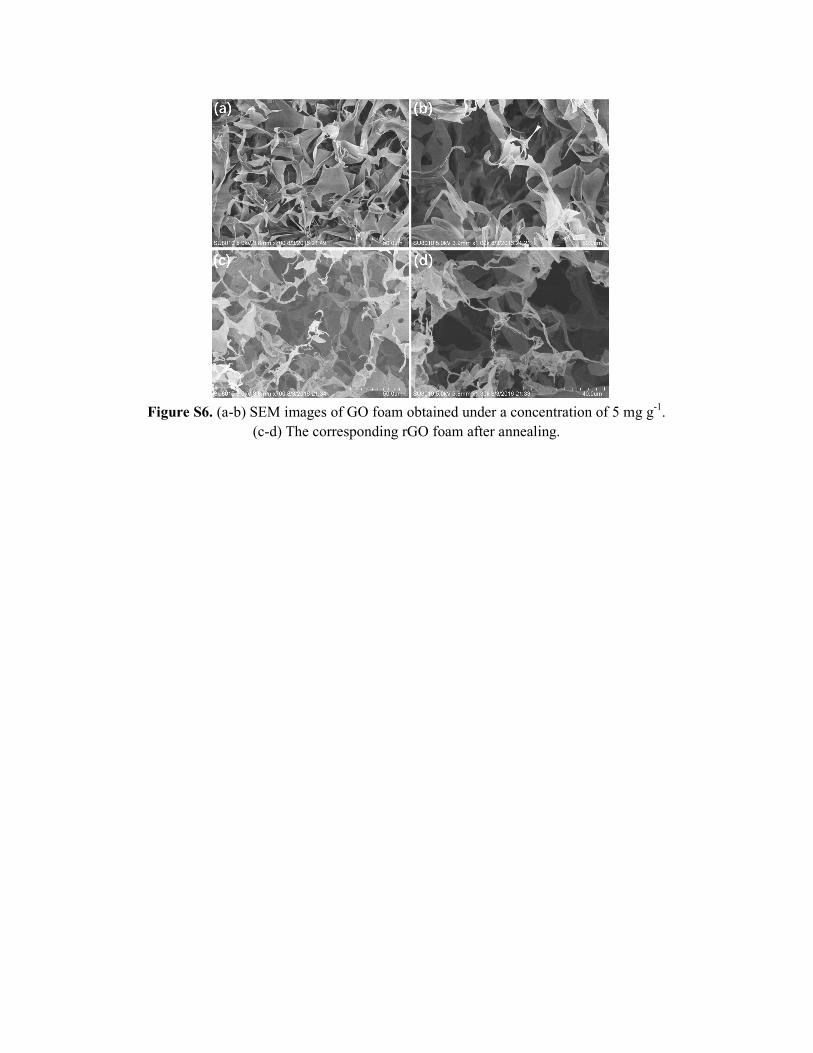
Figure S6. (a-b) SEM images of GO foam obtained under a concentration of 5 mg g-1
.
(c-d) The corresponding rGO foam after annealing.
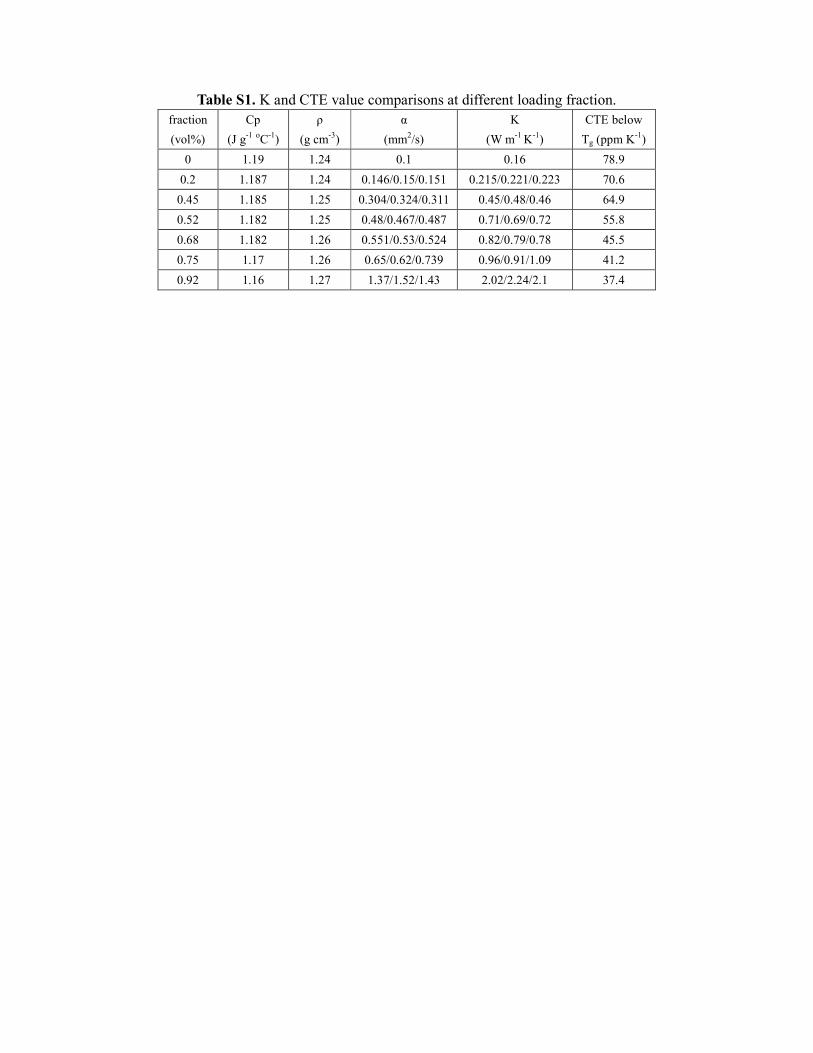
Table S1. K and CTE value comparisons at different loading fraction.
fraction
(vol%)
Cp
(J g-1
oC
-1)
ρ
(g cm-3
)
α
(mm2/s)
K
(W m-1
K-1
)
CTE below
Tg (ppm K-1
)
0 1.19 1.24 0.1 0.16 78.9
0.2 1.187 1.24 0.146/0.15/0.151 0.215/0.221/0.223 70.6
0.45 1.185 1.25 0.304/0.324/0.311 0.45/0.48/0.46 64.9
0.52 1.182 1.25 0.48/0.467/0.487 0.71/0.69/0.72 55.8
0.68 1.182 1.26 0.551/0.53/0.524 0.82/0.79/0.78 45.5
0.75 1.17 1.26 0.65/0.62/0.739 0.96/0.91/1.09 41.2
0.92 1.16 1.27 1.37/1.52/1.43 2.02/2.24/2.1 37.4