vestibular rehabilitation for dizziness and balance …...vestibular rehabilitation for dizziness...
TRANSCRIPT

Vestibular Rehabilitation for Dizziness and Balance
Disorders after Concussion
by
Bara Abdel Majid Alsalaheen
Bachelor of Science in Physiotherapy, University of Jordan, 2006
Masters of Science, University of Pittsburgh, 2008
Submitted to the Graduate Faculty of School of Health and Rehabilitation Sciences
in partial fulfillment
of the requirements for the degree of
Doctor of Philosophy in Rehabilitation Sciences
University of Pittsburgh
2012

ii
UNIVERSITY OF PITTSBURGH
School of Health and Rehabilitation Sciences
This dissertation was presented
by
Bara A. Alsalaheen It was defended on
Oct, 30th, 2012 and approved by
Anthony P. Kontos, PhD, Department of Orthopedic Surgery, University of Pittsburgh
Joseph M. Furman MD, PhD, Professor, Department of Otolaryngology, University of Pittsburgh
Gregory F. Marchetti PT, PhD, Associate Professor, Department of Physical Therapy, Duquesne University
Susan L. Whitney PT, PhD, Professor, Department of Physical Therapy, University of Pittsburgh
Thesis Director/Committee Chair
Patrick J. Sparto, PT, PhD, Associate Professor, Department of Physical Therapy, University of Pittsburgh

iii
Copyright © by Bara A. Alsalaheen
2012

iv
Many individuals who acquire a concussion are seen for vestibular rehabilitation. The studies
describing the prescribed exercises and the outcomes of vestibular rehabilitation are sparse.
Additionally, the outcome measures that have been used lack normative reference values
for healthy adolescents and have not been examined for correlation with established
neurocognitive measures. Therefore, the purpose of this dissertation is to provide normative data
for the measures used in vestibular rehabilitation, to describe the exercises and the outcomes of a
vestibular physical therapy program and to examine the relationship between self-reported
symptoms, neurocognitive and balance performance in individuals referred to vestibular physical
therapy.
A cross – sectional design was used to establish normative reference values; Ninety- one
participants completed the Activities – specific Balance Confidence scale, Dynamic Gait Index,
Functional Gait Assessment, Timed “UP & GO”, Five Times Sit to Stand test, tests of gait speed
and the Balance Error Scoring System. Percentile scores were computed for all measures.
A retrospective chart review of 114 consecutive subjects referred for vestibular physical
therapy after concussion was performed. At the time of initial evaluation and discharge,
recordings were made of outcome measures of self-report and balance performance. A repeated-
measures mixed ANOVA tested whether there was an effect of time and age on t he outcome
measures. Frequency counts of the most common exercise types were recorded. A correlation
Vestibular Rehabilitation for Dizziness and Balance Disorders after Concussion
Bara Alsalaheen, PhD
University of Pittsburgh, 2012

v
analysis was performed to examine the relationship between balance measures and Immediate
Post-concussion Assessment and Cognitive Testing (ImPACT) at the initiation of vestibular
physical therapy and to examine the relationship between change in ImPACT and change in
balance measures.
Normative reference values for balance were provided. An improvement was observed in
all measures at the time of discharge from vestibular rehabilitation. Eye-Head Coordination
exercises were the most commonly prescribed exercise type. Significant relationships between
the ImPACT neurocognitive scores and balance measures at the start of vestibular rehabilitation
were supported.
In conclusion, Individuals who received vestibular physical therapy after concussion had
favorable outcomes, but it is not possible to determine if the outcomes were solely due to the
therapy. The interventions provided by physical therapists were consistent across patients.

vi
TABLE OF CONTENTS
1.0 INTRODUCTION ........................................................................................................ 1
1.1 STATEMENT OF PROBLEM .......................................................................... 3
1.2 SPECIFIC AIMS ................................................................................................. 4
2.0 REVIEW OF LITERATURE ..................................................................................... 6
2.1 DEFINITION AND GRADING OF MILD TRAUMATIC BRAIN INJURY
(CONCUSSION) ................................................................................................................... 6
2.2 PREVALENCE OF MILD TRAUMATIC BRAIN INJURY ......................... 9
2.3 EFFECTS OF CONCUSSION ON NEUROCOGNITIVE PERORMANCE,
BALANCE AND POSTURE, AND SELF- REPORT SYMPTOMS ............................ 10
2.3.1 Neurocognitive performance ...................................................................... 10
2.3.1.1 Prevalence and effect size ................................................................... 10
2.3.1.2 Instruments for neurocognitive testing after concussion ................ 12
2.3.2 Balance and posture .................................................................................... 17
2.3.3 Self- report symptoms................................................................................. 19
2.4 MULTIFACATED RECOVERY PROCESS AFTER CONCUSSION ....... 25
2.4.1 Predictors of recovery after concussion .................................................... 25
2.4.1.1 Initial markers of concussion severity ............................................... 25
2.4.1.2 Age ........................................................................................................ 27

vii
2.4.1.3 Gender .................................................................................................. 28
2.4.1.4 Concussion History ............................................................................. 29
2.4.2 Correlation between outcome measures among different domains during
recovery 30
2.5 VESTIBULAR REHABILITATION FOR PATIENTS POST
CONCUSSION ................................................................................................................... 32
2.5.1 Evidence behind vestibular rehabilitation for concussion ...................... 32
2.5.2 Outcome measures used in vestibular rehabilitation .............................. 34
2.5.3 Limitations of previous work and rationale for proposed studies ......... 34
2.5.3.1 Rationale for the first study ............................................................... 35
2.5.3.2 Rationale for the second study ........................................................... 35
2.5.3.3 Rationale for the third study .............................................................. 36
2.5.3.4 Rationale for the fourth study ............................................................ 37
3.0 FIRST AIM ................................................................................................................. 40
3.1 INTRODUCTION ............................................................................................. 40
3.2 METHODS ......................................................................................................... 42
3.2.1 Design ........................................................................................................... 42
3.2.2 Subjects: ....................................................................................................... 43
3.2.3 Outcome measures ...................................................................................... 44
3.2.4 Procedure ..................................................................................................... 47
3.2.5 Statistical analysis: ...................................................................................... 48
3.3 RESULTS ........................................................................................................... 49
3.3.1 Reference values .......................................................................................... 50

viii
3.3.2 Reliability analysis ...................................................................................... 53
3.4 DISCUSSION ..................................................................................................... 54
3.4.1 Reference values .......................................................................................... 55
3.4.2 Reliability analysis: ..................................................................................... 58
3.5 LIMITATIONS .................................................................................................. 60
3.6 CONCLUSION .................................................................................................. 60
4.0 SECOND AIM ............................................................................................................ 61
4.1 INTRODUCTION ............................................................................................. 61
4.2 METHODS ......................................................................................................... 63
4.2.1 Participants .................................................................................................. 63
4.2.2 Intervention and outcome measures ......................................................... 63
4.2.2.1 Self-report measures ........................................................................... 64
4.2.2.2 Gait and balance Performance measures ......................................... 65
4.2.3 Statistical analysis ....................................................................................... 66
4.2.3.1 Process of care ..................................................................................... 66
4.2.3.2 Outcome measures .............................................................................. 66
4.3 RESULTS ........................................................................................................... 67
4.3.1 Process of care ............................................................................................. 67
4.3.2 Outcome measures at initial evaluation .................................................... 68
4.3.3 Change in outcome measures ..................................................................... 69
4.4 DISCUSSION ..................................................................................................... 72
4.5 LIMITATIONS AND FUTURE DIRECTIONS ............................................ 76
4.6 CONCLUSION .................................................................................................. 77

ix
5.0 THIRD AIM ............................................................................................................... 78
5.1 INTRODUCTION ............................................................................................. 78
5.2 METHODS ......................................................................................................... 79
5.2.1 Participants .................................................................................................. 79
5.2.2 Procedure ..................................................................................................... 80
5.2.3 Analysis ........................................................................................................ 83
5.3 RESULTS ........................................................................................................... 83
5.3.1 Preferred Prescription Patterns ................................................................ 86
5.3.2 Progression .................................................................................................. 87
5.4 DISCUSSION ..................................................................................................... 88
5.5 CONCLUSION .................................................................................................. 94
6.0 FOURTH AIM ........................................................................................................... 95
6.1 INTRODUCTION ............................................................................................. 95
6.2 METHODS ......................................................................................................... 97
6.2.1 Participants .................................................................................................. 97
6.2.2 Outcome measures ...................................................................................... 98
6.2.2.1 Self report balance measures ............................................................. 98
6.2.2.2 Balance performance measures ......................................................... 99
6.2.2.3 Neurocognitive and symptom measures ......................................... 100
6.2.3 Statistical analysis ..................................................................................... 101
6.3 RESULTS ......................................................................................................... 102
6.3.1 Analysis at rehab start .............................................................................. 102

x
6.3.1.1 Relationship between clinical balance and neurocogntive measures
103
6.3.2 Analysis of change scores ......................................................................... 105
6.4 DISCUSSION ................................................................................................... 109
6.5 CONCLUSION ................................................................................................ 115
7.0 FUTURE CONSIDERATIONS AND FUTURE DIRECTIONS ........................ 116
7.1 FUTURE CONSIDERATIONS ..................................................................... 116
7.2 FUTURE DIRECTIONS ................................................................................. 117
BIBLIOGRAPHY ..................................................................................................................... 120

xi
LIST OF TABLES
Table 2-1: The ImPACT Neuropsychological Testing Battery .................................................... 16
Table 2-2: Clusters of self- report symptoms after concussion .................................................... 19
Table 2-3: Total symptoms score reported after concussion ........................................................ 21
Table 2-4: Prevalence of Headache after concussion ................................................................... 22
Table 2-5: Prevalence of Dizziness after concussion ................................................................... 24
Table 2-6: Prevalence of Balance problems after concussion ..................................................... 24
Table 3-1: Demographic Characteristics of participants .............................................................. 43
Table 3-2: Number of participants who participated in formal athletic activities ........................ 44
Table 3-3: Percentile scores for the outcome measures (n = 91) .................................................. 50
Table 3-4: Percentile scores for individual items on the Activities-specific Balance Confidence
(ABC) Scale (n =91) ..................................................................................................................... 51
Table 3-5: Percentile scores for individual items on the Functional Gait Assessment (FGA) ..... 52
Table 3-6: Percentile scores for the Balance Error Scoring system (BESS). L ower scores
indicate “better” performance on the BESS .................................................................................. 53
Table 3-7: Reliability coefficients, standard error of the measurement (SEM), and minimal
detectable change (MDC) for the timed measures (n = 61) .......................................................... 53

xii
Table 3-8: Percent agreement, expected agreement, and weighted kappa statistics for the
individual conditions of the Balance Error Scoring System (BESS). ........................................... 54
Table 4-1: Mean (SD) of demographic and outcome measures at time of initial evaluation for
vestibular rehabilitation, according to those participants who had evaluation only, and those who
returned for a least 1 additional visit ............................................................................................. 70
Table 4-2: Mean (SD) of outcome measures at times of initial evaluation and discharge ........... 71
Table 4-3: Mean (SD) for the significant interaction effect between age group and time on
dizziness severity and Sensory Organization Test (SOT) scores .................................................. 72
Table 5-1: The exercise modifiers used the vestibular rehabilitation exercises ........................... 82
Table 5-2: Summary of the most common prescribed exercises throughout therapy and during
the first visit in number of subjects (Percentage of subjects) ....................................................... 85
Table 5-3: Progression patterns for the VORx1 exercise† ........................................................... 88
Table 6-1: Relationship between ImPACT composite scores and measures administered at the
start of vestibular physical therapy ............................................................................................. 104
Table 6-2: The relationship between outcome measures administered at the start of vestibular
rehabilitation, total symptom score and “vestibular/ balance” subset of symptoms ................... 105
Table 6-3: Difference in the initial outcome measures between subjects not included in change
analysis (n = 54) and subjects included in change analysis (n = 39) .......................................... 107
Table 6-4: Relationship between change in Vestibular/ balance measures and change in imPACT
composites and the total symptom score .................................................................................... 108
Table 6-5: Relationship between change in symptom scores and change in measures
administered over the course of vestibular rehabilitation ........................................................... 109

xiii
PREFACE
Over the past five years I have received support and encouragement from a great number of
individuals. Without their valuable insights and help, this dissertation would have not moved
from an idea to a completed study. I would like to express my deepest appreciation to my
committee chair, Patrick Sparto, PhD, PT, for the patient guidance, encouragement and advice he
has provided throughout my time as his student. His guidance has made this a thoughtful and
rewarding journey. I would also like thank Susan Whitney, PhD, PT, NCS, ATC, FAPTA, for
her continuous assistance, insights, and support she provided throughout the time when I was a
graduate student at the University of Pittsburgh.
I would like to acknowledge the members of my committee including Joseph Furman,
MD, PhD, Anthony Kontos PhD, Gregory F. Marchetti PT, PhD for their help in the
conceptualization and refining the specific aims of this dissertation and for the methodological
insights they have provided. I have been extremely lucky to have members of my doctoral
committee who cared so much about my work, and who responded to my questions and queries
so promptly.
I would like to thank Micky Collins PhD, Mark Lovell PhD, Tanya Hagen, MD, Jamie
Pardini PhD, and Vanessa Fazio, PhD of the UPMC Sports Medicine Concussion program. In
addition, I would like to thank the physical therapists of the Centers for Rehab Services
Vestibular Rehabilitation Clinic: Anne Mucha, DPT, NCS, Laura Moris, PT, NCS, Corrie

xiv
Amick, DPT, Kathryn Brown, MS, PT, NCS, Dana Hinderliter, PT, and Darcy Nunn, DPT,
NCS.
I would like to thank the graduate students from the University of Pittsburgh and the
physical therapists from the Centers for Rehab Services of University of Pittsburgh Medical
Center for assisting in the data collection, and students from Quaker Valley, Oakland Catholic
and Central Catholic High Schools for participating in the first aim of this dissertation.
I would like to thank the Clinical and Translational Science Institute (CTSI) and Chuck
Vukotich at the University of Pittsburgh for help in recruiting the schools, and the Department of
Physical Therapy in the University of Pittsburgh for providing the equipment for testing.
I must express my thankfulness for my parents and siblings for their unconditional
support and continuous belief in me since I was young. They all have experienced the ups and
downs of my academic journey.
I would like to express my deepest love and gratitude to Mariam, my fiancé; if I wrote
down everything I ever wanted in a fiancé and a best friend I would not have believed I could
meet someone better! All of your continuous support after moving to Michigan is deeply
appreciated. Thanks for making me finish this thing! I was continually amazed by yo ur
willingness to proofread countless pages and repeatedly listen to my dissertation presentation.

1
1.0 INTRODUCTION
Traumatic brain injury (TBI) is one of the most prevalent acquired neurological conditions
occurring in children and young adults.1-2 Most TBI is classified as mild TBI (i.e. concussion).3-4
The annual rate of mTBI is 130-546 per 100,000 persons.5-7 The reported numbers of
concussion are suggested to be conservative numbers; sport-related concussions are estimated to
be 1.6 t o 3.8 million annually.8 The deleterious effect of concussion appear in the areas of
neurocognitive functioning,9-12 postural and balance control,13-16 and self-report symptoms.17-21
Neurocognitive evaluation is seen as the cornerstone of concussion assessment and is the
area where the most advances in research have been made in the management of concussion.22-24
Computerized neurocognitive assessment (e.g.; Immediate Post-Concussion Assessment
and Cognitive Testing, CogSport) has replaced the traditional paper and pencil assessment, and
has provided a means to track the recovery process.12 One of the most studied computerized
tools is the Immediate Post-Concussion Assessment and Cognitive Testing (ImPACT).24
ImPACT contains a symptom inventory and neurocognitive test battery that examines the
neurocognitive aspects of verbal memory, visual memory, reaction time and processing speed.
Dizziness and balance difficulties have been widely reported after concussion.25-29 While
the dizziness and balance impairments usually resolve in the first 3-5 days after concussion,14, 30-
31 some patients exhibit persistent dizziness and balance disorders that require rehabilitation.32-40

2
While the vestibular origin of dizziness and postural instability after concussion has been
reported in many studies,34, 41-43 few studies have investigated the effect of vestibular
rehabilitation on patients with post concussion symptoms.34, 39, 44
Over the course of vestibular rehabilitation, various gait and functional balance measures
are used, and many of the clinical decisions regarding the exercise initiation / p rogression or
discharge are based on the scores obtained through the gait and balance testing as w ell as
symptom resolution. However, most of these measures were initially developed to be used in
adults (mostly older adults) and yet no study has investigated the reliability and the normative
scores of these measures in children between the age of 13 and 18. By providing age –specific
normative scores, we will be able to use these normative scores to determine the impact of
concussion on children’s balance performance and to provide an end point for vestibular
rehabilitation therapy.
The results of vestibular rehabilitation after concussion revealed that vestibular
rehabilitation exercises may reduce dizziness and balance disorders.34, 44 However, these studies
did not describe the severity of self-reported dizziness, and did not describe the severity of
balance performance dysfunction in the patients seen for vestibular rehabilitation after
concussion. Furthermore, it is unknown if the amount of recovery made during vestibular
rehabilitation is different between children and adults.
Although the individualized nature of vestibular rehabilitation programs for individuals
after concussion has been emphasized by experts vestibular physical therapists,45 an
understanding of what exercises have been prescribed for this population may be useful for
several reasons. First, due to the customized nature of vestibular rehabilitation exercises, the
exercise prescription can provide a detailed picture of the specific impairments and functional

3
limitations encountered by the individuals with concussion. Second, it can serve as a foundation
for other therapists who may be starting vestibular rehabilitation programs for management of
individuals with concussion. Third, by a nalyzing the prescription patterns of experienced
therapists, we may begin to examine how exercise progression relates to outcomes.
The impairments of neurocognitive and balance function after concussion are well
documented in the literature.9, 12, 19, 24, 30-31, 46-50 However, they have been studied individually.48
There are a limited number of studies that relate the neurocognitive testing scores to
functional gait and balance measures post-concussion.21 Examining the relationship between
neurocoginitive testing and functional balance measures utilized in clinical settings may help
clinicians effectively use these easily accessed measures in clinical decision making, and may
provide us with a better understanding of the multi faceted nature of the recovery process after
concussion.
In conclusion, many limitations have surrounded the implementation of vestibular
rehabilitation in the management of patients post- concussion. By addressing these limitations,
vestibular rehabilitation will have a greater impact in the management of patients with
concussion.
1.1 STATEMENT OF PROBLEM
Studies of vestibular rehabilitation for dizziness and balance disorders after concussion have
been promising. However, for individuals between 13 a nd 18 of age treated with vestibular
rehabilitation, there is a l ack of normative reference values for the common clinical balance

4
outcome measures used to track recovery. The severity of dizziness and imbalance problems in
this group of individuals post - concussion has not been described and the change in gait and
balance outcomes over the course of vestibular rehabilitation has not been quantified in children
and adult patients. Moreover, the specific exercise prescriptions during the course of vestibular
rehabilitation have not been detailed. Neurocognitive and balance performance and recovery
after concussion have been studied separately, and there have been no studies to examine the
presence/absence of relationship between neurocognitive and balance recovery. There have been
no studies to examine if the markers of concussion severity relate to vestibular rehabilitation
outcomes.
1.2 SPECIFIC AIMS
1. A cross – sectional study was conducted to provide normative data and to examine the
reliability for clinical gait/ balance measures for healthy high school aged children.
2. A retrospective chart review was conducted: 1) to describe the severity of dizziness and
balance dysfunction in patients who were referred to vestibular rehabilitation after being
diagnosed with concussion, 2) to describe the outcomes of vestibular rehabilitation for
dizziness and balance dysfunction after concussion, and 3) to examine whether the
amount of recovery made over the course of vestibular rehabilitation is equal between
children and adults.
3. A retrospective case series was performed to describe exercise prescription patterns in
patients treated with vestibular rehabilitation after concussion. The analysis will describe

5
the progression of the exercises and common exercise volumes for vestibular
rehabilitation exercises used in the management of individuals with dizziness and balance
disorders after concussion.
4. A retrospective case series was performed to examine the relationship between
neurocognitive and balance performance and recovery after concussion.

6
2.0 REVIEW OF LITERATURE
2.1 DEFINITION AND GRADING OF MILD TRAUMATIC BRAIN INJURY
(CONCUSSION)
Over the last three decades, many overlapping and sometimes confusing terms and constructs
were used to describe the milder spectrum of head injuries;51 minor head injury, mild closed head
injury, mild traumatic brain injury, and concussion were seen throughout the literature. Although
there were slight differences between these terms, the differences are often overlooked when
interpreting the evidence related to prevalence and recovery.
Many professional organizations have adopted the use of one of the above mentioned
terms; the World Health Organization (WHO) and the American Congress of Rehabilitation
Medicine have used mild traumatic brain injury (mTBI).52-53 Concussion and sports- concussion
were used by t he American Academy of Neurology and Concussion in Sport group,
respectively.22, 54 The American Academy of Pediatrics has used the term minor closed head
injury.55
Loss of consciousness, amnesia, and confusion are considered the hallmarks of
concussion, and were often included as defining characteristics in the various definitions of
concussion. However, there was high variability in numerical value assigned to some of these
defining characteristics; for example the duration of loss of consciousness (LOC) at time of

7
concussion has ranged between 0-30 minutes, and the duration of post-traumatic amnesia (PTA)
has ranged between 0-24 hours.49 The variability in the selected term of use and the duration of
defining characteristics has led to great heterogeneity in the selected “concussion” populations
across the studies, and sparked a great amount of confusion over the years.
Over the last three decades many definitions have been proposed for concussion (i.e.
mTBI). One of the earliest and most widely recognized definitions of concussion was proposed
by the committee on h ead injury nomenclature of neurologic surgeons in 1966 i n which
concussion was defined as “a c linical syndrome characterized by the immediate and transient
posttraumatic impairment of neural function such as alteration of consciousness, disturbance of
vision or equilibrium , etc., due to brain stem dysfunction”.56 In 1997, the American Academy
of Neurology (AAN) defined concussion as “Any trauma induced alteration in mental status that
may or may not include loss of consciousness”.54
Recently the Centers for Disease Control (CDC) have put forth the following definition
for concussion: “a complex pathophysiologic process affecting the brain, induced by t raumatic
biomechanical forces secondary to direct or indirect forces to the head. It is caused by a blow or
jolt to the head that disrupts the function of the brain. This disturbance of brain function is
typically associated with normal structural neuroimaging findings (i.e., CT scan, MRI). It results
in a constellation of physical, cognitive, emotional and/or sleep-related symptoms and may or
may not involve LOC.2 The CDC has also stated the mTBI and concussion are synonymous and
are often used interchangeably.2
Although the various definitions of concussion were not intended to provide subtypes for
concussion severity, many have detailed the defining characteristics in order to establish grading
scales for concussion severity. The establishment of different grading scales, variability in the

8
numerical values assigned to the defining characteristics, and the use of these subscales as
guidelines to the recovery process are all factors that have led to debate about the definition,
prognosis and management of concussion over many years.57
There have been at least 17 grading scales for concussion in the literature.57 It is essential
to note that none of these scales was validated by pr ospective data or based on e mpiric
evidence.58 Grading scales reflect a consensus among a group of experts and were based on
clinical experience.57, 59-60 The grading scales also heavily based the classification of severity on
the presence and duration of LOC and other markers of severity. The grading scales have also
assumed universal effects of concussion for all age and gender groups.
Recent evidence suggests no strong correlation between LOC and neurocognitive testing
performance and recovery.61-62 Furthermore, some studies have suggested differential rates of
recovery for different age groups63-66 and genders.67-69
The absence of a discernible relationship between LOC and neurocognitive recovery, and
the presence of a differential rate of recovery for different age groups and gender invalidate the
use of standardized concussion grading scales to make clinical decisions regarding return to play
or work after concussion.57 The lack of a validated grading scale has led to the endorsement of an
individualized concussion management approach. This approach was endorsed by the National
Athletic Trainers Association in which neurocognitive performance, balance performance and
resolution of self- report symptoms are used to track the recovery process.57, 60, 70-72

9
2.2 PREVALENCE OF MILD TRAUMATIC BRAIN INJURY
Traumatic brain injury (TBI) is one of the most prevalent acquired neurological conditions
occurring in children and young adults.8 Epidemiological studies revealed that between 75% -
90% of TBI are classified as mild TBI (i.e. concussion);73-74 the annual rate of mTBI is 130-546
per 100,000 persons5-7
Sports-related concussions have received the most attention; approximately 300,000
sports-related concussions occur in the United States every year.75 Three to eight percent of high
school and college athletes sustain a concussion every year.76-78 Six percent of all sports injuries
among the high school athletes are concussions,79 and 34 % of college athletes have had at least
one concussion in their past.80
The large number of reported concussions has led to concussion being recognized as one
of the most common neurological injuries in contact sports.81 However, the rates of reported
concussions vary by sport and age; American football accounts for 63% of high school
concussions.79
Despite the growing number of reported concussions in recent years, many researchers
believe the actual numbers of concussions in sport and non-sport environments are much higher
than reported;7, 82-85 the estimations of concussions occurring in the U.S have ranged between 1 –
4 million concussions every year.8, 86-87 The reported numbers of concussions are suggested to be
conservative numbers because it is influenced by the variability of concussion definitions and
therefore diagnosis. Additionally, athletes may not recognize that the symptoms they have is a
result of a concussion, or may intentionally underreport the concussion symptoms due to
personal desires, fear of financial loss or jeopardizing their future athletic career.83, 88 One study
reported 50% of interscholastic athletes do not report their concussion to medical personnel.83

10
Despite the uncertainty surrounding the actual number of concussions occurring in the
United States every year, concussion is now being recognized as an epidemic and major public
health concern, especially for children and young adults.23, 54, 79, 89-90
The estimated annual cost (direct and indirect) of concussions in the United States ranges
between 12 -17 billion dollars.73, 91 Furthermore, concussion is found to have negative effect on
psychological well being and health related quality of life (HRQOL),92-93 and also linked to
higher family burden and emotional distress.94
2.3 EFFECTS OF CONCUSSION ON NEUROCOGNITIVE PERORMANCE,
BALANCE AND POSTURE, AND SELF- REPORT SYMPTOMS
2.3.1 Neurocognitive performance
2.3.1.1 Prevalence and effect size
The effect of concussion on neurocognitive functioning has been documented in a large number
of studies;49, 76-77, 80, 95-102 neurocognitive testing is often seen as the cornerstone for concussion
assessment and the domain that provides information about impairments and the recovery
process after concussion.20, 22-24, 103-104 However, due to a practice effects, and continuous
development in adolescents’ cognitive abilities, return to baseline neurocognitive performance
may not always indicate full recovery.23 Although neurocognitive testing is viewed as t he
cornerstone for concussion assessment, there is a consensus that other measures such as postural

11
stability and self- report symptoms should be used in conjunction with neurocognitive testing.20,
57, 60, 70-71, 105-107
Despite the large body of evidence supporting the negative effect of concussion on
neurocognitive testing, the extent to which the concussion affects cognitive abilities and the
course of recovery has been controversial for decades.46 Many factors may contribute to the
variability in the prevalence of neurocognitive effects of concussion and its course of recovery;
studies had different operational definitions of concussion (if defined) and therefore the selection
of patients was variable.46, 108 For example, selection of subjects from the emergency department
registry may under-represent the less severe spectrum of concussion patients and therefore inflate
the effects of concussion.108-109 Conversely, selection of participants from sports settings where
concussions are often not formally diagnosed by physicians and are often self- reported may
under-represent the more severe continuum of individuals with concussion.9 Additionally, there
are many different neurocognitive domains such as attention, executive functioning, fluency,
delayed memory, memory acquisition, and visuospatial abilities. Within each domain, there are
many instruments used to track the recovery of neurocognitive functioning. The heterogeneity of
instruments and neurocognitive domains they include may explain some of the variability seen in
the reported effect size of concussion across many studies.46, 52 The differences in the
psychometric properties (e.g. sensitivity, specificity, and test-retest reliability) of different
measures at different points throughout the course of recovery may also influence the reported
effect size.110-111 Other methodological differences between studies (e.g. pre-injury self-
comparison vs. matched control) may affect the reported period of recovery.9, 46, 112
Five meta analyses examined the effect of concussion on neuropsychologcal testing9, 19,
46, 113-114 The overall effect size ranges from small (e.g. d = .12),114 to moderate (d= .54)46 and is

12
comparable between the sports- concussion (d=.49),9 and non-sport mTBI (d=.54).46 The overall
effect size has been examined by the time since injury; Schretlen et al115 demonstrated a
decrease in the effect size of mTBI on neurocognitive testing with time since concussion
compared to matched controls; in this study, the effect sizes were calculated for four time periods
since concussion; < 7days after mTBI, 2-29 days, 30- 89 days, and > 3 months, and significant
differences were found among effect sizes across these time intervals (d =.41, .29, .08, 0.04,
respectively).115
Some studies examined the effect size for different domains of neurocognitive
functioning rather than overall effect size; Zakzanis examined the effect of concussion on seven
cognitive domains and found moderate to large effect sizes ranging from (d=.44) for manual
dexterity to (d= .72) for flexibility/ abstraction.113 In another meta analysis, most effect sizes of 9
cognitive domains were moderate to large.46 Belanger et al reported the largest acute effects of
concussion for the domains of delayed memory, memory acquisition, and global cognitive
functions (d=1.00, 1.03, and 1.42, respectively).9 Despite the decrement in total effect size since
time of injury,9, 19, 46 various cognitive domains demonstrated great heterogeneity between the
effect size, and therefore differential rate of recovery.9, 46, 114
In summary, concussion has negative effects on neurocognitive testing performance. The
overall effect usually decreases with time after concussion. However, concussion may have
greater or longer effects on certain aspects of neurocognitive functioning compared with others.9
2.3.1.2 Instruments for neurocognitive testing after concussion
Many instruments have been used to assess neurocognitive performance after concussion.
Traditionally, paper and pencil instruments were used. While paper and pencil measures
have been somewhat effective in the diagnosis and management of concussion, paper and pencil

13
instruments were not sensitive, specific, and did not have normative data.59, 96 Moreover, paper
and pencil testing is inconvenient and expensive to administer because it requires a trained
professionals (e.g. a neuropsychologist) to administer and interpret the scores.57, 59, 106, 116 Some
of the paper and pencil tests (e.g. Symbol Digit Modalities Test (SDMT), Verbal Hopkins
Learning Test (VHLT), and Trail Making Test (TMT) have also been criticized for a practice
effect.96, 116-118
Studies that examined the recovery of neurocognitive deficits using different paper and
pencil instruments revealed resolution of measurable neurocognitive deficits by the fifth day post
concussion.31, 76, 80, 95-97, 100, 119 However, there are other studies that demonstrated persistent
neurocognitive deficits in divided and sustained attention,120-121 processing speed,122 and reaction
times120 long after the first five days post concussion.
In recent years, a shift has occurred with neurocognitive testing in which computerized
neurocognitive testing began to replace the traditional paper and pencil testing.23, 101, 105-106, 116,
123-124 This trend in neurocognitive testing was endorsed by the first and second international
symposium about concussion in sport22, 103 and by the National Athletic Trainers Association.125
Computerized neurocognitive testing does not require a trained professional to
administer, allowing more cost- and time-effective testing for large groups of individuals.57, 110
The computerized software allows for increased accuracy in recording reaction times
which may lead to better validity. The randomization of test stimuli may reduce practice effects
of multiple administrations and may improve the reliability compared with “paper and pencil”
neurocognitive evaluations.65, 106-107, 126-127
The implementation of computerized neurocognitive testing led to an increase in the
number of “at risk individuals” with available baseline neurocognitive data, and opened an
14
avenue for examining the recovery process after concussion on a larger scale.60, 126 The recovery
process after concussion has been examined by using matched controls or return to pre- injury
baselines.128 The use of baseline testing is recommended whenever possible.22, 57, 70, 103, 128-129
Computerized neurocognitive testing demonstrated sensitivity to the initial
neurocognitive deficits after concussion.65, 123-124, 130-132 Computerized neurocognitive testing is
proven to be sensitive to the persistent neurocognitive deficits beyond the one week window of
recovery seen in most patients with concussion.66, 130
Many computerized neurocognitive testing assessment batteries are currently used in
concussion assessment; CogSport,133 Headminder’s Concussion Resolution Index (CRI),123 and
the Immediate Post Concussion Assessment and Cognitive Testing (ImPACT)24 have been
developed and used for neurocognitive testing.
CogSport was designed to measure changes in cognitive functioning in the areas of
psychomotor, decision making, problem solving, and memory scales.134 CogSport was
originally validated in Australian professional football players and healthy controls,126, 131 and
CogSport indices have demonstrated high to very high (.69 - .90) test re-test reliability. CogSport
indices have been externally validated (i.e. construct validity) against the paper and pencil tests
of Trail Making and Digit Symbol Substitution Tests.116
HeadMinder’s Concussion Resolution Index (CRI) is an internet-based test that measures
cognitive functioning in the areas of reaction time, processing speed, and visual recognition. It
also includes a symptom scale. The CRI has been validated against a number of paper and pencil
measures.123-124, 135
ImPACT is a computer administered software package that containing a neurocognitive
testing battery and a post concussion symptom scale.24 The neurocognitive testing of ImPACT

15
measures different areas of cognitive functioning including attention, processing speed, reaction
time, and memory. The ImPACT neurocognitive battery uses six test modules (word memory,
design memory, X’s and O’s, symbol match, color match, and three letter memory) to generate
four composite scores. Each testing module may contribute to more than one composite score.
The four composite scores are verbal memory, visual memory, visual –motor processing
speed, and reaction time. Table 2- 1 illustrates the ImPACT neurocognitive testing battery. A
detailed description of individual tests and composite score has been detailed elsewhere.59, 63, 136
ImPACT is one of the most studied computerized tools in the field of computerized
neurocognitive testing. The validity,136-137 reliability,12, 18, 138 and sensitivity59 of ImPACT have
been examined. ImPACT is primarily used in quantifying the neurocognitive and symptom
outcomes after concussion.139 ImPACT has also been used to examine the correlation between
on- field markers of concussion severity and neurocognitive performance and symptoms
following sports related concussion.62, 65, 140 Moreover, ImPACT is used to examine if the
presence of a certain symptom (e.g. headache, fogginess) is correlated with poorer
neurocognitive performance.140-141 The successive and serial administration of ImPACT
(including pre injury testing) has facilitated the examination of neurocognitive recovery,12, 63, 65,
139, symptoms reolution,18 and the presence of the cumulative effects of concussion.142-143

16
Table 2-1: The ImPACT Neuropsychological Testing Battery
Test Name Neurocognitive domain measured
Word Memory Verbal recognition memory (learning and retention)
Design Memory Spatial recognition memory (learning and retention)
X’s and O’s Visual working memory and cognitive speed
Symbol Match Memory and visual-motor speed
Color Match Impulse inhibition and visual-motor speed
Three Letter Memory Verbal working memory and cognitive speed
Symptom Scale Rating of individual self- reported symptoms
Composite scores Contributing scores
Verbal Memory Word memory (learning and delayed), symbol match memory
score, three letter memory score
Visual Memory Design Memory (learning and delayed), X’s and O’s percent
correct
Reaction time X’s and O’s (average counted correct reaction time), symbol
match (average weighted reaction time for correct response)
Visual Motor Processing
Speed
X’s and O’s (average correct distracters), symbol match
(average correct responses, three letter (number of correct
numbers correctly counted)

17
2.3.2 Balance and posture
Poor balance and postural instability have been reported in many studies post concussion.14, 25-27,
29 However, the extent of balance disorders after concussion has not been clearly defined. Both
static and dynamic balance has been examined after concussion. Static balance requires
individuals to maintain balance in quiet stance (i.e. feet in place). Dynamic balance requires
individuals to maintain balance while the body is moving (e.g. gait). While many of the early
studies have examined the effect of concussion on static balance, recent literature has
investigated the effect of concussion on balance in dynamic and dual task environments.
Regardless of the environment where balance was tested, it has been acknowledged that
the variability in selected outcome measures and its psychometrics may contribute to the
variability in the reported prevalence and course of recovery of balance disorders after
concussion.15-16, 29
Impairments in static balance have been examined using the modified protocol of
Clinical Test of Sensory Interaction and Balance (CTSIB), Balance Error Scoring System
(BESS),144 and SOT. Studies on the immediate effect of concussion on static balance reveal that
patients exhibit increased postural sway14 and sway velocities in both coronal and sagittal
planes.145 Patients also exhibit poorer performance on the Balance Error Scoring System
(BESS).14, 31 However, most studies acknowledge that impairments in static balance usually
resolve in the first 3-5 days after concussion.30-31, 48, 146-147
Dynamic postural instability has been correlated with dysfunction in sensory
integration148 or lack of attentional resources required for dynamic balance performance,29 and

18
therefore dynamic postural stability is often examined when sensory conflict148-149 or a dual
task150-153 is introduced.
Studies of dynamic balance impairments after concussion revealed that patients exhibit
slower gait velocity,28, 151-152 shorter stride length,150 and wider step width.29 They adopt a
conservative gait pattern exhibited by less sway and slower sway velocity in the sagittal plane.15,
28-29, 152 This conservative strategy is often interpreted as a compensatory mechanism for reduced
postural control (i.e. more sway) in the coronal plane movement.152
Reports about the recovery of dynamic balance stability after concussion yield mixed
results; while some studies on sensory conflicts revealed that the destabilization effect of visual
field motion on balance may take 30 days to resolve,148 other reports demonstrated that patients
with concussion may exhibit an inconsistent pattern of recovery, in which many aspects of gait
stability are still impaired at four weeks after injury.151 This variability has been attributed in part
to the variations in psychometric properties of different testing procedures and its ability to
detect dynamic balance deficits at different times of the recovery process;15, 29 for example, it has
been suggested that dual cognitive tasks and obstacle crossing are better in detecting gait
adaptations at different times of the recovery process; while attention divided gait is able to
better distinguish gait deviations immediately following a concussion, obstacle crossing can be
used further along in the recovery process to detect new gait adaptations.15
Other measures of gait and functional balance are used in vestibular and balance therapy
post- concussion. These measures will be detailed below in the methods chapter.

19
2.3.3 Self- report symptoms
The use of self- report symptoms has been widely acknowledged as a useful assessment tool for
individuals with concussion. A self- report symptom checklist is the most common assessment
tool employed by athletic trainers.154 Although a recent meta analysis has concluded the largest
effect of concussion is in the domain of self- report symptoms compared to the neurocognitive
and postural testing,19 there is a consensus that self- report symptoms should be incorporated in a
multidisciplinary form of assessment, and the clinical decisions should not be solely based on the
resolution of symptoms.84 Symptoms have been obtained through formal and informal
evaluations. While the informal evaluations are sparse in the published literature,155 different
formal symptom checklists have been published and used by a thletic trainers125, 154 and
neuropsychologists.18, 140-141, 156 These checklists are designed to quantify the severity and
recovery of the self- report symptoms after concussion.18
Table 2-2: Clusters of self- report symptoms after concussion
Physical Cognitive Emotional Sleep
Headache Nausea Vomiting Balance problems Dizziness Visual problems Fatigue Sensitivity to light Sensitivity to noise Numbness Tingling
Feeling mentally foggy Feeling slowed down Difficulty concentrating Difficulty remembering
Irritability Sadness More emotional Nervousness
Drowsiness Sleeping less than usual Sleeping more than usual Trouble falling a sleep
The comparison of evidence among the different checklists is challenged by considerable
variation in their content, grading systems,19, 157 and the lack of reliability and other known

20
psychometrics.18 The Post- Concussion Symptom Scale (PCS) is one of the most widely used
checklists. It is a 22-item scale that was developed as a part of the Pittsburgh Steelers concussion
management program.18 The PCS is designed to quantify the severity of symptoms in the acute
phase of recovery after concussion, and is based on a 7 point Likert scale. For any particular
symptom, the scale ranges from 0 (no symptom) to 6 ( severe), and the total PCS score is
calculated by adding the scores obtained for the 22 items. The PCS has been examined for
psychometric data, clinical interpretation and normative scores.18, 138, 141 The PCS is available in
paper form and is incorporated in the ImPACT computerized neurocognitive testing program.24
The PCS has been used to quantify the self- report symptoms in patients after concussion
in large number of studies,18, 21, 50, 59, 80, 139-140, 142, 158-159 and has been adopted for use by t he
National Football League (NFL) and the National Hockey League (NHL).18
Other checklists include the Rivermead post concussion symptoms questionnaire
(RPQ),160 and concussion symptoms survey (CSS).161 The Rivermead post concussion symptoms
questionnaire is a 16 s ymptoms checklist. It uses a likert scale of five points between 0 (not
experienced at all) and 4 (severe problem). The model has been developed, validated and
assessed for reliability by King et al.160 Although one report has concluded the RPQ does not
meet the modern psychometric standards and should not be used in its current form,162 the
Rivermead post concussion questionnaire has been used for individuals with post concussion in
many studies.163-170
The prevalence of self- report symptoms after concussion is variable across different
reports. Many factors may have contributed to the large degree of variability seen; there have
been many proposed operational definitions of concussion and therefore the selection of
participants is influenced by w hat is defined as “concussion”.108 Moreover, the recruitment

21
process may influence the sample characteristics of selected participants and inflate the
prevalence of self- report symptoms.108 Participants in some studies were obtained from the
registry in emergency departments.109, 170-172 The longitudinal reports of self- report symptom
recovery tend to bias toward the more severe spectrum of patients that are presented with
unresolved symptoms and seen for follow up.108, 171 Table 2-3 illustrates the total symptom score
reported by many studies at the initial evaluation after concussion and at other times.
Table 2-3: Total symptoms score reported after concussion
Study
n Scale Mean age Mean initial total score
Follow up(days)
Mean total score at
follow up
McCrea et al,31 94 Graded Symptom checklist
20 y.o 20.93 90
.6
Lovell et al,65 64 Post concussion scale (PCS)
High school athletes
25 7 7
Register- Mihalik,173
392 Graded symptom checklist
17 y.o 11.70 7 1.9
n= Number of participants
Post- traumatic headache is the most common symptom after concussion.171, 174-175
Prevalence of initial headache after concussion has been reported to range between 43%
to 86% of patients (Table 2-4).18, 171, 176 Persistent headache is also reported in a period up to
three months after concussion.170, 172
Although post traumatic headache can exist in many forms such as tension-like, cluster
like or mixed headaches,175 individuals with migraine headache are found to have greater
neurocognitive deficits compared to individuals with other forms of headache and individuals
with no he adache.158 Migraine is also found to be an independent risk factor for sustaining
concussion.177

22
The prognostic value of headache has been investigated in many studies.140, 158, 163, 173, 178-
180 Evidence from a clinical population of mTBI revealed that the presence of headache at time
of admission to the emergency department is associated with development of post concussion
symptoms at one and six months after injury.163, 178 Individuals with headache are found to have
worse neurocognitive and balance testing, and found to report more symptoms than individuals
who do not have headache after concussion; Collins et al. revealed a c orrelation between the
neurocognitive testing scores and the severity of headache post concussion.140 Individuals with
Post-traumatic Migraine to have worse neurocognitive performance compared to athletes who
did not have headache or have other types of headache after sport related concussion.158
Table 2-4: Prevalence of Headache after concussion
Study (sample size)
Mean age (years)
Outcome measure
% report initial symptoms
(mean severity)
Time of follow up
% reporting symptom at follow up
(mean severity)
Blinnman et al,171 (116)
14.1 PCS 71.6 (2.7) 2-3 weeks 31.8 (1.8)
Collins et al,140 (109)
15.8 PCS NR† 1 week 33.0 (2.7)
Faux et al,172 (100)
33.6 RPQ 100 1 month 3 months
30.4 (NR)† 15.4(NR)†
Lannsjo et al170 (2523)
31 RPQ 43.2 3months 22 (2.6)
Lovell et al,18 (52)
16.8 PCS 88.5 Between 1 &4 weeks
32.7(NR)†
Savola et al,176 (37)
33.7 Modified version of
PRQ
65 4 weeks 38(NR)†
†NR: Not Reported

23
Dizziness is also a frequent symptom after concussion. Twenty three to eighty one
percent of persons post concussion report dizziness in the first days post concussion (Table 2-
5).18, 181 Of the 61% who reported dizziness in the initial days after concussion in one study,
41% reported mild dizziness, 16% reported moderate dizziness, and 4% reported severe
dizziness.18 Estimates of the prevalence of persistent dizziness after mTBI varies widely from
16-18% at three months,170, 181 1.2% at 6 months182 to 32.5% at five years.183
The prognostic value of dizziness in mTBI was examined in many studies.163, 176, 178 In a
clinical population 208 adults with mild and moderate brain injury, Chamelian et al reported that
patients with dizziness were more symptomatic and demonstrated worse psychosocial
functioning six months after injury compared to the patients who did not have dizziness.163
Although the results of this study may be confounded by the presence of moderate TBI
patients in the sample, the results are consistent with other studies that investigated the role of
dizziness in the outcomes after mTBI. Two studies have reported that dizziness at the time of
admission to the ER after mild TBI is associated with the severity of post concussion symptoms
at one and six months after injury.176, 178 Dizziness was also linked to psychological distress at 6
months after injury and found to be an independent factor for failure to return to work after mild
to moderate head injury.163
Balance problems are a f requent symptom after concussion. Self- report balance
problems have been reported in as high as 60% after concussion.171 Persistent self report balance
problems have also been reported after one week of concussion (Table 2-6).18, 171 Although some
studies have suggested that self- reported balance problems usually resolve in the first days after
concussion,31, 144, 146 patients may exhibit decreased balance performance despite not reporting
balance problems.184

24
Table 2-5: Prevalence of Dizziness after concussion
Study (sample size)
Mean age (years)
Outcome measure
% report initial symptoms
(mean severity)
Time of follow up
% reporting symptom at follow up (mean severity)
Blinmann et al,171 (116)
14.1 PCS 60.3(2.7) 2-3 weeks 27.0 (1.6)
Broglio et al,21 (32)
19.7 PCS 28.1(.75) NA‡ NA
Lovell et al,18 (52)
16.8 PCS 78.8 Between 1 and 4 weeks
17.3(NR)†
Lannsjo at al,170 (2523)
31 PRQ 31 3 months 16 (2.6)
Savola et al,176 (37)
33.7 Modified version of
RPQ
49 4 weeks 43(NR)†
†NR: Not Reported; ‡NA: Not applicable; RPQ: The Rivermead Post- Concussion symptom questionnaire
Table 2-6: Prevalence of Balance problems after concussion
Study (sample size)
Mean age (years)
Outcome measure
% report initial symptoms
(mean severity)
Time of follow up % reporting symptom at follow up (mean
severity)
Blinmann et al,171 (116)
14.1 PCS 60.3(2.6) 2-3 weeks 25.4(1.5)
Broglio et al,21 (32)
19.7 PCS 34.4 (.75) NA NA
Lovell et al,18 (52)
16.8 PCS 55.8 Between 1 and 4 weeks
11.5(NR)†
†NR : Not reported; NA: Not applicable; PCS; Post- Concussion Symptom scale
Many have suggested that the symptoms after concussion could be clustered into broad
constructs.24, 185-186 Although the nomenclature is slightly different across reports, the dividing of
symptoms into clusters is suggested to offer a better description about the effect of concussion
and reduce the redundancy and confounding in the symptom checklists. In one study, Piland et
al. have suggested that grouping of the head injury scale (HIS) of symptoms into a model of
three constructs (somatic, cognitive and neurocognitive) will demonstrate factorial and construct
25
validity among collegiate athletes.185 Others have suggested that the symptoms could be divided
into somatic, cognitive, neuropsychiatric or affective constructs.24 In a recent report, the CDC
has noted that the symptoms of concussion generally fall into four categories: physical (i.e.
somatic), cognitive, emotional (i.e. mood), and sleep (Table 2-2).186 However, the current
classification by the CDC reflects consensus among group of experts and is not based on
empirical evidence and therefore the use of the clusters is mainly for descriptive purposes.
Additionally, it is unclear if the current categorization has any clinical implications since
the symptom evaluation tools that are currently in use do not have categories sub scores.
2.4 MULTIFACATED RECOVERY PROCESS AFTER CONCUSSION
2.4.1 Predictors of recovery after concussion
2.4.1.1 Initial markers of concussion severity
The following signs have been recognized as the hallmarks of concussion severity; loss of
consciousness (LOC), amnesia, and disorientation. Many concussion severity scales have relied
on these signs for the classification of severity, especially the LOC.54, 187 However, recent
research has doubted the prognostic value of these markers, and whether they represent valid
measures to determine the severity and therefore the course of recovery after concussion.61-62, 77,
188
Loss of consciousness may be associated with early neurocognitive deficit, but not
prolonged neurocognitive deficit.77 McCrea et al. found that despite the normal neurocognitive
scores on the Standardized Assessment of Concussion (SAC), patients with LOC are more

26
symptomatic than patients who did not have LOC 48 hours after concussion.77 Lovell et al. have
retrospectively examined the relationship between neurocognitive performance and the presence
of LOC after concussion in 383 pa tients. The study demonstrated no s ignificant differences in
the neurocognitive testing between patients who sustained LOC vs. no LOC.61 The results of this
study are consistent with other studies that have examined the prognostic value of LOC on the
prolonged neurocognitive performance.62, 188 However, Auspland et al. has found that athletes
with LOC demonstrated prolonged return to play after concussion. It is unclear whether these
findings are attributed to providers’ conservative care or prolonged actual deficit.180 In summary,
the use of LOC as a marker of concussion severity has been scrutinized by many studies and
many studies have doubted the validity of the scales that rely heavily on the LOC.57, 60-62, 105, 128,
189-191
Other on-field markers have been also investigated for prognostic value.191 Collins et al.
reported increased risk of reduced memory scores and prolonged symptoms with the presence of
retrograde amnesia, anterograde amnesia, and disorientation.62 The duration of on-field mental
status changes such as retrograde amnesia and confusion were found to be related to poor
memory scores and higher symptoms at 36 hours, 4 and 7 days after concussion.65 Others have
found that post traumatic amnesia (PTA) is correlated with worse neurocognitive outcomes at
day 2 a fter concussion.189 These results suggested on-field mental status appeared to have a
prognostic value in recovery and should be considered when making clinical decisions.31, 60, 62, 65,
70, 187, 190

27
2.4.1.2 Age
Many have hypothesized that there are differences between children and adults that may affect
concussion management.71, 192 Many psychosocial factors could affect a children’s recovery
such as academic and social issues that need to be accounted for in the management process.192
Children also change in their developmental abilities and these changes warrants frequent
updates to baseline neurocognitive testing.4, 125, 193-194 A differential rate of recovery between
children and adults is seen in many studies.64-66, 110, 139, 190 Many pathophysiological factors may
contribute to differential rates of recovery of children after concussion. Children’s tolerance to
biochemical changes associated with concussion may be different from adults, and consequently
the sequelae from impacts of the same magnitude may be different between children and adults.4,
195
Differences in glutamate sensitivity and prolonged diffuse cerebral swelling in children
post injury were some of the factors suggested to contribute to the protracted recovery pattern
seen in children.57, 192, 195-196 These metabolic factors are thought to further expose children to
subsequent injury that may have catastrophic consequences such as Second Impact Syndrome
(SIS).194, 197
Many studies have noted that high school athletes are more susceptible to concussive
injuries60, 63, 128, 197 and have a prolonged recovery pattern compared to older athletes in the
domains of neurocognitive testing and symptom resolution.64-66, 139, 190 For instance, while the
memory function in college athletes returned to the level of matched controls by day three post
concussion, high school athletes needed 7 days to return to normal memory function.64 A similar
pattern of prolonged memory dysfunction in high school athletes was also noted by Sim et al.66

28
Despite the differential rate of recovery shown by studies, none of the standardized
concussion assessment scales has provided age specific guidelines, and therefore many have
doubted the use of standardized grading scales in children.57, 60, 63-64, 110
There is a consensus that conservative management strategy should be used with children
post concussion.192-193 This conservatism is endorsed by the National Athletic Trainers
Association and the 3rd International Conference on Concussion in Sport.70, 84
Finally, it is noteworthy that all the age- related studies have used measures of
neurocognitive testing and self- report symptoms. None of age-related studies described the
effects of age on recovery of impairments in balance and posture or if there is a differential rate
of recovery between children and adults for balance disorders.
2.4.1.3 Gender
The studies on t he effect of gender on c oncussion incidence have yielded mixed results.
Although some studies have found females to have a higher incidence of concussion,174, 198-200
other studies found equivalent concussion rates in both genders.79, 201-202
Differences between genders in baseline neurocognitive testing were found in some
studies.203-204 Barr et al. has found that while male athletes perform better on tests of visual
memory, female athletes perform better on verbal memory tests.203 It has been also found that
females may experience different effects after concussion compared to males and may
experience a different course of recovery.67-68, 204 Females have shown greater decline in their
memory scores,67reaction time and processing speed.68-69, 122 Females also have demonstrated
worse overall self- report symptoms,68-69, 93, 167, 201, 205-206 and were found to report headache,
sleep disturbances and depression more than male counterparts.205, 207

29
Despite the studies demonstrating different recovery patterns in self- report symptoms
and neurocognitive testing, there were no studies to examine recovery in the balance and posture
domain of assessment based on gender
2.4.1.4 Concussion History
The cumulative effect of concussion history on neurocognitive performance and self- report
symptoms have been investigated by many studies. Iverson et al. reported that individuals with
previous concussion history are more symptomatic and have worse neurocognitive performance
on pre- season testing.143 Others have suggested that a history of concussion increases the risk for
sustaining subsequent concussion by up to 5.8 times.69, 208-211
The cumulative effect of concussion also has been studied by c omparing performance
and recovery between individuals who have a previous history of concussion and individuals
who sustain their first concussion. The effect of three or more previous concussions on a
subsequent concussion yield convincing results. Athletes with three or more previous
concussions were reported to be 9.3 times more likely to experience more markers of concussion
severity,208 7.7 times more likely to experience major decline in memory performance,143 and
were found to report more symptoms of subsequent concussions.212 The evidence for the effect
of one or two previous concussions is mixed. While some studies suggested that a history of one
or two concussions have a cumulative effect,69, 155 many studies have not found such an effect.142,
213
Belanger et al. have noted that the effect size of concussion on neurocognitive
performance was different between the studies that excluded individuals with previous
concussions (d=.11) and the studies that did not exclude individuals with previous concussion

30
(d =.74).46, 214 Most studies analyzed the cumulative effect of concussion on t he overall
neurocognitive functioning. However, Belanger et al. found that a history of multiple
concussions is associated with worse performance for the measures of executive functioning and
delayed memory.214
2.4.2 Correlation between outcome measures among different domains during recovery
In examining the recovery process after concussion, researchers have often viewed the recovery
process from different points of view; Subjective vs. objective and cognitive vs. motor recovery.
The diversity in these points of view have enhanced our understanding of the multi-
faceted nature of the recovery process after concussion, and improved the management of
patients with concussion. Nonetheless, despite the improvements made in the validation of
different assessment domains, no single one should be a stand alone instrument.16, 23, 60, 107, 110
Using multiple domains of assessment that include neurocognitive testing, self- report
symptoms and postural testing is found to increase the sensitivity of a concussion assessment
battery to exceed 90% compared to 79% obtained by the most sensitive instrument only
(ImPACT).20 In another study, Van Kampen et al. reported that the use of neurocognitive testing
(i.e. ImPACT) in addition to self- report symptoms resulted in a 19% net increase in sensitivity
compared to self- report symptoms alone.215
The multi-faceted nature of concussion effects and the recovery process may shed light
on the relationships between the different domains of assessment during the recovery process.
Surprisingly, the recovery process has been studied separately within each domain, and
little research was directed to the interrelationships between different domains.

31
Recent research in laboratory settings suggested that the performance of cognitive and
postural control tasks simultaneously will adversely affect the performance of both tasks.29, 150-151
When clinical outcome measures are used to examine the relationship between different
domains, the evidence is less clear. Few studies have concluded that cognitive and motor effects
of concussion resolve differently after concussion.16, 216 Parker et al. have found a differential
rate of recovery by comparing the recovery pattern in ImPACT composite scores and different
dynamic motor tasks.216 The lack of correlation between measures of different domains has
sparked a b ig debate. For instance, while some view the lack of perfect correlation between
performance measures and self- report symptoms as an indication for the lack of sensitivity in
performance measures48 or an indication for the inaccuracy of self- report symptoms,21 others
speculate that they may represent fundamentally different neurobehavioral processes, and
therefore they should not be expected to correlate in all cases.14, 20, 104 Lovell et al. has concluded
that post concussion symptoms are a result of combinations of neurocognitive deficits and other
factors (e.g. vestibular dysfunction), and therefore the correlation (or lack thereof) between
symptoms and neurocognitive testing is expected to be less than perfect.104
Despite the conceptual debate about the reasons behind the correlation (or lack thereof)
between measurements from different domains, examining the correlation may enhance our
understanding about the multi-faceted nature of concussion effects and recovery. Preliminary
evidence from self- report symptoms revealed that balance problems were significantly
correlated with feeling mentally foggy, difficulty remembering, and difficulty concentrating.21
Recent work by B roglio et al. examined if the symptoms of feeling mentally foggy,
difficulty concentrating, and difficulty remembering are associated with decreased cognitive
performance (i.e. ImPACT composite scores). The results revealed a significant correlations

32
between feeling mentally foggy and reaction time, difficulty concentrating and verbal memory
score and between difficulty remembering and change in verbal memory composite score and
reaction time.21 In the same study Broglio et al. examined the relationship between self- report
“dizziness” and “balance problems” and Sensory Organization Test (SOT). The results
demonstrated a significant correlation between dizziness and change in the vestibular ratio of
SOT. The study also found a significant correlation between change in the total score of SOT,
change in the three ratios of SOT, and balance problems.21
In summary, preliminary evidence suggests the presence of a correlation between self-
reported symptoms related to cognition and neurocogntive testing performance. Also, a
correlation was found between self- reported symptoms related to balance and balance
performance. However, the evidence is less clear when the comparison is made between
neurocognitive testing and balance performance.
2.5 VESTIBULAR REHABILITATION FOR PATIENTS POST CONCUSSION
2.5.1 Evidence behind vestibular rehabilitation for concussion
The role of the vestibular system in balance and posture has been extensively studied and
numerous studies have found that impairments in vestibular function may lead to balance
disorders and dizziness.217-225 Although the effects are variable,226 many studies have
demonstrated that vestibular rehabilitation can help reduce dizziness and balance disorders.226-231
Post- traumatic dizziness (e.g. after concussion) is also suggested to be associated with
impairments in the peripheral vestibular system.42-43, 146-147, 232-233 Balance disorders after

33
concussion have also been attributed to dysfunction in sensory integration in which the vestibular
system is a key part of normal functioning.34, 42-43 Vestibular rehabilitation exercises may reduce
the dizziness and balance disorders after concussion.34, 44
Despite the high incidence of dizziness and balance dysfunction in people who have had
a concussion, reports of vestibular and balance rehabilitation in the management of concussion
are sparse.34, 44, 234-235 Previous studies have shown that vestibular rehabilitation reduces dizziness
and improves overall balance for individuals with head injury.39, 44, 236-237 The studies have also
emphasized that post traumatic dizziness can be caused by a wide array of dysfunctions in the
vestibular system, and therefore a customized impairment-based vestibular rehabilitation
program is recommended to successfully reduce the complaint of dizziness and improve balance
after concussion.33-34, 38, 238 Gurr et al. reported that vestibular rehabilitation comprised of graded
exposure to head and body movements, anxiety management, coping strategies and education
reduced complaints of vertigo and dizziness, and improved the balance of individuals standing
on an unstable surface.44 In another study, Hoffer et al. reported that in patients with mild TBI,
vestibular rehabilitation exercises consisting of an individualized program of somatosensory
exercises combined with aerobic activity, vestibuolo-ocular reflex, and cervico–ocular reflex
activities reduced complaints of dizziness and accelerated return to work.239 Although the use of
vestibular rehabilitation in the treatment of concussion-related dizziness and balance dysfunction
is promising, these studies were limited because of small sample size. It is also unclear if the
improvement made over the course of vestibular rehabilitation is due to the intervention or due to
the natural course of recovery. Without control group, it is difficult to attribute the improvement
to the provided intervention.

34
2.5.2 Outcome measures used in vestibular rehabilitation
The vestibular physical therapist uses many outcome measures to track recovery and perceived
improvement over the course of vestibular rehabilitation. These measures can be classified into
self- report and performance measures.
It has been reported that there could be a d iscrepancy between self- report and
performance measures of neurocognitive and balance functioning after concussion.21, 184 The
recent recommendations on concussion management have emphasized the use of both self-
report and performance measures to track the recovery of patients post concussion. For post
concussion patients treated with vestibular rehabilitation, it is not uncommon for the vestibular
physical therapist to employ a wide array of self- report and performance measures to track
recovery and make recommendations regarding discharge or return to work or practice.43 Self-
report and performance measures used in the dissertation research will be reviewed in the
Methods.
2.5.3 Limitations of previous work and rationale for proposed studies
The vestibular physical therapist can play a key role in a multidisciplinary management of
concussion by having a wide variety of assessment tools that cover multiple domains and by
providing an intervention that appears to be effective based on the small number of published
studies to date. However, in a multidisciplinary environment of concussion management,
vestibular rehabilitation lags behind other interventions used in concussion management. In order
for vestibular rehabilitation to be involved in an evidence-based medicine and cost driven health
care system, the limitations that surround the use vestibular rehabilitation in patients with

35
concussion need to be addressed. By overcoming the limitations mentioned below, vestibular
rehabilitation may have a greater role to play in the management of patients with concussion.
2.5.3.1 Rationale for the first study
Different gait and functional balance measures have been used to evaluate and re- assess the gait
and balance dysfunction in patients with vestibular disorders including patients with post-
concussion balance dysfunction. These measures are used as an indicator of the degree of
balance impairment after concussion, and the serial administration of these measures is used to
track the recovery of gait and balance function.
Many of the clinical decisions regarding the exercise initiation / progression or discharge
from vestibular rehabilitation therapy are often based on the scores obtained through the gait and
balance testing as well as symptom resolution. However, most of these measures were initially
developed to be used in middle aged and older adults and no study has investigated the reliability
and the normative scores of these measures in children between the age of 14 and 18. B y
providing specific normative scores for this age group, we will be able to use these normative
scores to determine the impact of concussion on children’s balance performance and it will allow
us to track the recovery process in children after concussion. The purpose of this study is to
provide normative data and to examine the reliability for clinical gait/ balance measures for
healthy high school aged children.
2.5.3.2 Rationale for the second study
The evidence behind vestibular rehabilitation in concussion management is sparse and largely
based on clinical experience and a small number of studies with small sample size and limited

36
methodological design. Dizziness and imbalance reported by pe ople who were referred for
vestibular rehabilitation after concussion has not been described.
It has not been established if the effects of concussion regarding dizziness and balance
dysfunction are the same for children and adults; children’s tolerance to biochemical changes
associated with concussion may be different from adults, and consequently the sequelae from
impacts of the same magnitude may be different between children and adults.4 In addition, the
role that is played by the continuous and rapid maturation in children’s cognitive abilities and
postural strategies in the recovery process is unknown.4, 64, 240-241 Despite all of these factors, the
above mentioned studies have not described whether the amount of recovery made in vestibular
rehabilitation was different between children and adults.4, 242-243
The second study will describe the severity of dizziness and balance dysfunction in
patients who were referred to vestibular rehabilitation after being diagnosed with concussion and
describe the outcomes of vestibular rehabilitation on dizziness and balance dysfunction after
concussion, and to test whether the amount of recovery is similar between children and adults.
2.5.3.3 Rationale for the third study
Although the individualized nature of the vestibular rehabilitation program for individuals after
concussion has been emphasized,244 an understanding of which specific exercises have been
prescribed for this population may be useful for several reasons. Assuming that the physical
therapists adhered to the problem-oriented approach described in vestibular rehabilitation
practice guidelines,244 the study can provide a detailed picture of the specific impairments and
functional limitations encountered by the individuals with concussion and the path by which they
returned to their pre-morbid status. Moreover, by understanding the prescription and progression

37
patterns provided by expert clinicians, physical therapists new to prescribing vestibular
rehabilitation exercises for patients with concussion can use this information to better understand
how to start and then make the exercises more challenging. Additionally, therapists can use the
framework of exercise categories, exercise groups and exercise modifiers to better document the
detailed prescription pattern of vestibular rehabilitation exercises.
In the previous proposed aim, a r eduction in dizziness and improvement in balance
occurred after patients with concussion received a v estibular rehabilitation exercise program
consisting of gaze stabilization, standing balance, and walking exercises. Consequently, the
purpose of this study is to describe exercise prescription patterns in patients treated with
vestibular rehabilitation exercises after concussion. The analysis will describe the progression of
the exercises and common exercise volumes for vestibular rehabilitation exercises used in the
management of individuals with dizziness and balance disorders after concussion.
2.5.3.4 Rationale for the fourth study
In examining the recovery process after concussion, clinicians and researchers assess a variety of
signs, symptoms, and physiological functions (e.g. sensory, cognitive, and motor).21, 62, 80, 124, 141
The diversity in measurements used to assess individuals with concussion has enhanced our
understanding of the multi-faceted nature of the effects after concussion, and improved the
sensitivity of the assessment battery available to record functioning in individuals with
concussion.20 A few studies have concluded that cognitive and motor effects of concussion
resolve differently after concussion.16, 216 Parker et al. have found a differential rate of recovery
by comparing the recovery pattern in ImPACT composite scores and different dynamic motor
tasks.216

38
The lack of correlation between recovery of measures of different domains has been a
subject of debate. 14, 20-21, 48, 104 For instance, while some view the lack of perfect correlation
between performance measures and self- report symptoms as an indication for the lack of
sensitivity in performance measures48 or an indication for the inaccuracy of self- report
symptoms,21 others speculate that they may represent fundamentally different neurobehavioral
processes, or exhibit different recovery trajectories, and therefore they should not be expected to
correlate in all cases.14, 20, 104 Lovell et al. has concluded that post-concussion symptoms are a
result of combinations of neurocognitive deficits and other factors (e.g. vestibular dysfunction),
and therefore, the correlation (or lack thereof) between symptoms and neurocognitive testing is
expected to be less than perfect.104
Despite the conceptual debate about the reasons behind the correlation (or lack thereof)
between measurements from different domains, examining the relationship among measurements
may enhance our understanding about the multi-faceted nature of concussion effects and
recovery. Collins et al. revealed a correlation between the neurocognitive testing scores and the
severity of headache post concussion.140 Preliminary evidence from a study that examined self-
report symptoms revealed that “balance problems” were significantly correlated with “feeling
mentally foggy”, “difficulty remembering”, and “difficulty concentrating”.21 In addition, these
symptoms were also associated with decreased cognitive performance (i.e. ImPACT composite
scores). In the same study Broglio et al. examined the relationship between self- report
“dizziness” and “balance problems” and the Sensory Organization Test (SOT). The study found
a significant correlation between change in the total score of the SOT to balance problems.21
The purpose of this study is to examine the relationship between self-reported symptoms,
neurocognitive performance and balance performance in individuals referred to vestibular

39
physical therapy after concussion, and to examine the relationship between recovery in gait and
balance measures and neuropsychological recovery made over the course of vestibular physical
therapy.

40
3.0 FIRST AIM
3.1 INTRODUCTION
The awareness of concussion injuries in high school aged children has increased substantially in
the last decade.64, 140, 174, 208, 245 Many studies have noted that high school athletes are more
susceptible to concussive injuries compared with older athletes.60, 63, 128, 197 Furthermore, high
school athletes may have prolonged recovery compared to older athletes in the domains of
neurocognition and symptom resolution.64-66, 139, 190 Memory function in college athletes has been
reported to return to the level of matched controls by day three post concussion whereas high
school athletes required seven days to return to normal memory function.64 Differences between
children and adults in glutamate sensitivity, tolerance to biomechanical changes after injury and
different psychosocial factors have been proposed to explain the different courses of recovery
between children and older individuals who sustain concussion.4, 57, 71, 192, 196 The differential rate
of recovery between children and adults led to a consensus that conservative management should
be used with children post-concussion.70, 84, 192-193 One of the principles of conservative
management includes not allowing return to play until the student-athlete achieves baseline (i.e.
pre-concussion) performance on t ests of neurocognitive function. In cases where baseline
performance measures do not exist, age-referenced normative scores for neuropsychological
testing are used to help assist in making decisions about return to play.18, 246 Additionally,

41
maturational changes in neurcognitive performance may dictate use of the age-referenced scores
if baseline testing has not been conducted recently.4, 125, 193-194, 247
Reports of dizziness and imbalance are prevalent in individuals who have had a
concussion.18, 170-171, 181-182 Estimates of the prevalence of persistent dizziness after mild
traumatic brain injury (mTBI) (i.e. concussion) varies between 1.2% to 32.5% depending on age
group and time of follow-up.170, 181,18, 21, 176, 182 Persistent balance problems have also been
reported after concussion.18, 21, 171 Vestibular rehabilitation is increasingly being used to manage
dizziness and balance disorders resulting from vestibular system dysfunction.226-231 Previous
studies have shown that vestibular rehabilitation may reduce dizziness and improve overall
balance for individuals with head injury.33-34, 39, 44, 248-249 Additionally, a recent report reported
that children with dizziness and balance disorders after concussion appear to benefit from
vestibular rehabilitation.249
For individuals treated with vestibular rehabilitation after concussion, it is common for
the physical therapist to employ a wide array of self- report and performance measures to track
recovery and make recommendations regarding discharge or return to work or athletic
participation.43, 144, 249-253 Many of the clinical decisions regarding the exercise initiation,
progression or discharge from physical therapy are based on the scores obtained through gait and
balance testing as w ell as presenting symptoms. Adolescents present a challenge for balance
assessment because they are too old for common developmental motor scales such as the
Bruininks - Oseretsky Test of Motor Proficiency (4.5 -14.5 years).254 Furthermore, there are no
estimates of reliability or normative scores in other common outcome measures utilized in
vestibular physical therapy that were developed for use in middle-aged and older adults, such as
the Activities – specific Balance Confidence (ABC) scale,255 the Dynamic Gait Index (DGI),256

42
the Functional Gait Assessment (FGA),257 gait speed (GS), the Timed “UP &GO” (TUG),258 and
the Five Times Sit to Stand (FTSTS) test.259 By providing specific normative scores for this age
group, we will be able to quantify balance impairments in children after concussion and assist
clinicians in making a better determination of when children are able to return to athletic
participation after concussion. Therefore, the purpose of this study is to provide normative scores
and determine the reliability of common clinical balance outcome measures in healthy children
between the ages of 14 to 18 years.
3.2 METHODS
3.2.1 Design
A cross-sectional sample of students in the 9th through the 12th grades was obtained through local
high schools. The study protocol was approved by the Institutional Review Board (IRB) at the
University of Pittsburgh and by the school board of the participating schools. An invitation letter
that described the purpose and the procedure of the study was sent to the parents. A total of 950
invitation letters were sent out. Students who were 18 years old provided informed consent and
students who were younger than 18 years of age provided assent after their parents provided
informed consent.

43
3.2.2 Subjects:
Ninety-one participants voluntarily enrolled from three local high schools in Allegheny County,
PA, USA. Two of the schools were private parochial schools in an urban location (one female
only, and one male only) and the other school was a public co-educational school in a suburban
school district. The participants were excluded if they had a previous history of self-reported
concussion or if they had a history of low back or lower extremity problems within three months
prior to the date of testing. The demographic characteristics of participants (age in years, height,
body mass) are summarized in Table 3-1. Participants were asked to report the duration of
participation in formal athletic practice for their high school or club teams (Table 3-2).
Participants also reported the duration of their recreational physical activities.
Table 3-1: Demographic Characteristics of participants
Male Female n 47 44 Age in years, n 14 .0 - 14.9 18 15 15.0 - 15.9 15 12 16 .0 - 16.9 8 11 17 .0 - 17.9 5 6 18.0 - 18.9 1 0 Age in years, mean (SD) 15.5 (1.1) 15.7 (.9) Mass in kg, mean (SD) 66 (17) 61 (11) Height in cm, mean (SD) 172 (10) 166 ( 6) Participation in formal sports Yes: 34
No: 13
Yes: 31
No: 13 n: Number of participants

44
Table 3-2: Number of participants who participated in formal athletic activities
3.2.3 Outcome measures
The ABC is a sel f-report questionnaire which was used to assess t he participant’s level of
confidence that they would not lose their balance while performing 16 functional activities.255
The highest possible score of 100 suggests maximum confidence and a score of 0
suggests no confidence.
The DGI is an eight item instrument that assessed the participants’ ability to walk on a
level surface, walk with head turns, walk with pivot turns, changes of speed, over and around
obstacles and up a nd down steps.256 The scale for each item ranges from 0-3, where 0 means
Formal athletic activities Number of participants Percent of total participants (%) None 26 28.6 Cross-country 11 12.1 Basketball 9 9.9 Soccer 7 7.7 Volleyball 7 7.7 Football 5 5.5 Lacrosse 5 5.5 Ice/ Field Hockey 4 4.4 Crew 4 4.4 Band 3 3.3 Softball 3 3.3 Baseball 2 2.2 Weight lifting 2 2.2 Gymnastics 2 2.2 Biking 2 2.2 Golf 1 1.1 Bowling 1 1.1 Wrestling 1 1.1 Tennis 1 1.1

45
severe impairment and 3 i ndicates normal performance. The highest possible score is 24. Its
concurrent validity has been established against the Berg Balance Scale in individuals with
vestibular disorders.260 It has been reported that DGI scores less than 19 are correlated with
reports of falls in community dwelling older adults and in individuals with vestibular
disorders.253, 261-262
The FGA is a 10-item test based on the DGI.263 The three new items introduced in the
FGA were gait with a narrow base of support, gait with eyes closed, and ambulating backwards.
The maximum score is 30. Higher scores indicate better performance. The FGA
demonstrated concurrent validity with other measures used in vestibular rehabilitation (r = .64 to
.80).257
Gait speed was recorded while participants ambulated at their comfortable speed over 4
meters using a standing start and over 6.1 m using a walking start. The participant was instructed
to “Walk to the other end of the course at your usual speed passing the marked line, just as if you
are walking down the street to go to the store.” The timing started when the first foot crossed the
start line, and ended when the first foot crossed the stop line.
The TUG is a timed test during which the participant stands from a chair, walks three
meters at their normal walking speed, returns to the chair and sits down.258 The participants were
instructed as follows: “When I say start, I want you to stand and walk at your usual speed to the
tape on the floor, and then come back and sit in the chair.” The timing began when the examiner
said “start” and ended when the participant’s buttocks touched the chair. The TUG has been
widely used in vestibular rehabilitation studies.264-267 It has been reported that slower TUG scores
(>11.5 sec) are correlated with reports of falls in individuals with vestibular disorders.253, 268

46
The FTSTS test requires participants to stand-up and sit down from a chair (43 cm high),
five times as quickly as possible. The participants completed the task with their hands crossed on
their chest.259 The instructions were: “I want you to stand up and sit down 5 times as quickly as
you can when I say “GO”. Stand up fully during each time. Do not touch the back of the chair
during each repetition. Keep your hands crossed on your chest.” The timing period began when
the examiner said “GO” and ended when the participant’s buttocks touched the chair on the fifth
repetition. The FTSTS test exhibited moderate correlation with gait and dynamic balance
measures in patients with vestibular disorders.269 The discriminative and concurrent validity of
the FTSTS test have been reported in patients with vestibular disorders.252
The Balance Error Scoring System (BESS)270 is a component of the Sport Concussion
Assessment Tool 2, r ecommended by the Consensus Statement on Concussion in Sport.70 The
BESS requires participants to maintain balance with eyes closed with their hands on their iliac
crests under six different conditions:270 1) firm surface, feet together, 2) firm surface, single leg
stance, 3) firm surface, tandem stance, 4) foam surface, feet together, 5) foam surface, single leg
stance, and 6) foam surface, tandem stance. E ach trial was 20 seconds.270 The scores were
calculated by counting the total number of errors. Errors could be any of the following:1) hands
lifted off the iliac crests, 2) opening eyes, 3) a step, stumble or fall, 4) moving the hip into >30
degrees of abduction or flexion, 5) lifting the forefoot or heel, or 6) remaining out of the test
position for > 5 seconds. The maximum number of errors in each trial was 10 and the maximum
number of errors in total was 60. A systematic review has concluded that the BESS demonstrated
moderate to good reliability and correlated well with other measures of balance using testing
devices.271

47
3.2.4 Procedure
After the demographic and athletic participation information was recorded, participants
completed the ABC. Participants then went to one of the three stations where the tests were
performed: 1) GS, TUG, and FTSTS, 2) DGI/FGA, and 3) the BESS. Participants performed the
testing in a pseudo- random order based on test station availability. Two consecutive trials of gait
speed, TUG, and FTSTS were performed by the same examiner. In a sample of 61 participants
who were examined by one of the raters, the two consecutive trials were used to calculate the
test-retest reliability for the gait speed, TUG and FTSTS. Seven raters who were licensed
physical therapists and routinely administered the tests participated in DGI/FGA scoring, and six
physical therapy graduate students participated in the scoring of GS, the TUG and the FTSTS.
Reliability training was provided to all examiners before the testing started and the
differences in timed tests between examiners was 0.1 sec. In a subset of the high school students
(n = 23), an electronic timing device was used to record gait speed so that validity of the
therapist administered gait speed could be determined.
The BESS performance was videotaped for later scoring using a cam era placed three
meters from the participants, perpendicular to the frontal plane in quiet standing. The participant
was facing the camera while performing the six different conditions. Inter- rater reliability was
examined using two Doctor of Physical Therapy student raters who were provided with written
instructions and trained to score the BESS.

48
3.2.5 Statistical analysis:
Statistical analyses were conducted to determine if there were any associations between the
subject demographic variables and the outcome measures. An independent t-test was performed
to examine if there was an effect of gender or athletic participation on the normally distributed
scores. Non-parametric Mann-Whitney U test was used to examine the effect of gender or
athletic participation on the non interval measures of ABC, DGI, FGA and the total BESS score.
Correlation analyses were performed to examine the relationship between age, height,
body mass and the performance of gait and balance measures. Pearson correlation coefficients
were calculated for normally distributed variables, and the Spearman-rho correlation coefficient
was calculated for variables not normally distributed.
For the total score of each outcome measure, scores were calculated at the 5th, 25th, 50th,
75th, and 95th percentiles. In addition, percentile scores were calculated for the individual items
of the ABC, DGI and FGA. To determine reliability of GS, TUG and FTSTS, the intraclass
correlation coefficient (ICC) was computed using the 2 way mixed model for the single measures
(3, 1). From the ICC analysis, the 95% confidence interval, the standard error of measurement
(SEM) and minimal detectable change (MDC) were calculated. The validity of clinician
administered gait speed was tested against the electronic timing device by computing the ICC,
using the two-way mixed model for single measures.
The inter-rater reliability of the total BESS score was examined by using the two-way
mixed ICC model (random subjects, fixed raters, absolute agreement). Percent agreement,
expected agreement and weighted kappa were calculated for the six individual conditions.

49
3.3 RESULTS
Of the 108 participants who consented, 17 were excluded from the study due to previous history
of concussion or a recent lower extremity injury. Ninety one participants participated in the study
(47 M/44 F). The majority of the participants (65%) were younger than 16 years old (Table 3-1).
Twenty- nine percent of the participants were not involved in any formal athletic
participation (Table 3-2). For the participants who were involved in formal athletic participation,
cross country running was the most common sport (11 participants). Three hours per week was
the most common duration of formal practices (9 participants) followed by two hours per week
(8 participants). However, the median was 7 hours per week (range: 1- 27 hours). An
independent t-test was performed to examine if the participants with no formal practice were
significantly different in the performance on any of the administered measures. The results
demonstrated that the group with no formal athletic performance had significantly worse scores
on the FTSTS (M =8.1, SD =1.4 s) compared with the group with formal athletic practice (M =
7.3, SD=1.3 s), (t89 = 2.4, p = .016).
There were no significant differences between males and females except for the ABC
where male participants exhibited higher scores (M = 95, SD = 5) compared to female (M =92,
SD = 7), (U = 762, p = 0.03). There was no significant correlation between height, weight and
any of the administered measures. Age demonstrated a significant positive correlation with the
TUG scores, (Spearman rho = 0. 27, p =.001).

50
3.3.1 Reference values
The percentile reference scores for the ABC, DGI, FGA, TUG, GS (4m & 6.1 m) and FTSTS are
detailed in Table 3-3. The distributions of timed performance tests of the TUG, GS and FTSTS
were normal and did not exhibit ceiling or floor effect. Additionally, the percentile score for gait
speed measured over a course of 4 m and 6.1 m revealed that walking speed was generally faster
when tested over the course of 6.1 m (walking start). A ceiling effect was observed with the
ABC, DGI, and FGA outcomes as demonstrated by the similarity of the scores from 50th to 95th
percentile.
Table 3-3: Percentile scores for the outcome measures (n = 91)
Percentile 5 25 50 75 95 Activities – specific Balance
Confidence Scale (ABC) 79 91 95 98 99
Dynamic Gait Index (DGI) 22 23 24 24 24 Functional Gait Assessment
(FGA) 26 28 29 30 30
Gait speed over 4m (m/sec) Standing start 0.84 1.09 1.19 1.29 1.46
Gait speed over 6.1 m (m/sec)
Walking start 1.03 1.23 1.32 1.44 1.69
Timed “UP &GO” (sec) 6.1 6.9 7.5 8.3 9.3 Five Times Sit to Stand (sec) 5.4 6.7 7.5 8.4 9.8
Table 3-4 demonstrates the ceiling effect in more detail by listing scores for the
individual items of the ABC. A full confidence score of 100 was rated by 75% of the participants
for 6 items, and by 50% for an additional 5 items. A closer inspection of the individual items of
the ABC revealed that the question “Walk outside on icy sidewalks?” and “Step onto or off an
escalator while you are holding onto parcels such that you cannot hold onto the railing?” were
the two items on the ABC scale in which subjects had the least confidence in performing. The

51
DGI also demonstrated a ceiling effect in which the full score (24/24) was achieved by more than
50 percent of the participants. To a lesser extent, the FGA also exhibited a ceiling effect in which
the optimal score was achieved by at least 25 % of the participants. The FGA percentile scores
revealed that gait with eyes closed was the most difficult item. A score of 3 (full score) was
achieved for all other items by 75 % of the participants (Table 3-5).
Table 3-4: Percentile scores for individual items on the Activities-specific Balance Confidence (ABC)
Scale (n =91)
Percentile 5 25 50 75 95 Walk around the house? 90 100 100 100 100 Walk up and down the stairs? 80 90 100 100 100 Bend over and pick up a slipper from in front of a closet door? 80 90 100 100 100
Reach for a small can off a shelf at eye level? 90 100 100 100 100
Stand up on t ip toes and reach for something above your head? 70 80 90 100 100
Stand on a chair and reach for something? 70 80 90 100 100
Sweep the floor? 80 100 100 100 100 Walk outside the house to a car parked in the driveway? 90 100 100 100 100
Get into or out of a car? 80 90 100 100 100 Walk across the parking lot to a mall? 90 100 100 100 100
Walk up or down a ramp? 80 100 100 100 100 Walk in a crowed mall where people rapidly walk past you? 70 90 100 100 100
Are bumped into by p eople as you walk through the mall? 60 80 90 100 100
Step onto or off of an escalator while you are holding onto a railing? 70 90 100 100 100
Step onto or off an escalator while you are holding onto parcels such that you cannot hold onto the railing?
50 80 90 100 100
Walk outside on icy sidewalks? 40 70 80 90 100

52
Table 3-5: Percentile scores for individual items on the Functional Gait Assessment (FGA)
Percentile 5 25 50 75 95 Gait Level Surface 2 3 3 3 3 Change In Gait Speed 2 3 3 3 3 Gait With Horizontal Head Turns 2 3 3 3 3
Gait With Vertical Head Turns 3 3 3 3 3 Gait And Pivot Turn 3 3 3 3 3 Step Over Obstacle 2 3 3 3 3 Gait With Narrow Base Of Support 2 3 3 3 3
Gait With Eyes Closed 0 2 3 3 3 Ambulating Backwards 2 3 3 3 3 Stair Climbing 2 3 3 3 3
The BESS test demonstrated variability in scores depending on the six conditions (Table
3-6). The condition of single leg stance on f oam surface was the most difficult condition,
followed by the conditions of single leg stance on a flat surface and tandem stance on a foam
surface where these two items were almost equally difficult. Stance with feet together exhibited a
ceiling effect in which the majority of participants did not commit any errors except a few
participants who had one error while the task was performed on the foam surface.

53
Table 3-6: Percentile scores for the Balance Error Scoring system (BESS). Lower scores indicate
“better” performance on the BESS
Percentile
5 25 50 75 95 Firm surface, feet together 0 0 0 0 0 Firm surface, single leg stance 0 1 2 4 7 Firm surface, tandem 0 0 0 1 4 Foam surface, feet together 0 0 0 0 1 Foam surface, single leg stance 2 5 7 10 10 Foam surface, tandem 0 1 3 4 7 Total BESS scores 4 10 13 18 24
3.3.2 Reliability analysis
The test retest reliability for the gait speed, TUG and FTSTS ( n = 61q) with 95% confidence
interval, SEM and MDC are summarized in Table 3-7. Gait speed measured over the course of
6.1 m using a walking start exhibited similar values for reliability coefficient, SEM and MDC
compared to gait speed measured over a course of 4 m using a standing start. The ICC for
clinician administered gait speed vs. electronic timing was 0.98 with 95% CI (0.95 - 0.99).
Table 3-7: Reliability coefficients, standard error of the measurement (SEM), and minimal
detectable change (MDC) for the timed measures (n = 61)
ICC (95 %CI) SEM MDC
Gait speed (4 m) 0.81 (0.71 - 0.88) 0.07 m/sec 0.18 m/sec Gait speed (6.1 m) 0.79 (0.67 - 0.87) 0.07 m/sec 0.21 m/sec Timed “UP&GO” 0.84 (0.75 - 0.90) 0.3 sec 0.9 sec Five Times Sit to Stand 0.91 (0.86 - 0.95) 0.1 sec 0.4 sec
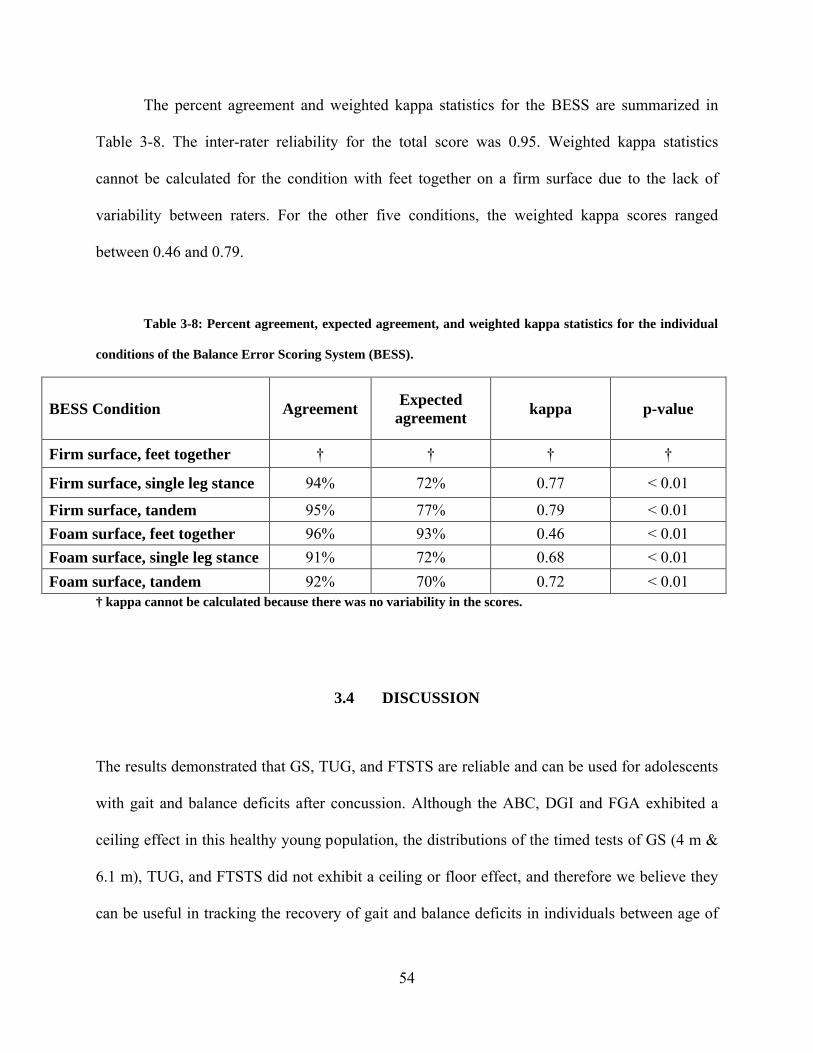
54
The percent agreement and weighted kappa statistics for the BESS are summarized in
Table 3-8. The inter-rater reliability for the total score was 0.95. Weighted kappa statistics
cannot be calculated for the condition with feet together on a firm surface due to the lack of
variability between raters. For the other five conditions, the weighted kappa scores ranged
between 0.46 and 0.79.
Table 3-8: Percent agreement, expected agreement, and weighted kappa statistics for the individual
conditions of the Balance Error Scoring System (BESS).
BESS Condition Agreement Expected agreement kappa p-value
Firm surface, feet together † † † †
Firm surface, single leg stance 94% 72% 0.77 < 0.01
Firm surface, tandem 95% 77% 0.79 < 0.01 Foam surface, feet together 96% 93% 0.46 < 0.01 Foam surface, single leg stance 91% 72% 0.68 < 0.01 Foam surface, tandem 92% 70% 0.72 < 0.01
† kappa cannot be calculated because there was no variability in the scores.
3.4 DISCUSSION
The results demonstrated that GS, TUG, and FTSTS are reliable and can be used for adolescents
with gait and balance deficits after concussion. Although the ABC, DGI and FGA exhibited a
ceiling effect in this healthy young population, the distributions of the timed tests of GS (4 m &
6.1 m), TUG, and FTSTS did not exhibit a ceiling or floor effect, and therefore we believe they
can be useful in tracking the recovery of gait and balance deficits in individuals between age of

55
14 and 18. In addition, the inter-rater reliability of the BESS is excellent when performance is
video-recorded and scored at a later time.
3.4.1 Reference values
Review of the normative scores revealed that the ABC, DGI and FGA had a ceiling effect, which
may limit their usefulness in this population. A potential alternative to using the full ABC is to
use the recently evaluated ABC-6 questionnaire, an abbreviated version of the full ABC that
includes item numbers 5, 6, 13, 14, 15, a nd 16 and is suggested to have psychometric properties
analogous to the full ABC questionnaire.272 A closer look at the individual items of the ABC in
the current study revealed that the items included in the ABC-6272 exhibited lower scores and had
more variation than other items in the full version of ABC. However, a validation study is
needed before a recommendation is made to adopt the use of an abbreviated version over the full
version of ABC.
The performance measures of the DGI and FGA also exhibited a ceiling effect,
suggesting that these tests do not assess higher level balance abilities that children in this age
range may possess. Therefore, a return to “normal” on these tests may not indicate that they have
fully achieved their pre-morbid balance capability. Since the FGA has less of a ceiling effect
compared to DGI in this age group, the use of the FGA is recommended over the DGI. These
findings emphasize the importance of using comprehensive assessment measures; this
conservative approach is in line with the recent recommendations on concussion management
endorsed by the National Athletic Trainers Association and the 3rd International Conference on
Concussion in Sport.70, 84

56
To the best of our knowledge, there are no age-specific normative reference scores
available for the DGI. One study provided normative reference values for the FGA;273 the study
included community dwelling older adults between the ages of 40 to 89 years and the normative
reference values for each decade. The study did not include participants younger than 40 years
based on the assumption that FGA performance is not expected to decline with age until middle
age or later. The mean score and range obtained for the participants between 40 and 49 years was
29 (range 24-30) which matches the median score and range obtained in our study.273 The item
of ambulating backward was reported to be the most difficult item in this study and in the study
of Walker et al.273 A comparison of the performance on i ndividual items revealed that a full
score of 3 was achieved by more than 50% of our participants for all items. However,
participants between 40 and 49 years old exhibited average scores that were less than 3 on the
items of gait on level surface, gait with eyes closed, and ambulating backwards.
Examination of the normative values showed that gait speed was faster when measured
over 6.1 m compared with 4 m, which can probably be explained by the difference in the
initiation of movement.
Over the course of 4 m, the participants initiated walking at the start line. However, over
the 6.1 m course, walking was initiated one meter before the starting line. This difference in
walking speed between the two methods suggests that clinicians should be consistent with their
method of administration of gait speed and use the appropriate norms. A previous study
established normative scores for participants that were similar to our age range.274 However, the
previous normative reference values were provided separately for male and female participants.
This is in contrary to our findings that there was no gender effect on gait speed in this age
range. Nonetheless, the median gait speed of the 6.1 m reported in our study (1.32 m/ sec) is

57
consistent with the means provided for males (1.35 m/sec) and females (1.24 m/sec) between 15
and 19 years old.274
The positive correlation between age and the TUG scores was unexpected and may be
related to the casual walking pattern exhibited by many of the older students, or the limited
number of older participants. The difference in the FTSTS scores between participants who were
involved in formal athletic practice and those who are not involved in athletic practice was also
unexpected. The participants were instructed to perform the task as quickly as possible;
therefore, participants with formal sports practices may have demonstrated better functional
lower extremity strength, which is known to affect the repetitive sit to stand performance,
compared to participants with no formal athletic involvement.275 Although exploring the
differences in FTSTS scores between different sports would be of interest, this goal was
unattainable with the limited number of participants in each sport category. Overall, the absence
of a relationship between age, gender, height and body mass to most of the administered
measures suggests the normative reference values provided in this manuscript can be used for all
individuals in this age range.
The distribution of total BESS scores appear to be similar to several previous studies of
high school and college-age subjects that have examined BESS performance in the context of
differentiating athletes with and without concussion and also for different sports.31, 144, 173, 276-278
The median number of errors accumulated in this age group (13 errors) compares well to
the average number of errors accumulated in high school and collegiate athletes without history
of concussion (range 12 to 13 errors).31, 173, 270, 277-278 One benefit of the current study is that it
also provides percentile values for each of the individual conditions. Compared with previous
studies of high school aged subjects,277, 279 the median values of the individual conditions are

58
similar to the average values of the previous studies, except for the single leg stance on foam
condition, which had a higher number of errors in the current study (7 vs. 4 to 5). Differences in
reference values of the BESS across the different studies can be attributed to several factors,
including inherent differences in balance performance across different age ranges and sport
abilities, disparate scoring methods (i.e. direct observation vs. Videotaping), rater experience,
and participant learning effects. Regarding balance abilities of different sports, female gymnasts
accumulated an average of 9.1 errors, female collegiate soccer players had 12.5 errors, and
female basketball athletes accumulated 14.1 errors.276 Clinicians who intend to use these scores
are encouraged to consider the limitations of these reference values and are encouraged to
consider the degree to which their patients match the participants included in this study.
3.4.2 Reliability analysis:
The reliability for the timed measures examined in this study (GS, TUG, and FTSTS) ranged
between 0.79 and 0.91, suggesting that these measures have moderate to good reliability and can
be used during vestibular rehabilitation for this age group. For the FTSTS, the ICC score
reported in the present study [0.91 (95% CI 0.86 - 0.95)] falls in the wide range of reliability
coefficients previously reported in other populations [0.64 - 0.99].259, 280-284 Test-retest reliability
of TUG and GS were lower in this group of adolescents than what has been published for older
adults. Reliability of the TUG generally is greater than 0.9,258, 285 although the reliability has
been reported as low as 0.5.286 Similarly, reliability of gait speed has been reported at 0.9 and
above.285, 287 It is unclear why adolescents have lower test-retest reliability for walking speed
demonstrated by the GS and TUG measures.

59
The inter-rater reliability ICC for the total BESS score was 0.95. This score is higher than
inter-rater reliability scores previously reported. McLeod reported an inter-rater ICC score of
0.85 in a sample of female high school basketball players.277 While the inter-rater reliability
scores for individual conditions have ranged from 0.78 to 0.96.270 However, Finnoff et al. has
reported an ICC score of 0.57 in a sample of 30 college athletes.288 Several reasons may have
contributed to the differences in inter-rater reliability reported among the studies. Our sample
size of 91 participants was much higher than the other two studies, which may suggest that the
previous studies were underpowered; in McLeod et al,277 although the overall sample consisted
of 62 pa rticipants, the analysis of inter- rater reliability was conducted only for a subset of this
sample and there were no f urther demographics details provided for the reliability subset
provided.277 The other study by Finnoff et al included a sample size of 30 participants that were
rated by three raters.288 The balance abilities of the subjects may also have played a role. Our
participants were different than participants reported in other studies as in Finoff et al’s study
where participants were described as “athletes” with no further description, while McLeod et al’s
study consisted of female basketball players.277 However, our study included athletic and
nonathletic male and female participants. This may have led to a larger variability in scores and
improved the ICC value. Additionally, the raters in our study scored the BESS performance by
viewing a videotape; this is contrary to McLeod et al. in which the BESS was scored by direct
observation.277 Although Finnoff et al have used videotapes for scoring,288 their ICC score was
much lower than ours; it is unclear if the self-selected pace of viewing the videotapes used in our
study improved the reliability, whereas in the Finnoff et al’s study the examiners were asked to
score 30 participants consecutively in the same session and therefore, fatigue may have resulted
in less accurate scoring.289
60
3.5 LIMITATIONS
Due to recruitment difficulties for students in the upper grades of high school, the majority of our
participants were 14 & 15 years old. However, age was not found to have an effect on t he
balance tests (except TUG) and therefore, the normative scores presented in the study can be
used for all high school age students. In addition, the participants in this study were students
from private and suburban schools in one geographic area. They may represent certain
socioeconomic status (SES) and may not reflect the wide spectrum of high school aged children.
3.6 CONCLUSION
These normative scores provide a r eference for interpreting the performance of common
functional gait and balance measures for individuals between 14 and 18 years of age who require
vestibular rehabilitation, such as individuals who sustain concussion. These normative scores
may provide end points for discharge from the vestibular physical therapy. Age did not affect the
performance of the administered measures (except TUG). Therefore, the normative scores
presented in the study can be used for all high school age students. The inclusion of non athletic
participants makes the normative scores presented in this manuscript applicable for both athletes
and non athletes who might be susceptible to mild TBI.

61
4.0 SECOND AIM
4.1 INTRODUCTION
Concussion is one of the most prevalent acquired neurological conditions occurring in children
and young a dults.8, 186 According to the Centers for Disease Control (CDC), concussion is
synonymous with the term “mild TBI”.186 Using the definition proposed by t he CDC,186
concussion is “a complex pathophysiologic process affecting the brain, induced by traumatic
biomechanical forces secondary to direct or indirect forces to the head. It is caused by a blow or
jolt to the head that disrupts the function of the brain. This disturbance of brain function is
typically associated with normal structural neuroimaging findings (i.e., CT scan, MRI). It results
in a constellation of physical, cognitive, emotional and/or sleep-related symptoms and may or
may not involve a loss of consciousness (LOC).” Duration of symptoms is highly variable and
may last from several minutes to days, weeks, months, or even longer in some cases. Some
factors which may contribute to prolonged recovery include loss of consciousness, amnesia, and
confusion;290 however, our understanding of this issue is still very limited.
Dizziness is a frequent symptom of concussion and has been reported in range from 23%
- 81% of cases within the first days post-injury. Estimates of the prevalence of persistent
dizziness after mTBI varies widely from 1.2% at 6 months to 32.5% at five years183, 291-293 Poor

62
balance and postural instability have been reported in many studies post- concussion,13, 48, 294 and
have been correlated with dysfunction in sensory integration.146, 295
Despite the high incidence of dizziness and balance dysfunction in people who have had
a concussion, reports of vestibular and balance rehabilitation in the management of concussion
are sparse.34, 44, 234-235 Part of the reason for the lack of information is that in many cases,
symptoms resolve relatively quickly before referrals to tertiary providers can be made. In one
study, over 75% of high school football players returned to play within 3 weeks of their
concussion.296 The use of vestibular rehabilitation in the treatment of concussion-related
dizziness and balance dysfunction has been promising, although Shepard et al.235 commented
that the duration of vestibular rehabilitation is longer in people with head injury compared with
unilateral peripheral vestibular dysfunction.
It has not been established if the effects of concussion regarding dizziness and balance
dysfunction are the same for children and adults. It is also unclear whether the amount of
recovery form dizziness and balance dysfunction is different between children and adults after
concussion. 4, 242-243 Children’s tolerance to biochemical changes associated with concussion may
be different from adults, and consequently the sequelae from impacts of the same magnitude may
be different between children and adults.4 Furthermore, the role that it is played by the
continuous and rapid maturation in children’s cognitive abilities and postural strategies in the
recovery process is unknown.4, 240, 242, 297
The purpose of this retrospective study was to describe the severity of dizziness
symptoms and balance dysfunction reported by people who were referred for vestibular
rehabilitation after concussion. Furthermore, this study described the outcomes of vestibular

63
rehabilitation on r educing dizziness and balance dysfunction, and described if the amount of
recovery during vestibular rehabilitation was different between adults and children.
4.2 METHODS
4.2.1 Participants
A retrospective case series was performed of 114 consecutive participants, including children,
who were referred between 2006 a nd 2008 to a tertiary balance center for vestibular
rehabilitation after being diagnosed with a concussion. For the purpose of this study, children
were defined as 18 years and younger, and the adults were defined as older than 18 years. The
median age for children (45 female, 22 male) was 16 y with a range of 8 to 18 y, and the median
age for the adults (25 female, 22 male) was 41 y w ith a range of 19 to 73 y. Of the 114
participants who were examined, 84 had more than one visit and 30 had a single visit. The study
was approved by Institutional Review Board (IRB) at the University of Pittsburgh.
4.2.2 Intervention and outcome measures
The vestibular rehabilitation intervention consisted of a customized program that was tailored to
each subject’s impairments and functional limitations that related to dizziness, ocular motor
function, and balance function. 298 The categories of exercises most frequently provided in
treatment and in the home exercise program included gaze stabilization exercises (e.g. VOR x1
in sitting and standing), standing balance (e.g. standing with feet apart, feet together, on foam,

64
with eyes open and closed), ambulation (e.g. walking with head turns, tandem walking, obstacle
avoidance) and in a few cases, canalith repositioning manuevers. Exercises were prescribed to be
done daily.
Self-report and performance measures were administered at the initial evaluation as well
as at weekly and monthly intervals. The time points considered for this report include the initial
evaluation and discharge scores. If a measure was not recorded at the time of initial evaluation or
discharge, the assessment at the time point closest to the time of initial evaluation or discharge
was used.
4.2.2.1 Self-report measures
Participants were asked to rate their current dizziness severity on a v erbal scale from 0-100,
where 0 means no dizziness and 100 means maximum dizziness. Verbal anchors relating to
severity of dizziness (e.g. slight, mild, moderate, severe) were provided for the scale. In addition,
participants were asked to describe their dizziness using any of the following non-exclusive
terms: spinning, lightheadedness, off balance, nausea, sensation of motion, and other.
The Activities-specific Balance Confidence scale (ABC) is a questionnaire used to assess
the respondent’s level of confidence that they would not lose their balance while performing 16
functional activities. The highest possible score of 100 suggests maximum confidence and a
score of 0 suggests no confidence.255
The Dizziness Handicap Inventory (DHI) is an instrument used to assess the individual’s
handicap due to their dizziness in 25 items relating to physical, emotional, and functional
domains. The highest overall score on the test is 100 and higher scores indicate greater handicap
resulting from dizziness.299

65
4.2.2.2 Gait and balance Performance measures
The Dynamic Gait Index (DGI) is an eight item instrument that assesses the ability to walk with
head turns, changes of speed, and around obstacles. The scale for each item ranges from 0-3,
where 0 means severe impairment and 3 means normal. The highest possible score is 24.256
The Functional Gait Assessment (FGA) is a 10-item test based on the DGI. The
maximum score is 30. Higher scores indicate better performance.263
While participants were asked to walk at their comfortable speed, gait speed was timed
over 4 meters course using stopwatch.
The Timed “Up& Go” (TUG) is a timed test during which the participant stands from a
chair, walks three meters at their normal walking speed, and returns to the chair.258
The Five Times Sit To Stand (FTSTS) requires participants to stand-up and sit down
from a standard height chair five times as quickly as possible. The participants were asked to
complete the task with their hands crossed on their chest.259
Dynamic Computerized Posturography: Participants performed the Sensory Organization
Test (SOT, Neurocom, Inc.) under six different sensory conditions:1) eyes open, fixed support;
2)eyes closed, fixed support; 3)sway-referenced vision, fixed support; 4) eyes open, sway-
referenced support; 5) eyes closed, sway-referenced support; 6) sway-referenced vision and
support surface. Three 20 s trials were performed for each condition. The highest theoretical
equilibrium score is 100 which indicates no sway; losses of balance were graded as zero.
Average scores for each condition were recorded, and the composite score was calculated
using a weighted average of the individual trials.

66
4.2.3 Statistical analysis
The process of care including time between the concussion and initial evaluation for vestibular
rehabilitation, number of visits, and duration of treatment is summarized by descriptive statistics.
4.2.3.1 Process of care
The non-parametric Mann-Whitney U test was performed to examine if there was a significant
difference between participants who continued after initial evaluation and those who did not for
the time between concussion onset and initial evaluation for vestibular rehabilitation therapy.
The Mann-Whitney U test was also performed to examine if there a significant difference
in treatment duration, and number of visits between children and adults who received vestibular
rehabilitation therapy.
4.2.3.2 Outcome measures
Independent t-tests were performed to determine if there was a difference in outcome measures
at initial evaluation between participants who were referred to vestibular rehabilitation therapy
but did not continue after their initial evaluation, and those who continued their intervention.
Independent t-tests also were performed to see if there was a difference in outcome
measures between children and adults at the time of initial evaluation. For the independent t-test,
Levine’s test of equality of variance was examined. In those outcome measures that did not have
equal variance, the p-value from the test that did not assume equal variances was used.
For the participants who had at least 2 visits, a mixed-factor repeated measures analysis
of variance was performed on each outcome measure to see if there was an effect of time, age
group, and interaction (time*age). The within-subjects factor was time with two levels (pre-

67
treatment and post-treatment). The between-subjects factor was the age group with two levels
(children 18 years and younger, and adults). For each outcome measure, only the participants
who had data at both time points were included in the repeated measures ANOVA, and the
sample size is reported for each. For all analyses, the level of significance was α = 0.05.
4.3 RESULTS
The vestibular rehabilitation was provided by 8 physical therapists; two of the therapists treated
approximately 44% and 27% of the cases. The most frequent description of dizziness was a
complaint of being “off balance” in 68% of the participants, followed by “ lightheadedness”
(54%), “spinning” (46%), “nausea” (38%) and “sensation of motion” (23%). “Off balance” was
the most frequent description in both children and adults. Five participants had BPPV. One of
participants with BPPV did not return after his initial visit. Three participants had pure BPPV,
and a canalith repositioning maneuver was used as the only intervention. Finally, the fifth
participant with BPPV also had other dizziness and balance dysfunction that was treated with a
customized program in addition to the canalith repositioning maneuver.
4.3.1 Process of care
Of the 114 participants, 30 received an initial evaluation without returning for a second visit.
Reasons for not returning included: physical therapy was not indicated (n = 6), the
participant lived far away (n = 8), and noncompliance (n = 16). The 2 groups of participants who
came only for initial evaluation and those who returned for more visits did not differ based on

68
age (t 112 = 1.1, p = 0.31), gender ( 2χ = 2.6, p = 0.11), or duration of time between the
concussion and referral to the vestibular rehabilitation clinic (median 61, range 6 - 2566, Mann-
Whitney U = 717, p =.07, Table 4-1).
Eighty-four (84) participants returned for at least 1 additional visit, and the median
number of visits was 4 (range 2-13), occurring over a median duration of 33 (range 7-181) days.
There was no significant difference between children and adults in the number of visits
(Mann- Whitney U = 730, p = .323) or treatment duration (Mann- Whitney U = 723, p = .363).
4.3.2 Outcome measures at initial evaluation
Outcome measures obtained during the initial evaluation for all 114 participants are reported in
Table 4-1. Participants who did not continue after initial evaluation had significantly better
scores on the dizziness severity, ABC, DHI, DGI, FGA, Gait Speed, and FTSTS (p < 0.05). The
FTSTS was the only outcome measure that was significantly different between the children and
the adults at the time of initial evaluation, with children having faster performance (children 9.7
+ 3.5 s, adults 13.2 + 5.4 s, t 49.8 = - 3.3, p = .002).

69
4.3.3 Change in outcome measures
For participants who had received vestibular rehabilitation therapy, there was a significant time
effect for all of the self-report and performance measures (Table 4-2).
Table 4-3 displays the outcome measures in which there was a s ignificant interaction
between time and age. There was a significant interaction between time and age for dizziness
severity (F 1, 62 = 8.6, p = .005). Post hoc analysis revealed that after treatment, children’s
dizziness severity was reduced by mean of 19 points (F 1, 40 = 31.0, p <.001). However, there was
no significant difference in dizziness severity for the adult group between pre-treatment and
post-treatment time points (F 1, 22=.06, p = .805) (Table 4-3). There were also significant
interactions between time and age for Conditions 1 and 2 of the SOT (F 1, 19 = 6.7, p = .018 and F
1, 19 = 5.9, p = .025 r espectively, Table 4-3). In both conditions, children had significant
improvement in their scores (p < .01). However, there was no significant improvement for adults.
Only three of the measures demonstrated a significant age effect collapsing across time.
Children demonstrated significantly lower (better) scores in DHI (36 + 6) compared with
adults (46 + 20) (F 1, 67 = 5.8, p = .019). Children showed significantly higher scores on the FGA
(25 + 2) compared with adults (23 + 3) (F 1, 46 = 5.0, p = .030). Children also had lower FTSTS
(9.5 + 2.6 s) compared with adults (13.8 + 5.8 s) (F 1, 34 = 8.7, P = .006).

70
Table 4-1: Mean (SD) of demographic and outcome measures at time of initial evaluation for
vestibular rehabilitation, according to those participants who had evaluation only, and those who returned
for a least 1 additional visit
Outcome measure Evaluation only (n=30)
Intervention (n = 84)
Statistic, p-value†
Gender 15 F, 15 M 56 F, 28 M 2χ = 2.6, p = 0.106 Age (y) 28 (16) 25 (15) t 112 = 1.1, p = 0.314 Median (range) days from concussion to evaluation
96 (8 – 2566) 58 (6 – 1149) U = 717, p = 0.07
Dizziness Severity (63 children, 46 adults)
11 (20) 23(21) t 52.1 = -2.8, p = .008*
ABC (65 children, 46 adults) 78 (25) 65(28) t 109 = 2.2, p =.028* DHI (66 children, 46 adults) 37 (19) 48 (22) t 110 = - 2.5, p = .014* DGI (60 children, 36 adults) 22 (3) 21 (3) t 94 = 2.3, p = .027* FGA (60 children, 36 adults) 27 (5) 24(5) t 94 =2.5, p = .013* Gait Speed (61 children, 38 adults) 1.21 (.23) 1.07 (.26) t 97 = 2.2, p = .033* TUG (s) (51 children, 32 adults) 7.9 (1.5) 9.0 (2.3) t 81 = -1.8, p = .070 FTSTS (s) (50 children, 33 adults) 7.9 (2) 11.7 (5) t 47.4 = - 4.8, p < .001* SOT(Composite) (38 children, 21 adults) 70 (12) 55 (20) t 57 = 1.7, p = .083 SOT Condition1 (38 children, 20 adults) 83 (16) 88 (11) t 5.5 = -1.1, p = .482 SOT Condition 2 (38 children, 20 adults) 85 (12) 80 (15) t 56 =.71, p = .478 SOT Condition 3 (38 children, 20 adults) 86 (9) 75 (22) t 56 = 1.2, p = .251 SOT Condition 4 (38 children, 20 adults) 74 (9) 53 (26) t 18 = 4.1, p < .001* SOT Condition 5 (38 children, 20 adults) 52 (15) 37 (25) t 8.7 = 2.2, p = .057 SOT Condition 6 (38 children, 20 adults) 59 (18) 41 (24) t 56 = 1.8, p = .074
SD, standard deviation, M, male; F, female; ABC = Activities-specific Balance Confidence scale, DHI = Dizziness Handicap Inventory, DGI = Dynamic Gait Index, FGA = Functional Gait Assessment, TUG = Timed “Up & Go”, FTSTS = Five Times Sit To Stand, SOT = Sensory Organization Test, † t is the Independent sample t-test, U is the Mann-Whitney U test, * p <.05

71
Table 4-2: Mean (SD) of outcome measures at times of initial evaluation and discharge
ABC, Activities-specific Balance Confidence scale; DHI , Dizziness Handicap Inventory; DGI , Dynamic Gait Index; FGA, Functional Gait Assessment; TUG, Timed “Up& Go”; FTSTS, Five Times Sit To Stand; SOT = Sensory Organization Test
Outcome Measure Pre-treatment Post-treatment F-test & p-value Dizziness Severity
( 41 children, 23 adults) 21(22) 12 (18) F1,62 = 11.4, p < .001*
ABC ( 41 children, 27 adults)
64 (27) 84 (17) F 1,66 = 31.5, p < .001*
DHI ( 42 children, 27 adults)
49 (21) 30 (22) F 1,67 = 45.5, p < .001*
DGI ( 30 children, 18 adults)
20 (3) 23 ( 1) F 1,46 = 42.6, p < .001*
FGA ( 30 children, 18 adults)
22 (5) 28 (3) F 1,46 = 62.9, p < .001*
Gait Speed ( 29 children, 17 adults)
1.02 (.28) 1.28 (.23) F 1,44 = 38.3, p < .001*
TUG ( 22 children, 16 adults)
9.7 (2.5) 7.8 (1.8) F 1,36 = 27.8, p < .001*
FTSTS ( 20 children, 16 adults)
13.1 (6) 9.7 (5) F 1,34 = 15.9, p < .001*
SOT(Composite) ( 13 children, 9 adults)
48 (19) 71 (13) F 1,20 = 36.8, p < .001*
SOT Condition 1 ( 13 children, 8 adults)
83 (13) 92 (4) F 1,19 =7.2, p = .015*
SOT Condition 2 ( 13 children, 8 adults)
76 (18) 86 (9) F 1,19 =5.3, p = .033*
SOT Condition 3 ( 13 children, 8 adults)
71 (21) 87 (9) F 1,19 =7.8, p = .012*
SOT Condition 4 ( 13 children, 8 adults)
46 (28) 80 (9) F 1,19 =27.2, p < .001*
SOT Condition 5 ( 13 children, 8 adults)
29 (24) 51 (15) F 1,19=21.6, p < .001*
SOT Condition 6 ( 13 children, 8 adults)
29 (21) 60 (15) F 1,19 =32.0, p < .001*

72
Table 4-3: Mean (SD) for the significant interaction effect between age group and time on dizziness
severity and Sensory Organization Test (SOT) scores
4.4 DISCUSSION
The primary finding of this study is that people who had persistent dizziness and balance
dysfunction after having a concussion appear to have improved after vestibular rehabilitation.
Although many post-concussive symptoms, including dizziness and imbalance, may
resolve within the first few weeks after the concussion,65, 296 it is less likely that the participants
in our sample fell in this category. Only 8/114 (7%) of the participants in our sample had an
initial evaluation within 3 weeks of the concussion, and the median number of 61 days (range 6-
2566) between the most recent concussion and their referral to vestibular rehabilitation suggests
that the symptoms did not resolve spontaneously, and consequently required intervention. Five
participants in our sample had BPPV. Although BPPV has been shown to be common after
concussion, it did not appear that way in our sample, perhaps because the extended length of
time between the concussion and initial evaluation for vestibular rehabilitation.
Outcome Measure Children Adults
Pre-treatment Post-treatment Pre-treatment Post-treatment
Dizziness Severity (41 children, 23 adults)
26 (22) 7 (11) 21 (20) 20 (25)
SOT Condition 1 (13 children, 8 adults)
79 (14) 92 (3) 91 (3) 91 (6)
SOT Condition 2 (13 children, 8 adults)
72 (21) 89 (5) 83 (11) 83 (13)

73
The intervention spanned a median of 4 vi sits and 33 da ys. The number of visits is
comparable with other open-ended trials of vestibular rehabilitation for both peripheral and
central causes of dizziness reported from the same clinic.300-301 However, the duration of care in
this report was less than in other studies. It is not clear if the shorter duration of care represented
truly faster recovery rates, or rather a change in frequency of treatment visits that enabled the
therapists to progress the exercise program more quickly. However, this improvement in
outcomes in the same number of visits over a shorter time period may indicate that patients
referred to vestibular rehabilitation post-concussion may benefit from a higher frequency of
visits at the beginning of care.
The patient recovery occurred across multiple domains, i.e. self- reports of dizziness
severity, dizziness handicap (DHI), and balance confidence (ABC), as well as functional balance
performance. The magnitude of improvement compares well with other types of vestibular
disorders.269, 300-302 Furthermore, the average magnitude of change was greater than the Minimal
Clinically Important Difference (MCID) established for the DHI (18 pts),299 gait speed303 (0.1
m/s) and SOT composite score (10 pts).304 Although statistically-derived MCIDs have not been
established for the other outcome measures, in our clinical experience, mean improvements of 20
for the ABC, 3 for the DGI, 6 for the FGA, suggest clinically significant changes. Without a
control group, it is not possible to know the relative contributions of the vestibular rehabilitation
program, concurrent medical management, and natural recovery toward the improved outcome
measures. Furthermore, we were not able to determine how impaired the participants were
immediately post-concussion, and therefore are unable to know how much improvement in
outcomes may have already occurred prior to treatment. However, the finding is consistent with

74
previous studies that have shown that vestibular rehabilitation may reduce dizziness and improve
overall balance for individuals with concussion.34, 44, 234-235
The scores of dizziness severity and DHI at initial evaluation were similar to several
other reports of persons with vestibular disorders, including central and peripheral
dysfunction.300-301 However, our participant sample had qualitatively better scores in several of
the functional gait and balance measures, including the DGI, TUG, and FTSTS, as well as the
self reported ABC. It is possible that the better gait and balance scores in the current study reflect
the younger age distribution of this group. An age difference was found for several of the gait
and balance measures, including FTSTS and FGA, so this explanation is plausible, but not
definitive since normative data for these measures are lacking in children. In contrast, across all
conditions, the SOT scores obtained from children during the initial evaluation (data not shown)
were worse than scores obtained from adults with vestibular disorders,228, 264, 305 and healthy
children,297, 306 providing additional evidence of dysfunctional sensory integration with
concussion in children.295, 307
In order to assess if age affected the amount of improvement, the interaction between
time and age was examined. Only 3 of the measures demonstrated significant interactions:
dizziness rating and SOT Conditions 1 a nd 2. The significant interaction for the dizziness
severity revealed that children had a g reater improvement in symptom severity despite having
slightly worse ratings at the initial evaluation. Closer inspection of the dizziness severity data for
the adult group showed that despite the improvement of dizziness in many participants, the large
variability in the scores, especially post-treatment scores may attribute to the overall lack of time
effect on dizziness for the adults. The significant interaction effect in SOT Conditions 1 and 2
indicates greater improvement in scores in children compared with adults. The adults ha d a

75
narrow range of scores that were within normal limits for SOT Condition 1 whereas the
distribution of the scores for SOT Condition 1 were more dispersed in children, which allowed
for greater recovery. In SOT Condition 2, c hildren again had greater room for improvement
because of lower initial scores, but it is also surprising that the adults’ scores did not increase to
normal values. Overall, the results of posturography analyses should be interpreted cautiously, as
they were limited by the low number of participants (13 children / 8 adults). However, the lack
of interaction between time and age in other outcome measures of DGI, FGA, gait speed,
FTSTS, and SOT suggests that these gait and balance measures could be used to track the
recovery after vestibular rehabilitation for both adult and children populations. It would be of a
great interest if future studies investigate the responsiveness of gait and balance measures in
patients with mTBI.
Another aim of the study was to examine if age impacted the overall level of symptoms
and the amount of recovery. There were age-related differences in DHI, FGA, and FTSTS
scores. The significantly lower scores on the DHI in children compared with adults may support
the notion that the perception of dizziness handicap is different between children and adults.243,
293 However, at the time of initial evaluation, the dizziness severity was not different between the
2 groups. This apparent contradiction may be explained by items in the DHI that are not
applicable to children (e.g. Does your problem interfere with your job or household
responsibilities) and by lack of items that relate dizziness to the functional difficulties that the
children are experiencing.293 Although the DHI has not been validated for use with children, we
used it because there were no other alternatives that assess the impact of dizziness on the
functional activities of children, and we felt that most of the items would respond to changes that
occurred during vestibular rehabilitation. The lower FTSTS scores in children (by 4 s) are

76
probably not related to any concussion-related factors, but rather explained by greater physical
fitness and agility. In addition, significantly higher FGA scores in children (by 2 points) may
reflect abilities that are not related to the concussion severity. Furthermore, a difference of two
points between groups may not be clinically meaningful.
4.5 LIMITATIONS AND FUTURE DIRECTIONS
Although we believe that this study added to our understanding of the effects of vestibular
rehabilitation after concussion, the results of this study were limited by the retrospective nature
of the data and the lack of control group. Owing to the retrospective nature of the study, many
limitations were identified; first, we were not able to reliably report the immediate markers of
concussion severity such as loss of consciousness (LOC), amnesia and confusion, and we were
not able to investigate if the presence of these markers could predict poorer outcomes. Second,
although acknowledged by athletic trainers as an essential tool in concussion assessment,125, 308-
311 symptom checklist was not implemented as a p art of vestibular assessment. Therefore, we
were not able to examine the symptoms severity and symptoms recovery in our sample. Third,
since there were no complete vestibular battery test, we were not able to place our participants in
one of the dizziness groups previously described by Hoffer et al.34 Fourth, the study was also
limited by some missing data and a low number of participants who completed pre- and post-
testing, especially the SOT.
We strongly recommend the use of the symptom checklist as a part of vestibular
evaluation as it allows the therapist do document the symptomatic severity of the participants and
allow the therapist to track the symptoms recovery by e xamining the difference in symptom

77
severity between the initial sideline symptom checklist, which is commonly used in the field of
athletic training and subsequent checklists.
We also recommend a multidisciplinary approach in which neuropsychologist, physical
therapist, athletic trainer can bring their expertise and work together to comprehensively mange
the concussion. Knowing that there are modifiers for concussion management,70 we recommend
having a profile for the concussion patient in which all the tests for the different domains
(Symptoms, neurocognitive and balance) at all evaluation points (baseline, immediately post
concussion, and throughout recovery) are documented in a systematic manner and kept
accessible to any member of the team.
Future directions for research should include replication of this study in a well controlled
prospective design with a control group.
4.6 CONCLUSION
Vestibular rehabilitation therapy may reduce dizziness severity and improve gait and balance
performance after concussion in both children and adults who have persistent symptoms that do
not resolve with rest. Future directions may include replication of this study in a prospective and
controlled design.

78
5.0 THIRD AIM
5.1 INTRODUCTION
Reports of dizziness and imbalance are prevalent in individuals who have had a concussion.
Twenty-three to eighty-one percent of persons post concussion report dizziness in the
first days post concussion. Estimates of the prevalence of persistent dizziness after mTBI varies
widely from 16-18% at three months,170, 181 1.2% at 6 months182 to 32.5% at five years.183
Persistent balance problems have also been reported three weeks after concussion.18, 171
Vestibular rehabilitation is a key component to the management of dizziness and balance
disorders resulting from vestibular system dysfunction, either peripherally or centrally.226-231
Despite the high incidence of dizziness and balance dysfunction in people who have had
a concussion, reports of vestibular and balance rehabilitation in management of concussion are
sparse.33-34, 39, 44 Previous studies have shown that vestibular rehabilitation reduces dizziness and
improves overall balance for individuals with head injury.33-34, 39, 44, 249
The accepted standard of care for vestibular rehabilitation is to use a p roblem-oriented
approach in which impairments and functional limitations are identified during the initial
evaluation, and customized exercises are prescribed to address the individual’s specific
problems, while accounting for the pathology and other co-morbidities.244 General guidelines for
exercise prescription and progression are available in Herdman et al, 244 and more specific

79
programs have been documented for prospective clinical trials.244 Outside of these descriptions
of authoritative practice guidelines, there have been no reports of how vestibular rehabilitation
therapists actually use these principles in practice. An understanding of what exercises have been
prescribed for individuals with dizziness and imbalance after concussion may be useful for
several reasons. Assuming that the physical therapists adhered to the problem-oriented approach
described above, the study can provide a d etailed picture of the specific impairments and
functional limitations encountered by the individuals with concussion and the path by which they
returned to their pre-morbid status. Moreover, by understanding the prescription and progression
patterns provided by expert clinicians, physical therapists new to prescribing vestibular
rehabilitation exercises for patients with concussion can use this information to better understand
how to start and then make the exercises more challenging. Additionally, therapists can use the
framework of exercise categories, exercise groups and exercise modifiers to better document the
detailed prescription pattern of vestibular rehabilitation exercises. Consequently, the purpose of
this study is to describe exercise prescription patterns in patients treated with vestibular
rehabilitation exercises.
5.2 METHODS
5.2.1 Participants
A retrospective chart review of the 114 participants referred to a tertiary vestibular rehabilitation
clinic for vestibular rehabilitation after being diagnosed with concussion. Five patients did not
have an indication for vestibular rehabilitation therapy, four patients were diagnosed with Benign

80
Positional Paroxysmal Vertigo (BPPV) and were successfully treated using the modified Epley
Canalith Repositioning Maneuver312 without need for home exercises. One patient did not return
for subsequent visit. A total of 104 participants (66 F/38 M, mean age 24 y, SD 19 y) received a
computer-generated home exercise program (HEP) of vestibular rehabilitation exercises after
being diagnosed with concussion. Results of the intervention were previously reported.249
Participants were referred for a median of 58 (6 – 1,149) days after the concussion
episode. The duration of the vestibular rehabilitation intervention was a median of 33 (range 7-
181) days, encompassing a median of 4 ( range 2-13) visits. The HEP was designed by e ight
physical therapists with at least three years experience in vestibular physical therapy.
5.2.2 Procedure
Each of the computer-generated exercise handouts (Visual Health Information (VHI), WA,
U.S.A) that was placed in the chart was reviewed by one of the authors (PS) and each exercise
was classified according to general exercise categories that address common areas of dysfunction
in individuals with vestibular and balance disorders. VHI software has a pre-determined set of
exercises that allows therapists to make modifications for the initial exercise prescription. The
software also allows therapists to create new exercises and to make changes to progress the
different exercise prescriptions.
There are five main exercise categories: 1) Eye–Head Coordination 2) Sitting balance 3)
Standing Static balance (i.e. feet-in-place), 4) Standing Dynamic balance (feet moving, but not
walking), and 5) Ambulation. Each one of these categories consisted of different exercise types.
A brief description of the exercise categories and types is included below.

81
1) Eye-Head Coordination exercises: This exercise category contains many exercise types
that involve movement of head and/or eyes for the purpose of vestibulo–ocular reflex (VOR)
gain adaptation, symptom habituation, or oculomotor re-education. The exercises include:
VORx1, VORx2, VOR cancellation, convergence, smooth pursuits, anticipatory gaze shifts,
imagined target, and saccades.250
2) Sitting balance exercises: The patient maintains balance while sitting upright, weight
shifting from side to side, or bouncing.
3) Standing Static balance exercises: The patient stands with feet in place while upright
or weight shifting. The patient can be asked to stand on one leg, stand on a rocker board or stand
with one foot on a step. This category also includes the sit-to-stand exercise.
4) Standing Dynamic balance exercises: The patient stands and moves without walking.
The patient might march in place, step forward or backward, step to the side, step up or
down, or turn around.
5) Ambulation exercises: The patient walks forward, backward, on stairs, with turns and
practice braiding (i.e. side stepping in an over and under pattern), skipping, jogging and running.
For each type of exercise, a u niversal set of 10 modifiers was used to describe other
characteristics of the exercise (Table 5-1): (1) the posture in which the exercise is performed, (2)
the type of support surface, (3) the size of the base of support, (4) the positioning of the trunk
and (5) arms, (6) the direction of head movements, (7) the direction of whole body movements,
(8) the visual input, (9) the presence or absence of the dual cognitive task and (10) any other
special circumstances, such as target distance (near or far) when performing VORx1 exercise.
The frequency and duration of time prescribed per exercise were also recorded.
Frequency is recorded in terms of the number of times it is performed per day, and the duration
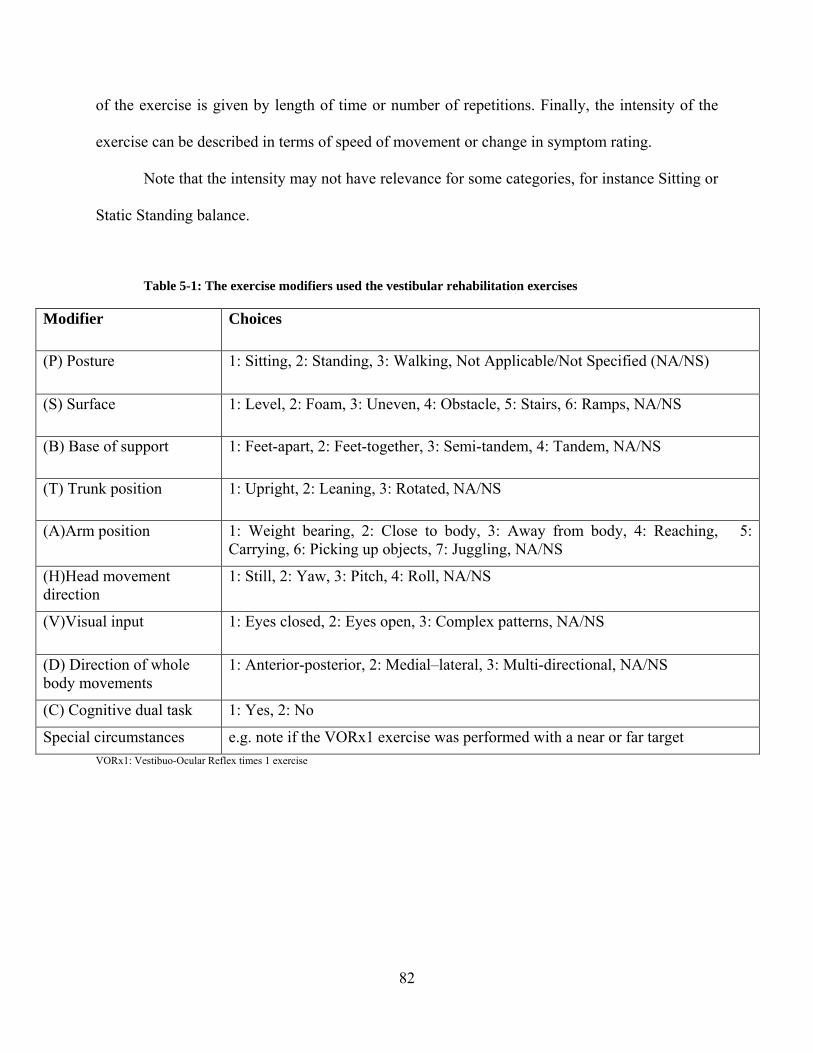
82
of the exercise is given by length of time or number of repetitions. Finally, the intensity of the
exercise can be described in terms of speed of movement or change in symptom rating.
Note that the intensity may not have relevance for some categories, for instance Sitting or
Static Standing balance.
Table 5-1: The exercise modifiers used the vestibular rehabilitation exercises
Modifier Choices
(P) Posture 1: Sitting, 2: Standing, 3: Walking, Not Applicable/Not Specified (NA/NS)
(S) Surface 1: Level, 2: Foam, 3: Uneven, 4: Obstacle, 5: Stairs, 6: Ramps, NA/NS
(B) Base of support 1: Feet-apart, 2: Feet-together, 3: Semi-tandem, 4: Tandem, NA/NS
(T) Trunk position 1: Upright, 2: Leaning, 3: Rotated, NA/NS
(A)Arm position 1: Weight bearing, 2: Close to body, 3: Away from body, 4: Reaching, 5: Carrying, 6: Picking up objects, 7: Juggling, NA/NS
(H)Head movement direction
1: Still, 2: Yaw, 3: Pitch, 4: Roll, NA/NS
(V)Visual input 1: Eyes closed, 2: Eyes open, 3: Complex patterns, NA/NS
(D) Direction of whole body movements
1: Anterior-posterior, 2: Medial–lateral, 3: Multi-directional, NA/NS
(C) Cognitive dual task 1: Yes, 2: No
Special circumstances e.g. note if the VORx1 exercise was performed with a near or far target VORx1: Vestibuo-Ocular Reflex times 1 exercise

83
5.2.3 Analysis
In order to provide an understanding about the patient’s initial presentation and the progression
for a sp ecific exercise type, the visit during which each new exercise was prescribed was
recorded. An exercise qualified as a new exercise if at least one modifier was different than the
previous prescriptions. Progression was defined as performance of the same exercise type, but
under more challenging conditions (e.g. progressing VORx1 from standing with feet apart to feet
together or walking). Frequency counts of the most common exercise categories and most
common exercise types within each category (constituting 95% of each category) were recorded.
Exercises provided to the participants as a home exercise program were analyzed, rather
than the exercises performed during the clinic visit, because the documentation was more
uniform and presumably reflected the most important activities that each patient needed to work
on. Throughout the results, and unless specified otherwise, the percentages were relative to the
overall number of participants who received a HEP (i.e. n=104).
5.3 RESULTS
A total of 104 participants had a home exercise program (HEP) prescription. Out of the sum total
of 411 patient visits, a printed HEP sheet was located for 335 visits (82%). It is not known in the
remaining 18% of the visits, if the participants were given a new HEP without being placed in
the chart, or if the therapist wanted the patient to continue with the same HEP. The 76 missing
home exercise notes were distributed among 40 participants. There were no differences in age,
gender and time between concussion and vestibular rehabilitation between this group with

84
missing data and the group without missing data; however, the group with missing data had a
longer treatment duration (48 + 29 days v. 26 + 16 days, p < 0.001).
Table 5-2 summarizes the frequencies for the most common exercise categories and
exercise types, prescribed throughout the duration of the intervention as well as for the first visit
only. Eye-Head Coordination exercises were the most commonly prescribed category, including
95% of the participants who had received a HEP. The VORx1, VOR cancellation, convergence
and VORx2 were the four most common exercises in this category, respectively. The Standing
Static balance category was the second most common category of exercises, prescribed in 88%
of participants; the most frequent were standing upright on level and foam surfaces, single leg
stance, weight-shifting exercises in various directions, and sit-to-stand. The Ambulation category
was the third most commonly prescribed category (76% of participants), with forward
ambulation followed by ba ckward ambulation, and walking with turns. To accompany these
commonly prescribed exercises, we have detailed the most common frequency and duration as
specified by the physical therapists.

85
Table 5-2: Summary of the most common prescribed exercises throughout therapy and during the
first visit in number of subjects (Percentage of subjects)
Exercises Throughout Therapy
First Visit
Frequency (times/day)
Duration
Eye- Head Coordination 99 (95%) 89 (86%) VORx1 92 (88%) 75 (72%) 3 60 s
VOR cancellation 67 (64%) 31 (30%) 2 10 reps
Convergence 30 (29%) 21 (20%) 2 10 reps
VORx2 9 (9%) 1 (1%) 1 30 s
Standing Static 92 (88%) 69 (66%)
Standing Upright 87 (84%) 67 (64%) 2 30 s
Single leg stance 29 (28%) 7 (7%) 4 30 s Weight Shift 15(14%) 2 (2%) 1 10 reps
Sit To Stand 14 (13%) 11 (11%) 1 10 reps
Ambulation 79 (76%) 43 (41%)
Forward Ambulation Feet Apart, yaw head turns Feet Apart, pitch head turns
Tandem, head still
76 (73%) 64 (62%) 29 (27%) 33 (32%)
42 (40%) 31(30%) 12(12%) 9 (9%)
1 1 1
20 head turns 20 head turns
20 feet
Backward Ambulation Feet Apart, head still
Feet Apart, yaw head turns Tandem, head still
44 (42%) 18 (17%) 14 (13%) 21 (20%)
10 (9%) 8 (8%) 0 (0%) 3 (3%)
1 1 1
20 feet
20 head turns 20 feet
Ambulation with Turns 19 (18%) 2 (2%) 1 Every 5 steps

86
5.3.1 Preferred Prescription Patterns
Even though the number of potential exercises is large due to the combination of modifiers that
could be used, the physical therapists demonstrated preferred prescription patterns that contained
a small subset of the potential combinations. For example, examination of these patterns revealed
that the VORx1 exercise was usually prescribed in both the yaw and pitch planes. For each
patient, it was further customized by c hanging the posture, size of base of support and visual
input. Therefore, the therapists usually did not alter the following modifiers during the VORx1
exercise: surface, trunk position, arm position, direction of whole body m ovement or
involvement of cognitive dual task. The specific patterns for the VORx1 exercise will be
presented in more detail in the section on progression.
The VOR cancellation exercise was customized primarily by changing the posture and/or
the base of support (BOS). As with the VORx1, VOR cancellation was prescribed in both yaw
and pitch planes. In 38% of the participants who received a H EP, VOR cancellation was
prescribed in the standing position on a level surface (most with feet apart). While in the
standing position, the target was either held in one hand while the arm was moving (e.g. a
playing card) or tossed between hands (e.g. a ball). This exercise was also performed while
walking (37% of participants), also with targets that were tossed or held in the hand. VOR
cancellation was prescribed in the sitting position for 18% of participants, always while having
the target held in hand.
For the Standing Static balance exercise category, the standing upright exercise was
customized and/or progressed by changing the surface, BOS, direction of head movement and
the visual input modifiers. The most common surface was a level one, which was prescribed in
74% of the participants receiving a HEP. Participants were instructed to stand with feet together

87
(46%), followed by standing tandem and semi-tandem (34% and 31% respectively). Across these
three BOS’s, the exercise was most commonly prescribed with head still and eyes closed. When
the exercise was given with head movement in the yaw direction (n=45), the eyes were open in
most cases (n=41). When performed on a foam surface (37%), the standing upright exercise was
most commonly prescribed with feet apart followed by feet together (27% and 8% respectively).
When performed with feet apart, it was most commonly performed with head still and
eyes closed.
The most common modifiers of the Ambulation exercises were the BOS and direction of
head movement. Forward ambulation was the most common prescribed exercise in 73% of the
participants. The majority of the participants performed the exercise with feet apart (68%).
Tandem ambulation was the second most common forward ambulation (34%). Across the
different BOS’s the exercise was prescribed with yaw head movement most frequently (62%),
then with pitch head movement and no head movement (28% and 12% respectively).
5.3.2 Progression
The VORx1 exercise can be used as an example of how exercises were progressed (Table 5-3).
The initial exercise prescription was given most commonly in standing with feet apart (40
participants), followed by s tanding with feet together (29 participants) and sitting (21
participants). For the participants who were prescribed VORx1 in sitting, 11 participants were
progressed to standing with feet apart, 6 participants to standing with feet together, 2 to walking
and 4 participants did not progress any further. During the final prescription of VORx1, 31, 30
and 19 participants were instructed to perform the exercise during walking, standing with feet
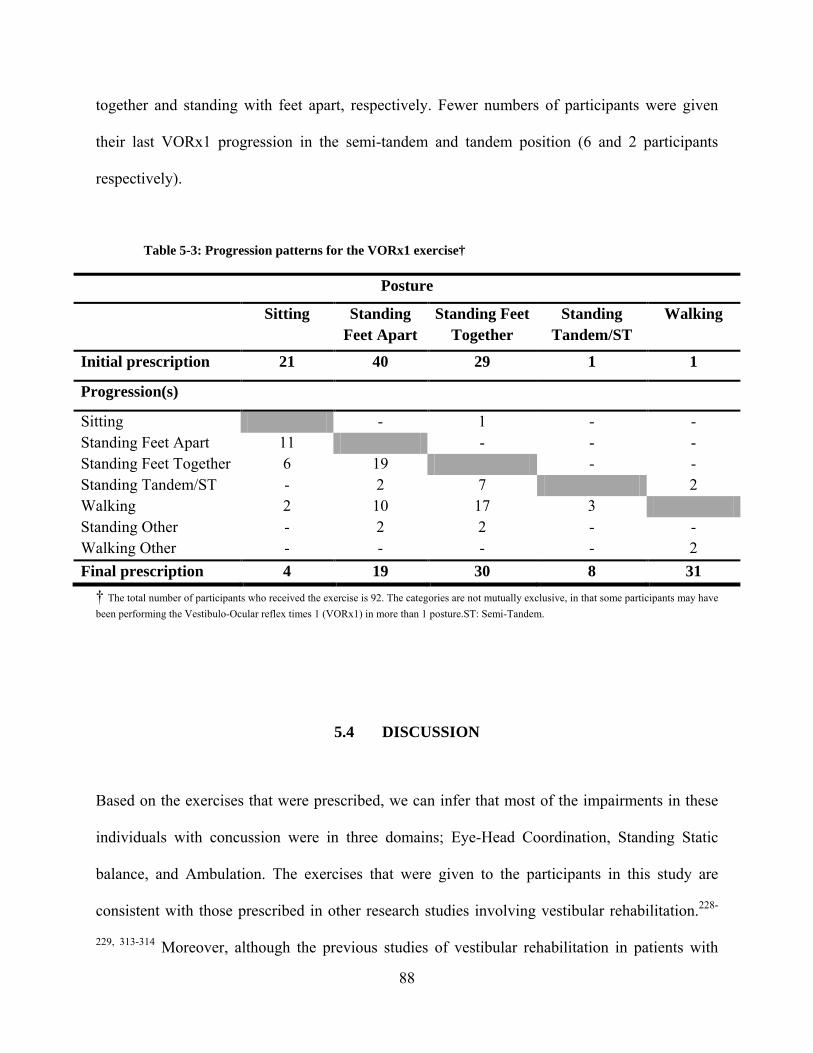
88
together and standing with feet apart, respectively. Fewer numbers of participants were given
their last VORx1 progression in the semi-tandem and tandem position (6 and 2 participants
respectively).
Table 5-3: Progression patterns for the VORx1 exercise†
Posture
Sitting Standing Feet Apart
Standing Feet Together
Standing Tandem/ST
Walking
Initial prescription 21 40 29 1 1
Progression(s)
Sitting - 1 - - Standing Feet Apart 11 - - - Standing Feet Together 6 19 - - Standing Tandem/ST - 2 7 2 Walking 2 10 17 3 Standing Other - 2 2 - - Walking Other - - - - 2 Final prescription 4 19 30 8 31
† The total number of participants who received the exercise is 92. The categories are not mutually exclusive, in that some participants may have been performing the Vestibulo-Ocular reflex times 1 (VORx1) in more than 1 posture.ST: Semi-Tandem.
5.4 DISCUSSION
Based on the exercises that were prescribed, we can infer that most of the impairments in these
individuals with concussion were in three domains; Eye-Head Coordination, Standing Static
balance, and Ambulation. The exercises that were given to the participants in this study are
consistent with those prescribed in other research studies involving vestibular rehabilitation.228-
229, 313-314 Moreover, although the previous studies of vestibular rehabilitation in patients with

89
post concussion symptoms did not provide a detailed description about their vestibular
rehabilitation program, the use of VORx1 and “positional exercises” has been reported.34
Impairments in the Eye-Head Coordination have been reported after brain injury, and
may result from disruption in the vestibulo–ocular reflex (VOR)45 or reflect increased symptoms
with head and eye movement.315 Vestibular adaptation exercises that improve VOR gain will
consequently improve gaze stabilization during head movement.244, 313 Eye–Head Coordination
exercises can also be prescribed for habituation purposes if the patient is found to have symptom
provocation independently of any reduction in VOR gain. In the current sample of participants,
95% were found to have impairments in Eye-Head Coordination. Because most of the
participants did not have formal vestibular function testing, it is not certain how many
participants had reduced VOR gain. However, most of the participants had symptom provocation
with eye and head movements.
Several studies have reported different balance and ambulation impairments in patients
with post-concussion symptoms. Despite the evidence that impairments in the static balance
spontaneously resolve within the first 3-5 days after concussion,30-31 88% of the current
participants were found to have impairments in Standing Static exercises at least 6 days after the
concussion. In addition, patients may exhibit slower gait velocity,15, 28, 152 shorter stride length,150
and wider step width.29 In the current sample of participants, Ambulation impairments were
found in 76% of the participants.
Ninety percent of participants who had difficulties in the domain of Eye–Head
Coordination received a HEP to address gaze stabilization during their first visit (Table 5- 2). Of
the participants who had standing static balance difficulties, 75% received a HEP in the Standing
Static balance category during the first visit. However, only 54% of the participants who had
90
difficulties during walking were given ambulation exercises during their first visit. These results
suggest that the Eye-Head Coordination category is the domain that is usually addressed first by
the expert clinicians during vestibular rehabilitation for patients post concussion. Several factors
may account for why Ambulation exercises were not emphasized during the first visit. First, it is
common for persons with vestibular disorders to become symptomatic before the Ambulation
evaluation is complete.250 Second, the therapist may have identified gait impairments but decided
to address the Eye–Head Coordination and Standing Static balance problems first to instill
confidence and make sure the participant performed the exercises safely before addressing the
more dynamic balance deficits (i.e. during ambulation). Others have suggested using a less
aggressive pattern of progression for patients with post concussion symptoms during vestibular
rehabilitation.45 Although the reasons for prescription patterns have not been verified through the
current data, these above mentioned issues are frequently seen in the management of patients
with vestibular disorders and warrant a frequent re-evaluation for patient’s status in order to
determine the current impairments and functional limitations throughout the course of vestibular
rehabilitation.250
The analysis revealed important observations about the exercise prescription and
progression patterns. For Eye-Head Coordination exercises, the most important modifiers were
the posture and base of support. A typical pattern of progression for the VORx1 exercise would
be from sitting to standing with feet apart, to standing with feet together, to walking. By varying
the combinations of posture and the size of base of support, the patient must learn to adjust for
natural body movements that occur while coordinating the eye and head movements during
typical daily activities. VOR cancellation is needed to follow moving objects while the head is
synchronously moving in the same direction. Posture was the most important modifier to be

91
changed during VOR cancellation prescription. The exercise was mainly performed in postures
that match the scenarios in which the suppression of VOR is needed in real life (i.e. standing and
walking). For participants who were more symptomatic, the exercise was prescribed while sitting
and progressed to standing and walking after the symptoms improved (data not shown).
Participants received the VORx2 exercise as part of the progression less frequently (9%)
than is typically prescribed for people with unilateral vestibular hypo-function. Several reasons
may exist to explain this. The participants may not have returned for enough visits to begin this
exercise, because their symptoms improved and they were discharged. In other cases, the
participants may still have been highly symptomatic with the VORx1 exercise.
Because of the retrospective study design, we were not able to record the explicit
rationale for the therapists’ prescription. All of the therapists who prescribed the exercises were
trained in the customized problem-oriented approach that is considered to be the standard
intervention for vestibular rehabilitation.244 Therefore, we can assume that the general rationale
for the exercise prescription in each case w as developed using the same framework of 1)
identifying the impairments during the evaluation, 2) prescribing a specific initial exercise to
address that impairment safely, and 3) progressing the exercise by increasing difficulty so that
the activity can be done in a functional manner. Although the current design cannot specifically
address “why” the exercises were given, we believe knowing “what” was prescribed by expert
therapists is an important step in understanding the management of these individuals. Given the
extreme shortcomings in the published literature about the vestibular rehabilitation exercises for
individuals post concussion, we believe that this manuscript is useful for clinicians who are
starting vestibular rehabilitation exercises because the exercise prescription and progression
patterns included in this manuscript is more detailed from previous studies that have commented

92
on the vestibular rehabilitation exercises post concussion.33-34, 44 Consequently, if a therapist has
a basic understanding of the general principles of vestibular rehabilitation, they can now see how
other therapists initially began the program and then progressed the participants. For example,
the results of this study suggest that during the initial visit, a therapist may want to concentrate
on assessing Eye-Head Coordination exercises and Standing Static balance activities, and when
indicated, prescribe exercises in these domains. Initially, the VORx1 exercise was prescribed
most frequently in standing with feet apart. In later visits, the participants progressed to perform
additional Eye-Head Coordination exercises, in more destabilizing postures, and also perform
more Ambulation exercises. Future studies should incorporate a prospective design and
determine both elements of prescription pattern (i.e. the “what” and “why”).
Additionally, we were not able to report the intensity of the prescribed exercises; this is
attributed in part to the retrospective nature of our study in which the intensity was not specified
in the software that was used to generate the home exercise program sheets. In the case of Eye-
Head Coordination exercises, participants were generally instructed to move their head at a speed
that caused their symptoms to increase slightly. Nonetheless, we believe intensity should be
more formally quantified in the prescription of vestibular rehabilitation exercises, in cases where
it applies. For instance, in the case of Eye-Head Coordination exercises, the speed of head
movements (or eye movements) is not well described, and is difficult to monitor. Perhaps
wearable sensors could be developed to assist in this area in which the speed of head movement
is recorded. Another potential way to prescribe the intensity, especially in the case of symptom
provocation, is by having the participant perform the exercise until they reach a certain level of
symptom severity on a visual or verbal analog scale. For standing dynamic exercises, the
intensity could be prescribed as the number of repetitions per minute, and increased to a higher

93
intensity during the progression. For Ambulation exercises, intensity could be prescribed as the
gait speed, or speed of head movements performed during gait.
While the progression of aerobic and resistance exercises is typically based on increasing
the intensity or volume of the same exercise type, vestibular rehabilitation exercises are often
based on subtle variations of the exercise types that are not able to be classified using the F.I.T.T
(frequency, intensity, time and type) principle of the American College of Sports Medicine
(ACSM). The current system was designed to facilitate the reporting of exercises commonly
used during vestibular rehabilitation.244, 316 The 5 main exercise categories and exercise types
within each category were loosely based on general exercise categories that address common
areas of dysfunction in individuals with vestibular and balance disorders. It is important to note
that the patients with dizziness and balance disorders also may have been given range of motion
and strengthening exercises as a part of their home exercise program. However, the prescription
frequency of these exercise types was much lower than the vestibular rehabilitation exercises.
One of the limitations encountered in the study was having missing home exercise
programs. The group with missing data did not differ from the group with complete data in age,
gender, and time since concussion; therefore, systematic bias is less likely to have had occurred
in prescriptions that may have been based according to age and gender. The group difference in
treatment duration may indicate that there was greater opportunity to have data missing, or
support the notion that the therapist may have asked the more impaired participants (i.e. longer
treatment duration) to continue the same HEP without documenting that in the chart.

94
5.5 CONCLUSION
Individuals with dizziness and imbalance post concussion may exhibit impairments in Eye-Head
Coordination, Standing Static balance and Ambulation. The exercises prescribed by e xpert
clinicians are comparable to the exercises prescribed for individuals with unilateral vestibular
hypo-function. Even though the number of potential exercises is nearly limitless due to the
number of modifiers, the physical therapists demonstrated preferred prescription patterns that
limited the number of modifiers used. By knowing the preferred prescription and progression
pattern of exercises employed by e xpert physical therapists, other clinicians initiating a
vestibular rehabilitation treatment program for individuals post-concussion may have a
foundation to guide their intervention.

95
6.0 FOURTH AIM
6.1 INTRODUCTION
Mild traumatic brain injury, or concussion, can result in a variety of symptoms and physical and
cognitive impairments. Post- traumatic headache is the most common symptom after
concussion.171, 174-175 Prevalence of initial headache after concussion has been reported to range
between 43% to 86% of patients.18, 171, 176 Persistent headache is also reported in a period up to
three months after concussion.170, 172
Dizziness is also a frequent symptom after concussion, with 23% to 81% of persons
reporting dizziness in the first days following concussion.18, 181 Of the 61% who reported
dizziness in the initial days after concussion in one study, 41% reported mild dizziness, 16%
reported moderate dizziness, and 4% reported severe dizziness.18 Dizziness at the time of
concussion was associated with a 6.34 odds ratio (95% CI = 1.34 -29.91, χ² = 5.44, P = .02) of a
protracted recovery (i.e >21 days) from concussion in a sample of high school football players.191
Estimates of the prevalence of persistent dizziness after mTBI varies widely from 16-
18% at three months,170, 181 1.2% at 6 months182 to 32.5% at five years.183 Self- reported balance
problems have been reported by as many as 60% of persons post- concussion.171 Although some
studies have suggested that self- reported balance problems usually resolve in the first days after

96
concussion,31, 144, 146 patients may exhibit poor balance despite not reporting balance
problems.184
In examining the recovery process after concussion, clinicians and researchers assess a
variety of signs, symptoms, and physiological functions (e.g. sensory, cognitive, and motor).21, 62,
80, 124, 141 The diversity in measurements used to assess individuals with concussion ha ve
enhanced our understanding of the multi-faceted nature of the effects after concussion, and
improved the sensitivity of the assessment battery available to record functioning in individuals
with concussion.20 A few studies have concluded that cognitive and motor effects of concussion
resolve differently after concussion.16, 216 Parker et al. have found a differential rate of recovery
by comparing the recovery pattern in ImPACT composite scores and different dynamic motor
tasks.216
The lack of correlation between recovery of measures of different domains has been a
subject of debate. 14, 20-21, 48, 104 For instance, while some view the lack of perfect correlation
between performance measures and self- report symptoms as an indication for the lack of
sensitivity in performance measures48 or an indication for the inaccuracy of self- report
symptoms,21 others speculate that they may represent fundamentally different neurobehavioral
processes, or exhibit different recovery trajectories, and therefore they should not be expected to
correlate in all cases.14, 20, 104 Lovell et al. has concluded that post-concussion symptoms are a
result of combinations of neurocognitive deficits and other factors (e.g. vestibular dysfunction),
and therefore, the correlation (or lack thereof) between symptoms and neurocognitive testing is
expected to be less than perfect.104
Despite the conceptual debate about the reasons behind the correlation (or lack thereof)
between measurements from different domains, examining the relationship between

97
measurements may enhance our understanding about the multi-faceted nature of concussion
effects and recovery. Collins et al. revealed a correlation between the neurocognitive testing
scores and the severity of headache post concussion.140 Preliminary evidence from a study that
examined self-report symptoms revealed that “balance problems” were significantly correlated
with “feeling mentally foggy”, “difficulty remembering”, and “difficulty concentrating”.21 In
addition, these symptoms were also associated with decreased cognitive performance (i.e.
ImPACT composite scores). In the same study Broglio et al. examined the relationship between
self- report “dizziness” and “balance problems” and Sensory Organization Test (SOT). The study
found a significant correlation between change in the total score of SOT to balance problems.21
The purpose of this study is to examine the relationship between self-reported symptoms,
neurocognitive performance and balance performance in individuals referred to vestibular
physical therapy after concussion, and to examine the relationship between recovery in gait and
balance measures and neuropsychological recovery made over the course of vestibular physical
therapy.
6.2 METHODS
6.2.1 Participants
A retrospective case series was performed of 114 consecutive participants who were referred
between 2006 and 2008 to a tertiary balance center for vestibular physical therapy after being
diagnosed with a concussion. The study was approved by the institutional review board (IRB).

98
6.2.2 Outcome measures
Self-report and performance gait/ balance measures were administered during the first physical
therapy visit as well as at weekly and monthly intervals. The time points considered for this
report include the initial evaluation and discharge scores. If a measure was not recorded at the
time of initial evaluation or discharge, the assessment at the time point closest to the initial
evaluation or discharge was used.
6.2.2.1 Self report balance measures
Participants were asked to rate their current dizziness severity on a verbal scale from 0-100,
where 0 means no dizziness and 100 means maximum dizziness. Verbal anchors relating to
severity of dizziness (e.g. slight, mild, moderate, severe) were provided for the scale.
The Activities-specific Balance Confidence scale (ABC) is a questionnaire used to assess
the respondent’s level of confidence that they would not lose their balance while performing 16
functional activities. The highest possible score of 100 suggests maximum confidence and a
score of 0 suggests no confidence.255
The Dizziness Handicap Inventory (DHI) is an instrument used to assess the individual’s
handicap due to their dizziness in 25 items relating to physical, emotional, and functional
domains. The highest overall score on the test is 100 and higher scores indicate greater handicap
resulting from dizziness.299
99
6.2.2.2 Balance performance measures
The Dynamic Gait Index (DGI) is an eight item instrument that assesses the ability to walk with
head turns, changes of speed, and around obstacles. The scale for each item ranges from 0-3,
where 0 means severe impairment and 3 means normal. The highest possible score is 24.256
The Functional Gait Assessment (FGA) is a 10-item test based on the DGI. The
maximum score is 30. Higher scores indicate better performance.263
While participants were asked to walk at their comfortable speed, gait speed was timed
over 4 meters course using stopwatch.
The Timed “Up& Go” (TUG) is a timed test during which the participant stands from a
chair, walks three meters at their normal walking speed, and returns to the chair.258
The Five Times Sit To Stand (FTSTS) requires participants to stand-up and sit down
from a standard height chair five times as quickly as possible. The participants were asked to
complete the task with their hands crossed on their chest.259
Dynamic Computerized Posturography: Participants performed the Sensory Organization
Test (SOT, Neurocom, Inc.) under six different sensory conditions:1) eyes open, fixed support;
2)eyes closed, fixed support; 3)sway-referenced vision, fixed support; 4) eyes open, sway-
referenced support; 5) eyes closed, sway-referenced support; 6) sway-referenced vision and
support surface. Three 20 s t rials were performed for each condition. The highest theoretical
equilibrium score is 100 which indicates no sway; losses of balance were graded as zero.
Average scores for each condition were recorded, and the composite score was calculated
using a weighted average of the individual trials.

100
6.2.2.3 Neurocognitive and symptom measures
During the time participants were seen for vestibular physical therapy, participants received
neuropsychological assessments that included repetitive administration of the Immediate Post-
concussion Assessment and Cognitive Testing (ImPACT).24 ImPACT is a co mputer
administered software program that consists of a neurocognitive testing battery and post-
concussion symptom (PCS) scale.24 The neurocognitive testing of ImPACT measures different
areas of cognitive functioning including attention, processing speed, reaction time, and memory.
The ImPACT neurocognitive battery uses six test modules (Word Memory, Design
Memory, X’s and O’s, Symbol Match, Color Match, and Three Letter Memory) to generate four
composite scores. Each testing module may contribute to more than one composite score. A
detailed description of individual tests and composite scores are provided elsewhere.59, 63, 136 The
four performance composite scores, consisting of verbal memory, visual memory, visual –motor
processing speed and reaction time were used in this manuscript. Additionally, the total PCS
score and the individual scores of symptoms were recorded. The PCS includes 22 items and is
designed to quantify the severity of symptoms in the acute phase of recovery after concussion,
using a 7 point Likert scale. For any particular symptom, the scale ranges from 0 (no symptom)
to 6 (severe), and the total PCS score is calculated by adding the scores obtained for the 22 items.
The PCS has been evaluated for its psychometric properties, clinical interpretation and
normative scores.18, 138, 141 The time points considered for this report were the ImPACT tests that
were closest to the start of vestibular physical therapy and the closest point to discharge from
vestibular physical therapy, both within 30 days of the balance assessment.

101
6.2.3 Statistical analysis
Descriptive statistics were used to describe the participants’ demographic characteristics, time
between concussion and ImPACT testing, and time between concussion and the start of
vestibular physical therapy. In order to examine if the participants had more prevalent
“vestibular/ balance” symptoms, a paired t-test was used to examine if the patients had higher
symptom scores in the “vestibular” symptoms (as detailed below) compared to other symptoms
around the start of vestibular physical therapy. A paired t-test was also used to examine if there
was a difference in change scores between the vestibular symptoms and other symptoms over the
course of vestibular physical therapy.
A vestibular/ balance subset of symptoms that included dizziness, nausea, balance
problems, headache, sensitivity to light and sensitivity to sound was considered for correlation
analysis with measures administered at the vestibular physical therapy.
Correlation analysis was performed to examine the relationship between the measures of
dizziness severity rating, ABC, DHI, DGI, FGA, gait speed, TUG, FTSTS and the five
composite scores of ImPACT at the starting point of vestibular physical therapy. The normality
of the distribution was examined. The ABC, DHI, FGA, GS, TUG, FTSTS, and conditions
2,4,5,6, of SOT were normally distributed. For the variables in ImPACT, all variables were
normally distributed except reaction time. The natural log transformation for the reaction time
was used throughout the analysis. For the variables that were not normally distributed (dizziness
rating, SOT composite score and condition 1 &3 of SOT), Spearman- rho correlation analysis
was performed for the original score. A total of 70 c orrelation analyses were conducted. To
account for multiple comparisons, the False Discovery Rate (FDR) method described by

102
Benjamini and Hochberg was used.317 False discovery rate is the expected proportion of
erroneous rejections among all rejections.
Correlation analysis was also performed to examine the relationship between change in
vestibular/ balance measures and change in ImPACT measures over the course of vestibular
physical therapy. For the correlation in the change scores, Spearman- rho correlation coefficient
was used for all analyses.
6.3 RESULTS
6.3.1 Analysis at rehab start
Ninety-three participants (59 F/34 M) out of 114 had received ImPACT testing around the time
when they were initially seen for vestibular physical therapy after concussion. Of the participants
included in this analysis, 65% (n = 60) were children (i.e. <18 y.o). Of the 60 children included
in this analysis, the concussive injury was sport –related in 29 pa rticipants, while another 29
participants endured non-sport related concussion. The cause of concussion was unidentified for
two participants. For the adult participants (n = 33), only eight participants suffered a sport-
related concussion while the majority of the adult participants (n = 25) endured non- sport related
concussion (e.g. fall, motor vehicle accident, assault).
The median age for the participants included in the analysis was 16 years (range: 11 -54).
They were seen at a m edian of 50 days after concussion (range: 4 -2566) days. The
ImPACT testing was administered within 29 days of the start of their vestibular physical therapy
(M =2.46 days, SD = 11.2 da ys, Median = 2, r ange 58 ( 29 days before-29 days after).

103
Participants were more symptomatic in the “vestibular” symptoms (M = 2.6) compared to other
symptoms (M = 2.0, t92 = -6.0, p<.001).
6.3.1.1 Relationship between clinical balance and neurocogntive measures
Using the FDR method to adjust for multiplicity of analyses, 33 ou t of 70 c orrelations were
significant (Table 6-1).
Greater total PCS scores were significantly related to greater impairment in all of the self-
report measures, worse performance in 3 of the 4 clinical performance measures, and greater
sway during only one of the SOT conditions (fixed surface with eyes closed). The strongest
correlation for the PCS was with the self-reported dizziness handicap inventory score (r = 0.49).
Of the neurocognitive measures of ImPACT, the visual memory score was correlated
most times with the self-report and performance measures. Lower (i.e. worse) visual memory
scores were associated with worse impairments in the self-report and balance measures.
Furthermore, lower visual memory scores were associated with greater sway in 5 of the 6
SOT conditions. In particular, visual memory performance was most strongly related to postural
sway on a solid surface with eyes closed.
Reaction time, verbal memory, and processing speed were related to the self-report and
clinical performance measures to a slightly lesser degree than visual memory. In all cases, worse
neurocognitive performance was associated with the expected deficits in self-report measures
and balance performance.

104
Table 6-1: Relationship between ImPACT composite scores and measures administered at the start
of vestibular physical therapy
Visual memory Reaction time Verbal memory Processing speed Total PCS score Self-Report Dizziness rating† (n = 90) rs= -.15, p = .159 rs= .09, p = .425 rs= -.04, p = .684 rs= -.02, p = .889 rs = .24*, p = .021
ABC (n = 90) r =.37*, p = <001 r =-.36*, p = <001 r =.25*, p = .020 r =.27*, p = .010 r = -.39*, p = <001
DHI (n = 90) r =-.28*, p = .008 r =.27*,p = .011 r =-.22, p = .041 r =-.21, p = .048 r =.49*, p = <001
Clinical Performance
FGA (n = 82) r = .43*, p = <001 r = -.40*, p = <001 r = .40*, p = <001 r = .31*, p = .004 r = -.38*, p = <001
GS (n = 84) r = .31*, p = .004 r = -.17, p = .114 r = .33*, p = .002 r = .20, p = .066 r = -.32*, p = .003
TUG (n = 71) r = -.24, p = .045 r = .31*, p =.009 r = -.19, p = .105 r = -.21, p = .081 r = .14, p = .239
FTSTS (n = 69) r = -.41*, p = <001 r = .45*, p = <001 r = -.38*, p = .001 r = -.29*, p = .014 r = .38*, p = .001
Sensory Organization Test (SOT)
SOT composite† (n = 49) rs = .32, p =.024 rs = -.18, p = .221 rs = .11, p = .437 rs = .20, p =.171 rs = -.26, p = .074
SOT 1† (n = 48) rs = .23, p = .118 rs = -.11, p = .451 rs = .19, p = .190 rs = .08, p = .585 rs = .004, p = .977
SOT 2 (n = 48) r = .53*, .000 r = -.46*, p = .001 r = .46*, p= .001 r = .37*, p =.011 r = -.36* p = .012
SOT 3† ( n = 48) rs = .47*, p = .001 rs = -.40*, p = .005 rs = .30, p = .036 rs = .26, p = .070 rs = -.31, p = .031
SOT 4 ( n = 48) r = .40*, p =.005 r = -.26, p = .072 r = .30, p = .040 r = .30, p = .039 r = -.18, p = .222
SOT 5 ( n = 48) r = .37*, p = .010 r = -.24, p = .105 r = .27, p = .065 r = .15, p = .309 r = -.23, p = .122
SOT 6 ( n = 48) r = .33*, p = .021 r = -.16, p = .266 r = .16, p = .288 r = .12, p = .405 r = -.22, p = .131 n = Number of participants, ABC = Activities-specific Balance Confidence scale, DHI = Dizziness Handicap Inventory, FGA = Functional Gait Assessment, TUG = Timed “Up & Go”, FTSTS = Five Times Sit To Stand, SOT = Sensory Organization Test, r = Pearson product-moment correlation coefficient , rs Spearman's rank correlation coefficient

105
For the measures where total PCS score was significantly related to self-report and
clinical performance measures, a secondary analysis was conducted to examine if the vestibular
subset of symptoms related better to these measures than the total symptom score. The results
revealed that the total symptom score relates better to the DHI, GS, FTSTS and SOT compared
to the “vestibular/ balance “subset that included dizziness, nausea, balance problems, headache,
sensitivity to light and sensitivity to sound. However, the “vestibular/ balance “subset better
relates to the ABC and dizziness rating compared to the total symptom score (Table 6-2).
Table 6-2: The relationship between outcome measures administered at the start of vestibular
rehabilitation, total symptom score and “vestibular/ balance” subset of symptoms
Outcome measure (n) Total symptom Vestibular/ balance Dizziness rating
(90) rs = .243, p =.021 rs =.410, p <001
ABC (91)
r = -.393, p <001 R = -.453, p <001
DHI (91)
r =.494, p <001 r =.485, p <001
FGA (82)
r = -.382, p <001 R = -.368, p= .001
GS (84)
r = -.316, p = .003 R = -.294, p = .007
FTSTS (69)
r =.381, p = .001 r =.327, p = .006
n = Number of participants, ABC = Activities-specific Balance Confidence scale, DHI = Dizziness Handicap Inventory, FGA = Functional Gait Assessment, FTSTS = Five Times Sit To Stand, GS = Gait Speed, r = Pearson product-moment correlation coefficient, rs Spearman's rank correlation coefficient
6.3.2 Analysis of change scores
Of the 93 participants who had received ImPACT testing around the time of initial assessment of
vestibular physical therapy, 22 participants did not continue in vestibular therapy after the initial
evaluation, and therefore, they were excluded from this analysis. S eventy-one participated in
vestibular physical therapy program. However, 29 of the subjects did not have an ImPACT

106
follow up during the time were they were seen for vestibular physical therapy (i.e. no change
scores for ImPACT). Therefore, 39 participants (29 F/ 10 M) received two ImPACT tests; one
around the start of vestibular physical therapy and one around the time of discharge from
vestibular physical therapy, and qualified for the analysis of relationship in change scores.
There was no significant difference between the group that is included in the analysis (n
=39) and the group who did not qualify for this analysis (n =54), in time since concussion
(Mann- Whitney U =809, p = .144), age (Mann- Whitney U = 937, p = .787), or treatment
duration (Mann- Whitney U = 341, p = .096). However, the group included in the analysis of
change scores reported higher dizziness severity and exhibited significantly worse performance
on the DGI, FGA and SOT recorded at the start of vestibular physical therapy, compared with
the group that were not included in this analysis at the time of initial evaluation in vestibular
physical therapy (Table 6-3).
Of the 39 participants included in this analysis, 67% (n =26) were children (i.e. <18 y.o).
The median age for the participants included in the analysis was 16.1 years (range: 11 - 47).
They were seen after a median of 46 days after concussion (range: 4 -168). The ImPACT
testing was administered within 29 days around the start of their vestibular physical therapy (M
=2 days, SD = 8.1 days, Median = 1, range (10 before - 23 after). The ImPACT testing closest to
the discharge from vestibular physical therapy was administered within 29 da ys around the
discharge from vestibular physical therapy (M = 0 ( i.e. ImPACT testing and discharge from
therapy were on t he same day), SD = 10.9 d ays, Median = same day, range: (26 before - 25
after).

107
Table 6-3: Difference in the initial outcome measures between subjects not included in change
analysis (n = 54) and subjects included in change analysis (n = 39)
Outcome measure at the time of
initial evaluation
Participants not in change analysis
Participants in change analysis
t-test,p value
ImPACT composite mean (SD) n mean (SD) N
Total PCS score 45 (32) 54 51 (24) 39 t91 = -1.1, .26
Verbal memory 79 (14) 54 75 (17) 39 t91 = 1.2, .23
Visual memory 66 (16) 54 61 (16) 39 t91 = 1.7, .09
Processing speed 30.5 (10.2) 54 30.0 (11.3) 39 t91 = .23, .82
Reaction time .70 (.27) 54 .73 (24) 39 t91 = -.6, .51 Vestibular rehab measures
mean (SD) n mean (SD) n Dizziness
rating 14 (18) 53 30 (22) 31 t82 = -3.5, .001*
ABC 71 (28) 52 62 (25) 32 t82 = 1.4, .16 DHI 42 (21) 52 49 (18) 38 t83 = -1.8, .08 DGI 22 (2) 44 20 (4) 23 t27.7 = 2.8, .009* FGA 26 (4) 44 23 (6) 23 t31.3 = 2.6, .02*
GS (m/sec) 1.14 (.26) 46 1.03 (.22) 22 t66 = 1.7, .06 TUG (sec) 8.3 (1.7) 33 9.4 (2.7) 20 t27.6 = -1.6, .11
FTSTS (sec) 9.7 (3.5) 37 10.8 (3.8) 18 t54 = -1.1, .28 SOT 65 (12) 24 45 (23) 13 t15.9 = 3.01, .008*
n = Nu mber of participants, SD = Standard Deviation, ABC = Activ ities-specific Balance Confidence scale, DHI = Dizz iness Handicap Inventory, DGI = Dynamic Gait Index, FGA = Functional Gait Assessment, GS = Gait Speed, TUG = Timed “Up & Go”, FTSTS = Five Times Sit To Stand, SOT = Sensory Organization Test, r = Pearson product-moment correlation coefficient, rs Spearman's rank correlation coefficient
The change in self-report and clinical performance measures was calculated over an
average period of 50 days, (SD = 44 days) and the change in ImPACT was calculated over an
average period of 49 da ys (SD = 43 days). A paired t-test revealed that this group of 39
participants who were included in this analysis exhibited a greater change in the vestibular/
balance symptoms subset (M = -1.5, SD = 1.0) compared to other symptoms (M = -0.9, SD =0.9)
= over the course of vestibular physical therapy (t38 = -6.1, p <.001).

108
The results of analysis of relationship between change in ImPACT composite scores and
change in self-report and clinical performance measures revealed that no significant relationship
was found after adjusting for multiple comparisons using the FDR method (Table 6-4).
Table 6-4: Relationship between change in Vestibular/ balance measures and change in imPACT
composites and the total symptom score
Change score (n)
Verbal memory
Visual memory
Processing speed
Reaction time
Total symptom score
Dizziness rating
(31) rs = -.153, p = .413 rs = -.052, p = .781 rs =.134, p = .473 rs = -.079, p =.674 rs = -.074, p = .694
ABC (32)
rs =.036, p = .847 rs =.107, p = .559 rs =.191, . p =296 rs = -.199, p =.276 rs = -.333, p = .062
DHI (33)
rs = -.275, p = .122 rs = -.222, p = .122 rs = -.366, p = .036 rs =.166, p = .356 rs =.345, p =.049
FGA (23)
rs =.327, p = .128 rs =.201, p = .358 rs =.592, p = .003 rs = -.335, p = .118 rs = -.070, p = .750
GS (22)
rs =.282, p = .204 rs =.222, p = .321 rs =.377, p = .084 rs = -.232, p = .299 rs =.064, p = .776
TUG (20)
rs = -.438, p = .053 rs = -.008, p = .972 rs = -.366, p = .112 rs =.059, p = 803 rs = -.197, p = .406
FTSTS (18)
rs = -.265, p = .287 rs = -.232, p =.354 rs = -.292, p =.240 rs =.688, p =.002 rs =.171, p = .499
n = Number of participants, ABC = Activities-specific Balance Confidence scale, DHI = Dizziness Handicap Inventory, FGA = Functional Gait Assessment, GS = Gait Speed, TUG = Timed “Up & Go”, FTSTS = Five Times Sit To Stand. rs = Spearman's rank correlation coefficient
The analysis of whether a change in the “vestibular” symptoms of PCS relates better to
the change in the vestibular measures than total symptom score revealed that no differences were
found between the change in vestibular symptoms when compared to the change in the total
symptom score. (Table 6-5)

109
Table 6-5: Relationship between change in symptom scores and change in measures administered
over the course of vestibular rehabilitation
Change in outcome measure (n)
Change in total symptom score
Change in vestibular symptoms
Dizziness rating (31)
rs = -.074, p= .69 rs =.026, p= .89
ABC (32)
rs = -.333, p=.06 rs = -.348, p= .05
DHI (33)
rs =.345*, p= .049 rs =.307, p= .08
FGA (23)
rs = -.070, p= .75 rs = -.072, p= .75
GS (22)
rs =.064, p= .77 rs = -.057, p=.80
TUG (20)
rs = -.197, p= .41 rs = -.136, p= .57
FTSTS (18)
rs =.171, p= .49 rs =.386, p= .11
n = Number of participants, ABC = Activities-specific Balance Confidence scale, DHI = Dizziness Handicap Inventory, FGA = Functional Gait Assessment, GS = Gait Speed, TUG = Timed “Up & Go”, FTSTS = Five Times Sit To Stand, rs = Spearman's rank correlation coefficient
6.4 DISCUSSION
A number of significant correlations (33/70) were found between the ImPACT performance
scores and measures administered at the time of start of vestibular physical therapy. However, no
significant relationships were found between the change in ImPACT composites and the change
in gait/ balance measures. Although all performance composite scores in ImPACT exhibited
some significant correlations with measures administered at the start of vestibular physical
therapy, it was noted that correlations were centered on visual memory compared to reaction
time, verbal memory and processing speed evidenced by more number of significant
relationships found with visual memory. Additionally, although FGA, FTSTS and Condition 2 of

110
SOT were significantly correlated to all ImPACT composite scores, the correlation coefficients
were higher (i.e. moderate) for visual memory and reaction time compared with correlations
exhibited for verbal memory and processing speed. Visual memory is a composite score that is
extracted from the Design Memory test and the X’s and O’s test in ImPACT. The vestibular
subset of symptoms seems to relate better to the self report measures of dizziness severity rating
and ABC. However, the vestibular subset of symptoms in this manuscript did not exhibit
stronger relationship to the clinical balance measures compared to the total symptom score.
The comparison between the results of this manuscript with the results of previous
research that studied the correlation between measures after concussion is limited. According to
our knowledge, there were no p revious research studies that have examined the relationship
between ImPACT composite scores and the balance outcomes used in this study. A previous
study suggested a relationship between self- report symptoms related to neurocognition (i.e.
difficulty remembering, difficulty concentration, and feeling mentally foggy) and neurocogntive
testing performance.21 Also, a relationship was supported between self- reported symptoms
related to balance (i.e. dizziness and balance problems) and balance performance. However, the
evidence is less clear when the comparison is made between neurocognitive testing and balance
performance. Broglio et al. examined if the symptoms of “feeling mentally foggy”, “difficulty
concentrating”, and “difficulty remembering” are associated with decreased cognitive
performance (i.e. ImPACT composite scores). The results revealed a significant correlation
between “feeling mentally foggy” and reaction time (rs = 0.36), between “difficulty
concentrating” and verbal memory (rs = -0.41), and between “difficulty remembering” and
change in verbal memory and reaction time (rs = 0.48 and 0.36, respectively).21

111
The absence of a relationship between the change scores in measures administered during
vestibular physical therapy may indicate that the recovery of neurocognitive domains and gait/
balance deficits are different. Moreover, over the period when change scores were calculated,
patients received a customized intervention based on the deficits found at the initial vestibular
evaluation and they were discharged based on the improvement in vestibular outcomes at the
time of discharge. Consequently, this specificity of intervention to vestibular impairments may
have contributed to the lack of relationship between the change in ImPACT composite scores
and change in vestibular symptoms. The significant difference found between change in
“vestibular” symptoms (M = -1.5, SD = 1.0) compared to other symptoms (M = -0.9, SD =0.9),
(t38 = -6.1, p <.001) may support the notion that the vestibular/ balance symptoms may have
changed differently attributed in part to the vestibular physical therapy exercises. Therefore, this
may have altered the relationship with total symptom score.
Additionally, the absence of relationships found in this sample may be explained by
reasons related to the methodology and analysis used in the current manuscript; the analysis of
change relationships may have been underpowered due to the following factors: 1) Small number
of participants included in each analysis; although 39 pa rticipants qualified for the change
analysis, the actual numbers in each analysis ranged between 18 and 33, 2). Since we have also
used the FDR to control for the multiplicity of analyses, we may have further limited our ability
to find significant results.
Although the composite scores of visual memory and reaction time seem to better relate
to the initial measures of vestibular physical therapy, a different pattern is observed when the
relationship is closely examined for the change scores. If the relationship in change scores is to
be examined without adjustment for multiplicity of analysis (i.e. α = 0.05), the visual-motor

112
processing speed is significantly correlated with the change in DHI and FGA (and SOT
composite scores and Conditions 3, 5 and 6 not shown). This change in the trends of relationship
may suggest the exercises provided in the vestibular physical therapy may have been beneficial
to the cognitive domain of visual-motor processing speed.
The participants in this study were referred to vestibular physical therapy and they
reported significantly worse symptoms in “vestibular “symptoms compared to other symptoms
suggesting that the referral for vestibular physical therapy clinic was appropriate. Although this
group of concussion patients can be labeled as v estibular patients, the deficits reported in
neurocognitive performance testing (i.e. ImPACT) emphasize the universal effects of concussion
even within this group of individuals with concussion that have complaints of vestibular
symptoms beyond the third week after concussion.
The findings of this study re- emphasize the need for a comprehensive approach of
concussion management that takes into account the effects of concussion on different areas of
brain functioning and allow clinicians to make appropriate recommendations on return to play or
work after concussion.103
Although this study aimed to examine the relationship between the neurocognitive and
balance performance and recovery after concussion, the design of the study was limited;
therefore, the results of this study are only preliminary and intended to guide future research
directions. The participants included in this study were obtained from a clinical population of
patients referred by one practice for vestibular physical therapy were the referral process was
solely based on clinical judgment and is often made if the patients are not recovering concussion.
The majority of participants [n = 85 (91 %)] were referred after three weeks of
concussion, and therefore this sample does not represent the wide spectrum of individuals with

113
concussion who will make full recovery by t he third week post- concussion. The relationship
between neurocognitive functioning and balance functioning may have been different if
examined in the acute (i.e. < 3 weeks) vs. chronic phase after concussion. Furthermore, the
participants of this study are clearly experiencing “vestibular” symptoms compared to other
symptoms, suggesting the referral to vestibular physical therapy was a sound clinical decision.
However, there might have been individuals with prolonged recovery that are managed in
other adjacent interventions and were not referred to vestibular physical therapy. Consequently,
the relationships found in this study could be different if examined in a larger group of
individuals with prolonged recovery after concussion (with and without vestibular deficit).
In summary, the participants of this study represent a sm all percentage of individuals
with concussion who are thought to benefit from vestibular physical therapy after
balance/dizziness related symptoms that lasted beyond the normal window of recovery.
Therefore, this sample does not represent the majority of individuals with concussion who
achieve full recovery before the third week after injury.
Furthermore, due to the retrospective design of this manuscript, the time points
considered for the correlation analyses were highly variable between participants and may have
influenced the findings of this study. Although the time between vestibular measures and
ImPACT testing was not significantly related to any of the measures; it may have affected the
strength of correlation coefficients. A prospective design that allows concurrent neurocognitive
and gait/ balance evaluation may provide a better estimation about the relationship between
neurocogntive and gait/ balance functioning after concussion.
The results obtained from the analysis of relationship between change scores have
additional limitations; the participants included in this analysis tend to be more impaired in the

114
gait/ balance measures at the start of vestibular physical therapy and therefore, they may
represent even a smaller group of individuals with prolonged balance deficits after concussion
and does not represent the whole spectrum of individuals with prolonged balance deficits after
concussion.
Furthermore, while being treated with vestibular physical therapy, some participants were
treated with other interventions such as medications, an exertional physical therapy program, or
had restricted work or school access in order to minimize mental and physical exertion and to
expedite recovery. It is unclear if the different adjacent interventions may have affected the
results found in this group. Without a control group, the role of adjacent interventions on t he
relationship between the recovery of different domains cannot be ruled out. However, the
adjacent interventions provided for some participants in this study were reported in clinicians’
notes, and were not systematically recorded in the medical charts making the examination of its
role in the recovery process unattainable. A future prospective study design should consider the
uniformity of interventions for all participants, and should allow examining the effects of
adjacent interventions on the interrelationships between recovery of neurogognitive and gait/
balance outcomes after concussion.
The participants in this study endured sport-related and non-sport related concussions.
While the majority of concussion injuries in the adult participants were caused by non-
sport injuries, the sport related concussions represent almost 50% of concussions in children
participants (i.e. < 18y.o). Due to power related issues, we did not examine if the relationship
would be different between sport-related and non-sport related injuries and we did not examine if
the relationship is different between children and adults.

115
Although we acknowledge the limitations in this study, we believe that this study can
serve as a starting point to direct future research to examine the interrelationships between the
recovery of different domains. Despite the limitations of this study, the results demonstrated that
the relationships between gait/ balance measures appear to be centered on the visual memory and
reaction time at referral. However, the change obtained in vestibular measures may appear to be
centered on the visual-motor processing speed, and therefore future research should consider
these domains when examining the relationship between neurocognitive functioning and gait/
functional balance testing for further research.
6.5 CONCLUSION
The significant relationships between the ImPACT neurocognitive performance scores and
balance measures at the start of vestibular rehabilitation may reflect that similar levels of
functioning exist across domains. Future areas of exploration will include assessment of changes
in neurocognitive and balance function during vestibular rehabilitation to see if recovery of these
measures have similar trajectories.

116
7.0 FUTURE CONSIDERATIONS AND FUTURE DIRECTIONS
7.1 FUTURE CONSIDERATIONS
Based on the limitations we have encountered in the current dissertation, I have the following
suggestions for future considerations. In the first aim, we aimed to provide normative data and to
examine the reliability for clinical gait/ balance measures for healthy high school aged children.
We chose the participants from two private parochial schools in an urban location (one
female only, and one male only) and the other school was a public co-educational school in a
suburban school district. However, for future considerations, the schools should represent a
wider spectrum of socioeconomic status of rural and public schools. A future study should
include equal representation of students at all ages within our age range. Additionally we did not
collect race/ ethnicity data. However, race/ ethnicity should be reported to provide an indication
of how well participants match to the overall high school demographics of the USA. The
participants in aim one included athletes and non a thletes, a future study can examine if the
normative reference scores are different between athletes and non athletes. For the reliability
analysis, we should examine the inter rater reliability of the BESS test as it is being scored
clinically vs. videotaping.
When we examined the outcome of vestibular rehabilitation exercises, the majority of our
samples were referred for vestibular physical therapy while being managed with other

117
interventions. Unfortunately, there was no systematic reporting of other interventions and
therefore, the relative contribution of vestibular rehabilitation was not determined. A future
prospective study can examine the relative contribution of vestibular physical therapy and ensure
the uniformity of interventions. Furthermore, the majority of our participants were referred for
therapy beyond three weeks after concussion. A future study may consider if early referral
affects the outcomes of vestibular rehabilitation vs. later referrals for vestibular therapy.
When we recorded the exercise prescription patterns, we were not able to determine the
rationale for the exercise prescription; a future prospective study should examine the therapist
rationale for the exercise prescription and the rational for exercise progression. A prospective
design will also allow for less missing data.
Another suggestion for aim four is to design a prospective study in which the
neurocognitive testing and the balance testing are being concurrently examined. A prospective
study can also examine if the relationship between neurocognitive and balance recovery is
different between individuals treated with vestibular physical therapy vs. individuals who are not
being treated with vestibular physical therapy.
7.2 FUTURE DIRECTIONS
In order to provide a higher quality of evidence, I suggest the following design. Individuals with
concussion who are being seen by a neuropsychologist within the first three days of concussion
should be examined for both neurocognitive and balance deficits Time 1(t1). The results of this
testing will place the patients into one of three categories 1) Individuals with no neurocogntive
deficits and no ba lance deficits, 2) Individuals with neurocogntive deficits but no balance

118
deficits, and 3) Individuals with balance deficits (compared to reference scores) or high balance
symptom score (based on the “vestibular “subset of symptoms).
The individuals who did not have neuropsychological or balance impairments will not be
eligible whereas the individuals in the other two categories could be recruited for the study, after
the participants were enrolled in the study, the individuals who presented with neurocognitive
but not a balance deficit can be managed with traditional concussion management for five weeks.
The individuals who presented with balance deficits and/ or balance symptoms can be
allocated to one of the two study groups; the experimental group that includes a cu stomized
physical therapy program that is provided for the individuals two visits every week for 5 weeks
(based on the median number of treatment duration found in the second aim of the dissertation).
The control group will be managed by c onventional concussion management approach
for five weeks. After the fifth week, all participants will be examined for neurocognitive and
balance testing.
An independent t- test is conducted to examine if the individuals with balance deficits
(category 3) also exhibited worse neuropsychological performance compared with individuals
with no balance deficits (category 2) immediately post concussion.
After the five weeks, the change scores in neuropsychological and balance measures is
calculated (t2 – t1), an independent t- test is conducted to examine if the presence of the balance
deficits is associated with worse neuropsychological recovery by examining if the recovery in
ImPACT composite scores is different between the individuals with balance deficits (the control
group of category 3) and the individuals with only neurocogntive deficits (category 2).
For individuals in category three (balance deficits), an independent t- test can be
conducted to ensure the participants were not significantly different on a ny of the outcome
119
measures at the time of group allocation. An independent t- test is conducted to examine if the
change scores are significantly different between the groups treated with vestibular PT when
compared with the group of conventional concussion management (effect of vestibular PT).
After the change scores in neurocognitive measures and balance measures is calculated
for all participants, a co rrelation analysis is conducted. T he Fisher’s z test is conducted to
examine if the correlation between neuropsychological and balance recovery is different between
individuals treated with vestibular rehabilitation vs. individuals treated with conventional
management.

120
BIBLIOGRAPHY
1. Rutland-Brown W, Langlois JA, Thomas KE, Xi YL. Incidence of traumatic brain injury in the United States, 2003. J. Head Trauma Rehabil. 2006;21:544-548.
2. Control CfD. http://www.cdc.gov/ncipc/pub-res/TBI_in_US_04/TBI%20Tables_2003.pdf. http://www.cdc.gov/ncipc/pub-res/TBI_in_US_04/TBI%20Tables_2003.pdf. Accessed 11/06/2009, 2009.
3. Kraus JF. Epidemiological features of brain injury in children: occurrence, children at risk, causes and manner of injury, severity and outcomes. In: S. B, M. M, eds. Traumatic head injury in children: Oxford University Press; 1995:22-39.
4. McCrory P, Collie A, Anderson V, Davis G. Can we manage sport related concussion in children the same as in adults? Br. J. Sports Med. 2004;38:516-519.
5. Kraus JF, Nourjah P. The epidemiology of mild, uncomplicated brain injury. J Trauma. 1988;28:1637-1643.
6. Annegers JF, Grabow JD, Kurland LT, Laws ER, Jr. The incidence, causes, and secular trends of head trauma in Olmsted County, Minnesota, 1935-1974. Neurology. 1980;30:912-919.
7. Cassidy JD, Carroll LJ, Peloso PM, et al. Incidence, risk factors and prevention of mild traumatic brain injury: results of the WHO Collaborating Centre Task Force on Mild Traumatic Brain Injury. J Rehabil Med. 2004:28-60.
8. Langlois JA, Rutland-Brown W, Wald MM. The epidemiology and impact of traumatic brain injury: a brief overview. J. Head Trauma Rehabil. 2006;21:375-378.
9. Belanger HG, Vanderploeg RD. The neuropsychological impact of sports-related concussion: a meta-analysis. J. Int. Neuropsychol. Soc. 2005;11:345-357.
10. Bleiberg J, Cernich AN, Cameron K, et al. Duration of cognitive impairment after sports concussion. Neurosurgery. 2004;54:1073-1078.
11. Catale C, Marique P, Closset A, Meulemans T. Attentional and executive functioning following mild traumatic brain injury in children using the Test for Attentional Performance (TAP) battery. J Clin Exp Neuropsychol. 2009;31:331-338.
12. Iverson GL, Brooks BL, Collins MW, Lovell MR. Tracking neuropsychological recovery following concussion in sport. Brain Inj. 2006;20:245-252.
13. Gagnon I, Forget R, Sullivan SJ, Friedman D. Motor performance following a mild traumatic brain injury in children: an exploratory study. Brain Inj. 1998;12:843-853.
14. Guskiewicz KM. Postural stability assessment following concussion: one piece of the puzzle. Clin J Sport Med. 2001;11:182-189.

121
15. Catena RD, van Donkelaar P, Chou LS. Different gait tasks distinguish immediate vs. long-term effects of concussion on balance control. J. Neuroeng & Rehabil. 2009;6.
16. Guskiewicz KM. Assessment of postural stability following sport-related concussion. . Curr. Sports med rep. 2003;2:24-30.
17. Randolph C, Millis S, Barr WB, et al. Concussion symptom inventory: an empirically derived scale for monitoring resolution of symptoms following sport-related concussion. Arch Clin Neuropsychol. 2009;24:219-229.
18. Lovell MR, Iverson GL, Collins MW, et al. Measurement of symptoms following sports-related concussion: reliability and normative data for the post-concussion scale. Appl. Neuropsych. 2006;13:166-174.
19. Broglio SP, Puetz TW. The effect of sport concussion on neurocognitive function, self-report symptoms and postural control: A meta-analysis. Sports Med. 2008;38:53-67.
20. Broglio SP, Macciocchi SN, Ferrara MS. Sensitivity of the concussion assessment battery. Neurosurgery. 2007;60:1050-1057.
21. Broglio SP, Sosnoff JJ, Ferrara MS. The relationship of athlete-reported concussion symptoms and objective measures of neurocognitive function and postural control. Clin J Sport Med. 2009;19:377-382.
22. McCrory P, Johnston K, Meeuwisse W, et al. Summary and agreement statement of the second international conference on concussion in sport, prague 2004. Phys Sportsmed. 2005;33:29-44.
23. Grindel SH, Lovell MR, Collins MW. The assessment of sport-related concussion: the evidence behind neuropsychological testing and management. Clin J Sport Med. 2001;11:134-143.
24. Maroon JC, Lovell MR, Norwig J, Podell K, Powell JW, Hartl R. Cerebral concussion in athletes: evaluation and neuropsychological testing. Neurosurgery. 2000;47:659-669.
25. Campbell M, Parry A. Balance disorder and traumatic brain injury: preliminary findings of a multi-factorial observational study. Brain Inj. 2005;19:1095-1104.
26. Gagnon I, Swaine B, Friedman D, et al. Children show decreased dynamic balance after mild traumatic brain injury. Arch. Phys. Med. Rehabil. 2004;85:444-452.
27. Basford JR, Chou LS, Kaufman KR, et al. An assessment of gait and balance deficits after traumatic brain injury. Arch. Phys. Med. Rehabil. 2003;84:343-349.
28. Kaufman KR, Brey RH, Chou LS, et al. Comparison of subjective and objective measurements of balance disorders following traumatic brain injury. Med Eng Phys. 2006;28:234-239.
29. Catena RD, van Donkelaar P, Chou LS. Altered balance control following concussion is better detected with an attention test during gait. Gait Posture. 2007;25:406-411.
30. Guskiewicz KM, Perrin DH, Gansneder BM. Effect of Mild Head Injury on P ostural Stability in Athletes. J Athl Train. 1996;31:300-306.
31. McCrea M, Guskiewicz KM, Marshall SW, et al. Acute effects and recovery time following concussion in collegiate football players: the NCAA Concussion Study. JAMA. 2003;290:2556-2563.
32. Johnston KM, Bloom GA, Ramsay J, et al. Current concepts in concussion rehabilitation. Curr. Sports med rep. 2004;3:316-323.
33. Gizzi M. Critical review: The efficacy of vestibular rehabilitation for patients with head trauma. J. Head Trauma Rehabil. 1995;10:60-77.

122
34. Hoffer ME, Gottshall KR, Moore R, Balough BJ, Wester D. Characterizing and treating dizziness after mild head trauma. Otol. and Neurotol. 2004;25:135-138.
35. Comper P, Bisschop SM, Carnide N, Tricco A. A systematic review of treatments for mild traumatic brain injury. Brain Inj. 2005;19:863-880.
36. Elgmark Andersson E, Emanuelson I, Bjorklund R, Stalhammar DA. Mild traumatic brain injuries: the impact of early intervention on late sequelae. A randomized controlled trial. Acta Neurochirurgica. 2007;149:151-159.
37. Gordon CR, Levite R, Joffe V, et al. Is posttraumatic benign paroxysmal positional vertigo different from the idiopathic form? Arch Neurol. 2004;61:1590-1593.
38. Gottshall KR, Moore RJ, Hoffer ME, Gottshall KR, Moore RJ, Hoffer ME. Vestibular rehabilitation for migraine-associated dizziness. Int. Tinnit. J. 2005;11:81-84.
39. Herdman SJ. Treatment of vestibular disorders in traumatically brain-injured patients. J. Head Trauma Rehabil. 1990;5:63-76.
40. Kissick J, Johnston KM. Return to play after concussion: principles and practice. Clin J Sport Med. 2005;15:426-431.
41. Friedman JM, Friedman JM. Post-traumatic vertigo. Med Health R I. 2004;87:296-300. 42. Davies RA, Luxon LM. Dizziness following head injury: a neuro-otological study. J
Neurol. 1995;242:222-230. 43. Gottshall K, Drake A, Gray N, et al. Objective vestibular tests as outcome measures in
head injury patients. Laryngoscope. 2003;113:1746-1750. 44. Gurr B, Moffat N. Psychological consequences of vertigo and the effectiveness of
vestibular rehabilitation for brain injury patients. Brain Inj. 2001;15:387-400. 45. Shumway-Cook A. Assessment and Management of the patient with Traumatic Brain
Injury and Vestibular Dysfunction. In: Herdman SJ, ed. Vestibular Rehabilitation. Third Edition ed. Philadelphia: F.A. Davis company; 2007:444 - 457.
46. Belanger HG, Curtiss G, Demery JA, Lebowitz BK, Vanderploeg RD. Factors moderating neuropsychological outcomes following mild traumatic brain injury: a meta-analysis. J. Int. Neuropsychol. Soc. 2005;11:215-227.
47. Vanderploeg RD, Curtiss G, Belanger HG. Long-term neuropsychological outcomes following mild traumatic brain injury. J. Int. Neuropsychol. Soc. 2005;11:228-236.
48. Guskiewicz KM, Ross SE, Marshall SW. Postural Stability and Neuropsychological Deficits After Concussion in Collegiate Athletes. J Athl Train. 2001;36:263-273.
49. Lange RT, Iverson GL, Franzen MD. Neuropsychological functioning following complicated vs. uncomplicated mild traumatic brain injury. Brain Inj. 2009;23:83-91.
50. Fazio VC, Lovell MR, Pardini JE, Collins MW. The relation between post concussion symptoms and neurocognitive performance in concussed athletes. NeuroRehabilitation. 2007;22:207-216.
51. Kirkwood MW, Yeates KO, Taylor HG, Randolph C, McCrea M, Anderson VA. Management of pediatric mild traumatic brain injury: a neuropsychological review from injury through recovery. Clin. Neuropsych. 2008;22:769-800.
52. Carroll LJ, Cassidy JD, Holm L, Kraus J, Coronado VG. Methodological issues and research recommendations for mild traumatic brain injury: the WHO Collaborating Centre Task Force on Mild Traumatic Brain Injury. J Rehabil Med. 2004:113-125.
53. Medicine ACoR. Definition of mild traumatic brain injury. J. Head Trauma Rehabil. 1993;8:86-87.

123
54. Neurology AAo. Practice parameter: the management of concussion in sports (summary statement). Report of the Quality Standards Subcommittee. Neurology. 1997;48:581-585.
55. Pediatrics AAo. The management of minor closed head injury in children. Committee on Quality Improvement, American Academy of Pediatrics. Commission on Clinical Policies and Research, American Academy of Family Physicians. Pediatrics. 1999;104:1407-1415.
56. Surgeons CoN. Committee on head injury nomenclature: Glossary of head injury. Clin. Neurosurg. 1966;12:386-384.
57. Collins MW, Hawn KL. The clinical management of sports concussion. Curr. Sports med rep. 2002;1:12-22.
58. Johnston KM, McCrory P, Mohtadi NG, Meeuwisse W. Evidence-Based review of sport-related concussion: clinical science. Clin J Sport Med. 2001;11:150-159.
59. Schatz P, Pardini JE, Lovell MR, Collins MW, Podell K. Sensitivity and specificity of the ImPACT Test Battery for concussion in athletes. Arch Clin Neuropsychol. 2006;21:91-99.
60. Reddy CC, Collins MW, Gioia GA. Adolescent sports concussion. Phys Med Rehabil Clin N Am. 2008;19:247-269.
61. Lovell MR, Iverson GL, Collins MW, McKeag D, Maroon JC. Does loss of consciousness predict neuropsychological decrements after concussion? Clin J Sport Med. 1999;9:193-198.
62. Collins MW, Iverson GL, Lovell MR, McKeag DB, Norwig J, Maroon J. On-field predictors of neuropsychological and symptom deficit following sports-related concussion. Clin J Sport Med. 2003;13:222-229.
63. Lovell MR, Collins MW, Iverson GL, Johnston KM, Bradley JP. Grade 1 or "ding" concussions in high school athletes. Am. J. Sports Med. 2004;32:47-54.
64. Field M, Collins MW, Lovell MR, Maroon J. Does age play a r ole in recovery from sports-related concussion? A comparison of high school and collegiate athletes. J Pediatr. 2003;142:546-553.
65. Lovell MR, Collins MW, Iverson GL, et al. Recovery from mild concussion in high school athletes. J. Neurosurg. 2003;98:296-301.
66. Sim A, Terryberry-Spohr L, Wilson KR. Prolonged recovery of memory functioning after mild traumatic brain injury in adolescent athletes. J. Neurosurg. 2008;108:511-516.
67. Covassin T, Schatz P, Swanik CB. Sex differences in neuropsychological function and post-concussion symptoms of concussed collegiate athletes. Neurosurgery. 2007;61:345-350.
68. Broshek DK, Kaushik T, Freeman JR, Erlanger D, Webbe F, Barth JT. Sex differences in outcome following sports-related concussion. J. Neurosurg. 2005;102:856-863.
69. Colvin AC, Mullen J, Lovell MR, West RV, Collins MW, Groh M. The role of concussion history and gender in recovery from soccer-related concussion. Am. J. Sports Med. 2009;37:1699-1704.
70. McCrory P, Meeuwisse W, Johnston K, et al. Consensus statement on C oncussion in Sport 3rd International Conference on C oncussion in Sport held in Zurich, November 2008. Clin J Sport Med. 2009;19:185-200.
71. Cohen JS, Gioia G, Atabaki S, Teach SJ. Sports-related concussions in pediatrics. Curr. Opin. Pediatr. 2009;21:288-293.

124
72. Akhavan A, Flores C, Green S, et al. Clinical inquiries. How should we follow athletes after a concussion? J. Fam. Pract. 2005;54:902-904.
73. Thurman DJ. The Epidemiology and economics of head trauma. In: Miller L, Ayes R, eds. Head Trauma: Basic, Preclinical, and Clinical Directions. New York: John Wiley and Sons; 2001:327-347.
74. Wade DT, King NS, Wenden FJ, Crawford S, Caldwell FE. Routine follow up after head injury: a second randomised controlled trial. J Neurol Neurosurg Psychiatry. 1998;65:177-183.
75. Sports-related recurrent brain injuries--United States. MMWR Morb Mortal Wkly Rep. 1997;46:224-227.
76. Macciocchi SN, Barth JT, Alves W, Rimel RW, Jane JA. Neuropsychological functioning and recovery after mild head injury in collegiate athletes. Neurosurgery. 1996;39:510-514.
77. McCrea M, Kelly JP, Randolph C, et al. Standardized assessment of concussion (SAC): on-site mental status evaluation of the athlete. J. Head Trauma Rehabil. 1998;13:27-35.
78. Goldberg LD, Dimeff RJ, Goldberg LD, Dimeff RJ. Sideline management of sport-related concussions. Sports med. 2006;14:199-205.
79. Powell JW, Barber-Foss KD. Traumatic brain injury in high school athletes. JAMA. 1999;282:958-963.
80. Collins MW, Grindel SH, Lovell MR, et al. Relationship between concussion and neuropsychological performance in college football players. JAMA. 1999;282:964-970.
81. Koh JO, Cassidy JD, Watkinson EJ. Incidence of concussion in contact sports: a systematic review of the evidence. Brain Inj. 2003;17:901-917.
82. Lee MA. Adolescent concussions--management recommendations: a practical approach. Conn. Med. 2006;70:377-380.
83. McCrea M, Hammeke T, Olsen G, Leo P, Guskiewicz K. Unreported concussion in high school football players: implications for prevention. Clin J Sport Med. 2004;14:13-17.
84. Guskiewicz KM, Bruce SL, Cantu RC, et al. National Athletic Trainers' Association Position Statement: Management of Sport-Related Concussion. J Athl Train. 2004;39:280-297.
85. Williamson IJ, Goodman D. Converging evidence for the under-reporting of concussions in youth ice hockey. Br. J. Sports Med. 2006;40:128-132.
86. Sosin DM, Sniezek JE, Thurman DJ. Incidence of mild and moderate brain injury in the United States, 1991. Brain Inj. 1996;10:47-54.
87. Bazarian JJ, McClung J, Shah MN, Cheng YT, Flesher W, Kraus J. Mild traumatic brain injury in the United States, 1998--2000. Brain Inj. 2005;19:85-91.
88. Meehan WP, 3rd, Bachur RG. Sport-related concussion. Pediatrics. 2009;123:114-123. 89. Thurman DJ, Branche CM, Sniezek JE. The epidemiology of sports-related traumatic
brain injuries in the United States: recent developments. J. Head Trauma Rehabil. 1998;13:1-8.
90. Kelly JP. Traumatic brain injury and concussion in sports. JAMA. 1999;282:989-991. 91. Finkelstein E, Corso P, Miller T. The Incidence and Economic Burden of Injuries in the
United States. New York: Oxford University Press; 2006. 92. Findler M, Cantor J, Haddad L, Gordon W, Ashman T. The reliability and validity of the
SF-36 health survey questionnaire for use with individuals with traumatic brain injury. Brain Inj. 2001;15:715-723.

125
93. Rutherford WH, Merrett JD, McDonald JR. Symptoms at one year following concussion from minor head injuries. Injury. 1979;10:225-230.
94. Ganesalingam K, Yeates KO, Ginn MS, et al. Family burden and parental distress following mild traumatic brain injury in children and its relationship to post-concussive symptoms. J. Pediatr. Psychol. 2008;33:621-629.
95. McCrea M, Kelly JP, Randolph C, Cisler R, Berger L. Immediate neurocognitive effects of concussion. Neurosurgery. 2002;50:1032-1040.
96. Hinton-Bayre AD, Geffen GM, Geffen LB, McFarland KA, Friis P. Concussion in contact sports: reliable change indices of impairment and recovery. J Clin Exp Neuropsychol. 1999;21:70-86.
97. Maddocks D, Saling M. Neuropsychological deficits following concussion. Brain Inj. 1996;10:99-103.
98. Iverson GL. Complicated vs uncomplicated mild traumatic brain injury: acute neuropsychological outcome. Brain Inj. 2006;20:1335-1344.
99. Matser EJ, Kessels AG, Lezak MD, Jordan BD, Troost J. Neuropsychological impairment in amateur soccer players. JAMA. 1999;282:971-973.
100. McCrea M. Standardized mental status assessment of sports concussion. Clin J Sport Med. 2001;11:176-181.
101. Lovell MR, Collins MW. Neuropsychological assessment of the college football player. J. Head Trauma Rehabil. 1998;13:9-26.
102. Majerske CW, Mihalik JP, Ren D, et al. Concussion in sports: postconcussive activity levels, symptoms, and neurocognitive performance. J Athl Train. 2008;43:265-274.
103. Aubry M, Cantu R, Dvorak J, et al. Summary and agreement statement of the First International Conference on C oncussion in Sport, Vienna 2001. Recommendations for the improvement of safety and health of athletes who may suffer concussive injuries. Br. J. Sports Med. 2002;36:6-10.
104. Lovell MR. The relevance of neuropsychologic testing for sports-related head injuries. Curr. Sports med rep. 2002;1:7-11.
105. Echemendia RJ, Cantu RC. Return to play following sports-related mild traumatic brain injury: the role for neuropsychology. Appl. Neuropsych. 2003;10:48-55.
106. Lovell MR, Collins MW. New developments in the evaluation of sports-related concussion. Curr. Sports med rep. 2002;1:287-292.
107. Grindel SH. The use, abuse, and future of neuropsychologic testing in mild traumatic brain injury. Curr. Sports med rep. 2006;5:9-14.
108. Iverson GL. Outcome from mild traumatic brain injury. Curr Opin Psychiatry. 2005;18:301-317.
109. Watson MR, Fenton GW, McClelland RJ, Lumsden J, Headley M, Rutherford WH. The post-concussional state: neurophysiological aspects. Br. J. Psychiatry. 1995;167:514-521.
110. Lovell M. The management of sports-related concussion: current status and future trends. Clin. Sports Med. 2009;28:95-111.
111. Collie A, Maruff P, McStephen M, Darby DG. Psychometric issues associated with computerised neuropsychological assessment of concussed athletes. Br. J. Sports Med. 2003;37:556-559.
112. McCrea M, Barr WB, Guskiewicz K, et al. Standard regression-based methods for measuring recovery after sport-related concussion. J. Int. Neuropsychol. Soc. 2005;11:58-69.

126
113. Zakzanis KK, Leach L, Kaplan E. Mild Traumatic Brain Injury. Neuropsychological Differential Diagnosis. Exton: Pennsylvania; 1999:161-171.
114. Binder LM, Rohling ML, Larrabee GJ. A review of mild head trauma: I. Meta-analytic review of neuropsychological studies. J Clin Exp Neuropsychol. 1997;19:421-431.
115. Schretlen DJ, Shapiro AM. A quantitative review of the effects of traumatic brain injury on cognitive functioning. Int Rev Psychiatry. 2003;15:341-349.
116. Collie A, Darby D, Maruff P. Computerised cognitive assessment of athletes with sports related head injury. Br. J. Sports Med. 2001;35:297-302.
117. MCCaffrey RJ, Duff K, Westervelt HJ. Practitioners Guide to Evaluate Change in Neuropsychological Assessment Instruments. New York: Klewer Academic; 2000.
118. Benedict RH, Zgaljardic DJ. Practice effects during repeated administrations of memory tests with and without alternate forms. J Clin Exp Neuropsychol. 1998;20:339-352.
119. Echemendia RJ, Putukian M, Mackin RS, Julian L, Shoss N. Neuropsychological test performance prior to and following sports-related mild traumatic brain injury. Clin J Sport Med. 2001;11:23-31.
120. Mathias JL, Beall JA, Bigler ED. Neuropsychological and information processing deficits following mild traumatic brain injury. J. Int. Neuropsychol. Soc. 2004;10:286-297.
121. Kwok FY, Lee TM, Leung CH, Poon WS. Changes of cognitive functioning following mild traumatic brain injury over a 3-month period. Brain Inj. 2008;22:740-751.
122. Ellemberg D, Leclerc S, Couture S, Daigle C. Prolonged neuropsychological impairments following a f irst concussion in female university soccer athletes. Clin J Sport Med. 2007;17:369-374.
123. Erlanger D, Feldman D, Kutner K, et al. Development and validation of a web-based neuropsychological test protocol for sports-related return-to-play decision-making. Arch Clin Neuropsychol. 2003;18:293-316.
124. Erlanger D, Saliba E, Barth J, Almquist J, Webright W, Freeman J. Monitoring Resolution of Postconcussion Symptoms in Athletes: Preliminary Results of a Web-Based Neuropsychological Test Protocol. J Athl Train. 2001;36:280-287.
125. Guskiewicz KM, Bruce SL, Cantu RC, et al. Recommendations on management of sport-related concussion: summary of the National Athletic Trainers' Association position statement. Neurosurgery. 2004;55:891-895.
126. Schatz P, Zillmer EA. Computer-based assessment of sports-related concussion. Appl. Neuropsych. 2003;10:42-47.
127. McCrory P, Makdissi M, Davis G, Collie A. Value of neuropsychological testing after head injuries in football. Br. J. Sports Med. 2005;39.
128. Reddy CC, Collins MW. Sports concussion: management and predictors of outcome. Curr. Sports med rep. 2009;8:10-15.
129. Moser RS, Iverson GL, Echemendia RJ, et al. Neuropsychological evaluation in the diagnosis and management of sports-related concussion. Arch Clin Neuropsychol. 2007;22:909-916.
130. Pellman EJ, Lovell MR, Viano DC, Casson IR. Concussion in professional football: recovery of NFL and high school athletes assessed by computerized neuropsychological testing--Part 12. Neurosurgery. 2006;58:263-274; discussion 263-274.
131. Makdissi M, Collie A, Maruff P, et al. Computerised cognitive assessment of concussed Australian Rules footballers. Br. J. Sports Med. 2001;35:354-360.

127
132. Warden DL, Bleiberg J, Cameron KL, et al. Persistent prolongation of simple reaction time in sports concussion. Neurology. 2001;57:524-526.
133. CogSport [computer program]. Parkville, Victoria, Australia1999. 134. Bleiberg J, Cernich AN, Cameron K, et al. Duration of cognitive impairment after sports
concussion. Neurosurgery. 2004;54:1073-1078; discussion 1078-1080. 135. Erlanger DM, Kaushik T, Broshek D, Freeman J, Feldman D, Festa J. Development and
validation of a web-based screening tool for monitoring cognitive status. J. Head Trauma Rehabil. 2002;17:458-476.
136. Iverson GL, Lovell MR, Collins MW. Validity of ImPACT for measuring processing speed following sports-related concussion. J Clin Exp Neuropsychol. 2005;27:683-689.
137. Schatz P, Putz BO. Cross-validation of measures used for computer-based assessment of concussion. Appl. Neuropsych. 2006;13:151-159.
138. Iverson GL, Lovell MR, Collins MW. Interpreting change on ImPACT following sport concussion. Clin. Neuropsych. 2003;17:460-467.
139. McClincy MP, Lovell MR, Pardini J, Collins MW, Spore MK. Recovery from sports concussion in high school and collegiate athletes. Brain Inj. 2006;20:33-39.
140. Collins MW, Field M, Lovell MR, et al. Relationship between postconcussion headache and neuropsychological test performance in high school athletes. Am. J. Sports Med. 2003;31:168-173.
141. Iverson GL, Gaetz M, Lovell MR, Collins MW. Relation between subjective fogginess and neuropsychological testing following concussion. J. Int. Neuropsychol. Soc. 2004;10:904-906.
142. Iverson GL, Brooks BL, Lovell MR, Collins MW. No cumulative effects for one or two previous concussions. Br. J. Sports Med. 2006;40:72-75.
143. Iverson GL, Gaetz M, Lovell MR, Collins MW. Cumulative effects of concussion in amateur athletes. Brain Inj. 2004;18:433-443.
144. Riemann BL, Guskiewicz KM. Effects of Mild Head Injury on P ostural Stability as Measured Through Clinical Balance Testing. J Athl Train. 2000;35:19-25.
145. Geurts AC, Ribbers GM, Knoop JA, van Limbeek J. Identification of static and dynamic postural instability following traumatic brain injury. Arch. Phys. Med. Rehabil. 1996;77:639-644.
146. Guskiewicz KM, Riemann BL, Perrin DH, Nashner LM. Alternative approaches to the assessment of mild head injury in athletes. Med & Sci in Sports & Ex's. 1997;29.
147. Peterson CL, Ferrara MS, Mrazik M, Piland S, Elliott R. Evaluation of neuropsychological domain scores and postural stability following cerebral concussion in sports. Clin J Sport Med. 2003;13:230-237.
148. Slobounov S, Tutwiler R, Sebastianelli W, Slobounov E. Alteration of postural responses to visual field motion in mild traumatic brain injury. Neurosurgery. 2006;59:134-139.
149. Catena RD, van Donkelaar P, Halterman CI, Chou LS. Spatial orientation of attention and obstacle avoidance following concussion. Exp Brain Res. 2009;194:67-77.
150. Parker TM, Osternig LR, Lee H, van Donkelaar P, Chou L. The effect of divided attention on gait stability following concussion. Clin. Biomech. 2005;20:389-395.
151. Parker TM, Osternig LR, P VAND, Chou LS. Gait stability following concussion. Med. Sci. Sports Exerc. 2006;38:1032-1040.
152. Parker TM, Osternig LR, van Donkelaar P, Chou LS. Balance control during gait in athletes and non-athletes following concussion. Med Eng Phys. 2008;30:959-967.

128
153. Sosnoff JJ, Broglio SP, Ferrara MS. Cognitive and motor function are associated following mild traumatic brain injury. Exp Brain Res. 2008;187:563-571.
154. Notebaert AJ, Guskiewicz KM. Current trends in athletic training practice for concussion assessment and management. J Athl Train. 2005;40:320-325.
155. Moser RS, Schatz P, Jordan BD. Prolonged effects of concussion in high school athletes. Neurosurgery. 2005;57:300-306.
156. Lau B, Lovell MR, Collins MW, Pardini J. Neurocognitive and symptom predictors of recovery in high school athletes. Clin J Sport Med. 2009;19:216-221.
157. Piland SG, Motl RW, Guskiewicz KM, McCrea M, Ferrara MS. Structural validity of a self-report concussion-related symptom scale. Med & Sci in Sports & Ex's. 2006;38:27-32.
158. Mihalik JP, Stump JE, Collins MW, Lovell MR, Field M, Maroon JC. Posttraumatic migraine characteristics in athletes following sports-related concussion. J. Neurosurg. 2005;102:850-855.
159. Iverson G. Predicting slow recovery from sport-related concussion: the new simple-complex distinction. Clin J Sport Med. 2007;17:31-37.
160. King NS, Crawford S, Wenden FJ, Moss NE, Wade DT. The Rivermead Post Concussion Symptoms Questionnaire: a m easure of symptoms commonly experienced after head injury and its reliability. J Neurol. 1995;242:587-592.
161. LaBotz M, Martin MR, Kimura IF, Hetzler RK, Nichols AW. A comparison of a preparticipation evaluation history form and a symptom-based concussion survey in the identification of previous head injury in collegiate athletes. Clin J Sport Med. 2005;15:73-78.
162. Eyres S, Carey A, Gilworth G, Neumann V, Tennant A. Construct validity and reliability of the Rivermead Post-Concussion Symptoms Questionnaire. Clin Rehabil. 2005;19:878-887.
163. Chamelian L, Feinstein A, Chamelian L, Feinstein A. Outcome after mild to moderate traumatic brain injury: the role of dizziness. Arch. Phys. Med. Rehabil. 2004;85:1662-1666.
164. Ghaffar O, McCullagh S, Ouchterlony D, Feinstein A. Randomized treatment trial in mild traumatic brain injury. J. Psychosom. Res. 2006;61:153-160.
165. Heitger MH, Jones RD, Frampton CM, Ardagh MW, Anderson TJ. Recovery in the first year after mild head injury: divergence of symptom status and self-perceived quality of life. J Rehabil Med. 2007;39:612-621.
166. Jakola AS, Muller K, Larsen M, Waterloo K, Romner B, Ingebrigtsen T. Five-year outcome after mild head injury: a prospective controlled study. Acta Neurol Scand. 2007;115:398-402.
167. Preiss-Farzanegan SJ, Chapman B, Wong TM, Wu J, Bazarian JJ. The relationship between gender and postconcussion symptoms after sport-related mild traumatic brain injury. Pm & R. 2009;1:245-253.
168. Roe C, Sveen U, Alvsaker K, Bautz-Holter E. Post-concussion symptoms after mild traumatic brain injury: influence of demographic factors and injury severity in a 1-year cohort study. Disabil Rehabil. 2009;31:1235-1243.
169. Stulemeijer M, Vos PE, Bleijenberg G, van der Werf SP. Cognitive complaints after mild traumatic brain injury: things are not always what they seem. J. Psychosom. Res. 2007;63:637-645.

129
170. Lannsjo M, af Geijerstam JL, Johansson U, Bring J, Borg J. Prevalence and structure of symptoms at 3 months after mild traumatic brain injury in a national cohort. Brain Inj. 2009;23:213-219.
171. Blinman TA, Houseknecht E, Snyder C, Wiebe DJ, Nance ML. Postconcussive symptoms in hospitalized pediatric patients after mild traumatic brain injury. J Pediatr Surg. 2009;44:1223-1228.
172. Faux S, Sheedy J. A prospective controlled study in the prevalence of posttraumatic headache following mild traumatic brain injury. Pain Med. 2008;9:1001-1011.
173. Register-Mihalik J, Guskiewicz KM, Mann JD, Shields EW. The effects of headache on clinical measures of neurocognitive function. Clin J Sport Med. 2007;17:282-288.
174. Gessel LM, Fields SK, Collins CL, Dick RW, Comstock RD. Concussions among United States high school and collegiate athletes. J Athl Train. 2007;42:495-503.
175. Lew HL, Lin PH, Fuh JL, Wang SJ, Clark DJ, Walker WC. Characteristics and treatment of headache after traumatic brain injury: a f ocused review. Am J Phys Med Rehabil. 2006;85:619-627.
176. Savola O, Hillbom M. Early predictors of post-concussion symptoms in patients with mild head injury. Eur J Neurol. 2003;10:175-181.
177. Gordon KE, Dooley JM, Wood EP. Is migraine a risk factor for the development of concussion? Br. J. Sports Med. 2006;40:184-185.
178. De Kruijk JR, Leffers P, Menheere PP, Meerhoff S, Rutten J, Twijnstra A. Prediction of post-traumatic complaints after mild traumatic brain injury: early symptoms and biochemical markers. J Neurol Neurosurg Psychiatry. 2002;73:727-732.
179. Register-Mihalik JK, Mihalik JP, Guskiewicz KM. Balance deficits after sports-related concussion in individuals reporting posttraumatic headache. Neurosurgery. 2008;63:76-80.
180. Asplund CA, McKeag DB, Olsen CH. Sport-related concussion: factors associated with prolonged return to play. Clin J Sport Med. 2004;14:339-343.
181. Dischinger PC, Ryb GE, Kufera JA, Auman KM. Early predictors of postconcussive syndrome in a population of trauma patients with mild traumatic brain injury. J Trauma. 2009;66:289-296.
182. Maskell F, Chiarelli P, Isles R, Maskell F, Chiarelli P, Isles R. Dizziness after traumatic brain injury: results from an interview study. Brain Inj. 2007;21:741-752.
183. Masson F, Maurette P, Salmi LR, et al. Prevalence of impairments 5 years after a head injury, and their relationship with disabilities and outcome. Brain Inj. 1996;10:487-497.
184. Guskiewicz KM. Balance and mild head injury in athletes. Orthop Phys Ther Clin North Am. 2002;11:143-158.
185. Piland SG, Motl RW, Ferrara MS, Peterson CL. Evidence for the factorial and construct validity of a self-report concussion symptoms scale. J Athl Train. 2003;38:104-112.
186. Control CFD. http://www.cdc.gov/NCIPC/tbi/Facts_for_Physicians_booklet.pdf. Accessed 1/19/2010, 2010.
187. Cantu RC. Posttraumatic Retrograde and Anterograde Amnesia: Pathophysiology and Implications in Grading and Safe Return to Play. J Athl Train. 2001;36:244-248.
188. Iverson GL, Lovell MR, Smith SS. Does brief loss of consciousness affect cognitive functioning after mild head injury? Arch Clin Neuropsychol. 2000;15:643-648.
189. Hinton-Bayre AD, Geffen G. Severity of sports-related concussion and neuropsychological test performance. Neurology. 2002;59:1068-1070.

130
190. Lovell M, Collins M, Bradley J. Return to play following sports-related concussion. Clin. Sports Med. 2004;23:421-441.
191. Lau BC, Kontos AP, Collins MW, Mucha A, Lovell MR. Which On-field Signs/Symptoms Predict Protracted Recovery From Sport-Related Concussion Among High School Football Players? Am. J. Sports Med. 2011;39:2311-2318.
192. Kirkwood MW, Yeates KO, Wilson PE. Pediatric sport-related concussion: a review of the clinical management of an oft-neglected population. Pediatrics. 2006;117:1359-1371.
193. Buzzini SR, Guskiewicz KM. Sport-related concussion in the young athlete. Curr. Opin. Pediatr. 2006;18:376-382.
194. Patel DR, Shivdasani V, Baker RJ. Management of sport-related concussion in young athletes. Sports Med. 2005;35:671-684.
195. McDonald JW, Johnston MV. Physiological and pathophysiological roles of excitatory amino acids during central nervous system development. Brain Res Brain Res Rev. 1990;15:41-70.
196. Bruce DA, Alavi A, Bilaniuk L. Diffuse cerebral swelling following head injuries in children: the syndrome of malignant brain edema. J. Neurosurg. 1981;54:170-178.
197. Cantu RC. Second-impact syndrome. Clin. Sports Med. 1998;17:37-44. 198. Covassin T, Swanik CB, Sachs ML. Sex Differences and the Incidence of Concussions
Among Collegiate Athletes. J Athl Train. 2003;38:238-244. 199. Fuller CW, Junge A, Dvorak J. A six year prospective study of the incidence and causes
of head and neck injuries in international football. Br. J. Sports Med. 2005;39 Suppl 1:i3-9.
200. Delaney JSM, Lacroix VJM, Leclerc SMD, Johnston KMMDP. Concussions Among University Football and Soccer Players. . Clin J Sport Med. 2002;12:331-338.
201. Barnes BC, Cooper L, Kirkendall DT, McDermott TP, Jordan BD, Garrett WE, Jr. Concussion history in elite male and female soccer players. Am. J. Sports Med. 1998;26:433-438.
202. Boden BP, Kirkendall DT, Garrett WE, Jr. Concussion incidence in elite college soccer players. Am. J. Sports Med. 1998;26:238-241.
203. Barr WB. Neuropsychological testing of high school athletes. Preliminary norms and test-retest indices. Arch Clin Neuropsychol. 2003;18:91-101.
204. Covassin T, Swanik CB, Sachs M, et al. Sex differences in baseline neuropsychological function and concussion symptoms of collegiate athletes. Br. J. Sports Med. 2006;40:923-927.
205. Farace E, Alves WM. Do women fare worse: a metaanalysis of gender differences in traumatic brain injury outcome. J. Neurosurg. 2000;93:539-545.
206. Bazarian JJ, Wong T, Harris M, Leahey N, Mookerjee S, Dombovy M. Epidemiology and predictors of post-concussive syndrome after minor head injury in an emergency population. Brain Inj. 1999;13:173-189.
207. Fenton G, McClelland R, Montgomery A, MacFlynn G, Rutherford W. The postconcussional syndrome: social antecedents and psychological sequelae. Br. J. Psychiatry. 1993;162:493-497.
208. Collins MW, Lovell MR, Iverson GL, Cantu RC, Maroon JC, Field M. Cumulative effects of concussion in high school athletes. Neurosurgery. 2002;51:1175-1179.

131
209. Guskiewicz KM, McCrea M, Marshall SW, et al. Cumulative effects associated with recurrent concussion in collegiate football players: the NCAA Concussion Study. JAMA. 2003;290:2549-2555.
210. Schulz MR, Marshall SW, Mueller FO, et al. Incidence and risk factors for concussion in high school athletes, North Carolina, 1996-1999. Am J Epidemiol. 2004;160:937-944.
211. Zemper ED. Two-year prospective study of relative risk of a second cerebral concussion. Am J Phys Med Rehabil. 2003;82:653-659.
212. Gaetz M, Goodman D, Weinberg H. Electrophysiological evidence for the cumulative effects of concussion. Brain Inj. 2000;14:1077-1088.
213. Macciocchi SN, Barth JT, Littlefield L, Cantu RC. Multiple Concussions and Neuropsychological Functioning in Collegiate Football Players. J Athl Train. 2001;36:303-306.
214. Belanger HG, Spiegel E, Vanderploeg RD. Neuropsychological performance following a history of multiple self-reported concussions: a meta-analysis. J. Int. Neuropsychol. Soc. 2010;16:262-267.
215. Van Kampen DA, Lovell MR, Pardini JE, Collins MW, Fu FH. The "value added" of neurocognitive testing after sports-related concussion. Am. J. Sports Med. 2006;34:1630-1635.
216. Parker TM, Osternig LR, van Donkelaar P, Chou LS. Recovery of cognitive and dynamic motor function following concussion. Br. J. Sports Med. 2007;41:868-873.
217. Keshner EA, Allum JH, Pfaltz CR. Postural coactivation and adaptation in the sway stabilizing responses of normals and patients with bilateral vestibular deficit. Exp Brain Res. 1987;69:77-92.
218. Lacour M, Xerri C. Compensation of postural reactions to free-fall in the vestibular neurectomized monkey. Role of the visual motions cues. Exp Brain Res. 1980;40:103-110.
219. Wicke RW, Oman CM. Visual and graviceptive influences on lower leg EMG activity in humans during brief falls. Exp Brain Res. 1982;46:324-330.
220. Peterka RJ. Sensorimotor integration in human postural control. J Neurophysiol. 2002;88:1097-1118.
221. Peterka RJ, Benolken MS. Role of somatosensory and vestibular cues in attenuating visually induced human postural sway. Exp Brain Res. 1995;105:101-110.
222. Bronstein AM, Morland AB, Ruddock KH, Gresty MA. Recovery from bilateral vestibular failure: implications for visual and cervico-ocular function. Acta Otolaryngol Suppl. 1995;520 Pt 2:405-407.
223. Fay BH. Role of the Vestibular System in Postural Control. In: Herdman JS, ed. Vestibular Rehabilitation. Philadelpia: F. A. Davis Company; 2007:32-53.
224. Keshner EA. Postural Abnormalities in Vestibular Disorders. In: Herdman JS, ed. Vestibular Rehabilitation. Philadelphia: F. A. Davis Company; 2007:54-75.
225. Karatas M. Central vertigo and dizziness: epidemiology, differential diagnosis, and common causes. Neurologist. 2008;14:355-364.
226. Krebs DE, Gill-Body KM, Parker SW, Ramirez JV, Wernick-Robinson M. Vestibular rehabilitation: useful but not universally so. Otolaryngol Head Neck Surg. 2003;128:240-250.

132
227. Yardley L, Beech S, Zander L, Evans T, Weinman J. A randomized controlled trial of exercise therapy for dizziness and vertigo in primary care. Br. J. Gen. Pract. 1998;48:1136-1140.
228. Horak FB, Jones-Rycewicz C, Black FO, Shumway-Cook A. Effects of vestibular rehabilitation on dizziness and imbalance. Otolaryngol Head Neck Surg. 1992;106:175-180.
229. Herdman SJ, Clendaniel RA, Mattox DE, Holliday MJ, Niparko JK. Vestibular adaptation exercises and recovery: acute stage after acoustic neuroma resection. Otolaryngol Head Neck Surg. 1995;113:77-87.
230. Herdman SJ, Schubert MC, Das VE, Tusa RJ. Recovery of dynamic visual acuity in unilateral vestibular hypofunction. Arch Otolaryngol Head Neck Surg. 2003;129:819-824.
231. Enticott JC, O'Leary S J, Briggs RJ. Effects of vestibulo-ocular reflex exercises on vestibular compensation after vestibular schwannoma surgery. Otol Neurotol. 2005;26:265-269.
232. Maskell F, Chiarelli P, Isles R, Maskell F, Chiarelli P, Isles R. Dizziness after traumatic brain injury: overview and measurement in the clinical setting. Brain Inj. 2006;20:293-305.
233. Griffiths MV. The incidence of auditory and vestibular concussion following minor head injury. J Laryngol Otol. 1979;93:253-265.
234. Herdman JS. Treatment of vestibular disorders in traumatically brain-injured patients. J. Head Trauma Rehabil. 1990;5:63-76.
235. Shepard NT, Telian SA, Smith-Wheelock M, Raj A. Vestibular and balance rehabilitation therapy. Ann. Otol. Rhinol. Laryngol. 1993;102:198-205.
236. Gizzi M. Critical review. The efficacy of vestibular rehabilitation for patients with head trauma. J. Head Trauma Rehabil. 1995;10:60-77.
237. Shepard NT, Telian SA, Smith-Wheelock M, Raj A. Vestibular and balance rehabilitation therapy. Ann. Otol. Rhinol. Laryngol. 1993;102:198-205.
238. Ernst A, Basta D, Seidl RO, et al. Management of posttraumatic vertigo. Otolaryngol Head Neck Surg. 2005;132:554-558.
239. Hoffer ME, Gottshall KR, Moore R, et al. Characterizing and treating dizziness after mild head trauma. Otol Neurotol. 2004;25:135-138.
240. Polissar NL, Fay GC, Jaffe KM, et al. Mild pediatric traumatic brain injury: adjusting significance levels for multiple comparisons. Brain Inj. 1994;8:249-263.
241. Hirabayashi S, Iwasaki Y. Developmental perspective of sensory organization on postural control. Brain Dev. 1995;17:111-113.
242. Field M, Collins MW, Lovell MR, Maroon J. Does age play a r ole in recovery from sports-related concussion? A comparison of high school and collegiate athletes. J. Pediatr. 2003;142:546-553.
243. Vartiainen E, Karjalainen S, Karja J. Vestibular disorders following head injury in children. Int. J. Pediatr. Otorhinolaryngol. 1985;9:135-141.
244. Herdman SJ, Whitney SL. Interventions for the Patient With Vestibular Hypofunction. In: Herdman SJ, ed. Vestibular Rheabilitation. Philadelphia: F.A. Davis Company 2007:309 - 337.

133
245. Collins M, Lovell MR, Iverson GL, et al. Examining concussion rates and return to play in high school football players wearing newer helmet technology: a three-year prospective cohort study. Neurosurgery. 2006;58:275-286.
246. Oliaro SM, Guskiewicz KM, Prentice WE. Establishment of Normative Data on Cognitive Tests for Comparison with Athletes Sustaining Mild Head Injury. J Athl Train. 1998;33:36-40.
247. Schmidt JD, Register-Mihalik JK, Mihalik JP, Kerr ZY, Guskiewicz KM. Identifying Impairments after Concussion: Normative Data versus Individualized Baselines. Med Sci Sports Exerc. 2012.
248. Hillier SL, McDonnell M. Vestibular rehabilitation for unilateral peripheral vestibular dysfunction. Clin. Otolaryngol. 2011;36:248-249.
249. Alsalaheen BA, Mucha A, Morris LO, et al. Vestibular rehabilitation for dizziness and balance disorders after concussion. J Neurol Phys Ther. 2010;34:87-93.
250. Whitney SL, Herdman SJ. Physical Therapy Assessment of Vestibular Hypofunction. In: Herdman SJ, ed. Vestibular Rehabilitation. Philadelphia: F.A.Davis; 2007:272 - 308.
251. Wrisley DM, Walker ML, Echternach JL, Strasnick B. Reliability of the dynamic gait index in people with vestibular disorders. Arch. Phys. Med. Rehabil. 2003;84:1528-1533.
252. Whitney SL, Wrisley DM, Marchetti GF, Gee MA, Redfern MS, Furman JM. Clinical measurement of sit-to-stand performance in people with balance disorders: validity of data for the Five-Times-Sit-to-Stand Test. Phys. Ther. 2005;85:1034-1045.
253. Whitney SL, Marchetti GF, Schade A, Wrisley DM. The sensitivity and specificity of the Timed "Up & Go" and the Dynamic Gait Index for self-reported falls in persons with vestibular disorders. J. Vestib. Res. 2004;14:397-409.
254. Bruininks RH. Bruininks-Oseretsky Test of Motor Proficiency -Owner's Manual. Circle Pines: American Guidance Service; 1978.
255. Powell LE, Myers AM. The Activities-specific Balance Confidence (ABC) Scale. J. Gerontol. A. Biol. Sci. Med. Sci. 1995;50A:M28-34.
256. Shumway-Cook A, woollacott M. Motor Control: Theory and Practical Applications. Baltimore, MD: Williams & Wilkins; 1995.
257. Wrisley DM, Marchetti GF, Kuharsky DK, Whitney SL. Reliability, internal consistency, and validity of data obtained with the functional gait assessment. Phys. Ther. 2004;84:906-918.
258. Podsiadlo D, Richardson S. The timed "Up & Go": a test of basic functional mobility for frail elderly persons. J. Am. Geriatr. Soc. 1991;39:142-148.
259. Lord SR, Murray SM, Chapman K, Munro B, Tiedemann A. Sit-to-stand performance depends on sensation, speed, balance, and psychological status in addition to strength in older people. J. Gerontol. A. Biol. Sci. Med. Sci. 2002;57:M539-543.
260. Whitney S, Wrisley D, Furman J. Concurrent validity of the Berg Balance Scale and the Dynamic Gait Index in people with vestibular dysfunction. Physiother. Res. Int. 2003;8:178-186.
261. Shumway-Cook A, Baldwin M, Polissar NL, Gruber W. Predicting the probability for falls in community-dwelling older adults. Phys. Ther. 1997;77:812-819.
262. Hall CD, Schubert MC, Herdman SJ. Prediction of fall risk reduction as measured by dynamic gait index in individuals with unilateral vestibular hypofunction. Otol Neurotol. 2004;25:746-751.

134
263. Wrisley DM, Walker ML, Echternach JL, Strasnick B. Reliability of the dynamic gait index in people with vestibular disorders. Arch. Phys. Med. Rehabil. 2003;84:1528-1533.
264. Gill-Body KM, Beninato M, Krebs DE. Relationship among balance impairments, functional performance, and disability in people with peripheral vestibular hypofunction. Phys. Ther. 2000;80:748-758.
265. Whitney SL, Marchetti GF, Morris LO, Sparto PJ. The reliability and validity of the Four Square Step Test for people with balance deficits secondary to a v estibular disorder. Arch. Phys. Med. Rehabil. 2007;88:99-104.
266. Wrisley DM, Whitney SL, Furman JM. Vestibular rehabilitation outcomes in patients with a history of migraine. Otol Neurotol. 2002;23:483-487.
267. Brown KE, Whitney SL, Marchetti GF, Wrisley DM, Furman JM. Physical therapy for central vestibular dysfunction. Arch. Phys. Med. Rehabil. 2006;87:76-81.
268. Viccaro LJ, Perera S, Studenski SA. Is timed up and go better than gait speed in predicting health, function, and falls in older adults? J. Am. Geriatr. Soc. 2011;59:887-892.
269. Meretta BM, Whitney SL, Marchetti GF, Sparto PJ, Muirhead RJ. The five times sit to stand test: responsiveness to change and concurrent validity in adults undergoing vestibular rehabilitation. J. Vestib. Res. 2006;16:233-243.
270. Riemann BL, Guskiewicz KM, Shields EW. Relationship between clinical and forceplate measures of postural stability. J Sport Rehabil. 1999:71-82.
271. Bell DR, Guskiewicz K, Clark MA, Padua DA. Systematic Review of the Balance Error Scoring System. Sports Health: A multidisciplinary approach 2011;3:287 -295.
272. Peretz C, Herman T, Hausdorff JM, Giladi N. Assessing fear of falling: Can a sh ort version of the Activities-specific Balance Confidence scale be useful? Mov. Disord. 2006;21:2101-2105.
273. Walker ML, Austin AG, Banke GM, et al. Reference group data for the functional gait assessment. Phys. Ther. 2007;87:1468-1477.
274. Oberg T, Karsznia A, Oberg K. Basic gait parameters: reference data for normal subjects, 10-79 years of age. J. Rehabil. Res. Dev. 1993;30:210-223.
275. Csuka M, McCarty DJ. Simple method for measurement of lower extremity muscle strength. Am. J. Med. 1985;78:77-81.
276. Bressel E, Yonker JC, Kras J, Heath EM. Comparison of static and dynamic balance in female collegiate soccer, basketball, and gymnastics athletes. J Athl Train. 2007;42:42-46.
277. McLeod TC, Armstrong T, Miller M, Sauers JL. Balance improvements in female high school basketball players after a 6-week neuromuscular-training program. J Sport Rehabil. 2009;18:465-481.
278. Sabin MJ, Van Boxtel BA, Nohren MW, Broglio SP. Presence of headache does not influence sideline neurostatus or balance in high school football athletes. Clin J Sport Med. 2011;21:411-415.
279. Hunt TN, Ferrara MS, Bornstein RA, Baumgartner TA. The reliability of the modified Balance Error Scoring System. Clin J Sport Med. 2009;19:471-475.
280. Jette AM, Jette DU, Ng J, Plotkin DJ, Bach MA. Are performance-based measures sufficiently reliable for use in multicenter trials? Musculoskeletal Impairment (MSI) Study Group. J. Gerontol. A. Biol. Sci. Med. Sci. 1999;54:M3-6.

135
281. Ostchega Y, Harris TB, Hirsch R, Parsons VL, Kington R, Katzoff M. Reliability and prevalence of physical performance examination assessing mobility and balance in older persons in the US: data from the Third National Health and Nutrition Examination Survey. J. Am. Geriatr. Soc. 2000;48:1136-1141.
282. Schaubert KL, Bohannon RW. Reliability and validity of three strength measures obtained from community-dwelling elderly persons. J Strength Cond Res. 2005;19:717-720.
283. Schaubert K, Bohannon RW. Reliability of the sit-to-stand test over dispersed sessions. Isokinetics and Exercise Science. 2005;13:119-122.
284. Mong Y, Teo TW, Ng SS. 5-repetition sit-to-stand test in subjects with chronic stroke: reliability and validity. Arch. Phys. Med. Rehabil. 2010;91:407-413.
285. Steffen TM, Hacker TA, Mollinger L. Age- and gender-related test performance in community-dwelling elderly people: Six-Minute Walk Test, Berg Balance Scale, Timed Up & Go Test, and gait speeds. Phys. Ther. 2002;82:128-137.
286. Rockwood K, Awalt E, Carver D, MacKnight C. Feasibility and measurement properties of the functional reach and the timed up and go tests in the Canadian study of health and aging. J. Gerontol. A. Biol. Sci. Med. Sci. 2000;55:M70-73.
287. Bohannon RW. Comfortable and maximum walking speed of adults aged 20-79 years: reference values and determinants. Age Ageing. 1997;26:15-19.
288. Finnoff JT, Peterson VJ, Hollman JH, Smith J. Intrarater and interrater reliability of the Balance Error Scoring System (BESS). Pm & R. 2009;1:50-54.
289. Mulsant BH, Kastango KB, Rosen J, Stone RA, Mazumdar S, Pollock BG. Interrater reliability in clinical trials of depressive disorders. Am J Psychiatry. 2002;159:1598-1600.
290. Reddy CC, Collins MW, Gioia GA. Adolescent sports concussion. . Phys. Med. Rehabil. Clin. N. Am. 2008;19:247-269.
291. Griffiths MV. The incidence of auditory and vestibular concussion following minor head injury. J. Laryngol. Otol. 1979;93:253-265.
292. Kisilevski V, Podoshin L, Ben-David J, et al. Results of otovestibular tests in mild head injuries. Int. Tinnitus J. 2001;7:118-121.
293. Maskell F, Chiarelli P, Isles R. Dizziness after traumatic brain injury: overview and measurement in the clinical setting. Brain Inj. 2006;20:293-305.
294. Geurts AC, Ribbers GM, Knoop JA, van Limbeek J. Identification of static and dynamic postural instability following traumatic brain injury. Arch. Phys. Med. Rehabil. 1996;77:639-644.
295. Shumway-Cook A, Olmscheid R. A systems analysis of postural dyscontrol in traumatically brain-injured patients. J. Head Trauma Rehabil. 1990;5:51-62.
296. Collins M, Lovell MR, Iverson GL, Ide T, Maroon J. Examining concussion rates and return to play in high school football players wearing newer helmet technology: a three-year prospective cohort study. Neurosurgery. 2006;58:275-286.
297. Hirabayashi S, Iwasaki Y. Developmental perspective of sensory organization on postural control. Brain Dev. 1995;17:111-113.
298. Shepard NT, Telian SA, Smith-Wheelock M. Habituation and balance retraining therapy. A retrospective review. Neurol. Clin. 1990;8:459-475.
299. Jacobson GP, Newman CW. The development of the Dizziness Handicap Inventory. Arch. Otolaryngol. Head Neck Surg. 1990;116:424-427.

136
300. Whitney SL, Wrisley DM, Marchetti GF, Furman JM. The effect of age on vestibular rehabilitation outcomes. Laryngoscope. 2002;112:1785-1790.
301. Brown KE, Whitney SL, Marchetti GF, Wrisley DM, Furman JM. Physical therapy for central vestibular dysfunction. Arch. Phys. Med. Rehabil. 2006;87:76-81.
302. Meli A, Zimatore G, Badaracco C, De Angelis E, Tufarelli D. Vestibular rehabilitation and 6-month follow-up using objective and subjective measures. Acta Oto Laryngologica. 2006;126:259-266.
303. Perera S, Mody SH, Woodman RC, Studenski SA. Meaningful change and responsiveness in common physical performance measures in older adults. J. Am. Geriatr. Soc. 2006;54:743-749.
304. Broglio SP, Ferrara MS, Sopiarz K, Kelly MS. Reliable change of the sensory organization test. Clin. J. Sport Med. 2008;18:148-154.
305. Horak FB, Jones-Rycewicz C, Black FO, Shumway-Cook A. Effects of vestibular rehabilitation on dizziness and imbalance. Otolaryngology Head & Neck Surgery. 1992;106:175-180.
306. Peterson ML, Christou E, Rosengren KS. Children achieve adult-like sensory integration during stance at 12-years-old. Gait Posture. 2006;23:455-463.
307. Guskiewicz KM. Assessment of postural stability following sport-related concussion. Curr. Sports Med. Rep. 2003;2:24-30.
308. Guskiewicz KM, Bruce SL, Cantu RC, et al. National Athletic Trainers' Association Position Statement: Management of Sport-Related Concussion. J Athl Train. 2004;39:280-297.
309. Oliaro S, Anderson S, Hooker D. Management of Cerebral Concussion in Sports: The Athletic Trainer's Perspective. J Athl Train. 2001;36:257-262.
310. Covassin T, Elbin R, 3rd, Stiller-Ostrowski JL. Current sport-related concussion teaching and clinical practices of sports medicine professionals. J Athl Train. 2009;44:400-404.
311. Alla S, Sullivan SJ, Hale L, McCrory P. Self-report scales/checklists for the measurement of concussion symptoms: a systematic review. Br. J. Sports Med. 2009;43 Suppl 1:i3-12.
312. Epley JM. The canalith repositioning procedure: for treatment of benign paroxysmal positional vertigo. Otolaryngol. Head Neck Surg. 1992;107:399-404.
313. Schubert MC, Migliaccio AA, Clendaniel RA, Allak A, Carey JP. Mechanism of dynamic visual acuity recovery with vestibular rehabilitation. Arch. Phys. Med. Rehabil. 2008;89:500-507.
314. Smith-Wheelock M, Shepard NT, Telian SA. Physical therapy program for vestibular rehabilitation. Am J Otol. 1991;12:218-225.
315. Scherer MR, Schubert MC. Traumatic brain injury and vestibular pathology as a comorbidity after blast exposure. Phys. Ther. 2009;89:980-992.
316. Herdman SJ, Schubert MC, Tusa RJ. Strategies for balance rehabilitation: fall risk and treatment. Ann. N. Y. Acad. Sci. 2001;942:394-412.
317. Benjamini Y, Hochberg Y. Controlling the False Discovery Rate: A practical and Powerful Approach to Multiple Testing. Journal of Royal Statistical Society. Series B. 1995;57:289-300.