veterans affairs canada facts & figures
TRANSCRIPT
Veterans Affairs Canada
December 2018 Edition
i Please read the important disclaimer on the inside cover.
Ce livre est disponible en français.
Facts & Figures
DisclaimerDepartmental client and expenditure forecasts are used to support official budgetary requests to adjust annual funding
levels and spending authorities for Veteran programs and services as well as to track actual client intake and program
usage in terms of both number of clients and dollars expended. Forecasts are updated annually while expenditure tracking
is reflected quarterly where possible.
These numbers will not reconcile precisely with other published financial reports as listed below, due to timing of the
information, the level of detailed reporting across the various programs and focus on program spending only.
Departmental regular operating budget and expenditures are not included under program spending. Forecasts may not
correspond to approved departmental budget amounts. In these cases, funding adjustments may be sought through future
Estimates cycles to ensure appropriate funding so that all Veterans receive their rightful benefits and services.
More detail on the Department's expenditure plan and actual expenditures can be found as follows:
1. The Departmental Plan (DP) (previously known as the Report on Plans and Priorities) Departmental Plan describes
departmental priorities, strategic outcomes, programs, expected results and associated resource requirements, covering a
three-year period beginning with the year indicated in the title of the report.
2. The Departmental Results Report (DRR) (previously known as the Departmental Performance Report) is a departmental
account of actual performance for the most recently completed fiscal year against the plans, priorities and expected results
set out in the respective Departmental Plan. DRRs inform Parliamentarians and Canadians of the results achieved by
government organizations for Canadians.
3. Quarterly Financial Reports (QFR) for departments and agencies consist of financial tables comparing planned and actual
expenditures for both the quarter and year-to-date, as well as comparative information for the preceding fiscal year. Each
report includes spending authorities granted through the Main and Supplementary Estimates, as well as any allotment
transfers approved by Treasury Board that have become available for use by the institution at the end of the quarter.
4. The Public Accounts of Canada is the report of the Government of Canada prepared annually by the Receiver General.
The report covers the financial transactions of the Government during the year.
VAC Facts and Figures Book Page 2 December 2018
Page
5
5
5
6
6
7
8
11
11
11
12
12
13
1414
15
16
16
17
17
17
17
18
18
18
19
20
20
21
21
2222232425
26
2727
5.5 Long Term Care (LTC) Recipients and Expenditures..........................................................5.6 Rehabilitation Program: Eligible Recipients and Expenditures.........................................
5.7 Family Caregiver Relief Benefit Recipients and Expenditures...........................................
1.2 Estimated Veteran Population by Average Age................................................................
1.4 Total Number of Veterans by Gender, Service Type, and Age..........................................
4.3 Disability Pension Expenditures........................................................................................
1.5 Veterans served by Area Office.........................................................................................
4.11 Critical Injury Benefit Recipients and Expenditures........................................................
2.2 Departmental Budget........................................................................................................
2.1 Program and Operating Expenditures...............................................................................
1.3 Veterans and survivors served by VAC (Unique)...............................................................
5.2 Treatment Benefits and Other Health Purchased Services Expenditures.........................
1.1 Estimated Veteran Population by Province.......................................................................
Contents: VAC Facts & Figures
Facts & Figures Summary............................................................................................Summary of Program Recipients..............................................................................................
Summary of Program Expenditures.........................................................................................
Analysis of VAC Facts and Figures............................................................................................
VAC Program Trends ...............................................................................................................
Highlights of 2017–18 Trends..................................................................................................
CHAPTER 1: Demographics..........................................................................................
New Programs at VAC …………………………………………………………………………………………………….
5.3 Veterans Independence Program Recipients....................................................................
5.4 Veterans Independence Program Expenditures................................................................
4.8 Most Common Medical Conditions...................................................................................
4.9 Most Common Conditions - First Applications Completed...............................................
4.10 Disability Benefits - (First Application) Decisions and Favourable Rates.........................
CHAPTER 5: Health Care Programs..............................................................................5.1 Treatment Benefits Recipients..........................................................................................
CHAPTER 2: Departmental Spending...........................................................................
CHAPTER 3: Program Expenditure Overview...............................................................
3.1 Expenditures by Program..................................................................................................
CHAPTER 4: Disability Benefits ...................................................................................4.1 Disability Benefits Recipients............................................................................................
4.7 Recipients by Disability Class.............................................................................................
4.4 Disability Award Recipients...............................................................................................
4.5 Disability Award Expenditures..........................................................................................
4.6 Disability Award and Disability Pension Duals..................................................................
4.2 Disability Pension Recipients.............................................................................................
VAC Facts and Figures Book Page 3 December 2018
Page
2828
29
30
30
31
31
31
3232
3333
33
33
3434
34
34
35
35
35
3636
36
37
37
3838
3939
6.5 Canadian Forces Income Support Program Recipients and Expenditures.........................
6.7 War Veterans Allowance Expenditures.............................................................................
6.6 War Veterans Allowance Recipients.................................................................................
6.4 Retirement Income Support Benefit Recipients and Expenditures...................................
Contents: VAC Facts & Figures
6.1 Earnings Loss Recipients and Expenditures.......................................................................
6.2 Career Impact Allowance Recipients and Expenditures....................................................
CHAPTER 6: Financial Benefits......................................................................................
6.3 Supplementary Retirement Benefit Recipients and Expenditures....................................
CHAPTER 7: Career Transition Services.........................................................................
9.1 Afghanistan Deployed Members (Unique)........................................................................
9.2 Afghanistan Veterans in Receipt of VAC Benefits..............................................................
9.3 Afghanistan Veterans by Age............................................................................................
9.4 Afghanistan Veterans in Receipt of Disability Benefits by Disability Class........................
7.1 Career Transition Services Recipients and Expenditures...................................................
CHAPTER 9: Afghanistan Veterans...............................................................................
8.1 Veterans in Receipt of Disability Benefits with Psychiatric Disability................................
8.2 Veterans with Mental Health Conditions by Age and Gender...........................................
8.3 Mental Health - Quick Facts..............................................................................................
CHAPTER 8: Mental Health...........................................................................................
9.5 Afghanistan Veterans in Receipt of Disability Benefits - Mental Health Conditions....................
9.6 Afghanistan Veterans - Quick Facts...................................................................................
CHAPTER 10: Service Delivery.......................................................................................10.1 Case Managed Veterans..................................................................................................
11.1 Total Cases Completed by Bureau of Pension Advocates................................................
CHAPTER 12: Human Resources....................................................................................12.1 Historical Full Time Equivalents (FTE) Numbers..............................................................
10.2 Telephony Results - National Contact Centre Network (NCCN) and Medavie................
CHAPTER 11: Appeals - Disability Pensions and Awards................................................
10.3 My VAC Account Users....................................................................................................
10.4 My VAC Account Usage (session logins)..........................................................................
VAC Facts and Figures Book Page 4 December 2018
Program 2015-16 2016-17 2017-18Percentage
Change
YTD Dec
2018
2018-19
Forecast
Forecasted
Percentage
Change
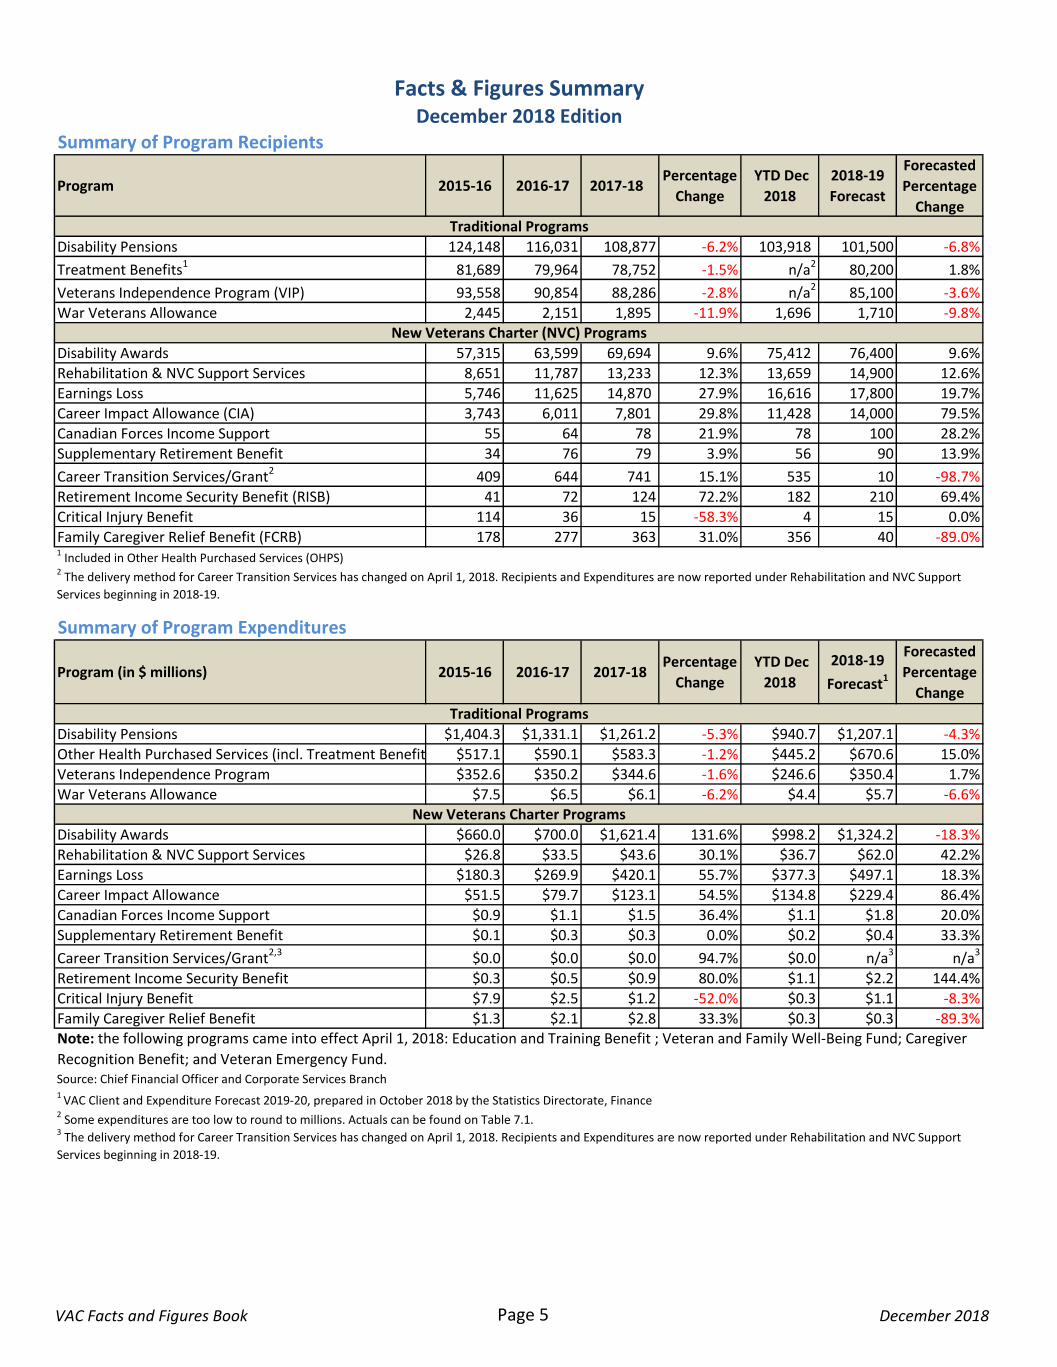
Disability Pensions 124,148 116,031 108,877 -6.2% 103,918 101,500 -6.8%
Treatment Benefits1 81,689 79,964 78,752 -1.5% n/a2 80,200 1.8%
Veterans Independence Program (VIP) 93,558 90,854 88,286 -2.8% n/a2 85,100 -3.6%
War Veterans Allowance 2,445 2,151 1,895 -11.9% 1,696 1,710 -9.8%
Disability Awards 57,315 63,599 69,694 9.6% 75,412 76,400 9.6%
Rehabilitation & NVC Support Services 8,651 11,787 13,233 12.3% 13,659 14,900 12.6%
Earnings Loss 5,746 11,625 14,870 27.9% 16,616 17,800 19.7%
Career Impact Allowance (CIA) 3,743 6,011 7,801 29.8% 11,428 14,000 79.5%
Canadian Forces Income Support 55 64 78 21.9% 78 100 28.2%
Supplementary Retirement Benefit 34 76 79 3.9% 56 90 13.9%
Career Transition Services/Grant2 409 644 741 15.1% 535 10 -98.7%
Retirement Income Security Benefit (RISB) 41 72 124 72.2% 182 210 69.4%
Critical Injury Benefit 114 36 15 -58.3% 4 15 0.0%
Family Caregiver Relief Benefit (FCRB) 178 277 363 31.0% 356 40 -89.0%
Program (in $ millions) 2015-16 2016-17 2017-18Percentage
Change
YTD Dec
2018
2018-19
Forecast1
Forecasted
Percentage
Change
Disability Pensions $1,404.3 $1,331.1 $1,261.2 -5.3% $940.7 $1,207.1 -4.3%
Other Health Purchased Services (incl. Treatment Benefits) $517.1 $590.1 $583.3 -1.2% $445.2 $670.6 15.0%
Veterans Independence Program $352.6 $350.2 $344.6 -1.6% $246.6 $350.4 1.7%
War Veterans Allowance $7.5 $6.5 $6.1 -6.2% $4.4 $5.7 -6.6%
Disability Awards $660.0 $700.0 $1,621.4 131.6% $998.2 $1,324.2 -18.3%
Rehabilitation & NVC Support Services $26.8 $33.5 $43.6 30.1% $36.7 $62.0 42.2%
Earnings Loss $180.3 $269.9 $420.1 55.7% $377.3 $497.1 18.3%
Career Impact Allowance $51.5 $79.7 $123.1 54.5% $134.8 $229.4 86.4%
Canadian Forces Income Support $0.9 $1.1 $1.5 36.4% $1.1 $1.8 20.0%
Supplementary Retirement Benefit $0.1 $0.3 $0.3 0.0% $0.2 $0.4 33.3%
Career Transition Services/Grant2,3 $0.0 $0.0 $0.0 94.7% $0.0 n/a3 n/a3
Retirement Income Security Benefit $0.3 $0.5 $0.9 80.0% $1.1 $2.2 144.4%
Critical Injury Benefit $7.9 $2.5 $1.2 -52.0% $0.3 $1.1 -8.3%
Family Caregiver Relief Benefit $1.3 $2.1 $2.8 33.3% $0.3 $0.3 -89.3%
1 VAC Client and Expenditure Forecast 2019-20, prepared in October 2018 by the Statistics Directorate, Finance
2 Some expenditures are too low to round to millions. Actuals can be found on Table 7.1.
Note: the following programs came into effect April 1, 2018: Education and Training Benefit ; Veteran and Family Well-Being Fund; Caregiver
Recognition Benefit; and Veteran Emergency Fund.
3 The delivery method for Career Transition Services has changed on April 1, 2018. Recipients and Expenditures are now reported under Rehabilitation and NVC Support
Services beginning in 2018-19.
Summary of Program Recipients
Summary of Program Expenditures
Facts & Figures SummaryDecember 2018 Edition
New Veterans Charter Programs
Traditional Programs
New Veterans Charter (NVC) Programs
Traditional Programs
2 The delivery method for Career Transition Services has changed on April 1, 2018. Recipients and Expenditures are now reported under Rehabilitation and NVC Support
Services beginning in 2018-19.
1 Included in Other Health Purchased Services (OHPS)
Source: Chief Financial Officer and Corporate Services Branch
VAC Facts and Figures Book Page 5 December 2018
NVC clients and expenditures have increased each year since implementation of the NVC on April 1, 2006. Clients and expenditures for every
NVC program including the three largest [Disability Awards (DA), Earnings Loss Benefits (ELB), and Career Impact Allowance (CIA)], are
expected to increase throughout the forecast period, except for Critical Injury Benefit (CIB), which was introduced in 2015-16.
Overall, VAC’s program expenditures increased by 31% to $4,441.5 million in 2017-18 from $3,398.2 million in 2016-17. Expenditures are
expected to decrease over the next three years and then will begin to increase starting in 2021-22.
Total expenditures for traditional programs serving WS Veterans and Survivors - Disability Pensions, and War Veterans Allowance (WVA) have
declined in recent years. The decline is mainly due to decreasing numbers of WS Veterans and survivors. Expenditures for the Veterans
Independence Program (VIP) have declined for the same reason.
VAC’s 2019-20 planned spending is slightly lower than 2018-19 primarily attributed to the transition to the Pension for Life plan and gradual
uptake of some of the Department’s other new programs – such as the Education and Training Benefit. As a result of offering monthly benefits
through Pension for Life beginning in 2019, benefit payments will be spread over the lifetime of the Veteran, resulting in lower near term cash
payments. That being said, the lifetime value of Veterans’ benefits will increase significantly as a result of these programs.
Analysis of VAC Facts and Figures
As of March 31, 2018, VAC estimated the total Veteran population in Canada to be 649,300, consisting of 48,300 War Service (WS) Veterans
and 601,000 Canadian Armed Forces (CAF) Veterans. Both the WS and CAF Veteran populations are forecasted to decline through the next five
years, but the decline in WS Veterans is expected to outpace the decline in CAF Veterans.
Veterans served by VAC account for approximately 18% of the Veteran population in Canada. As of March 31, 2018 VAC served 20,139 (42%) of
the WS Veteran population and 96,644 (16%) of the CAF Veteran population. In addition, VAC provided benefits to 46,980 WS survivors, 10,986
CAF survivors, and administers benefits on behalf of 13,396 RCMP members or former members and their survivors.
Overall, total VAC clients (Veterans and survivors) decreased by 2.3% in 2017-18; this trend is expected to continue. The forecasted decrease is
the result of an expected decrease of 18% in WS Veterans and a 8% decrease in WS survivor clients. CAF Veteran and survivor clients are
expected to increase by 5% over the next year.
Traditional Programs
New Veterans Charter (NVC) Programs
VAC Program Trends
Expenditures have been increasing since 2015-16 until 2017-18 due to the introduction of changes in Cannabis for Medical Puposes policy.
Expenditures are expected to grow throughout the forecast cycle.
Pension For LifeApril 1, 2019, Pension for Life (PFL) will be introduced. Pension for Life includes three new benefits: Pain and Suffering Compensation;
Additional Pain and Suffering Compensation; and Income Replacement Benefit. The Pension for Life Benefits package is intended to meet the
following objectives:
• Providing recognition, income support and better overall stability to Canadian Armed Forces (CAF) members and Veterans who are living
with a disability due to a service-related injury and/or illness.
• Providing a holistic package that reintroduces lifelong monthly pain and suffering payments; implement a new recognition benefit, and
consolidate six of seven existing income-related financial benefits.
• Addressing concerns raised by military and Veteran communities and families by empowering CAF members and Veterans living with a
disability, caused by a service-related illness or injury, to choose the form of compensation that works best for them and their families.
VAC Facts and Figures Book Page 6 December 2018
During 2017-18, Disability Award (DA) payments were $1,621.4 million which was an increase of 132% from $700 million in 2016-17. This
increase in expenditures was due to a one time DA additional amount to increase the maximum DA payment to $360,000. The one time DA
amount was also in addition to a 10% increase in DA clients. DA clients are forecast to increase by another 10% in 2018-19 and expenditures are
forecasted to be $1,324.2 million.
In April 2017, the Permanent Impairment Allowance (PIA) was renamed to Career Impact Allowance (CIA) in order to better reflect the program
intent of providing compensation for loss of earnings capacity due to a service related injury or illness.
The first significant growth in CIA occurred in 2011, when VAC introduced changes to allow individuals in receipt of a Disability Pension to
qualify for CIA; prior to that, only clients with a Disability Award could qualify. VAC also introduced a $1,000 monthly supplement to those CIA
clients who were also deemed to have a Diminished Earnings Capacity (DEC). As of March 2018, about 56% of CIA clients were in receipt of the
supplement. CIA expenditures for 2017-18 came in over the forecasted amount of $118.1 million.
As of April 1, 2017, a new grading scheme was implemented for CIA, which gave access to higher grade levels for some clients. The result is that
a greater proportion of clients are in Grades 1 and 2 than previous to the change. Grade 1 increased from 0.5% to approximately 1% of CIA
clients upon implementation of the new grading system. Grade 2 clients increased from 9.4% to approximately 34% of CIA clients. This resulted
in a smaller ratio of clients in the lowest paying grade 3, changing from 90.1% to approximately 65% of CIA clients.
Disability Awards
Other Health Purchased Services (OHPS)
OHPS expenditures decreased by $6.8 million from 2016-17 to 2017-18. OHPS expenditures are expected to increase in 2018-19 due to
increased Treatment Benefits and payments for cannabis for medical purposes.
Analysis of VAC Facts and Figures …/cont'd
Earnings Loss Benefit
Career Impact Allowance (CIA)
Highlights of 2017-18 Trends
On October 1, 2016, VAC began issuing Earnings Loss Benefits (ELB) at 90% of pre-release salary instead of 75% which had been in place since
2006. This change had an immediate impact as all recipients who were already in receipt of ELB received increases, and many who were not in
receipt due to other income started receiving payments. Monthly expenditures for the first six months of 2016-17 were less than $20 million
each month. Monthly expenditures since the changes have averaged $25 million.
Enhancements to the Earnings Loss Program have increased the demand on the Rehabilitation Program as a Veteran is required to be in the
Rehabilitation Program to be eligible for Earnings Loss Benefits. Rehabilitation and Earnings Loss clients were 13,233 and 14,870 respectively as
of March 31, 2018.
VAC Facts and Figures Book Page 7 December 2018
New Programs at VAC: 2018-19
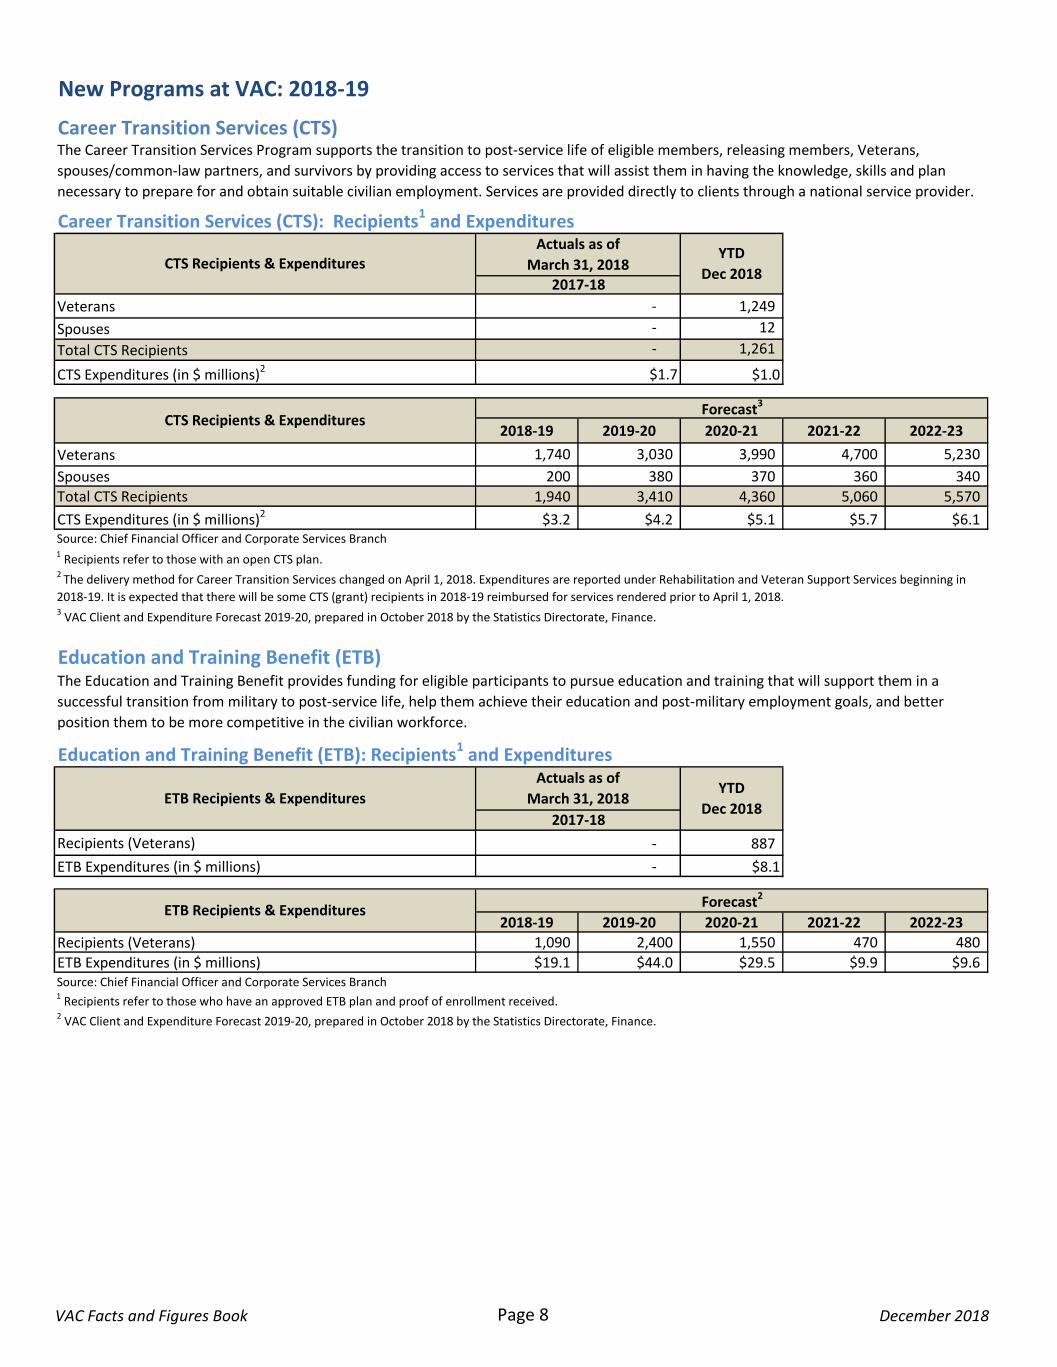
Veterans 1,249
Spouses 12
Total CTS Recipients 1,261
CTS Expenditures (in $ millions)2 $1.0
2018-19 2019-20 2020-21 2021-22 2022-23
Veterans 1,740 3,030 3,990 4,700 5,230
Spouses 200 380 370 360 340
Total CTS Recipients 1,940 3,410 4,360 5,060 5,570
CTS Expenditures (in $ millions)2 $3.2 $4.2 $5.1 $5.7 $6.1
Recipients (Veterans) 887
ETB Expenditures (in $ millions) $8.1
2018-19 2019-20 2020-21 2021-22 2022-23
Recipients (Veterans) 1,090 2,400 1,550 470 480
ETB Expenditures (in $ millions) $19.1 $44.0 $29.5 $9.9 $9.6Source: Chief Financial Officer and Corporate Services Branch 1 Recipients refer to those who have an approved ETB plan and proof of enrollment received.
The Education and Training Benefit provides funding for eligible participants to pursue education and training that will support them in a
successful transition from military to post-service life, help them achieve their education and post-military employment goals, and better
position them to be more competitive in the civilian workforce.
Education and Training Benefit (ETB): Recipients1 and Expenditures
CTS Recipients & ExpendituresForecast3
1 Recipients refer to those with an open CTS plan.
2 The delivery method for Career Transition Services changed on April 1, 2018. Expenditures are reported under Rehabilitation and Veteran Support Services beginning in
2018-19. It is expected that there will be some CTS (grant) recipients in 2018-19 reimbursed for services rendered prior to April 1, 2018.3 VAC Client and Expenditure Forecast 2019-20, prepared in October 2018 by the Statistics Directorate, Finance.
Source: Chief Financial Officer and Corporate Services Branch
-
-
-
$1.7
Education and Training Benefit (ETB)
Career Transition Services (CTS)The Career Transition Services Program supports the transition to post-service life of eligible members, releasing members, Veterans,
spouses/common-law partners, and survivors by providing access to services that will assist them in having the knowledge, skills and plan
necessary to prepare for and obtain suitable civilian employment. Services are provided directly to clients through a national service provider.
Career Transition Services (CTS): Recipients1 and Expenditures
CTS Recipients & ExpendituresActuals as of
March 31, 2018YTD
Dec 20182017-18
Forecast2
ETB Recipients & ExpendituresYTD
Dec 2018
-
Actuals as of
March 31, 2018
2017-18
-
ETB Recipients & Expenditures
2 VAC Client and Expenditure Forecast 2019-20, prepared in October 2018 by the Statistics Directorate, Finance.
VAC Facts and Figures Book Page 8 December 2018
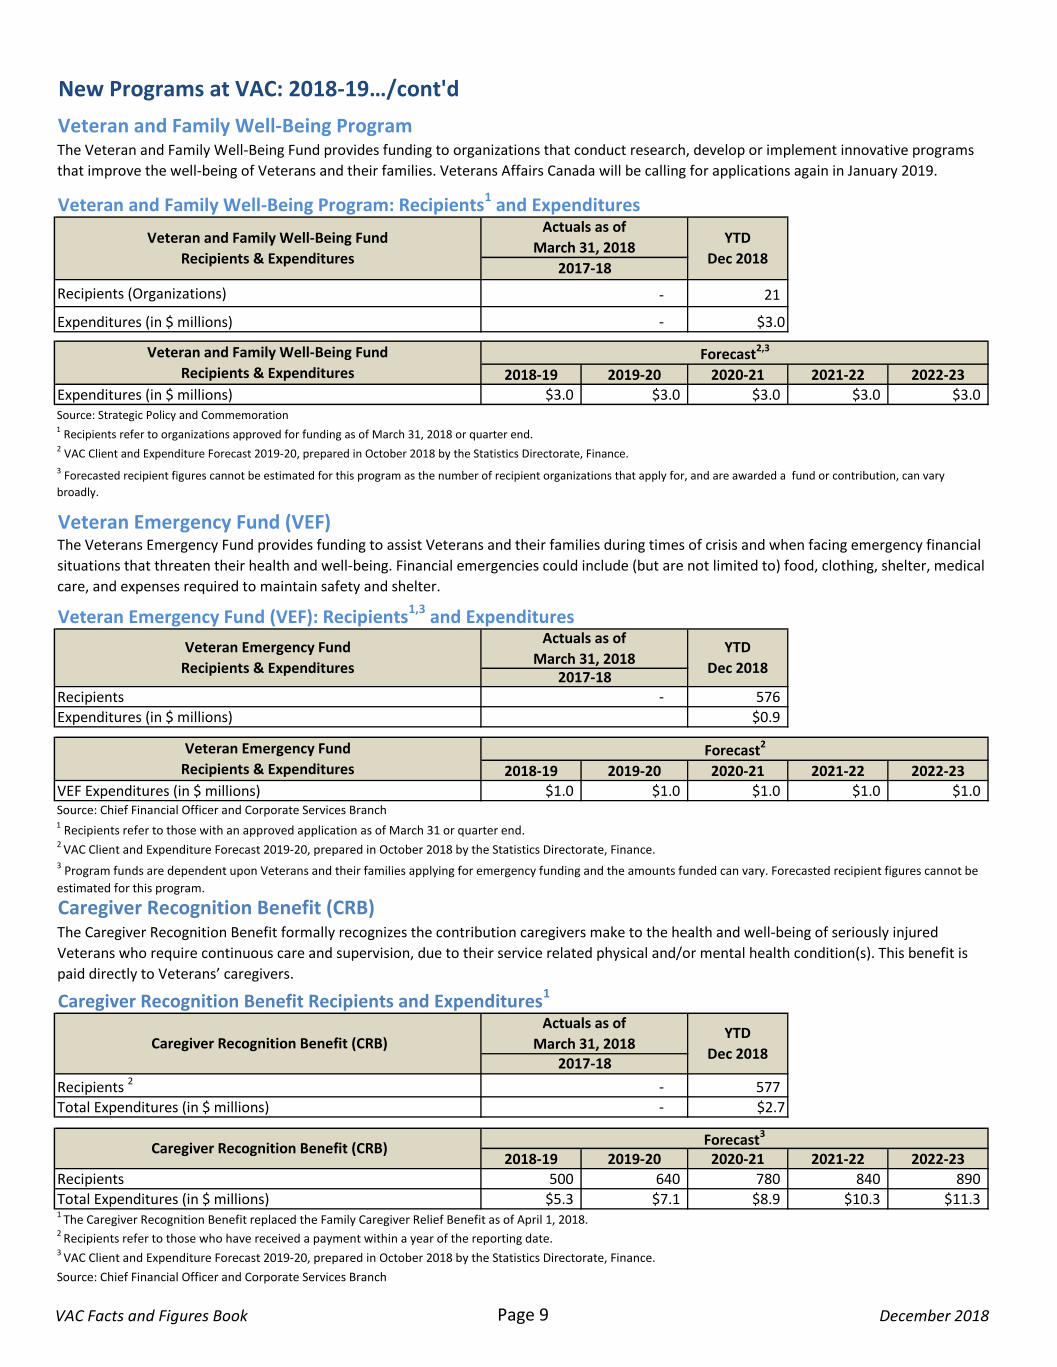
Recipients (Organizations) 21
Expenditures (in $ millions) $3.0
2018-19 2019-20 2020-21 2021-22 2022-23Expenditures (in $ millions) $3.0 $3.0 $3.0 $3.0 $3.0Source: Strategic Policy and Commemoration
Recipients 576
Expenditures (in $ millions) $0.9
2018-19 2019-20 2020-21 2021-22 2022-23VEF Expenditures (in $ millions) $1.0 $1.0 $1.0 $1.0 $1.0
Recipients 2 577
Total Expenditures (in $ millions) $2.7
2018-19 2019-20 2020-21 2021-22 2022-23Recipients 500 640 780 840 890
Total Expenditures (in $ millions) $5.3 $7.1 $8.9 $10.3 $11.3
-
Source: Chief Financial Officer and Corporate Services Branch
1 Recipients refer to those with an approved application as of March 31 or quarter end.
Veteran and Family Well-Being Fund
Recipients & ExpendituresForecast2,3
Veteran Emergency Fund (VEF): Recipients1,3 and Expenditures
Veteran Emergency Fund
Recipients & Expenditures
Veteran Emergency Fund
Recipients & ExpendituresForecast2
Veteran Emergency Fund (VEF)
2 VAC Client and Expenditure Forecast 2019-20, prepared in October 2018 by the Statistics Directorate, Finance.
Source: Chief Financial Officer and Corporate Services Branch
-
New Programs at VAC: 2018-19…/cont'd
The Veteran and Family Well-Being Fund provides funding to organizations that conduct research, develop or implement innovative programs
that improve the well-being of Veterans and their families. Veterans Affairs Canada will be calling for applications again in January 2019.
Actuals as of
March 31, 2018YTD
Dec 20182017-18
-
Actuals as of
March 31, 2018
The Veterans Emergency Fund provides funding to assist Veterans and their families during times of crisis and when facing emergency financial
situations that threaten their health and well-being. Financial emergencies could include (but are not limited to) food, clothing, shelter, medical
care, and expenses required to maintain safety and shelter.
1 Recipients refer to organizations approved for funding as of March 31, 2018 or quarter end.
Caregiver Recognition Benefit (CRB)The Caregiver Recognition Benefit formally recognizes the contribution caregivers make to the health and well-being of seriously injured
Veterans who require continuous care and supervision, due to their service related physical and/or mental health condition(s). This benefit is
paid directly to Veterans’ caregivers.
Caregiver Recognition Benefit (CRB)YTD
Dec 20182017-18
2 VAC Client and Expenditure Forecast 2019-20, prepared in October 2018 by the Statistics Directorate, Finance.3 Program funds are dependent upon Veterans and their families applying for emergency funding and the amounts funded can vary. Forecasted recipient figures cannot be
estimated for this program.
Caregiver Recognition Benefit Recipients and Expenditures1
3 Forecasted recipient figures cannot be estimated for this program as the number of recipient organizations that apply for, and are awarded a fund or contribution, can vary
broadly.
-
Veteran and Family Well-Being Program
2017-18
-
Veteran and Family Well-Being Program: Recipients1 and Expenditures
Veteran and Family Well-Being Fund
Recipients & Expenditures
YTD
Dec 2018
Actuals as of
March 31, 2018
Caregiver Recognition Benefit (CRB)Forecast3
1 The Caregiver Recognition Benefit replaced the Family Caregiver Relief Benefit as of April 1, 2018.
2 Recipients refer to those who have received a payment within a year of the reporting date.3 VAC Client and Expenditure Forecast 2019-20, prepared in October 2018 by the Statistics Directorate, Finance.
VAC Facts and Figures Book Page 9 December 2018
2018-19 2019-20 2020-21 2021-22 2022-23
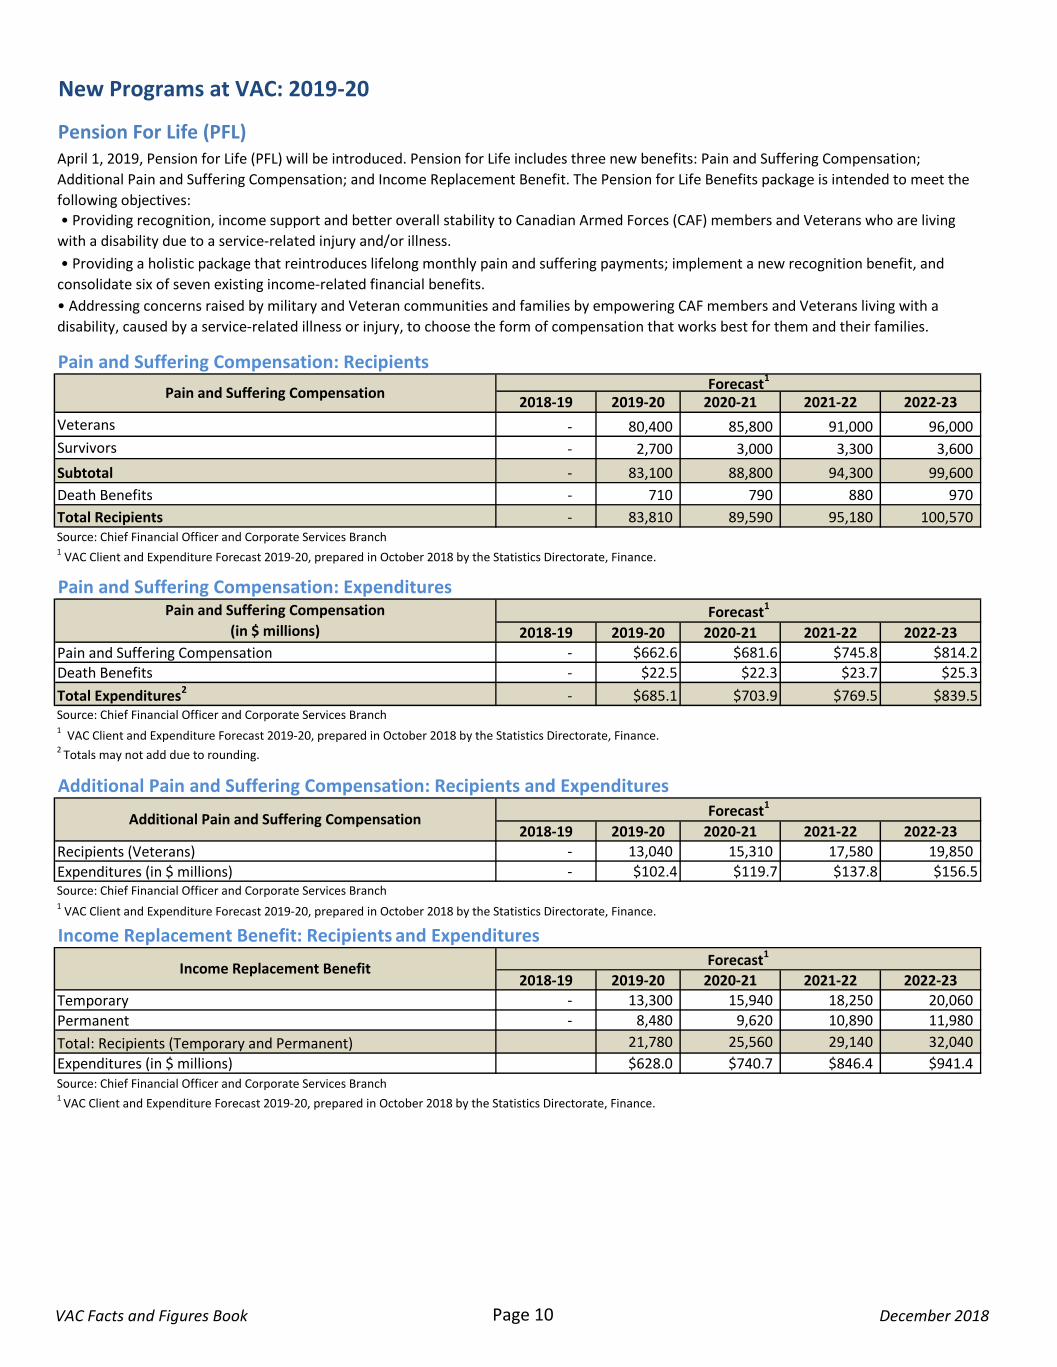
Veterans - 80,400 85,800 91,000 96,000
Survivors - 2,700 3,000 3,300 3,600
Subtotal - 83,100 88,800 94,300 99,600
Death Benefits - 710 790 880 970
Total Recipients - 83,810 89,590 95,180 100,570 Source: Chief Financial Officer and Corporate Services Branch
2018-19 2019-20 2020-21 2021-22 2022-23
Pain and Suffering Compensation - $662.6 $681.6 $745.8 $814.2
Death Benefits - $22.5 $22.3 $23.7 $25.3
Total Expenditures2 - $685.1 $703.9 $769.5 $839.5
2018-19 2019-20 2020-21 2021-22 2022-23
Recipients (Veterans) - 13,040 15,310 17,580 19,850
Expenditures (in $ millions) - $102.4 $119.7 $137.8 $156.5
2018-19 2019-20 2020-21 2021-22 2022-23
Temporary - 13,300 15,940 18,250 20,060
Permanent - 8,480 9,620 10,890 11,980
Total: Recipients (Temporary and Permanent) 21,780 25,560 29,140 32,040
Expenditures (in $ millions) $628.0 $740.7 $846.4 $941.4Source: Chief Financial Officer and Corporate Services Branch
2 Totals may not add due to rounding.
1 VAC Client and Expenditure Forecast 2019-20, prepared in October 2018 by the Statistics Directorate, Finance.
Income Replacement BenefitForecast1
Income Replacement Benefit: Recipients and Expenditures
1 VAC Client and Expenditure Forecast 2019-20, prepared in October 2018 by the Statistics Directorate, Finance.
Additional Pain and Suffering Compensation: Recipients and Expenditures
Additional Pain and Suffering CompensationForecast1
Source: Chief Financial Officer and Corporate Services Branch
Source: Chief Financial Officer and Corporate Services Branch
• Addressing concerns raised by military and Veteran communities and families by empowering CAF members and Veterans living with a
disability, caused by a service-related illness or injury, to choose the form of compensation that works best for them and their families.
New Programs at VAC: 2019-20
Pension For Life (PFL)April 1, 2019, Pension for Life (PFL) will be introduced. Pension for Life includes three new benefits: Pain and Suffering Compensation;
Additional Pain and Suffering Compensation; and Income Replacement Benefit. The Pension for Life Benefits package is intended to meet the
following objectives:
• Providing recognition, income support and better overall stability to Canadian Armed Forces (CAF) members and Veterans who are living
with a disability due to a service-related injury and/or illness.
• Providing a holistic package that reintroduces lifelong monthly pain and suffering payments; implement a new recognition benefit, and
consolidate six of seven existing income-related financial benefits.
Pain and Suffering Compensation: Recipients
Pain and Suffering Compensation
(in $ millions)Forecast1
Pain and Suffering CompensationForecast1
1 VAC Client and Expenditure Forecast 2019-20, prepared in October 2018 by the Statistics Directorate, Finance.
Pain and Suffering Compensation: Expenditures
1 VAC Client and Expenditure Forecast 2019-20, prepared in October 2018 by the Statistics Directorate, Finance.
VAC Facts and Figures Book Page 10 December 2018
Province
War Service Veterans
(Second World War,
Korean War)
Canadian Armed Forces
Veterans (Regular and
Primary Reserve)
Total Estimated
Veterans
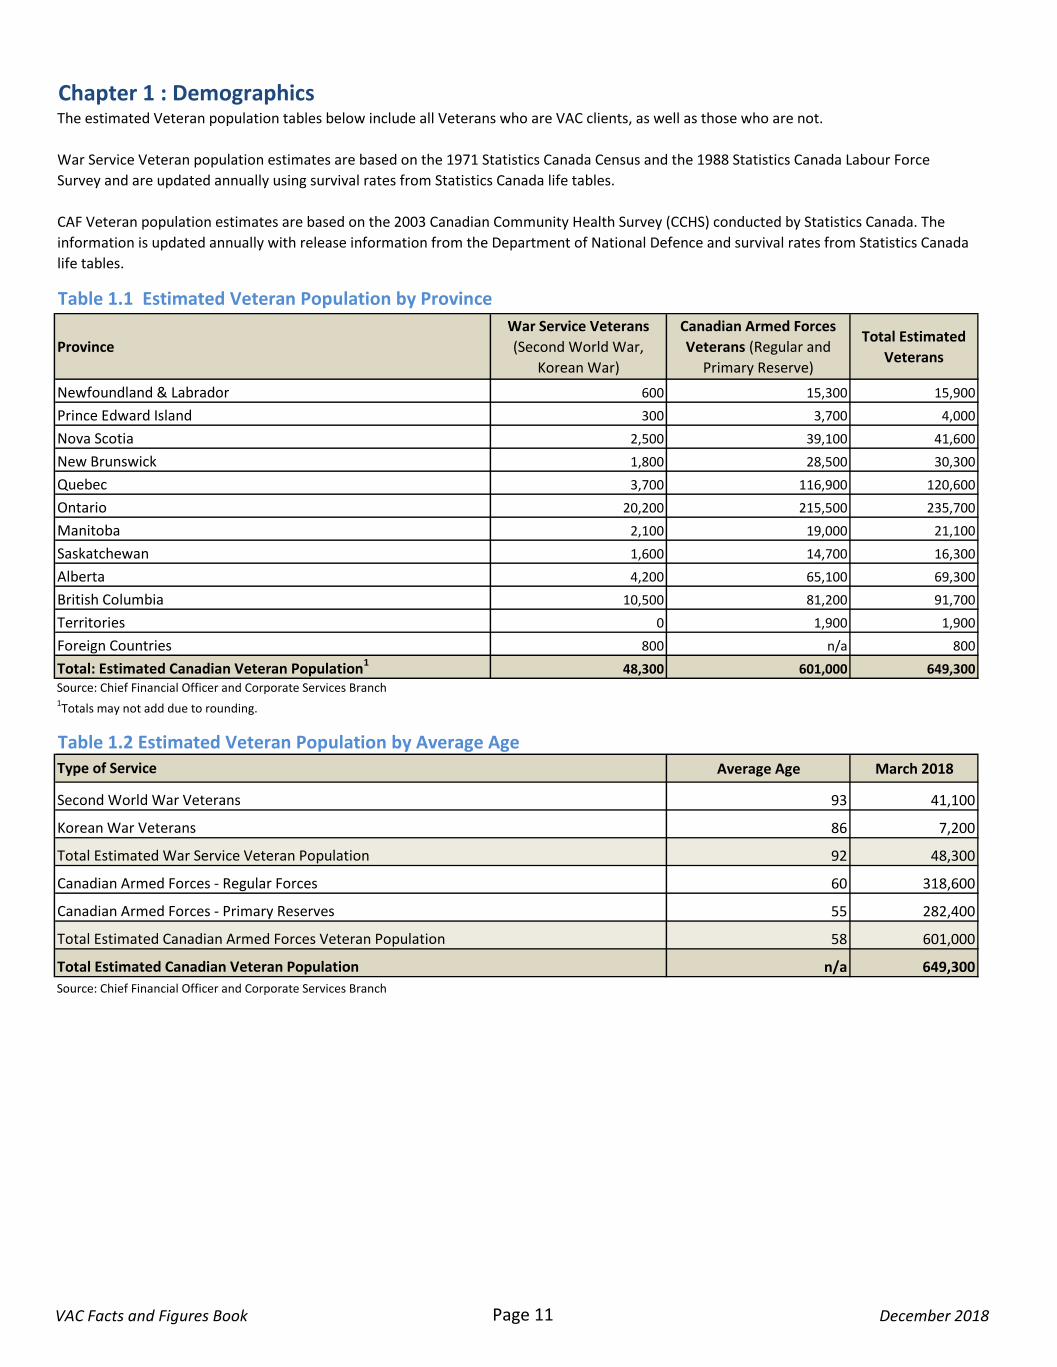
Newfoundland & Labrador 600 15,300 15,900
Prince Edward Island 300 3,700 4,000
Nova Scotia 2,500 39,100 41,600
New Brunswick 1,800 28,500 30,300
Quebec 3,700 116,900 120,600
Ontario 20,200 215,500 235,700
Manitoba 2,100 19,000 21,100
Saskatchewan 1,600 14,700 16,300
Alberta 4,200 65,100 69,300
British Columbia 10,500 81,200 91,700
Territories 0 1,900 1,900
Foreign Countries 800 n/a 800
Total: Estimated Canadian Veteran Population148,300 601,000 649,300
Average Age March 2018
93 41,100
86 7,200
92 48,300
60 318,600
55 282,400
58 601,000
n/a 649,300
Source: Chief Financial Officer and Corporate Services Branch
The estimated Veteran population tables below include all Veterans who are VAC clients, as well as those who are not.
War Service Veteran population estimates are based on the 1971 Statistics Canada Census and the 1988 Statistics Canada Labour Force
Survey and are updated annually using survival rates from Statistics Canada life tables.
CAF Veteran population estimates are based on the 2003 Canadian Community Health Survey (CCHS) conducted by Statistics Canada. The
information is updated annually with release information from the Department of National Defence and survival rates from Statistics Canada
life tables.
Chapter 1 : Demographics
Table 1.1 Estimated Veteran Population by Province
Source: Chief Financial Officer and Corporate Services Branch
Table 1.2 Estimated Veteran Population by Average AgeType of Service
1Totals may not add due to rounding.
Canadian Armed Forces - Primary Reserves
Canadian Armed Forces - Regular Forces
Korean War Veterans
Second World War Veterans
Total Estimated War Service Veteran Population
Total Estimated Canadian Armed Forces Veteran Population
Total Estimated Canadian Veteran Population
VAC Facts and Figures Book Page 11 December 2018
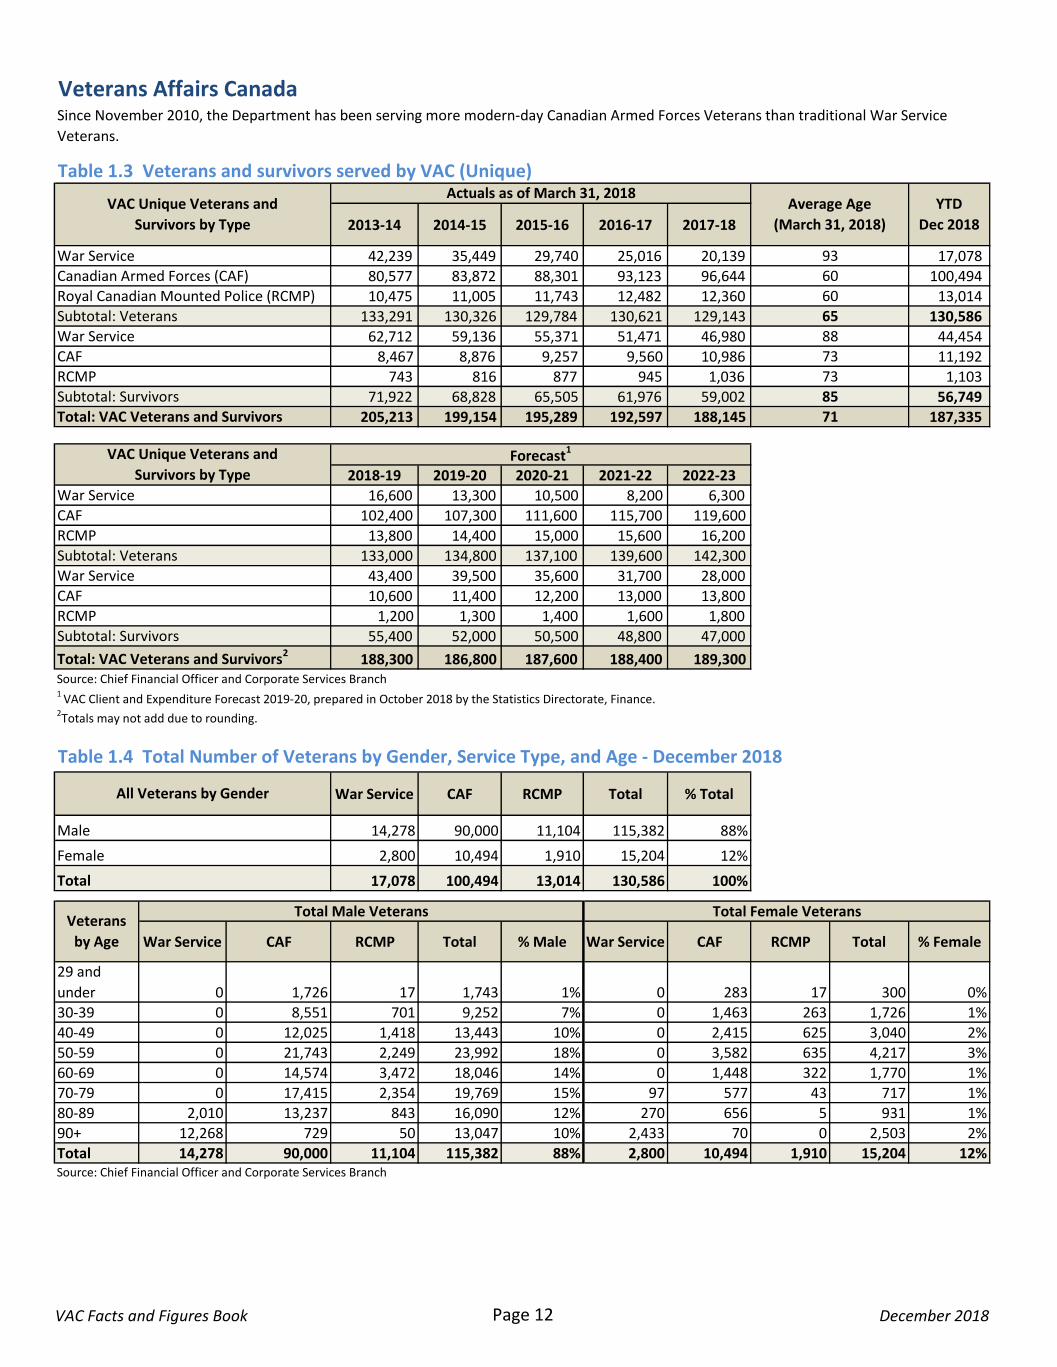
Veterans Affairs Canada
Table 1.3 Veterans and survivors served by VAC (Unique)
2013-14 2014-15 2015-16 2016-17 2017-18
42,239 35,449 29,740 25,016 20,139 17,078
80,577 83,872 88,301 93,123 96,644 100,494
10,475 11,005 11,743 12,482 12,360 13,014
133,291 130,326 129,784 130,621 129,143 130,586
62,712 59,136 55,371 51,471 46,980 44,454
8,467 8,876 9,257 9,560 10,986 11,192
743 816 877 945 1,036 1,103
71,922 68,828 65,505 61,976 59,002 56,749
205,213 199,154 195,289 192,597 188,145 187,335
2018-19 2019-20 2020-21 2021-22 2022-23
16,600 13,300 10,500 8,200 6,300
102,400 107,300 111,600 115,700 119,600
13,800 14,400 15,000 15,600 16,200
133,000 134,800 137,100 139,600 142,300
43,400 39,500 35,600 31,700 28,000
10,600 11,400 12,200 13,000 13,800
1,200 1,300 1,400 1,600 1,800
55,400 52,000 50,500 48,800 47,000
188,300 186,800 187,600 188,400 189,300 Source: Chief Financial Officer and Corporate Services Branch
War Service CAF RCMP Total % Total
14,278 90,000 11,104 115,382 88%
2,800 10,494 1,910 15,204 12%
17,078 100,494 13,014 130,586 100%
War Service CAF RCMP Total % Male War Service CAF RCMP Total % Female
29 and
under 0 1,726 17 1,743 1% 0 283 17 300 0%
30-39 0 8,551 701 9,252 7% 0 1,463 263 1,726 1%
40-49 0 12,025 1,418 13,443 10% 0 2,415 625 3,040 2%
50-59 0 21,743 2,249 23,992 18% 0 3,582 635 4,217 3%
60-69 0 14,574 3,472 18,046 14% 0 1,448 322 1,770 1%
70-79 0 17,415 2,354 19,769 15% 97 577 43 717 1%
80-89 2,010 13,237 843 16,090 12% 270 656 5 931 1%
90+ 12,268 729 50 13,047 10% 2,433 70 0 2,503 2%
Total 14,278 90,000 11,104 115,382 88% 2,800 10,494 1,910 15,204 12%
Average Age
(March 31, 2018)
93
71
85
73
73
88
65
60
60
CAF
RCMP
Subtotal: Veterans
Subtotal: Survivors
Total: VAC Veterans and Survivors
War Service
VAC Unique Veterans and
Survivors by Type
Veterans
by Age
Actuals as of March 31, 2018
1 VAC Client and Expenditure Forecast 2019-20, prepared in October 2018 by the Statistics Directorate, Finance.
2Totals may not add due to rounding.
Table 1.4 Total Number of Veterans by Gender, Service Type, and Age - December 2018
Total Female VeteransTotal Male Veterans
VAC Unique Veterans and
Survivors by Type
War Service
Canadian Armed Forces (CAF)
Royal Canadian Mounted Police (RCMP)
War Service
YTD
Dec 2018
Since November 2010, the Department has been serving more modern-day Canadian Armed Forces Veterans than traditional War Service
Veterans.
Source: Chief Financial Officer and Corporate Services Branch
Forecast1
Total
Female
Male
All Veterans by Gender
Total: VAC Veterans and Survivors2
Subtotal: Survivors
RCMP
CAF
War Service
Subtotal: Veterans
RCMP
CAF
VAC Facts and Figures Book Page 12 December 2018
War Service CAF RCMP
Halifax 774 11,731 923 13,428 1,568
Sydney 122 1,148 92 1,362 185
Nova Scotia 896 12,879 1,015 14,790 1,753
Campbellton 154 1,011 92 1,257 104
Charlottetown 116 1,107 179 1,402 151
Oromocto 135 3,900 213 4,248 721
Saint John 368 3,690 407 4,465 315
NB, PEI and Gaspésie 773 9,708 891 11,372 1,291
Corner Brook 42 539 79 660 178
St John's 165 1,594 326 2,085 375
Newfoundland and Labrador 207 2,133 405 2,745 553
Quebec 243 7,654 104 8,001 1,546
Eastern Quebec 243 7,654 104 8,001 1,546
Gatineau 86 1,852 210 2,148 298
Montreal 750 3,160 314 4,224 508
St-Jean-sur-Richelieu 145 1,980 106 2,231 321
Western Quebec 981 6,992 630 8,603 1,127
North Bay 320 2,515 166 3,001 342
Ottawa 765 6,356 799 7,920 917
Pembroke 147 3,339 121 3,607 518
Thunder Bay 228 570 19 817 87
North Eastern Ontario and Nunavut 1,460 12,780 1,105 15,345 1,864
Kingston 321 3,953 114 4,388 476
Peterborough 454 924 34 1,412 107
Toronto 1,783 1,941 96 3,820 377
Trenton 197 2,912 26 3,135 299
Central Ontario 2,755 9,730 270 12,755 1,259
Hamilton 674 1,652 76 2,402 210
London 450 1,284 75 1,809 224
Mississauga 1,488 4,138 241 5,867 431
Windsor 439 1,306 61 1,806 161
South Western Ontario 3,051 8,380 453 11,884 1,026
Brandon 193 1,002 177 1,372 155
Regina 251 729 466 1,446 108
Saskatoon 336 723 313 1,372 126
Winnipeg 538 2,236 393 3,167 271
Manitoba and Saskatchewan 1,318 4,690 1,349 7,357 660
Calgary 877 4,591 1,269 6,737 395
Edmonton 513 6,177 942 7,632 933
Alberta and Northwest Territories 1,390 10,768 2,211 14,369 1,328
Kelowna 342 1,151 669 2,162 135
Penticton 494 1,576 822 2,892 72
Prince George 99 419 247 765 47
Surrey 834 2,006 1,265 4,105 225
Vancouver 800 1,264 521 2,585 235
BC Mainland and Yukon 2,569 6,416 3,524 12,509 714
Victoria 1,178 7,133 978 9,289 769
Vancouver Island and the Islands 1,178 7,133 978 9,289 769
Foreign Countries 239 1,156 63 1,458 112
Unknown/Missing 18 75 16 109 0
Total 17,078 100,494 13,014 130,586 14,002
Source: Chief Financial Officer and Corporate Services Branch
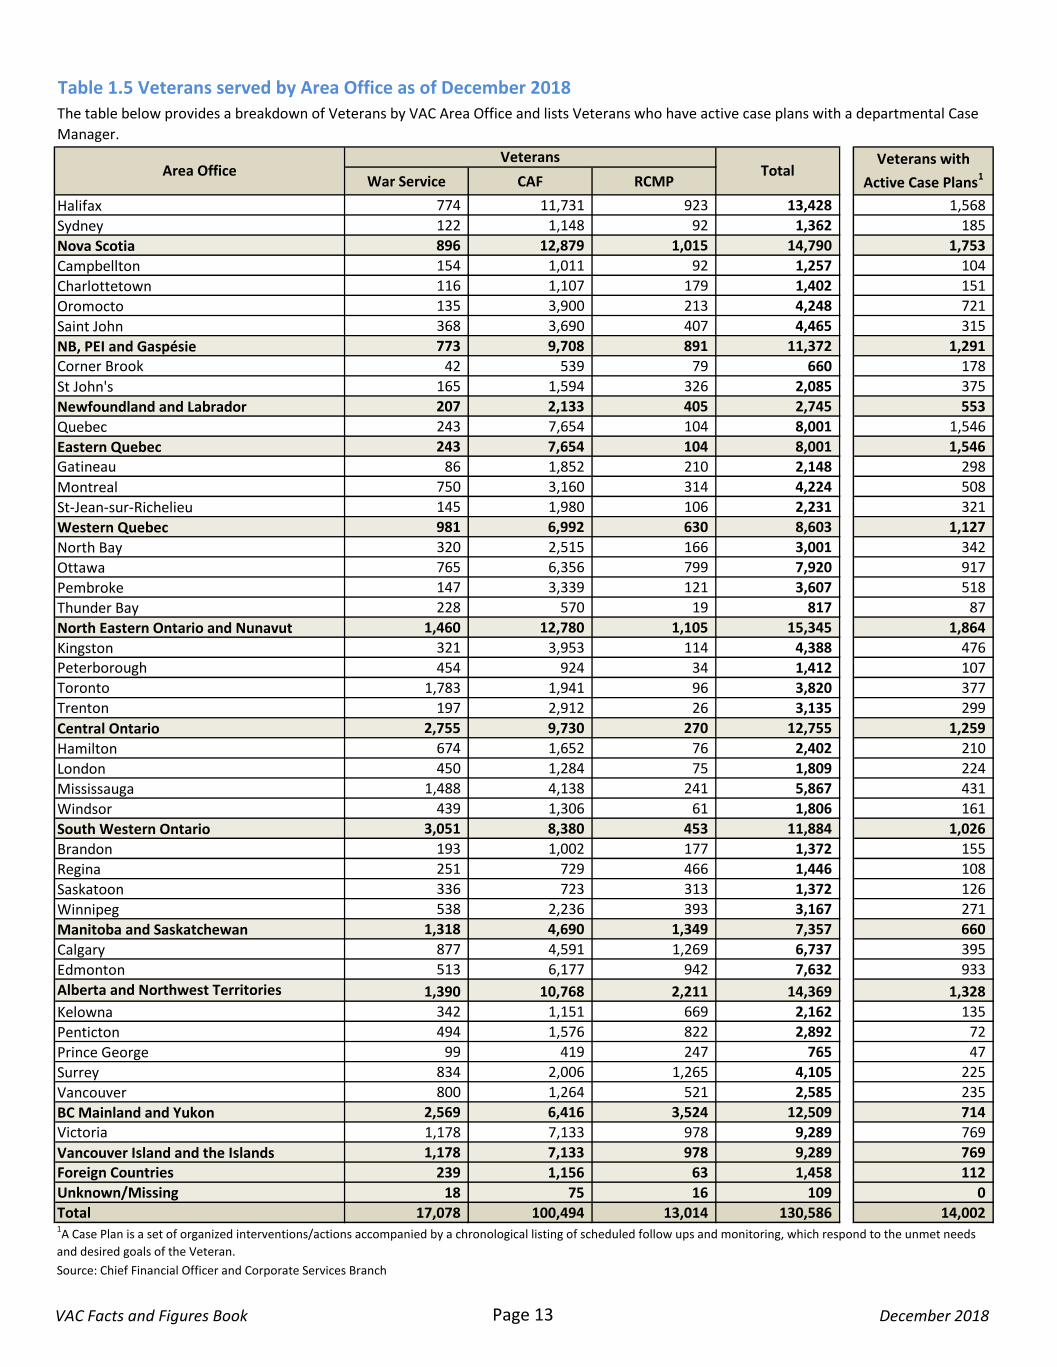
Table 1.5 Veterans served by Area Office as of December 2018The table below provides a breakdown of Veterans by VAC Area Office and lists Veterans who have active case plans with a departmental Case
Manager.
Area OfficeVeterans
TotalVeterans with
Active Case Plans1
1A Case Plan is a set of organized interventions/actions accompanied by a chronological listing of scheduled follow ups and monitoring, which respond to the unmet needs
and desired goals of the Veteran.
VAC Facts and Figures Book Page 13 December 2018
2013-14 2014-15 2015-16 2016-17 2017-18
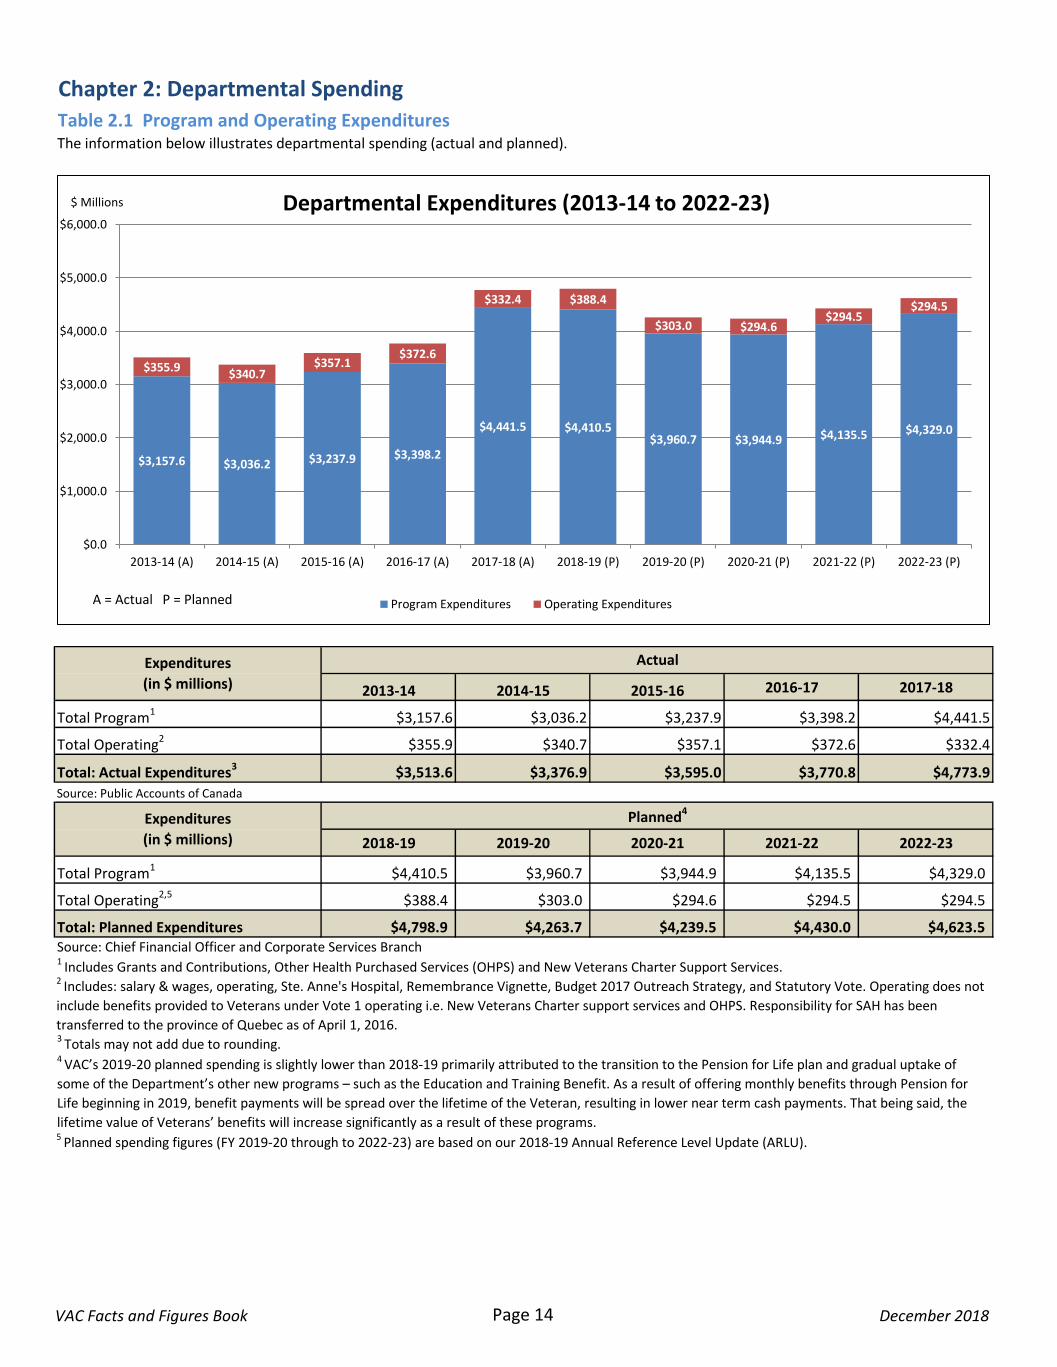
Total Program1 $3,157.6 $3,036.2 $3,237.9 $3,398.2 $4,441.5
Total Operating2 $355.9 $340.7 $357.1 $372.6 $332.4
Total: Actual Expenditures3 $3,513.6 $3,376.9 $3,595.0 $3,770.8 $4,773.9
Source: Public Accounts of Canada
2018-19 2019-20 2020-21 2021-22 2022-23
Total Program1 $4,410.5 $3,960.7 $3,944.9 $4,135.5 $4,329.0
Total Operating2,5 $388.4 $303.0 $294.6 $294.5 $294.5
Total: Planned Expenditures $4,798.9 $4,263.7 $4,239.5 $4,430.0 $4,623.5
1 Includes Grants and Contributions, Other Health Purchased Services (OHPS) and New Veterans Charter Support Services.2 Includes: salary & wages, operating, Ste. Anne's Hospital, Remembrance Vignette, Budget 2017 Outreach Strategy, and Statutory Vote. Operating does not
include benefits provided to Veterans under Vote 1 operating i.e. New Veterans Charter support services and OHPS. Responsibility for SAH has been
transferred to the province of Quebec as of April 1, 2016.
Expenditures
(in $ millions)
Planned4
Source: Chief Financial Officer and Corporate Services Branch
3 Totals may not add due to rounding.4 VAC’s 2019-20 planned spending is slightly lower than 2018-19 primarily attributed to the transition to the Pension for Life plan and gradual uptake of
some of the Department’s other new programs – such as the Education and Training Benefit. As a result of offering monthly benefits through Pension for
Life beginning in 2019, benefit payments will be spread over the lifetime of the Veteran, resulting in lower near term cash payments. That being said, the
lifetime value of Veterans’ benefits will increase significantly as a result of these programs. 5 Planned spending figures (FY 2019-20 through to 2022-23) are based on our 2018-19 Annual Reference Level Update (ARLU).
Chapter 2: Departmental Spending
Table 2.1 Program and Operating ExpendituresThe information below illustrates departmental spending (actual and planned).
Expenditures
(in $ millions)
Actual
$3,157.6 $3,036.2 $3,237.9 $3,398.2
$4,441.5 $4,410.5 $3,960.7 $3,944.9 $4,135.5 $4,329.0
$355.9$340.7
$357.1$372.6
$332.4 $388.4
$303.0 $294.6 $294.5
$294.5
$0.0
$1,000.0
$2,000.0
$3,000.0
$4,000.0
$5,000.0
$6,000.0
2013-14 (A) 2014-15 (A) 2015-16 (A) 2016-17 (A) 2017-18 (A) 2018-19 (P) 2019-20 (P) 2020-21 (P) 2021-22 (P) 2022-23 (P)
$ Millions Departmental Expenditures (2013-14 to 2022-23)
Program Expenditures Operating ExpendituresA = Actual P = Planned
VAC Facts and Figures Book Page 14 December 2018
2014-15 2015-16 2016-17 2017-18 2018-191
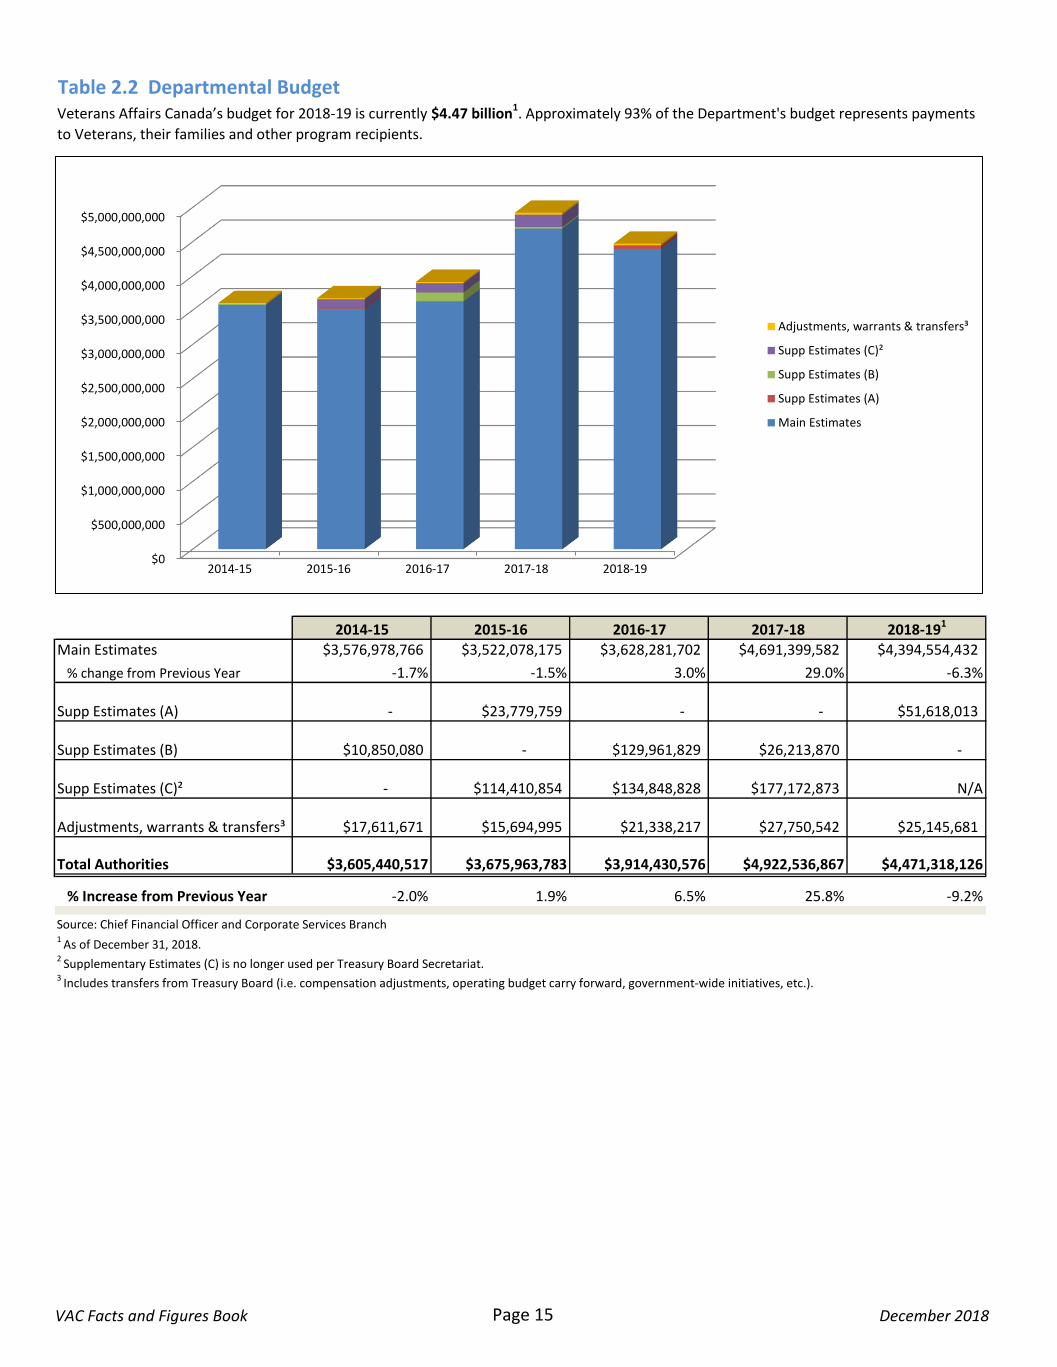
Main Estimates $3,576,978,766 $3,522,078,175 $3,628,281,702 $4,691,399,582 $4,394,554,432
% change from Previous Year -1.7% -1.5% 3.0% 29.0% -6.3%
Supp Estimates (A) - $23,779,759 - - $51,618,013
Supp Estimates (B) $10,850,080 - $129,961,829 $26,213,870 -
Supp Estimates (C)² - $114,410,854 $134,848,828 $177,172,873 N/A
Adjustments, warrants & transfers³ $17,611,671 $15,694,995 $21,338,217 $27,750,542 $25,145,681
Total Authorities $3,605,440,517 $3,675,963,783 $3,914,430,576 $4,922,536,867 $4,471,318,126
% Increase from Previous Year -2.0% 1.9% 6.5% 25.8% -9.2%
Source: Chief Financial Officer and Corporate Services Branch
3 Includes transfers from Treasury Board (i.e. compensation adjustments, operating budget carry forward, government-wide initiatives, etc.).
Table 2.2 Departmental BudgetVeterans Affairs Canada’s budget for 2018-19 is currently $4.47 billion1. Approximately 93% of the Department's budget represents payments
to Veterans, their families and other program recipients.
1 As of December 31, 2018.
2 Supplementary Estimates (C) is no longer used per Treasury Board Secretariat.
$0
$500,000,000
$1,000,000,000
$1,500,000,000
$2,000,000,000
$2,500,000,000
$3,000,000,000
$3,500,000,000
$4,000,000,000
$4,500,000,000
$5,000,000,000
2014-15 2015-16 2016-17 2017-18 2018-19
Adjustments, warrants & transfers³
Supp Estimates (C)²
Supp Estimates (B)
Supp Estimates (A)
Main Estimates
VAC Facts and Figures Book Page 15 December 2018
2013-14 2014-15 2015-16 2016-17 2017-18Disability Pensions $1,562.9 $1,473.4 $1,404.3 $1,331.1 $1,261.2 $940.7
Disability Awards1 $461.4 $472.6 $660.0 $700.0 $1,621.4 $998.2
Other Health Purchased Services $503.6 $480.9 $517.1 $590.1 $583.3 $445.2Veterans Independence Program (Includes Housekeeping & Grounds Maintenance) $429.6 $363.1 $352.6 $350.2 $344.6 $246.6
Earnings Loss $127.2 $156.4 $180.3 $269.9 $420.1 $377.3
Career Impact Allowance (CIA)2 $22.2 $34.2 $51.5 $79.7 $123.1 $134.8
Canadian Forces Income Support $0.3 $0.6 $0.9 $1.1 $1.5 $1.1
Supplementary Retirement Benefit $0.0 $0.1 $0.1 $0.3 $0.3 $0.2
War Veterans Allowance $8.5 $8.5 $7.5 $6.5 $6.1 $4.4
Rehabilitation and New Veterans Charter (NVC)
Support Services $18.5 $21.2 $26.8 $33.5 $43.6 $36.7
Career Transition Services (Grant)3 $0.0 $0.0 $0.0 $0.0 $0.0 $0.0
Education and Training Benefit - - - - - $8.1
Retirement Income Security Benefit - - $0.3 $0.5 $0.9 $1.1
Critical Injury Benefit - - $7.9 $2.5 $1.2 $0.3
Caregiver Recognition benefit - - - - - $2.7
Family Caregiver Relief Benefit - - $1.3 $2.1 $2.8 $0.3
Subtotal: Program Expenditures $3,134.2 $3,011.0 $3,210.6 $3,367.5 $4,410.1 $3,197.7
Other Program Expenditures4 $23.4 $25.2 $27.3 $30.7 $31.4 $21.0
Total Program Expenditures $3,157.6 $3,036.2 $3,237.9 $3,398.2 $4,441.5 $3,218.7
2018-19 2019-20 2020-21 2021-22 2022-23Disability Pensions $1,207.1 $1,155.8 $1,108.4 $1,063.2 $1,021.5
Disability Awards1,6 $1,324.2 $108.5 $1.3 $1.0 $0.8
Pain and Suffering Compensation $0.0 $685.1 $703.9 $769.5 $839.5
Additional Pain and Suffering Compensation $0.0 $102.4 $119.7 $137.8 $156.5
Other Health Purchased Services $670.6 $708.6 $752.8 $804.6 $843.2Veterans Independence Program (Includes Housekeeping & Grounds Maintenance) $350.4 $354.2 $358.3 $364.4 $372.1
Earnings Loss $497.1 $0.8 $0.0 $0.0 $0.0
Career Impact Allowance (CIA)2 $229.4 $0.7 $0.0 $0.0 $0.0
Income Replacement Benefit $0.0 $628.0 $740.7 $846.4 $941.4
Canadian Forces Income Support $1.8 $2.2 $2.6 $3.0 $3.4
Supplementary Retirement Benefit $0.4 $53.8 $0.0 $0.0 $0.0
War Veterans Allowance $5.7 $5.3 $4.9 $4.5 $4.2
Rehabilitation and NVC Support Services6 $62.0 $68.7 $73.6 $78.9 $83.6
Career Transition Services (Grant)3 $0.0 $0.0 $0.0 $0.0 $0.0
Education and Training Benefit $19.1 $44.1 $29.5 $9.9 $9.6
Retirement Income Security Benefit $2.2 $0.0 $0.0 $0.0 $0.0
Critical Injury Benefit $1.1 $0.9 $0.8 $0.7 $0.6
Caregiver Recognition Benefit $5.3 $7.1 $8.9 $10.3 $11.3
Family Caregiver Relief Benefit $0.3 $0.0 $0.0 $0.0 $0.0
Subtotal: Program Expenditures $4,376.7 $3,926.2 $3,905.5 $4,094.2 $4,287.7
Other Program Expenditures4 $33.8 $34.5 $39.4 $41.3 $41.3
Total Program Expenditures $4,410.5 $3,960.7 $3,944.9 $4,135.5 $4,329.0
5 VAC Client and Expenditure Forecast 2019-20, prepared in October 2018 by the Statistics Directorate, Finance.6 Includes Planned Program Amendments from 2017. i.e. program changes
1 Includes Financial Counseling expenditures.
2 Includes CIA Supplement.
3 Some expenditures are too low to round to millions. Actuals can be found on Table 7.1
4 Includes Other Grants & Contributions such as the Last Post Fund, Commonwealth War Graves Commission, Veterans Emergency Fund, Veteran and Family Well-Being
Fund, Commemorative Partnership Program, etc.
Source: Chief Financial Officer and Corporate Services Branch
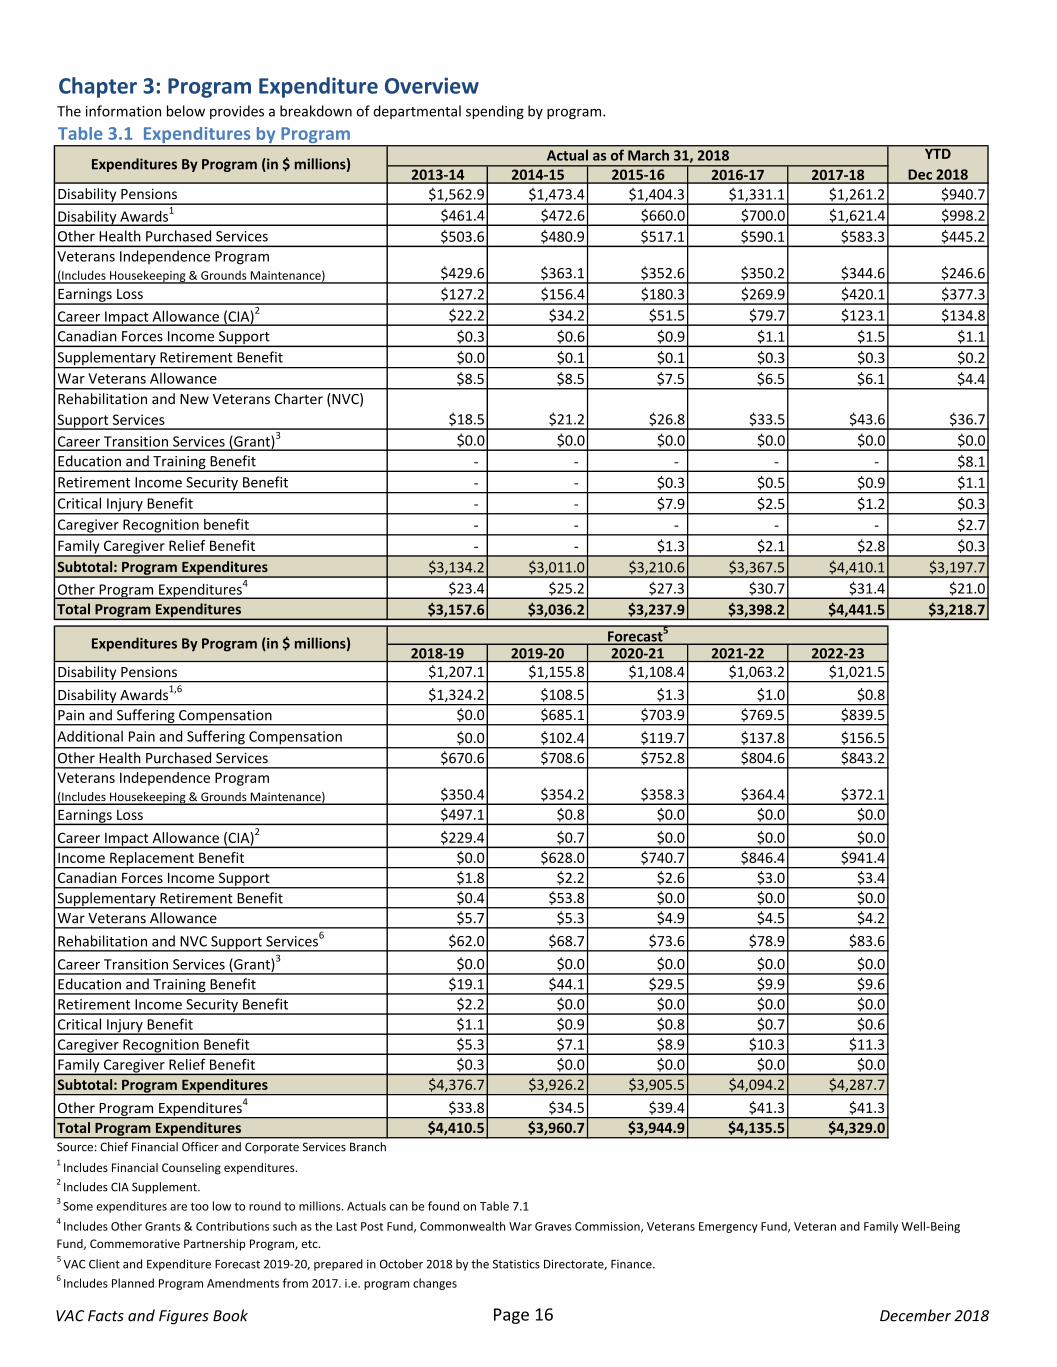
The information below provides a breakdown of departmental spending by program.
Chapter 3: Program Expenditure Overview
Table 3.1 Expenditures by Program
Expenditures By Program (in $ millions)Actual as of March 31, 2018
Expenditures By Program (in $ millions) Forecast5
YTD
Dec 2018
VAC Facts and Figures Book Page 16 December 2018
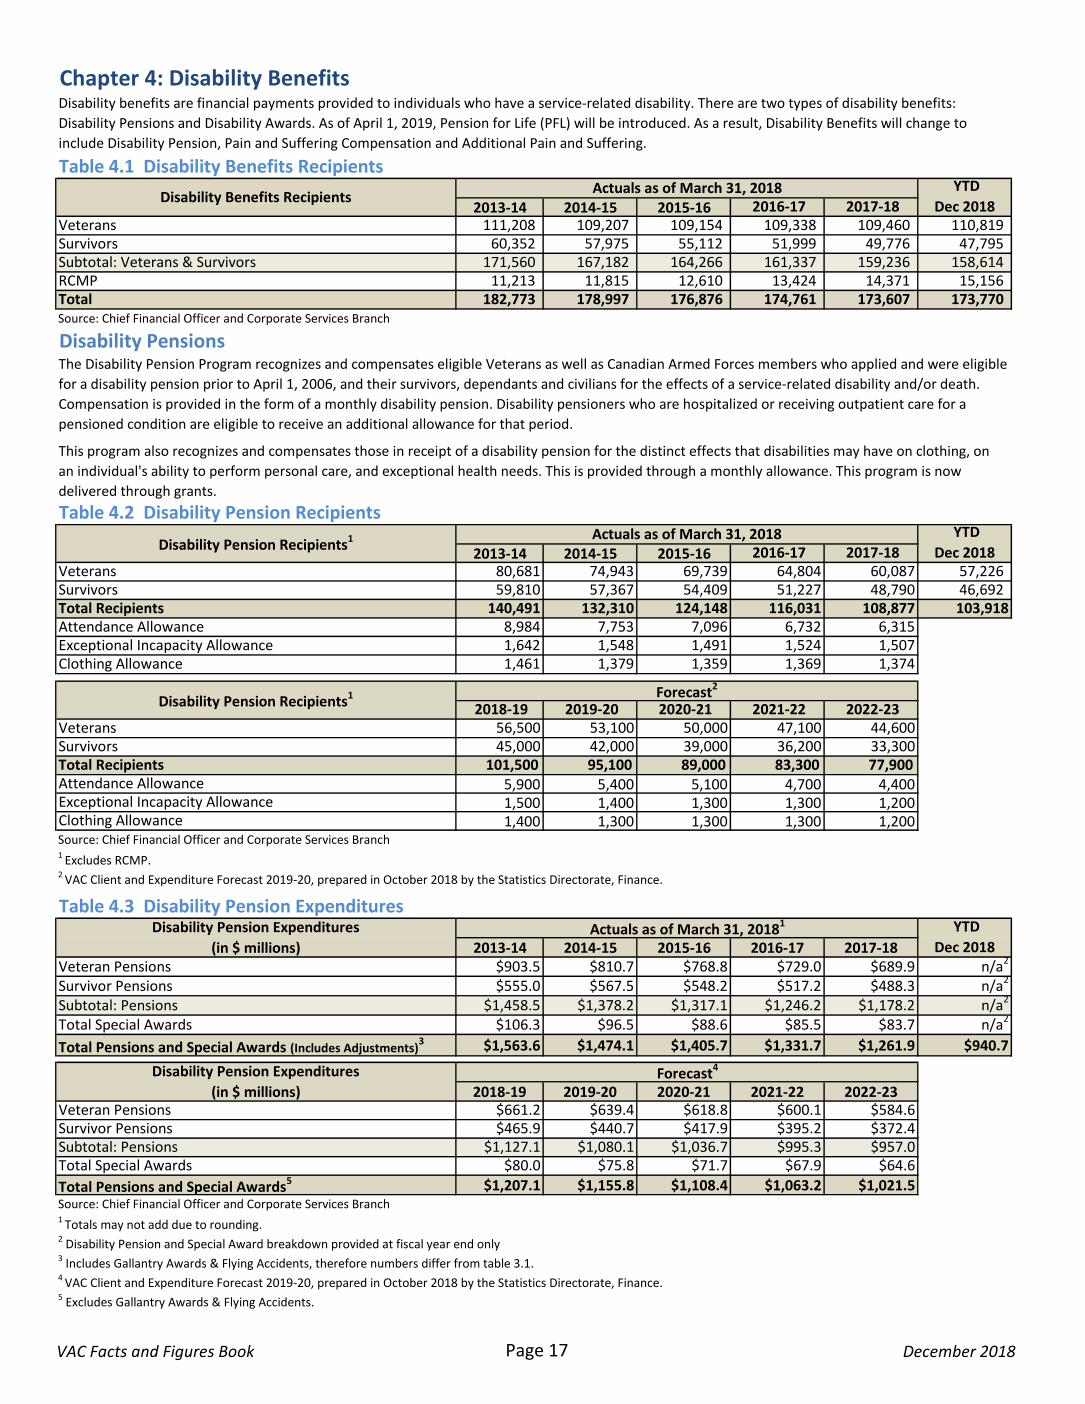
2013-14 2014-15 2015-16 2016-17 2017-18 Veterans 111,208 109,207 109,154 109,338 109,460 110,819 Survivors 60,352 57,975 55,112 51,999 49,776 47,795 Subtotal: Veterans & Survivors 171,560 167,182 164,266 161,337 159,236 158,614 RCMP 11,213 11,815 12,610 13,424 14,371 15,156 Total 182,773 178,997 176,876 174,761 173,607 173,770
2013-14 2014-15 2015-16 2016-17 2017-18 Veterans 80,681 74,943 69,739 64,804 60,087 57,226 Survivors 59,810 57,367 54,409 51,227 48,790 46,692 Total Recipients 140,491 132,310 124,148 116,031 108,877 103,918Attendance Allowance 8,984 7,753 7,096 6,732 6,315Exceptional Incapacity Allowance 1,642 1,548 1,491 1,524 1,507Clothing Allowance 1,461 1,379 1,359 1,369 1,374
2018-19 2019-20 2020-21 2021-22 2022-23 Veterans 56,500 53,100 50,000 47,100 44,600 Survivors 45,000 42,000 39,000 36,200 33,300 Total Recipients 101,500 95,100 89,000 83,300 77,900 Attendance Allowance 5,900 5,400 5,100 4,700 4,400Exceptional Incapacity Allowance 1,500 1,400 1,300 1,300 1,200Clothing Allowance 1,400 1,300 1,300 1,300 1,200
2013-14 2014-15 2015-16 2016-17 2017-18Veteran Pensions $903.5 $810.7 $768.8 $729.0 $689.9 n/a2
Survivor Pensions $555.0 $567.5 $548.2 $517.2 $488.3 n/a2
Subtotal: Pensions $1,458.5 $1,378.2 $1,317.1 $1,246.2 $1,178.2 n/a2
Total Special Awards $106.3 $96.5 $88.6 $85.5 $83.7 n/a2
Total Pensions and Special Awards (Includes Adjustments)3 $1,563.6 $1,474.1 $1,405.7 $1,331.7 $1,261.9 $940.7
2018-19 2019-20 2020-21 2021-22 2022-23Veteran Pensions $661.2 $639.4 $618.8 $600.1 $584.6Survivor Pensions $465.9 $440.7 $417.9 $395.2 $372.4Subtotal: Pensions $1,127.1 $1,080.1 $1,036.7 $995.3 $957.0Total Special Awards $80.0 $75.8 $71.7 $67.9 $64.6
Total Pensions and Special Awards5 $1,207.1 $1,155.8 $1,108.4 $1,063.2 $1,021.5
Disability Pension Expenditures
(in $ millions)Forecast4
YTD
Dec 2018
The Disability Pension Program recognizes and compensates eligible Veterans as well as Canadian Armed Forces members who applied and were eligible
for a disability pension prior to April 1, 2006, and their survivors, dependants and civilians for the effects of a service-related disability and/or death.
Compensation is provided in the form of a monthly disability pension. Disability pensioners who are hospitalized or receiving outpatient care for a
pensioned condition are eligible to receive an additional allowance for that period.
This program also recognizes and compensates those in receipt of a disability pension for the distinct effects that disabilities may have on clothing, on
an individual's ability to perform personal care, and exceptional health needs. This is provided through a monthly allowance. This program is now
delivered through grants.
1 Excludes RCMP.
Source: Chief Financial Officer and Corporate Services Branch
Disability Pension Expenditures
(in $ millions)Actuals as of March 31, 20181
Source: Chief Financial Officer and Corporate Services Branch
Disability benefits are financial payments provided to individuals who have a service-related disability. There are two types of disability benefits:
Disability Pensions and Disability Awards. As of April 1, 2019, Pension for Life (PFL) will be introduced. As a result, Disability Benefits will change to
include Disability Pension, Pain and Suffering Compensation and Additional Pain and Suffering.
Chapter 4: Disability Benefits
Table 4.1 Disability Benefits Recipients
Disability Benefits RecipientsActuals as of March 31, 2018
Source: Chief Financial Officer and Corporate Services Branch
2 Disability Pension and Special Award breakdown provided at fiscal year end only
5 Excludes Gallantry Awards & Flying Accidents.
4 VAC Client and Expenditure Forecast 2019-20, prepared in October 2018 by the Statistics Directorate, Finance.
Disability Pensions
Table 4.2 Disability Pension Recipients
Disability Pension Recipients1 Actuals as of March 31, 2018 YTD
Dec 2018
YTD
Dec 2018
3 Includes Gallantry Awards & Flying Accidents, therefore numbers differ from table 3.1.
1 Totals may not add due to rounding.
2 VAC Client and Expenditure Forecast 2019-20, prepared in October 2018 by the Statistics Directorate, Finance.
Disability Pension Recipients1 Forecast2
Table 4.3 Disability Pension Expenditures
VAC Facts and Figures Book Page 17 December 2018
2013-14 2014-15 2015-16 2016-17 2017-18
Veterans 44,765 49,372 55,698 61,759 67,575 72,517
Survivors 850 999 1,186 1,373 1,581 2,305
Subtotal 45,615 50,371 56,884 63,132 69,156 74,822
Death Benefits 324 352 431 467 538 590
Total Awards 45,939 50,723 57,315 63,599 69,694 75,412
2018-19 2019-20 2020-21 2021-22 2022-23Disability Awards 75,780 220 180 140 110
Death Benefits 620 - - - -
Total Awards 76,400 220 180 140 110
2013-14 2014-15 2015-16 2016-17 2017-181
Disability Awards $451.5 $461.6 $643.0 $690.0 $1,603.9 n/a2
Death Benefits $9.8 $11.2 $17.0 $10.0 $17.5 n/a2
Total Awards3 $461.4 $472.6 $660.0 $700.0 $1,621.4 $998.2
2018-19 2019-20 2020-21 2021-22 2022-23Disability Awards $1,302.6 $106.8 $1.3 $1.0 $0.8
Death Benefits $21.6 $1.7 $0.0 $0.0 $0.0
Total Awards $1,324.2 $108.5 $1.3 $1.0 $0.8
2013-14 2014-15 2015-16 2016-17 2017-18
Veterans 14,267 15,108 16,283 17,225 18,202 18,968
Survivors 603 743 914 1,068 1,133 1,227
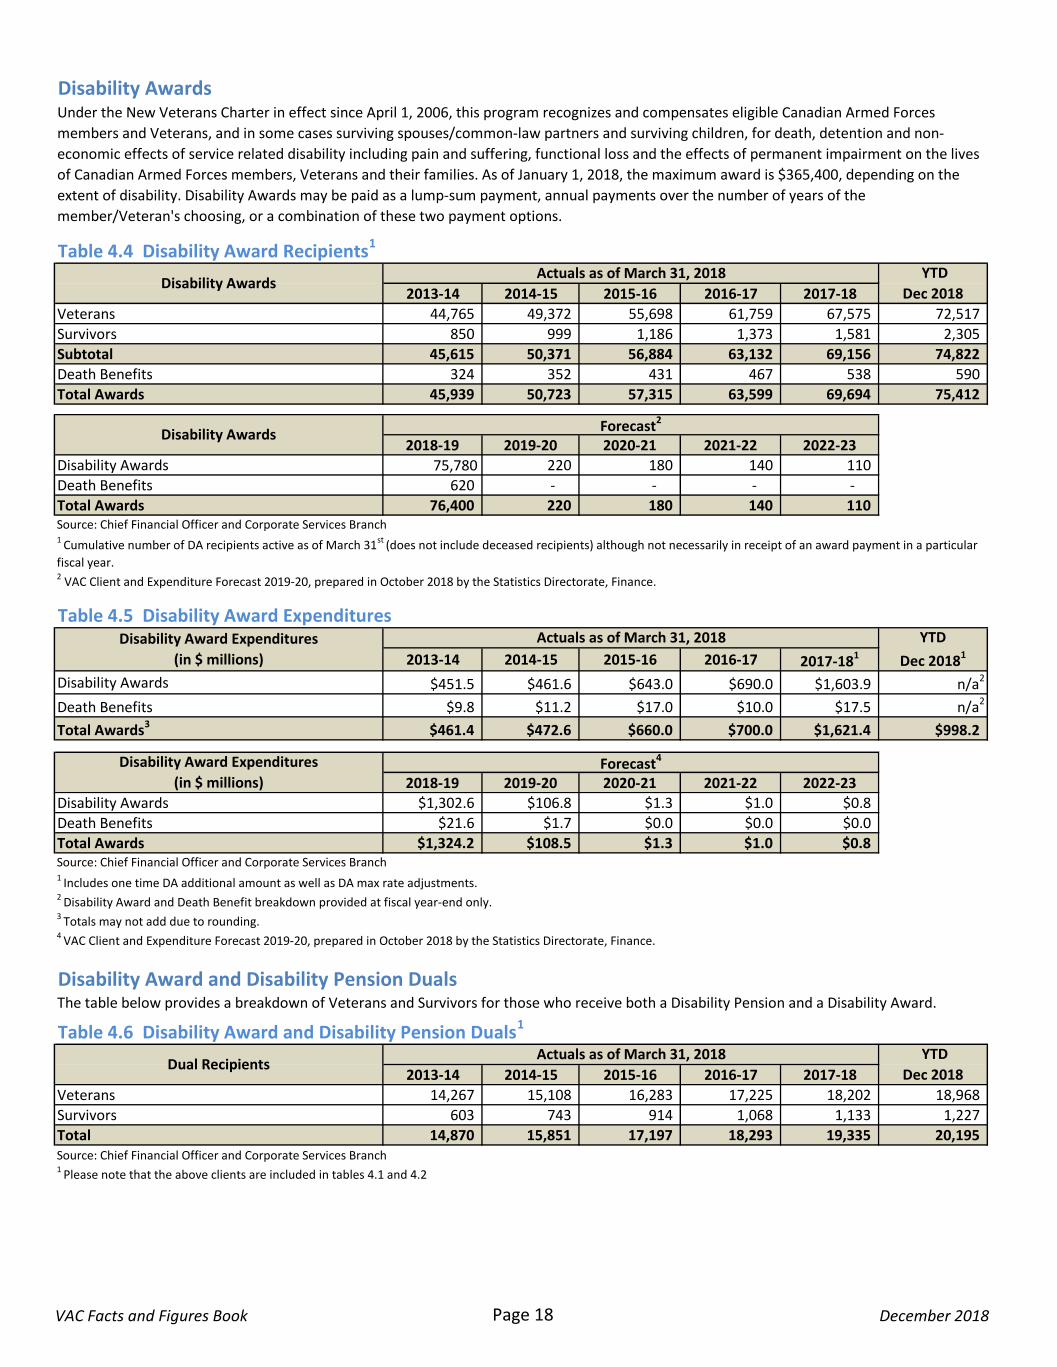
Total 14,870 15,851 17,197 18,293 19,335 20,195 Source: Chief Financial Officer and Corporate Services Branch 1
Please note that the above clients are included in tables 4.1 and 4.2
Table 4.4 Disability Award Recipients1
Disability Awards Actuals as of March 31, 2018
1 Cumulative number of DA recipients active as of March 31
st (does not include deceased recipients) although not necessarily in receipt of an award payment in a particular
fiscal year.
The table below provides a breakdown of Veterans and Survivors for those who receive both a Disability Pension and a Disability Award.
Disability Award Expenditures
(in $ millions)
Actuals as of March 31, 2018
Disability AwardsForecast2
Table 4.5 Disability Award Expenditures
Source: Chief Financial Officer and Corporate Services Branch
2 VAC Client and Expenditure Forecast 2019-20, prepared in October 2018 by the Statistics Directorate, Finance.
Source: Chief Financial Officer and Corporate Services Branch
4 VAC Client and Expenditure Forecast 2019-20, prepared in October 2018 by the Statistics Directorate, Finance.
3 Totals may not add due to rounding.
1 Includes one time DA additional amount as well as DA max rate adjustments.
Disability Awards
YTD
Dec 2018
Disability Award Expenditures
(in $ millions)Forecast4
Disability Award and Disability Pension Duals
Table 4.6 Disability Award and Disability Pension Duals1
Dual RecipientsActuals as of March 31, 2018
2 Disability Award and Death Benefit breakdown provided at fiscal year-end only.
YTD
Dec 20181
YTD
Dec 2018
Under the New Veterans Charter in effect since April 1, 2006, this program recognizes and compensates eligible Canadian Armed Forces
members and Veterans, and in some cases surviving spouses/common-law partners and surviving children, for death, detention and non-
economic effects of service related disability including pain and suffering, functional loss and the effects of permanent impairment on the lives
of Canadian Armed Forces members, Veterans and their families. As of January 1, 2018, the maximum award is $365,400, depending on the
extent of disability. Disability Awards may be paid as a lump-sum payment, annual payments over the number of years of the
member/Veteran's choosing, or a combination of these two payment options.
VAC Facts and Figures Book Page 18 December 2018
Survivors
Disability Pension
(DP) Only
Disability Pension &
Award
Disability Award
OnlyTotal Disability Disability Benefits
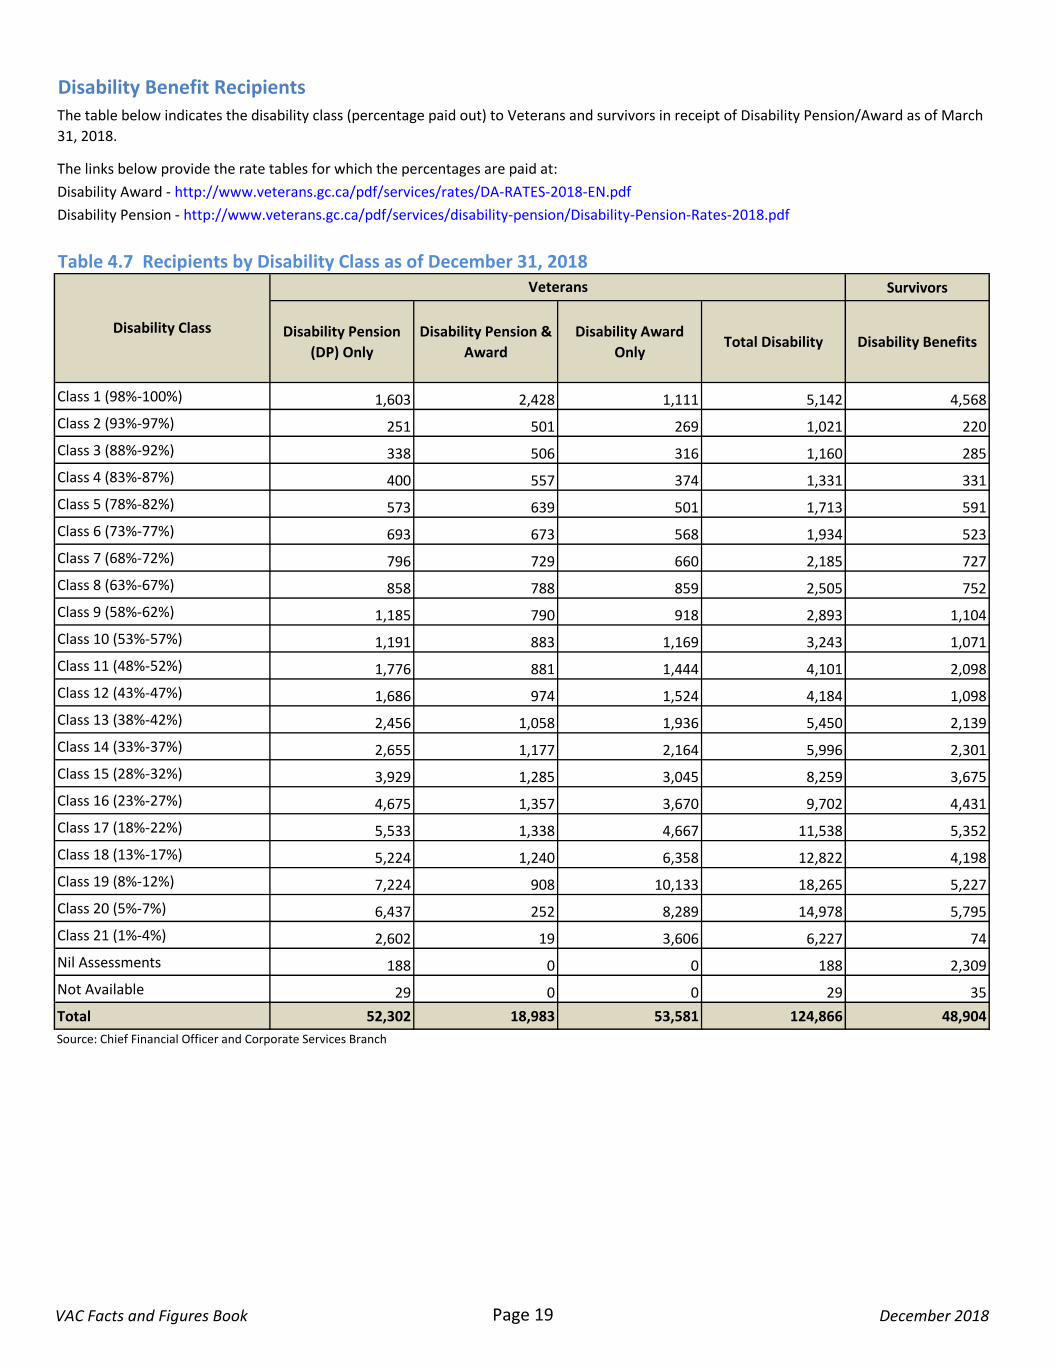
Class 1 (98%-100%) 1,603 2,428 1,111 5,142 4,568
Class 2 (93%-97%) 251 501 269 1,021 220
Class 3 (88%-92%) 338 506 316 1,160 285
Class 4 (83%-87%) 400 557 374 1,331 331
Class 5 (78%-82%) 573 639 501 1,713 591
Class 6 (73%-77%) 693 673 568 1,934 523
Class 7 (68%-72%) 796 729 660 2,185 727
Class 8 (63%-67%) 858 788 859 2,505 752
Class 9 (58%-62%) 1,185 790 918 2,893 1,104
Class 10 (53%-57%) 1,191 883 1,169 3,243 1,071
Class 11 (48%-52%) 1,776 881 1,444 4,101 2,098
Class 12 (43%-47%) 1,686 974 1,524 4,184 1,098
Class 13 (38%-42%) 2,456 1,058 1,936 5,450 2,139
Class 14 (33%-37%) 2,655 1,177 2,164 5,996 2,301
Class 15 (28%-32%) 3,929 1,285 3,045 8,259 3,675
Class 16 (23%-27%) 4,675 1,357 3,670 9,702 4,431
Class 17 (18%-22%) 5,533 1,338 4,667 11,538 5,352
Class 18 (13%-17%) 5,224 1,240 6,358 12,822 4,198
Class 19 (8%-12%) 7,224 908 10,133 18,265 5,227
Class 20 (5%-7%) 6,437 252 8,289 14,978 5,795
Class 21 (1%-4%) 2,602 19 3,606 6,227 74
Nil Assessments 188 0 0 188 2,309
Not Available 29 0 0 29 35
Total 52,302 18,983 53,581 124,866 48,904
Source: Chief Financial Officer and Corporate Services Branch
Disability Class
Table 4.7 Recipients by Disability Class as of December 31, 2018
Disability Benefit RecipientsThe table below indicates the disability class (percentage paid out) to Veterans and survivors in receipt of Disability Pension/Award as of March
31, 2018.
The links below provide the rate tables for which the percentages are paid at:
Disability Award - http://www.veterans.gc.ca/pdf/services/rates/DA-RATES-2018-EN.pdf
Disability Pension - http://www.veterans.gc.ca/pdf/services/disability-pension/Disability-Pension-Rates-2018.pdf
Veterans
VAC Facts and Figures Book Page 19 December 2018
Ranking All Veterans
1 Hearing Loss
2 Tinnitus
3 Post Traumatic Stress Disorder
4 Lumbar Disc Disease
5 Osteoarthritis Knee
6 Internal Derangement Knee
7 Cervical Disc Disease
8
Depressive Disorders,
including Dysthymia and
Major Depression
9 Osteoarthritis Lumbar Spine
10Chronic Mechanical Low Back
Pain
# of Favourable
Decisions
% of
Favourable
Decisions
# of
Unfavourable
Decisions
% of
Unfavourable
Decisions
4,245 77% 1,257 23% 5,502
3,831 74% 1,376 26% 5,207
2,453 96% 95 4% 2,548
766 83% 158 17% 924
716 90% 83 10% 799
611 86% 100 14% 711
589 83% 118 17% 707
489 80% 125 20% 614
479 84% 94 16% 573
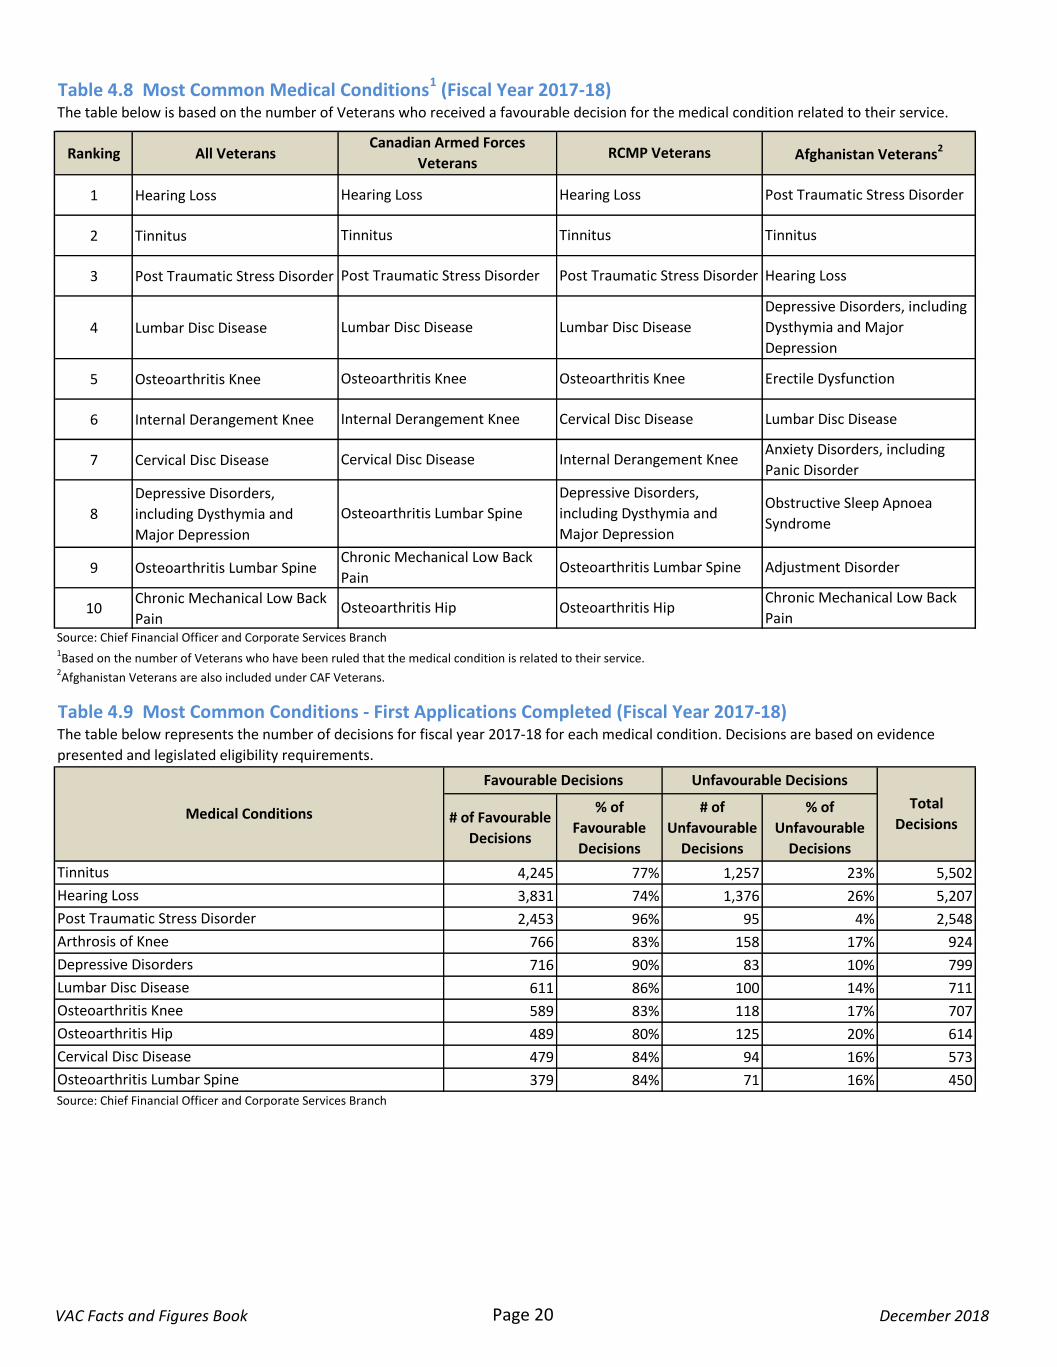
379 84% 71 16% 450Source: Chief Financial Officer and Corporate Services Branch
Chronic Mechanical Low Back
Pain
Osteoarthritis Lumbar Spine
Osteoarthritis Hip Osteoarthritis Hip
1Based on the number of Veterans who have been ruled that the medical condition is related to their service.
Adjustment Disorder
Table 4.9 Most Common Conditions - First Applications Completed (Fiscal Year 2017-18)The table below represents the number of decisions for fiscal year 2017-18 for each medical condition. Decisions are based on evidence
presented and legislated eligibility requirements.
Unfavourable Decisions
Total
Decisions
Favourable Decisions
Medical Conditions
Osteoarthritis Knee Osteoarthritis Knee Erectile Dysfunction
Source: Chief Financial Officer and Corporate Services Branch
Cervical Disc Disease Internal Derangement Knee Anxiety Disorders, including
Panic Disorder
Osteoarthritis Lumbar Spine
Depressive Disorders,
including Dysthymia and
Major Depression
Obstructive Sleep Apnoea
Syndrome
Internal Derangement Knee Cervical Disc Disease Lumbar Disc Disease
2Afghanistan Veterans are also included under CAF Veterans.
Chronic Mechanical Low Back
Pain
Post Traumatic Stress Disorder Post Traumatic Stress Disorder Hearing Loss
Lumbar Disc Disease Lumbar Disc Disease
Depressive Disorders, including
Dysthymia and Major
Depression
Hearing Loss Hearing Loss Post Traumatic Stress Disorder
Tinnitus Tinnitus Tinnitus
Table 4.8 Most Common Medical Conditions1 (Fiscal Year 2017-18)The table below is based on the number of Veterans who received a favourable decision for the medical condition related to their service.
Canadian Armed Forces
VeteransRCMP Veterans Afghanistan Veterans2
Osteoarthritis Lumbar Spine
Cervical Disc Disease
Osteoarthritis Hip
Osteoarthritis Knee
Lumbar Disc Disease
Depressive Disorders
Arthrosis of Knee
Post Traumatic Stress Disorder
Hearing Loss
Tinnitus
VAC Facts and Figures Book Page 20 December 2018
2013-14 2014-15 2015-16 2016-17 2017-18
Applications
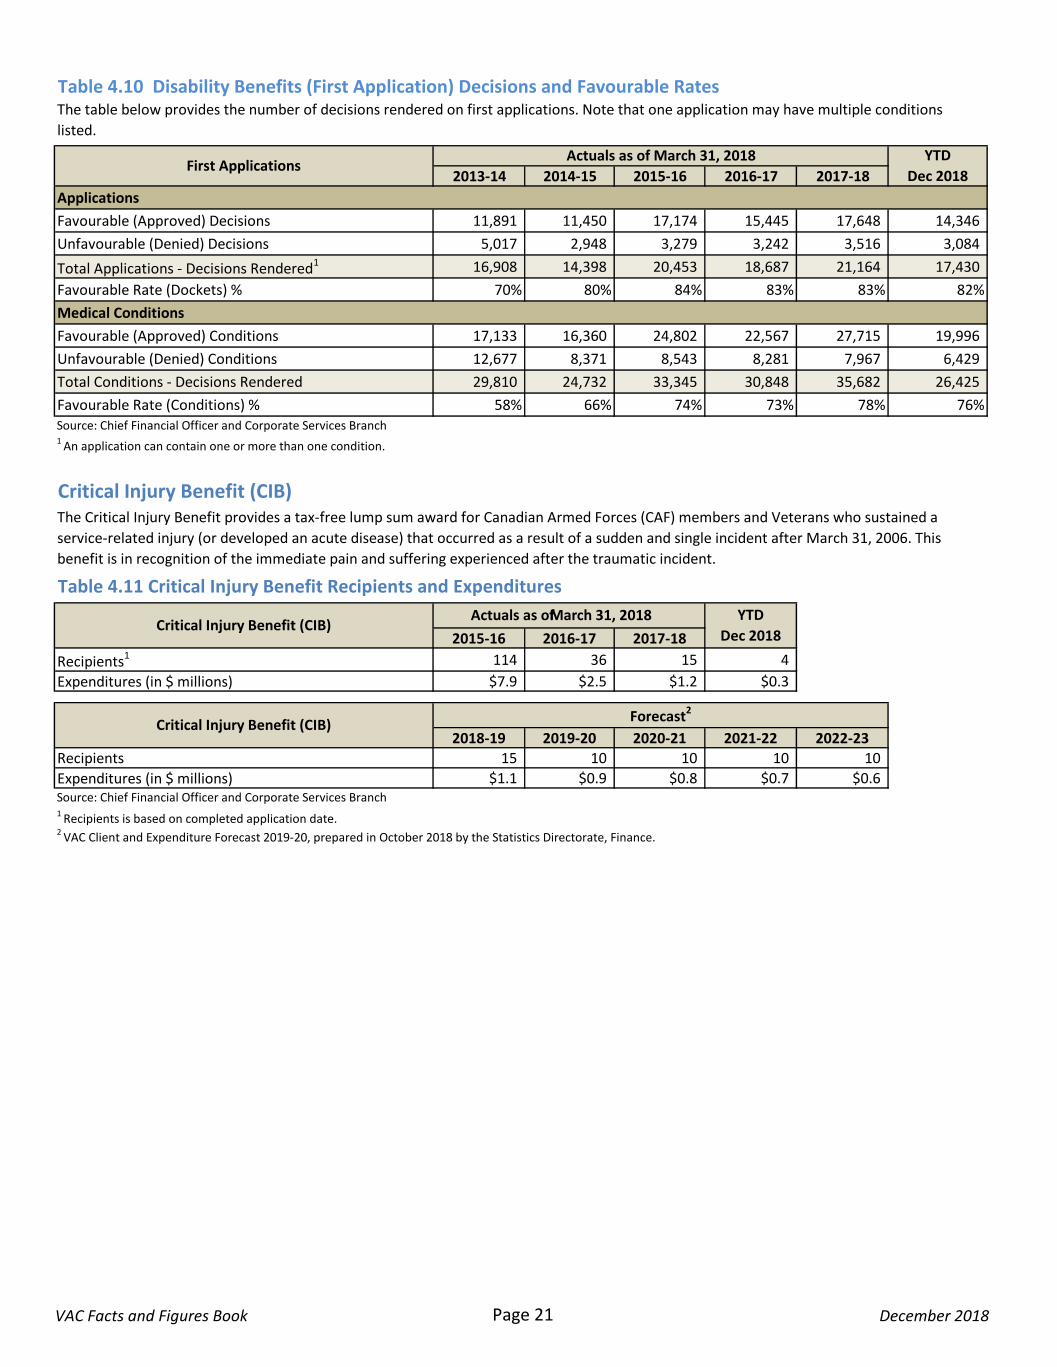
Favourable (Approved) Decisions 11,891 11,450 17,174 15,445 17,648 14,346
Unfavourable (Denied) Decisions 5,017 2,948 3,279 3,242 3,516 3,084
Total Applications - Decisions Rendered1 16,908 14,398 20,453 18,687 21,164 17,430
Favourable Rate (Dockets) % 70% 80% 84% 83% 83% 82%
Medical Conditions
Favourable (Approved) Conditions 17,133 16,360 24,802 22,567 27,715 19,996
Unfavourable (Denied) Conditions 12,677 8,371 8,543 8,281 7,967 6,429
Total Conditions - Decisions Rendered 29,810 24,732 33,345 30,848 35,682 26,425
Favourable Rate (Conditions) % 58% 66% 74% 73% 78% 76%
2015-16 2016-17 2017-18
Recipients1 114 36 15 4
Expenditures (in $ millions) $7.9 $2.5 $1.2 $0.3
2018-19 2019-20 2020-21 2021-22 2022-23Recipients 15 10 10 10 10
Expenditures (in $ millions) $1.1 $0.9 $0.8 $0.7 $0.6
1 Recipients is based on completed application date.
Table 4.11 Critical Injury Benefit Recipients and Expenditures
Critical Injury Benefit (CIB)
Critical Injury Benefit (CIB)Forecast2
Actuals as of March 31, 2018 YTD
Dec 2018
Source: Chief Financial Officer and Corporate Services Branch
2 VAC Client and Expenditure Forecast 2019-20, prepared in October 2018 by the Statistics Directorate, Finance.
Actuals as of March 31, 2018 YTD
Dec 2018
The Critical Injury Benefit provides a tax-free lump sum award for Canadian Armed Forces (CAF) members and Veterans who sustained a
service-related injury (or developed an acute disease) that occurred as a result of a sudden and single incident after March 31, 2006. This
benefit is in recognition of the immediate pain and suffering experienced after the traumatic incident.
Table 4.10 Disability Benefits (First Application) Decisions and Favourable RatesThe table below provides the number of decisions rendered on first applications. Note that one application may have multiple conditions
listed.
Critical Injury Benefit (CIB)
First Applications
1 An application can contain one or more than one condition.
Source: Chief Financial Officer and Corporate Services Branch
VAC Facts and Figures Book Page 21 December 2018
2013-14 2014-15 2015-16 2016-17 2017-18
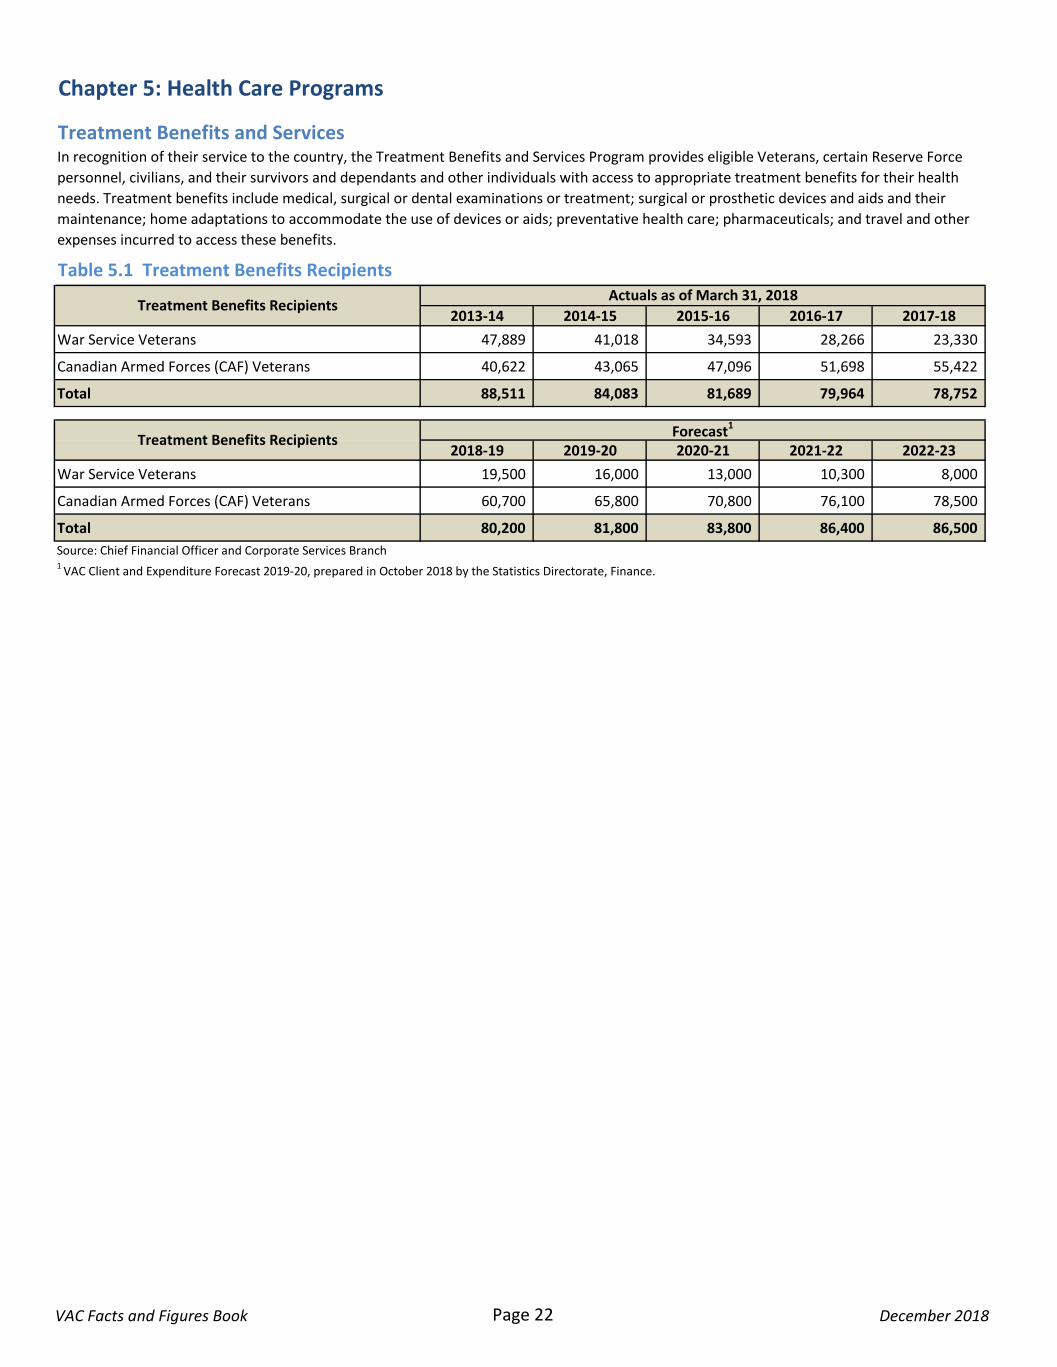
War Service Veterans 47,889 41,018 34,593 28,266 23,330
Canadian Armed Forces (CAF) Veterans 40,622 43,065 47,096 51,698 55,422
Total 88,511 84,083 81,689 79,964 78,752
2018-19 2019-20 2020-21 2021-22 2022-23
War Service Veterans 19,500 16,000 13,000 10,300 8,000
Canadian Armed Forces (CAF) Veterans 60,700 65,800 70,800 76,100 78,500
Total 80,200 81,800 83,800 86,400 86,500
Source: Chief Financial Officer and Corporate Services Branch 1 VAC Client and Expenditure Forecast 2019-20, prepared in October 2018 by the Statistics Directorate, Finance.
Treatment Benefits RecipientsForecast1
Chapter 5: Health Care Programs
Treatment Benefits and ServicesIn recognition of their service to the country, the Treatment Benefits and Services Program provides eligible Veterans, certain Reserve Force
personnel, civilians, and their survivors and dependants and other individuals with access to appropriate treatment benefits for their health
needs. Treatment benefits include medical, surgical or dental examinations or treatment; surgical or prosthetic devices and aids and their
maintenance; home adaptations to accommodate the use of devices or aids; preventative health care; pharmaceuticals; and travel and other
expenses incurred to access these benefits.
Table 5.1 Treatment Benefits Recipients
Treatment Benefits RecipientsActuals as of March 31, 2018
VAC Facts and Figures Book Page 22 December 2018
2013-14 2014-15 2015-16 2016-17 2017-18
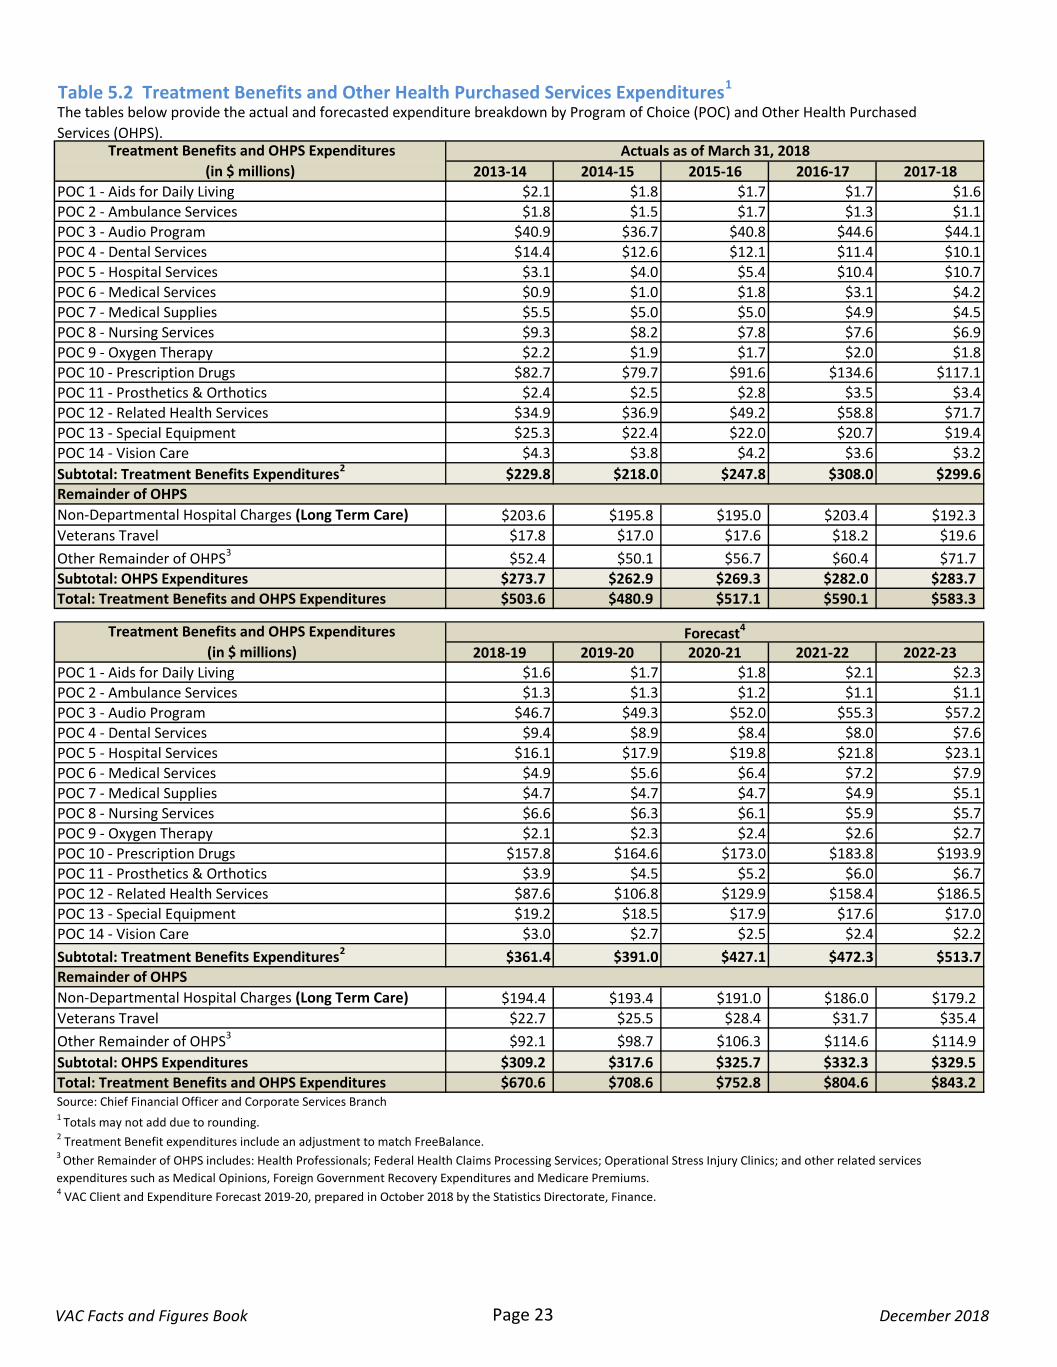
POC 1 - Aids for Daily Living $2.1 $1.8 $1.7 $1.7 $1.6
POC 2 - Ambulance Services $1.8 $1.5 $1.7 $1.3 $1.1
POC 3 - Audio Program $40.9 $36.7 $40.8 $44.6 $44.1
POC 4 - Dental Services $14.4 $12.6 $12.1 $11.4 $10.1
POC 5 - Hospital Services $3.1 $4.0 $5.4 $10.4 $10.7
POC 6 - Medical Services $0.9 $1.0 $1.8 $3.1 $4.2
POC 7 - Medical Supplies $5.5 $5.0 $5.0 $4.9 $4.5
POC 8 - Nursing Services $9.3 $8.2 $7.8 $7.6 $6.9
POC 9 - Oxygen Therapy $2.2 $1.9 $1.7 $2.0 $1.8
POC 10 - Prescription Drugs $82.7 $79.7 $91.6 $134.6 $117.1
POC 11 - Prosthetics & Orthotics $2.4 $2.5 $2.8 $3.5 $3.4
POC 12 - Related Health Services $34.9 $36.9 $49.2 $58.8 $71.7
POC 13 - Special Equipment $25.3 $22.4 $22.0 $20.7 $19.4
POC 14 - Vision Care $4.3 $3.8 $4.2 $3.6 $3.2
Subtotal: Treatment Benefits Expenditures2 $229.8 $218.0 $247.8 $308.0 $299.6
Non-Departmental Hospital Charges (Long Term Care) $203.6 $195.8 $195.0 $203.4 $192.3
Veterans Travel $17.8 $17.0 $17.6 $18.2 $19.6
Other Remainder of OHPS3 $52.4 $50.1 $56.7 $60.4 $71.7
Subtotal: OHPS Expenditures $273.7 $262.9 $269.3 $282.0 $283.7
Total: Treatment Benefits and OHPS Expenditures $503.6 $480.9 $517.1 $590.1 $583.3
2018-19 2019-20 2020-21 2021-22 2022-23POC 1 - Aids for Daily Living $1.6 $1.7 $1.8 $2.1 $2.3
POC 2 - Ambulance Services $1.3 $1.3 $1.2 $1.1 $1.1
POC 3 - Audio Program $46.7 $49.3 $52.0 $55.3 $57.2
POC 4 - Dental Services $9.4 $8.9 $8.4 $8.0 $7.6
POC 5 - Hospital Services $16.1 $17.9 $19.8 $21.8 $23.1
POC 6 - Medical Services $4.9 $5.6 $6.4 $7.2 $7.9
POC 7 - Medical Supplies $4.7 $4.7 $4.7 $4.9 $5.1
POC 8 - Nursing Services $6.6 $6.3 $6.1 $5.9 $5.7
POC 9 - Oxygen Therapy $2.1 $2.3 $2.4 $2.6 $2.7
POC 10 - Prescription Drugs $157.8 $164.6 $173.0 $183.8 $193.9
POC 11 - Prosthetics & Orthotics $3.9 $4.5 $5.2 $6.0 $6.7
POC 12 - Related Health Services $87.6 $106.8 $129.9 $158.4 $186.5
POC 13 - Special Equipment $19.2 $18.5 $17.9 $17.6 $17.0
POC 14 - Vision Care $3.0 $2.7 $2.5 $2.4 $2.2
Subtotal: Treatment Benefits Expenditures2 $361.4 $391.0 $427.1 $472.3 $513.7
Non-Departmental Hospital Charges (Long Term Care) $194.4 $193.4 $191.0 $186.0 $179.2
Veterans Travel $22.7 $25.5 $28.4 $31.7 $35.4
Other Remainder of OHPS3 $92.1 $98.7 $106.3 $114.6 $114.9
Subtotal: OHPS Expenditures $309.2 $317.6 $325.7 $332.3 $329.5
Total: Treatment Benefits and OHPS Expenditures $670.6 $708.6 $752.8 $804.6 $843.2
4 VAC Client and Expenditure Forecast 2019-20, prepared in October 2018 by the Statistics Directorate, Finance.
3 Other Remainder of OHPS includes: Health Professionals; Federal Health Claims Processing Services; Operational Stress Injury Clinics; and other related services
expenditures such as Medical Opinions, Foreign Government Recovery Expenditures and Medicare Premiums.
Treatment Benefits and OHPS Expenditures
(in $ millions) Forecast4
Remainder of OHPS
1 Totals may not add due to rounding.
2 Treatment Benefit expenditures include an adjustment to match FreeBalance.
Source: Chief Financial Officer and Corporate Services Branch
Remainder of OHPS
The tables below provide the actual and forecasted expenditure breakdown by Program of Choice (POC) and Other Health Purchased
Services (OHPS).
Table 5.2 Treatment Benefits and Other Health Purchased Services Expenditures1
Treatment Benefits and OHPS Expenditures
(in $ millions)
Actuals as of March 31, 2018
VAC Facts and Figures Book Page 23 December 2018
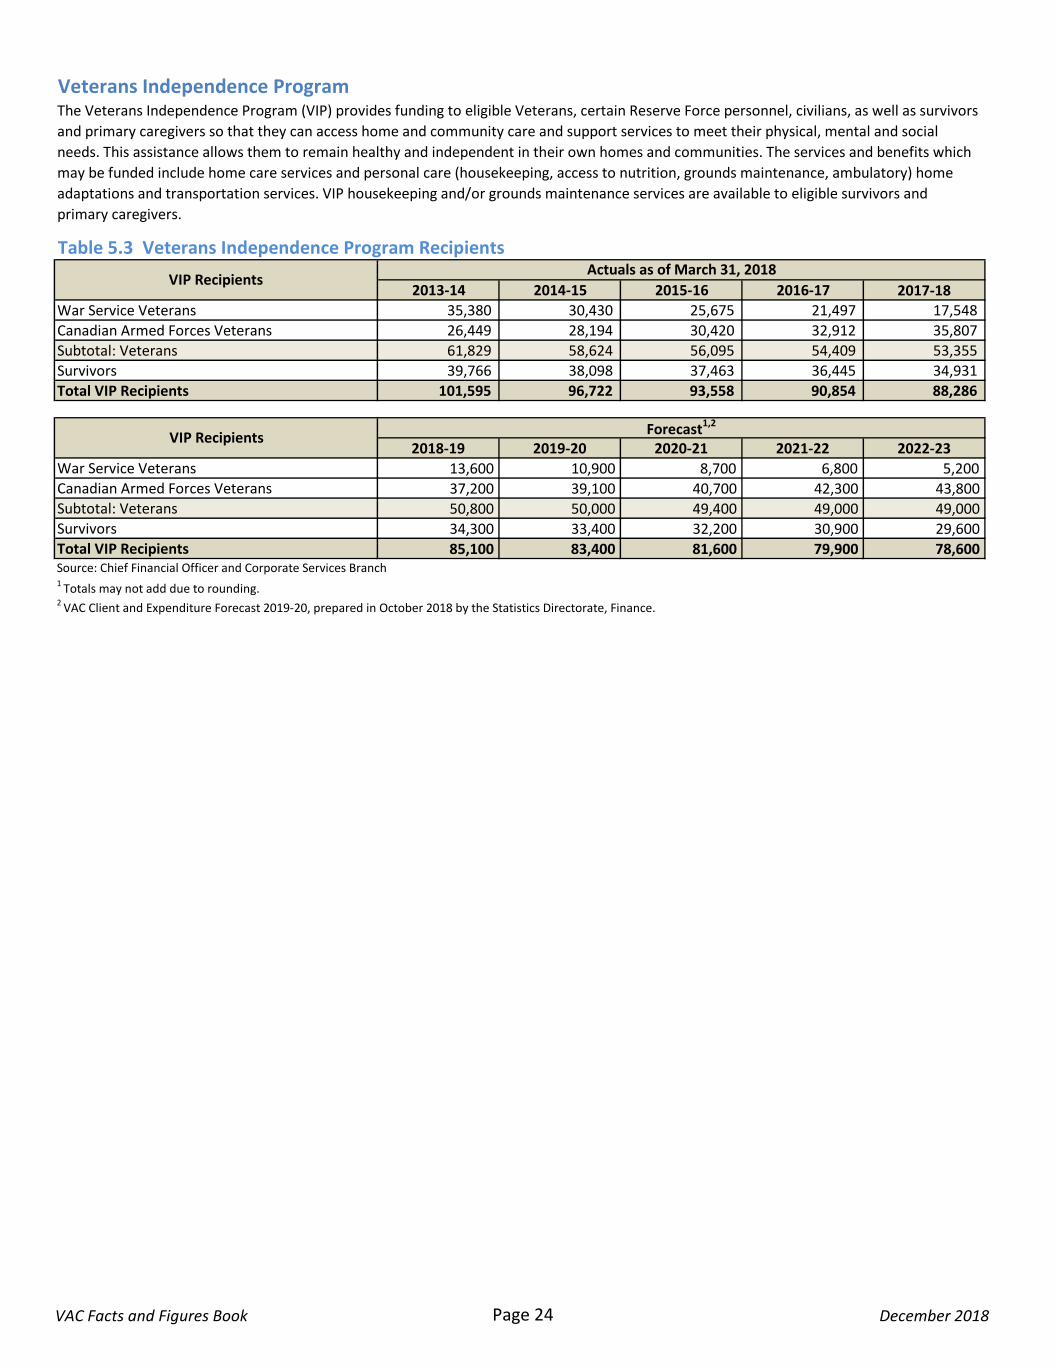
2013-14 2014-15 2015-16 2016-17 2017-18War Service Veterans 35,380 30,430 25,675 21,497 17,548
Canadian Armed Forces Veterans 26,449 28,194 30,420 32,912 35,807
Subtotal: Veterans 61,829 58,624 56,095 54,409 53,355
Survivors 39,766 38,098 37,463 36,445 34,931
Total VIP Recipients 101,595 96,722 93,558 90,854 88,286
2018-19 2019-20 2020-21 2021-22 2022-23War Service Veterans 13,600 10,900 8,700 6,800 5,200 Canadian Armed Forces Veterans 37,200 39,100 40,700 42,300 43,800 Subtotal: Veterans 50,800 50,000 49,400 49,000 49,000 Survivors 34,300 33,400 32,200 30,900 29,600 Total VIP Recipients 85,100 83,400 81,600 79,900 78,600 Source: Chief Financial Officer and Corporate Services Branch 1 Totals may not add due to rounding.2
VAC Client and Expenditure Forecast 2019-20, prepared in October 2018 by the Statistics Directorate, Finance.
VIP RecipientsForecast1,2
Veterans Independence ProgramThe Veterans Independence Program (VIP) provides funding to eligible Veterans, certain Reserve Force personnel, civilians, as well as survivors
and primary caregivers so that they can access home and community care and support services to meet their physical, mental and social
needs. This assistance allows them to remain healthy and independent in their own homes and communities. The services and benefits which
may be funded include home care services and personal care (housekeeping, access to nutrition, grounds maintenance, ambulatory) home
adaptations and transportation services. VIP housekeeping and/or grounds maintenance services are available to eligible survivors and
primary caregivers.
Table 5.3 Veterans Independence Program Recipients
VIP RecipientsActuals as of March 31, 2018
VAC Facts and Figures Book Page 24 December 2018
2013-14 2014-15 2015-16 2016-17 2017-18
Ambulatory Care $0.8 $0.6 $0.6 $0.4 $0.3
Health and Support Services $0.5 $0.4 $0.4 $0.9 $1.1
Access to Nutrition $7.8 $7.2 $6.4 $6.0 $5.2
Personal Care $24.9 $23.0 $23.2 $25.0 $25.6
Housekeeping $75.9 $0.4 $0.0 $0.0 $0.0
Grounds Maintenance $19.9 $0.1 $0.0 $0.0 $0.0
Transportation Services $1.3 $1.0 $0.8 $0.7 $0.5
Home Adaptations $0.6 $0.8 $0.9 $1.5 $1.7
Adult Residential Care $0.0 $0.0 $0.0 $0.0 $0.0
Intermediate Care $52.5 $49.0 $48.9 $46.7 $44.6
Subtotal: Contributions $184.1 $82.6 $81.2 $81.3 $79.1
Housekeeping & Grounds Maintenance Grants2 $245.6 $280.5 $271.3 $268.8 $265.5
Total: VIP Expenditures $429.6 $363.1 $352.6 $350.2 $344.6
2018-19 2019-20 2020-21 2021-22 2022-23
Ambulatory Care $0.4 $0.4 $0.3 $0.3 $0.3
Health and Support Services $1.2 $1.2 $1.3 $1.3 $1.4
Access to Nutrition $4.8 $4.5 $4.3 $4.1 $4.0
Personal Care $23.4 $22.3 $21.3 $20.8 $20.4
Transportation Services $0.4 $0.4 $0.3 $0.3 $0.2
Home Adaptations $1.8 $1.9 $2.0 $2.1 $2.2
Adult Residential Care $0.0 $0.0 $0.0 $0.0 $0.0
Intermediate Care $42.4 $41.8 $41.5 $41.8 $42.5
Subtotal: Contributions $74.4 $72.4 $71.0 $70.7 $71.1
Housekeeping (Grants) $204.7 $207.4 $209.9 $213.1 $216.8
Grounds Maintenance (Grants) $71.4 $74.5 $77.4 $80.7 $84.1
Subtotal: Grants $276.0 $281.8 $287.3 $293.7 $301.0
Total: VIP Expenditures $350.4 $354.2 $358.3 $364.4 $372.1Source: Chief Financial Officer and Corporate Services Branch
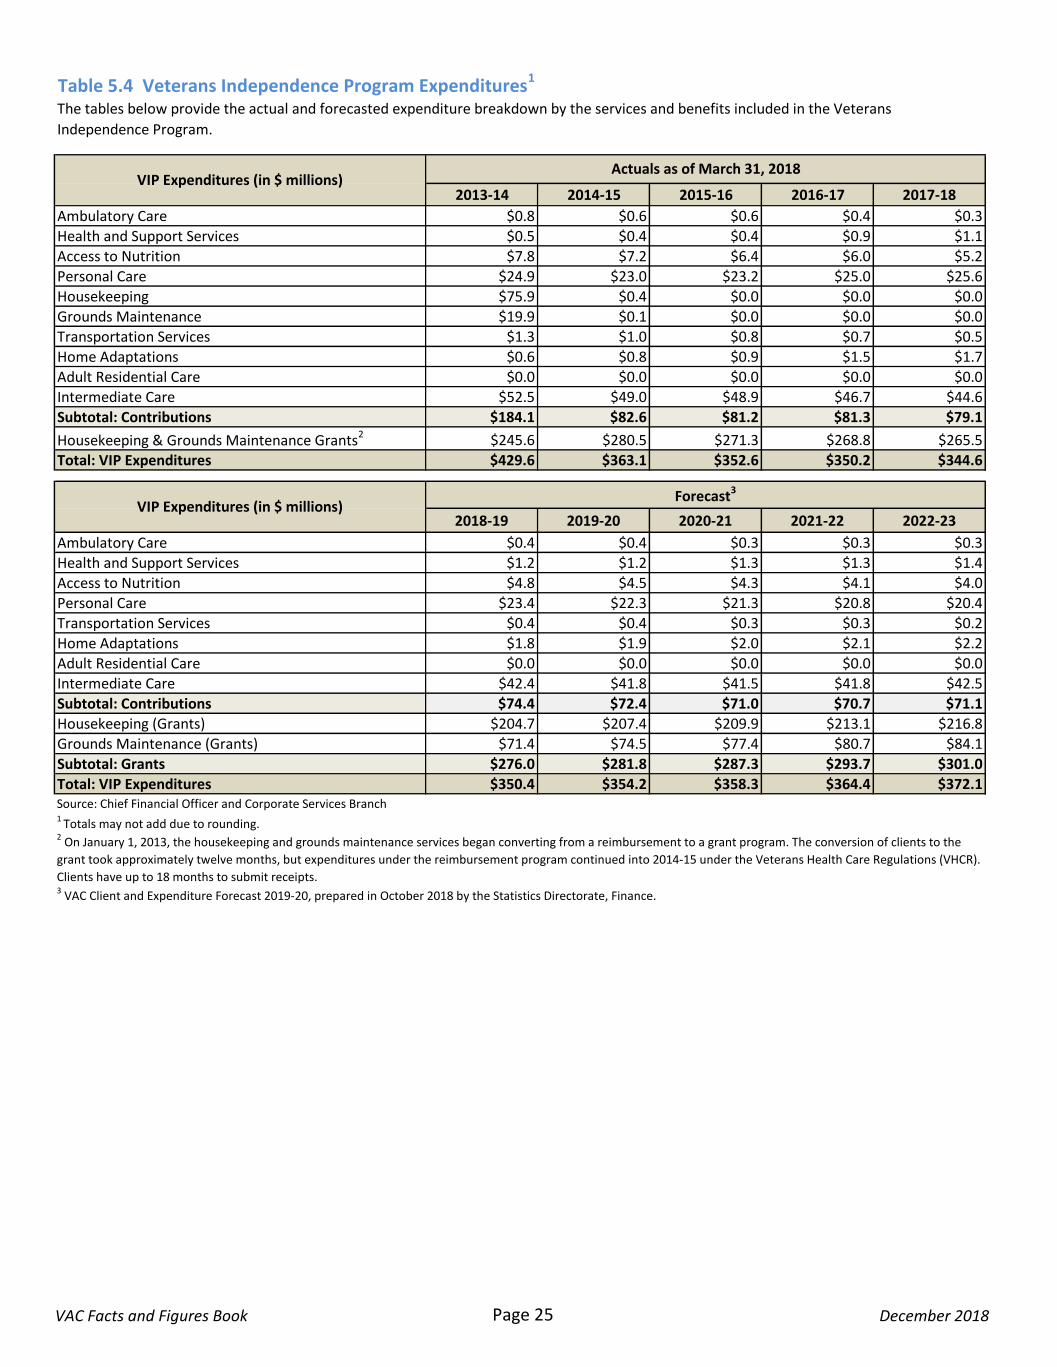
3 VAC Client and Expenditure Forecast 2019-20, prepared in October 2018 by the Statistics Directorate, Finance.
2 On January 1, 2013, the housekeeping and grounds maintenance services began converting from a reimbursement to a grant program. The conversion of clients to the
grant took approximately twelve months, but expenditures under the reimbursement program continued into 2014-15 under the Veterans Health Care Regulations (VHCR).
Clients have up to 18 months to submit receipts.
VIP Expenditures (in $ millions)Forecast3
The tables below provide the actual and forecasted expenditure breakdown by the services and benefits included in the Veterans
Independence Program.
Table 5.4 Veterans Independence Program Expenditures1
VIP Expenditures (in $ millions)Actuals as of March 31, 2018
1 Totals may not add due to rounding.
VAC Facts and Figures Book Page 25 December 2018
2013-14 2014-15 2015-16 2016-17 2017-18
Veterans in Departmental Beds 340 325 302 n/a1 n/a1 n/a1
Veterans in Contract Beds (LTC funded) 2,450 2,252 2,178 2,157 1,810 1,527
Veterans in Community Beds (LTC funded) 2,011 1,796 1,522 1,247 1,288 986
Veterans in Community Beds (VIP funded) 2,858 2,536 2,439 2,326 2,012 1,835
Total : Veterans in LTC Beds 7,659 6,909 6,441 5,730 5,110 4,348
Veterans in Departmental Beds $63.0 $63.8 $70.8 n/a1 n/a1 n/a1
Veterans in Contract Beds (LTC funded) $174.9 $170.7 $171.0 $183.1 $175.6 n/a3
Veterans in Community Beds (LTC funded) $28.7 $25.1 $24.0 $20.3 $16.8 n/a3
Veterans in Community Beds (VIP funded) $52.5 $49.1 $48.9 $46.7 $44.6 n/a3
Subtotal : LTC Facility Funding $319.1 $308.7 $314.7 $250.1 $237.0 n/a3
Additional Funding: Ste. Anne's Hospital2 $0.0 $0.0 $0.0 $55.7 $4.9 n/a3
Total: LTC Expenditures $319.1 $308.7 $314.7 $305.8 $241.9 n/a3
2018-19 2019-20 2020-21 2021-22 2022-23Veterans in Contract Beds (LTC funded) 1,666 1,492 1,301 1,017 779
Veterans in Community Beds (LTC funded) 1,243 1,160 1,052 857 698
Veterans in Community Beds (VIP funded) 1,923 1,841 1,775 1,714 1,682
Total: Forecasted Veterans in LTC Beds 4,832 4,493 4,128 3,588 3,159
Veterans in Contract Beds (LTC funded) $176.7 $176.1 $174.5 $171.2 $166.6
Veterans in Community Beds (LTC funded) $17.7 $17.3 $16.5 $14.8 $12.6
Veterans in Community Beds (VIP funded) $42.4 $41.8 $41.5 $41.8 $42.5
Total: Forecasted LTC Funding $236.8 $235.2 $232.5 $227.8 $221.7
Source: Chief Financial Officer and Corporate Services Branch
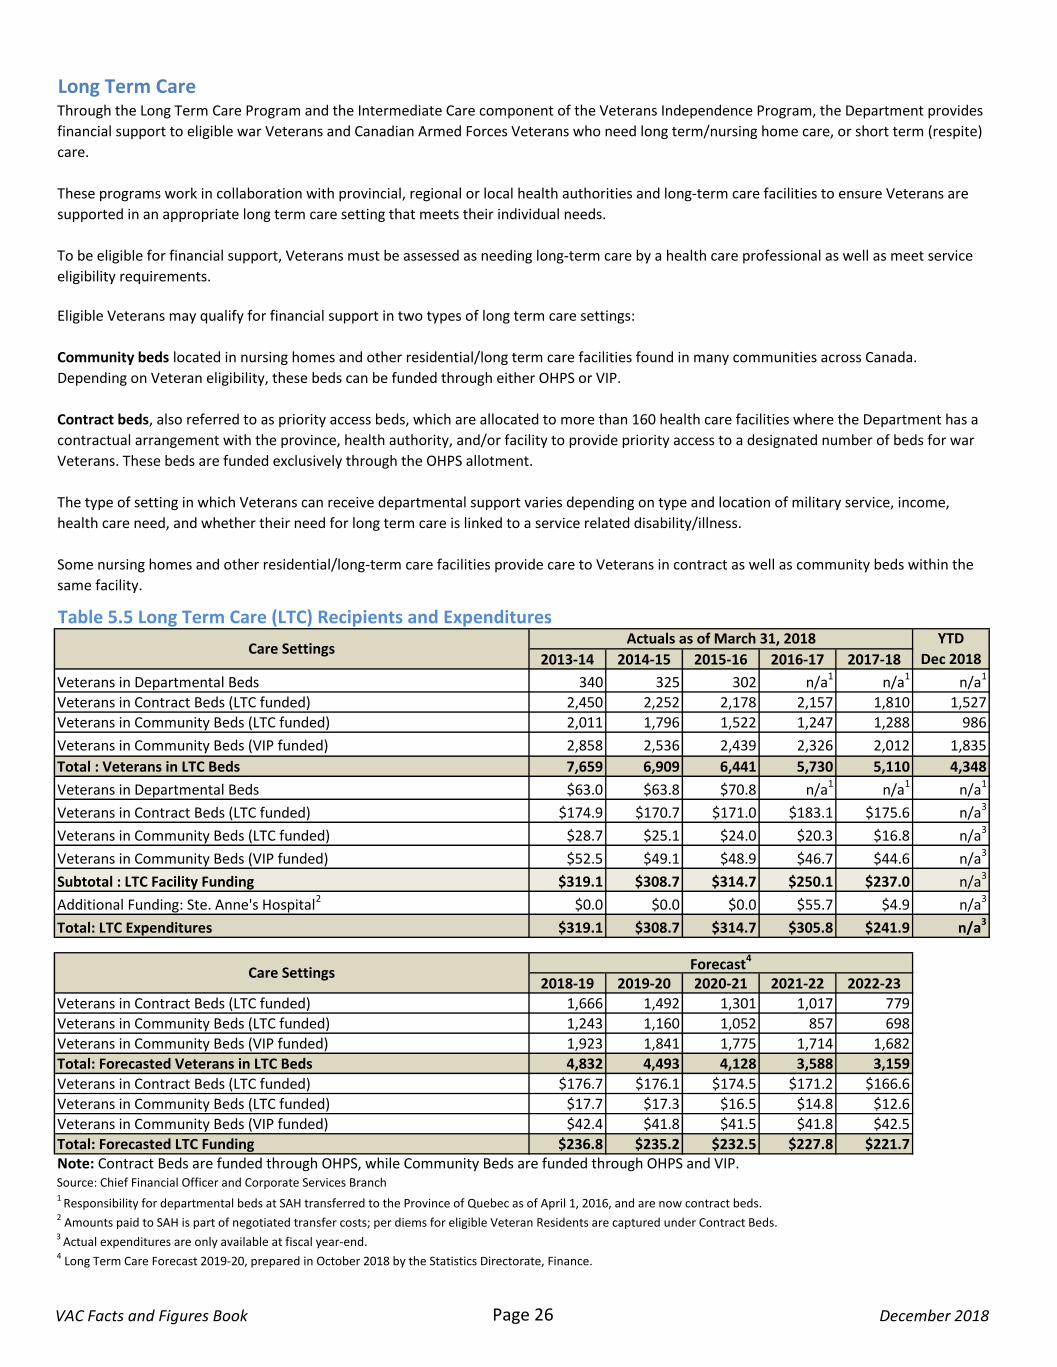
Eligible Veterans may qualify for financial support in two types of long term care settings:
Community beds located in nursing homes and other residential/long term care facilities found in many communities across Canada.
Depending on Veteran eligibility, these beds can be funded through either OHPS or VIP.
Contract beds, also referred to as priority access beds, which are allocated to more than 160 health care facilities where the Department has a
contractual arrangement with the province, health authority, and/or facility to provide priority access to a designated number of beds for war
Veterans. These beds are funded exclusively through the OHPS allotment.
The type of setting in which Veterans can receive departmental support varies depending on type and location of military service, income,
health care need, and whether their need for long term care is linked to a service related disability/illness.
Some nursing homes and other residential/long-term care facilities provide care to Veterans in contract as well as community beds within the
same facility.
Long Term Care
Table 5.5 Long Term Care (LTC) Recipients and Expenditures
Care SettingsActuals as of March 31, 2018 YTD
Dec 2018
Through the Long Term Care Program and the Intermediate Care component of the Veterans Independence Program, the Department provides
financial support to eligible war Veterans and Canadian Armed Forces Veterans who need long term/nursing home care, or short term (respite)
care.
These programs work in collaboration with provincial, regional or local health authorities and long-term care facilities to ensure Veterans are
supported in an appropriate long term care setting that meets their individual needs.
To be eligible for financial support, Veterans must be assessed as needing long-term care by a health care professional as well as meet service
eligibility requirements.
Care SettingsForecast4
2 Amounts paid to SAH is part of negotiated transfer costs; per diems for eligible Veteran Residents are captured under Contract Beds.
3 Actual expenditures are only available at fiscal year-end.4 Long Term Care Forecast 2019-20, prepared in October 2018 by the Statistics Directorate, Finance.
1 Responsibility for departmental beds at SAH transferred to the Province of Quebec as of April 1, 2016, and are now contract beds.
Note: Contract Beds are funded through OHPS, while Community Beds are funded through OHPS and VIP.
VAC Facts and Figures Book Page 26 December 2018
2013-14 2014-15 2015-16 2016-17 2017-18
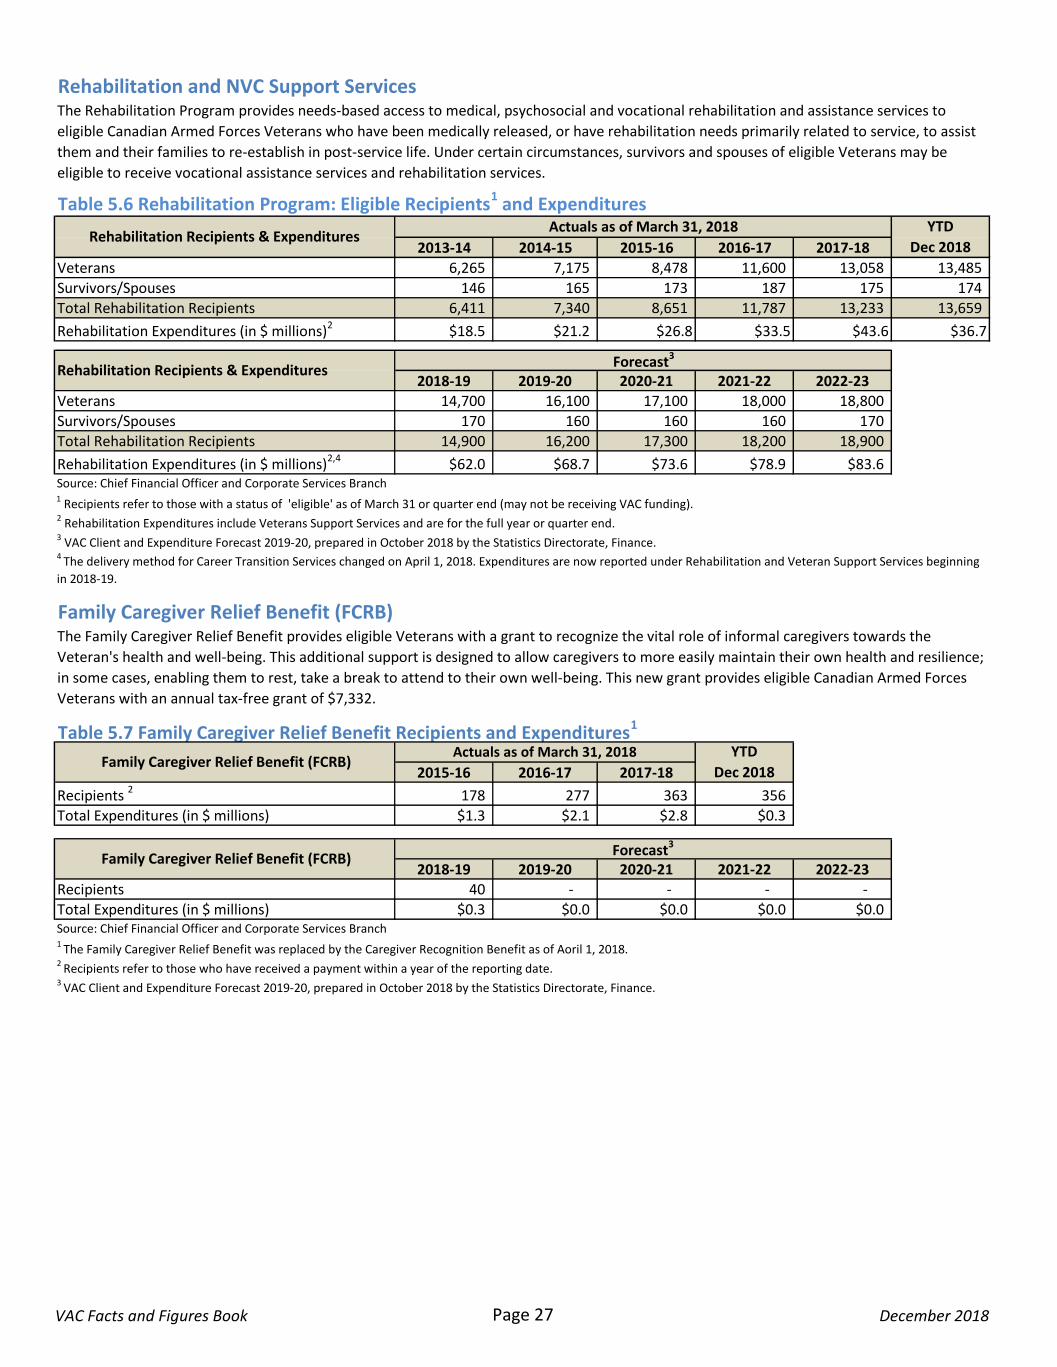
Veterans 6,265 7,175 8,478 11,600 13,058 13,485
Survivors/Spouses 146 165 173 187 175 174
Total Rehabilitation Recipients 6,411 7,340 8,651 11,787 13,233 13,659
Rehabilitation Expenditures (in $ millions)2 $18.5 $21.2 $26.8 $33.5 $43.6 $36.7
2018-19 2019-20 2020-21 2021-22 2022-23Veterans 14,700 16,100 17,100 18,000 18,800
Survivors/Spouses 170 160 160 160 170
Total Rehabilitation Recipients 14,900 16,200 17,300 18,200 18,900
Rehabilitation Expenditures (in $ millions)2,4 $62.0 $68.7 $73.6 $78.9 $83.6
2015-16 2016-17 2017-18
Recipients 2 178 277 363 356
Total Expenditures (in $ millions) $1.3 $2.1 $2.8 $0.3
2018-19 2019-20 2020-21 2021-22 2022-23Recipients 40 - - - -
Total Expenditures (in $ millions) $0.3 $0.0 $0.0 $0.0 $0.0
Source: Chief Financial Officer and Corporate Services Branch
Family Caregiver Relief Benefit (FCRB)Actuals as of March 31, 2018 YTD
Dec 2018
1 Recipients refer to those with a status of 'eligible' as of March 31 or quarter end (may not be receiving VAC funding).
2 Rehabilitation Expenditures include Veterans Support Services and are for the full year or quarter end.
3 VAC Client and Expenditure Forecast 2019-20, prepared in October 2018 by the Statistics Directorate, Finance.
4 The delivery method for Career Transition Services changed on April 1, 2018. Expenditures are now reported under Rehabilitation and Veteran Support Services beginning
in 2018-19.
The Family Caregiver Relief Benefit provides eligible Veterans with a grant to recognize the vital role of informal caregivers towards the
Veteran's health and well-being. This additional support is designed to allow caregivers to more easily maintain their own health and resilience;
in some cases, enabling them to rest, take a break to attend to their own well-being. This new grant provides eligible Canadian Armed Forces
Veterans with an annual tax-free grant of $7,332.
Family Caregiver Relief Benefit (FCRB)
Table 5.7 Family Caregiver Relief Benefit Recipients and Expenditures1
Rehabilitation and NVC Support Services
Table 5.6 Rehabilitation Program: Eligible Recipients1 and ExpendituresActuals as of March 31, 2018
Forecast3
Rehabilitation Recipients & Expenditures
The Rehabilitation Program provides needs-based access to medical, psychosocial and vocational rehabilitation and assistance services to
eligible Canadian Armed Forces Veterans who have been medically released, or have rehabilitation needs primarily related to service, to assist
them and their families to re-establish in post-service life. Under certain circumstances, survivors and spouses of eligible Veterans may be
eligible to receive vocational assistance services and rehabilitation services.
YTD
Dec 2018
Rehabilitation Recipients & Expenditures
Family Caregiver Relief Benefit (FCRB)Forecast3
3 VAC Client and Expenditure Forecast 2019-20, prepared in October 2018 by the Statistics Directorate, Finance.
Source: Chief Financial Officer and Corporate Services Branch
2 Recipients refer to those who have received a payment within a year of the reporting date.
1 The Family Caregiver Relief Benefit was replaced by the Caregiver Recognition Benefit as of Aoril 1, 2018.
VAC Facts and Figures Book Page 27 December 2018
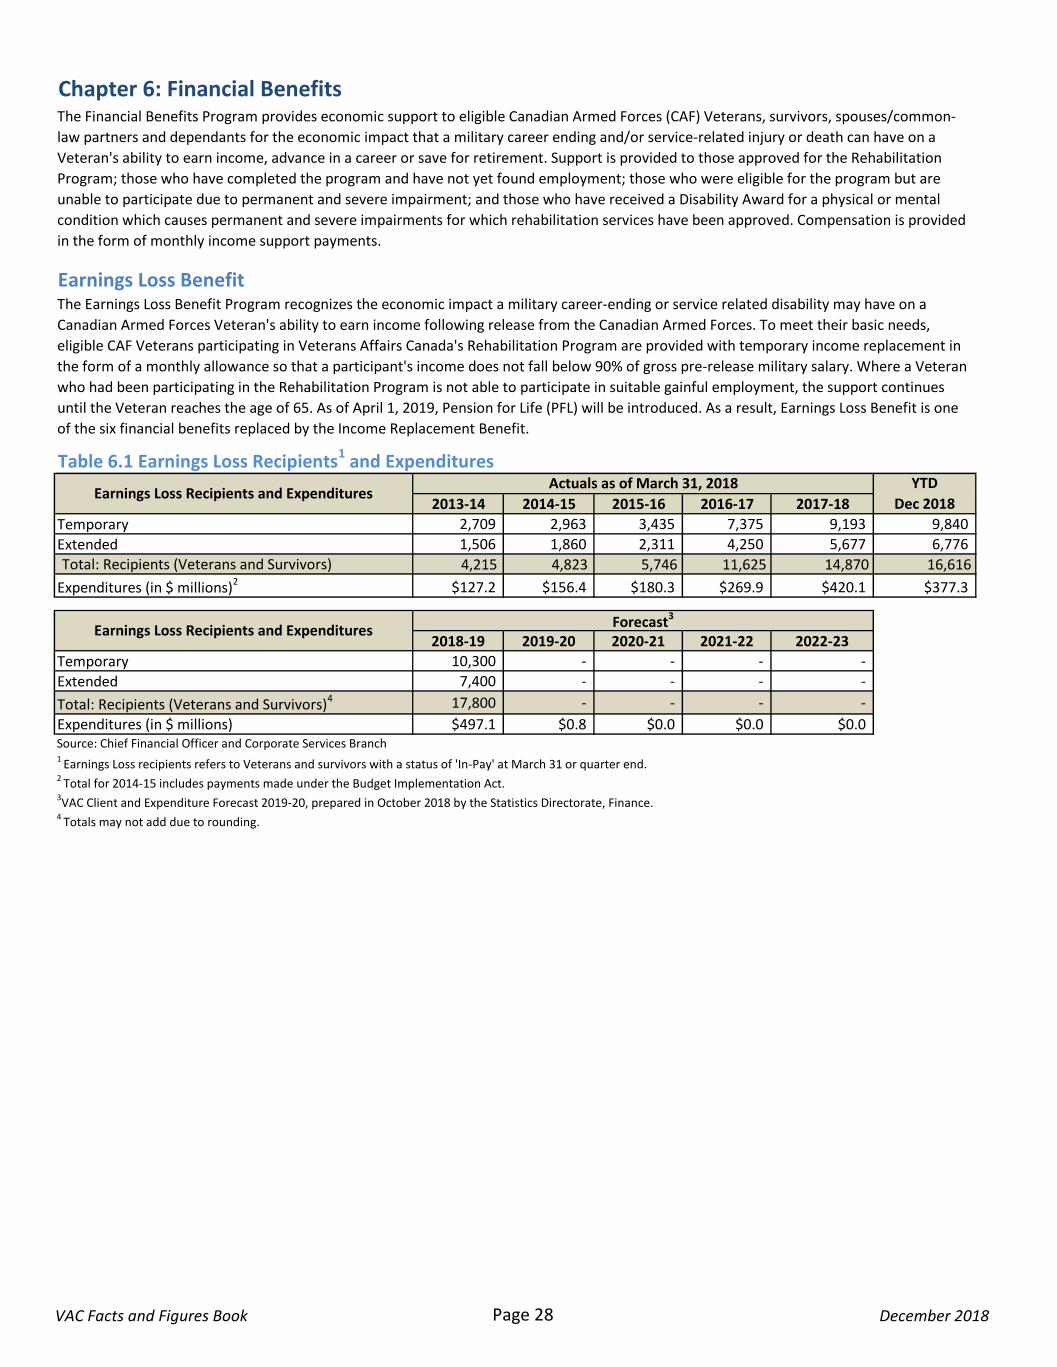
2013-14 2014-15 2015-16 2016-17 2017-18
Temporary 2,709 2,963 3,435 7,375 9,193 9,840
Extended 1,506 1,860 2,311 4,250 5,677 6,776
Total: Recipients (Veterans and Survivors) 4,215 4,823 5,746 11,625 14,870 16,616
Expenditures (in $ millions)2 $127.2 $156.4 $180.3 $269.9 $420.1 $377.3
2018-19 2019-20 2020-21 2021-22 2022-23
Temporary 10,300 - - - -
Extended 7,400 - - - -
Total: Recipients (Veterans and Survivors)4 17,800 - - - -
Expenditures (in $ millions) $497.1 $0.8 $0.0 $0.0 $0.0
YTD
Dec 2018
The Financial Benefits Program provides economic support to eligible Canadian Armed Forces (CAF) Veterans, survivors, spouses/common-
law partners and dependants for the economic impact that a military career ending and/or service-related injury or death can have on a
Veteran's ability to earn income, advance in a career or save for retirement. Support is provided to those approved for the Rehabilitation
Program; those who have completed the program and have not yet found employment; those who were eligible for the program but are
unable to participate due to permanent and severe impairment; and those who have received a Disability Award for a physical or mental
condition which causes permanent and severe impairments for which rehabilitation services have been approved. Compensation is provided
in the form of monthly income support payments.
The Earnings Loss Benefit Program recognizes the economic impact a military career-ending or service related disability may have on a
Canadian Armed Forces Veteran's ability to earn income following release from the Canadian Armed Forces. To meet their basic needs,
eligible CAF Veterans participating in Veterans Affairs Canada's Rehabilitation Program are provided with temporary income replacement in
the form of a monthly allowance so that a participant's income does not fall below 90% of gross pre-release military salary. Where a Veteran
who had been participating in the Rehabilitation Program is not able to participate in suitable gainful employment, the support continues
until the Veteran reaches the age of 65. As of April 1, 2019, Pension for Life (PFL) will be introduced. As a result, Earnings Loss Benefit is one
of the six financial benefits replaced by the Income Replacement Benefit.
Earnings Loss Recipients and ExpendituresForecast3
Chapter 6: Financial Benefits
Earnings Loss Benefit
Table 6.1 Earnings Loss Recipients1 and Expenditures
Earnings Loss Recipients and ExpendituresActuals as of March 31, 2018
Source: Chief Financial Officer and Corporate Services Branch 1
Earnings Loss recipients refers to Veterans and survivors with a status of 'In-Pay' at March 31 or quarter end.2
Total for 2014-15 includes payments made under the Budget Implementation Act.3VAC Client and Expenditure Forecast 2019-20, prepared in October 2018 by the Statistics Directorate, Finance.4
Totals may not add due to rounding.
VAC Facts and Figures Book Page 28 December 2018
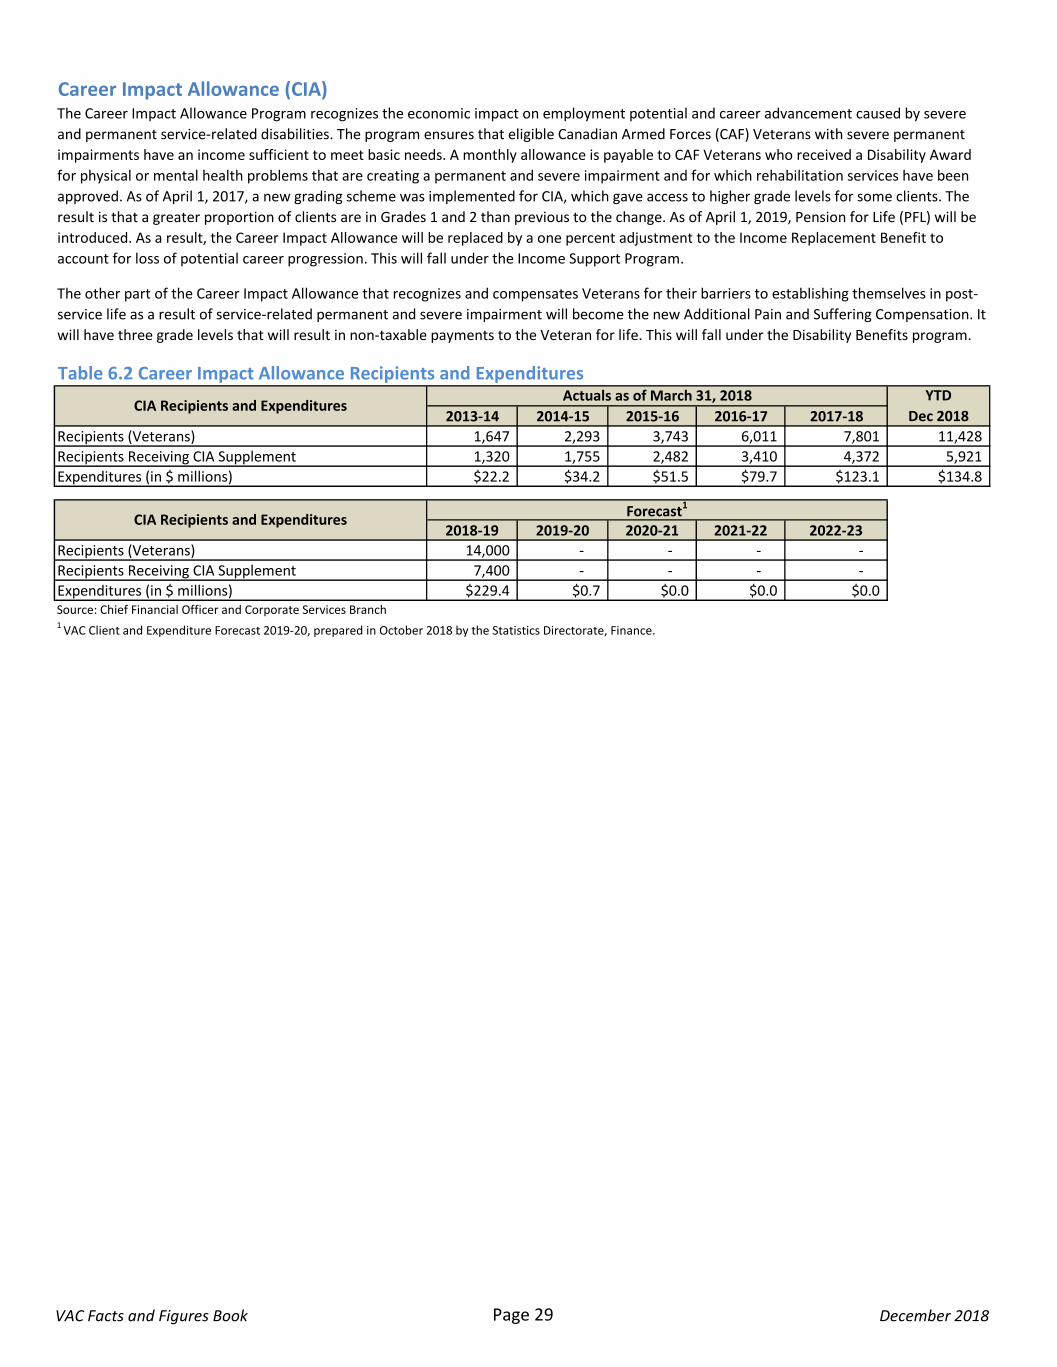
2013-14 2014-15 2015-16 2016-17 2017-18
Recipients (Veterans) 1,647 2,293 3,743 6,011 7,801 11,428
Recipients Receiving CIA Supplement 1,320 1,755 2,482 3,410 4,372 5,921
Expenditures (in $ millions) $22.2 $34.2 $51.5 $79.7 $123.1 $134.8
2018-19 2019-20 2020-21 2021-22 2022-23Recipients (Veterans) 14,000 - - - -
Recipients Receiving CIA Supplement 7,400 - - - -
Expenditures (in $ millions) $229.4 $0.7 $0.0 $0.0 $0.0
Career Impact Allowance (CIA)
CIA Recipients and ExpendituresForecast1
The Career Impact Allowance Program recognizes the economic impact on employment potential and career advancement caused by severe
and permanent service-related disabilities. The program ensures that eligible Canadian Armed Forces (CAF) Veterans with severe permanent
impairments have an income sufficient to meet basic needs. A monthly allowance is payable to CAF Veterans who received a Disability Award
for physical or mental health problems that are creating a permanent and severe impairment and for which rehabilitation services have been
approved. As of April 1, 2017, a new grading scheme was implemented for CIA, which gave access to higher grade levels for some clients. The
result is that a greater proportion of clients are in Grades 1 and 2 than previous to the change. As of April 1, 2019, Pension for Life (PFL) will be
introduced. As a result, the Career Impact Allowance will be replaced by a one percent adjustment to the Income Replacement Benefit to
account for loss of potential career progression. This will fall under the Income Support Program.
The other part of the Career Impact Allowance that recognizes and compensates Veterans for their barriers to establishing themselves in post-
service life as a result of service-related permanent and severe impairment will become the new Additional Pain and Suffering Compensation. It
will have three grade levels that will result in non-taxable payments to the Veteran for life. This will fall under the Disability Benefits program.
Table 6.2 Career Impact Allowance Recipients and Expenditures
CIA Recipients and ExpendituresActuals as of March 31, 2018 YTD
Dec 2018
Source: Chief Financial Officer and Corporate Services Branch 1 VAC Client and Expenditure Forecast 2019-20, prepared in October 2018 by the Statistics Directorate, Finance.
VAC Facts and Figures Book Page 29 December 2018
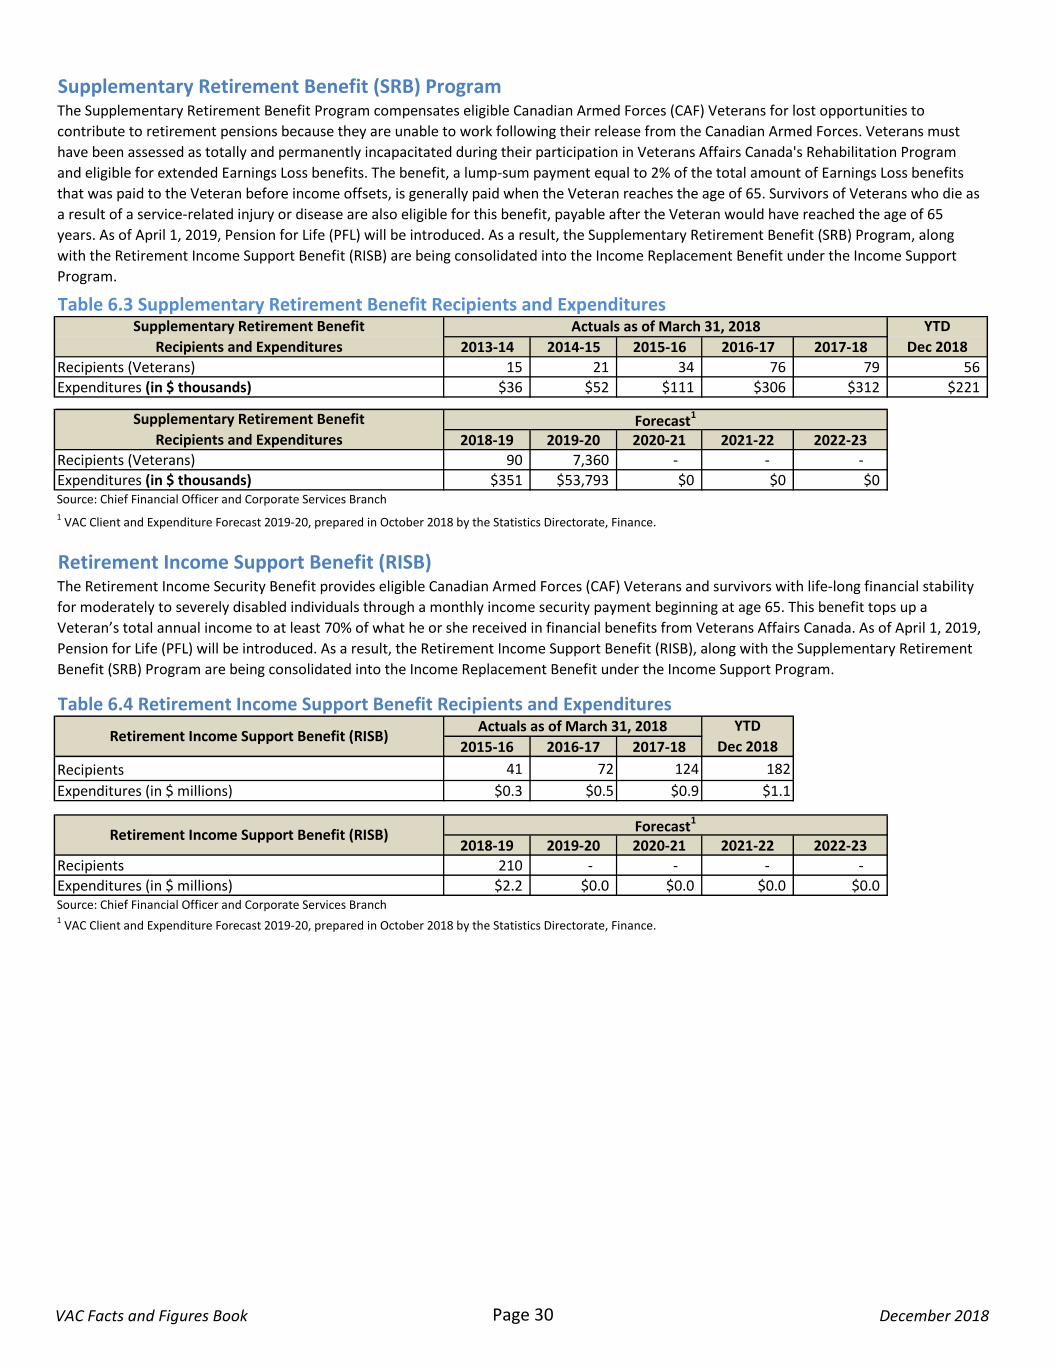
2013-14 2014-15 2015-16 2016-17 2017-18
Recipients (Veterans) 15 21 34 76 79 56
Expenditures (in $ thousands) $36 $52 $111 $306 $312 $221
2018-19 2019-20 2020-21 2021-22 2022-23Recipients (Veterans) 90 7,360 - - -
Expenditures (in $ thousands) $351 $53,793 $0 $0 $0
2015-16 2016-17 2017-18
Recipients 41 72 124 182
Expenditures (in $ millions) $0.3 $0.5 $0.9 $1.1
2018-19 2019-20 2020-21 2021-22 2022-23Recipients 210 - - - -
Expenditures (in $ millions) $2.2 $0.0 $0.0 $0.0 $0.0
YTD
Dec 2018
The Supplementary Retirement Benefit Program compensates eligible Canadian Armed Forces (CAF) Veterans for lost opportunities to
contribute to retirement pensions because they are unable to work following their release from the Canadian Armed Forces. Veterans must
have been assessed as totally and permanently incapacitated during their participation in Veterans Affairs Canada's Rehabilitation Program
and eligible for extended Earnings Loss benefits. The benefit, a lump-sum payment equal to 2% of the total amount of Earnings Loss benefits
that was paid to the Veteran before income offsets, is generally paid when the Veteran reaches the age of 65. Survivors of Veterans who die as
a result of a service-related injury or disease are also eligible for this benefit, payable after the Veteran would have reached the age of 65
years. As of April 1, 2019, Pension for Life (PFL) will be introduced. As a result, the Supplementary Retirement Benefit (SRB) Program, along
with the Retirement Income Support Benefit (RISB) are being consolidated into the Income Replacement Benefit under the Income Support
Program.
The Retirement Income Security Benefit provides eligible Canadian Armed Forces (CAF) Veterans and survivors with life-long financial stability
for moderately to severely disabled individuals through a monthly income security payment beginning at age 65. This benefit tops up a
Veteran’s total annual income to at least 70% of what he or she received in financial benefits from Veterans Affairs Canada. As of April 1, 2019,
Pension for Life (PFL) will be introduced. As a result, the Retirement Income Support Benefit (RISB), along with the Supplementary Retirement
Benefit (SRB) Program are being consolidated into the Income Replacement Benefit under the Income Support Program.
Retirement Income Support Benefit (RISB)
Supplementary Retirement Benefit
Recipients and ExpendituresForecast1
Retirement Income Support Benefit (RISB)
1 VAC Client and Expenditure Forecast 2019-20, prepared in October 2018 by the Statistics Directorate, Finance.
Source: Chief Financial Officer and Corporate Services Branch
Forecast1
Retirement Income Support Benefit (RISB)
Table 6.4 Retirement Income Support Benefit Recipients and ExpendituresActuals as of March 31, 2018 YTD
Dec 2018
1 VAC Client and Expenditure Forecast 2019-20, prepared in October 2018 by the Statistics Directorate, Finance.
Source: Chief Financial Officer and Corporate Services Branch
Supplementary Retirement Benefit (SRB) Program
Table 6.3 Supplementary Retirement Benefit Recipients and ExpendituresSupplementary Retirement Benefit
Recipients and Expenditures
Actuals as of March 31, 2018
VAC Facts and Figures Book Page 30 December 2018
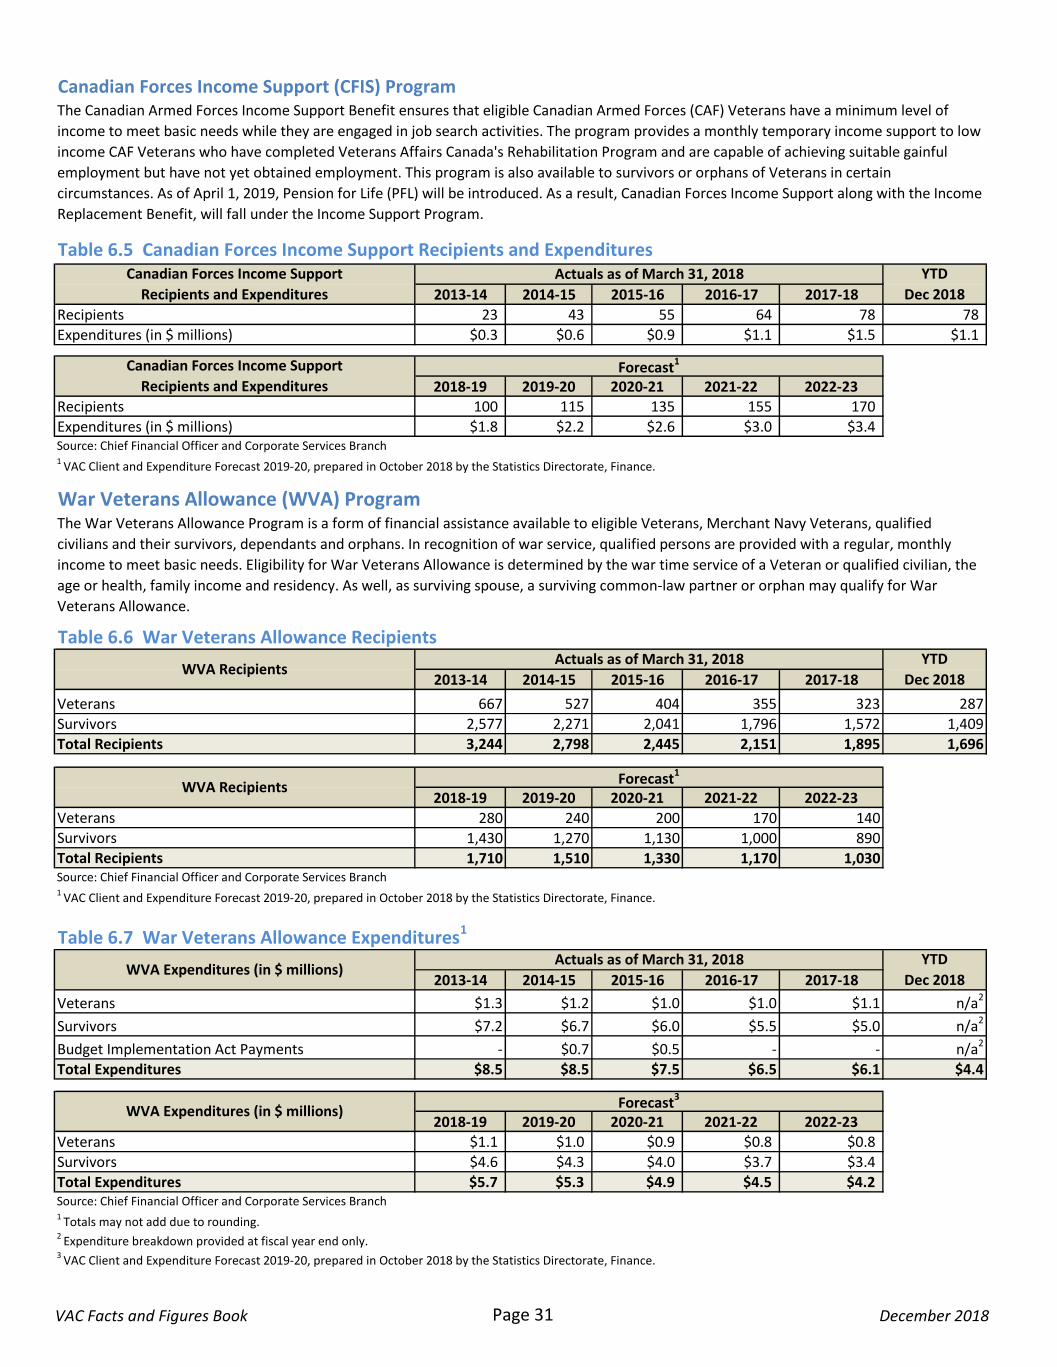
2013-14 2014-15 2015-16 2016-17 2017-18
Recipients 23 43 55 64 78 78
Expenditures (in $ millions) $0.3 $0.6 $0.9 $1.1 $1.5 $1.1
2018-19 2019-20 2020-21 2021-22 2022-23Recipients 100 115 135 155 170
Expenditures (in $ millions) $1.8 $2.2 $2.6 $3.0 $3.4
2013-14 2014-15 2015-16 2016-17 2017-18
Veterans 667 527 404 355 323 287
Survivors 2,577 2,271 2,041 1,796 1,572 1,409
Total Recipients 3,244 2,798 2,445 2,151 1,895 1,696
2018-19 2019-20 2020-21 2021-22 2022-23Veterans 280 240 200 170 140Survivors 1,430 1,270 1,130 1,000 890Total Recipients 1,710 1,510 1,330 1,170 1,030
2013-14 2014-15 2015-16 2016-17 2017-18
Veterans $1.3 $1.2 $1.0 $1.0 $1.1 n/a2
Survivors $7.2 $6.7 $6.0 $5.5 $5.0 n/a2
Budget Implementation Act Payments - $0.7 $0.5 - - n/a2
Total Expenditures $8.5 $8.5 $7.5 $6.5 $6.1 $4.4
2018-19 2019-20 2020-21 2021-22 2022-23Veterans $1.1 $1.0 $0.9 $0.8 $0.8
Survivors $4.6 $4.3 $4.0 $3.7 $3.4
Total Expenditures $5.7 $5.3 $4.9 $4.5 $4.2
3 VAC Client and Expenditure Forecast 2019-20, prepared in October 2018 by the Statistics Directorate, Finance.
2 Expenditure breakdown provided at fiscal year end only.
1 Totals may not add due to rounding.
Source: Chief Financial Officer and Corporate Services Branch
The Canadian Armed Forces Income Support Benefit ensures that eligible Canadian Armed Forces (CAF) Veterans have a minimum level of
income to meet basic needs while they are engaged in job search activities. The program provides a monthly temporary income support to low
income CAF Veterans who have completed Veterans Affairs Canada's Rehabilitation Program and are capable of achieving suitable gainful
employment but have not yet obtained employment. This program is also available to survivors or orphans of Veterans in certain
circumstances. As of April 1, 2019, Pension for Life (PFL) will be introduced. As a result, Canadian Forces Income Support along with the Income
Replacement Benefit, will fall under the Income Support Program.
The War Veterans Allowance Program is a form of financial assistance available to eligible Veterans, Merchant Navy Veterans, qualified
civilians and their survivors, dependants and orphans. In recognition of war service, qualified persons are provided with a regular, monthly
income to meet basic needs. Eligibility for War Veterans Allowance is determined by the war time service of a Veteran or qualified civilian, the
age or health, family income and residency. As well, as surviving spouse, a surviving common-law partner or orphan may qualify for War
Veterans Allowance.
YTD
Dec 2018
YTD
Dec 2018
YTD
Dec 2018
Forecast1
1 VAC Client and Expenditure Forecast 2019-20, prepared in October 2018 by the Statistics Directorate, Finance.
Source: Chief Financial Officer and Corporate Services Branch
1 VAC Client and Expenditure Forecast 2019-20, prepared in October 2018 by the Statistics Directorate, Finance.
Source: Chief Financial Officer and Corporate Services Branch
WVA Expenditures (in $ millions)Forecast3
Table 6.7 War Veterans Allowance Expenditures1
WVA Expenditures (in $ millions)Actuals as of March 31, 2018
Canadian Forces Income Support (CFIS) Program
Table 6.5 Canadian Forces Income Support Recipients and ExpendituresCanadian Forces Income Support
Recipients and Expenditures
Actuals as of March 31, 2018
Canadian Forces Income Support
Recipients and ExpendituresForecast1
War Veterans Allowance (WVA) Program
Table 6.6 War Veterans Allowance Recipients
WVA RecipientsActuals as of March 31, 2018
WVA Recipients
VAC Facts and Figures Book Page 31 December 2018
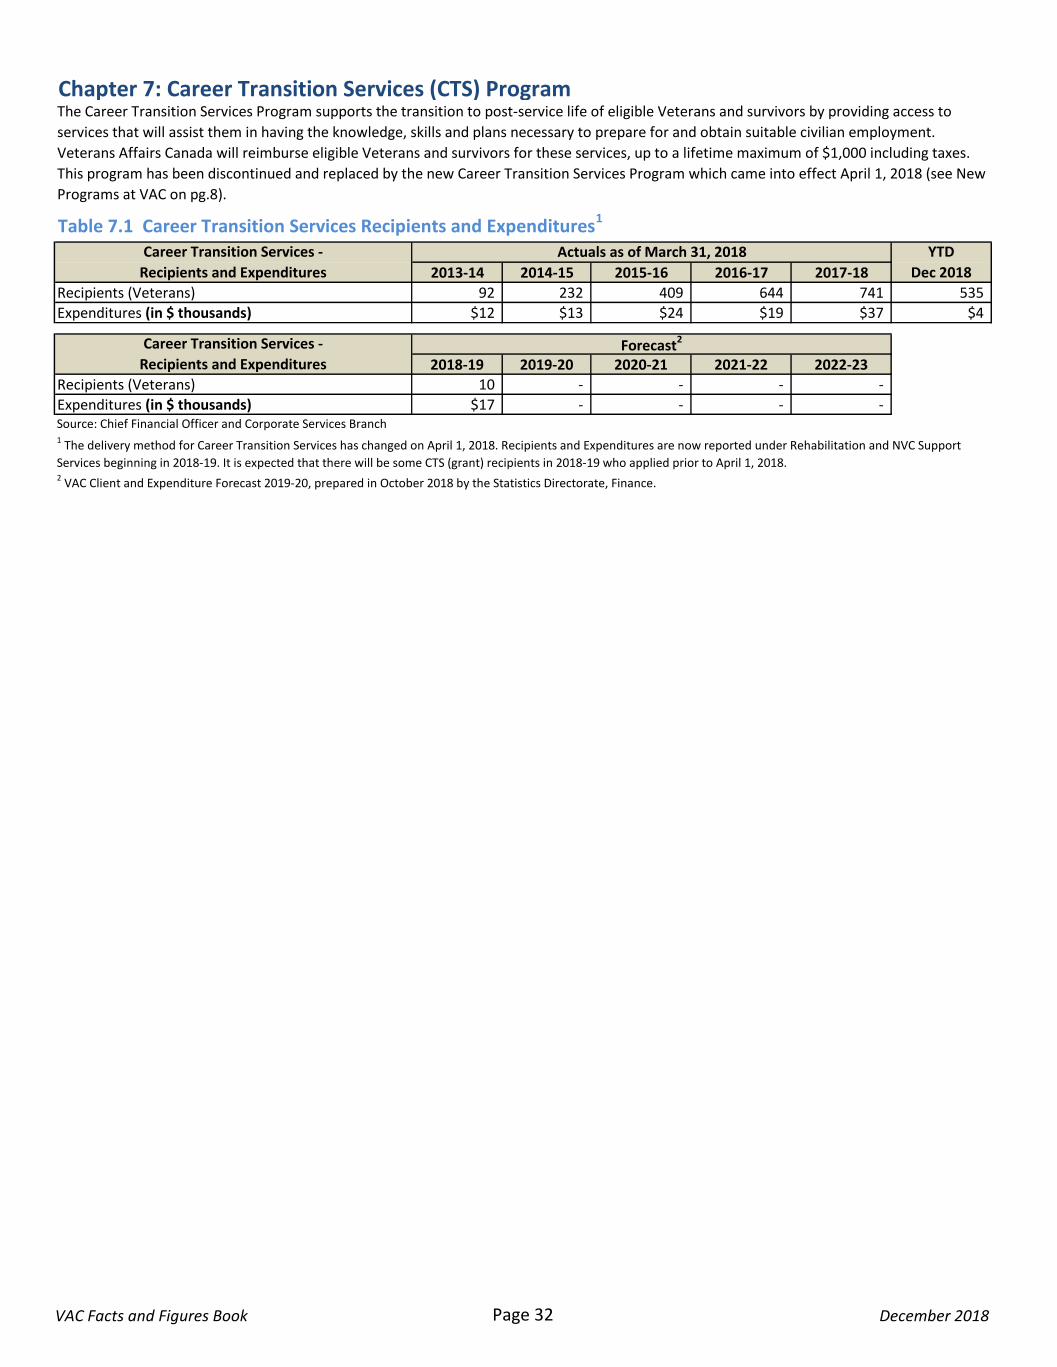
2013-14 2014-15 2015-16 2016-17 2017-18
Recipients (Veterans) 92 232 409 644 741 535
Expenditures (in $ thousands) $12 $13 $24 $19 $37 $4
2018-19 2019-20 2020-21 2021-22 2022-23Recipients (Veterans) 10 - - - -
Expenditures (in $ thousands) $17 - - - -
Chapter 7: Career Transition Services (CTS) Program
Table 7.1 Career Transition Services Recipients and Expenditures1
Career Transition Services -
Recipients and Expenditures
Actuals as of March 31, 2018
1 The delivery method for Career Transition Services has changed on April 1, 2018. Recipients and Expenditures are now reported under Rehabilitation and NVC Support
Services beginning in 2018-19. It is expected that there will be some CTS (grant) recipients in 2018-19 who applied prior to April 1, 2018.
YTD
Dec 2018
The Career Transition Services Program supports the transition to post-service life of eligible Veterans and survivors by providing access to
services that will assist them in having the knowledge, skills and plans necessary to prepare for and obtain suitable civilian employment.
Veterans Affairs Canada will reimburse eligible Veterans and survivors for these services, up to a lifetime maximum of $1,000 including taxes.
This program has been discontinued and replaced by the new Career Transition Services Program which came into effect April 1, 2018 (see New
Programs at VAC on pg.8).
Career Transition Services -
Recipients and ExpendituresForecast2
2 VAC Client and Expenditure Forecast 2019-20, prepared in October 2018 by the Statistics Directorate, Finance.
Source: Chief Financial Officer and Corporate Services Branch
VAC Facts and Figures Book Page 32 December 2018
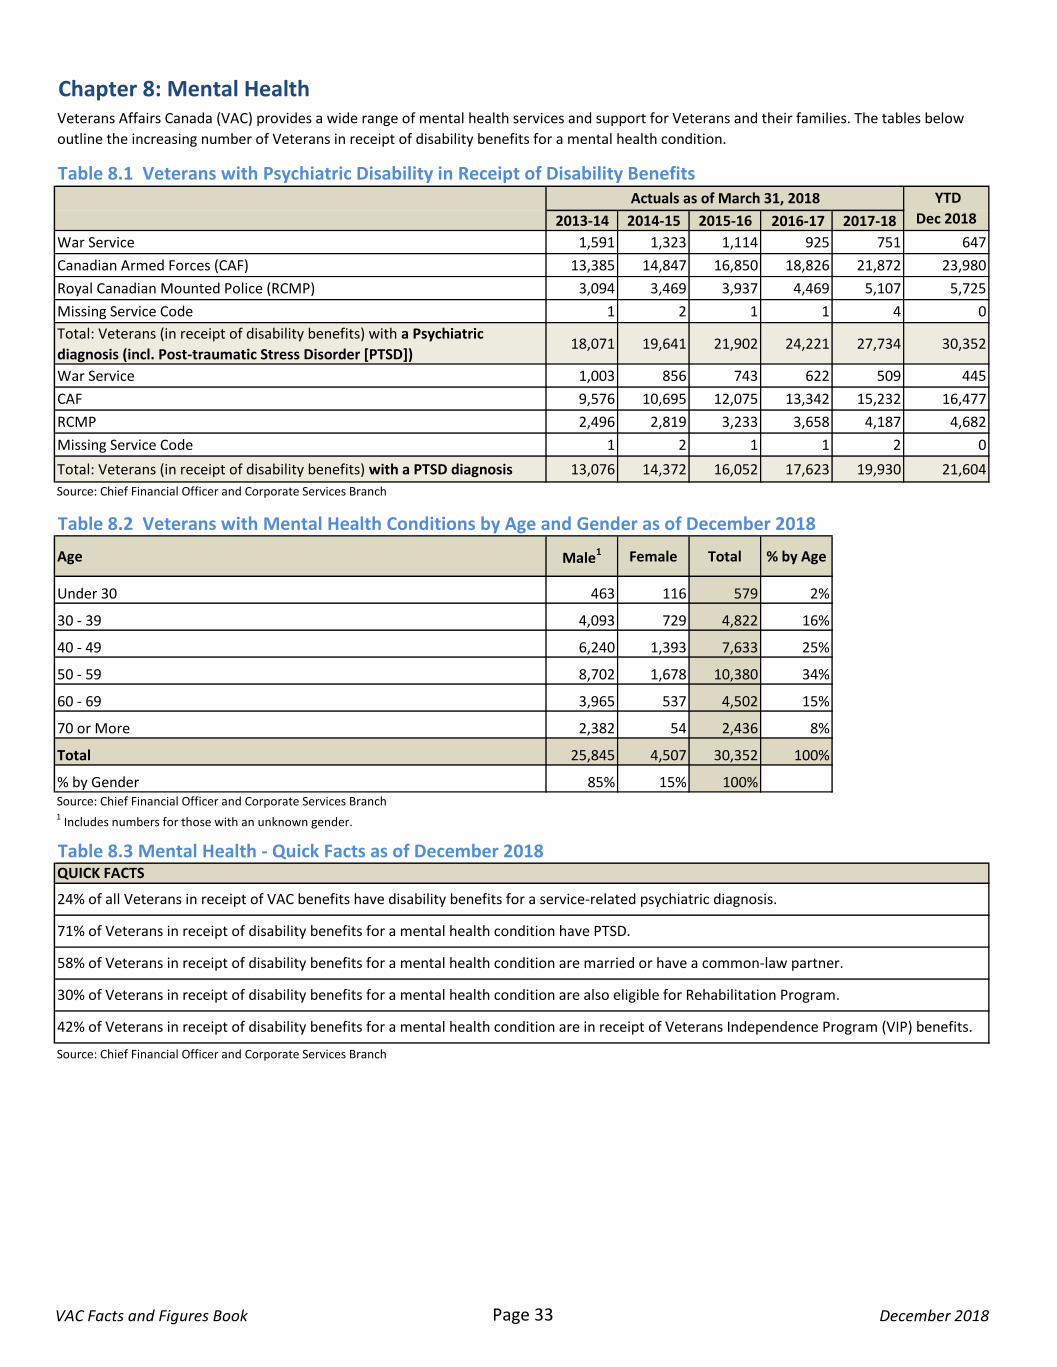
2013-14 2014-15 2015-16 2016-17 2017-18
War Service 1,591 1,323 1,114 925 751 647
Canadian Armed Forces (CAF) 13,385 14,847 16,850 18,826 21,872 23,980
Royal Canadian Mounted Police (RCMP) 3,094 3,469 3,937 4,469 5,107 5,725
Missing Service Code 1 2 1 1 4 0
Total: Veterans (in receipt of disability benefits) with a Psychiatric
diagnosis (incl. Post-traumatic Stress Disorder [PTSD])18,071 19,641 21,902 24,221 27,734 30,352
War Service 1,003 856 743 622 509 445
CAF 9,576 10,695 12,075 13,342 15,232 16,477
RCMP 2,496 2,819 3,233 3,658 4,187 4,682
Missing Service Code 1 2 1 1 2 0
Total: Veterans (in receipt of disability benefits) with a PTSD diagnosis 13,076 14,372 16,052 17,623 19,930 21,604
Age Male1 Female Total % by Age
Under 30 463 116 579 2%
30 - 39 4,093 729 4,822 16%
40 - 49 6,240 1,393 7,633 25%
50 - 59 8,702 1,678 10,380 34%
60 - 69 3,965 537 4,502 15%
70 or More 2,382 54 2,436 8%
Total 25,845 4,507 30,352 100%
% by Gender 85% 15% 100%
Source: Chief Financial Officer and Corporate Services Branch
42% of Veterans in receipt of disability benefits for a mental health condition are in receipt of Veterans Independence Program (VIP) benefits.
30% of Veterans in receipt of disability benefits for a mental health condition are also eligible for Rehabilitation Program.
58% of Veterans in receipt of disability benefits for a mental health condition are married or have a common-law partner.
71% of Veterans in receipt of disability benefits for a mental health condition have PTSD.
24% of all Veterans in receipt of VAC benefits have disability benefits for a service-related psychiatric diagnosis.
Veterans Affairs Canada (VAC) provides a wide range of mental health services and support for Veterans and their families. The tables below
outline the increasing number of Veterans in receipt of disability benefits for a mental health condition.
Chapter 8: Mental Health
QUICK FACTS
Table 8.2 Veterans with Mental Health Conditions by Age and Gender as of December 2018
Table 8.3 Mental Health - Quick Facts as of December 2018
1 Includes numbers for those with an unknown gender.
Source: Chief Financial Officer and Corporate Services Branch
Source: Chief Financial Officer and Corporate Services Branch
Table 8.1 Veterans with Psychiatric Disability in Receipt of Disability Benefits Actuals as of March 31, 2018 YTD
Dec 2018
VAC Facts and Figures Book Page 33 December 2018
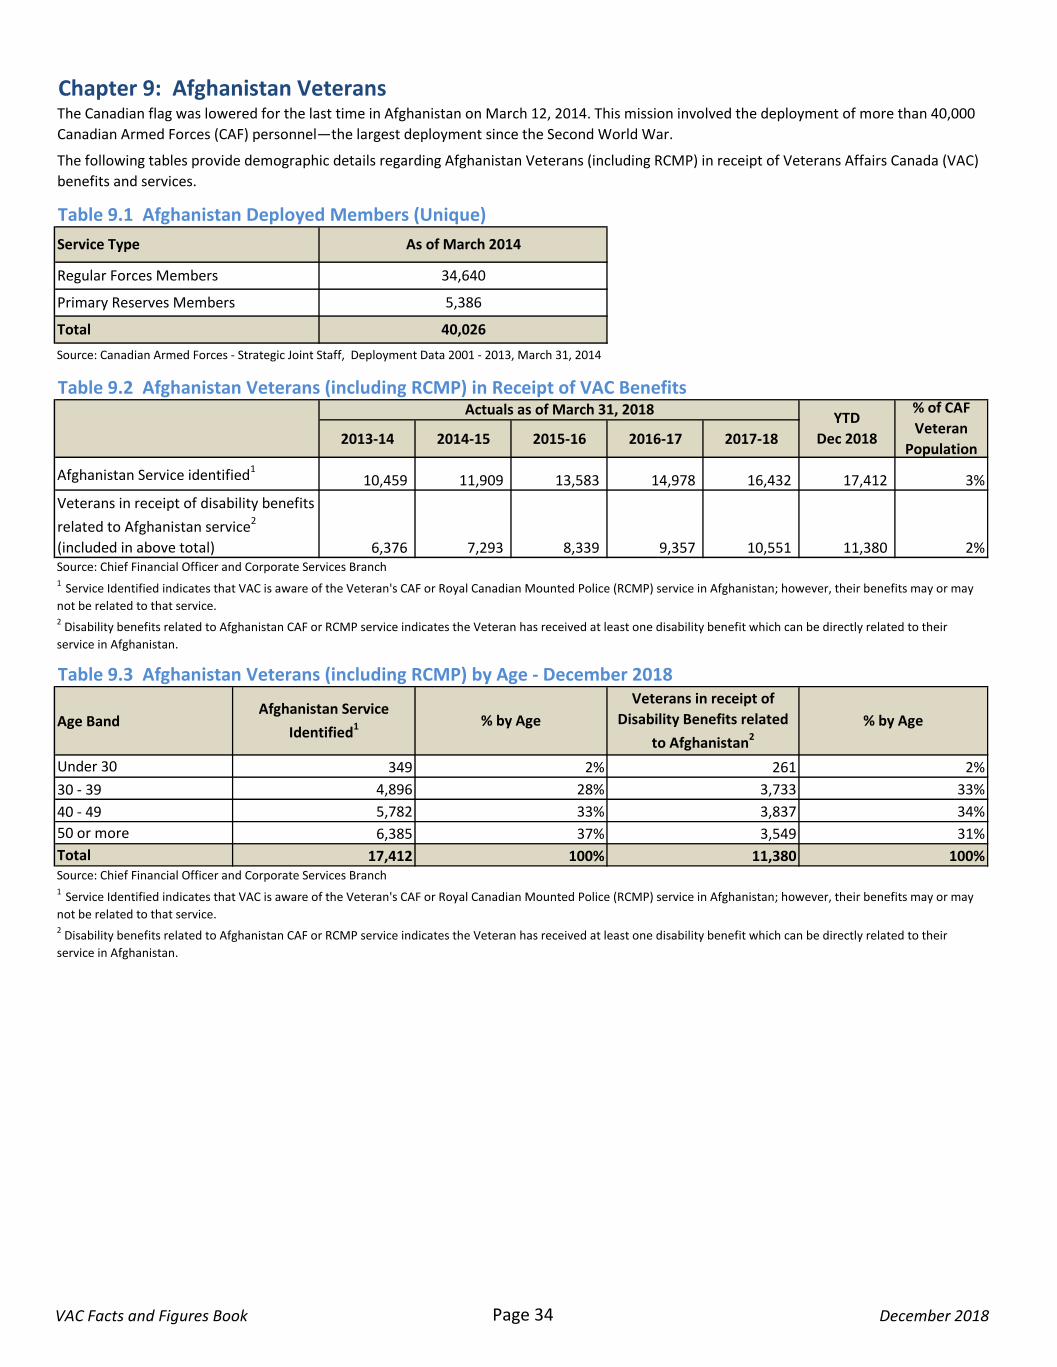
2013-14 2014-15 2015-16 2016-17 2017-18
10,459 11,909 13,583 14,978 16,432 17,412 3%
6,376 7,293 8,339 9,357 10,551 11,380 2%
Age Band
Under 30
30 - 39
40 - 49
50 or more
TotalSource: Chief Financial Officer and Corporate Services Branch
5,782 33% 3,837
6,385 37% 3,549
17,412 100% 11,380
1 Service Identified indicates that VAC is aware of the Veteran's CAF or Royal Canadian Mounted Police (RCMP) service in Afghanistan; however, their benefits may or may
not be related to that service. 2 Disability benefits related to Afghanistan CAF or RCMP service indicates the Veteran has received at least one disability benefit which can be directly related to their
service in Afghanistan.
100%
4,896 28%
34%
1 Service Identified indicates that VAC is aware of the Veteran's CAF or Royal Canadian Mounted Police (RCMP) service in Afghanistan; however, their benefits may or may
not be related to that service. 2 Disability benefits related to Afghanistan CAF or RCMP service indicates the Veteran has received at least one disability benefit which can be directly related to their
service in Afghanistan.
Source: Chief Financial Officer and Corporate Services Branch
Primary Reserves Members 5,386
31%
Afghanistan Service identified1
YTD
Dec 2018
33%
2%
Veterans in receipt of disability benefits
related to Afghanistan service2
(included in above total)
Afghanistan Service
Identified1 % by Age
Veterans in receipt of
Disability Benefits related
to Afghanistan2
% by Age
Table 9.3 Afghanistan Veterans (including RCMP) by Age - December 2018
349 2% 261
Total 40,026
3,733
Chapter 9: Afghanistan Veterans
Table 9.1 Afghanistan Deployed Members (Unique)
The Canadian flag was lowered for the last time in Afghanistan on March 12, 2014. This mission involved the deployment of more than 40,000
Canadian Armed Forces (CAF) personnel—the largest deployment since the Second World War.
The following tables provide demographic details regarding Afghanistan Veterans (including RCMP) in receipt of Veterans Affairs Canada (VAC)
benefits and services.
Service Type As of March 2014
Regular Forces Members 34,640
Source: Canadian Armed Forces - Strategic Joint Staff, Deployment Data 2001 - 2013, March 31, 2014
Actuals as of March 31, 2018
Table 9.2 Afghanistan Veterans (including RCMP) in Receipt of VAC Benefits% of CAF
Veteran
Population
VAC Facts and Figures Book Page 34 December 2018
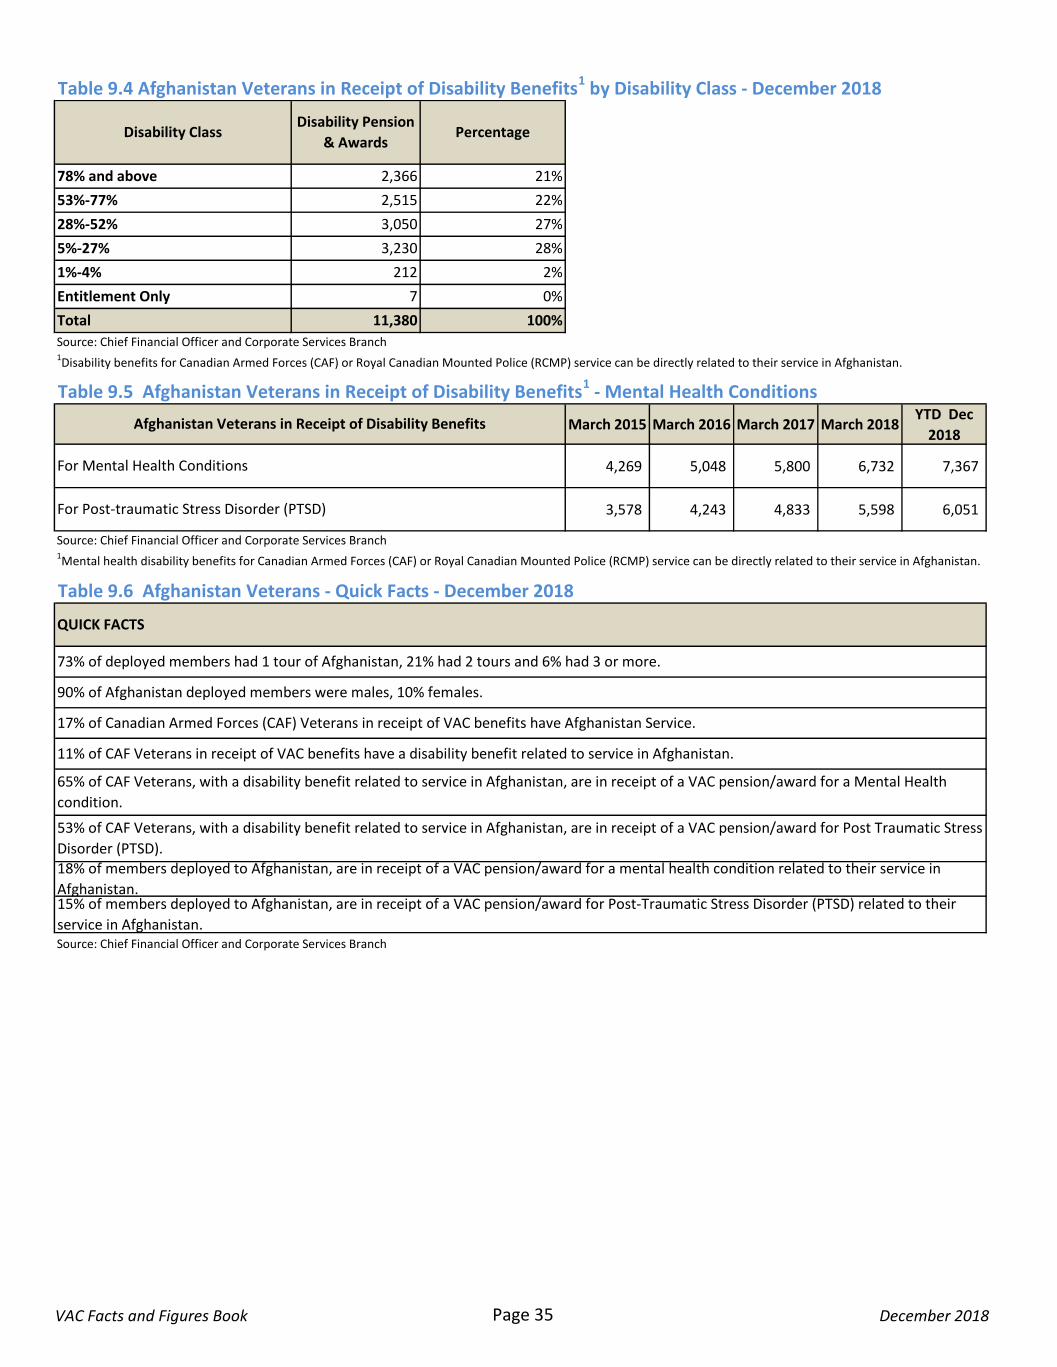
March 2015 March 2016 March 2017 March 2018YTD Dec
2018
4,269 5,048 5,800 6,732 7,367
3,578 4,243 4,833 5,598 6,051
Source: Chief Financial Officer and Corporate Services Branch
73% of deployed members had 1 tour of Afghanistan, 21% had 2 tours and 6% had 3 or more.
QUICK FACTS
100%
Table 9.6 Afghanistan Veterans - Quick Facts - December 2018
Afghanistan Veterans in Receipt of Disability Benefits
For Post-traumatic Stress Disorder (PTSD)
For Mental Health Conditions
Table 9.5 Afghanistan Veterans in Receipt of Disability Benefits1 - Mental Health Conditions
1Disability benefits for Canadian Armed Forces (CAF) or Royal Canadian Mounted Police (RCMP) service can be directly related to their service in Afghanistan.
11,380
Source: Chief Financial Officer and Corporate Services Branch
Source: Chief Financial Officer and Corporate Services Branch
Table 9.4 Afghanistan Veterans in Receipt of Disability Benefits1 by Disability Class - December 2018
28%
1%-4% 212 2%
Disability ClassDisability Pension
& Awards Percentage
78% and above 2,366 21%
53%-77% 2,515 22%
28%-52% 3,050 27%
15% of members deployed to Afghanistan, are in receipt of a VAC pension/award for Post-Traumatic Stress Disorder (PTSD) related to their
service in Afghanistan.
18% of members deployed to Afghanistan, are in receipt of a VAC pension/award for a mental health condition related to their service in
Afghanistan.
53% of CAF Veterans, with a disability benefit related to service in Afghanistan, are in receipt of a VAC pension/award for Post Traumatic Stress
Disorder (PTSD).
65% of CAF Veterans, with a disability benefit related to service in Afghanistan, are in receipt of a VAC pension/award for a Mental Health
condition.
11% of CAF Veterans in receipt of VAC benefits have a disability benefit related to service in Afghanistan.
Entitlement Only 7 0%
5%-27% 3,230
1Mental health disability benefits for Canadian Armed Forces (CAF) or Royal Canadian Mounted Police (RCMP) service can be directly related to their service in Afghanistan.
17% of Canadian Armed Forces (CAF) Veterans in receipt of VAC benefits have Afghanistan Service.
90% of Afghanistan deployed members were males, 10% females.
Total
VAC Facts and Figures Book Page 35 December 2018
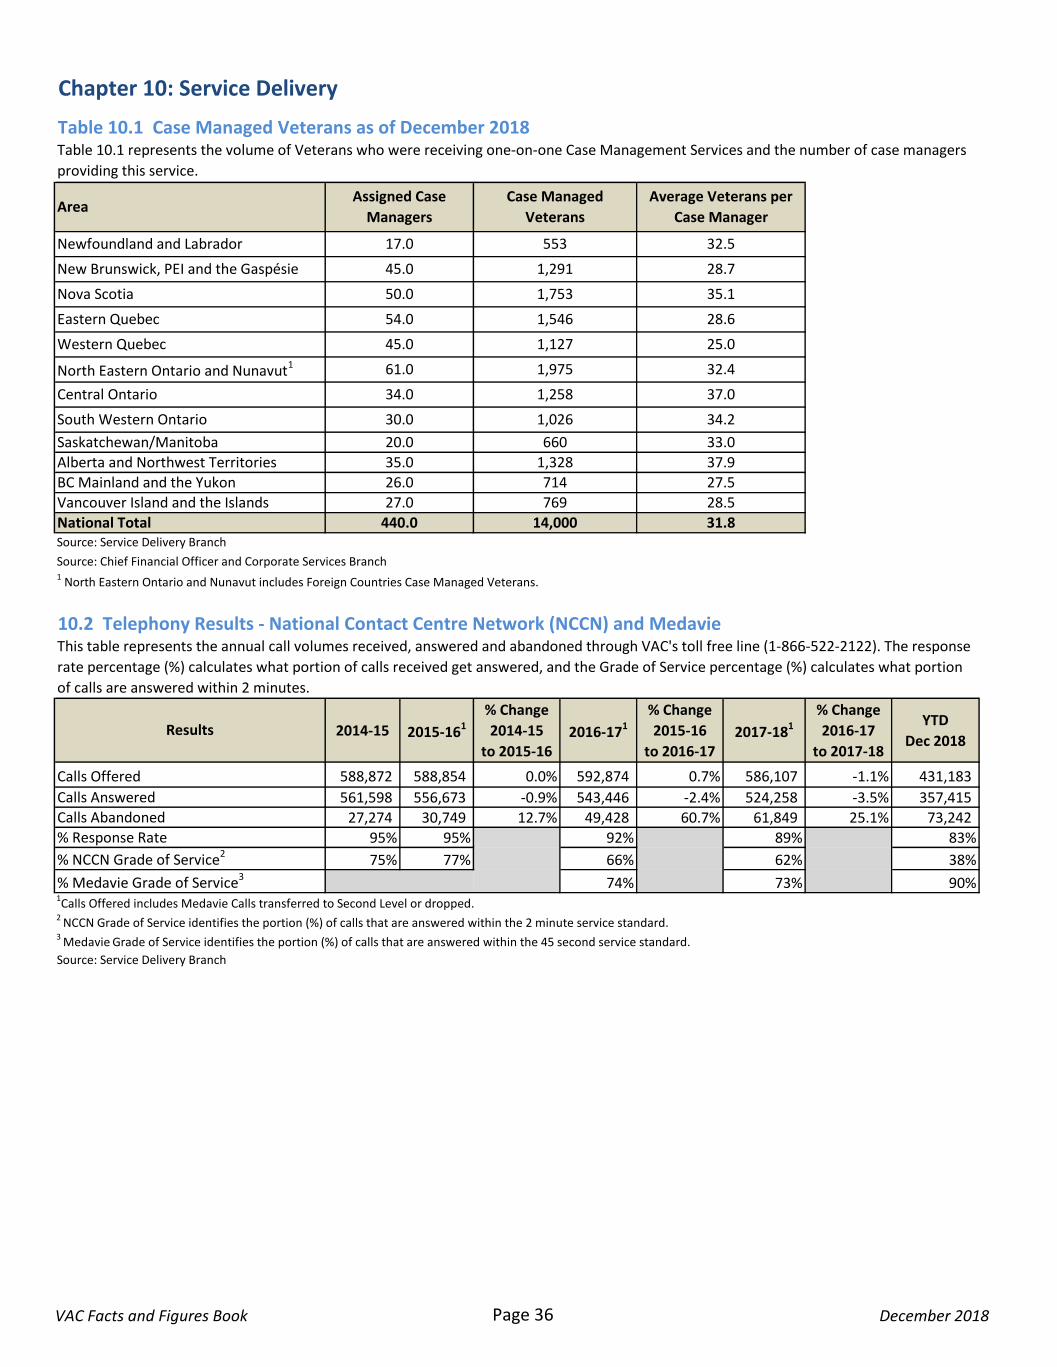
2014-15 2015-161
% Change
2014-15
to 2015-162016-171
% Change
2015-16
to 2016-172017-181
% Change
2016-17
to 2017-18
YTD
Dec 2018
588,872 588,854 0.0% 592,874 0.7% 586,107 -1.1% 431,183
561,598 556,673 -0.9% 543,446 -2.4% 524,258 -3.5% 357,415
27,274 30,749 12.7% 49,428 60.7% 61,849 25.1% 73,242
95% 95% 92% 89% 83%
75% 77% 66% 62% 38%
74% 73% 90%
Source: Service Delivery Branch
Western Quebec 45.0 25.0
North Eastern Ontario and Nunavut1
Nova Scotia 50.0 1,753 35.1
Eastern Quebec 54.0 1,546 28.6
61.0 1,975 32.4
26.0
AreaAssigned Case
Managers
Case Managed
Veterans
Average Veterans per
Case Manager
Newfoundland and Labrador 17.0 553 32.5
New Brunswick, PEI and the Gaspésie 45.0 1,291 28.7
714
Table 10.1 Case Managed Veterans as of December 2018
% NCCN Grade of Service2
1Calls Offered includes Medavie Calls transferred to Second Level or dropped.
% Medavie Grade of Service3
1,328 37.9
National Total 440.0
10.2 Telephony Results - National Contact Centre Network (NCCN) and Medavie
3 Medavie
Grade of Service identifies the portion (%) of calls that are answered within the 45 second service standard.
Calls Answered
Calls Abandoned
Results
Calls Offered
769
% Response Rate
2 NCCN Grade of Service identifies the portion (%) of calls that are answered within the 2 minute service standard.
South Western Ontario 30.0 1,026 34.2
14,000 31.8
Saskatchewan/Manitoba 20.0 660 33.0
28.5
27.5
Chapter 10: Service Delivery
This table represents the annual call volumes received, answered and abandoned through VAC's toll free line (1-866-522-2122). The response
rate percentage (%) calculates what portion of calls received get answered, and the Grade of Service percentage (%) calculates what portion
of calls are answered within 2 minutes.
Table 10.1 represents the volume of Veterans who were receiving one-on-one Case Management Services and the number of case managers
providing this service.
Source: Chief Financial Officer and Corporate Services Branch
Source: Service Delivery Branch
1 North Eastern Ontario and Nunavut includes Foreign Countries Case Managed Veterans.
Central Ontario 34.0 1,258 37.0
Vancouver Island and the Islands 27.0
Alberta and Northwest Territories 35.0
BC Mainland and the Yukon
1,127
VAC Facts and Figures Book Page 36 December 2018
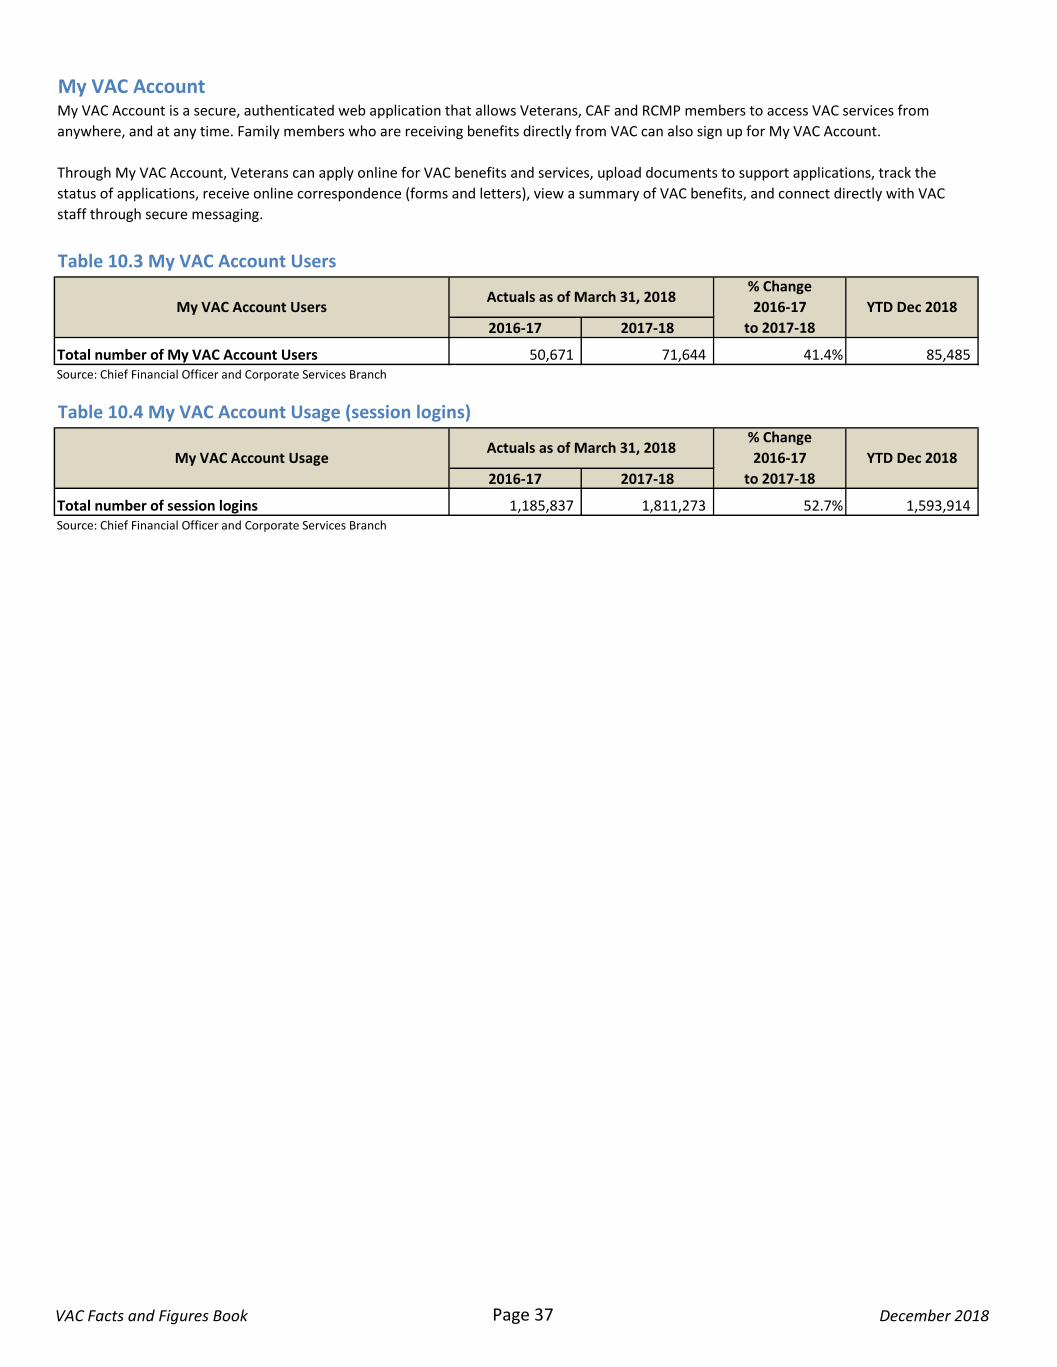
2016-17 2017-18
Total number of My VAC Account Users 50,671 71,644 41.4% 85,485 Source: Chief Financial Officer and Corporate Services Branch
2016-17 2017-18
Total number of session logins 1,185,837 1,811,273 52.7% 1,593,914 Source: Chief Financial Officer and Corporate Services Branch
YTD Dec 2018
YTD Dec 2018
% Change
2016-17
to 2017-18
% Change
2016-17
to 2017-18
My VAC AccountMy VAC Account is a secure, authenticated web application that allows Veterans, CAF and RCMP members to access VAC services from
anywhere, and at any time. Family members who are receiving benefits directly from VAC can also sign up for My VAC Account.
Through My VAC Account, Veterans can apply online for VAC benefits and services, upload documents to support applications, track the
status of applications, receive online correspondence (forms and letters), view a summary of VAC benefits, and connect directly with VAC
staff through secure messaging.
Table 10.4 My VAC Account Usage (session logins)
My VAC Account Usage
Table 10.3 My VAC Account Users
My VAC Account UsersActuals as of March 31, 2018
Actuals as of March 31, 2018
VAC Facts and Figures Book Page 37 December 2018
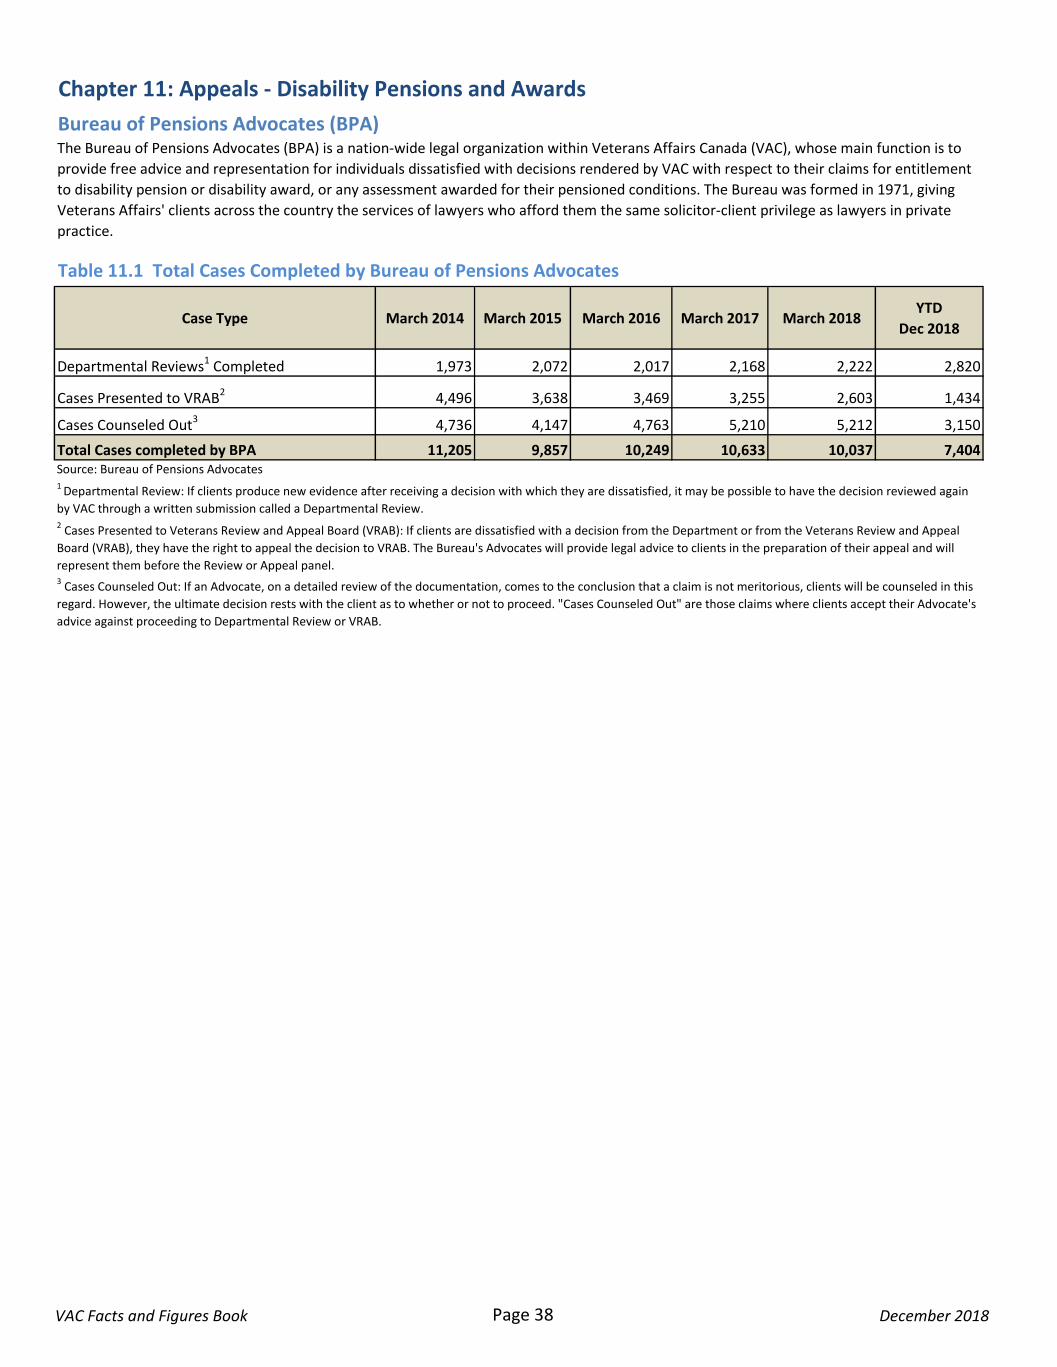
Case Type March 2014 March 2015 March 2016 March 2017 March 2018YTD
Dec 2018
Departmental Reviews1 Completed 1,973 2,072 2,017 2,168 2,222 2,820
Cases Presented to VRAB2 4,496 3,638 3,469 3,255 2,603 1,434
Cases Counseled Out3 4,736 4,147 4,763 5,210 5,212 3,150
Total Cases completed by BPA 11,205 9,857 10,249 10,633 10,037 7,404
Chapter 11: Appeals - Disability Pensions and Awards
Table 11.1 Total Cases Completed by Bureau of Pensions Advocates
The Bureau of Pensions Advocates (BPA) is a nation-wide legal organization within Veterans Affairs Canada (VAC), whose main function is to
provide free advice and representation for individuals dissatisfied with decisions rendered by VAC with respect to their claims for entitlement
to disability pension or disability award, or any assessment awarded for their pensioned conditions. The Bureau was formed in 1971, giving
Veterans Affairs' clients across the country the services of lawyers who afford them the same solicitor-client privilege as lawyers in private
practice.
Source: Bureau of Pensions Advocates
Bureau of Pensions Advocates (BPA)
1 Departmental Review: If clients produce new evidence after receiving a decision with which they are dissatisfied, it may be possible to have the decision reviewed again
by VAC through a written submission called a Departmental Review.2 Cases Presented to Veterans Review and Appeal Board (VRAB): If clients are dissatisfied with a decision from the Department or from the Veterans Review and Appeal
Board (VRAB), they have the right to appeal the decision to VRAB. The Bureau's Advocates will provide legal advice to clients in the preparation of their appeal and will
represent them before the Review or Appeal panel.3 Cases Counseled Out: If an Advocate, on a detailed review of the documentation, comes to the conclusion that a claim is not meritorious, clients will be counseled in this
regard. However, the ultimate decision rests with the client as to whether or not to proceed. "Cases Counseled Out" are those claims where clients accept their Advocate's
advice against proceeding to Departmental Review or VRAB.
VAC Facts and Figures Book Page 38 December 2018
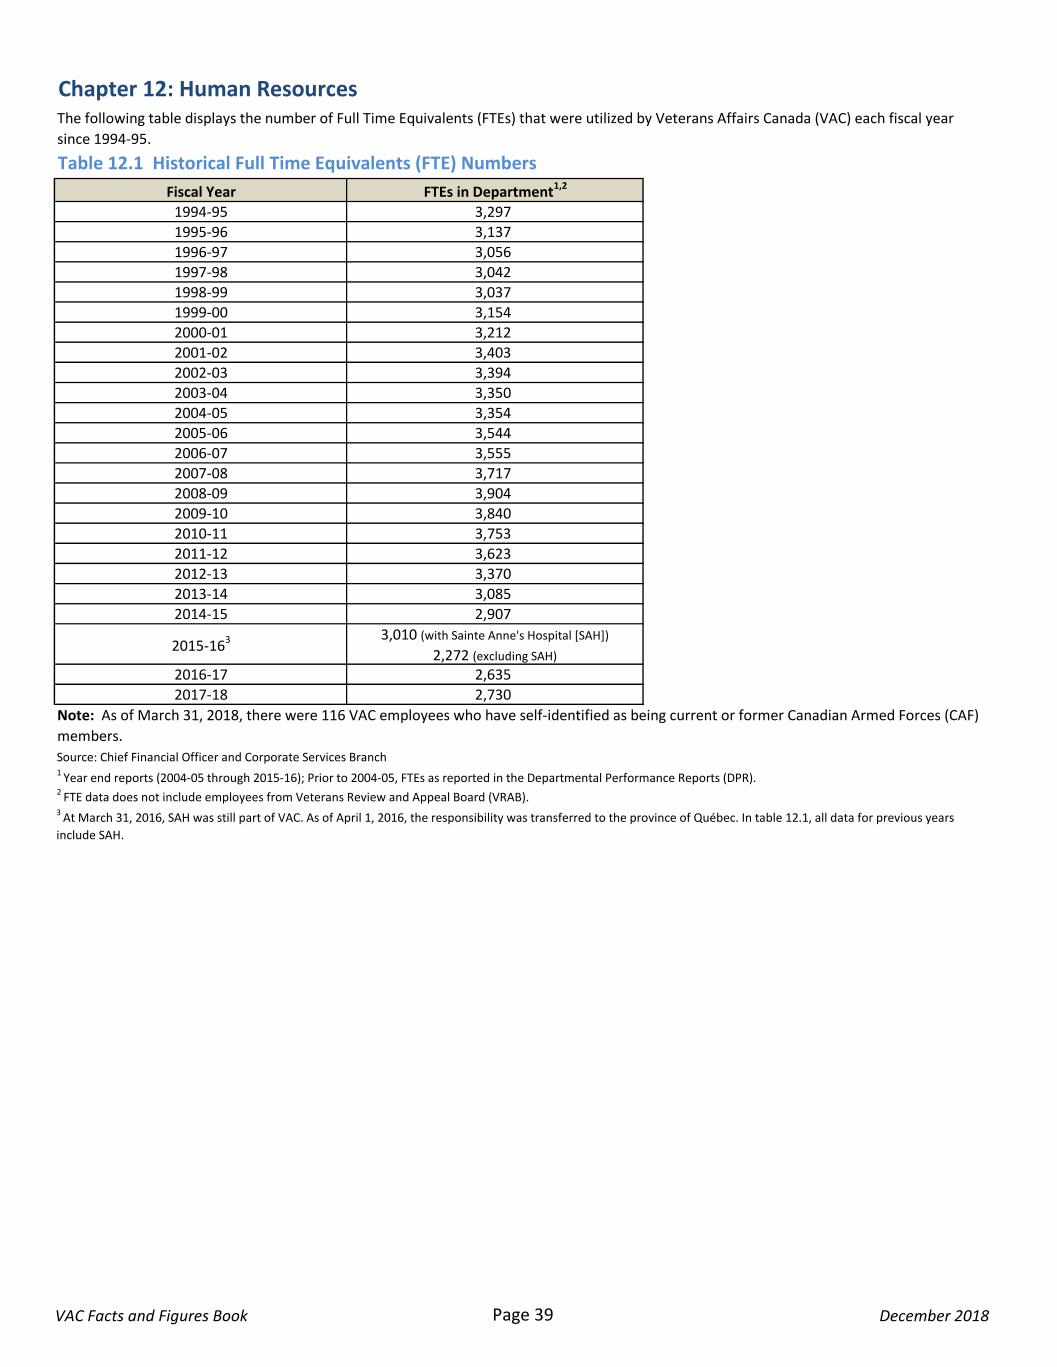
Fiscal Year FTEs in Department1,2
1994-95 3,297
1995-96 3,137
1996-97 3,056
1997-98 3,042
1998-99 3,037
1999-00 3,154
2000-01 3,212
2001-02 3,403
2002-03 3,394
2003-04 3,350
2004-05 3,354
2005-06 3,544
2006-07 3,555
2007-08 3,717
2008-09 3,904
2009-10 3,840
2010-11 3,753
2011-12 3,623
2012-13 3,370
2013-14 3,085
2014-15 2,907
2015-163 3,010 (with Sainte Anne's Hospital [SAH])
2,272 (excluding SAH)
2016-17 2,635
2017-18 2,730
Chapter 12: Human ResourcesThe following table displays the number of Full Time Equivalents (FTEs) that were utilized by Veterans Affairs Canada (VAC) each fiscal year
since 1994-95.
Table 12.1 Historical Full Time Equivalents (FTE) Numbers
Note: As of March 31, 2018, there were 116 VAC employees who have self-identified as being current or former Canadian Armed Forces (CAF)
members.
3 At March 31, 2016, SAH was still part of VAC. As of April 1, 2016, the responsibility was transferred to the province of Québec. In table 12.1, all data for previous years
include SAH.
1 Year end reports (2004-05 through 2015-16); Prior to 2004-05, FTEs as reported in the Departmental Performance Reports (DPR).
2 FTE data does not include employees from Veterans Review and Appeal Board (VRAB).
Source: Chief Financial Officer and Corporate Services Branch
VAC Facts and Figures Book Page 39 December 2018