vfr met - aviation.govt.nz
TRANSCRIPT
VFR MET
ContentsIntroduction ....................................... 3
Sources of MET information .......................4MetFlight GA ................................................. 4IFIS (Internet Flight Information Service) ............ 4What to get ................................................... 6
Building the picture ............................... 7What creates weather? ...................................... 7Air masses .................................................... 8Surface weather charts .................................... 9Reading synoptic charts .................................. 10Interpreting webcams ................................... 12
MET products .................................... 14Radar imagery............................................... 14Satellite imagery .......................................... 18SIGMET – significant meteorological information ................................................ 20GSM – Graphical SIGMET Monitor ..................... 20GNZSIGWX – Graphical New Zealand Significant Weather ...................................... 21GRAFOR – Graphical Aviation Forecast ............... 21AAW – Aviation Area Winds ............................. 22
Before and during flight ........................ 23Cloud base and visibility ................................ 23Turbulence ................................................. 24Terrain avoidance .......................................... 24Reserve fuel ................................................ 24Escape options ............................................ 25Brief your passengers .................................. 25Inflight decision-making ................................ 26
Learn from experience .......................... 26
Rules of thumb .................................. 27
MET abbreviations ............................... 29
Cover photo: iStock.com/tomasworks
See the CAA website for Civil Aviation Rules, advisory circulars, airworthiness directives, forms, and more safety publications. Visit aviation.govt.nz.
Every effort is made to ensure the information in this booklet is accurate and up-to-date at the time of publishing. But numerous changes can occur with time, especially in regard to airspace and legislation. Readers are reminded to get appropriate up-to-date information.

IntroductionA full MET briefing is essential. It keeps you safe, and legally you must be familiar with the current and forecast MET conditions before you go flying.
A comprehensive MET briefing is one of the most important tools in your planning and decision-making kit. But beyond getting the briefing, it’s critical you understand it, and can build a mental picture of what effect the weather will have on your flight.
Weather is a significant contributing factor in air accident statistics, and all too often these accidents could have been prevented by the pilot having all the MET information available and understanding how it affects their flight. There are practical steps you can take to ensure your understanding of the weather, and how it changes:
Become familiar with all the places you can get weather information.
Know what MET products you should have.
Use charts, satellite pictures, and radar images to get an overall picture of the weather.
Be clear about how the weather affects your aircraft and your intended flight.
Break the information down so that it is easy to understand the conditions.
Use the most up-to-date information available.
Relate the weather you see with what you expect.
Meteorological products and services for civil aviation in New Zealand can only be provided by organisations certificated to do so by the CAA.
The CAA is the International Civil Aviation Organization (ICAO) Meteorological Authority in New Zealand, and, as such, has an arrangement for MetService to carry out the operational requirements prescribed in ICAO Annex 3, Meteorological Service for International Air Navigation.
Before you can understand aviation meteorology products you need to know how to decode them. The CAA has produced a number of resources to help you do this:
• the MET section on our website aviation.govt.nz/met
• the New Zealand Cloud Types poster
• the Weather card which contains abbreviations, UTC converter, and aviation weather products, this will fit in your AIP Vol 4
• the VFR MET Minima card which graphically explains visibility distances when flying under VFR rules, this will also fit in your AIP Vol 4.
Request these products for free by emailing [email protected].
3VFR MET

Sources of MET information Specific aviation MET briefings are available from the following sources:
MetFlight GA
MetFlight GA is the best source of preflight MET information.
metflight.metra.co.nz
The MetService’s MetFlight GA website provides aviation MET for non-commercial use and is intended primarily for general aviation and flight training organisations.
The information available and the functions provided include: a situation statement (textual), satellite pictures, weather radar, analysis and prognosis charts, cloud and rain forecasts, GNZSIGWX, GRAFOR, AAW, SIGMET, GSM, VAA, VAG, TAF, METAR, METAR AUTO and SPECI reports.
IFIS (Internet Flight Information Service)
ifis.airways.co.nz
IFIS is provided by Airways New Zealand. This is the online location for obtaining NOTAMs, current ATIS reports for attended aerodromes and filing flight plans. Weather information is also available including TAF, METAR, SPECI, METAR AUTO, SIGMET, GSM, GNZSIGWX and AAW, and there is a link to MetFlight GA to access additional weather information. An IFIS app is available for mobile devices.
4

iSto
ck.c
om/jo
ndpa
tton
5VFR MET

What to get
As there are so many sources of weather information available, the first challenge is simply knowing where and how to look for the weather information you need. Below is a list of the MET information you should use when preparing for and flying a VFR flight.
Aviation MET information
When to use
Type of information
Aviation weather product
Coverage and content Where to get
Preflight Overview New Zealand Situation (textual), GNZSIGWX, GRAFOR, AAW, Surface weather charts
Satellite pictures and radar imagery
New Zealand and Tasman Sea – the big picture of the major weather elements
MetFlight
IFIS
Warnings SIGMET (textual), GSM, VAA, VAG, SWX Advisory
NZZC FIR – details of hazardous weather
MetFlight
IFIS
Enroute GRAFOR
AAW
GNZSIGWX
Graphical coverage of all of mainland New Zealand
MetFlight
IFIS
Aerodrome TAF
METAR AUTO
METAR/SPECI
BWR*
ATIS
Departure, destination and alternate aerodromes – forecasts and reports
MetFlight
IFIS
Inflight Hazardous weather and aerodrome update
SIGMET
Amended TAF
METAR/SPECI
METAR AUTO
ATIS, BWR* VAA
Update of preflight information, hazardous weather, and destination and alternate aerodrome updates
MetFlight
IFIS
Airways tower or flight information service
A guide to the abbreviations used in this booklet is on pages 29–31.
* A basic weather report (BWR) may be provided by someone qualified to do so. It may contain basic verbal comment on aspects of the weather being experienced at a particular aerodrome or place. It cannot contain a QNH, but may contain a mean sea level pressure for contextual information. For more information, see rule 174.6 and AC174-1.
6

Building the pictureStart with an overview of the whole country and surrounding seas. You can get this from assessing surface weather charts, satellite pictures, and radar images. These will give you the overall situation.
Then start asking yourself some questions about your particular route or intended area of operation:
• Do the charts and images agree with each other? If not, why not?
• Is there a frontal situation overhead or expected? When will it arrive?
• What general wind direction and strength is expected?
• What effect will terrain have on the wind?
• What cloud would you expect to see?
• What is the visibility likely to be?
• What changes would you expect to see?
• Does the information suggest any hazardous conditions?
What creates weather?
To build the big picture you need to know what creates it. The three basic elements of weather are:
• temperature – warm or cold
• wind – speed and direction
• moisture or humidity.
Air masses can be described as warm, cold, moist, or dry. Air masses are named according to where they originate from, and each has its own characteristic temperature and humidity.
7VFR MET

L
H
H
L
50º
30º
40º
150º 160º 170º E 180º W
1016
1008
1000
1021
1023
1016
10081000
1008997
1000
1008
993991 1000
Surface weather chart of the Tasman area.
Temperature differences support the development of low pressure systems. Surface low pressure systems usually have fronts associated with them. A front is the zone between two air masses that contain different combinations of the three basic elements – temperature, wind, and moisture.
A front marks the boundary between two air masses and appears on the weather map as a line with triangles or semicircles attached.
Air masses
• A tropical air mass flows from the tropics, and is therefore warm and generally moist.
• A polar air mass flows from the polar regions, and is therefore cold.
• A maritime air mass flows over a large sea area, and is therefore moist.
• A continental air mass flows over a large land area, and is therefore dry.
The air masses reaching New Zealand are generally maritime polar or maritime tropical.
8

iSto
ck.c
om/F
erha
n H
ussa
in
Surface weather charts
One of the primary ways of representing the weather is the use of surface weather charts. It should be the first thing you look at to build your mental picture of the current and expected weather conditions.
The chart could be historical – an analysis of the situation at a particular time; or it could be a prognostic forecast chart for some time in the future. So check the type and time of the chart. You may have both, the most recent analysis and the latest prognostic chart. Remember, all chart times are in UTC time.
The MetFlight GA image looper function is a helpful tool for looking at the progression of the weather as depicted on the standard analysis and prognostic charts.
9VFR MET

Reading synoptic charts
Remember that the charts are showing the nominal weather pattern at sea level.
The isobars connect areas of equal pressure with 4Hpa spacing, and the closer together the isobars, the windier it will be. The direction of the wind is generally parallel to the isobars: Anti-clockwise around a high pressure area (a ridge or anticyclone), and clockwise around a low pressure area (a trough).
Important features to note are the frontal systems. This is where different air masses clash resulting in poor or hazardous weather conditions.
Cold fronts (lines with blue triangles) represent the encroachment of cold air under a warmer moist air mass. This forces the warmer air mass to rise, creating cumuliform clouds that can result in light to heavy showers, as well as reduced visibility and lower ceilings during showers. The passage of the front itself will create more intense, and possibly longer duration, shower activity depending on the speed of the front.
After the passage of the cold front, the air is usually clearer (but may still include showers); the wind direction having backed to the southerly quarter. If there is
170º
50º
30º
40º
150º 160º 170º E 180º W
996 1000
1004
1008
1012
1016
1000
996
1020
1024
1016
A synoptic chart showing cold fronts, a warm front, and a stationary front.
10

sufficient instability along the frontal zone, a line of active cumuliform clouds and CB (cumulonimbus/thunderstorms) can form along the front.
Warm fronts (lines with red semicircles) represent the encroachment of moist warm air over a cold air mass. Generally warm fronts move slower than cold fronts because the warm air mass is less dense than the cold air mass it has to rise over. Cloud ahead of the warm front is mostly stratiform, and rainfall gradually increases as the frontal zone approaches. There is often low cloud preceding the passage of a warm front and then clearing and rapid warming usually follows. If the warm air mass is unstable, CBs may be embedded among the stratiform clouds ahead of the front, and after the front passes showers may continue. Essentially warm fronts are much less well defined than cold fronts.
When a warm or cold front becomes slow moving, this is represented as a stationary front (lines with blue triangles on the ‘warm’ side, red semicircles on the ‘cold’ side).
Occluded fronts (lines with alternating blue triangles and red semicircles) represent areas where a warm air mass gets caught between two cold air masses, and rises as the cooler air pushes in underneath. A variety of weather is associated with an occluded front, with CBs possible. Isolated occluded fronts often remain for a time after a low pressure system has decayed. Cloudy conditions with lower visibility and patchy rain or showers are the result.
Troughs (dashed lines) can be used to depict wind changes with no associated change in temperature or humidity (these may be the remnants of – or the precursors to – cold fronts), or they can depict an upper feature that could be inducing upward motion and therefore convective clouds to form.
Less obvious perhaps than frontal systems, but equally important, are the overall airflows shown on the charts. For example, if there is a sustained airflow from the ocean, especially to the south, then the area of the country exposed to it will experience showery and, depending on the intensity of the flow, windy conditions.
Conversely in these conditions, leeward of the mountain ranges will be dry and more settled because all the moisture has been removed from the air mass windward of the mountains. But leeward areas can still be very windy. For example, a strong southwesterly on the West Coast passing over the Southern Alps; it becomes an even stronger, turbulent, and very dry northwesterly on the east coast of the South Island. This same affect can be experienced leeward of all of the mountain ranges in New Zealand.
How fast are the systems moving? Have a look at a series of prognostic charts to get a feel for how fast any given weather system is moving. Because New Zealand lies in the mid-latitudes surrounded by ocean, the speed of the systems can vary greatly. A frontal system may pass through in less than an hour — or take the best part of a day. Similarly, anticyclones can sometime lock onto the country and be present for weeks, and low pressure areas, especially remnants of tropical cyclones can pass quite quickly.
11VFR MET

Interpreting webcams
There are many public webcams available on the internet that can help pilots if used carefully. Use them in conjunction with aviation weather forecasts, METARs and METAR AUTOs to build a picture of the overall weather. Some of these cameras are at airports (eg, Taupō) while others such as the Desert Road cameras can provide useful enroute information.
MetService is progressively installing webcams at aerodromes to assist with its aviation forecasting, and provides images from some of these on MetFlight Commercial and MetJet.
Webcam image quality and usability varies considerably depending on type of camera and lens used.
Tips and hints:
• Always check imagery times to make sure they are current. Some sites may update infrequently and some may display old images for long periods when either the cameras or the communication links have failed.
• Where there are webcams on the routes or aerodromes you use regularly, look at the imagery frequently (even on days you’re not flying) so that you become familiar with the hills and other landmarks you might want to use to assess visibility and cloud base. If you’re unfamiliar with the aerodrome, or route, the images may also help you build a picture of local terrain and aerodrome layout.
• Learn to recognise when some cameras switch to infrared mode at night and note the different appearance of these images. Although infrared images provide useful night-time imagery it can be more difficult to assess visibility and the state of the sky.
• Be conscious of the effect of different lens types (wide and narrow angle) on your assessment of terrain, cloud amounts, cloud bases, and visibility.
• When using airport webcams, always verify cloud bases with those reported in METAR and METAR AUTO reports, and ATIS (where available).
• Bookmark webcam sites on your phone or tablet so that you can quickly access them during stops (and note that if you keep your MetFlight GA briefing open, you will be able to quickly refresh it without having to log on again).
• Be wary of cameras that only point in one direction. It may look like a beautiful day, but there could be a front approaching from right behind the camera.
• Websites with cameras pointing in several directions, or with cameras that you can manipulate yourself, are the best. For example, www.tekapotourism.com has multiple cameras showing views in multiple directions and an interactive live video camera that allows you to select from 20 preset views and watch while the camera moves to that view.
• Depth of field characteristics sometimes mean that mist, light rain, or low visibility don’t show up in the picture.
Personally assess each website on its merits – don’t just rely on the recommendations of others.
Webcam photographs at Taupō Airport taken over the course of a day (www.taupoairport.co.nz) >>
12

13VFR MET

MET productsRadar imagery
MET radar operates using the same principle as any other radar. A beam of electromagnetic energy is emitted from a focused antenna. If the beam encounters any precipitation, either water or ice particles, some of the energy of the beam is returned to the radar. The antenna also acts as a receiver, and by timing how long it takes for the pulse of electromagnetic energy to return to the radar, the distance to the object (in the case of weather radar, precipitation) can be determined. There is a mathematical relationship between the particles’ characteristics and the power of the returned beam, and this is used to plot a colour-coded image that shows precipitation intensity. Generally, the stronger the echo, the heavier the precipitation.
Weather radars use a wavelength of about 5.5 cm. This is much less than ATC radar, which has a wavelength of about 23 cm, because the size of objects being detected by the weather radar is much smaller.
The radar rotates through a full 360 degree cone, and the entire scan takes approximately 7½ minutes. This means that any image you look at will be at least 7½ minutes old.
Due to the Earth’s curvature, the further the beam is from the radar, the higher it is looking in the atmosphere. At 250 km, the lowest beam elevation is approximately 6 km (about 19,700 feet) above the Earth’s surface. Precipitation below the beam will therefore be undetected, and also there is no guarantee that any precipitation detected by the radar at this elevation is reaching the ground.
NZ radar image >>
Possible hail
Heavy
Moderate
Light
Rain intensity
14

15VFR MET

in that area, but none of the beam’s energy can penetrate the heavy rain. Some newer radars can correct for this phenomena using algorithmic techniques.
Icing and virga
Virga is precipitation not reaching the ground. If you only looked at the image above, you might think it’s raining in Whanganui. METAR AUTO reports during this time didn’t report any rain. However, there was a report of moderate icing in the area. The radar is detecting ice in the cloud and/or virga below the cloud. Below the freezing level, the ice will melt and any precipitation (ice or rain) falling from the cloud must have evaporated before reaching the ground.
Use other information, such as METARs and METAR AUTOs, to help complete your mental picture.
Drizzle
Drizzle is associated with cloud in the lower levels of the atmosphere. There could be drizzle below the beam of the radar but it’s physically impossible for the radar to detect it. Compounding the problem is the very small size of drizzle droplets; any energy returned to the radar will be very weak, making detection problematic. However, the visibility associated with drizzle is typically very low. Just because you don’t see much on the radar, doesn’t mean flying conditions are good!
Orographic screening
Like any other primary radar, the beam can’t go through mountains. It can be raining heavily on the West Coast, but the Christchurch radar won’t pick this up. This is known as orographic shadowing.
Attenuation
In the image above, the strong echoes southwest of the radar (located at the green X) are blocking the beam in the area indicated by the red arrow. There would still be rain
16
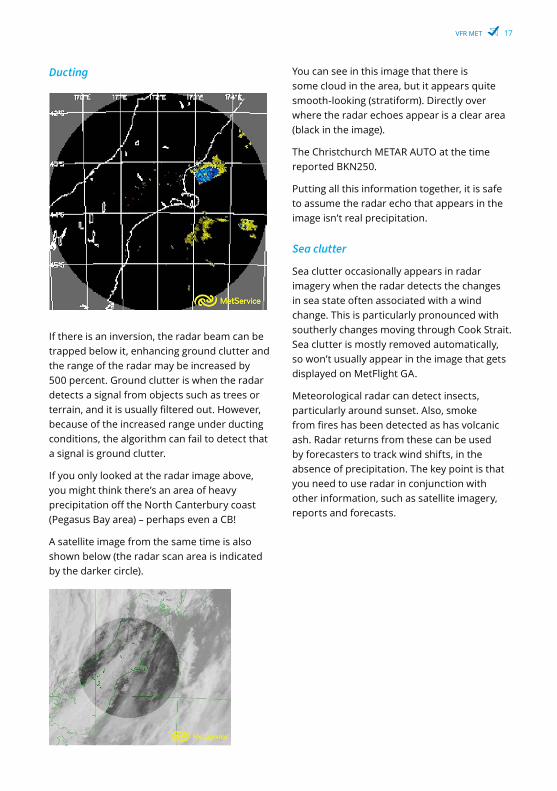
Ducting
If there is an inversion, the radar beam can be trapped below it, enhancing ground clutter and the range of the radar may be increased by 500 percent. Ground clutter is when the radar detects a signal from objects such as trees or terrain, and it is usually filtered out. However, because of the increased range under ducting conditions, the algorithm can fail to detect that a signal is ground clutter.
If you only looked at the radar image above, you might think there’s an area of heavy precipitation off the North Canterbury coast (Pegasus Bay area) – perhaps even a CB!
A satellite image from the same time is also shown below (the radar scan area is indicated by the darker circle).
You can see in this image that there is some cloud in the area, but it appears quite smooth-looking (stratiform). Directly over where the radar echoes appear is a clear area (black in the image).
The Christchurch METAR AUTO at the time reported BKN250.
Putting all this information together, it is safe to assume the radar echo that appears in the image isn’t real precipitation.
Sea clutter
Sea clutter occasionally appears in radar imagery when the radar detects the changes in sea state often associated with a wind change. This is particularly pronounced with southerly changes moving through Cook Strait. Sea clutter is mostly removed automatically, so won’t usually appear in the image that gets displayed on MetFlight GA.
Meteorological radar can detect insects, particularly around sunset. Also, smoke from fires has been detected as has volcanic ash. Radar returns from these can be used by forecasters to track wind shifts, in the absence of precipitation. The key point is that you need to use radar in conjunction with other information, such as satellite imagery, reports and forecasts.
17VFR MET

Remember, these images tell you nothing about cloud bases or tops – you need to look at other information, such as METAR/SPECI, METAR AUTO, TAF and GRAFOR.
The major limitation of visible satellite imagery is that it is only available during daylight hours.
Visible image example:
In the image above, dark areas are cloud free. There is a solid area of cloud in the western Bay of Plenty, you can see it along the eastern side of the Kaimai Range. There is also cloud around Taranaki, although there appear to be breaks in it. Cloud is also along the South Island West Coast, but there are gaps in the cloud in northern Westland and Buller. Most of the east of the South Island is cloud free.
The red arrow indicates an area of very smooth looking cloud. This is actually stratus.
We can’t be totally sure of that from the satellite image, so other information is needed. In this case, the Christchurch METAR AUTO reported BKN008. It would also be worthwhile looking at the Kaikoura cloud base.
Satellite imagery
Satellite images come from a geostationary satellite orbiting the Earth at approximately 36,000km. Geostationary means it stays in the same position relative to the Earth, so is always looking at the same area. The satellite measures emitted or reflected radiation from the Earth’s surface, clouds, precipitation, water vapour and other components of the atmosphere. Modern satellites measure many different channels of the electromagnetic spectrum, but what we are interested in here are the visible (shorter wavelength) and infrared (longer wavelength) channels.
Visible imagery
Incoming solar radiation is reflected by the Earth’s surface or cloud and bounces back out to space where it is detected by the satellite. The images produced show albedo (how good a surface is at reflecting light) of the surface. For example, snow will appear brighter than grass and thicker clouds are brighter than thin clouds.
On MetFlight GA, one image is available per hour. The major advantage of visible imagery is that you can see where the clouds actually are. This should help when you read a GRAFOR. If the GRAFOR says “BKN 2000 TOPS 5000”, you don’t really know exactly where the “BKN” cloud is. For example, is there cloud on or in the pass I want to fly through? By taking a look at the most recent visible satellite image you will be able to answer this question. Of course, by the time you get there, the situation may have changed. Using a loop of a series of visible satellite images will help determine if areas of cloud are dissipating or growing.
You can also gather information about the type of cloud. Stratiform cloud appears smooth, while cumuliform appears lumpy.
18

Infrared image example:
Cloud Top Temperature (°C)
25
-25
-50
0
In the image above, we can see that there is an area of colder cloud tops (around -40°C) over the south of the South Island, but there is no information about the depth of the cloud layer. We can also see an area of relatively warm cloud tops along the South Island’s West Coast, and what appears to be a cloud-free area off the Canterbury coast. One of the major limitations of infrared satellite imagery is that if the cloud tops are a similar temperature to the land or sea, they will not be easy to distinguish. A particular example of this to be aware of is when there is fog or stratus. This will be a relatively thin layer, with a temperature very close to the surface below (sea or land). At night, when fog and stratus are more common, its presence cannot be determined from infrared images alone. However, once the first visible satellite image is available, the areas will become obvious.
The yellow arrow indicates an area of cirrus, although we can’t be sure of that from this image alone. We can tell there is cloud in the area, and that it’s thin enough to see the ground below. The Dunedin METAR AUTO may help, but the infrared satellite image is the real key in this case.
Infrared imagery
Some of the incoming radiation from the sun is absorbed by the Earth, and re-radiated at longer wavelengths. Much of this infrared radiation is absorbed by clouds and water vapour in the troposphere, and is then re-radiated. Satellite radiometers measure the radiance of the emitting surface. Radiance is the rate of emission of electromagnetic energy per unit area of a surface, and it depends on the temperature of the surface. A simple way of thinking about this is the difference between white hot and red hot – the object that is white hot has a higher temperature.
When we are looking at infrared satellite images, what we are really looking at is the temperature of the emitting surface. The surface could be cloud, land or ocean, but what is important is cloud top temperatures. Note that it’s the temperature of the cloud tops that will be measured. Because the temperature of the atmosphere at different levels is known, the tops of the clouds can be calculated. No information about cloud bases can be determined from infrared satellite images.
The images are usually coloured to make them easier to use, with darker colours usually indicating warmer cloud tops and brighter colours indicating cold cloud tops.
On MetFlight GA, one satellite image is available per hour. These images are available 24 hours per day, because the Earth continues to emit long wave radiation at night.
There are other sites that may help you form the picture, such as satview.bom.gov.au.
19VFR MET

Visible and infrared examples
Both of these images (see pages 18, 19) are from 2200Z (UTC).
Note the area of stratus identified earlier off the Canterbury coast (red arrow) doesn’t appear in the infrared image.
If all you looked at was the infrared image, you might think there was a lot of cloud over Dunedin. However, the visible image shows this to be a thin layer of cloud. It must be cirrus because the tops are so cold in the infrared image.
SIGMET – significant meteorological information
SIGMETs provide information on observed or forecast hazardous weather conditions, particularly thunderstorms, severe turbulence, volcanic ash, tropical cyclones, severe icing, and severe mountain waves.
They are issued for an FIR, and are valid for four hours (or six hours for volcanic ash and tropical cyclones), and are reviewed after three hours or when further information is available, especially from PIREPs and AIREPs. They are sequentially numbered so it is easy to work out whether you have the most current SIGMET or not. Note that SIGMET numbering starts again from 1 after 0000 UTC each day – so check both the date and the number to ensure you have the latest issue.
The height of SIGMET phenomena included in SIGMETs is given in feet above mean sea level up to 10,000 ft and in flight levels (FLs) at and above FL100.
GSM – Graphical SIGMET Monitor
GSM is a graphical representation of the text-based SIGMETs provided by MetService in a product called the Graphical SIGMET Monitor (GSM). It is intended for overall situational awareness.
A separate GSM is issued for the New Zealand FIR (NZZC) and the Auckland Oceanic FIR (NZZO). A new GSM is issued each time a new textual SIGMET is issued or cancelled. There will never be more than one GSM valid for each FIR at any particular time.
The validity period of each GSM will be displayed in the legend box of the GSM. This corresponds to the earliest start time for the SIGMETs displayed, and extend to the latest end time for the SIGMETs displayed.
Textual SIGMETs concerning volcanic ash and tropical cyclones are not displayed in GSMs. If a volcano or a tropical cyclone is located in either the NZZC or NZZO GSM, the location of the volcano or tropical cyclone will be shown at the actual location in the GSM.
Note that SIGMETs are not displayed in the NZZO GSM south of 70S, the southern limit of the NZZO GSM product.
Refer to aviation.govt.nz/met for the Graphical SIGMET Monitor (GSM) user guide.
20

GNZSIGWX – Graphical New Zealand Significant Weather
The GNZSIGWX chart provides forecast information on the horizontal and vertical extent of turbulence, mountain waves, cumulonimbus clouds (CB) and icing for flights within the NZZC flight information region. It also provides awareness information for hazardous phenomena such as volcanic activity and radioactive cloud within the NZZC flight information region.
Issued 3 times a day by MetService, each chart depicts the hazards to aviation listed above that are expected to impact the NZZC FIR over a 15-hour period. The validity of each chart is in a text box in the bottom right of each chart. Three versions of the GNZSIGWX are available to users. MetFlight carries the SFC to FL100 product, and the SFC to FL250 and SFC to FL410 products are available over other MetService web products.
This chart only covers phenomenon which are moderate in nature, ie, moderate turbulence, icing, mountain waves, etc. If a hazard is expected to become severe within the validity of the chart, the term “intensifying” (INTSF) will be added to the hazard’s description. If a SIGMET is already in effect for a given phenomenon there will be no mention of this on the GNZSIGWX chart and so users must also refer to the GSM in conjunction with this chart.
All heights in GNZSIGWX are expressed in flight levels (FL) unless otherwise specified.
Refer to aviation.govt.nz/met for the Graphical NZ SIGWX (GNZSIGWX) user guide.
GRAFOR – Graphical Aviation Forecast
The low level Graphical Aviation Forecast (GRAFOR) aims to deliver information about flight conditions up to FL100 (SFC-FL100) in a more intuitive way.
These forecasts are mainly intended for planning and conducting VFR flying.
GRAFOR are issued twice a day as a set of three, covering a total period of 18 hours. The coast line of New Zealand and 15 NM envelope (adjusted over the Southern Taranaki Bight) that marks the forecast area coverage is displayed on the chart.
The fixed validity time is displayed on the chart. However, some of the elements cover three hours before and after to the fixed validity time. Amendments are issued if there are widespread weather conditions not corresponding to the forecast. In that case the abbreviation AMD is added to the chart caption.
Refer to aviation.govt.nz/met for the low level Graphical Aviation Forecast (GRAFOR) and Aviation Area Winds user guides.
GRAFOR example >>
21VFR MET

GE Gore
CY Clyde
AL Alps
PL Plains
KA Kaikouras
ST Straits
DV Dannevirke
MH Mahia
ED Edgecumbe
FN Far North
TA Tamaki
TK Te Kuiti
CP Central Plateau
SA Sanson
TN Tasman
WW Windward
FD Fjords
AAW – Aviation Area Winds
Aviation Area Winds are issued twice a day, along with GRAFOR. AAW will be in form of tables that correspond to the areas shown here. The wind forecast is provided for 1000 ft, 3000 ft, 5000 ft, 7000 ft and 10000 ft. A temperature forecast is also provided for 5000 ft, 7000 ft and 10000 ft.
All heights in AAW are in feet AMSL, and the temperatures are in degrees Celsius.
22

Rotor Rotorcloud
Mountain wave cloud
Wind
Lee wave cloud
zone
Before and during flightCloud base and visibility
You should be thinking about visible moisture all the time. Ask yourself the following questions about cloud base and visibility:
• Do I have reliable cloud base information?
• If I have to fly lower to remain clear of clouds, will terrain be a factor?
• If I do, how much ground clearance will I have?
• How much airspace do I have between the cloud base and the terrain along my route? Do I need to change my planned altitude?
• Will I be over mountainous terrain, where the weather can change rapidly?
• What visibility can I expect? Will it be affected by haze, showers, rain, etc?
• Given the speed of the aircraft, expected light conditions, terrain, cloud base and alternates available, are the reported and forecast visibility conditions sufficient for this trip?
• Are there conditions that could reduce visibility during the planned flight? Look for a small and/or decreasing temperature/dew point spread.
• Are cloud base and visibility values above my personal or club minimums?
Typical mountain wave and associated turbulence.
23VFR MET

Turbulence
Review wind conditions for departure aerodrome, the cruise, and destination. You will also need a mental picture of vertical wind profiles, so you can select the best altitude(s) for cruise flight, the best flight path to mitigate turbulence, and to determine whether wind shear is present.
Consider the wind direction and the effect terrain will have on the wind’s behaviour. A small angular change in the direction the wind is striking terrain can make a significant difference to turbulence, making it greater or lesser. Are the winds at departure and destination likely to be affected by a sea or land breeze?
Also take into account surface heating leading to convective turbulence. This will be particularly noticeable on warmer days. Some important questions about turbulence:
• Are the wind conditions at departure and destination aerodromes within the gust and crosswind capabilities of both you and your aircraft?
• What is the manoeuvring speed (VA) of your aircraft at the expected weight? Remember that VA is lower if you are flying at less than maximum gross weight.
• Is it a hot day with light winds? Beware of dust devils that can form in a location where the ground heats up more quickly relative to its surroundings – such as a sealed runway or a carpark, that is surrounded by cooler, grassy paddocks or a body of water.
Terrain avoidance
Know how low you can go without encountering terrain and/or obstacles. Consider a terrain avoidance plan for any flight that involves:
• weather at or below the mountain tops or ridge lines
• a temperature-dew point spread of 4 degrees Celsius or less
• any expected precipitation
• operating at night.
All visual navigation charts have MEFs (maximum elevation figures) in each quadrangle. They show thousands and hundreds of feet above mean sea level. The example shown is 4200 ft. The MEF is determined by locating the highest obstacle (natural or man-made) in each quadrangle, and rounding up to the nearest 100 feet.
Ensure your training has included terrain awareness or mountain flying if considering operating in the mountains. See the Mountain flying GAP booklet.
In addition, many GPS include a feature showing the minimum safe altitude, en-route safe altitude, or minimum en-route altitude, relative to the aircraft’s position. If you have access to such equipment, be sure you understand how to access and interpret the information about safe altitudes.
Most importantly, make sure any database that your GPS uses to convey safe altitudes is clearly maintained and certificated or approved by an aviation regulatory authority.
Reserve fuel
Knowing where to find good VFR weather doesn’t do you any good unless you have enough fuel to get there. Taking only minimum legal reserve fuel could significantly limit your options. More fuel means access to more alternatives.
Having plenty of fuel also spares you the worry (and distraction) of fearing fuel exhaustion when weather has already increased your cockpit workload.
24

The Fuel management GAP booklet has a lot of good information about fuel planning and management. Email [email protected] to request a copy.
Escape options
Always have some escape options. Know where you can find good weather that is within your aircraft range and endurance capability. Where is it? Which way do you turn to get there? How long will it take to get there?
Brief your passengers
There is a real danger in focusing on the gain of reaching your destination compared with the losses associated with not going, or turning back. For example, extra costs, missed appointments, disappointed passengers. Don’t fall into this trap – look for the gains from the alternative action – being alive and safe with an intact aircraft (with probably very relieved passengers).
For this reason, your weather planning should include briefing your passengers (and anyone waiting at your destination).
If you jointly plan for weather contingencies, and brief your passengers before you board the aircraft, you will be less vulnerable to the pressure to continue in deteriorating weather conditions.
Discuss the vagaries of light aircraft trips with your passengers, in particular:
• Departure and arrival times cannot be guaranteed – the weather may have other plans.
• The weight of baggage they can bring is limited – anything over the limit will be left behind.
• Turning back, taking an alternative route, or diverting, is always a possibility.
• What your contingency plans will be if you are delayed, diverted or have to cancel.
Excerpt from a visual navigation chart showing an MEF of 4200 ft.
25VFR MET

Inflight decision-making
There are many variables that can influence the successful outcome of any flight and hinder sound decision-making.
For example:
• the compressed time-frame when travelling at speed
• the changeable nature of the weather
• the challenges of a pilot’s own currency
• a homing pigeon-like instinct to return home.
These can and do undermine the decision-making process. Their combined pressure can grow with each passing minute and every drop of fuel consumed, all the while taxing the human mind.
In these situations, pilots need to be wary of complacency because it can negatively influence the decision-making process of even the most capable aviators. A common action that often leads to an accident is the determination to continue with a bad landing approach, rather than going around and setting up again.
As pilots, we gather information by scanning the environment, we understand information by comparing the information with our mental models, and we use those models to make decisions, take action and then importantly, review.
Learn from experienceAnother way to develop your weather experience and judgment is simply to observe and analyse the weather every day. Constant practice will help improve your judgement and interpretation skills.
When you look out the window or go outside, watch the clouds. What type of cloud are they? What are they doing? Why is the cloud base changing? This simple habit will help you develop the ability to ‘read’ clouds, and understand how nature, colour, thickness, cloud base and altitude can be valuable weather indicators, and help you anticipate and predict likely flying conditions.
As your cloud-reading skill develops, start trying to correlate the temperature, dew point, humidity, and time of day to the types of clouds that have formed. Take note of the wind and try to visualise how it wraps around a tree or whips around the corner of a building. This exercise will help you become more aware of wind at critical points in your flight.
After a challenging flight, you may want nothing more than to go home and unwind, but immediately after the flight is the best time to evaluate how good your weather decision-making was. Take a few minutes to mentally review the flight and reflect on what you learned from the experience to increase your weather
26

Rules of thumb
Local winds
New Zealand meteorology is strongly dominated by local wind effects, for example, anabatic winds (uphill), katabatic winds (downhill), sea and lake breezes, and venturi effects. Try and understand any effect that enhances a katabatic or anabatic wind, for example a sea or land breeze.
Monitor the surface wind – you never know when you might need to know it.
Forecast accuracy
A forecast is just that – it is not a guarantee. Apply some common sense and a margin to the forecast. The conditions could be better or worse than forecast.
If the forecast indicates bad weather is on the way, the issue may be one of timing rather than severity.
Pilot reports
Pilot reports are very useful, but underutilised. If you come across weather that is different from that forecast, and that can be better or worse, give an AIREP over the FISCOM frequency. You could be someone who benefits from another’s AIREP. Typically they include information on hazardous conditions like windshear or turbulence.
27VFR MET

QNH changes
Rapid decreases in QNH, either actual or forecast, normally mean strong winds and bad weather is on the way. A rapid increase can indicate an imminent improvement.
Similarly, a significant QNH difference between two near locations normally means strong winds.
Temperature – dew point split
The temperature/dew point difference (split) is an indication of the amount of water vapour in the air.
When they are the same or close, it normally means low cloud/fog/precipitation. The smaller the split, the lower the cloud base. Pay particular attention late in the day when temperatures can drop rapidly, especially in winter.
2000 ft wind
The 2000 ft wind is a good indicator of the gradient flow. A significant difference between the surface wind and the 2000 ft wind can indicate local wind effects, possible turbulence, and possible windshear.
True or magnetic
Make sure you know which reports and forecasts use degrees true, and which use degrees magnetic to report wind direction. As a general rule, anything provided directly by an air traffic controller will be in magnetic.
28

//1 Weather not detected due sensor temporarily inoperative
///1 Cloud is detected (unable to determine TCU/CB)
////1 Visibility not reported due faulty sensor
/////////1 Cloud not reported due faulty sensor
– Light
(blank space)
Moderate (when included before a weather phenomenon)
+ Heavy
9999 Visibility 10KM or more
AAW Aviation Area Winds
ABT About
ABV Above
AC Altocumulus
AD QNH Aerodrome QNH forecast
AFT After
AGL Above ground level
AIP Aeronautical Information Publication
AIREP Routine air report from aircraft in flight
AIREP SPECIAL
Special (non-routine) air report from aircraft in flight
AMD Amended
AMSL Above mean sea level
APRX Approximate
AS Altostratus
AT At
ATIS Automatic terminal information service
ATS Air traffic services
AWIB Aerodrome and weather information broadcast
AWS Automatic weather station (produces METAR AUTO)
BASE Cloud base
BC Patches
BDRY Boundary
BECMG Becoming
BFR Before
BKN Broken (5–7 oktas)
BL Blowing
BLDG Building
BLW Below
BR Mist (1000–5000 M vis)
BTN Between
BWR Basic weather report
CAT Clear air turbulence
CAVOK2 Cloud and visibility OK
CB Cumulonimbus
CLD Cloud
CLR Clear
CNL Cancel
CONS Continuous
COR Corrected
COT At the coast
CU Cumulus
DP Dew point temperature
DR Low drifting
DS Dust storm
DTG Date time group
DTRT Deteriorating/deteriorate
DU Dust
DZ Drizzle
EMBD Embedded
EST Estimated
EXC Except
MET abbreviations
29VFR MET

EXTD Extended or extending
FC Funnel cloud
FCST Forecast
FEW Few (1–2 oktas)
FG Fog (visibility less than 1000 M)
FIR Flight information region
FISB Flight information service broadcast
FL Flight level
FM From
FRQ Frequent
FU Smoke
FZ Freezing
FZL Freezing level
G Gusts
GNZSIGWX Graphical NZ significant weather
GR Hail (5 mm or more)
GRAFOR Graphical aviation forecast
GS Small hail (smaller than 5 mm)
GSM Graphical SIGMET Monitor
HVY Heavy
HZ Haze (visibility less than 5000 M)
ICAO International Civil Aviation Organization
ICE Icing
IFR Instrument flight rules
IMC Instrument meteorological conditions
IMPR Improving
INTSF Intensifying
ISOL Isolated
KM Kilometres
KT Knots
LAN Inland
LCA Local/locally/location/located
LYR Layer
M Metres
MAX Maximum
METAR Aerodrome routine meteorological report
METAR AUTO
Automatic aerodrome routine meteorological report
MI Shallow
MOD Moderate
MOV Moving
MS Minus
MT Mountain
MTW Mountain waves
NC No change
NCD1 No cloud detected below 10,000 ft
NM Nautical miles
NOSIG No significant change
NOTAM Notice to airmen
NS Nimbostratus
NSC2 No significant cloud
NSW Nil significant weather
NXT Next
NZZC New Zealand FIR
NZZO Auckland Oceanic FIR
OBS Observed
OBSC Obscured
OCNL Occasional
OPMET Operational meteorological information
OVC Overcast (8 oktas)
PIREP Pilot report (AIREP)
PL Ice pellets
PO Dust/sand whirls
PR Partial
PROB Probability
PS Plus
PSN Position
30

Q QNH
QNH Altimeter sub-scale setting
R Runway
RA Rain
RDOACT Radioactive
RDOACT CLD Radioactive cloud
RE Recent
RMK Remark
ROFOR Route forecast
RVR Runway visual range
SA Sand
SC Stratocumulus
SCT Scattered (3–4 oktas)
SECT Sector
SEV Severe
SFC Surface
SG Snow grains
SH Shower
SIG Significant
SIGMET Significant meteorological information
SIGWX Significant weather forecast
SKC3 Sky clear (no cloud at all)
SN Snow
SPECI Aerodrome special meteorological report
SQ Squall
SQL Squall line
SS Sandstorm
ST Stratus
STNR Stationary
SWX Space weather
T Temperature, in degrees Celsius
TAF Aerodrome forecast
TC Tropical cyclone
TCU Towering cumulus
TEMPO Temporarily
TL Till
TREND Trend forecast
TS Thunderstorm
TURB Turbulence
UP Unidentified precipitation
UTC Coordinated Universal Time
V Variations from mean wind direction
VA Volcanic ash
VAA Volcanic Ash Advisory
VAAC Volcanic Ash Advisory Centre
VAG Volcanic Ash Graphic
VAL In valleys
VC Vicinity of the aerodrome
VCY Vicinity
VFR Visual flight rules
VIS Visibility
VMC Visual meteorological conditions
VRB Variable
VV Vertical visibility
WI Within
WKN Weakening
WDSPR Widespread
WS Windshear
WX Weather
Z Coordinated Universal Time
1 used in METAR AUTO only
2 only used in TREND/TAF for NZAA, NZWN, NZCH
3 not used in METAR AUTO or TAF/TREND for NZAA, NZWN, NZCH
31VFR MET
PO Box 3555 Wellington 6140
Tel: +64 4 560 9400 Fax: +64 4 569 2024
Email: [email protected]
See the CAA website for Civil Aviation Rules, advisory circulars, airworthiness directives,
forms, and more safety publications.
To request publications such as GAPs and posters email: [email protected].
aviation.govt.nz
VFR MET was revised in June 2021.