vgv optimization for performance - lu
TRANSCRIPT

VGV optimization for performance
Sara Ling and Ted Sönne
Thesis for the Degree of Master of Science
Division of Thermal Power EngineeringDepartment of Energy SciencesFaculty of Engineering, LTHLund UniversityP.O. Box 118SE-221 00 LundSweden
VGV optimization for performance
Thesis for the Degree of Master of Science
Division of Thermal Power Engineering
Department of Energy SciencesBy
Sara LingTed Sönne
LUNDUNIVERSITY
May 2014Master Thesis
Department of Energy SciencesLund Institute of Technology
Lund University, Sweden

i
AbstractToday’s market for gas turbines is very competitive and it is important to constantly improvethe performance of the engines. It is commonly known that gas turbines have betterperformance at low ambient temperatures than at high ambient temperatures. One way tocounteract the negative influence of a high ambient temperature is to use variable compressorguide vanes. The aim of this thesis is to evaluate the potential of using another way to controlthese variable guide vanes to enhance the performance of gas turbines at high ambienttemperatures. This is done by modelling and calculations complemented with interviews anddiscussions with employees at Siemens Industrial Turbomachinery.
This master thesis consists of several studies that together form a foundation to build animproved control algorithm from. In the first study of this thesis the compressor turbineperformance at different physical shaft-speeds is evaluated. The second study shows how thegas turbines react when the ambient temperature is varied. In the third study the variableguide vanes are altered to find the most suitable way to control them. The fourth study studiesthe most promising positions, from the third study, with consideration to the effects from thesecondary air system. The fifth study shows how the engine would react to a more openedposition of the variable guide vanes when running at part load. In the final study of thisthesis, separate controlling of the inlet guide vane and the first stator is evaluated to see if itcould increase the performance for SGT-700. In this thesis the effects on surge margin andengine lifespan, as the variable guide vane positions are altered, are also evaluated.
Based on the results in this master thesis SGT-700 is concluded to be running at optimalvariable guide vane settings at the tested ambient temperatures. The test of using separateactuators for the inlet guide vane and stator 1 did not result in any improved performance.
The results show that SGT-750 could gain from a more opened position at high ambienttemperatures when running on full load. The most promising case at 30°C is an opening ofthe inlet guide vane of 2.5° relative to today’s existing position. This results in an increase inshaft power of 0.5% and an increase in thermal efficiency of 0.1%. The most promising caseat 45°C is an opening of the inlet guide vane of 4° relative to today’s existing position. Thisresults in an increase in shaft power of nearly 2.9% and an increase in thermal efficiency of1.1%.
At part load the results show that SGT-750 will benefit from running at a more openedposition as long as the aerodynamic shaft-speed is low. As the aerodynamic shaft-speed isincreased, the part load performance does no longer benefit from running at a more openedposition of the variable guide vanes.
Using these new variable guide vane positions will lead to a decreased surge margin but thedecrease in surge margin is considered acceptable. The proposed changes will lead to lowerphysical shaft-speeds thus lowering the centrifugal stresses. The lowered stresses are positivebut will not result in longer service intervals.

ii
Based on the results in this master thesis the recommendation is that further time andresources are devoted to find an improved control algorithm for SGT-750. The biggestpotential of improvement is found for engines running at full load at high ambienttemperatures. It is also recommended that further investigation is done into the possibility touse a more opened position at part load.

iii
AcknowledgmentsThis master thesis has been performed at Siemens Industrial Turbomachinery AB inFinspång. It marks the end of our five year education in mechanical engineering at LundsUniversity.
We would especially like to thank our supervisor at Siemens, Kerstin Tageman, for all helpand guidance throughout our work with this thesis. It has been nice to have someone that cananswer all questions, from the trickiest to the silliest ones. We would also like to thank ourgroup manager, Lennart Näs who gave us the opportunity to do this study, and the entire RPPdepartment for giving us such a warm welcome. Many employees at Siemens have helped usduring this thesis and we thank them all. An extra thank to Sven Axelsson and Ken Flydalenfor all the time they have devoted to helping us and explaining this difficult topic.
We would also like to thank our supervisor at Lunds University, Magnus Genrup, who cameup with the idea behind this master thesis and helped us with the first contact with Siemens.He is also the person who introduced us to the interesting world of gas turbines and gave usthe tools to be a part of it. We would also like to thank Marcus Thern for his help with thestructure and design of our report. During our education we have had the pleasure to meetmany good teachers and we would like to thank them all.
A final thank to our families and loved ones for all support.
Sara Ling Ted Sönne
Finspång 2014-04-09

iv
Contents1 INTRODUCTION ........................................................................................................................................ 1
1.1 SIEMENS INDUSTRIAL TURBOMACHINERY AB ................................................................................... 11.2 BACKGROUND .................................................................................................................................. 11.3 OBJECTIVES ..................................................................................................................................... 2
1.3.1 Problem definition ....................................................................................................................... 21.4 LIMITATIONS .................................................................................................................................... 31.5 METHODOLOGY ............................................................................................................................... 31.6 OUTLINE OF THE THESIS .................................................................................................................... 5
2 THEORY ..................................................................................................................................................... 7
2.1 GAS TURBINE CONFIGURATION ......................................................................................................... 72.1.1 Single-shaft and twin-shaft engines .............................................................................................. 7
2.2 VELOCITY TRIANGLES ...................................................................................................................... 72.3 INCIDENCE ....................................................................................................................................... 82.4 DIMENSIONLESS PARAMETERS ........................................................................................................ 112.5 STAGNATION PROPERTIES ............................................................................................................... 11
2.5.1 Stagnation enthalpy ................................................................................................................... 112.5.2 Stagnation temperature.............................................................................................................. 112.5.3 Stagnation pressure ................................................................................................................... 12
2.6 COMPRESSOR CHARACTERISTIC ...................................................................................................... 122.7 COMPONENT MATCHING ................................................................................................................. 14
2.7.1 Assumptions of turbines in series ............................................................................................... 152.7.2 Calculations for twin-shaft gas turbine with unchoked PT .......................................................... 172.7.3 Calculations for twin-shaft gas turbine with choked PT .............................................................. 202.7.4 Running line .............................................................................................................................. 20
2.8 VARIABLE PT GEOMETRY ............................................................................................................... 212.9 CORRELATION BETWEEN GAS TURBINE PARAMETERS ....................................................................... 22
2.9.1 Gas turbine performance predictions from characteristics .......................................................... 222.9.2 Humidity’s effect on density and mass flow ................................................................................ 232.9.3 Temperature’s effect on density .................................................................................................. 242.9.4 Physical shaft-speed’s effects on lifespan ................................................................................... 24
2.10 SURGE MARGIN .............................................................................................................................. 242.11 SAS ............................................................................................................................................... 25
3 THE STUDIED GAS TURBINES ............................................................................................................. 27
3.1 SGT-700........................................................................................................................................ 273.2 SGT-750........................................................................................................................................ 27
4 MAPPING OF POTENTIAL .................................................................................................................... 29
4.1 SGT-700........................................................................................................................................ 294.1.1 15°C .......................................................................................................................................... 294.1.2 30°C .......................................................................................................................................... 304.1.3 45°C .......................................................................................................................................... 31
4.2 SGT-750........................................................................................................................................ 324.2.1 15°C .......................................................................................................................................... 324.2.2 30°C .......................................................................................................................................... 334.2.3 45°C .......................................................................................................................................... 34
4.3 SUMMARY...................................................................................................................................... 35
5 ANALYSIS OF EFFECTS FROM AMBIENT TEMPERATURE........................................................... 37
v
5.1 SGT-700........................................................................................................................................ 385.2 SGT-750........................................................................................................................................ 435.3 SUMMARY...................................................................................................................................... 48
6 ANALYSIS OF EFFECTS FROM DIFFERENT VGV-POSITIONS ...................................................... 49
6.1 SGT-700........................................................................................................................................ 496.1.1 30°C .......................................................................................................................................... 496.1.2 45°C .......................................................................................................................................... 50
6.2 SGT-750........................................................................................................................................ 516.2.1 30°C .......................................................................................................................................... 516.2.2 45°C .......................................................................................................................................... 53
6.3 SUMMARY...................................................................................................................................... 54
7 EVALUATION OF HOW PHYSICAL SHAFT-SPEED AFFECTS LIFESPAN .................................... 56
7.1 SGT-700........................................................................................................................................ 567.2 SGT-750........................................................................................................................................ 567.3 SUMMARY...................................................................................................................................... 56
8 ANALYSIS OF EFFECTS FROM ALTERED PRESSURE LEVELS IN THE SAS .............................. 58
8.1 SGT-700........................................................................................................................................ 588.1.1 30°C .......................................................................................................................................... 598.1.2 45°C .......................................................................................................................................... 60
8.2 SGT-750........................................................................................................................................ 618.2.1 30°C .......................................................................................................................................... 628.2.2 45°C .......................................................................................................................................... 63
8.3 SUMMARY...................................................................................................................................... 65
9 ANALYSIS OF SURGE MARGIN ........................................................................................................... 67
9.1 NUMERICAL SURGE MARGIN ........................................................................................................... 679.1.1 30°C .......................................................................................................................................... 679.1.2 45°C .......................................................................................................................................... 69
9.2 SUMMARY...................................................................................................................................... 70
10 ANALYSIS OF THE PERFORMANCE AT PART LOAD ..................................................................... 72
10.1 99.2% OF AERODYNAMIC SHAFT-SPEED AT DESIGN POINT................................................................. 7210.2 97.7% OF AERODYNAMIC SHAFT-SPEED AT DESIGN POINT................................................................. 7310.3 SUMMARY...................................................................................................................................... 74
11 ANALYSIS OF EFFECTS FROM SEPARATE CONTROLLING OF IGV AND FIRST STATOR ..... 76
11.1 EVALUATION OF EFFECTS FROM DIFFERENT ANGLES ........................................................................ 7611.1.1 IGV-angle -2.5° ..................................................................................................................... 7611.1.2 IGV-angle 0° ......................................................................................................................... 7711.1.3 IGV-angle 2.5° ...................................................................................................................... 7811.1.4 IGV-angle 5° ......................................................................................................................... 78
11.2 EVALUATION OF EFFECTS FROM THE SECONDARY AIR SYSTEM.......................................................... 7911.2.1 IGV-angle -2.5° ..................................................................................................................... 8011.2.2 IGV-angle 0° ......................................................................................................................... 8111.2.3 IGV-angle 2.5° ...................................................................................................................... 8211.2.4 IGV-angle 5° ......................................................................................................................... 83
11.3 SUMMARY...................................................................................................................................... 84
12 CONCLUSIONS ........................................................................................................................................ 86
13 FUTURE DEVELOPMENTS AT SIEMENS INDUSTRIAL TURBOMACHINERY AB ...................... 88

vi
14 BIBLIOGRAPHY ...................................................................................................................................... 89
APPENDIX A EVALUATION OF SURGE MARGIN DURING OPERATION ........................................ 91
APPENDIX B SUGGESTIONS FOR IMPROVED CONTROLLING OF THE VGVS ............................. 92
B - 1 ALTERNATIVE 1 ............................................................................................................................. 92B - 2 ALTERNATIVE 2 ............................................................................................................................. 93B - 3 ALTERNATIVE 3 ............................................................................................................................. 93
APPENDIX C EVALUATION OF TURBINE EFFICIENCY IN DIFFERENT PROGRAMS ................. 95
vii
NomenclatureAbbreviations
CT Compressor turbine
IGV Inlet guide vane
PT Power turbine
S1 First stator
SAS Secondary air system
SIT Siemens Industrial Turbomachinery
STAL Svenska Turbinfabriksaktiebolaget Ljungström
TIT Turbine inlet temperature
VGV Variable guide vane
Latin
A Area
cp Specific heat capacity at constant pressure
cv Specific heat capacity at constant volume
C Absolute velocity
h Enthalpy
i Incidence
m Mass flow
N Rotational speed
p Pressure
PR Pressure ratio
R Gas constant
RH Relative humidity
SM Surge margin

viii
T Temperature
U Blade velocity
W Relative velocity
Greek
Absolute flow angle
Absolute blade angle
Relative flow angle
Ratio of specific heats
Efficiency
ρ Density
υ Specific volume
Subscripts
0 Stagnation
1, 2, 3, etc. Reference planes
a Ambient
c Compressor
CT Compressor turbine
g Gas (out of the combustion chamber)
m Mechanical
op Operational point
S Surge
1
1 Introduction
1.1 SiemensIndustrialTurbomachineryABIn 1913 the two brothers Birger and Fredrik Ljungström founded the company SvenskaTurbinfabriksaktiebolaget Ljungström (STAL) in Finspång. Already during their first year theyreceived an order for a steam turbine from London. About 40 years later STAL manufacturedtheir first gas turbine (Siemens Industrial Turbomachinery AB, 2013).
In the late 1950s STAL merged with AB de Laval Ångturbin, who had been manufacturingturbines since the late 1900s and held a lot of patents, forming STAL-LAVAL Turbin AB.During the following years the company changed owner and name several times until 2003 whenSiemens acquired the company and formed Siemens Industrial Turbomachinery (SIT) AB(Siemens Industrial Turbomachinery AB, 2013). Today SIT employs about 2800 persons(Siemens Industrial Turbomachinery AB, 2009).
The gas turbines designed in Finspång are SGT-500, SGT-600, SGT-700, SGT-750 and SGT-800 (Siemens AG, 2013). SGT-750 is the newest gas turbine designed in Finspång, launchedofficially in November 2010 (Siemens AG, 2014). Gas turbines made in Finspång can be foundin over 100 different countries all over the world (Siemens Industrial Turbomachinery AB,2013).
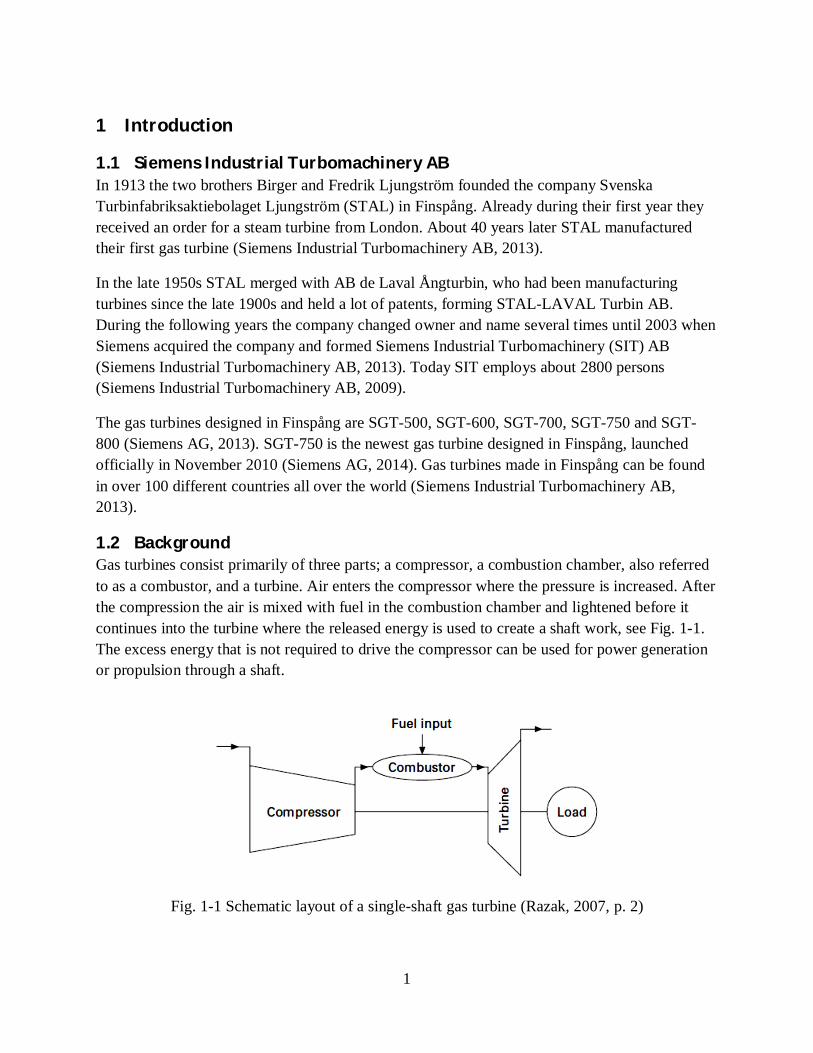
1.2 BackgroundGas turbines consist primarily of three parts; a compressor, a combustion chamber, also referredto as a combustor, and a turbine. Air enters the compressor where the pressure is increased. Afterthe compression the air is mixed with fuel in the combustion chamber and lightened before itcontinues into the turbine where the released energy is used to create a shaft work, see Fig. 1-1.The excess energy that is not required to drive the compressor can be used for power generationor propulsion through a shaft.
Fig. 1-1 Schematic layout of a single-shaft gas turbine (Razak, 2007, p. 2)

2
The performance of a gas turbine is dependent on the properties of the ambient air that is drawninto the compressor. When designing a gas turbine the ambient conditions must be estimated.Whenever the gas turbine runs on conditions not matching the design conditions it is said to berunning off-design. A gas turbine running off-design often lacks in performance compared towhen running under design conditions.
SIT sells gas turbines all over the world and the conditions on site vary from place to place,especially the ambient temperature. High ambient temperature will lead to a decrease inefficiency and power output of the engine (Brun & Kurz, 2000, p. II-2-8). A way to compensatefor the loss in efficiency would be desirable, not only for the economical aspect but also for thesake of our environment. An increase in thermal efficiency will lead to lower emissions ofcarbon dioxide which is important to reduce global warming.
When the ambient temperature increases the compressor aerodynamic shaft-speed will decrease,thereby disturbing the flow in both the compressor and the turbine. One way to control the shaft-speed is by using variable guide vanes (VGVs) to control the intake area and air velocity.
The VGVs consist of several rows, starting with the inlet guide vanes (IGVs) and thereaftercontinuing with variable stators in the first stages of the compressor. The rows are oftencontrolled by one single armature but it may also be possible to control each row separately toachieve an even better performance.
1.3 ObjectivesThe purpose of this thesis is to analyse the potential of having a more advanced control algorithmof the VGVs to obtain an enhanced gas turbine performance. The focus will be on improvementsat SIT’s gas turbines SGT-700 and SGT-750 at high ambient temperatures.
1.3.1 ProblemdefinitionThe following questions will be analysed and answered in this thesis:
· Is there a potential for enhanced performance when altering the VGVs at high ambienttemperatures? What will be the impact on SGT-700 and SGT-750?
If there is a potential improvement the following question will be investigated:
· What will be needed to assure surge margin?
If there is no potential improvement the following question will be investigated:
· Is there a potential for enhanced performance by having different actuators for thedifferent VGVs?

3
1.4 LimitationsMany parameters are affected in the gas turbine when the position of the VGVs is altered. Toinvestigate them all would be too extensive for this thesis and therefore some limitations areestablished. The following areas will not be investigated:
· Emission tuning with VGV· Lifing detailed analysis· Detailed control description· Transient analysis· Other gas turbine models than SGT-700 and SGT-750· Arctic and normal matched gas turbines
1.5 MethodologyThe methodology chosen for this thesis is modelling since there is not enough published materialto only do a mapping of existing knowledge. In addition the resources and time are not sufficientto support experimental studies. Gathered information from a literature survey along withinterviews with employees at SIT has been used as a complement and validation of the results.Several in-house programs have been used for the modelling.
GTPerform is used to model the performance of the complete gas turbine. Since the compressorcharacteristic is sensitive to VGV-position, GTPerform is not sufficient to model the compressorif the VGV-position is altered. The same applies for the turbines if the ratios of the secondary airsystem (SAS) flow are altered.
HT0300 is used to model the compressor. HT0300 does not have the ability to estimate theimpact on the complete cycle. Therefore an iterative process is needed using GTPerform toestimate the behaviour of the complete cycle and thereafter transferring the data as input toHT0300, where the compressor behaviour can be estimated. The results are then taken back toGTPerform to correct the behaviour of the compressor and rerun the evaluation of the cycle. Thissequence will be continued until convergence is reached resulting in a good estimate of thecompressor behaviour and the performance of the total cycle.
Merlin is used as a user interface coupling and handling the data transfer between 2ndFlow andMAC 1/Beta2. 2ndFlow is used to calculate the behaviour of the SAS as the pressure in thecompressor changes due to different VGV-positions. MAC 1/Beta 2 is used to calculate the flowin the compressor turbine (CT) and power turbine (PT). The difference between the twoprograms is that MAC1 performs mean line calculations while Beta2 performs the calculations intwo dimensions. Beta2 is more accurate but the calculation time is larger compared to usingMAC1. Merlin is used to scale the parameters correctly between 2ndFlow and MAC1/Beta2 andcombining them into an iterative loop. The iteration loop using MAC1 is shown in Fig. 1-2.

4
Fig. 1-2 Description of the iteration loop between MAC 1 and 2ndFlow. Merlin works as a userinterface between the two programs, scaling, handling data and presenting the results in a user
friendly way (Flydalen, 2011, p. 44)
This thesis will be focusing on two hypotheses:
· An opening of the VGVs is a suitable way to reduce physical shaft-speed and enhancecompressor efficiency without having a clearly negative impact on the total gas turbineperformance or loosing sufficient surge margin
· A closing of the VGVs is a suitable way to enhance CT efficiency without having aclearly negative impact on the total gas turbine performance or endangering the lifespanof the gas turbine
The hypotheses will be tried by testing and modelling in several programs provided by SIT. Fourcases will be analysed for each gas turbine. The cases are full load and part load, at 75% of fullload, at ambient temperatures of 30 and 45°C. As soon as one hypothesis can be proven false forone case, the hypothesis will no longer be tested for that case. Table 1-1 shows a hypothesismatrix that will be updated at the end of every chapter, starting from chapter 4, until allhypotheses are proven either true or false. The aim with this hypothesis matrix is to get a quickoverview of the status of each hypothesis. As a hypothesis is proven false or true it is denotedwith an F for false or a T for true. Hypothesis still under investigation will be denoted with thenotation u.i.

5
Table 1-1 Hypothesis matrix showing the progress for each hypothesis. A hypothesis proven truewill be denoted by a T and a hypothesis proven false will be denoted by an F. Hypothesis under
investigation will be denoted u.i.
30°C/100% 45°C/100% 30°C/75% 45°C/75%SGT-750/Open u.i. u.i. u.i. u.i.SGT-750/Close u.i. u.i. u.i. u.i.SGT-700/Open u.i. u.i. u.i. u.i.SGT-700/Close u.i. u.i. u.i. u.i.
1.6 OutlineofthethesisChapter 2 covers the theory needed to understand the results presented in latter chapters. Thereader is assumed to have basic knowledge of thermodynamics, aerodynamics and gas turbineperformance. The most basic theory is therefore explained shortly or excluded.
Chapter 3 gives a description of the two gas turbines this thesis focuses on, SGT-700 and SGT-750. Here the specific models are described briefly to give the reader a basic understanding ofhow these gas turbines are designed.
Starting from chapter 4 and ending at chapter 8 the chapters follow the same structure. Eachchapter starts with a general introduction to the analysis and is thereafter divided into threesections. The first section presents the results for SGT-700, the second section presents theresults for SGT-750 and the third section contains a summary and a comparison of the resultsfrom the two earlier sections.
Chapter 4 contains a mapping of the CT efficiency as a function of physical shaft-speed for thetwo engines. The mapping is done using GTPerform. Since the VGV-position is controlled bythe aerodynamic shaft-speed in GTPerform, which is coupled to the physical shaft-speed, thismapping can be seen as a mapping of the CT efficiency as a function of VGV-position. Thesections presenting the results for each gas turbine model are further divided into two parts, onefor each temperature.
Chapter 5 contains an evaluation of how the ambient temperature affects the gas turbineperformance. Since the two gas turbines control the VGV-position as a function of aerodynamicshaft-speed it is important to distinguish the effects that occur due to pure physics from thoseoccurring due to the control of the VGVs. In this evaluation GTPerform and HT0300 are used inan iterative process to evaluate the performance at different operating conditions as the VGVsare kept at a fixed position.
In chapter 6 several different VGV-positions are tested for ambient temperatures of 30 and 45°C.Both opening and closing relative to today’s existing position is tested to distinguish the caseswith potential. In this analysis GTPerform and HT0300 are used in an iterative process.
Chapter 7 contains an analysis of how the physical shaft-speed affects the lifespan of the two gasturbine models. The conclusions are drawn based on interviews with employees at SIT.

6
Chapter 8 contains an analysis of how the SAS flow is affected by the new VGV-positions andhow the new SAS flow affects the gas turbine performance. In this analysis GTPerform andMerlin are used in an iterative process. The results are then verified by running HT0300.
Chapter 9 contains an analysis of how the surge margin is affected by the new VGV-positions.HT0300 is used to estimate the numerical surge margin and to estimate the pressure ratios in thecompressor stages.
In chapter 10 the proposed VGV-positions are tested at part load. This gives the possibility to seeif the proposed control algorithm can be used with the aerodynamic shaft-speed as the only input.This study is performed through an iterative process between GTPerform and Merlin.
Chapter 11 contains an analysis of how separate controlling of the IGV and stator 1 (S1) affectsthe performance for SGT-700 at 30°C. The chapter is divided into two sections. In the firstsection several combinations of angles are tested using HT0300 and GTPerform withoutconsidering the effects from SAS. In the second section the most promising combinations areevaluated using Merlin and GTPerform to catch the effects from SAS.
Chapter 12 contains conclusions and recommendations. Chapter 13 contains some guidelines forfuture work at SIT. The bibliography is presented in chapter 14.
This master thesis contains three appendixes. Appendix A contains a discussion about new waysto measure surge margin during operation. Appendix B contains three suggestions for animproved control algorithm based on the results in this master thesis. Appendix C discusses howthe CT efficiency is evaluated in GTPerform and Merlin as the ambient temperature and physicalshaft-speed is altered.
7
2 Theory
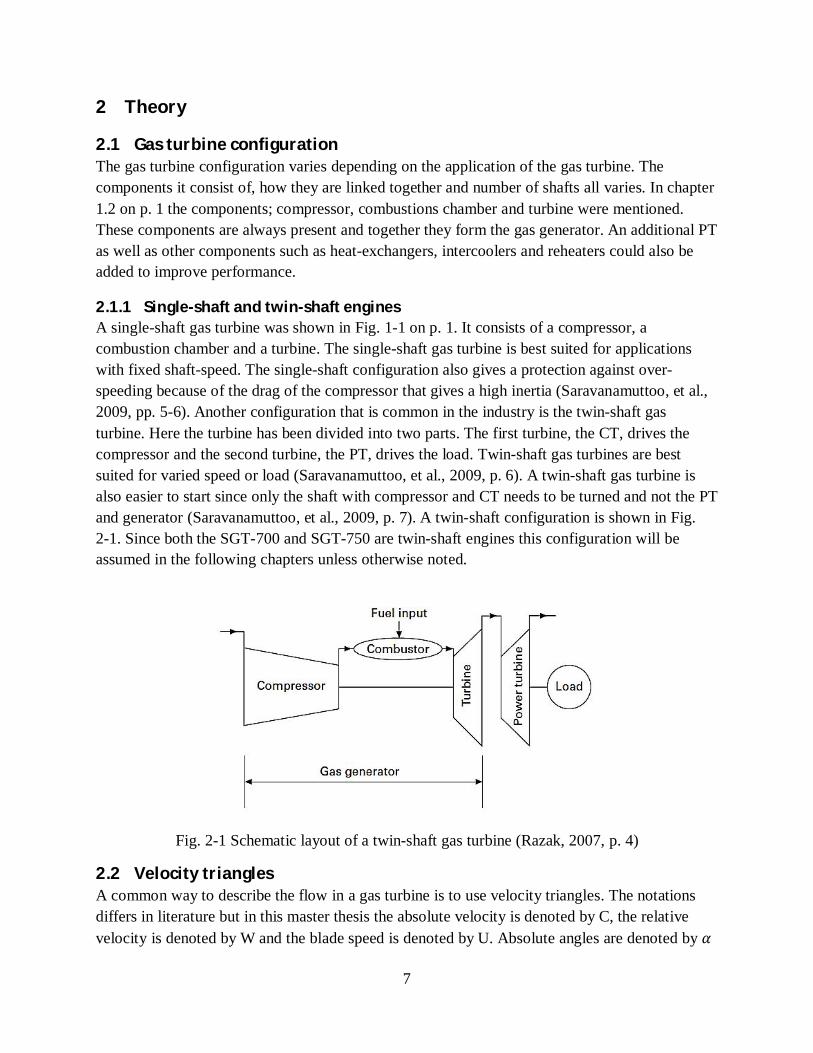
2.1 GasturbineconfigurationThe gas turbine configuration varies depending on the application of the gas turbine. Thecomponents it consist of, how they are linked together and number of shafts all varies. In chapter1.2 on p. 1 the components; compressor, combustions chamber and turbine were mentioned.These components are always present and together they form the gas generator. An additional PTas well as other components such as heat-exchangers, intercoolers and reheaters could also beadded to improve performance.
2.1.1 Single-shaftandtwin-shaftenginesA single-shaft gas turbine was shown in Fig. 1-1 on p. 1. It consists of a compressor, acombustion chamber and a turbine. The single-shaft gas turbine is best suited for applicationswith fixed shaft-speed. The single-shaft configuration also gives a protection against over-speeding because of the drag of the compressor that gives a high inertia (Saravanamuttoo, et al.,2009, pp. 5-6). Another configuration that is common in the industry is the twin-shaft gasturbine. Here the turbine has been divided into two parts. The first turbine, the CT, drives thecompressor and the second turbine, the PT, drives the load. Twin-shaft gas turbines are bestsuited for varied speed or load (Saravanamuttoo, et al., 2009, p. 6). A twin-shaft gas turbine isalso easier to start since only the shaft with compressor and CT needs to be turned and not the PTand generator (Saravanamuttoo, et al., 2009, p. 7). A twin-shaft configuration is shown in Fig.2-1. Since both the SGT-700 and SGT-750 are twin-shaft engines this configuration will beassumed in the following chapters unless otherwise noted.
Fig. 2-1 Schematic layout of a twin-shaft gas turbine (Razak, 2007, p. 4)
2.2 VelocitytrianglesA common way to describe the flow in a gas turbine is to use velocity triangles. The notationsdiffers in literature but in this master thesis the absolute velocity is denoted by C, the relativevelocity is denoted by W and the blade speed is denoted by U. Absolute angles are denoted by
8
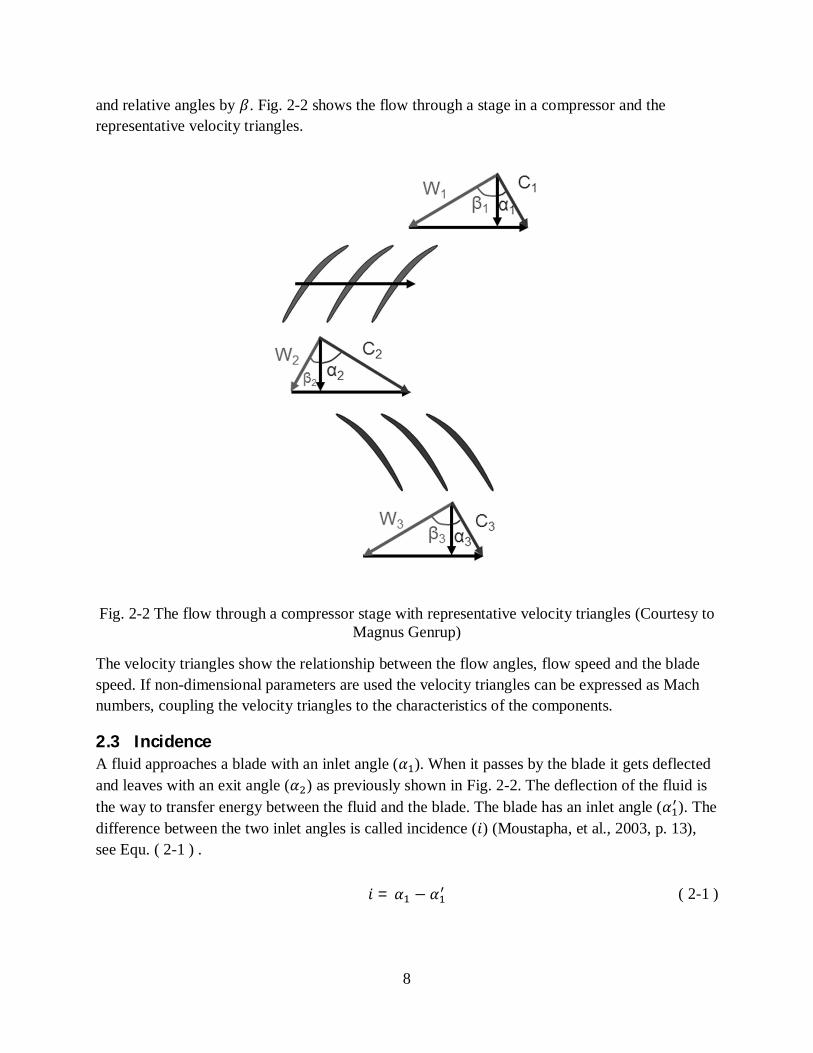
and relative angles by . Fig. 2-2 shows the flow through a stage in a compressor and therepresentative velocity triangles.
Fig. 2-2 The flow through a compressor stage with representative velocity triangles (Courtesy toMagnus Genrup)
The velocity triangles show the relationship between the flow angles, flow speed and the bladespeed. If non-dimensional parameters are used the velocity triangles can be expressed as Machnumbers, coupling the velocity triangles to the characteristics of the components.
2.3 IncidenceA fluid approaches a blade with an inlet angle ( ). When it passes by the blade it gets deflectedand leaves with an exit angle ( ) as previously shown in Fig. 2-2. The deflection of the fluid isthe way to transfer energy between the fluid and the blade. The blade has an inlet angle ( ). Thedifference between the two inlet angles is called incidence ( ) (Moustapha, et al., 2003, p. 13),see Equ. ( 2-1 ) .
= − ( 2-1 )

9
Fig. 2-3 Schematic sketch of the definition of incidence
Fig. 2-3 shows a schematic sketch of the definition of incidence. If the incidence differs from thedesign value it might lead to separation in the boundary layers of the blades and in the worst casecause stall or surge. It is therefore crucial to keep the incidence within acceptable levels. Arotating blade will not see the actual velocity but the relative velocity. Here the incidence isdefined as the difference in relative flow angle ( ) and (Moustapha, et al., 2003, p. 13). Therotational speed is affecting the velocity angles and thereby the performance of the engine.
The angle of the fluid is determined by the ratio between the axial component and the swirlcomponent of the fluid. As the shaft-speed varies the swirl component of the relative velocitywill vary as well. One way to counteract this is to vary the VGV-position thereby adding orremoving swirl, keeping the incidence at design level. With the VGVs it is also possible to affectthe shaft-speed thus counteracting the influence of other parameters, for example the ambienttemperature. The velocity profile will vary over the height of the blade leading to a variation of
along the blade height. The blades are twisted along the height to compensate for this andkeep the incidence at acceptable levels at all radii.
Another phenomenon that affects the losses due to incidence is the Mach number. The relationbetween the Mach number and the incidence interval that the compressor can work in withouttoo big losses is shown in Fig. 2-4. As can be seen in this figure the incidence interval that givesa predefined loss coefficient gets smaller and the minimum loss increases as the Mach numberincreases. The Mach number decreases as the temperature rises due to the increase in speed ofsound. This implies that the last stages of a compressor have lower Mach number and therefore abigger incidence interval to work in than the first stages (Saravanamuttoo, et al., 2009, pp. 254-255).
10
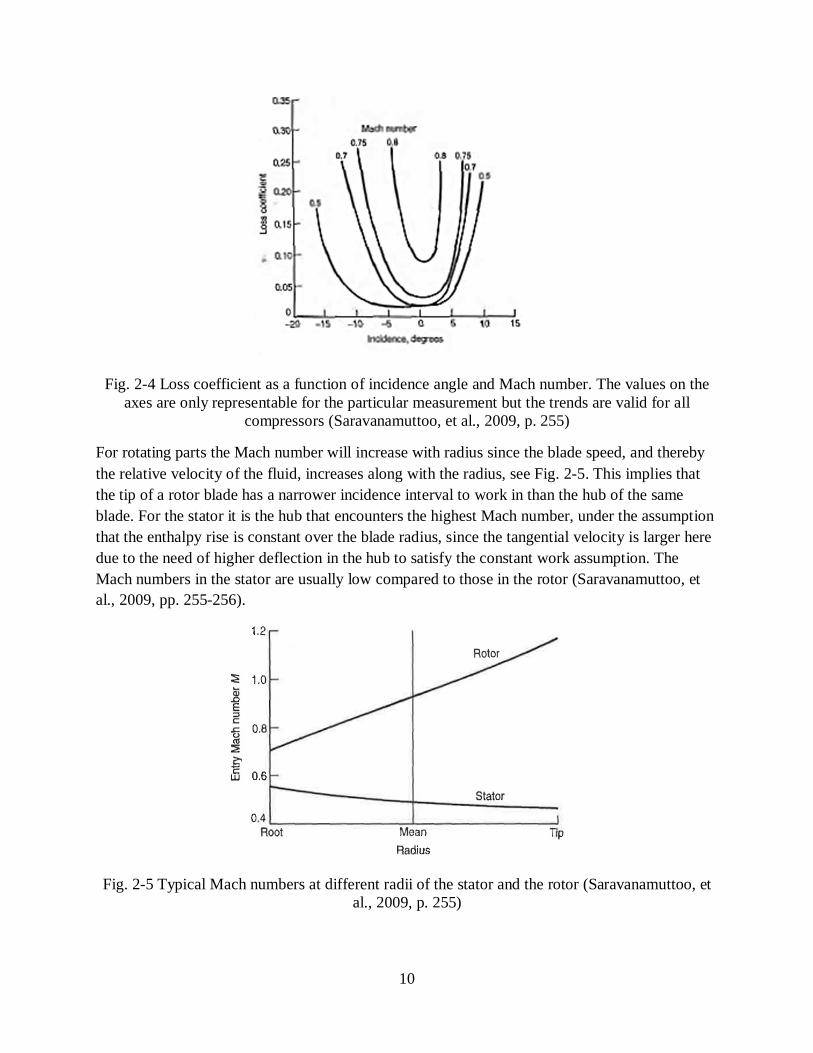
Fig. 2-4 Loss coefficient as a function of incidence angle and Mach number. The values on theaxes are only representable for the particular measurement but the trends are valid for all
compressors (Saravanamuttoo, et al., 2009, p. 255)
For rotating parts the Mach number will increase with radius since the blade speed, and therebythe relative velocity of the fluid, increases along with the radius, see Fig. 2-5. This implies thatthe tip of a rotor blade has a narrower incidence interval to work in than the hub of the sameblade. For the stator it is the hub that encounters the highest Mach number, under the assumptionthat the enthalpy rise is constant over the blade radius, since the tangential velocity is larger heredue to the need of higher deflection in the hub to satisfy the constant work assumption. TheMach numbers in the stator are usually low compared to those in the rotor (Saravanamuttoo, etal., 2009, pp. 255-256).
Fig. 2-5 Typical Mach numbers at different radii of the stator and the rotor (Saravanamuttoo, etal., 2009, p. 255)

11
2.4 DimensionlessparametersNon-dimensional parameters can be used to describe the performance of a gas turbine. Theparameters are formed into so called dimensionless groups even though the groups usually arenot truly dimensionless. In literature there is no definite way to form these dimensionless groupsand the formation varies from case to case. The name of these groups also varies in literature.Aerodynamic-, non-dimensional- and corrected parameters are all common names of thesegroups.
At SIT the standard is to correct the values according to ISO values (Tageman, 2014). In thisthesis, the corrected values will be referred to as aerodynamic shaft-speed and correctedparameters and should not be confused with the dimensionless groups used in literature. In thetheory part of this thesis, these groups will be referred to as non-dimensional parameters.
2.5 StagnationpropertiesIn gas turbine calculations it is common to use stagnation properties. If stagnation properties areused, it simplifies the calculations since they consider both the change in static enthalpy and thechange in velocity and thereby change in kinetic energy. The speed alteration in a gas turbine ismajor and the kinetic energy alteration is therefore too big to neglect.
2.5.1 StagnationenthalpyStagnation enthalpy is the total enthalpy a fluid would have if it, adiabatically and without worktransfer, was brought to zero speed. If a steady flow is considered to go through a nozzleadiabatically without any losses in potential energy the energy equation would become as in Equ.( 2-2 ) where ℎ is the stagnation enthalpy, h is the static enthalpy and C the velocity before thedeceleration (Saravanamuttoo, et al., 2009, p. 55).
(ℎ − ℎ) +12 (0− ) = 0 ( 2-2 )
Thus the stagnation enthalpy is the sum of the static enthalpy and the kinetic energy ( 2⁄ ) ascan be seen in Equ. ( 2-3 ) (Saravanamuttoo, et al., 2009, p. 55).
ℎ = ℎ + 2⁄ ( 2-3 )
2.5.2 Stagnation temperatureIf the fluid is considered to be a perfect gas the relationship between enthalpy and temperaturecan be described as in Equ. ( 2-4 ) (Saravanamuttoo, et al., 2009, p. 55).

12
ℎ = ( 2-4 )
Thus, using Equ. ( 2-3 ), the stagnation temperature ( ) can be expressed as in Equ. ( 2-5 )where the first term is called static temperature ( ) and the second term is called dynamictemperature ( 2 ) (Saravanamuttoo, et al., 2009, p. 55).
= + 2 ( 2-5 )
2.5.3 StagnationpressureIf the deceleration of the fluid is also reversible, i.e. the deceleration is isentropic, the stagnationpressure ( ) is defined by the relationship in Equ. ( 2-6 ) (Saravanamuttoo, et al., 2009, p. 56)where the ratio of specific heat ( ) is defined as the ratio between cp and cv.
=( )⁄
( 2-6 )
2.6 CompressorcharacteristicThe behaviour of the compressor is explained and described by a compressor characteristic,sometimes also referred to as a compressor map. The compressor characteristic is a chart wherepressure ratio and compressor efficiency are plotted as a function of mass flow. Points with thesame aerodynamic shaft-speed are then formed together to lines, so called constant speed lines.
To enable application to all inlet conditions mass flow, pressure ratio and shaft-speed must begeometrically non-dimensional. This will make every point in the compressor map fixed. For agiven corrected mass flow and pressure ratio only one aerodynamic shaft-speed and onecompressor isentropic efficiency is possible. This is achieved when (Sjödin, 2013, p. 43):
1) The Mach numbers are identical2) The velocity triangles are identical3) The Reynolds numbers are identical
Fig. 2-6 shows an example of a compressor characteristic. Here the vertical lines are constantspeed lines and the dotted lines form so called efficiency islands. The isentropic efficiency isconstant along the border of an efficiency island. In this figure the surge line is plotted. Surge isfurther described in section 2.10 on p. 24. The compressor characteristic varies for differentcompressors and geometries. It is also common to have non-dimensional mass flow on theabscissa instead of non-dimensional flow. Stagnation properties can also be used.

13
Fig. 2-6 Compressor characteristic. The vertical lines are constant speed lines and the dottedlines form efficiency islands. The surge line marks the limit where the compressor runs into
surge (Razak, 2007, p. 175)
Due to the small influence and great theoretical complexity, the effect of the Reynolds number isneglected. By assuming that is constant the influence of the Mach number can be ignored(Sjödin, 2013, p. 45). The effects of an increase in ambient conditions are minor and thereforethe results can be trusted even though the ambient conditions changes. If the medium would bechanged, the impact of the errors would be large and the results would not be trustable (Sjödin,2014).
The compressor characteristic is unique for a fixed geometry. If the VGV-position is altered thecharacteristic will no longer be valid since the intake area of the engine has changed, therebychanging the geometry of the engine (Walsh & Fletcher, 2004, p. 172). There are two ways todeal with this problem. Either separate characteristics are made for different VGV-positions or ascaling factor is used to scale the map when the VGV-positions are changed (Sjödin, 2013, p.50). Using a scaling factor will be cheaper and less time consuming but might not be as accurateas making separate characteristics (Tageman, 2014).
SIT uses different approaches for different gas turbines. For single-shaft engines severalcharacteristics are made for different VGV-positions. For twin-shaft engines the VGV-position iscontrolled as a function of aerodynamic shaft-speed, i.e. for one given aerodynamic shaft-speedonly one VGV-position is used. It is therefore unnecessary to make more characteristics for

14
different VGV-positions since the control system will prevent them from occurring. If the controlalgorithms were to be changed new compressor characteristic would have to be generated(Tageman, 2014).
A compressor can operate anywhere in the compressor map but when it is connected to a turbineit will be restricted due to the influence of the turbine. The interaction between the components isdescribed in the following section.
2.7 ComponentmatchingThe compressor, CT and PT interacts with each other and the reaction of one component, forexample to higher ambient temperature, will also affect the other components. All off-designconditions will affect the components and thereby the interaction in different ways. Thecomponents therefore needs to be matched together and the interaction between the componentsis referred to as component matching (Razak, 2007, pp. 174-175).
The compressor and the CT have a mechanical coupling i.e. the shaft-speed is the same for thetwo components. The PT does not have a mechanical coupling with the two other componentsbut the mass flow from the CT goes into the PT and therefore the PT and CT is said to have anaerodynamically coupling (Razak, 2007, p. 181). The pressure ratio that is available to the PTalso depends on the pressure ratios of the CT and compressor (Saravanamuttoo, et al., 2009, p.466).
To visualize the area in which the gas turbine operates, the characteristic of the compressor andturbines are normally plotted on a non-dimensional basis with non-dimensional shaft-speed, non-dimensional mass flow, pressure ratio and isentropic efficiency (Razak, 2007, p. 176).
The matching process is normally calculated by computers (Razak, 2007, p. 185) butSaravanamuttoo et al. (2009, pp. 463-469) describes how the calculation could be done by hand.Assumptions of turbines in series are presented in section 2.7.1 on p. 15. Thereafter thecalculations are reproduced, first for a gas turbine with unchoked PT in section 2.7.2 on p. 17and then for a gas turbine with choked PT in section 2.7.3 on p. 20. The numbering of the gasturbine sections used in this chapter is shown in Fig. 2-7.

15
Fig. 2-7 Numbering of the sections in a twin-shaft gas turbine. 1 refers to the intake of thecompressor, 2 to the outlet of the compressor, 3 to the intake of the CT, 4 to the intake of the PT
and 5 to the exhaust of the PT (Courtesy to Magnus Genrup)
In these calculations the ambient conditions have been assumed known and the inlet and exhaustlosses have been assumed negligible. The combustion chamber pressure loss has been assumed afixed percentage of the compressor delivery pressure. The mass flow through the engine isassumed constant.
2.7.1 Assumptionsofturbinesinseries
Turbines normally experience merely minor changes in non-dimensional mass flow ( ) when
the non-dimensional shaft-speed ( )is altered. In general other components restrict the area in
which the turbine could operate. If these assumptions are made the mass flow function could beassumed as a single line in the turbine characteristic as seen in Fig. 2-8 (Saravanamuttoo, et al.,
2009, p. 456) instead of several lines as in Fig. 2-12 on p. 23. At SIT is referred to as flow
number.
16
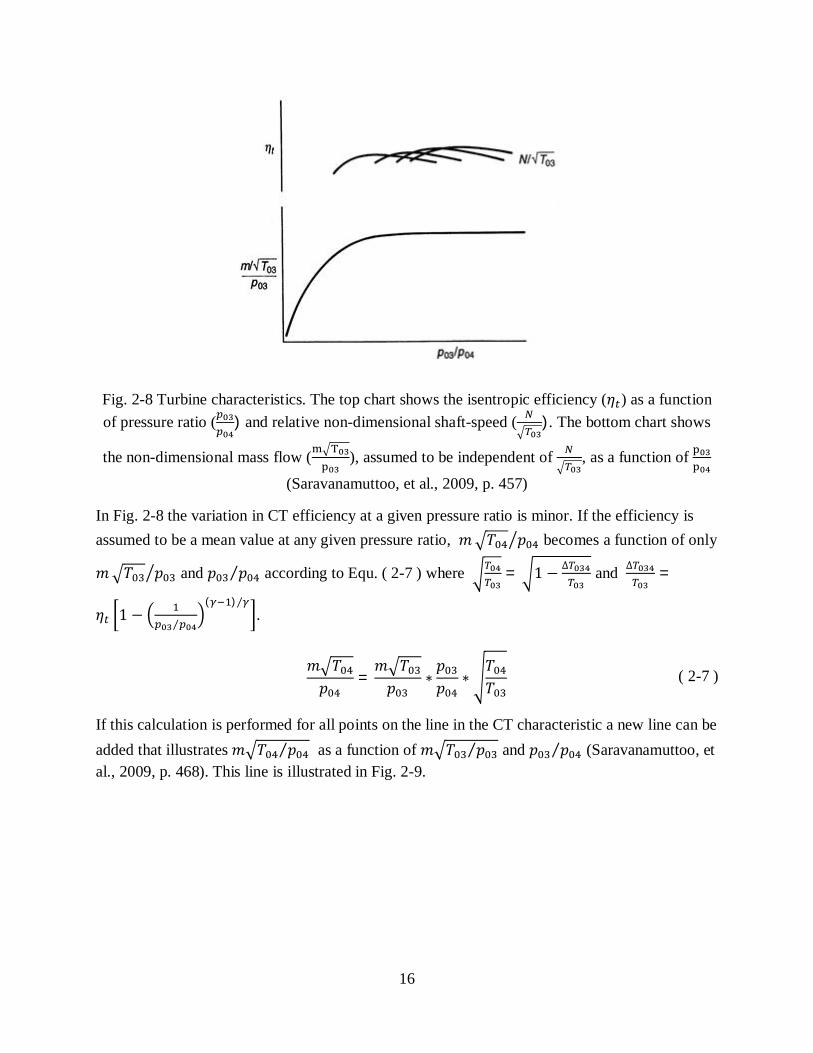
Fig. 2-8 Turbine characteristics. The top chart shows the isentropic efficiency ( ) as a functionof pressure ratio ( ) and relative non-dimensional shaft-speed ( ). The bottom chart shows
the non-dimensional mass flow ( ), assumed to be independent of , as a function of
(Saravanamuttoo, et al., 2009, p. 457)
In Fig. 2-8 the variation in CT efficiency at a given pressure ratio is minor. If the efficiency isassumed to be a mean value at any given pressure ratio, becomes a function of only
and ⁄ according to Equ. ( 2-7 ) where = 1 − ∆ and ∆ =
1 −⁄
( )⁄.
= ∗ ∗ ( 2-7 )
If this calculation is performed for all points on the line in the CT characteristic a new line can beadded that illustrates ⁄ as a function of ⁄ and ⁄ (Saravanamuttoo, etal., 2009, p. 468). This line is illustrated in Fig. 2-9.

17
Fig. 2-9 The left turbine characteristics illustrates non-dimensional mass flow into the CT
( ) and out of the CT ( ) as functions of CT pressure ratio ( ). The right turbine
characteristic illustrates as function of PT pressure ratio ( ). The dashed lines illustrate
how the aerodynamic coupling affects the interaction between the two components and how theswallowing capacity of the PT restricts the non-dimensional mass flow through the CT (Courtesy
to Magnus Genrup)
Fig. 2-9 illustrates how the aerodynamic coupling between the CT and PT affects the interactionbetween the components. In points (1) and (2) the PT is choked which causes the CT to operateon a fixed non-dimensional point even if the pressure ratio over the PT is raised(Saravanamuttoo, et al., 2009, pp. 468-469).
When the PT is unchoked the CT will operate with a fixed non-dimensional outlet mass flow andpressure ratio for each PT pressure ratio. This is illustrated by point (3). Therefore the CT outletpressure, and as a result also the non-dimensional mass flow, always depends on the PT’sswallowing capacity (Saravanamuttoo, et al., 2009, pp. 468-469).
2.7.2 Calculationsfortwin-shaftgasturbinewithunchokedPTIn this section calculation for a gas turbine with unchoked PT is reproduced fromSaravanamuttoo et al. (2009, pp. 463-467).
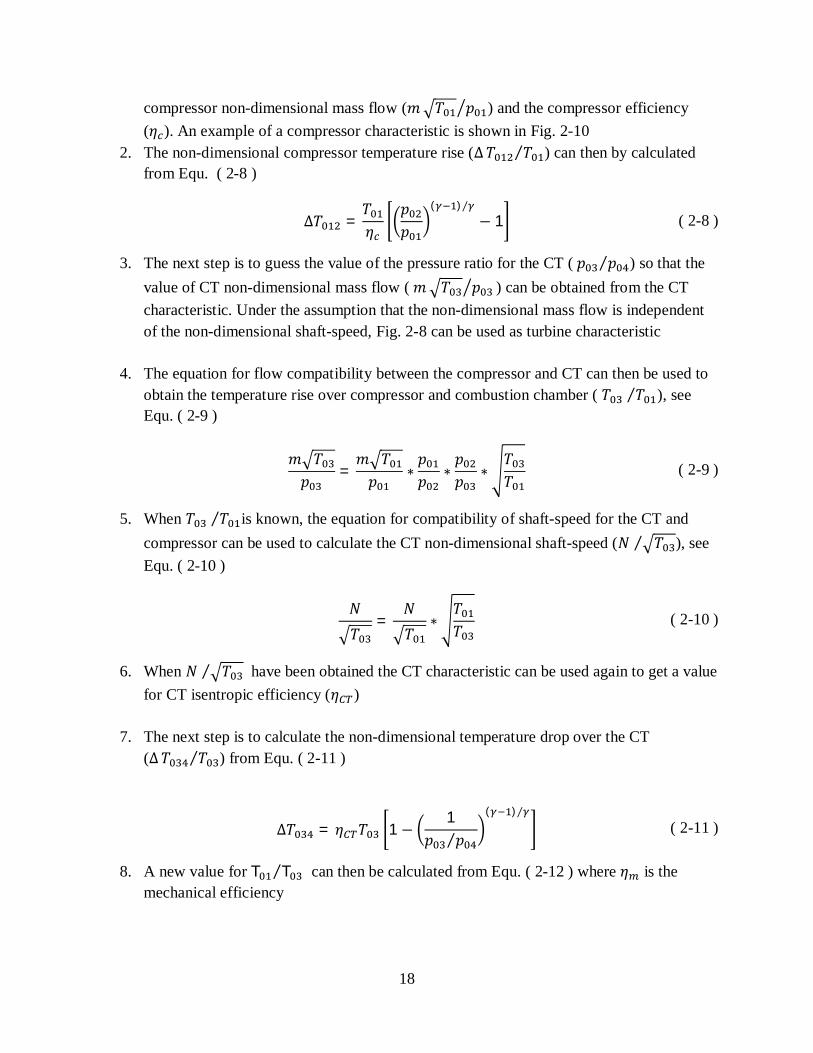
1. The first step is to choose a constant non-dimensional shaft-speed line in the compressorcharacteristic which the calculations should be executed for. Thereafter a point on thatline is chosen which will give the pressure rise over the compressor ( ⁄ ), the
18
compressor non-dimensional mass flow ( ) and the compressor efficiency( ). An example of a compressor characteristic is shown in Fig. 2-10
2. The non-dimensional compressor temperature rise (∆ ⁄ ) can then by calculatedfrom Equ. ( 2-8 )
∆ =( )⁄
− 1 ( 2-8 )
3. The next step is to guess the value of the pressure ratio for the CT ( ⁄ ) so that thevalue of CT non-dimensional mass flow ( ) can be obtained from the CTcharacteristic. Under the assumption that the non-dimensional mass flow is independentof the non-dimensional shaft-speed, Fig. 2-8 can be used as turbine characteristic
4. The equation for flow compatibility between the compressor and CT can then be used toobtain the temperature rise over compressor and combustion chamber ( ⁄ ), seeEqu. ( 2-9 )
= ∗ ∗ ∗ ( 2-9 )
5. When ⁄ is known, the equation for compatibility of shaft-speed for the CT andcompressor can be used to calculate the CT non-dimensional shaft-speed ( ⁄ ), seeEqu. ( 2-10 )
= ∗ ( 2-10 )
6. When ⁄ have been obtained the CT characteristic can be used again to get a valuefor CT isentropic efficiency ( )
7. The next step is to calculate the non-dimensional temperature drop over the CT(∆ ⁄ ) from Equ. ( 2-11 )
∆ = 1 −1⁄
( )⁄( 2-11 )
8. A new value for T T⁄ can then be calculated from Equ. ( 2-12 ) where is themechanical efficiency

19
∆=∆
∗ ∗ ( 2-12 )
9. If the new value for T T⁄ does not agree with the value calculated in step 4, P P⁄needs to be modified and the equations recalculated from step 3 in an iterative processuntil the values converge
10. When the values are equal, the non-dimensional mass flow out of the CT ( )can be calculated from Equ. ( 2-7 )
11. The pressure ratio over the PT (p p⁄ ) can then be calculated from Equ. ( 2-13 )
= ∗ ∗ ( 2-13 )
12. p p⁄ can then be used to get a new value for from the PT characteristicwhich will have the same shape as the CT characteristics in Fig. 2-8 but with differentparameters and values at the axes
13. If the new value for does not match the value calculated in step 10 a newcompressor operating point needs to be selected and the calculation repeated from step 2until the flows from the two turbines converge

20
Fig. 2-10 Compressor characteristic. The top chart shows the isentropic efficiency ( ) as a
function of non-dimensional mass flow ( ). The right chart shows as a function of
pressure ratio ( ). The left bottom chart shows as a function of and the non-
dimensional shaft-speed ( ) (Saravanamuttoo, et al., 2009, p. 456)
2.7.3 Calculationsfortwin-shaftgasturbinewithchokedPTIn this section calculation for a gas turbine with choked PT is reproduced from (2009, pp. 468-469)
1. When the PT is chocked the CT pressure ratio and the non-dimensional mass flowthrough CT and PT is known, see. Fig. 2-9
2. If the calculations are performed for a constant non-dimensional shaft-speed line thecompressor pressure ratio can be obtained from the compressor characteristic, see Fig.2-10
3. The next step is to calculate the PT pressure ratio from Equ. ( 2-13 )
For a gas turbine with a choked PT all parameters can be calculated by a single iteration.
2.7.4 RunninglineThere will be only one point on the constant speed line, on the compressor characteristic, thatwill fulfil both the aerodynamic coupling between the PT and CT and the mechanical couplingbetween the compressor and CT. If the calculations are performed for all constant speed lines aline could be drawn between the emerged points, called a running line. This running line will beindependent of load and instead decided by the swallowing capacity of the PT. The gas turbine
21
will always run on this line since it is the only path that fulfils both the aerodynamic andmechanical couplings between the components (Saravanamuttoo, et al., 2009, p. 467).
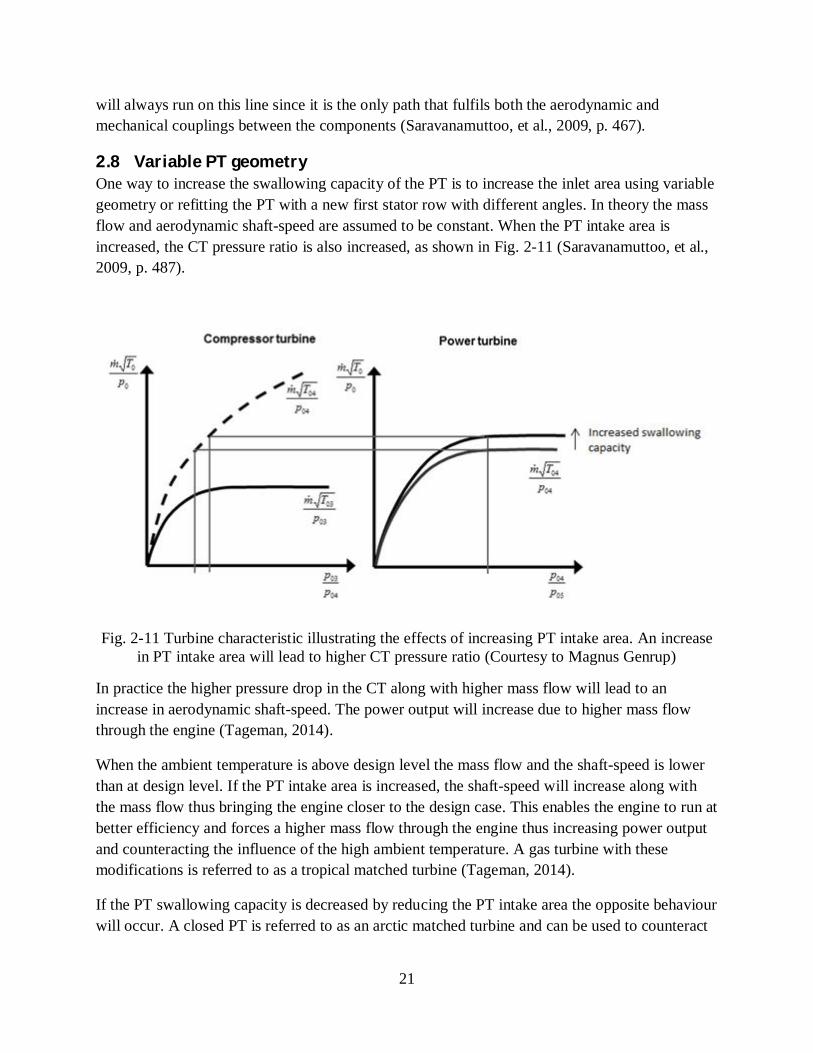
2.8 VariablePTgeometryOne way to increase the swallowing capacity of the PT is to increase the inlet area using variablegeometry or refitting the PT with a new first stator row with different angles. In theory the massflow and aerodynamic shaft-speed are assumed to be constant. When the PT intake area isincreased, the CT pressure ratio is also increased, as shown in Fig. 2-11 (Saravanamuttoo, et al.,2009, p. 487).
Fig. 2-11 Turbine characteristic illustrating the effects of increasing PT intake area. An increasein PT intake area will lead to higher CT pressure ratio (Courtesy to Magnus Genrup)
In practice the higher pressure drop in the CT along with higher mass flow will lead to anincrease in aerodynamic shaft-speed. The power output will increase due to higher mass flowthrough the engine (Tageman, 2014).
When the ambient temperature is above design level the mass flow and the shaft-speed is lowerthan at design level. If the PT intake area is increased, the shaft-speed will increase along withthe mass flow thus bringing the engine closer to the design case. This enables the engine to run atbetter efficiency and forces a higher mass flow through the engine thus increasing power outputand counteracting the influence of the high ambient temperature. A gas turbine with thesemodifications is referred to as a tropical matched turbine (Tageman, 2014).
If the PT swallowing capacity is decreased by reducing the PT intake area the opposite behaviourwill occur. A closed PT is referred to as an arctic matched turbine and can be used to counteract

22
the influence of cold ambient temperatures. If no modifications are made to the PT the gasturbine is referred to as a normal matched turbine (Tageman, 2014).
2.9 Correlationbetweengasturbineparameters
2.9.1 GasturbineperformancepredictionsfromcharacteristicsIn section 2.7 on p. 14 it was shown how the operation area of a gas turbine is reduced down to asingle line when the compressor and turbines operates together. Thus the performance of the gasturbine could be gained from compressor and turbines characteristics. In the compressorcharacteristics in Fig. 2-10 it could be seen that if the non-dimensional shaft-speed is altered itwill affect compressor pressure ratio, efficiency and non-dimensional mass flow. If the non-dimensional shaft-speed is reduced both compressor pressure ratio and non-dimensional massflow will decrease and contrariwise. From the same figure it can be seen that the compressorefficiency depends on both pressure ratio and dimensionless mass flow.
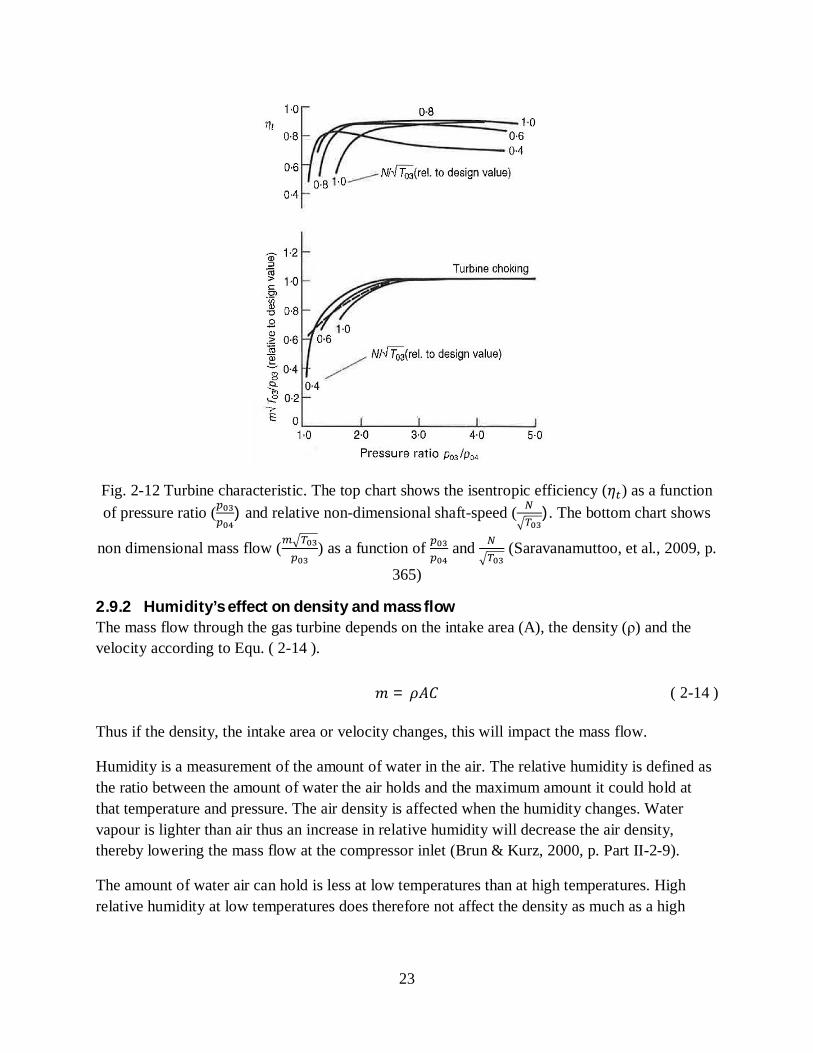
According to the turbine characteristics, as seen in Fig. 2-12, the CT pressure ratio and the non-dimensional mass flow are nearly independent of the non-dimensional shaft-speed. When theturbine is unchoked, the non-dimensional mass flow decreases when the pressure ratio decreases.The turbine efficiency depends on all three parameters; non-dimensional shaft-speed, non-dimensional mass flow and pressure ratio.
23
Fig. 2-12 Turbine characteristic. The top chart shows the isentropic efficiency ( ) as a functionof pressure ratio ( ) and relative non-dimensional shaft-speed ( ). The bottom chart shows
non dimensional mass flow ( ) as a function of and (Saravanamuttoo, et al., 2009, p.
365)
2.9.2 Humidity’seffectondensityandmassflowThe mass flow through the gas turbine depends on the intake area (A), the density (ρ) and thevelocity according to Equ. ( 2-14 ).
= ( 2-14 )
Thus if the density, the intake area or velocity changes, this will impact the mass flow.
Humidity is a measurement of the amount of water in the air. The relative humidity is defined asthe ratio between the amount of water the air holds and the maximum amount it could hold atthat temperature and pressure. The air density is affected when the humidity changes. Watervapour is lighter than air thus an increase in relative humidity will decrease the air density,thereby lowering the mass flow at the compressor inlet (Brun & Kurz, 2000, p. Part II-2-9).
The amount of water air can hold is less at low temperatures than at high temperatures. Highrelative humidity at low temperatures does therefore not affect the density as much as a high

24
relative humidity at high temperatures. Thus the gas turbine performance is more affected by achange in relative humidity at high ambient temperatures (Brun & Kurz, 2000, p. Part II-2-9).
2.9.3 Temperature’seffectondensityA change in temperature also affects the density. If the air is considered to be an ideal gas therelationship could be received from the ideal gas law, see Equ. ( 2-15 ).
= ↔ = ( 2-15 )
Thus if the temperature increases the density will decrease.
2.9.4 Physicalshaft-speed’seffectsonlifespanThe maximum centrifugal stresses occur in the root of the blade. The centrifugal stresses in arotor blade are proportional to the annulus area and to the square of the physical shaft-speed(Saravanamuttoo, et al., 2009, pp. 346-347, 354), commonly referred to as AN2. For an existinggas turbine the annulus area is already set. The only thing that is left for the engineer to controlthe stress levels with, is the physical shaft-speed. Since the centrifugal stresses are proportionalto the square of the physical shaft-speed there is a great potential to enhance the lifespan of theengine if the physical shaft-speed can be reduced.
2.10 SurgemarginOne of the most severe problems that can occur in a gas turbine is surge. Surge occurs when thecompressor is unable to build up enough pressure, resulting in a turn of the flow which can leadto great dynamical damages (Razak, 2007, p. 111). Altering the VGVs will affect the surgemargin. If the VGVs are closed the non-dimensional flow will decrease thus improving the surgemargin (Razak, 2007, p. 246). If a more opened VGV-position is used the surge line may drifttowards the running line thereby increasing the risk of surge (Razak, 2007, p. 248). The conceptof the running line was explained in section 2.7.4 on p. 20. If the running line is plotted into Fig.2-6 on p. 13 the circumstances that lead to surge for that particular compressor can be detected.The vertical distance from the operating point to the surge line is called surge margin and ismeasured as percentage of the operating pressure ratio (Walsh & Fletcher, 2004, p. 472), seeEqu. ( 2-16 ).
= − 1 ( 2-16 )
At SIT the surge margin is defined as the distance from the operating point to the surge line,following the constant speed line. The surge margin (SM) is then calculated according to Equ. (2-17 ) using the pressure ratio (PR) and the corrected mass flow (m) (Axelsson, 2014).
= ∗ − 1 ( 2-17 )
The surge margin is needed to ensure that the gas turbine never encounters surge even as therunning conditions changes. The surge margin needs to take the fouling of the compressor into

25
account along with the possibility of rapidly increasing the load and the transient behaviour ofthe gas turbine. Some extra margin is always taken to be able to handle manufacturingdifferences and other parameters that may vary from engine to engine (Walsh & Fletcher, 2004,p. 459).
Calculations made by SIT shows that the risk of surge due to rapid load increase is very small fortheir twin-shaft engines. The rapid response of the gas generator makes it very unlikely toencounter surge since the sudden increase in pressure ratio is quickly met by a higheraerodynamic shaft-speed. In a theoretical world the pressure ratio could reach about 10% higherthan the running line at a sudden increase in load. The mechanical limitations make thisimpossible since it is impossible to inject the needed fuel so quickly. Thus the actual pressurerise is even lower (Axelsson, 2014).
The most accurate way to measure the surge margin is to do experimental tests but since surgemay damage the engine severely, these tests are rarely made for full size engines at full load.One common way to test is to use a smaller scaled version and then interpret the results. Theproblem with this method is that some of the phenomena are hard to scale. One example is theeffects of the Reynolds number. Another example is the gap between the casing and the rotor tip.As the engine is scaled down some tolerances are still needed to ensure that the rotor does not hitthe casing. It may be hard to scale down this gap as much as the rest of the engine. Thus asmaller engine often encounters higher gap-losses (Axelsson, 2014).
At SIT experimental surge margin tests have been performed at a full size engine running at fullload but at lowered intake pressure to minimize the forces and thus the potential of damages.Using this method there are no scaling effects affecting the results but the risks are higher sincethe full size engine is much more expensive than a smaller prototype (Axelsson, 2014).
2.11 SASSAS is a commonly used term for all the air that is extracted from the compressor to be used ascooling or as a pressure barrier. In advanced gas turbines up to 25% of the intake air may be usedas SAS (Walsh & Fletcher, 2004, p. 226). The air is extracted from different stages in thecompressor. If the extraction is at the early stages less work have been used to compress the airthus the performance loss will be lower than if air is extracted from the final stages. Theextraction point must be of sufficient pressure to ensure sufficient flow through the extractioneven when losses, from extraction and transportation, are considered (Walsh & Fletcher, 2004, p.225). Thus the pressure from the extractions in the first stages is not sufficient for allapplications. In those cases the much more valuable air from the latter stages in the compressoris needed to ensure the flow.
The SAS is crucial to the performance of the gas turbine. If the SAS fails, the cooling of theturbine will fail causing severe damages. If the SAS requires too much air, the performance willdecrease since too much of the mass flow is used for cooling making the main mass flow too

26
small. The turbine efficiency will also decrease as the amount of cooling air increases since themixing of this cool air disturbs the main flow leading to losses.

27
3 ThestudiedgasturbinesIn this thesis focus will be on two of SIT’s gas turbines; SGT-700 and SGT-750. The gasturbines are constantly improved to meet higher demands and reduce costs. Both engines belongto the segment that SIT refers to as industrial gas turbines, gas turbines with a power between 5and 50 MW. Both engines have two rows of VGVs, IGV included, that are controlled by oneactuator.
3.1 SGT-700SGT-700, shown in Fig. 3-1, is a twin-shaft gas turbine that delivers 33 MW shaft power at anefficiency of 37.8%. The compressor has a pressure ratio of 18.7:1, consists of 11 stages and isequipped with two rows of VGVs. It has extractions for the SAS at stage 2, stage 6 and stage 11which is used to cool an air-cooled two-stage CT (Tageman, 2014). The power is delivered by atwo stage PT. SGT-700 is designed to be able to run on both gaseous and liquid fuels. It is alsodesigned to match the criteria set in an Ex-environment and to meet offshore codes and standards(Siemens AG, 2009a, p. 1).
Fig. 3-1 The left picture shows a schematic view of the SGT-700. The right picture shows SGT-700 during assembly (Siemens AG, 2009b, pp. 1-2)
3.2 SGT-750SGT-750, shown in Fig. 3-2, is the newest product in SIT’s gas turbine portfolio. It is a twin-shaft engine that delivers 38.2 MW shaft power at an efficiency of 40.7% (Tageman, 2014). Thecompressor consists of 13 stages and is equipped with two rows of VGVs. The compressor has apressure ratio of 24:1. It is driven by an air-cooled two-stage CT and the power is generated in acounter-rotating PT consisting of two stages (Siemens AG, 2010, p. 8). The cooling air for theCT is taken from extraction points at stage 3, stage 6, stage 9 and stage 13 (Tageman, 2014). Thecombustion takes place in eight can-burners (Siemens AG, 2010, p. 9).

28
Fig. 3-2 The left picture shows a schematic view of SGT-750. The right picture shows a modelof SGT-750 (Siemens AG, 2014)

29
4 MappingofpotentialThere is no available tool to quickly calculate how the gas turbine will respond to a change inVGV-position. Therefore every component is modelled individually. The performance of theentire gas turbine is then acquired through an iterative process between the different programs. Inthis study GTPerform and HT0300 have been used.
Six different cases have been tested. The 75% load cases are by default calculated from the100% load results. Therefore these results will be affected if the 100% load case reaches anylimitations even though that might not be the case in reality. This thesis focuses on high ambienttemperatures but for this chapter 15°C is also tested for comparison.
The figures in this chapter show the results as variations from design cases. The figures displaythe variation in CT polytropic efficiency as a function of the variation in physical shaft-speed.
4.1 SGT-700To allow higher physical shaft-speed, the physical shaft-speed limitation has been disabledduring these tests. This implies that even though a potential is possible, the raised physical shaft-speed might endanger the solidity of the rotating parts. The solidity depends on many parametersand the physical shaft-speed might exceed the chosen limit without endangering the solidity.Nevertheless great care has to be taken to ensure the lifespan of the engine. In the case of anambient temperature of both 15°C and 30°C there are three points where the physical shaft-speedis higher than the original limit. In the case where the ambient temperature is 45°C there are fourpoints where the physical shaft-speed is higher than the original limit.
At 45°C the exhaust temperature limit is reached leading to a reduced TIT. The impact of thislimitation is further discussed in section 4.1.3 on p. 31.
4.1.1 15°CWhen the ambient temperature is 15°C there is a positive correlation between CT polytropicefficiency and physical shaft-speed. The impact on the CT polytropic efficiency when thephysical shaft-speed is altered is presented in Fig. 4-1.

30
Fig. 4-1 Variation in CT polytropic efficiency as a function of variation in physical shaft-speed atan ambient temperature of 15°C for SGT-700
4.1.2 30°CFor an ambient temperature of 30°C the results show a positive correlation between CTpolytropic efficiency and physical shaft-speed. The impact on the CT polytropic efficiency whenthe physical shaft-speed is altered is presented in Fig. 4-2.

31
Fig. 4-2 Variation in CT polytropic efficiency as a function of variation in physical shaft-speed atan ambient temperature of 30°C for SGT-700
4.1.3 45°CWhen the ambient temperature is increased to 45°C the results show a positive correlationbetween CT polytropic efficiency and physical shaft-speed. All test points in this simulation arelimited by the exhaust temperature leading to a limit of the TIT. The exhaust temperature limit isset to ensure the solidity of the outlet components such as housing, bearings and outlet duct. Theimpact of limiting the TIT is that the engine will not be reaching its highest temperature i.e. theengine will not be used to its maximum. Due to the nature of the calculations the results at 75%are also limited. The impact on the CT polytropic efficiency when the physical shaft-speed isaltered is presented in Fig. 4-3.
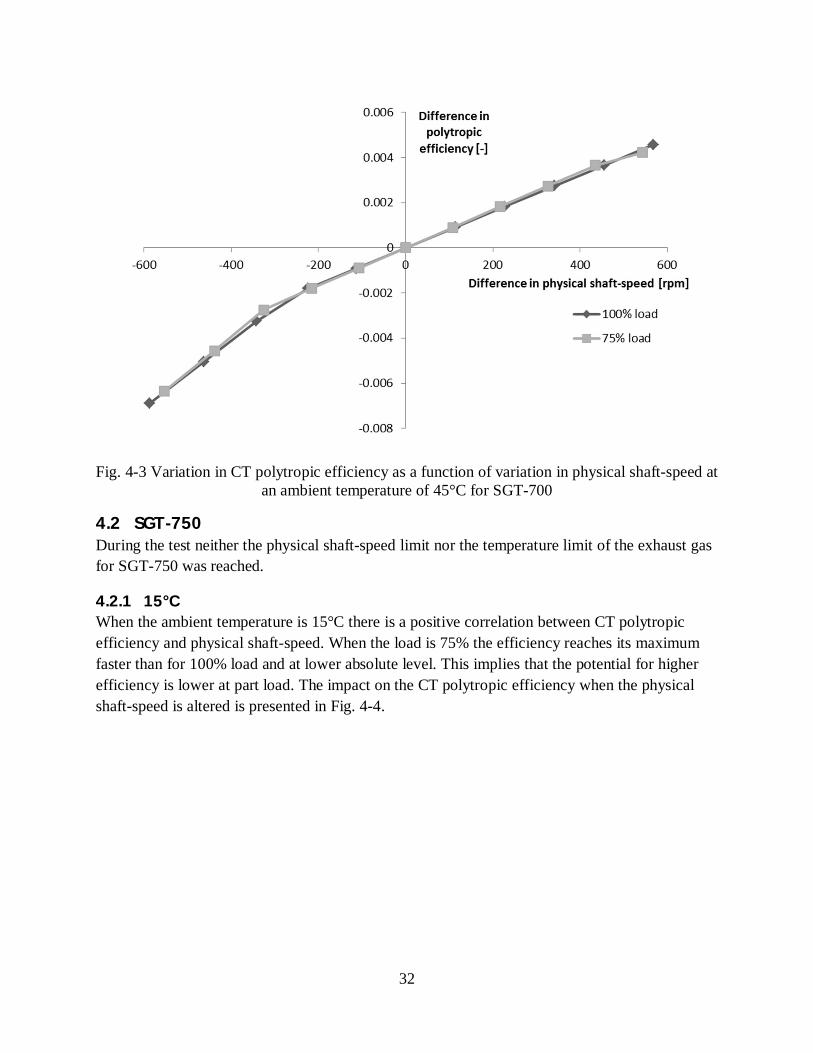
32
Fig. 4-3 Variation in CT polytropic efficiency as a function of variation in physical shaft-speed atan ambient temperature of 45°C for SGT-700
4.2 SGT-750During the test neither the physical shaft-speed limit nor the temperature limit of the exhaust gasfor SGT-750 was reached.
4.2.1 15°CWhen the ambient temperature is 15°C there is a positive correlation between CT polytropicefficiency and physical shaft-speed. When the load is 75% the efficiency reaches its maximumfaster than for 100% load and at lower absolute level. This implies that the potential for higherefficiency is lower at part load. The impact on the CT polytropic efficiency when the physicalshaft-speed is altered is presented in Fig. 4-4.

33
Fig. 4-4 Variation in CT polytropic efficiency as a function of variation in physical shaft-speed atan ambient temperature of 15°C for SGT-750
4.2.2 30°CFor an ambient temperature of 30°C the results show a positive correlation between CTpolytropic efficiency and physical shaft-speed. When the load is 75% the efficiency reaches itsmaximum faster than for 100% load and at lower absolute level. This implies that the potential ofhigher efficiency gets lower at part load. On the other hand the part load case does not get a steepdecrease in efficiency as the physical shaft-speed is lowered implying that the CT efficiency ismore sensitive to an opening of the VGVs at full load. The impact on the CT polytropicefficiency when the physical shaft-speed is altered is presented in Fig. 4-5.

34
Fig. 4-5 Variation in CT polytropic efficiency as a function of variation in physical shaft-speed atan ambient temperature of 30°C for SGT-750
4.2.3 45°CWhen the ambient temperature increases to 45°C, there is a positive correlation between CTpolytropic efficiency and physical shaft-speed. When the load is 75% the efficiency reaches itsmaximum faster than for 100% load and at lower absolute level. This implies that the potentialgets lower at part load. The impact on the CT polytropic efficiency when the physical shaft-speed is altered is presented in Fig. 4-6.

35
Fig. 4-6 Variation in CT polytropic efficiency as a function of variation in physical shaft-speed atan ambient temperature of 45°C for SGT-750
4.3 SummaryA comparison of the test results shows that the potential of improving the CT polytropicefficiency is larger for SGT-700 than for SGT-750 even though it is still minor. It can also beseen that the CT polytropic efficiency varies more with load for SGT-750 than for SGT-700where hardly any differences were detected. The physical shaft-speed could be either increasedor decreased without making major effects on the CT polytropic efficiency for both SGT-700and SGT-750.
One thing that did change with load for SGT-750 was the relative physical shaft-speed at whichthe peak in efficiency occurred. At part load the peak in efficiency occurred at lower relativephysical shaft-speed than at full load for the same ambient conditions. The absolute improvementin efficiency was also higher for the full load case.
Another thing that changes is that the efficiency suddenly starts to drop faster when the relativephysical shaft-speed decreases below a certain level. The point where this drop occurs is athigher shaft-speed for full load compared with part load. This behaviour is more significant forSGT-750 and implies that the engine can tolerate a larger drop in physical shaft-speed at partload before dropping steeply in CT efficiency. These changes will also occur on the SGT-700 butoutside the explored interval of physical shaft-speed. In this thesis the physical shaft-speedinterval is limited since the gas turbine performance will be affected negative if the physicalshaft-speed is too far away from its design point.
36
Even though the effects on CT efficiency might be small it can still be valuable as long as noother component is negatively affected to such extent that the total efficiency is reduced. Sincethe cost of reprograming the VGV-controller is low the improvement might be economicallyviable as long as it is only a matter of different control algorithms.
At the same time the loss in CT efficiency when opening the VGVs might be acceptable if theefficiency of other components are affected in such extent that the total performance of theengine is enhanced. An opening of the VGVs may also lead to an increase in lifespan due tolower stress levels in the rotating parts. Since no major loss in CT efficiency is detected it isinteresting to further investigate the possibility to open the VGVs.
It is necessary to keep investigating both the hypothesis of closing to gain CT efficiency and thehypothesis of opening to gain compressor efficiency and enhance engine lifespan. Furtherinvestigation is needed in a compressor program to see how the compressor responds to thevariation in VGV-position, physical shaft-speed and aerodynamic shaft-speed.
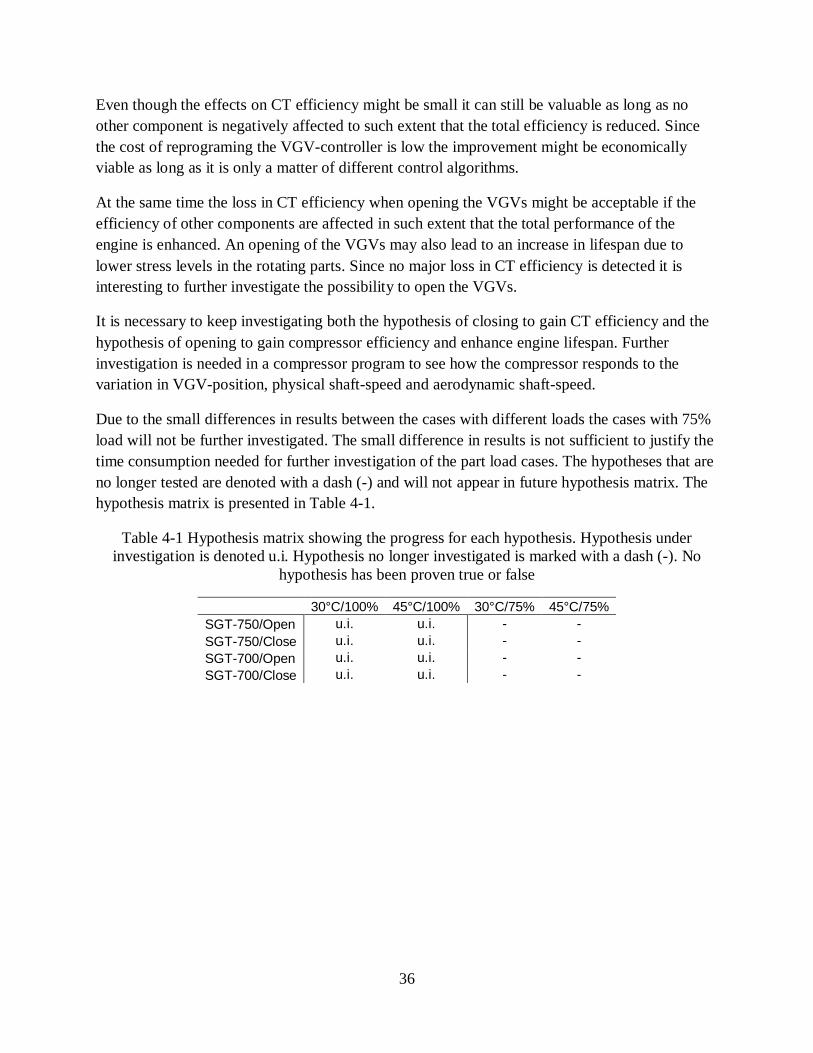
Due to the small differences in results between the cases with different loads the cases with 75%load will not be further investigated. The small difference in results is not sufficient to justify thetime consumption needed for further investigation of the part load cases. The hypotheses that areno longer tested are denoted with a dash (-) and will not appear in future hypothesis matrix. Thehypothesis matrix is presented in Table 4-1.
Table 4-1 Hypothesis matrix showing the progress for each hypothesis. Hypothesis underinvestigation is denoted u.i. Hypothesis no longer investigated is marked with a dash (-). No
hypothesis has been proven true or false
30°C/100% 45°C/100% 30°C/75% 45°C/75%SGT-750/Open u.i. u.i. - -SGT-750/Close u.i. u.i. - -SGT-700/Open u.i. u.i. - -SGT-700/Close u.i. u.i. - -
37
5 AnalysisofeffectsfromambienttemperatureGTPerform is used in Finspång to calculate gas turbine performance. As have been discussed inchapter 2.4 on p.11 the characteristics changes when the VGV-position is altered. In SIT’s twin-shaft gas turbines the VGVs are controlled as a function of aerodynamic shaft-speed, i.e. theVGV-position is determined by the aerodynamic shaft-speed and for a given aerodynamic shaft-speed the VGVs will always have the same position. This simplifies the characteristics since onecharacteristic is sufficient to calculate the performance of the engine as long as the regulation ofthe VGVs is not altered.
It is commonly known at SIT how the gas turbines will behave as the ambient temperature isaltered, given that the VGVs are controlled the way they are today. Due to the fact that the VGV-position is a part of the characteristics it is hard to distinguish the effects that are coupled to thechange in ambient temperature from the effects that results from the controlling of the VGVs.
By keeping the VGV-position fixed at a constant angle using HT0300 and thereafter changingthe parameters in GTPerform to match the results from HT0300 an operational point can befound. The process is iterative since a change of input data in GTPerform may lead to a changeof input data for HT0300. Once an operating point is found that matches the results in bothprograms the effects of the ambient temperature without the interference from the existingcontrol algorithm for the VGVs is revealed.
This thesis focuses on how the VGVs can be used to get a higher performance at high ambienttemperatures. It is therefore important to first distinguish what is caused by pure physics andwhat can be related to the controlling of the VGV-position to see the effects without theinfluence of existing modifications. This since the goal is to find an improved control algorithmfor the VGVs.
In these tests the ambient temperature has been altered using 15, 30 and 45°C at 60% humidity.15°C has been tested to be used as a comparison. The results have been normalized to the case of30°C. To estimate the effects of the water content in the air an additional point has been tested at45°C where the relative humidity has been adjusted to keep the composition of the air at 30°C.For 45°C this is achieved with a relative humidity at 27%. This is relevant since the relativehumidity normally decreases when the temperature increases.
In the figures the results are compared with those retrieved from GTPerform where the VGVsare automatically controlled as a function of the aerodynamic shaft-speed to show the effects ofthe existing control algorithm. When the VGV-position is fixed it is at the angle the gas turbinewould have at 30°C if it was tropical matched. Thus the VGVs are more closed at 15°C and moreopen at 45°C than for the existing control algorithm.

38
5.1 SGT-700Fig. 5-1 shows the aerodynamic shaft-speed as a function of the ambient temperature. As can beseen in the figure the aerodynamic shaft-speed decreases as the ambient temperature rises. Theexisting control algorithm counteracts these effects and keeps the aerodynamic shaft-speed at ahigher level at higher ambient temperatures. The results also show that the aerodynamic shaft-speed is almost independent of the relative humidity for SGT-700.
Fig. 5-1 Aerodynamic shaft-speed as a function of ambient temperature, VGV-position andrelative humidity for SGT-700
As mentioned in section 2.9.1 on p. 22 the impact of a decreased aerodynamic shaft-speed islowered corrected mass flow and lower pressure ratio along with a variation in efficiency. Sincea higher ambient temperature leads to a decreased aerodynamic shaft-speed, these phenomenaare expected to occur. This is confirmed by the results shown in Fig. 5-2, Fig. 5-3 and Fig. 5-4.The results show that an opening of the VGVs will result in lower mass flow, lower pressureratio and lower CT efficiency but higher compressor efficiency. These parameters also seem tobe close to independent of relative humidity for SGT-700.

39
Fig. 5-2 Pressure ratio as a function of ambient temperature, VGV-position and relative humidityfor SGT-700
Fig. 5-3 Corrected mass flow as a function of ambient temperature, VGV-position and relativehumidity for SGT-700

40
Fig. 5-4 To the left: CT polytropic efficiency as a function of ambient temperature, VGV-position and relative humidity. To the right: compressor polytropic efficiency as a function of
ambient temperature, VGV-position and relative humidity. Both figures are for SGT-700
Fig. 5-5 shows how the physical shaft-speed varies with the ambient temperature. There is adistinct difference between the controlled and the uncontrolled VGVs. For the existing VGVcontrol algorithm the physical shaft-speed increases when the ambient temperature increaseswhereas for the case without a control algorithm for the VGVs the opposite behaviour occurs.
As mentioned in section 2.9.4 on p 24 the centrifugal stresses are proportional to the square ofthe physical shaft-speed. The existing control algorithm brings up the physical shaft-speed whenthe temperature rises to keep up the aerodynamic shaft-speed. This will cause higher centrifugalstresses.
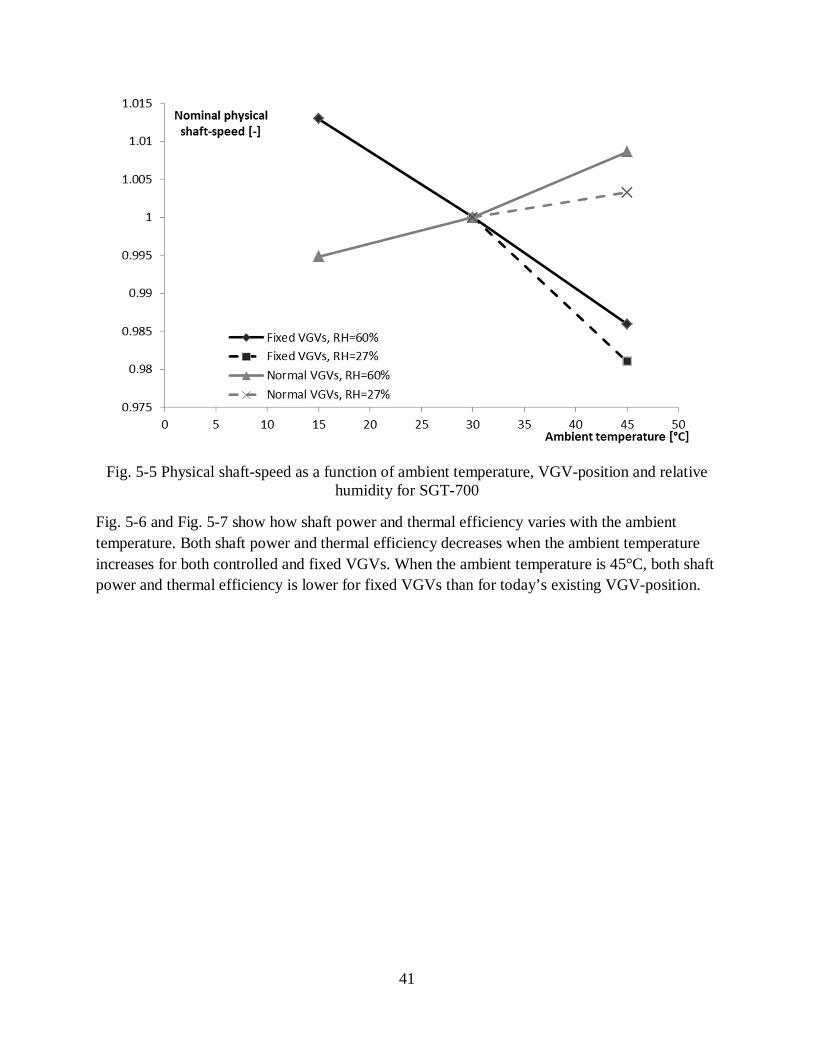
41
Fig. 5-5 Physical shaft-speed as a function of ambient temperature, VGV-position and relativehumidity for SGT-700
Fig. 5-6 and Fig. 5-7 show how shaft power and thermal efficiency varies with the ambienttemperature. Both shaft power and thermal efficiency decreases when the ambient temperatureincreases for both controlled and fixed VGVs. When the ambient temperature is 45°C, both shaftpower and thermal efficiency is lower for fixed VGVs than for today’s existing VGV-position.
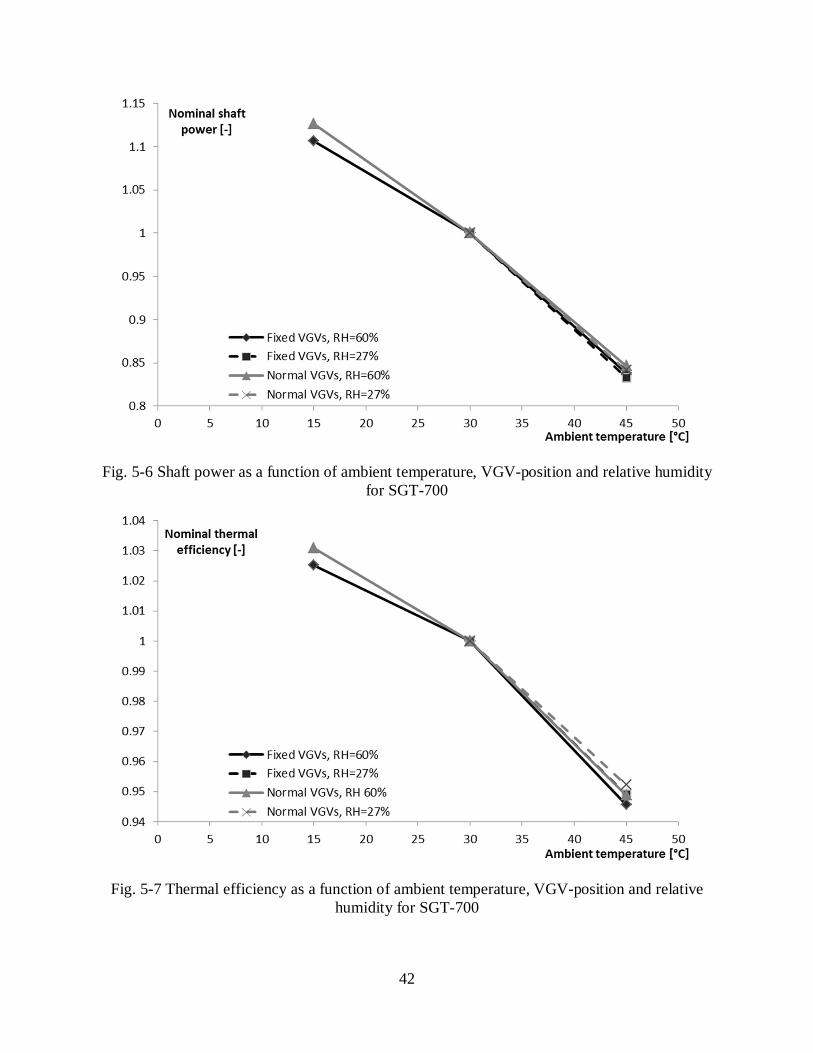
42
Fig. 5-6 Shaft power as a function of ambient temperature, VGV-position and relative humidityfor SGT-700
Fig. 5-7 Thermal efficiency as a function of ambient temperature, VGV-position and relativehumidity for SGT-700
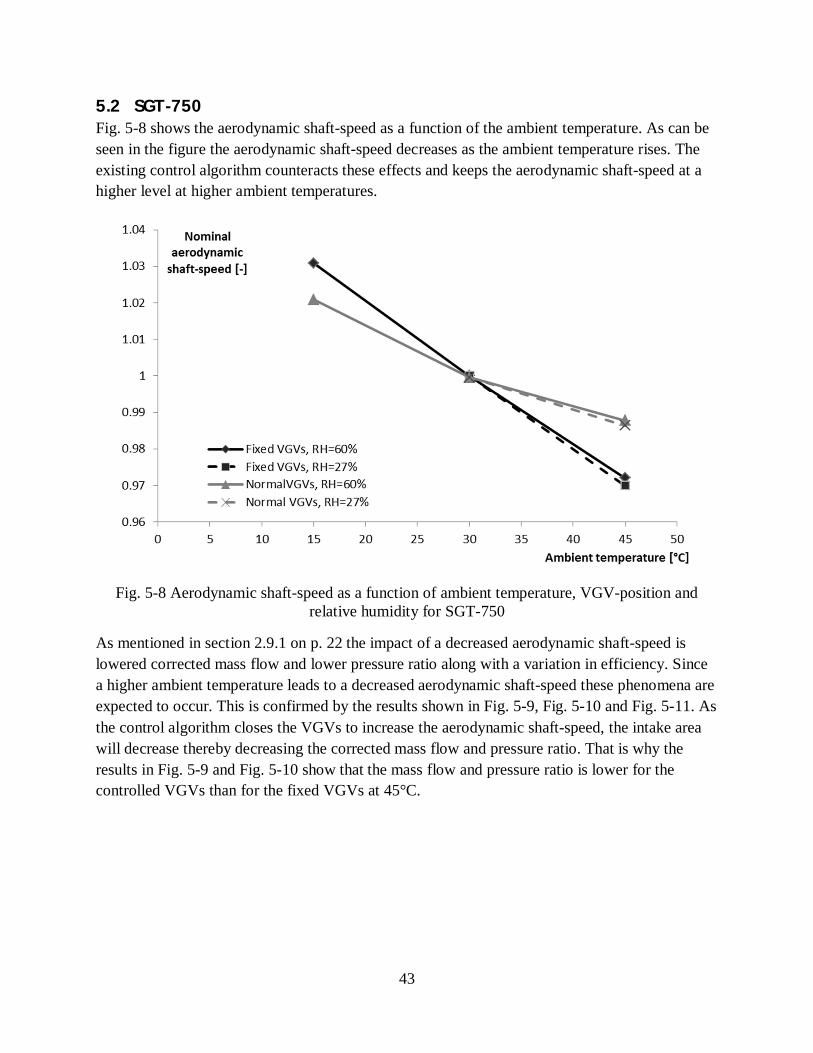
43
5.2 SGT-750Fig. 5-8 shows the aerodynamic shaft-speed as a function of the ambient temperature. As can beseen in the figure the aerodynamic shaft-speed decreases as the ambient temperature rises. Theexisting control algorithm counteracts these effects and keeps the aerodynamic shaft-speed at ahigher level at higher ambient temperatures.
Fig. 5-8 Aerodynamic shaft-speed as a function of ambient temperature, VGV-position andrelative humidity for SGT-750
As mentioned in section 2.9.1 on p. 22 the impact of a decreased aerodynamic shaft-speed islowered corrected mass flow and lower pressure ratio along with a variation in efficiency. Sincea higher ambient temperature leads to a decreased aerodynamic shaft-speed these phenomena areexpected to occur. This is confirmed by the results shown in Fig. 5-9, Fig. 5-10 and Fig. 5-11. Asthe control algorithm closes the VGVs to increase the aerodynamic shaft-speed, the intake areawill decrease thereby decreasing the corrected mass flow and pressure ratio. That is why theresults in Fig. 5-9 and Fig. 5-10 show that the mass flow and pressure ratio is lower for thecontrolled VGVs than for the fixed VGVs at 45°C.

44
Fig. 5-9 Pressure ratio as a function of ambient temperature, VGV-position and relative humidityfor SGT-750
Fig. 5-10 Corrected mass flow as a function of ambient temperature, VGV-position and relativehumidity for SGT-750

45
Fig. 5-11 To the left: CT polytropic efficiency as a function of ambient temperature, VGV-position and relative humidity. To the right: compressor polytropic efficiency as a function of
ambient temperature, VGV-position and relative humidity. Both figures are for SGT-750
Fig. 5-12 shows how the physical shaft-speed varies with the ambient temperature. There is adistinct difference between the controlled and the uncontrolled VGVs. For the existing VGVcontrol algorithm, the physical shaft-speed increases when the ambient temperature increaseswhereas for the case without a control algorithm for the VGVs, the physical shaft-speed is almostconstant or even decreases if the relative humidity is low.
As mentioned in section 2.9.4 on p 24 the centrifugal stresses are proportional to the square ofthe physical shaft-speed. The existing control algorithm brings up the physical shaft-speed whenthe temperature rises to keep up the aerodynamic shaft-speed. This will cause higher centrifugalstresses and lower compressor efficiency in exchange for higher CT efficiency and a highersurge margin due to lower mass flow and lower pressure ratio.

46
Fig. 5-12 Physical shaft-speed as a function of ambient temperature, VGV-position and relativehumidity for SGT-750
Fig. 5-13 and Fig. 5-14 presents how shaft power and thermal efficiency varies with the ambienttemperature. Both shaft power and thermal efficiency decreases when the ambient temperatureincreases for both controlled and fixed VGVs. When the ambient temperature is 45°C, both shaftpower and thermal efficiency is higher for fixed VGVs than for controlled VGVs. This impliesthat it could be possible to gain efficiency and power by opening the VGVs.

47
Fig. 5-13 Shaft power as a function of ambient temperature, VGV-position and relative humidityfor SGT-750
Fig. 5-14 Thermal efficiency as a function of ambient temperature, VGV-position and relativehumidity for SGT-750

48
5.3 SummaryThe aim of this chapter was to distinguish the effects of high ambient temperature from theeffects of the control algorithm. The study shows that the physical shaft-speed is reduced due toan increase in ambient temperature but the control algorithm will try to keep up the physicalshaft-speed to ensure surge margin. This holds true for both engines. As previously discussedless surge margin is needed at full load since no rapid increase in load can occur. It can thereforebe possible to reduce the surge margin as long as the engine is running at full load. All the resultsin this chapter are based on keeping the VGVs fixed. It is therefore not possible to determinehow an opening or closing would affect the performance since only one new VGV-position istested.
In this study the VGVs were kept at a more opened position at 45°C and a more closed positionat 15°C compared to today’s existing position. The results showed some similar trends for bothengines. The CT efficiency benefits from more closed VGVs whereas the compressor efficiencyis higher at a more opened position. The variation in CT efficiency is smaller than the variationin compressor efficiency implying that a potential increase in CT efficiency due to higheraerodynamic shaft-speed will be counteracted by a greater decrease in compressor efficiency.
At 45°C the more opened position gave a decrease in performance along with lower physicalshaft-speed for SGT-700. For SGT-750 more opened VGVs resulted in higher corrected massflow and higher pressure ratio but lower aerodynamic shaft-speed at 45°C. The more openedposition gave an increase in performance and a lower physical shaft-speed. Since only one angleis tested it is too soon to prove any of the hypotheses true or false. Additional VGV-positionsneed to be tested and the effects on the SAS need to be investigated.
For SGT-750 the relative humidity gives more significant difference to the result than for SGT-700. This is coupled to iterative loops between the programs used in this chapter and the usedconvergence criteria. For SGT-700 the relative humidity did affect the performance but it waswithin the convergence criteria thus the results does not differ as much as for SGT-750 whereseveral iteration were needed before the result converged.
The hypothesis matrix shown in Table 5-1 shows the progress of each hypothesis. This chapterhas focused on the temperature’s effects and has not proven any hypothesis true or false.
Table 5-1 Hypothesis matrix showing the progress for each hypothesis. Hypothesis underinvestigation is denoted u.i. No hypothesis has been proven true or false
30°C/100% 45°C/100%SGT-750/Open u.i. u.i.SGT-750/Close u.i. u.i.SGT-700/Open u.i. u.i.SGT-700/Close u.i. u.i.
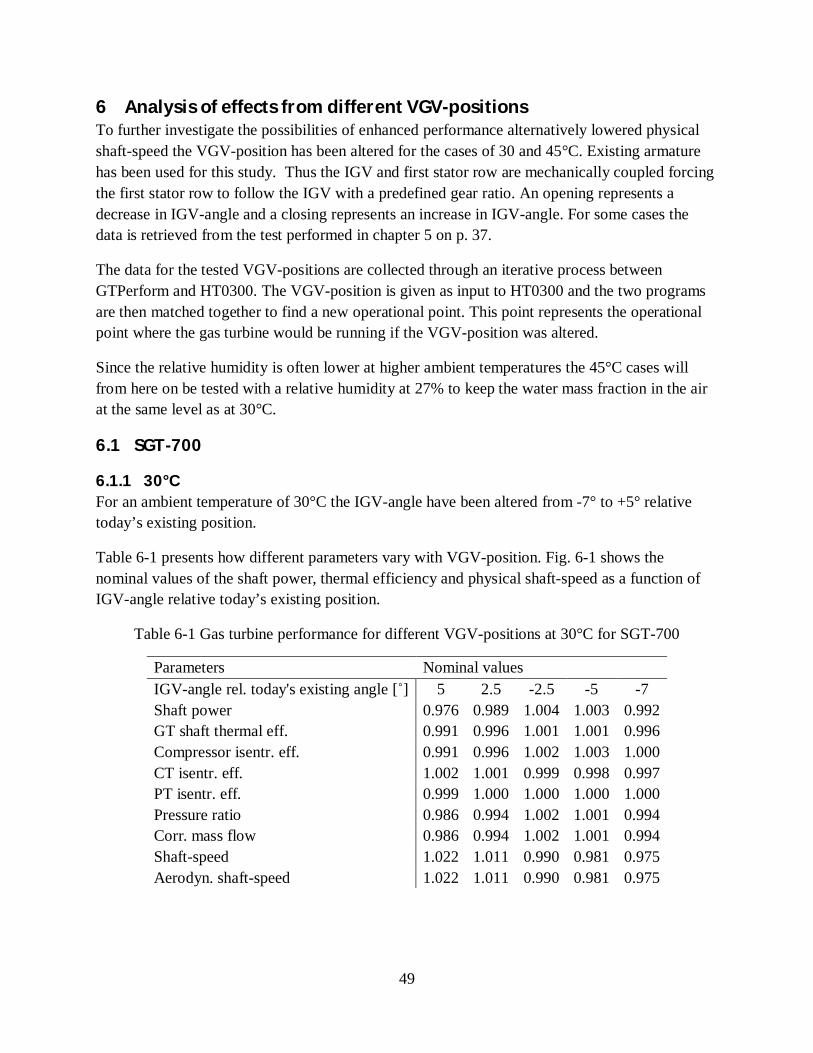
49
6 AnalysisofeffectsfromdifferentVGV-positionsTo further investigate the possibilities of enhanced performance alternatively lowered physicalshaft-speed the VGV-position has been altered for the cases of 30 and 45°C. Existing armaturehas been used for this study. Thus the IGV and first stator row are mechanically coupled forcingthe first stator row to follow the IGV with a predefined gear ratio. An opening represents adecrease in IGV-angle and a closing represents an increase in IGV-angle. For some cases thedata is retrieved from the test performed in chapter 5 on p. 37.
The data for the tested VGV-positions are collected through an iterative process betweenGTPerform and HT0300. The VGV-position is given as input to HT0300 and the two programsare then matched together to find a new operational point. This point represents the operationalpoint where the gas turbine would be running if the VGV-position was altered.
Since the relative humidity is often lower at higher ambient temperatures the 45°C cases willfrom here on be tested with a relative humidity at 27% to keep the water mass fraction in the airat the same level as at 30°C.
6.1 SGT-700
6.1.1 30°CFor an ambient temperature of 30°C the IGV-angle have been altered from -7° to +5° relativetoday’s existing position.
Table 6-1 presents how different parameters vary with VGV-position. Fig. 6-1 shows thenominal values of the shaft power, thermal efficiency and physical shaft-speed as a function ofIGV-angle relative today’s existing position.
Table 6-1 Gas turbine performance for different VGV-positions at 30°C for SGT-700
Parameters Nominal valuesIGV-angle rel. today's existing angle [˚] 5 2.5 -2.5 -5 -7Shaft power 0.976 0.989 1.004 1.003 0.992GT shaft thermal eff. 0.991 0.996 1.001 1.001 0.996Compressor isentr. eff. 0.991 0.996 1.002 1.003 1.000CT isentr. eff. 1.002 1.001 0.999 0.998 0.997PT isentr. eff. 0.999 1.000 1.000 1.000 1.000Pressure ratio 0.986 0.994 1.002 1.001 0.994Corr. mass flow 0.986 0.994 1.002 1.001 0.994Shaft-speed 1.022 1.011 0.990 0.981 0.975Aerodyn. shaft-speed 1.022 1.011 0.990 0.981 0.975
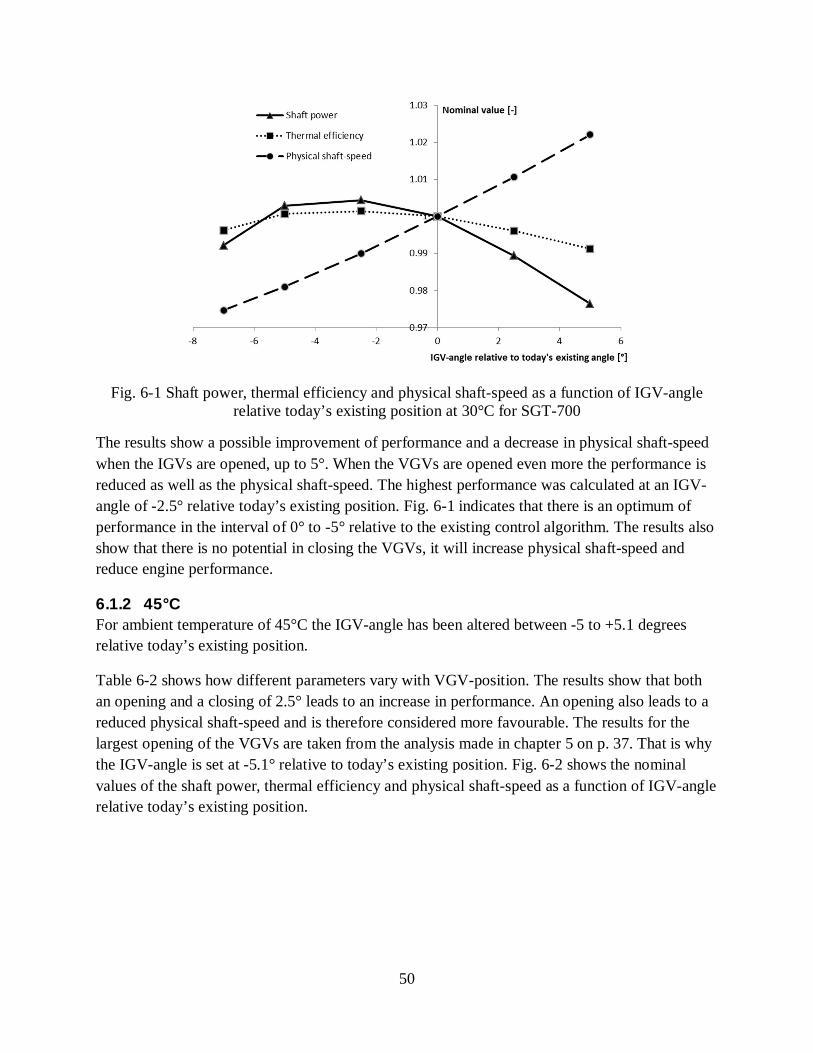
50
Fig. 6-1 Shaft power, thermal efficiency and physical shaft-speed as a function of IGV-anglerelative today’s existing position at 30°C for SGT-700
The results show a possible improvement of performance and a decrease in physical shaft-speedwhen the IGVs are opened, up to 5°. When the VGVs are opened even more the performance isreduced as well as the physical shaft-speed. The highest performance was calculated at an IGV-angle of -2.5° relative today’s existing position. Fig. 6-1 indicates that there is an optimum ofperformance in the interval of 0° to -5° relative to the existing control algorithm. The results alsoshow that there is no potential in closing the VGVs, it will increase physical shaft-speed andreduce engine performance.
6.1.2 45°CFor ambient temperature of 45°C the IGV-angle has been altered between -5 to +5.1 degreesrelative today’s existing position.
Table 6-2 shows how different parameters vary with VGV-position. The results show that bothan opening and a closing of 2.5° leads to an increase in performance. An opening also leads to areduced physical shaft-speed and is therefore considered more favourable. The results for thelargest opening of the VGVs are taken from the analysis made in chapter 5 on p. 37. That is whythe IGV-angle is set at -5.1° relative to today’s existing position. Fig. 6-2 shows the nominalvalues of the shaft power, thermal efficiency and physical shaft-speed as a function of IGV-anglerelative today’s existing position.

51
Table 6-2 Gas turbine performance for different VGV-positions at 45°C for SGT-700
Parameters Nominal valuesIGV-angle rel. today's existing angle [˚] 5 2.5 -2.5 -5.1Shaft power 0.980 1.001 1.010 0.990GT shaft thermal eff. 0.993 1.000 1.003 0.997Compressor isentr. eff. 0.994 0.999 1.003 1.001CT isentr. eff. 1.002 1.001 0.999 0.998PT isentr. eff. 1.000 1.000 1.000 1.000Pressure ratio 0.990 1.001 1.005 0.994Corr. mass flow 0.990 1.001 1.005 0.995Shaft-speed 1.019 1.008 0.988 0.978Aerodyn. shaft-speed 1.019 1.008 0.988 0.978
Fig. 6-2 Shaft power, thermal efficiency and physical shaft-speed as a function of IGV-anglerelative today’s existing position at 45°C for SGT-700
6.2 SGT-750For SGT-750 an opening of 5° at 30°C was not possible to test due to problems withconvergence in the calculations. Calculations show that the problem occurs in the front stageswhere the stage loading gets to high resulting in detachment of the boundary layers.
6.2.1 30°CFor ambient temperature of 30°C the IGV-angle have been altered between -5 to +5 degreesrelative today’s existing position. Because of problems with convergence the results for opening5 degrees will not be presented.
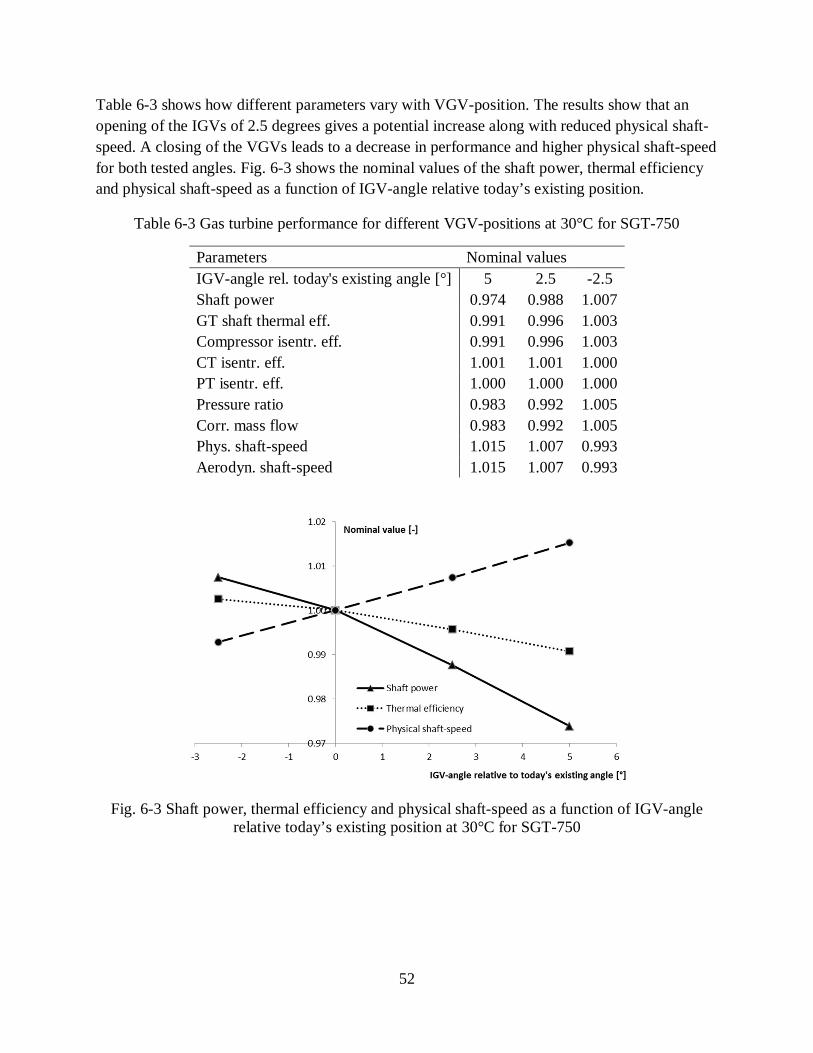
52
Table 6-3 shows how different parameters vary with VGV-position. The results show that anopening of the IGVs of 2.5 degrees gives a potential increase along with reduced physical shaft-speed. A closing of the VGVs leads to a decrease in performance and higher physical shaft-speedfor both tested angles. Fig. 6-3 shows the nominal values of the shaft power, thermal efficiencyand physical shaft-speed as a function of IGV-angle relative today’s existing position.
Table 6-3 Gas turbine performance for different VGV-positions at 30°C for SGT-750
Parameters Nominal valuesIGV-angle rel. today's existing angle [°] 5 2.5 -2.5Shaft power 0.974 0.988 1.007GT shaft thermal eff. 0.991 0.996 1.003Compressor isentr. eff. 0.991 0.996 1.003CT isentr. eff. 1.001 1.001 1.000PT isentr. eff. 1.000 1.000 1.000Pressure ratio 0.983 0.992 1.005Corr. mass flow 0.983 0.992 1.005Phys. shaft-speed 1.015 1.007 0.993Aerodyn. shaft-speed 1.015 1.007 0.993
Fig. 6-3 Shaft power, thermal efficiency and physical shaft-speed as a function of IGV-anglerelative today’s existing position at 30°C for SGT-750

53
6.2.2 45°CFor ambient temperature of 45°C the IGV-angle has been altered between -7.77 to +5 degreesrelative today’s existing position.
Table 6-4 presents the variation in performance as the VGV-position was altered. The results forthe largest opening of the VGVs are taken from the analysis made in chapter 5 on p. 37. That iswhy the IGV-angle is set at -7.77° relative to today’s existing position for that case. Fig. 6-4shows the nominal values of the shaft power, thermal efficiency and physical shaft-speed as afunction of IGV-angle relative today’s existing position.
Table 6-4 Gas turbine performance for different VGV-positions at 45°C for SGT-750
Parameters Nominal valuesIGV-angle rel. today's existing angle [°] 5 2.5 -2 -4 -6 -7.77Shaft power 0.983 1.000 1.026 1.033 1.032 1.030GT shaft thermal eff. 0.994 1.000 1.011 1.013 1.013 1.012Compressor isentr. eff. 0.994 0.999 1.008 1.010 1.010 1.009CT isentr. eff. 1.001 1.001 1.000 0.999 0.999 0.999PT isentr. eff. 1.000 1.000 1.001 1.001 1.001 1.001Pressure ratio 0.991 1.001 1.016 1.020 1.019 1.017Corr. mass flow 0.991 1.001 1.016 1.020 1.019 1.017Phys. shaft-speed 1.020 1.011 0.996 0.991 0.986 0.984Aerodyn. shaft-speed 1.020 1.011 0.996 0.991 0.986 0.984
Fig. 6-4 Shaft power, thermal efficiency and physical shaft-speed as a function of IGV-anglerelative today’s existing position at 45°C for SGT-750

54
The result shows that an opening of the VGVs leads to an increase in performance and reducedphysical shaft-speed. A closing of the VGVs gives different results depending on how much theangle is altered. For a closing of 2.5° the performance is almost constant but for a closing of 5°the performance decreases. As a closing of the VGVs also increases the physical shaft-speedwhile an opening results in lower physical shaft-speed, an opening is favourable.
The highest performance was calculated at an IGV-angle of -4° relative to today’s existingposition. According to the results there is an optimum in the interval of -2° to -6° relative totoday’s existing position.
6.3 SummaryIn this chapter the approach was to open and close the VGVs to investigate how the gas turbineperformance was affected for SGT-700 and SGT-750. The study was performed for ambienttemperatures of 30 and 45°C.
For SGT-700 an opening of the VGVs at 30°C resulted in an increase in performance as well aslowered shaft-speed as long as the IGV was opened no more than 5°. When the VGVs wereopened even more the performance was reduced. The highest performance was calculated at anIGV-angle of -2.5° relative to today’s existing position. According to the results there is anoptimum in the interval of 0° to -5° relative to today’s existing position.
A closing of the VGVs at 30°C gave the opposite behaviour with a decrease in performance at ahigher shaft-speed. The conclusion is therefore that the hypothesis of closing the VGVs at 30°Cfor SGT-700 is proven false since the increase in CT efficiency is not sufficient to enhance thetotal performance.
At 45°C both an opening and a closing resulted in enhanced performance as long as the anglealteration was small. Opening the VGVs increased the performance more than closing. As aclosing of the VGVs also increases the physical shaft-speed while an opening results in lowerphysical shaft-speed the opening is favourable. The hypothesis of closing the VGVs at 45°C forSGT-700 is considered proven false since it is not a suitable solution, even though it doesenhance performance. An opening increases the performance more and reduces the physicalshaft-speed and is therefore more suitable.
For SGT-750 a closing of the VGVs at 30°C gave a decrease in performance at higher physicalshaft-speed. The hypothesis of closing the VGVs at 30°C for SGT-750 is considered proven falsesince the increase in CT efficiency is not sufficient to enhance the total performance.
It was impossible to model how SGT-750 would react to an opening of 5° at 30°C due toproblems with convergence. The front stages were too heavily loaded resulting in detachedboundary layers and steep pressure losses. A real engine might be able to run on these harshconditions but the modelling fails due to the restrictions, set to cover phenomena like fouling andmanufacturing differences, in the program. Even though a real engine could be able to run on
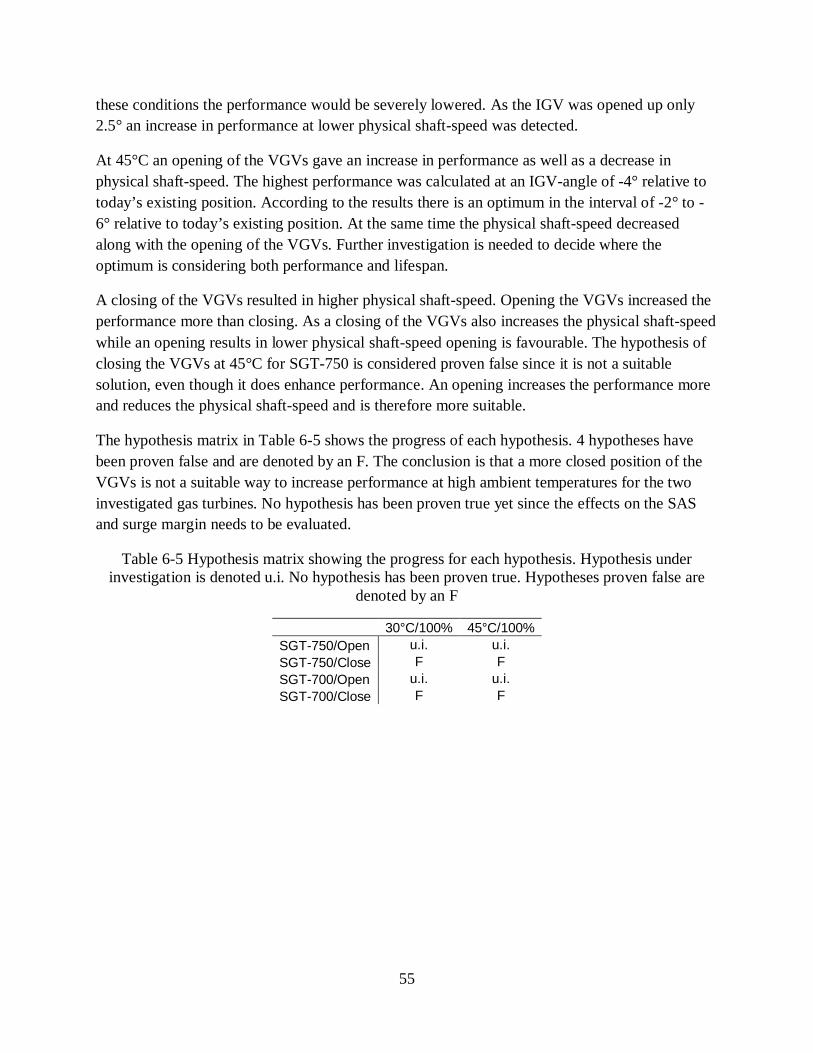
55
these conditions the performance would be severely lowered. As the IGV was opened up only2.5° an increase in performance at lower physical shaft-speed was detected.
At 45°C an opening of the VGVs gave an increase in performance as well as a decrease inphysical shaft-speed. The highest performance was calculated at an IGV-angle of -4° relative totoday’s existing position. According to the results there is an optimum in the interval of -2° to -6° relative to today’s existing position. At the same time the physical shaft-speed decreasedalong with the opening of the VGVs. Further investigation is needed to decide where theoptimum is considering both performance and lifespan.
A closing of the VGVs resulted in higher physical shaft-speed. Opening the VGVs increased theperformance more than closing. As a closing of the VGVs also increases the physical shaft-speedwhile an opening results in lower physical shaft-speed opening is favourable. The hypothesis ofclosing the VGVs at 45°C for SGT-750 is considered proven false since it is not a suitablesolution, even though it does enhance performance. An opening increases the performance moreand reduces the physical shaft-speed and is therefore more suitable.
The hypothesis matrix in Table 6-5 shows the progress of each hypothesis. 4 hypotheses havebeen proven false and are denoted by an F. The conclusion is that a more closed position of theVGVs is not a suitable way to increase performance at high ambient temperatures for the twoinvestigated gas turbines. No hypothesis has been proven true yet since the effects on the SASand surge margin needs to be evaluated.
Table 6-5 Hypothesis matrix showing the progress for each hypothesis. Hypothesis underinvestigation is denoted u.i. No hypothesis has been proven true. Hypotheses proven false are
denoted by an F
30°C/100% 45°C/100%SGT-750/Open u.i. u.i.SGT-750/Close F FSGT-700/Open u.i. u.i.SGT-700/Close F F

56
7 Evaluationofhowphysicalshaft-speedaffectslifespanTo evaluate the effects from the reduced physical shaft-speed on the lifespan, interviews havebeen held with Johan Kling and Jonas Gustafsson at SIT. The information gathered at thoseinterviews is summarized in this chapter.
7.1 SGT-700SGT-700’s lifespan is limited by creep damages at the second rotor of the CT. As discussed insection 2.9.4 on p. 24 the centrifugal stresses are proportional to the annulus area and to thesquare of the physical shaft-speed, hence a reduction in physical shaft-speed leads to lower stresslevels and less creep damages. Lower stress levels also increase the resistance to cyclic fatigue.
Table 6-2 on p. 51 presents that a 5° opening of the IGVs at 45°C leads to a reduction in physicalshaft-speed with roughly 2.2%. A reduction by 2.2% would lead to a tension reduction by around4% which results in an increased lifespan (Kling, 2014).
The tension reduction would be beneficial for the engine but not enough to increase the timebetween the service intervals for the second rotor of the CT (Kling, 2014).
7.2 SGT-750SGT-750’s lifespan is limited by cyclic fatigue damages at the CT rotor (Gustafsson, 2014). Asmentioned in the previous section a reduction in physical shaft-speed leads to lower stress levelsresulting in less cyclic fatigue and creep damages.
Table 6-4 on p. 53 presents that a 7.77° opening of the IGVs at 45°C leads to a reduction inphysical shaft-speed with roughly 1.6%. A reduction by 1.6% would lead to a tension reductionby around 3%. The reduction in stress levels is positive but too small to increase the timebetween the service intervals. Such low reductions in stress levels do not counterweight loss inperformance (Gustafsson, 2014). Comparing the case of opening 7.77° and opening 4° the lattercase is a more suitable way to control the VGVs.
7.3 SummaryThe decrease in physical shaft-speed gained from altered VGV-positions reduces the centrifugalstresses thereby increasing the lifespan of the components. The level of reduction is too smallhowever, to increase the service intervals as it is today. The decreases in centrifugal stresses arepositive but at such small levels the performance should be optimized without considering thephysical shaft-speed.
The hypothesis matrix in Table 7-1 shows the progress of each hypothesis. 4 hypotheses havebeen proven false and are denoted by an F.

57
Table 7-1 Hypothesis matrix showing the progress for each hypothesis. Hypothesis underinvestigation is denoted u.i. No hypothesis has been proven true. Hypotheses proven false are
denoted by an F
30°C/100% 45°C/100%SGT-750/Open u.i. u.i.SGT-750/Close F FSGT-700/Open u.i. u.i.SGT-700/Close F F
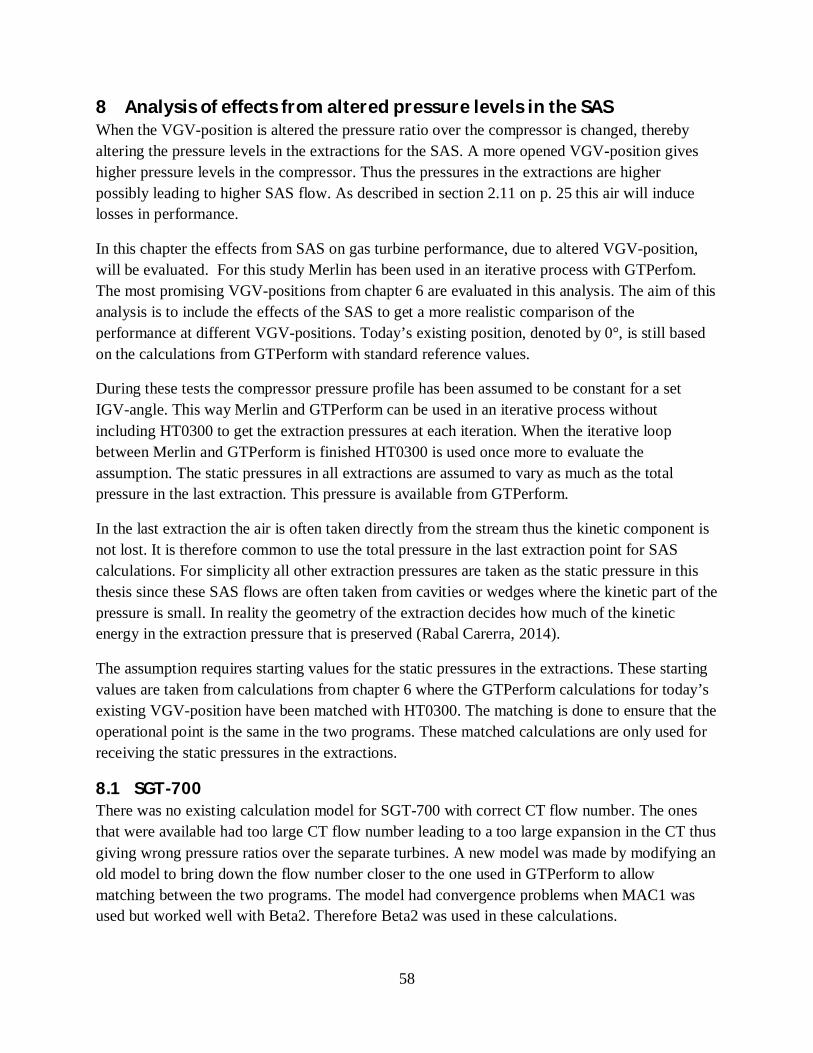
58
8 AnalysisofeffectsfromalteredpressurelevelsintheSASWhen the VGV-position is altered the pressure ratio over the compressor is changed, therebyaltering the pressure levels in the extractions for the SAS. A more opened VGV-position giveshigher pressure levels in the compressor. Thus the pressures in the extractions are higherpossibly leading to higher SAS flow. As described in section 2.11 on p. 25 this air will inducelosses in performance.
In this chapter the effects from SAS on gas turbine performance, due to altered VGV-position,will be evaluated. For this study Merlin has been used in an iterative process with GTPerfom.The most promising VGV-positions from chapter 6 are evaluated in this analysis. The aim of thisanalysis is to include the effects of the SAS to get a more realistic comparison of theperformance at different VGV-positions. Today’s existing position, denoted by 0°, is still basedon the calculations from GTPerform with standard reference values.
During these tests the compressor pressure profile has been assumed to be constant for a setIGV-angle. This way Merlin and GTPerform can be used in an iterative process withoutincluding HT0300 to get the extraction pressures at each iteration. When the iterative loopbetween Merlin and GTPerform is finished HT0300 is used once more to evaluate theassumption. The static pressures in all extractions are assumed to vary as much as the totalpressure in the last extraction. This pressure is available from GTPerform.
In the last extraction the air is often taken directly from the stream thus the kinetic component isnot lost. It is therefore common to use the total pressure in the last extraction point for SAScalculations. For simplicity all other extraction pressures are taken as the static pressure in thisthesis since these SAS flows are often taken from cavities or wedges where the kinetic part of thepressure is small. In reality the geometry of the extraction decides how much of the kineticenergy in the extraction pressure that is preserved (Rabal Carerra, 2014).
The assumption requires starting values for the static pressures in the extractions. These startingvalues are taken from calculations from chapter 6 where the GTPerform calculations for today’sexisting VGV-position have been matched with HT0300. The matching is done to ensure that theoperational point is the same in the two programs. These matched calculations are only used forreceiving the static pressures in the extractions.
8.1 SGT-700There was no existing calculation model for SGT-700 with correct CT flow number. The onesthat were available had too large CT flow number leading to a too large expansion in the CT thusgiving wrong pressure ratios over the separate turbines. A new model was made by modifying anold model to bring down the flow number closer to the one used in GTPerform to allowmatching between the two programs. The model had convergence problems when MAC1 wasused but worked well with Beta2. Therefore Beta2 was used in these calculations.

59
8.1.1 30°CTwo different IGV-angles, -2.5° and -5° relative to today’s existing position, have been analysedfor SGT-700 at 30°C since the optimum seemed to be located in the span of -5° to 0°. In Table8-1 and Table 8-2 the SAS mass flows from the extractions are shown. The results show that themass flow increases at the early stages while decreasing at the final stages.
The ratio between SAS flow and total flow is almost constant for the different VGV-positions.The physical shaft-speed is reduced when the VGV-position is more open due to lower turbineefficiency. Thus also the total flow is reduced. This will counteract the reduced SAS flowresulting in almost constant ratios. The cooling of the components is therefore not endangered.
Table 8-1 SAS mass flow from different compressor stages for different VGV-positions at 30°Cfor SGT-700
Parameters Nominal valuesIGV angle rel. today's existing angle[°] -2.5 -5Mass flow at stage 2 1.010 1.039Mass flow at stage 6 1.008 1.029Mass flow at stage 11 0.984 0.980
Table 8-2 The ratio between the SAS flow and the compressor inlet flow, stage 2 and 6, and theSAS flow and the turbine inlet flow, stage 11 at 30°C for SGT-700 compared to today’s existing
position
Parameters Nominal value of ratio between SAS flow and total flowIGV angle rel. today'sexisting angle[°] -2.5 -5
Mass flow at stage 2 1.025 1.059Mass flow at stage 6 1.022 1.049Mass flow at stage 11 0.998 1.000
In Table 8-3 the results from chapter 6 have been updated to include the changes in the SAS. Ifthe parameters in Table 8-3 are compared to the parameters in Table 6-1on p. 49 where thecalculations are without consideration to the effects from SAS, it could be seen that the valuesare reduced.
There is no longer any potential in opening the VGVs. The increased SAS flow leads to lowerturbine efficiencies thus reducing the physical shaft-speed and mass flow. The gain incompressor efficiency is not large enough to counteract the losses thus the thermal efficiency ofthe engine decreases due to the altered SAS flow.

60
Table 8-3 Gas turbine performance for different IGV-angles after considering the effects fromchanges in SAS at 30°C for SGT-700
Parameters Nominal valuesIGV angle rel. today's existing angle[°] -2.5 -5Shaft power 0.982 0.974GT shaft thermal eff. 0.991 0.987Compressor isentr. eff. 1.003 1.004CT isentr. eff. 0.990 0.988PT isentr. eff. 1.000 0.999Pressure ratio 0.985 0.979Corr. mass flow 0.986 0.981Physical shaft-speed 0.985 0.975Aerodyn. shaft-speed 0.985 0.975
8.1.2 45°CFor SGT-700 at 45°C the most promising VGV-position was an IGV-angle of -2.5° relative totoday’s position. In Table 8-4 and Table 8-5 the SAS mass flows from the extractions are shown.The results show that the mass flow increases at the early stages while decreasing at the finalstage.
The ratio between the SAS flow and the total flow is almost constant. The physical shaft-speedhas been reduced for the tested VGV-position due to lower turbine efficiency, therefore thelowered SAS flow from the last stages is counteracted by the lower total flow into the turbineresulting in almost constant ratios. Thus the cooling of the components is not endangered.
Table 8-4 SAS mass flow from different compressor stages for different VGV-positions at 45°Cfor SGT-700
Parameters Nominal valuesIGV angle rel. today's existing angle[°] -2.5Mass flow at stage 2 1.032Mass flow at stage 6 1.005Mass flow at stage 11 0.982

61
Table 8-5 The ratio between the SAS flow and the compressor inlet flow, stage 2 and 6, and theSAS flow and the turbine inlet flow, stage 11 at 45°C for SGT-700 compared to today’s existing
position
Parameters Nominal value of ratio between SAS flow and total flowIGV angle rel. today'sexisting angle[°] 2.5
Mass flow at stage 2 1.051Mass flow at stage 6 1.024Mass flow at stage 11 1.001
In Table 8-6 the results from chapter 6 have been updated to include the changes in the SAS. Ifthe parameters in Table 8-6 are compared to the parameters in Table 6-2 on p. 51 where thecalculations are without consideration to the effects from SAS, it could be seen that the valuesare reduced due to the new SAS flow.
Table 8-6 Gas turbine performance for different IGV-angles after considering the effects fromchanges in SAS at 45°C for SGT-700
Parameters Nominal valuesIGV angle rel. today's existing angle[°] -2Shaft power 0.974GT shaft thermal eff. 0.992Compressor isentr. eff. 1.004CT isentr. eff. 0.994PT isentr. eff. 1.002Pressure ratio 0.982Corr. mass flow 0.986Physical shaft-speed 0.983Aerodyn. shaft-speed 0.983
There is no longer any potential in opening the VGVs. The increased SAS flow leads to lowerCT efficiency thus reducing the physical shaft-speed and mass flow. The gain in compressor andPT efficiency is not large enough to counteract the losses thus the thermal efficiency of theengine decreases.
8.2 SGT-750A sufficient calculation model of SGT-750, needed for the calculations in Merlin, already existedso there was no need for adjusting the model. MAC1 was used for the calculations since itreduces the calculation time compared to using Beta2. The accuracy is sufficient using MAC1 sothere is no incentive for using Beta2 in this case.

62
SGT-750 has extractions at stage 3, 6, 9 and 11. The first extraction, at stage 3, has been left outof this study due to the small mass flows through that extraction. The cooling flow from stage 3does increase but the impact is so small that it was left out of the study to save time.
8.2.1 30°CFor SGT-750 at 30°C the only IGV-angle that showed an improved performance was an IGV-angle of -2.5° relative to today’s position. In Table 8-7 and Table 8-8 the SAS mass flows fromthe extractions are shown. The results show that the mass flow increases at all extractionsindicating increased losses. Meanwhile the mass flow through the engine has increased keepingthe ratios between SAS flow and inlet flow almost constant.
Table 8-7 SAS mass flow from different compressor stages for different VGV-positions at 30°Cfor SGT-750
Parameters Nominal valuesIGV angle rel. today's existing angle[°] -2.5Mass flow at stage 6 1.020Mass flow at stage 9 1.020Mass flow at stage 13 1.002
Table 8-8 The ratio between the SAS flow and the compressor inlet flow, stage 6 and 9, and theSAS flow and the turbine inlet flow, stage 13 at 30°C for SGT-750 compared to today’s existing
position
Parameters Nominal value of ratio between SAS flow and total flowIGV angle rel. today'sexisting angle[°] -2.5
Mass flow at stage 6 1.017Mass flow at stage 9 1.017Mass flow at stage 13 0.999
In Table 8-9 the results from chapter 6 have been updated to include the changes in the SAS. Ifthe parameters in Table 8-9 are compared to the parameters in Table 6-3 on p. 52 where thecalculations are without consideration to the effects from SAS, it could be seen that the valuesare reduced due to the increased SAS flow.

63
Table 8-9 Gas turbine performance for different VGV-positions after considering the effectsfrom changes in SAS at 30°C for SGT-750
Parameters Nominal valuesIGV angle rel. today's existing angle[°] -2.5Shaft power 1.005GT shaft thermal eff. 1.001Compressor isentr. eff. 1.003CT isentr. eff. 0.998PT isentr. eff. 1.000Pressure ratio 1.002Corr. mass flow 1.003Physical shaft-speed 0.992Aerodyn. shaft-speed 0.992
The results still show a possible improvement in performance as the IGVs are opened 2.5° at30°C. An opening of the IGV-angle of 2.5° compared to today’s existing position would have thepotential to increase the shaft power by 0.5% and reducing the physical shaft-speed by 0.8%.
8.2.2 45°CThree different IGV-angles have been analysed for SGT-750 at 45°C since the optimum seemedto be located within the span of these IGV-angles. In Table 8-10 and Table 8-11 the SAS massflows from the extractions are shown. The results show that the mass flow increases at allextractions for all cases indicating increased losses. Meanwhile the mass flow through the enginehas increased keeping the ratios between SAS flow and inlet flow almost constant. Thus thecooling of the components is not endangered.
Table 8-10 SAS mass flow from different compressor stages for different VGV-positions at 45°Cfor SGT-750
Parameters Nominal valuesIGV angle rel. today's existing angle[°] -2 -4 -6Mass flow at stage 6 1.007 1.034 1.045Mass flow at stage 9 1.002 1.028 1.037Mass flow at stage 13 1.015 1.015 1.013

64
Table 8-11 The ratio between the SAS flow and the compressor inlet flow, stage 6 and 9, and theSAS flow and the turbine inlet flow, stage 13 at 45°C for SGT-750 compared to today’s existing
position
Parameters Nominal value of ratio between SAS flow and total flowIGV angle rel. today'sexisting angle[°] -2 -4 -6
Mass flow at stage 6 0.994 1.017 1.031Mass flow at stage 9 0.988 1.012 1.023Mass flow at stage 13 1.001 0.999 1.000
In Table 8-12 the results from chapter 6 have been updated to include the changes in the SAS.Opening the VGVs still shows an improved performance, with both higher shaft power andthermal efficiency. An opening of the IGV-angle by 4° showed a potential of increasing the shaftpower by 2.9% and increasing the thermal efficiency by 1.1% as well decreasing the physicalshaft-speed by 0.9%.
Table 8-12 Gas turbine performance for different IGV-angles after considering the effects fromchanges in SAS at 45°C for SGT-750
Parameters Nominal valuesIGV angle rel. today's existing angle[°] -2 -4 -6Shaft power 1.025 1.029 1.025GT shaft thermal eff. 1.010 1.011 1.009Compressor isentr. eff. 1.008 1.010 1.010CT isentr. eff. 0.999 0.998 0.997PT isentr. eff. 1.001 1.001 1.001Pressure ratio 1.015 1.016 1.012Corr. mass flow 1.014 1.016 1.014Physical shaft-speed 0.996 0.991 0.985Aerodyn. shaft-speed 0.996 0.991 0.985
If the parameters in Table 8-12 are compared to the parameters in Table 6-4 on p. 53 where thecalculations are without consideration to the effects from SAS, it could be seen that the valuesare reduced, confirming that the increased SAS flow has led to a small reduction in performance.The results show a steeper gradient between the cases of an IGV-angle of -4° and -6° due to thefact that the latter case has a bigger increase in SAS mass flow and therefore more performancelosses occur.

65
8.3 SummaryThe aim of this chapter was to evaluate how the different VGV-positions affected the SAS andthe differences this made to the cycle. The study was made through an iterative process betweenGTPerform and Merlin. To simplify the time consuming process the compressor pressure profilewas assumed to be fixed for a set IGV-angle thus excluding HT0300 from the iterative process.In the end HT0300 was used to evaluate how the new operational point affected the compressorand to evaluate the accuracy of the assumption.
The results show that there is no potential in opening the VGVs for SGT-700 at high ambienttemperatures. For both 30 and 45° the new SAS flow decreased the CT efficiency leading tolower physical shaft-speed and lower mass flow. This affected the cycle negatively and resultedin lower thermal efficiency and lower shaft power compared to using today’s existing VGV-position.
The evaluation using HT0300 showed that the compressor was affected by the new operationalpoints and that the assumption made of constant compressor pressure profile was not accurate forSGT-700. HT0300 predicted that the compressor would operate at lower efficiency but at highermass flow due to the new operational points. It also predicted that the pressure profile wouldchange towards higher pressures in the first stages but the same pressures in the last stages. Thiswould lead to increased SAS flow from the first extractions inducing more losses while keepingthe SAS flow from the last stages nearly constant.
If the new data from HT0300 were to be used it would have led to lower compressor efficiencydue to the new operational points and lower turbine efficiency due to the increase in SAS flowfrom the early extractions. Since the results already showed no potential the tests were notrepeated to ensure more accurate results. The new results would only confirm that SGT-700 doesnot benefit from a more opened VGV at 30 or 45°C. The hypothesis of opening the VGVs at 30and 45°C for SGT-700 is therefore considered proven false.
The results were more optimistic for SGT-750. Improved performance is possible at both 30 and45°C if the VGVs are opened. For 30°C and an opening of 2.5° the results show a possibleincrease of the thermal efficiency by 0.1% and the shaft power could increase 0.5%. Furtherinvestigation is needed to ensure surge margin. At 45°C an opening led to higher performancewith higher thermal efficiency and higher shaft power. The highest performance was stillcalculated at an IGV-angle of -4° relative today’s existing position with a potential improvementof thermal efficiency by 1.1% and shaft power by 2.9%. Further investigation is needed to ensuresurge margin.
The iteration process with Merlin and GTPerform led to slightly different operational points forSGT-750 compared to the ones from chapter 6. HT0300 was used to see how the differencesaffected the compressor. The results showed no significant differences and the decision was

66
therefore to not repeat the iteration loop between HT0300 and GTPerform for the newoperational points.
The HT0300 calculation also showed that the assumption that the compressor pressure profilewas constant for a set IGV-angle was not entirely correct but the errors encountered were small.A more correct way would have been to use slightly higher pressures in the first stages. Theassumption was accurate for the last compressor stages. Still the results are considered reliablesince the errors encountered were in the order of tenths of bar.
The hypothesis matrix in Table 8-13 shows the progress of each hypothesis. 6 hypotheses havebeen proven false and are denoted by an F. The conclusion is that no possible improvements canbe achieved by adjusting the VGVs for the SGT-700 at full load and high ambient temperatures.Opening the VGVs for SGT-750 at full load is the only option that still has potential to increasethe performance at high ambient temperatures. No hypothesis has been proven true yet since theeffects on the surge margin needs to be evaluated.
Table 8-13 Hypothesis matrix showing the progress for each hypothesis. Hypothesis underinvestigation is denoted u.i. No hypothesis has been proven true. Hypotheses proven false are
denoted by an F
30°C/100% 45°C/100%SGT-750/Open u.i. u.i.SGT-750/Close F FSGT-700/Open F FSGT-700/Close F F

67
9 AnalysisofsurgemarginAs discussed in section 2.10 on p. 24 the surge margin can be calculated according toEqu. ( 2-16 ) where the changes in mass flow are neglected or according to Equ. ( 2-17 ) wherethe changes in mass flow are taken into account. In this chapter both types of surge margin willbe analysed. When the VGV-position is adjusted the corrected mass flow and the pressure ratiowill be affected thereby affecting the surge margin. In this chapter the effects on the surgemargin, due to the altered VGV-position, will be evaluated. The analysis will only be performedfor SGT-750 since the result from the previous chapter showed that there are no potential forenhanced performance in adjusting the VGV-position for SGT-700.
As the VGVs are altered both the running line and the surge line will be affected. Today thesurge margin during operation of SIT’s gas turbines is measured by measuring the angle of thefuel valve, thus measuring the fuel mass flow entering the combustion chamber and from therecalculating how the pressure ratio is affected. A better way would be to measure the pressureratio directly but until now the measurement has been assumed too slow (Axelsson, 2014). Newcalculations indicate that this assumption is no longer valid. This is further discussed inAppendix A.
9.1 NumericalsurgemarginSurge margin can be calculated with measured values from tests but also from calculated values.When the surge margin is based on calculated values it is referred to as numerical surge margin.The method used is to set the aerodynamic shaft-speed in HT0300 and then increase the pressureratio until the program does not converge. The last point that is able to converge is used as surgepoint. This is an effective way to estimate the surge margin without having the need to run thetest rig. This chapter is based on the numerical surge margin.
The results in this chapter are presented as relative differences from the existing surge marginaccording to Equ. ( 9-1 ). In this chapter the case with the today’s existing VGV-position isbased on calculations where GTPerform has been matched with HT0300. The matching is doneto ensure that the operational point is the same in the two programs. This since the pressure ratiosneeded to calculate the surge margin are gathered from HT0300.
− ( 9-1 )
The method used is not sufficiently accurate and the surge margin should be measured in test rigsto be fully evaluated. Still the results can be used to see trends and evaluate if the performance isendangering the surge margin.
9.1.1 30°CThe only IGV-angle that showed an improved performance at 30°C was an IGV-angle of -2.5°relative to today’s position. In Fig. 9-1 the nominal surge margin for the two tested IGV-angles ispresented.
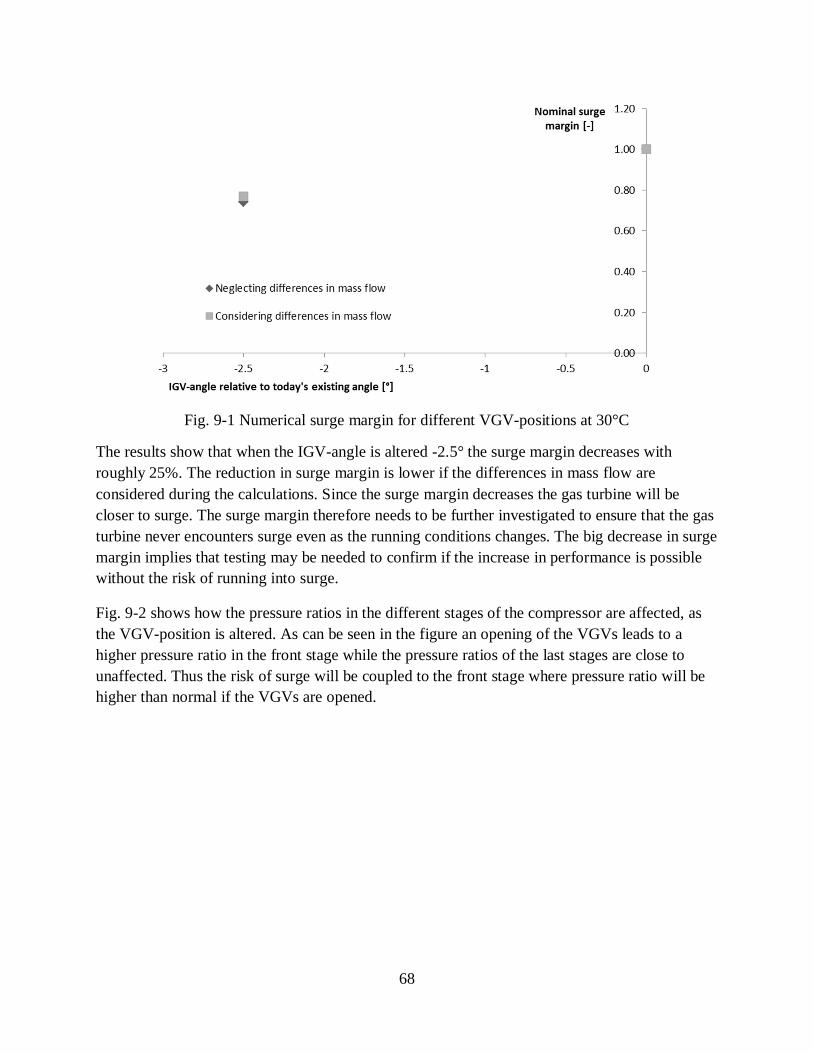
68
Fig. 9-1 Numerical surge margin for different VGV-positions at 30°C
The results show that when the IGV-angle is altered -2.5° the surge margin decreases withroughly 25%. The reduction in surge margin is lower if the differences in mass flow areconsidered during the calculations. Since the surge margin decreases the gas turbine will becloser to surge. The surge margin therefore needs to be further investigated to ensure that the gasturbine never encounters surge even as the running conditions changes. The big decrease in surgemargin implies that testing may be needed to confirm if the increase in performance is possiblewithout the risk of running into surge.
Fig. 9-2 shows how the pressure ratios in the different stages of the compressor are affected, asthe VGV-position is altered. As can be seen in the figure an opening of the VGVs leads to ahigher pressure ratio in the front stage while the pressure ratios of the last stages are close tounaffected. Thus the risk of surge will be coupled to the front stage where pressure ratio will behigher than normal if the VGVs are opened.

69
Fig. 9-2 Relative pressure ratio in the compressor stages for a 2.5° more open VGV-position at30°C compared to today’s position
9.1.2 45°CThree different IGV-angles have been evaluated at 45°C. Fig. 9-3 shows nominal surge marginfor the tested cases.
Fig. 9-3 Nominal surge margin for different VGV-positions at 45°C
The results show that all tested angles give a decrease in surge margin if the differences in massflow are neglected. If the differences in mass flow are considered the surge margin does increaseslightly at an IGV-angle of -2° relative today’s angle before dropping as the VGV-position is

70
more opened. Since the surge margin decreases the gas turbine will be closer to surge. The surgemargin therefore needs to be further investigated to ensure that the gas turbine never encounterssurge even as the running conditions changes.
For the best case, when the IGV-angle is opened 4° compared to today’s existing position, thesurge margin decreases by less than 10 % for both tested calculation methods. Considering thatno margin is needed for sudden increases in load, as the engine is assumed running at full load,the improvement may be possible without the risk of running into surge.
Fig. 9-4 shows how the pressure ratios in the different stages of the compressor are affected, asthe VGV-position is altered. As can be seen in the figure an opening of the VGVs leads to ahigher pressure ratio in the front stage while the pressure ratio of the last stages decrease slightly.Thus the risk of surge will be coupled to the front stage where pressure ratio will be higher thannormal if the VGVs are opened. An opening of 6° gives the highest pressure ratio for the firststage and it can be seen that the pressure ratio increases as the opening angle increases. Thus therisk for surge in the first stage increases as the VGV-position is opened.
Fig. 9-4 Relative pressure ratio in the compressor stages for different VGV-positions at 45°C
9.2 SummaryWhen the VGV-position is altered to a more opened position the pressure ratio over thecompressor and the corrected mass flow are altered thereby affecting the surge margin. The moreopened VGV-position gives a reduced surge margin indicating that the gas turbine would becloser to surge. This confirms the findings by Razak (2007, pp. 246-248) earlier described insection 2.10 on p. 24.

71
The more opened VGV-position gives a higher pressure ratio in the front stage while thepressure ratios of the last stages decrease slightly. Thus the risk of surge will be coupled to thefront stage.
At full load there is no risk that the load will increase and the surge margin does therefore notneed to be as large as at part load. Since these calculations are performed for full load the smallersurge margin could be within accepted limits. To fully evaluate the surge margin and thepotential of our calculations experimental tests have to be performed in test-rig.
It is difficult to evaluate how much the surge margin can decrease before the limit is reached.The results show that an opening of the IGVs of 4° relative to today’s existing position at 45°Ccould improve the performance without having a big impact on the surge margin. At 30°C anopening of the IGVs of 2.5° relative today’s existing position also showed enhancedperformance but at the same time the surge margin was reduced by roughly 25%. Assuming thata big part of the surge margin is used to protect the engines at rapid increases in load thisreduction might be acceptable. The hypotheses regarding an opening of the VGVs for SGT-750at both 30 and 45°C are considered proven true.
The hypothesis matrix in Table 9-1 shows the progress of each hypothesis. 6 hypotheses havebeen proven false and are denoted by an F and 2 hypotheses have been proven true and aredenoted by a T. The conclusion is that no possible improvements can be achieved by adjustingthe VGVs for the SGT-700 at full load and high ambient temperatures. Opening the VGVs forSGT-750 at full load is the only option that has potential to increase the performance at highambient temperatures.
Table 9-1 Hypothesis matrix showing the progress for each hypothesis. Hypothesis underinvestigation is denoted u.i. Hypotheses proven true are denoted by a T. Hypotheses proven false
are denoted by an F
30°C/100% 45°C/100%SGT-750/Open T TSGT-750/Close F FSGT-700/Open F FSGT-700/Close F F

72
10 AnalysisoftheperformanceatpartloadToday SIT controls the VGVs as a function of aerodynamic shaft-speed, without considering thereason for reaching a specific aerodynamic shaft-speed. This is beneficial since it minimizes thenumber of input parameters to the control algorithm thus limiting the need of computational timeand number of measurement probes. It would therefore be beneficial if a new control algorithmbased on the results from chapter 8 can be used without having to increase the number of inputparameters.
To test this, the proposed settings for the VGV-positions for SGT-750 at full load have beentested for other ambient temperatures and part load. The load has been chosen to give the sameaerodynamic shaft-speed thus giving the ability to test if the proposed VGV-position stillimproves the performance independent of load and ambient temperature. This would imply that anew control algorithm based on the proposed VGV-position can still operate with only theaerodynamic shaft-speed as input parameter.
This analysis is only performed for SGT-750 since the earlier results showed that SGT-700 seemto be running at optimum VGV-settings. GTPerform and Merlin have been used to perform thisanalysis. The compressor pressure profile is assumed constant as the load varies, i.e. the pressureprofile is assumed to match earlier results for the same VGV-position. The input parameters forthe compressor are taken from earlier calculations involving HT0300 and GTPerform.
The first step is to find the correct load that gives the same aerodynamic shaft-speed at the newambient temperature. The shaft power is then locked while Merlin and GTPerform are used in aniterative process to evaluate the new SAS flow and the impact on the turbines. The results arethen compared to the performance at that shaft power if today’s existing control algorithm at thatambient temperature is used. The results from the comparison are then compared to theimprovement found in chapter 8. If these match it implies that the proposed control algorithmgives the same improvement at a specific aerodynamic shaft-speed independent of the load andambient temperature.
This chapter is divided into three sections. The first two sections contain the results for the twotested aerodynamic shaft-speeds and the third section contains a summary and a comparison ofthe results from the two earlier sections. The two tested aerodynamic shaft-speeds are 99.2% ofaerodynamic shaft-speed at design point, from the proposed VGV-position at 30°C, and 97.7%,from the proposed VGV-position at 45°C.
10.1 99.2%ofaerodynamicshaft-speedatdesignpointAccording to the results in chapter 8 the full load performance of SGT-750 would increase at30°C if the VGV-position was opened 2.5° relative today’s existing position. The newoperational point would then correspond to an aerodynamic shaft-speed of 99.2% of designspeed. To see if the increase in performance is independent of load two part loads thatcorrespond to the same aerodynamic shaft-speed but different inlet temperatures are tested.
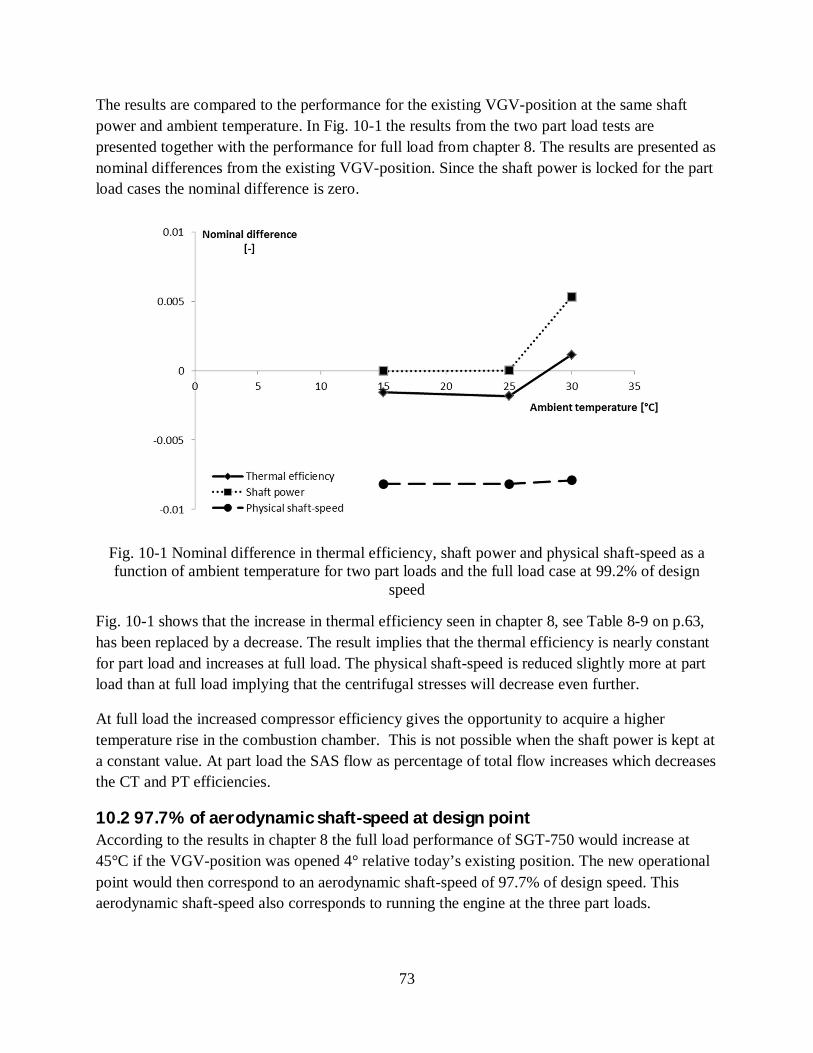
73
The results are compared to the performance for the existing VGV-position at the same shaftpower and ambient temperature. In Fig. 10-1 the results from the two part load tests arepresented together with the performance for full load from chapter 8. The results are presented asnominal differences from the existing VGV-position. Since the shaft power is locked for the partload cases the nominal difference is zero.
Fig. 10-1 Nominal difference in thermal efficiency, shaft power and physical shaft-speed as afunction of ambient temperature for two part loads and the full load case at 99.2% of design
speed
Fig. 10-1 shows that the increase in thermal efficiency seen in chapter 8, see Table 8-9 on p.63,has been replaced by a decrease. The result implies that the thermal efficiency is nearly constantfor part load and increases at full load. The physical shaft-speed is reduced slightly more at partload than at full load implying that the centrifugal stresses will decrease even further.
At full load the increased compressor efficiency gives the opportunity to acquire a highertemperature rise in the combustion chamber. This is not possible when the shaft power is kept ata constant value. At part load the SAS flow as percentage of total flow increases which decreasesthe CT and PT efficiencies.
10.2 97.7%ofaerodynamicshaft-speedatdesignpointAccording to the results in chapter 8 the full load performance of SGT-750 would increase at45°C if the VGV-position was opened 4° relative today’s existing position. The new operationalpoint would then correspond to an aerodynamic shaft-speed of 97.7% of design speed. Thisaerodynamic shaft-speed also corresponds to running the engine at the three part loads.

74
The results are compared to the performance for the existing VGV-position at the same shaftpower and ambient temperature. In Fig. 10-2 the result from the three part load tests arepresented together with the performance for full load from chapter 8. The results are presented asnominal differences from the existing VGV-position. Since the shaft power is locked for the partloads the nominal difference is zero.
Fig. 10-2 Nominal difference in thermal efficiency, shaft power and physical shaft-speed as afunction of ambient temperature for three part loads and the full load case at 97.7% of design
speed
Fig. 10-2 shows that the improvement seen in chapter 8, see Table 8-12 on p.64, has beenreduced. The thermal efficiency still increases for the part load cases if the VGV-position is moreopened but the increase is less than in chapter 8. The result implies that the thermal efficiency isconstant for part load and increases at full load. The physical shaft-speed is reduced slightlymore at part load than at full load implying that the centrifugal stresses will decrease evenfurther.
At full load the increased compressor efficiency gives the opportunity to acquire a highertemperature rise in the combustion chamber. This is not possible when the shaft power is kept ata constant value. At part load the SAS flow as percentage of total flow increases which decreasesthe CT and PT efficiencies.
10.3 SummaryThe aim of this chapter was to evaluate if the control algorithm proposed in chapter 8 could beused with aerodynamic shaft-speed as the only input. The analyses were performed for both theVGV-position proposed to be used at 30°C and the VGV-position proposed to be used at 45°Cfor SGT-750. The proposed VGV-positions were in this chapter tested for the same aerodynamic

75
shaft-speed but at part load and different ambient temperatures to evaluate if the performancewas still improved.
The result shows that at 99.2% of design speed the increase in performance gained in chapter 8 isnow lost. At part load the new VGV-position instead gives a reduced performance. At 97.7% ofdesign speed the results shows that the performance still increases but compared to the result inchapter 8 the increase is less. At part load the mass flow of cooling air is larger at all extractionleading to increased cooling and inducing losses. Thus the performance for both testedaerodynamic shaft-speeds is reduced. At full load the increased compressor efficiency gives theopportunity to acquire a larger temperature rise in the combustion chamber which increases thethermal efficiency.
The analysis in this chapter implies that the proposed control algorithm in chapter 8 is not onlydependent on aerodynamic shaft-speed. The control algorithm could still be used with only theaerodynamic shaft-speed as input but then the gained performance at full load will be lost.Further discussion concerning which control algorithms that can be used could be found inAppendix B.
The results also imply that the enhanced performance seen in chapter 8 is mainly due to thepossibility to require a larger temperature rise in the combustion chamber. As the compressorefficiency is increased the temperature into the combustion chamber will decrease. With a fixedTIT this gives the opportunity to increase the temperature rise in the combustion chamber.
As this is not possible at part load where the shaft power is kept at a constant level thisphenomena will not occur. At part load it is only the behavior of the individual components thataffects the cycle performance. The results show that the gain in performance at part load is muchlower than the gain at full load. This implies that the pure effects from the components are only aminor part of the total increase.

76
11 AnalysisofeffectsfromseparatecontrollingofIGVandfirststatorIn previous studies the IGV and S1 have been assumed to follow the existing gear ratio for thegas turbines. In this chapter the IGV and S1 will be moved separately to investigate which gearratio that is the most suitable. The study will be performed for SGT-700 at 30°C since SGT-700showed no improvement in performance in the previous studies. The IGV will be kept at theprevious investigated angles -2.5, 0, 2.5 and 5° compared to today’s existing position.Meanwhile S1 will be adjusted to different angles at each IGV-position to evaluate performanceand influence on the SAS.
From chapter 6 it was clear that the changes in SAS flow led to a reduction in performance as theVGV-positions were more opened. It is therefore interesting not only to vary S1 to try tocounterweight these effects but also to test a closing of the VGVs to see how the SAS flowaffects the performance.
This chapter is divided into three sections. In the first section the effects on the compressor as theVGV-positions are varied are evaluated. In the second section the effects on the SAS and thusthe effects on the CT due to changed SAS flow are evaluated. Each section is further divided intofour subsections, one for each tested IGV-angle. The last section is a summary where the resultsare compared and summarized.
11.1 EvaluationofeffectsfromdifferentanglesThe results in this section are first shown as absolute values and then compared to the values fortoday’s existing position, here marked as IGV-angle 0° and S1-angle 0°. The S1-angle is markedas 0° if it adjusted according to today’s existing gear ratio thus the S1-angle can be noted as 0°more than once in each table even though these angles are not the same. The S1-angle isadjusted as long as the performance increases in comparison with performance for the existingS1-angle at that IGV-angle.
11.1.1 IGV-angle-2.5°In Table 11-1 the result for when the IGV-angle is closed 2.5° compared to today’s existingposition is presented. Here the S1-angle has been adjusted to five different positions.

77
Table 11-1 Gas turbine performance for today’s existing position and for different S1-angleswhen the IGV-angle is altered -2.5°
Parameters Nominal valuesIGV-angle rel. today's existing angle [°] -2.5 -2.5 -2.5 -2.5 -2.5S1-angle rel. today's existing S1-angle [°] -1.89 -1.26 -0.63 0 0.63Shaft power 1.006 1.006 1.005 1.004 1.004GT shaft thermal eff. 1.002 1.002 1.002 1.001 1.001Comp. isentr. eff. 1.003 1.003 1.003 1.002 1.002CT isentr. eff. 0.999 0.999 0.999 0.999 0.999PT isentr. eff. 1.000 1.000 1.000 1.000 1.000Pressure ratio 1.003 1.003 1.002 1.002 1.002Corr. mass flow 1.003 1.004 1.003 1.002 1.002Physical shaft-speed 0.986 0.987 0.988 0.990 0.990Aerodyn. shaft-speed 0.986 0.987 0.988 0.990 0.990
Table 11-1 shows that all tested S1- angles give an increase in shaft power and thermalefficiency when the IGV-angle is opened 2.5° compared to the performance for today’s existingpositions. The highest performance is gained when the S1-angle is opened 1.89 and 1.26°. Theincrease is small however, for all tested S1-angles.
11.1.2 IGV-angle0°In Table 11-2 the results for when the IGV-angle is adjusted 0° compared to today’s existingposition are presented. Here the S1-angle has been adjusted to three different positions.
Table 11-2 Gas turbine performance for today’s existing position and for different S1-angleswhen the IGV-angle is altered 0°
Parameters Nominal valuesIGV-angle rel. today's existing angle [°] 0 0 0S1-angle rel. today's existing S1-angle [°] -0.63 0.62 1.25Shaft power 1.000 1.000 0.998GT shaft thermal eff. 1.000 1.000 0.999Comp. isentr. eff. 1.000 1.000 0.999CT isentr. eff. 1.000 1.000 1.000PT isentr. eff. 1.000 1.000 1.000Pressure ratio 1.000 1.000 0.999Corr. mass flow 1.000 1.000 0.999Physical shaft-speed 0.998 1.002 1.003Aerodyn. shaft-speed 0.998 1.002 1.003
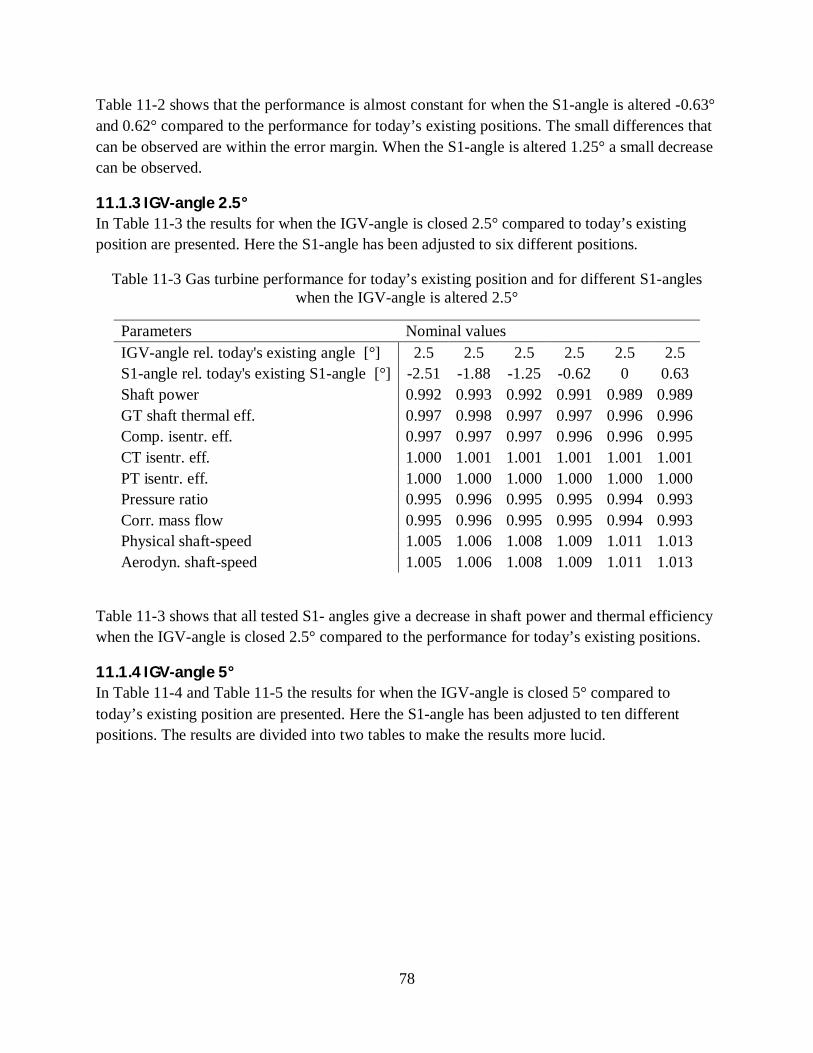
78
Table 11-2 shows that the performance is almost constant for when the S1-angle is altered -0.63°and 0.62° compared to the performance for today’s existing positions. The small differences thatcan be observed are within the error margin. When the S1-angle is altered 1.25° a small decreasecan be observed.
11.1.3 IGV-angle2.5°In Table 11-3 the results for when the IGV-angle is closed 2.5° compared to today’s existingposition are presented. Here the S1-angle has been adjusted to six different positions.
Table 11-3 Gas turbine performance for today’s existing position and for different S1-angleswhen the IGV-angle is altered 2.5°
Parameters Nominal valuesIGV-angle rel. today's existing angle [°] 2.5 2.5 2.5 2.5 2.5 2.5S1-angle rel. today's existing S1-angle [°] -2.51 -1.88 -1.25 -0.62 0 0.63Shaft power 0.992 0.993 0.992 0.991 0.989 0.989GT shaft thermal eff. 0.997 0.998 0.997 0.997 0.996 0.996Comp. isentr. eff. 0.997 0.997 0.997 0.996 0.996 0.995CT isentr. eff. 1.000 1.001 1.001 1.001 1.001 1.001PT isentr. eff. 1.000 1.000 1.000 1.000 1.000 1.000Pressure ratio 0.995 0.996 0.995 0.995 0.994 0.993Corr. mass flow 0.995 0.996 0.995 0.995 0.994 0.993Physical shaft-speed 1.005 1.006 1.008 1.009 1.011 1.013Aerodyn. shaft-speed 1.005 1.006 1.008 1.009 1.011 1.013
Table 11-3 shows that all tested S1- angles give a decrease in shaft power and thermal efficiencywhen the IGV-angle is closed 2.5° compared to the performance for today’s existing positions.
11.1.4 IGV-angle5°In Table 11-4 and Table 11-5 the results for when the IGV-angle is closed 5° compared totoday’s existing position are presented. Here the S1-angle has been adjusted to ten differentpositions. The results are divided into two tables to make the results more lucid.

79
Table 11-4 Gas turbine performance for today’s existing position and for different S1-angleswhen the IGV-angle is altered 5°
Parameters Nominal valuesIGV-angle rel. today's existing angle [°] 5 5 5 5 5S1-angle rel. today's existing S1-angle [°] -5.06 -4.43 -3.8 -3.17 -2.51Shaft power 0.983 0.984 0.982 0.981 0.980GT shaft thermal eff. 0.994 0.994 0.993 0.993 0.993Comp. isentr. eff. 0.994 0.994 0.993 0.993 0.992CT isentr. eff. 1.001 1.001 1.001 1.001 1.002PT isentr. eff. 1.000 1.000 1.000 1.000 1.000Pressure ratio 0.990 0.990 0.989 0.989 0.988Corr. mass flow 0.990 0.990 0.989 0.988 0.988Physical shaft-speed 1.011 1.013 1.013 1.014 1.017Aerodyn. shaft-speed 1.011 1.013 1.013 1.014 1.017
Table 11-5 Gas turbine performance for today’s existing position and for different S1-angleswhen the IGV-angle is altered 5°
Parameters Nominal valuesIGV-angle rel. today's existing angle [°] 5 5 5 5 5S1-angle rel. today's existing S1-angle [°] -1.88 -1.25 -0.63 0.00 0.63Shaft power 0.980 0.978 0.978 0.976 0.974GT shaft thermal eff. 0.993 0.992 0.992 0.991 0.991Comp. isentr. eff. 0.992 0.991 0.991 0.991 0.990CT isentr. eff. 1.002 1.002 1.002 1.002 1.002PT isentr. eff. 1.000 0.999 0.999 0.999 0.999Pressure ratio 0.988 0.987 0.987 0.986 0.985Corr. mass flow 0.988 0.987 0.987 0.986 0.985Physical shaft-speed 1.017 1.019 1.020 1.022 1.024Aerodyn. shaft-speed 1.017 1.019 1.020 1.022 1.024
Table 11-4 and Table 11-5 show that all tested S1- angles reduce the performance when the IGV-angle is opened 5° compared to the performance for today’s existing positions.
11.2 EvaluationofeffectsfromthesecondaryairsystemWhen the VGV-position is altered the pressure ratio over the compressor will change, asmentioned in chapter 8 on p. 58. This will affect the SAS and must therefore be furtherinvestigated. In this study GTPerform and Merlin are used in an iterative process as in chapter 8.
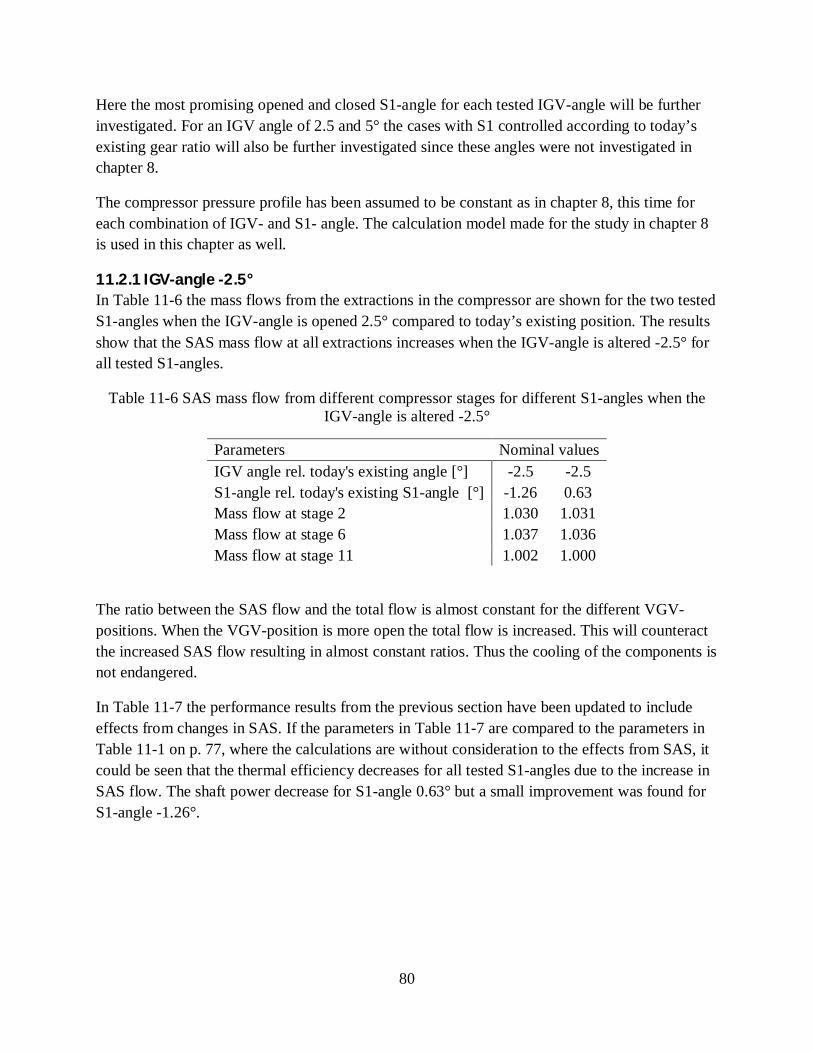
80
Here the most promising opened and closed S1-angle for each tested IGV-angle will be furtherinvestigated. For an IGV angle of 2.5 and 5° the cases with S1 controlled according to today’sexisting gear ratio will also be further investigated since these angles were not investigated inchapter 8.
The compressor pressure profile has been assumed to be constant as in chapter 8, this time foreach combination of IGV- and S1- angle. The calculation model made for the study in chapter 8is used in this chapter as well.
11.2.1 IGV-angle-2.5°In Table 11-6 the mass flows from the extractions in the compressor are shown for the two testedS1-angles when the IGV-angle is opened 2.5° compared to today’s existing position. The resultsshow that the SAS mass flow at all extractions increases when the IGV-angle is altered -2.5° forall tested S1-angles.
Table 11-6 SAS mass flow from different compressor stages for different S1-angles when theIGV-angle is altered -2.5°
Parameters Nominal valuesIGV angle rel. today's existing angle [°] -2.5 -2.5S1-angle rel. today's existing S1-angle [°] -1.26 0.63Mass flow at stage 2 1.030 1.031Mass flow at stage 6 1.037 1.036Mass flow at stage 11 1.002 1.000
The ratio between the SAS flow and the total flow is almost constant for the different VGV-positions. When the VGV-position is more open the total flow is increased. This will counteractthe increased SAS flow resulting in almost constant ratios. Thus the cooling of the components isnot endangered.
In Table 11-7 the performance results from the previous section have been updated to includeeffects from changes in SAS. If the parameters in Table 11-7 are compared to the parameters inTable 11-1 on p. 77, where the calculations are without consideration to the effects from SAS, itcould be seen that the thermal efficiency decreases for all tested S1-angles due to the increase inSAS flow. The shaft power decrease for S1-angle 0.63° but a small improvement was found forS1-angle -1.26°.
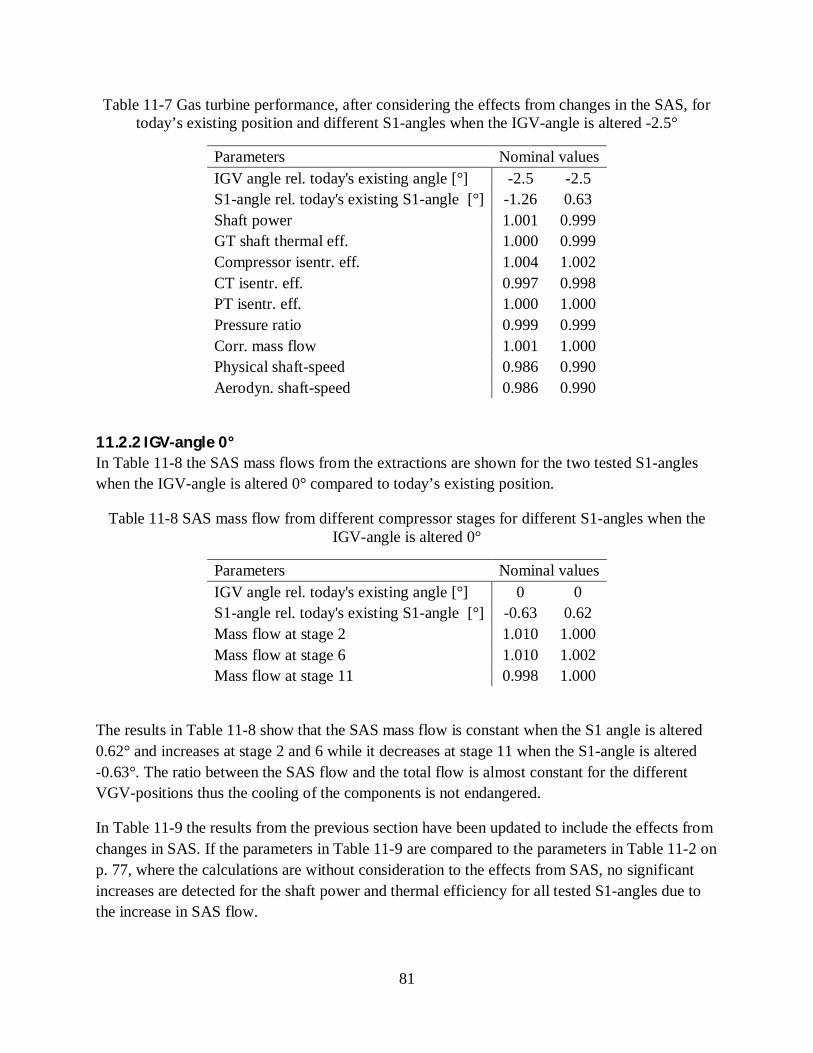
81
Table 11-7 Gas turbine performance, after considering the effects from changes in the SAS, fortoday’s existing position and different S1-angles when the IGV-angle is altered -2.5°
Parameters Nominal valuesIGV angle rel. today's existing angle [°] -2.5 -2.5S1-angle rel. today's existing S1-angle [°] -1.26 0.63Shaft power 1.001 0.999GT shaft thermal eff. 1.000 0.999Compressor isentr. eff. 1.004 1.002CT isentr. eff. 0.997 0.998PT isentr. eff. 1.000 1.000Pressure ratio 0.999 0.999Corr. mass flow 1.001 1.000Physical shaft-speed 0.986 0.990Aerodyn. shaft-speed 0.986 0.990
11.2.2 IGV-angle0°In Table 11-8 the SAS mass flows from the extractions are shown for the two tested S1-angleswhen the IGV-angle is altered 0° compared to today’s existing position.
Table 11-8 SAS mass flow from different compressor stages for different S1-angles when theIGV-angle is altered 0°
Parameters Nominal valuesIGV angle rel. today's existing angle [°] 0 0S1-angle rel. today's existing S1-angle [°] -0.63 0.62Mass flow at stage 2 1.010 1.000Mass flow at stage 6 1.010 1.002Mass flow at stage 11 0.998 1.000
The results in Table 11-8 show that the SAS mass flow is constant when the S1 angle is altered0.62° and increases at stage 2 and 6 while it decreases at stage 11 when the S1-angle is altered-0.63°. The ratio between the SAS flow and the total flow is almost constant for the differentVGV-positions thus the cooling of the components is not endangered.
In Table 11-9 the results from the previous section have been updated to include the effects fromchanges in SAS. If the parameters in Table 11-9 are compared to the parameters in Table 11-2 onp. 77, where the calculations are without consideration to the effects from SAS, no significantincreases are detected for the shaft power and thermal efficiency for all tested S1-angles due tothe increase in SAS flow.

82
Table 11-9 Gas turbine performance, after considering the effects from changes in the SAS, fortoday’s existing position and different S1-angles when the IGV-angle is altered 0°
Parameters Nominal valuesIGV angle rel. today's existing angle [°] 0 0S1-angle rel. today's existing S1-angle [°] -0.63 0.62Shaft power 0.997 1.000GT shaft thermal eff. 0.999 1.000Compressor isentr. eff. 1.000 1.000CT isentr. eff. 0.999 1.000PT isentr. eff. 1.000 1.000Pressure ratio 0.998 1.000Corr. mass flow 0.998 1.000Physical shaft-speed 0.998 1.002Aerodyn. shaft-speed 0.998 1.002
11.2.3 IGV-angle2.5°In Table 11-10 the SAS mass flows from the extractions are shown for the three tested S1-angleswhen the IGV-angle is closed 2.5° compared to today’s existing position. The results show thatthe mass flow decrease at all stages for all tested S1-angles.
Table 11-10 SAS mass flow from different compressor stages for different S1-angles when theIGV-angle is altered 2.5°
Parameters Nominal valuesIGV angle rel. today's existing angle [°] 2.5 2.5 2.5S1-angle rel. today's existing S1-angle [°] -1.88 0 0.63Mass flow at stage 2 0.980 0.980 0.971Mass flow at stage 6 0.985 0.972 0.966Mass flow at stage 11 0.997 0.995 0.994
The ratio between the SAS flow and the total flow is almost constant for the different VGV-positions. The total mass flow is reduced when the VGV-position is more closed. This willcounteract the reduced SAS flow resulting in almost constant ratios. Thus the cooling of thecomponents is not endangered.
In
Table 11-11 the results from the previous section have been updated to include the effects fromchanges in SAS. If the parameters
Table 11-11 are compared to the parameters in Table 11-3 on p. 78, where the calculations arewithout consideration to the effects from SAS, it could be seen that shaft power and thermal

83
efficiency are reduced for all tested angles. The CT efficiency increases for all tested S1-anglesbut the increase is too small to counterweight the reduction in compressor efficiency, pressureratio and corrected mass flow.
Table 11-11 Gas turbine performance, after considering the effects from changes in the SAS, fortoday’s existing position and different S1-angles when the IGV-angle is altered 2.5°
Parameters Nominal valuesIGV angle rel. today's existing angle [°] 2.5 2.5 2.5S1-angle rel. today's existing S1-angle [°] -1.88 0 0.63Shaft power 0.994 0.992 0.991GT shaft thermal eff. 0.998 0.997 0.997Compressor isentr. eff. 0.997 0.996 0.995CT isentr. eff. 1.001 1.002 1.002PT isentr. eff. 0.999 0.999 1.000Pressure ratio 0.998 0.997 0.995Corr. mass flow 0.997 0.996 0.994Physical shaft-speed 1.007 1.011 1.013Aerodyn. shaft-speed 1.007 1.011 1.013
11.2.4 IGV-angle5°In Table 11-12 the SAS mass flows from the extractions are shown for the three tested S1-angleswhen the IGV-angle is closed 5° compared to today’s existing position. The results show that themass flow decrease at all stages for all tested S1-angles.
Table 11-12 SAS mass flow from different compressor stages for different S1-angles when theIGV-angle is altered 5°
Parameters Nominal valuesIGV angle rel. today's existing angle [°] 5 5 5S1-angle rel. today's existing S1-angle [°] -4.43 0 0.63Mass flow at stage 2 0.971 0.940 0.940Mass flow at stage 6 0.964 0.930 0.929Mass flow at stage 11 0.992 0.988 0.987
The ratio between the SAS flow and the total flow is almost constant for the different VGV-positions. The total mass flow is reduced when the VGV-position is more closed. This willcounteract the reduced SAS flow resulting in almost constant ratios. Thus the cooling of thecomponents is not endangered.

84
In Table 11-13 the performance results from the previous section have been updated to includethe effects from changes in SAS. If the parameters in Table 11-13 are compared to theparameters in Table 11-4 on p. 79 and Table 11-5 on p 79, where the calculations are withoutconsideration to the effects from SAS, it could be seen that the shaft power and thermalefficiency are reduced for all tested angles. The CT efficiency increases for all tested S1-anglesbut the increase is too small to counterweight the reduction in compressor efficiency, pressureratio and corrected mass flow.
Table 11-13 Gas turbine performance, after considering the effects from changes in the SAS, fortoday’s existing position and different S1-angles when the IGV-angle is altered 5°
Parameters Nominal valuesIGV angle rel. today's existing angle [°] 5 5 5S1-angle rel. today's existing S1-angle [°] -4.43 0 0.63Shaft power 0.987 0.982 0.979GT shaft thermal eff. 0.995 0.993 0.992Compressor isentr. eff. 0.994 0.990 0.990CT isentr. eff. 1.002 1.003 1.004PT isentr. eff. 0.999 0.999 0.999Pressure ratio 0.993 0.991 0.990Corr. mass flow 0.992 0.989 0.988Physical shaft-speed 1.013 1.023 1.025Aerodyn. shaft-speed 1.013 1.023 1.025
11.3 SummaryThe aim of this chapter was to evaluate if another gear ratio between the IGV and first statorcould increase the performance for SGT-700 at 30°C. First a study was made through an iterativeprocess between GTPerform and HT0300 to predict the potential of different gear ratios.Secondly an additionally study was made through an iterative process between GTPerform andMerlin to include the effects from SAS. To simplify the time consuming process the compressorpressure profile was assumed to be fixed for a set IGV-angle thus excluding HT0300 from theiterative process.
The result from the first study show that when the IGV-angle was set to -2.5° compared totoday’s existing position, all S1-angles gave an increased performance. For all other testedcombination of IGV- and S1-angles the shaft power and thermal efficiency was constant ordecreased.
The most promising combinations of IGV- and S1-angles from the first study were furtherinvestigated in the next study. Here the effects from the altered pressure ratio in the compressorand thereby the SAS was taken under consideration. For the case where the IGV was adjusted to

85
a more opened position the effects from the SAS decreased the CT efficiency whereas for thecase with a more closed position the effects from the SAS increased the CT efficiency. Eventhough the CT efficiency increased the efficiency, pressure ratio and corrected mass flow for thecompressor decreased thereby reducing the thermal efficiency.
To control the IGV and stator 1 individually would demand separate actuators which could beimplemented but at a higher cost. A great increase in performance would have to be obtained tomotivate this change. From the studies in this chapter no tested combination of IGV- and S1-angle indicates that this is possible. Therefore a new way to control the VGVs for SGT-700 willno longer be investigated.

86
12 ConclusionsThe overall objective of this thesis was to investigate how an altered VGV-position would affectperformance and lifespan at high ambient temperatures. The study showed no possibleimprovements for SGT-700 while a more opened VGV-position showed both enhancedperformance and reduced physical shaft-speed for SGT-750.
For SGT-700 at 30°C an analysis of how separated controlling of IGV and S1 affected theperformance was also made. The study showed a very small possible improvement for an IGVsettings at -2.5° and S1 setting at 0°. The increase was too small however, to counterweigh forthe increased cost with separate actuators. SGT-700 seems to be running on the best possibleVGV-setting.
The most promising case for SGT-750 at full load and 30°C was an opening of the IGVs of 2.5°relative today’s existing position. This resulted in an increase in shaft power of nearly 0.5% andan increase in thermal efficiency of 0.1% while reducing physical shaft-speed by 0.8%. The mostpromising case at 45°C was an opening of the IGVs of 4° relative today’s existing position. Thisresulted in an increase in shaft power of 2.9% and an increase in thermal efficiency of 1.1%while reducing physical shaft-speed by nearly 0.9%. Based on our studies we recommend furtherstudies or tests in test-rig to confirm and possibly apply these new VGV-positions at full load.
A numerical surge margin evaluation was made but to truly assure the surge margin tests in test-rig needs to be performed. If the VGVs are set at an more opened position it will be the firststage that has the highest increase in pressure ratio thus having the largest risk of running intosurge.
The VGV-position was also tested at part load to see if the new control algorithm can be usedwith the aerodynamic shaft-speed as the only input. These tests showed that the potentialimprovement decreased compared to the cases at full load. At low aerodynamic shaft-speed anopening resulted in enhanced performance compared to using today’s VGV-position while at ahigher aerodynamic shaft-speed today’s VGV-position is more beneficial.
To benefit from the gained performance with a more opened VGV-position at full load it couldbe interesting to investigate the possibility to use a more complex control algorithm with moreinput parameters. Based on the results in this master thesis three different ways to control theVGVs have been created. These suggestions can work as a foundation to start off the work withan improved control algorithm for SGT-750. The three suggestions are presented in Appendix B.
During our studies many iterative loops have been used and several programs have been matchedusing simple correlations. This is a source of error since the simple correlations cannot describethe behaviour of the programs to full extent. The iteration loops have all introduced small errorssince the solution is assumed converged before the results are identical. The differences areconsidered negligible but may in the end add up to an error too large to be neglected.

87
GTPerform and Merlin gave slightly different results when calculating the turbine efficiencies.The absolute values differed and the difference in PT efficiency varied with ambient temperatureat part load. As the ambient temperature changed Merlin often calculated a bigger loss in PTefficiency than GTPerform. This is coupled to the incidence losses discussed in section 2.3 onp.8 and is further discussed in Appendix C. The result is less accurate results from GTPerform.The difference is minor for all normal purposes but in a study like this it contributes to theuncertainty.
The programs used for these analyses are all intended to model the gas turbine in reality.Normally within SIT these programs are not operated as one unit but rather as individual designtools. None of the programs we used calculate in 3D. Therefore some complex effects may havebeen left out but the programs used were assumed to give reliable results with enough accuracyfor this thesis. The errors introduced by using more basic programs and not fully knowing how tointegrate the programs together are hard to estimate and that is why we strongly recommend thatour results are confirmed by rig tests.
88
13 FuturedevelopmentsatSiemensIndustrialTurbomachineryABThis chapter aims to discuss possibilities for SIT to further investigate areas that we foundinteresting but did not fit under the purpose of this thesis. The problems have been encounteredduring our work but left unsolved.
In chapter 11 the proposed VGV-position was tested at part load to see if the new controlalgorithm can be used with the aerodynamic shaft-speed as the only input. These tests showedthat the potential improvement decreased compared to full load. At low aerodynamic shaft-speedan opening resulted in enhanced performance compared to using today’s VGV-position while ata higher aerodynamic shaft-speed today’s VGV-position is more beneficial. In this thesis onlytwo aerodynamic shaft-speeds have been tested for one VGV-position each. We recommend thatthe subject is further investigated to find the optimum VGV-position at part load for severalaerodynamic shaft-speeds to use in an improved control algorithm.
It would be interesting to investigate if the control algorithm can be built with more than oneinput parameter. This would give the opportunity to control the VGV-position according totoday’s control algorithm until the gas turbine is close to full load where the VGV can beadjusted to a more opened position. Three suggestions on foundations to build an improvedcontrol algorithm around are presented in Appendix B. We recommend that time and resourcesare devoted to develop this new control algorithm.
During the work with this thesis a lot of iterations have been made between different programs.One tool that would have been useful is a correlation between the programs since there is anoffset between the results. When HT0300 was matched with GTPerform the difference in resultsfrom the two programs varied with ambient temperature, relative humidity and type of engine.Other parameters affecting the difference might exist but has not been encountered during thisthesis. We recommend that time and resources are devoted to find a suitable correlation tointerpret and compare the results from different programs.

89
14 BibliographyAxelsson, S., 2014. [Interview] (12 03 2014).
Brun, K. & Kurz, R., 2000. Introduction to Gas Turbine Theory. 2nd ed. San Diego: SolarTurbines.
Flydalen, K., 2011. Iteration Interface Merlin RT_GRCTA_020_11, Finspång: SiemensIndustrial Turbomachinery (Proprietary).
Gustafsson, J., 2014. [Interview] (25 02 2014).
Kling, J., 2014. [Interview] (24 02 2014).
Moustapha, H., Zelesky, M. F., Baines, N. C. & Japikse, D., 2003. Axial and Radial Turbines.Vermont: Concepts NREC.
Rabal Carerra, S., 2014. [Interview] (12 03 2014).
Razak, A., 2007. Industrial gas turbines. Cambridge: Woodhead Publishing Limited.
Saravanamuttoo, H. I. H., Rogers, G. F. C., Cohen, H. & Straznicky, P. V., 2009. Gas TurbineTheory. 6th ed. Essex: Pearson Education Limited.
Siemens AG, 2009a. SGT-700 Gas Turbine for Mechanical Drive. [Online]Available at: http://www.energy.siemens.com/hq/pool/hq/power-generation/gas-turbines/SGT-700/Brochure_Siemens_Gas-Turbine_SGT-700_MD.pdf[Accessed 28 01 2014].
Siemens AG, 2009b. SGT-700 Gas Turbine for Power Generation. [Online]Available at: http://www.energy.siemens.com/hq/pool/hq/power-generation/gas-turbines/SGT-700/E50001-W430-A104-X-4A00_SGT-700_GB_LR.pdf[Accessed 28 01 2014].
Siemens AG, 2010. SGT-750 Siemens Gas Turbine. [Online]Available at: http://www.energy.siemens.com/hq/pool/hq/power-generation/gas-turbines/sgt-750/SGT-750_brochure.pdf[Accessed 28 01 2014].
Siemens AG, 2013. Siemens Gas Turbines. [Online]Available at: http://www.energy.siemens.com/hq/en/fossil-power-generation/gas-turbines/#content=Output%20Overview[Accessed 15 01 2014].
Siemens AG, 2014. Gas Turbine SGT-750. [Online]Available at: http://www.energy.siemens.com/hq/en/fossil-power-generation/gas-turbines/sgt-

90
750.htm[Accessed 12 02 2014].
Siemens Industrial Turbomachinery AB, 2009. SIT Homepage. [Online]Available at: http://www.sit-ab.se/[Accessed 15 01 2014].
Siemens Industrial Turbomachinery AB, 2013. En historia om drivkraft. [Online]Available at: http://sit-ab.leon.se/[Accessed 15 01 2014].
Sjödin, M., 2013. SIT Performance Model Definition RT RP 01/13 Edition B, Finspång: SiemensIndustrial Turbomachinery (Proprietary).
Sjödin, M., 2014. [Interview] (29 01 2014).
Tageman, K., 2014. [Interview] (27 01 2014).
Walsh, P. P. & Fletcher, P., 2004. Gas Turbine Performance. 2nd ed. Oxford: Blackwell ScienceLtd.

91
AppendixA EvaluationofsurgemarginduringoperationThe surge margin is one of the hardest parameters to measure and evaluate since the surge line isso hard to estimate. Since experimental tests are expensive and rarely done for full load and full-sized engines the surge margin for each individual engine is hard to evaluate.
Today the surge margin during operation is evaluated by measuring the fuel mass flow into thecombustion chamber. The energy sent into the combustion chamber is then used to evaluate thepressure ratio to assure surge margin. One problem with this method is that it is indirect and itcan be influenced by other parameters such as the heating value of the fuel. The surge margin istherefore often bigger than needed.
A direct measurement of the pressure ratio would be much better but until recently themeasurement devices has been too slow. The risk of having slow measurements is that once therisk of surge is detected it is too late to save the engine from running into surge. At SIT surge isconsidered to be very dangerous thus this risk is not acceptable.
New calculations indicates that there are new devices on the market that are capable ofmeasuring the pressure ratio fast enough to guarantee that the control system will have time toprevent the engine from running into surge. Using this new devices and measuring the pressureratio directly would remove a level of uncertainty that is otherwise introduced as the fuel massflow is converted into pressure ratio.
Being more certain of the instant pressure ratio of the engine gives the opportunity to lower thesurge margin. As showed in this study the performance of the engine can sometimes be improvedby running closer to surge. Having a direct way of measuring the pressure ratio thus having theability to lower the surge margin would therefore be beneficial.

92
AppendixB SuggestionsforimprovedcontrollingoftheVGVsToday the VGVs are controlled as a function of aerodynamic shaft-speed. The results in thismaster thesis show that there is potential of increased performance if the controlling algorithm ismodified to a more opened VGV-position at high ambient temperatures, primary at full load. Inthis appendix three different ways of controlling is presented. The actual VGV-position for everyposition in the matrixes is not presented but rather the trends and the parameters that can be usedfor controlling.
B-1 Alternative1Table B - 1 shows a schematic view of a control algorithm that could be used to enhanceperformance at high ambient temperatures. Here the aerodynamic shaft-speed and thecompressor intake temperature (T1200) form two matrixes. The left matrix represent today’s wayof controlling the VGV-position while the right matrix represent a new VGV-position. At highambient temperatures we suggest that b is a more opened VGV-position than a. The right handmatrix is primary used at high TIT, i.e. full load.
Since the biggest increase in performance was reached at full load the TIT will be used toevaluate when to use which matrix. To get a smooth transition between the two matrixes acoefficient based on TIT (k) can be used. If the TIT equals TITBase load, k would equal 1 and atTIT<<TITBase load, k would equal 0. The VGVs would then be controlled according toEqu. ( B - 1 ), where is the VGV-position gathered from the left matrix in Table B - 1 and b isthe VGV-position gathered from the right matrix.
= ∗ (1 − ) + ∗ ( B - 1 )
This way of controlling would require two separate matrixes and the coefficient k would have tobe carefully estimated to get the best performance at all loads without getting an unstable system.The benefit with this system is that the coefficient k ensures that the engine is running close tofull load before adjusting the VGVs, i.e. no other phenomena can trick the system into openingup the VGVs as the engine is running at part load.
Table B - 1 VGV matrixes with aerodynamic shaft-speed and compressor intake temperature asinput. a is the VGV-position used today and b is a new VGV-position
Aerodyn. shaft-speed / T1200 -60 0 20 30 45
Aerodyn. shaft-speed / T1200 -60 0 20 30 45
2000 A a a a a 2000 b b b b b- A a a a a - b b b b b- A a a a a - b b b b b- a a a a a - b b b b b- a a a a a - b b b b b
10000 a a a a a 10000 b b b b b
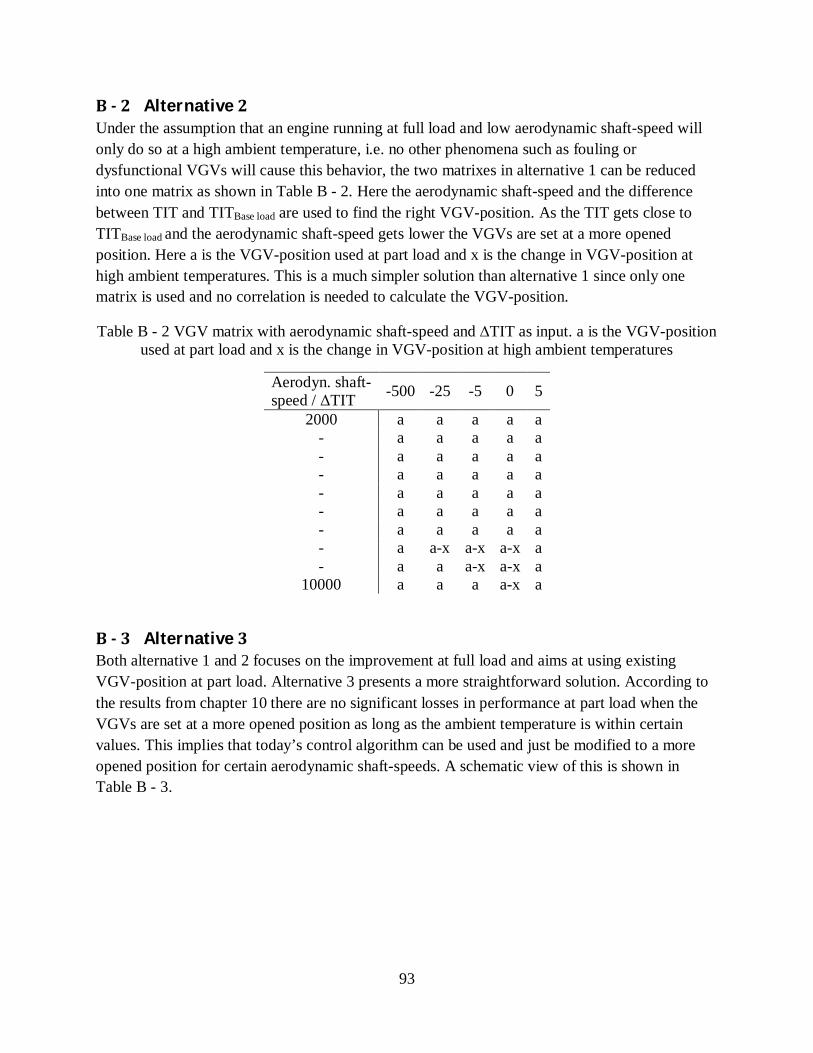
93
B-2 Alternative2Under the assumption that an engine running at full load and low aerodynamic shaft-speed willonly do so at a high ambient temperature, i.e. no other phenomena such as fouling ordysfunctional VGVs will cause this behavior, the two matrixes in alternative 1 can be reducedinto one matrix as shown in Table B - 2. Here the aerodynamic shaft-speed and the differencebetween TIT and TITBase load are used to find the right VGV-position. As the TIT gets close toTITBase load and the aerodynamic shaft-speed gets lower the VGVs are set at a more openedposition. Here a is the VGV-position used at part load and x is the change in VGV-position athigh ambient temperatures. This is a much simpler solution than alternative 1 since only onematrix is used and no correlation is needed to calculate the VGV-position.
Table B - 2 VGV matrix with aerodynamic shaft-speed and ∆TIT as input. a is the VGV-positionused at part load and x is the change in VGV-position at high ambient temperatures
Aerodyn. shaft-speed / ΔTIT -500 -25 -5 0 5
2000 a a a a a- a a a a a- a a a a a- a a a a a- a a a a a- a a a a a- a a a a a- a a-x a-x a-x a- a a a-x a-x a
10000 a a a a-x a
B-3 Alternative3Both alternative 1 and 2 focuses on the improvement at full load and aims at using existingVGV-position at part load. Alternative 3 presents a more straightforward solution. According tothe results from chapter 10 there are no significant losses in performance at part load when theVGVs are set at a more opened position as long as the ambient temperature is within certainvalues. This implies that today’s control algorithm can be used and just be modified to a moreopened position for certain aerodynamic shaft-speeds. A schematic view of this is shown inTable B - 3.

94
Table B - 3 VGV table with aerodynamic shaft-speed as input. a is the VGV-position used at partload and x is the change in VGV-position at high ambient temperatures
Aerodyn. shaft-speed VGV-position2000 a
- a- a- a- a- a- a- a-x- a-x
10000 a-x
The simplicity of this alternative is its biggest advantage. The disadvantage is that the simplesolution may lead to that the engine runs at a more opened position at part load even though theperformance does not benefit until the engine reaches full load.

95
AppendixC EvaluationofturbineefficiencyindifferentprogramsIn this master thesis different programs have been used to evaluate the CT-efficiency. To getbetter understanding of the behavior of the different programs the CT-efficiency as a function ofphysical shaft-speed and ambient temperature has been evaluated using both GTPerform andMerlin. This way it is possible to evaluate how usage of the different programs affects theresults.
Merlin generally predicts a higher CT-efficiency than GTPerform. In this chapter the results hasbeen normalized to see the gradients rather than absolute values. The aim is not to prove thatMerlin predicts higher CT-efficiency than GTPerform but rather to evaluate how the CT-efficiency varies in the different programs as the physical shaft-speed and ambient temperaturevaries.
Fig. C - 1 shows how the CT-efficiency varies as a function of ambient temperature usingGTPerform and Merlin for the calculations at full load. The results show that the two programsestimate the variation in CT-efficiency almost similar. Here the results from Merlin aredependent on an iterative process using input data from GTPerform. The iterative processexplains why the results from Merlin do not form such as smooth trend as the results fromGTPerform. The results indicate that as long as the relative differences are used, the programswill estimate the CT-efficiency as a function of ambient temperature in a similar way.
Fig. C - 1 Nominal CT-efficiency as a function of ambient temperature calculated in GTPerformand Merlin
At part load the difference between the programs is bigger. As the ambient temperature changesMerlin often calculates a bigger loss in PT efficiency than GTPerform. This is coupled to theincidence losses discussed in section 2.3 on p. 8. The lower ambient temperature results in lower
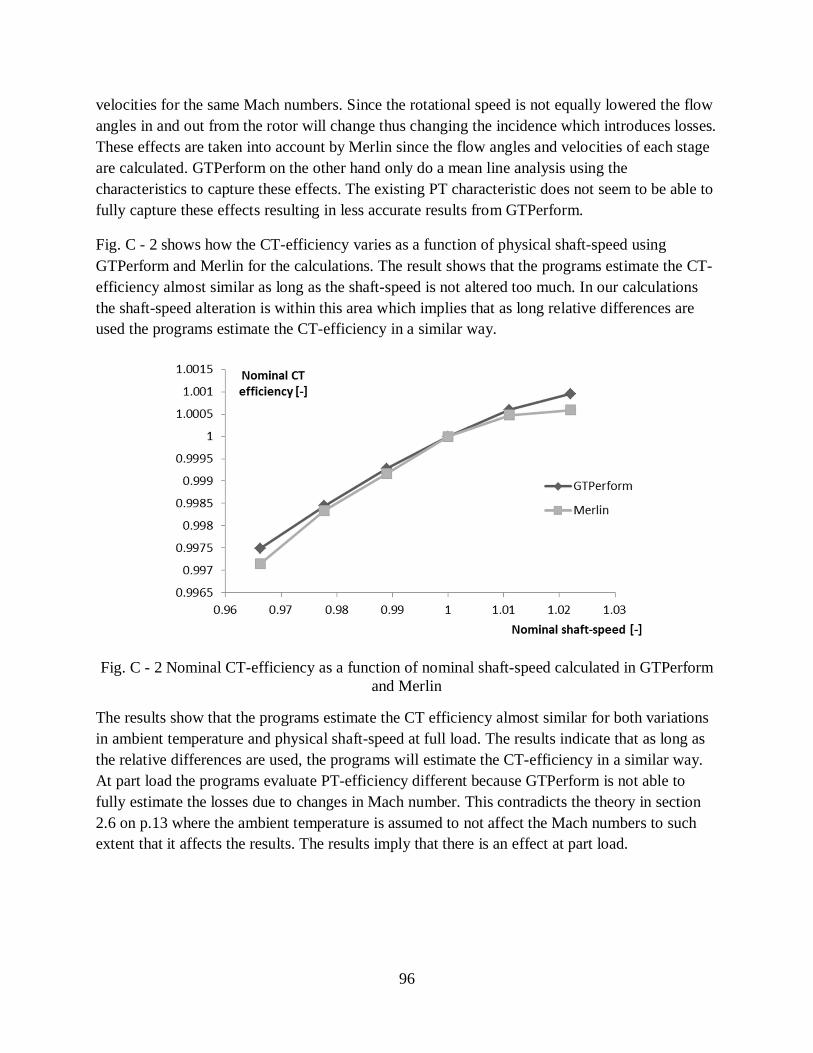
96
velocities for the same Mach numbers. Since the rotational speed is not equally lowered the flowangles in and out from the rotor will change thus changing the incidence which introduces losses.These effects are taken into account by Merlin since the flow angles and velocities of each stageare calculated. GTPerform on the other hand only do a mean line analysis using thecharacteristics to capture these effects. The existing PT characteristic does not seem to be able tofully capture these effects resulting in less accurate results from GTPerform.
Fig. C - 2 shows how the CT-efficiency varies as a function of physical shaft-speed usingGTPerform and Merlin for the calculations. The result shows that the programs estimate the CT-efficiency almost similar as long as the shaft-speed is not altered too much. In our calculationsthe shaft-speed alteration is within this area which implies that as long relative differences areused the programs estimate the CT-efficiency in a similar way.
Fig. C - 2 Nominal CT-efficiency as a function of nominal shaft-speed calculated in GTPerformand Merlin
The results show that the programs estimate the CT efficiency almost similar for both variationsin ambient temperature and physical shaft-speed at full load. The results indicate that as long asthe relative differences are used, the programs will estimate the CT-efficiency in a similar way.At part load the programs evaluate PT-efficiency different because GTPerform is not able tofully estimate the losses due to changes in Mach number. This contradicts the theory in section2.6 on p.13 where the ambient temperature is assumed to not affect the Mach numbers to suchextent that it affects the results. The results imply that there is an effect at part load.
