vi. voltage optimization a. backgroundblogs.edf.org/energyexchange/files/2015/04/comed-study.pdf ·...
TRANSCRIPT
A-10 DRAFT 3/6/2015 FOR DISCUSSION PURPOSES ONLY
and notified interested parties on August 15, 2013 of the posting of the map tool.36 ComEd updated the map on October 1, 2014, plans to update the map once per year, and will continue to consider more frequent updates if there is a large increase in DG interconnection activities in the future. An update will also be necessary if and when there is a change to the rules that govern the review and approval of DG interconnection requests for DG facilities with a nameplate capacity of up to 10 MVA.37
VI. VOLTAGE OPTIMIZATION
A. Background
Voltage Optimization (“VO”) is a combination of Conservation Voltage Reduction (“CVR”) and Volt-VAR Optimization (“VVO”). These programs are intended to reduce end-use customer energy consumption and peak demand while also reducing utility distribution system energy losses. The ICC, in Docket No. 13-0495, stated that “A review of the record leads the Commission to believe that a VO feasibility study should be pursued and could in fact result in many direct and indirect benefits.” The order also stated that ”The record is also not clear whether there is already a budget earmarked for voltage optimization in ComEd’s Smart Grid plan. If there is already, it should go forward; if not the Company is directed to include it with the next AMI plan filing.” In accordance with ComEd’s 2014 AIPR, a Voltage Optimization Feasibility study was completed by Applied Energy Group (“AEG”) in December 2014.
B. Feasibility Study Approach
AEG was selected through a competitive bid process, based on the thoroughness of their proposed plan of work and the previous relevant experience to conduct a feasibility study of implementing Voltage Optimization on the ComEd distribution system. The study relied on industry standard modeling and engineering methods that have been used for electric utilities including:
• Use of power flow simulation feeder models derived from ComEd’s Geographic Information System (CEGIS)
• Robust statistical techniques yielding representative system-level VO benefits and costs
The study methodology followed two major steps: 1) “total feeder prioritization” of potential candidates; and 2) “sample feeder detailed analysis” using load-flow simulations. Estimated VO
36 https://www.comed.com/customer-service/rates-pricing/interconnection/Pages/distribution-
under-10000kva.aspx. 37 83 Ill. Admin. Code Part 466 – Electric Interconnection of Distributed Generation Facilities.
A-11 DRAFT 3/6/2015 FOR DISCUSSION PURPOSES ONLY
factors were applied to both steps. Two VO scenarios labeled Plans A and B were evaluated to compare the benefits of alternative levels of energy efficiency.
The initial step of “total feeder prioritization” classified 3,757 feeders out of ComEd’s total population of approximately 5,650 feeders using a simplified load flow analysis of feeder characteristics involving load type, load density, feeder lengths, existing voltage control settings, real and reactive loads, line voltage drops and losses, line regulators installed, and conductor loading. Feeders were categorized as viable or non-viable for VO implementation, and viable feeders were prioritized based on a potential voltage-reduction magnitude-sensitivity impact analysis, and subsequent energy savings potential.
For the “sample feeder detailed analysis”, a sample of 70 feeders from 16 substations was selected using a stratified random sampling approach to fairly represent the total feeder population. Detailed analyses of planning and loadflow simulations were performed to determine expected annual energy savings (kWh) and peak power reductions (kW) for each of two VO scenarios. This sample feeder analysis included an assessment of system upgrades between the existing system and VO-modified plans, including benefits/costs for each VO scenario, which were then extrapolated back to the total ComEd system level using statistical ratio estimation techniques linking the sample group, study group, and system population. In addition, a recommended VO pilot project was outlined to demonstrate the proposed VO implementation strategies, verify estimated VO factors, and develop simplified VO M&V procedures for ComEd’s distribution system.
It is important to note that the study is not an implementation plan for VO. In fact, the results are statistically valid, but represent an instant change from current operations to one where VO is implemented fully and effectively on each viable feeder.
C. Feasibility Study Results
The Commonwealth Edison Voltage Optimization (VO) Feasibility Study Final Report (“VO Feasibility Study Report”), dated January 6, 2015 and prepared by AEG, is attached hereto in Subsection F.
Key AEG Feasibility Study Findings
VO is likely to be cost-effective for viable feeders
• The high level estimated potential Total Resource Cost (TRC) benefit cost ratio for viable feeders ranges from 2.2 to 2.3
Deployment costs are primarily to increase feeder efficiency, minimize voltage drop and monitor last customer and system voltages
ComEd has a relatively efficient feeder design
Existing voltage regulation practices provide an opportunity for voltage reduction
Approximately 50% of all ComEd feeders are believed to be viable for VO (2,890 of 5,655 feeders)

A-12 DRAFT 3/6/2015 FOR DISCUSSION PURPOSES ONLY
• Viable feeder criteria - 12kV feeders that supply residential and small C&I customers
• Non-viable feeders continue using traditional voltage regulation
Summary of Feasibility Study Analysis Plan A
(Reduced Cost)
Plan B (Greater Savings)
Potential VO Savings • Energy (GWh/year)
• Peak Load (MW)
1350
260
1900
360 Total VO Estimated Costs $425 M $575 M VO Program TRC 2.20 2.30 Levelized Cost of Energy Saved ($/kWh)
$0.0193 $0.0185
Number of Viable Feeders 2890 2890 Average Energy Savings per Viable Feeder (MWh/yr)
470 660
Average VO cost per feeder $150 K $200 K Average Voltage Reduction 3.0% 3.8%
Key AEG Feasibility Study Recommendations
Design/Implement VO verification project(s) to validate:
• Method used to estimate energy savings
• Residential and commercial VO factor assumptions
• Test voltage optimization strategies
• Validate Line Drop Compensation (LDC) voltage control schemes
• Test End of Line (EOL) voltage feedback for overriding LDC controls
• Switched capacitor VAR control schemes
• Measurement and Verification protocol
• Effectiveness of Integrated Volt VAR Control (IVVC) applications
Develop and implement VO analysis training, operations, and maintenance materials
Improve VAR management with small capacitor banks using controls with VAR sensing
Install EOL voltmeters on every VO feeder and voltage control device at the lowest voltage location

A-13 DRAFT 3/6/2015 FOR DISCUSSION PURPOSES ONLY
Examine AMI voltage/loading data to determine actual feeder voltage drop and load profiles to determine the need to upgrade distribution transformers.
D. Planned ComEd Validation Project
Based on the VO Feasibility Study Report and the AEG Recommendations, ComEd plans to conduct a VO Validation Project as follows:
Conduct a validation project to confirm annual estimated energy savings, deployment costs and implementation technologies for at least 2 substations with 4-to-6 feeders each
• Selected feeders will represent urban, suburban and rural areas and will contain those evaluated by AEG with both higher and lower benefit-cost ratios
Evaluate and select appropriate VO technologies at the validation substations
• Validate both LDC and IVVC control technologies
Begin VO operations of the validation project in 2016. It is anticipated that data collected over a 12-month operating period will be sufficient to validate the assumptions and conclusions reached in the feasibility study. Additional data collection and evaluation for a period of up to 12 months may be necessary if unanticipated operational issues arise during the validation project.
Assess and report learnings from the results of the validation project
E. Budget and Cost Recovery
A preliminary estimate of the cost of the validation project is $2,000,000. As indicated above, the estimated cost to fully implement VO is expected to be in the range of $425-575 million. This amount may exceed what is available in the AMI budget. At some point prior to full implementation, ComEd and the Commission will need to consider and address the appropriate cost recovery mechanism.
F. VO Feasibility Study Final Report
The VO Feasibility Study Final Report is attached below.
Contract No. 01146430 – Task 10 Proprietary
Applied Energy Group 1377 Motor Parkway, Suite 401 Islandia, NY 11749 P: 631-434-1414 www.appliedenergygroup.com
Report specifically developed for:
Commonwealth Edison Company
December 17, 2014
Voltage Optimization (VO) Feasibility StudyTask 10 – Final Report

Commonwealth Edison Company Task 10 – Final Report
Contract No. 01146430 – Task 10 Proprietary
Applied Energy Group 1377 Motor Parkway, Suite 401 Islandia, NY 11749 P: 631-434-1414 www.appliedenergygroup.com
Distribution Feeder VO ScreeningPotential VO Energy Savings and Cost Impacts
TASK 10: Final Report
Prepared by: Kellogg Warner - Applied Energy Group (AEG)
Ronald Willoughby, PE - Applied Energy Group (AEG)
Robert Fletcher, PhD, PE - Utility Planning Solutions, PLLC (UPS)
Daniel Desrosiers, PE - Eaton CYME International T&D
Assisted by: Philippe Bernier - Eaton CYME International T&D
Craig Williamson - Applied Energy Group (AEG)
Joe Reilly - Applied Energy Group (AEG)
Commonwealth Edison Company Task 10 – Final Report
Contract No. 01146430 – Task 10 Proprietary
Applied Energy Group 1377 Motor Parkway, Suite 401 Islandia, NY 11749 P: 631-434-1414 www.appliedenergygroup.com
This report was prepared by the Applied Energy Group, Inc. (AEG) for the exclusiveuse by Commonwealth Edison Company, and for the specific purposes therein. Thepublication of the report or any part or parts thereof in technical papers, magazinearticles, or journals must be attributed to AEG. The study or any part or parts thereofincluding outlines, formulations, summary formats, and engineering assessments usedby other entities is prohibited except by written permission from the Applied EnergyGroup, Inc., 1377 Motor Parkway Suite 401, Islandia, N.Y. 11749, Phone: 631-434-1414 and Robert H. Fletcher, PhD, P.E., DBA Utility Planning Solutions (UPS), PLLC,3416 Bell Ave., Everett, WA 98201 Phone 425-330-0628.
All observations, conclusions, and recommendations contained herein attributed toAEG and UPS, and are the opinions thereof with no assurances. To the extent thisinformation was provided by clients or others and used in the preparation of this study,AEG and UPS relied on same to be accurate, but gives no assurances or guarantees.
Commonwealth Edison Company Task 10 – Final Report
Contract No. 01146430 – Task 10 Proprietary
Applied Energy Group 1377 Motor Parkway, Suite 401 Islandia, NY 11749 P: 631-434-1414 www.appliedenergygroup.com
Table of Contents
1. Executive Summary 1
1.1 Key Findings ............................................................................................................................................................................... 1
1.2 Approach ...................................................................................................................................................................................... 2
1.3 Project Results ............................................................................................................................................................................ 4
1.4 Key Recommendations............................................................................................................................................................ 9
2. Introduction 11
2.1 General Distribution System Characteristics Investigated .................................................................................11
2.2 Feeder Performance Characteristics..................................................................................................................................12
3. Data Collection Process 15
4. VO Screening and Representative Feeder Selection 16
4.1 Screening Results ....................................................................................................................................................................18
4.2 Sample Selection .....................................................................................................................................................................24
4.2.1 Feeder Population Study Group...............................................................................................................................24
4.2.2 Substations and Feeders .............................................................................................................................................24
4.2.3 Sample Stratification ...................................................................................................................................................25
4.2.4 Sampling Method..........................................................................................................................................................25
4.2.5 Sample List and Metrics .............................................................................................................................................25
5. Scenario Plan Case Development 28
5.1 Scenario Plan Development Objectives ...........................................................................................................................28
5.2 Performance Efficiency Thresholds ..................................................................................................................................29
5.3 Upgrade Priority.......................................................................................................................................................................29
5.4 Plan Development Process ...................................................................................................................................................32
6. Detailed VO Analysis of Representative Feeders 39
6.1 Objectives...................................................................................................................................................................................39
6.2 Load Flow Simulations..........................................................................................................................................................39
6.3 Conductor Types and Loading Guidelines .....................................................................................................................40
6.4 VO Improvement Costs .........................................................................................................................................................42
6.5 Economic Evaluation Approach and Financial Factors .............................................................................................43
6.6 VO Factor Application ..........................................................................................................................................................44
6.7 VO Efficiency Performance Thresholds..........................................................................................................................47
6.7.1 Minimum Allowed Primary Volt & Secondary Voltage Drops ...................................................................48
6.8 Overview of VO Analysis Process and Application Guidelines .............................................................................48
6.8.1 VO Design Process ......................................................................................................................................................48
6.8.2 VO Improvement Priority ..........................................................................................................................................51
Commonwealth Edison Company Task 10 – Final Report
Contract No. 01146430 – Task 10 Proprietary
Applied Energy Group 1377 Motor Parkway, Suite 401 Islandia, NY 11749 P: 631-434-1414 www.appliedenergygroup.com
6.9 VO Improvements Common to all VO Plans ................................................................................................................51
6.9.1 Substation and Feeder Metering Applications ....................................................................................................52
6.9.2 Feeder VAR Management Applications ...............................................................................................................52
6.9.3 Feeder Volt-Regulator Line-Drop-Compensation Applications ..................................................................52
6.9.4 Capacitor VAR Management ...................................................................................................................................53
6.9.5 AMI Applications .........................................................................................................................................................54
6.9.6 IVVC Applications.......................................................................................................................................................54
6.10 VO Improvements Common to all VO Plans ................................................................................................................55
6.10.1 Substation and Feeder Metering Applications ....................................................................................................55
6.10.2 Feeder VAR Management Applications ...............................................................................................................56
6.10.3 IVVC and EOL Voltage Feedback and Control Application ........................................................................56
6.11 Existing Case VO Performance Threshold Assessment.............................................................................................56
6.12 Plan A – Low Cost Solution ................................................................................................................................................60
6.12.1 Summary..........................................................................................................................................................................60
6.12.2 Plan A VO Improvements and Installed Costs ...................................................................................................60
6.12.3 Average Voltage and End-Use Savings ................................................................................................................61
6.12.4 System Line and No-Load Loss Savings..............................................................................................................61
6.12.5 VO Economic Analysis ..............................................................................................................................................63
6.13 Plan B – High Savings Solution .........................................................................................................................................65
6.13.1 Summary..........................................................................................................................................................................65
6.13.2 Plan B VO Improvements and Installed Costs................................................................................................65
6.13.3 Average Voltage and End-Use Savings ..............................................................................................................66
6.13.4 System Line and No-Load Loss Savings ............................................................................................................66
6.13.5 VO Economic Analysis ..............................................................................................................................................67
6.14 Comparison of Alternative VO Plans.............................................................................................................................70
6.14.1 Economic Evaluation Analysis Methodology..................................................................................................70
6.14.2 Summary of Economic Comparison ...................................................................................................................71
6.14.3 Plan A and Plan B Summary Comparison ........................................................................................................73
7. Extrapolation to System Level 76
7.1 Project Study Groups .............................................................................................................................................................76
7.2 VO Estimation Methods........................................................................................................................................................78
7.3 System Level Results .............................................................................................................................................................78
7.4 Factors Affecting Potential Results ...................................................................................................................................81
8. Benefit-Cost Analysis on Representative Feeders 83
8.1 DSMore Input Development................................................................................................................................................83
8.2 Participation, Program Costs, and Credits ......................................................................................................................83
8.3 DSMore Load Shapes ............................................................................................................................................................84
Commonwealth Edison Company Task 10 – Final Report
Contract No. 01146430 – Task 10 Proprietary
Applied Energy Group 1377 Motor Parkway, Suite 401 Islandia, NY 11749 P: 631-434-1414 www.appliedenergygroup.com
9. VO Pilot Project Recommendation 88
9.1 Implementation – Comprehensive List of Typical Components.............................................................................89
9.1.1 Distribution System Planning and Design Engineering ..................................................................................89
9.1.2 Distribution Equipment Specification, Procurement, and Installation .......................................................89
9.1.3 Metering Specification, Procurement, and Insulation ......................................................................................89
9.1.4 Operation Control Engineering ................................................................................................................................90
9.1.5 Engineering Assessment Standard Guidelines ...................................................................................................90
9.1.6 Implementation and trial testing ..............................................................................................................................90
9.1.7 Operational Performance Assessment ...................................................................................................................90
9.2 Demonstration Scenarios ......................................................................................................................................................91
9.3 Verification ................................................................................................................................................................................91
10. VO Feasibility Study Results, Findings, and Recommendations 93
10.1 Results .........................................................................................................................................................................................93
10.2 Key Findings .............................................................................................................................................................................99
10.3 Additional Findings .............................................................................................................................................................100
10.4 Recommendations ................................................................................................................................................................101
11. References 103
11.1 Industry Standards and Protocols....................................................................................................................................103
11.2 Books and Guides.................................................................................................................................................................103
11.3 Technical Papers and Research........................................................................................................................................104
11.4 ComEd Standards .................................................................................................................................................................106
11.5 Other Publications ................................................................................................................................................................107
12. Appendix 108
12.1 Viable Substations (346) Ranked by Benefit-Cost Ratio (BCR) .........................................................................108
Commonwealth Edison Company Task 10 – Final Report
Contract No. 01146430 – Task 10 Proprietary
Applied Energy Group 1377 Motor Parkway, Suite 401 Islandia, NY 11749 P: 631-434-1414 www.appliedenergygroup.com
List of TablesTable 1 - Summary of Project Results ............................................................................................ 5
Table 2 - ComEd Regions Screened ............................................................................................. 19
Table 3 - Total System Feeder Prioritization Results ................................................................... 20
Table 4 - System Average Feeder VO Upgrades.......................................................................... 21
Table 5 - Summary of Initial Screening Feeder Energy Savings Potential .................................. 22
Table 6 - Total System Load Flow Simulation Summary Results ............................................... 22
Table 7 - VO Constants Used in the Screening Analysis ............................................................. 23
Table 8 - Number of Substations and Feeders Included in the Sample ........................................ 25
Table 9 - List of Representative Feeders Included in the Sample ................................................ 26
Table 10 - OH Conductors Commonly Used for Primary Lines .................................................. 41
Table 11 - UG Cables Commonly Used for Primary Lines.......................................................... 41
Table 12 - VO Upgrade Unit Costs............................................................................................... 42
Table 13 - Financial Factors ......................................................................................................... 44
Table 14 - Common End-Use Load Types ................................................................................... 45
Table 15 - Global Energy VO Factors by Customer Class for ComEd Study.............................. 46
Table 16 - Substation Annual Energy Weighted VO Factors....................................................... 46
Table 17 - Summary of Existing Case Compliance with VO Thresholds .................................... 58
Table 18 - Plan A VO Improvements ........................................................................................... 60
Table 19 - Plan A VO Improvements and Costs........................................................................... 61
Table 20 - Plan A Average Voltage Reduction and End-Use Energy Savings ............................ 62
Table 21 - Plan A System Line and No-Load Losses................................................................... 62
Table 22 - Plan A Economic Analysis Summary by Substation .................................................. 63
Table 23 - Plan A Economic Analysis Summary - Overall .......................................................... 64
Table 24 - Plan B VO Improvements ........................................................................................... 65
Table 25 - Plan B VO Improvements and Costs........................................................................... 66
Table 26 - Plan B Average Voltage Reduction and End-Use Energy Savings............................. 67
Table 27 - Plan B System Line and No-Load Losses ................................................................... 68
Table 28 - Plan B Economic Analysis Summary by Substation................................................... 68
Table 29 - Plan B Economic Analysis for Substations ................................................................. 69
Table 30 - Plan A VO Upgrades ................................................................................................... 72
Table 31 - Plan B VO Upgrades ................................................................................................... 74
Table 32 - Plan Comparison Summary......................................................................................... 75
Table 33 - System-Level Results .................................................................................................. 79
Table 34 - Relative Precision........................................................................................................ 79
Table 35 - Extrapolation Results - Feeder-Based ......................................................................... 80
Table 36 - Extrapolation Results - Substation-Based ................................................................... 81
Table 37 - Factors Affecting Potential Results ............................................................................. 82
Commonwealth Edison Company Task 10 – Final Report
Contract No. 01146430 – Task 10 Proprietary
Applied Energy Group 1377 Motor Parkway, Suite 401 Islandia, NY 11749 P: 631-434-1414 www.appliedenergygroup.com
Table 38 - DSMore Input Parameters ........................................................................................... 83
Table 39 - DSMore Utility Cost Categories ................................................................................. 84
Table 40 - DSMore Load Shape Parameters................................................................................. 84
Table 41 - Plan A DSMore B-C Results....................................................................................... 86
Table 42 - Plan B DSMore B-C Results ....................................................................................... 87
Table 43 - Summary of Project Results ........................................................................................ 93
Table 44 - System Level Itemization of VO Costs ....................................................................... 95
List of Figures
Figure 1 - Overall Project Design and Flow Chart ......................................................................... 4
Figure 2 - Average Savings per Substation..................................................................................... 6
Figure 3 - Average VO Cost per Substation ................................................................................... 6
Figure 4 - VO Cost Itemization ...................................................................................................... 7
Figure 5 - VO EE Supply Curves ................................................................................................... 8
Figure 6 - EE and VO Benchmark Supply Curve........................................................................... 9
Figure 7 - Number of Feeders per Substation............................................................................... 13
Figure 8 - Illustration of Efficiency Upgrades for Plans A and B ................................................ 21
Figure 9 - VO Study Process for Existing Case............................................................................ 33
Figure 10 - VO Study Process for VO Simulation Cases ............................................................. 34
Figure 11 - Typical IVVC Application to Isolate Non-Viable Feeders........................................ 43
Figure 12 - Sample Group Total Energy Savings Potential.......................................................... 71
Figure 13 - Sample Group Total VO Cost .................................................................................... 72
Figure 14 - Sample Extrapolation Process.................................................................................... 77
Figure 15 - DSMore Load Shapes ................................................................................................ 85
Figure 16 - Average Savings per Substation................................................................................. 94
Figure 17 - Average VO Cost per Substation ............................................................................... 95
Figure 18 - VO Cost Itemization .................................................................................................. 96
Figure 19 - VO EE Supply Curves ............................................................................................... 97
Figure 20 - EE and VO Benchmark Supply Curve....................................................................... 98
Commonwealth Edison Company Task 10 – Final Report
Contract No. 01146430 – Task 10 Proprietary 1
Applied Energy Group 1377 Motor Parkway, Suite 401 Islandia, NY 11749 P: 631-434-1414 www.appliedenergygroup.com
1. Executive Summary
The Applied Energy Group (AEG) was contracted by Commonwealth Edison Company (ComEd)
under Contract No. 01146430 to conduct an investigation of the feasibility and potential of energy
savings and peak power reductions on ComEd’s power system through systematic deployment of
voltage optimization techniques and technologies. Voltage Optimization (VO) is defined to be a
combination of Conservation Voltage Reduction (CVR) and Volt-VAR Optimization (VVO).
VVO coordinates capacitor bank operation to reduce distribution losses and improve power
factors. CVR initiates a systematic reduction of end-user voltages using load tap changers, line
drop compensation, voltage regulators, and capacitors to reduce energy consumption.
The Illinois Commerce Commission (ICC) directed ComEd to conduct a feasibility study of
adopting VO in the final order of Docket No. 13-0495 (2013 Energy Efficiency Plan). These
programs are intended to reduce end-use customer energy consumption and peak demand while
reducing utility distribution system energy losses. AEG conducted a feasibility study on ComEd’s
electric distribution system to quantify potential VO savings.
A primary objective of the study was to assess the magnitude of customer end-user and utility
benefits available from two VO scenarios: A minimum cost VO scenario (Plan A) based on
feeder upgrades required to bring the system up to ComEd defined performance standards; and a
maximum savings scenario (Plan B) designed to optimize VO savings within the constraints of
ComEd’s Total Resource Cost (TRC) benefit-cost thresholds. In all cases, existing ComEd
distribution system planning/design and operation guidelines were strictly followed. Not
addressed was the impact of end-use energy savings on ComEd’s distribution revenues and
associated cost recovery.
1.1 Key Findings
The potential to achieve cost-effective energy savings and demand reductions for VO on the
ComEd distribution network is significant. The study found cost-effective energy savings of
as much as 1900 GWh-yr, equal to approximately 2% of ComEd’s retail sales, at a cost of
approximately $0.0185/kWh.
It is estimated 515 substations (64%) and 2,890 feeders (51%) are viable candidates for VO
implementation with an average savings per viable feeder of 3.5%. This high savings
estimate relative to other utility VO programs can be attributed to a number of factors,
including low voltage drops across feeders due to short runs, relatively good system
efficiencies (good phase and load balancing), favorable end-use load composition (low
saturation of electric resistance heat), and current voltage settings (conservatively high).
The primary determinants of feeder VO non-viability were voltage level (>25kV and <11kV
urban networks were excluded), and customer class (large commercial and industrial loads are
Commonwealth Edison Company Task 10 – Final Report
Contract No. 01146430 – Task 10 Proprietary 2
Applied Energy Group 1377 Motor Parkway, Suite 401 Islandia, NY 11749 P: 631-434-1414 www.appliedenergygroup.com
not good VO candidates).
A majority of the distribution system requires efficiency upgrades (best industry practices) for
VO to be effective. For example, Plan A (minimum cost plan) requires a $425 million
investment to allow average voltages at the customer meter to be reduced by 2.96%,
accounting for the majority of energy savings.
ComEd design guidelines specify maximum secondary voltage drops of 6.0 volts. However,
for the VO study, a utility best practice of 3.6 volts was used (or 3% on a 120-volt base) to
allow potential energy savings to be maximized.
The maximum energy savings (Plan B) can be achieved by investing an additional $150
million – a total of $575 million – over Plan A, resulting in an average voltage reduction of
3.81%. The incremental Plan B investments increase the total program TRC B-C ratio from
2.20 to 2.30.
Isolating non-viable feeders from viable feeders at the same substation (and voltage control
zone) is one of the key challenges to VO implementation. The use of IVVC rather than
physical space-prohibited substation voltage regulator banks is the recommended feeder
isolation solution.
Capital cost recovery, lost revenue adjustments, and energy efficiency program inclusion are
key regulatory hurdles for ComEd’s VO strategy.
1.2 Approach
AEG’s approach was designed to provide ComEd with the following benefits:
Reliance on proven, industry standard modeling and engineering methods that have been used
at other utilities similar to ComEd.
Efficient use of ComEd’s existing CYME distribution data sets to ensure timely and cost-
effective results.
Robust statistical techniques yielding representative and defensible system-level VO benefits
and costs, appropriate for regulatory submittal.
Recent national perspectives on VO activities through the collective experience of the AEG
team.
AEG’s methodology followed two major steps: 1) “Total feeder prioritization” of potential
candidates; and 2) “Sample feeder detailed analysis” using load-flow simulations. Estimated VO
factors were applied to both steps.
Commonwealth Edison Company Task 10 – Final Report
Contract No. 01146430 – Task 10 Proprietary 3
Applied Energy Group 1377 Motor Parkway, Suite 401 Islandia, NY 11749 P: 631-434-1414 www.appliedenergygroup.com
Fourteen (14) of ComEd’s 19 operating regions were included in the study group. The initial step
of “total feeder prioritization” classified 3757 feeders out of ComEd’s total population of
approximately 5650 feeders1 using a simplified load flow analysis of feeder characteristics
involving load type, load density, feeder lengths, existing voltage control settings, real and
reactive loads, line voltage drops and losses, line regulators installed, and conductor loading.
Feeders were categorized as viable or non-viable for VO implementation, and viable feeders were
prioritized based on a potential voltage-reduction magnitude-sensitivity impact analysis, and
subsequent energy savings potential.
Next, a sample of 70 feeders from 16 substations was selected using a stratified random sampling
approach to fairly represent the total feeder population. Detailed analyses of planning and load-
flow simulations were performed to determine expected annual energy savings (kWh) and peak
power reductions (kW) for each of the two VO scenarios. This sample feeder analyses included
an assessment of system upgrades between the existing system and VO-modified plans, including
benefits/costs for each VO scenario, which were then extrapolated back to the total ComEd
system level using statistical ratio estimation techniques linking the sample group, study group,
and system population. In addition, a recommended VO pilot project was outlined to demonstrate
the proposed VO implementation strategies, verify estimated VO factors, and develop simplified
VO M&V procedures for ComEd’s distribution system.
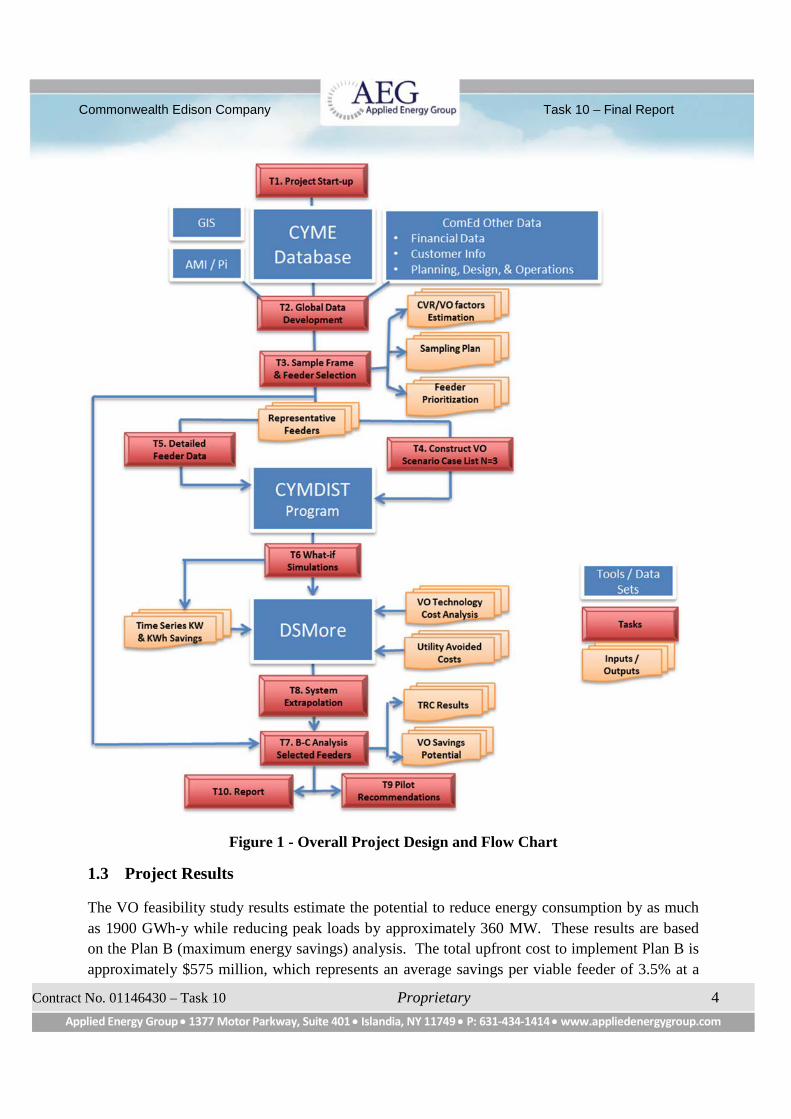
The overall project design and process flow chart is shown in Figure 1. The numbers in the task
boxes (T1, T2, etc.) refer to the 10 project tasks referenced throughout this report and listed
below.
Task 1: Project Start Up (kick-off meeting)
Task 2: Develop Global Data Templates to facilitate data collection
Task 3: Sample Frame and Feeder Selection/Screening
Task 4: Develop Scenario Case List for “what-if” analysis
Task 5: Data Collection for representative feeders to be studied
Task 6: Conduct “What-if” Analysis on representative feeders
Task 7: Perform Benefit-Cost Analysis
Task 8: Extrapolate representative feeder results to system level
Task 9: Suggest Potential VO Pilot Project to test study results
Task 10: Final Report/Presentation
1Except for secondary networks like the one serving downtown Chicago, which will need further discussion with the
ComEd distribution planning group.
Commonwealth Edison Company Task 10 – Final Report
Contract No. 01146430 – Task 10 Proprietary 4
Applied Energy Group 1377 Motor Parkway, Suite 401 Islandia, NY 11749 P: 631-434-1414 www.appliedenergygroup.com
Figure 1 - Overall Project Design and Flow Chart
1.3 Project Results
The VO feasibility study results estimate the potential to reduce energy consumption by as much
as 1900 GWh-y while reducing peak loads by approximately 360 MW. These results are based
on the Plan B (maximum energy savings) analysis. The total upfront cost to implement Plan B is
approximately $575 million, which represents an average savings per viable feeder of 3.5% at a
Commonwealth Edison Company Task 10 – Final Report
Contract No. 01146430 – Task 10 Proprietary 5
Applied Energy Group 1377 Motor Parkway, Suite 401 Islandia, NY 11749 P: 631-434-1414 www.appliedenergygroup.com
levelized cost of energy (LCOE) of $0.0185/kWh-saved. It is estimated VO is viable on 515 of
ComEd’s 806 substations, representing 2890 feeders. The minimum cost Plan A generates 1350
GWh-yr of savings at a cost of $425 million. A summary of Plan A and Plan B results are
presented in Table 1.
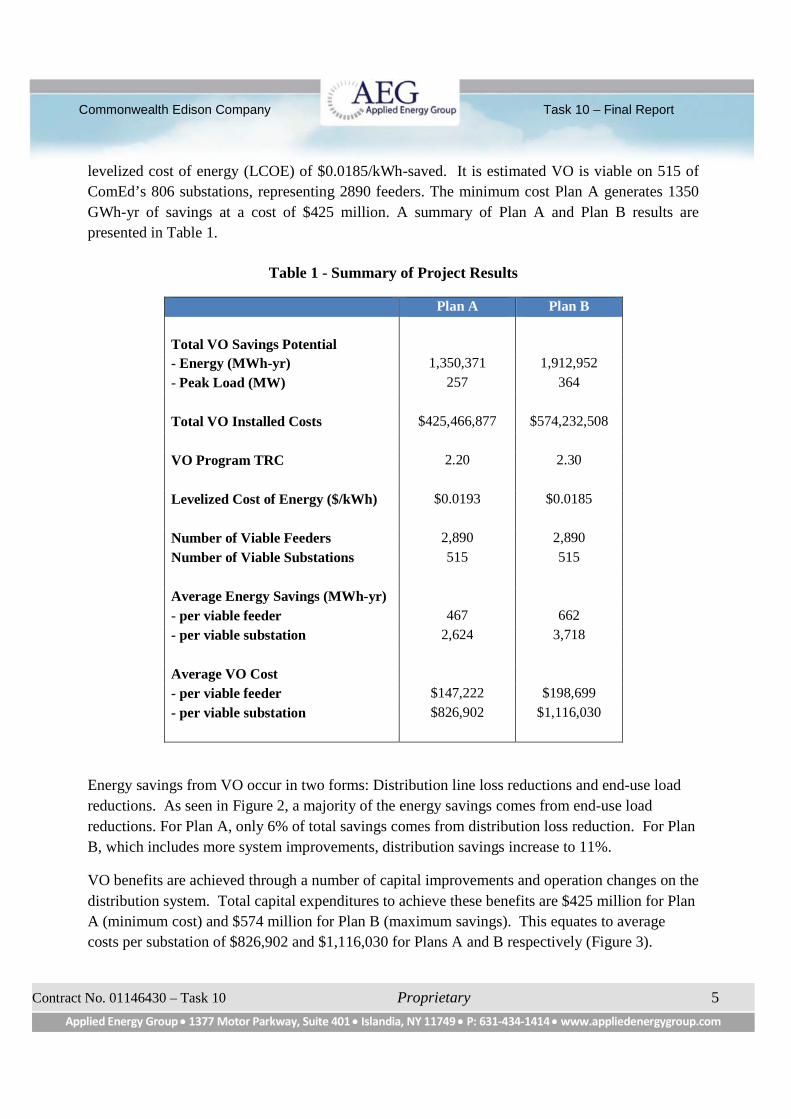
Table 1 - Summary of Project Results
Plan A Plan B
Total VO Savings Potential
- Energy (MWh-yr) 1,350,371 1,912,952
- Peak Load (MW) 257 364
Total VO Installed Costs $425,466,877 $574,232,508
VO Program TRC 2.20 2.30
Levelized Cost of Energy ($/kWh) $0.0193 $0.0185
Number of Viable Feeders 2,890 2,890
Number of Viable Substations 515 515
Average Energy Savings (MWh-yr)
- per viable feeder 467 662
- per viable substation 2,624 3,718
Average VO Cost
- per viable feeder $147,222 $198,699
- per viable substation $826,902 $1,116,030
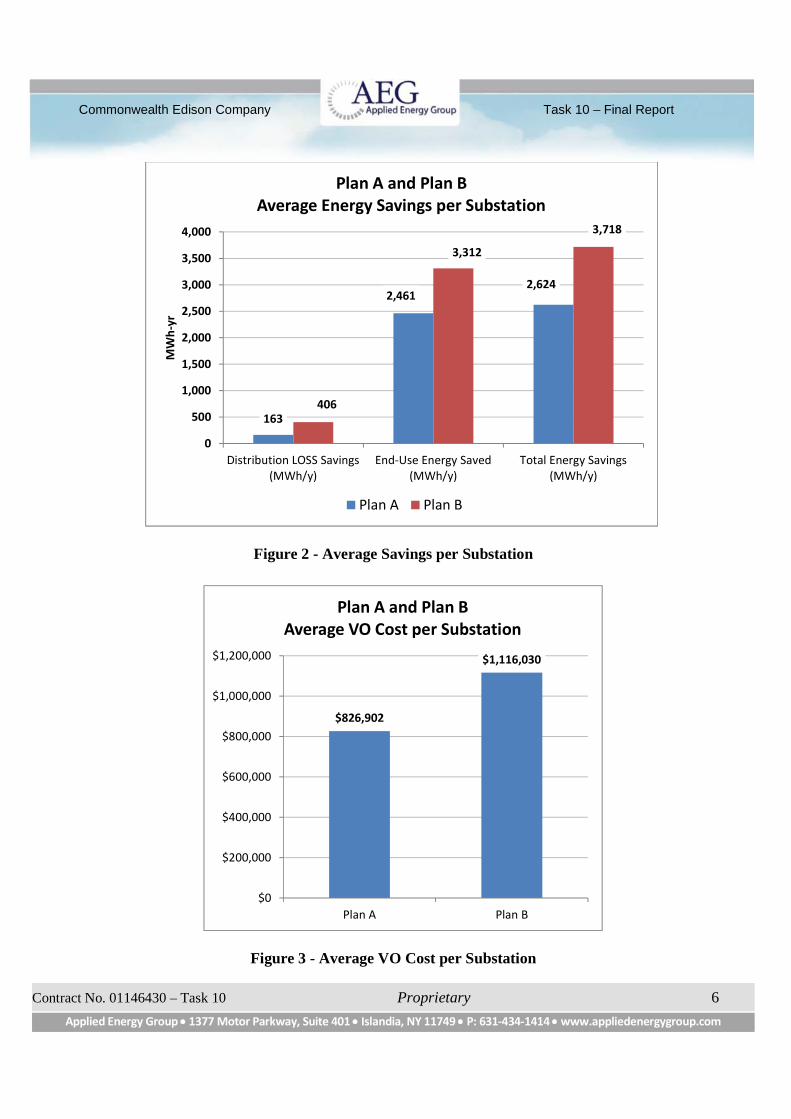
Energy savings from VO occur in two forms: Distribution line loss reductions and end-use load
reductions. As seen in Figure 2, a majority of the energy savings comes from end-use load
reductions. For Plan A, only 6% of total savings comes from distribution loss reduction. For Plan
B, which includes more system improvements, distribution savings increase to 11%.
VO benefits are achieved through a number of capital improvements and operation changes on the
distribution system. Total capital expenditures to achieve these benefits are $425 million for Plan
A (minimum cost) and $574 million for Plan B (maximum savings). This equates to average
costs per substation of $826,902 and $1,116,030 for Plans A and B respectively (Figure 3).
Commonwealth Edison Company Task 10 – Final Report
Contract No. 01146430 – Task 10 Proprietary 6
Applied Energy Group 1377 Motor Parkway, Suite 401 Islandia, NY 11749 P: 631-434-1414 www.appliedenergygroup.com
Figure 2 - Average Savings per Substation
Figure 3 - Average VO Cost per Substation
163
2,4612,624
406
3,312
3,718
0
500
1,000
1,500
2,000
2,500
3,000
3,500
4,000
Distribution LOSS Savings(MWh/y)
End-Use Energy Saved(MWh/y)
Total Energy Savings(MWh/y)
MW
h-y
rPlan A and Plan B
Average Energy Savings per Substation
Plan A Plan B
$826,902
$1,116,030
$0
$200,000
$400,000
$600,000
$800,000
$1,000,000
$1,200,000
Plan A Plan B
Plan A and Plan BAverage VO Cost per Substation
Commonwealth Edison Company Task 10 – Final Report
Contract No. 01146430 – Task 10 Proprietary 7
Applied Energy Group 1377 Motor Parkway, Suite 401 Islandia, NY 11749 P: 631-434-1414 www.appliedenergygroup.com
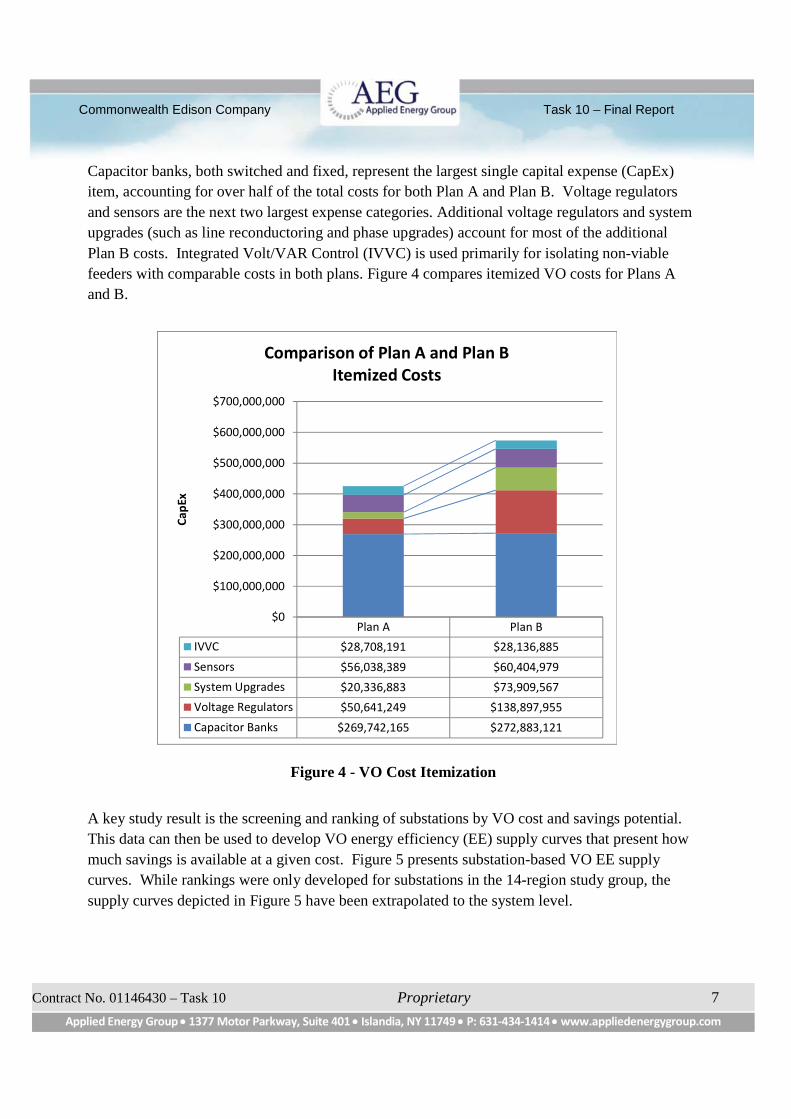
Capacitor banks, both switched and fixed, represent the largest single capital expense (CapEx)
item, accounting for over half of the total costs for both Plan A and Plan B. Voltage regulators
and sensors are the next two largest expense categories. Additional voltage regulators and system
upgrades (such as line reconductoring and phase upgrades) account for most of the additional
Plan B costs. Integrated Volt/VAR Control (IVVC) is used primarily for isolating non-viable
feeders with comparable costs in both plans. Figure 4 compares itemized VO costs for Plans A
and B.
Figure 4 - VO Cost Itemization
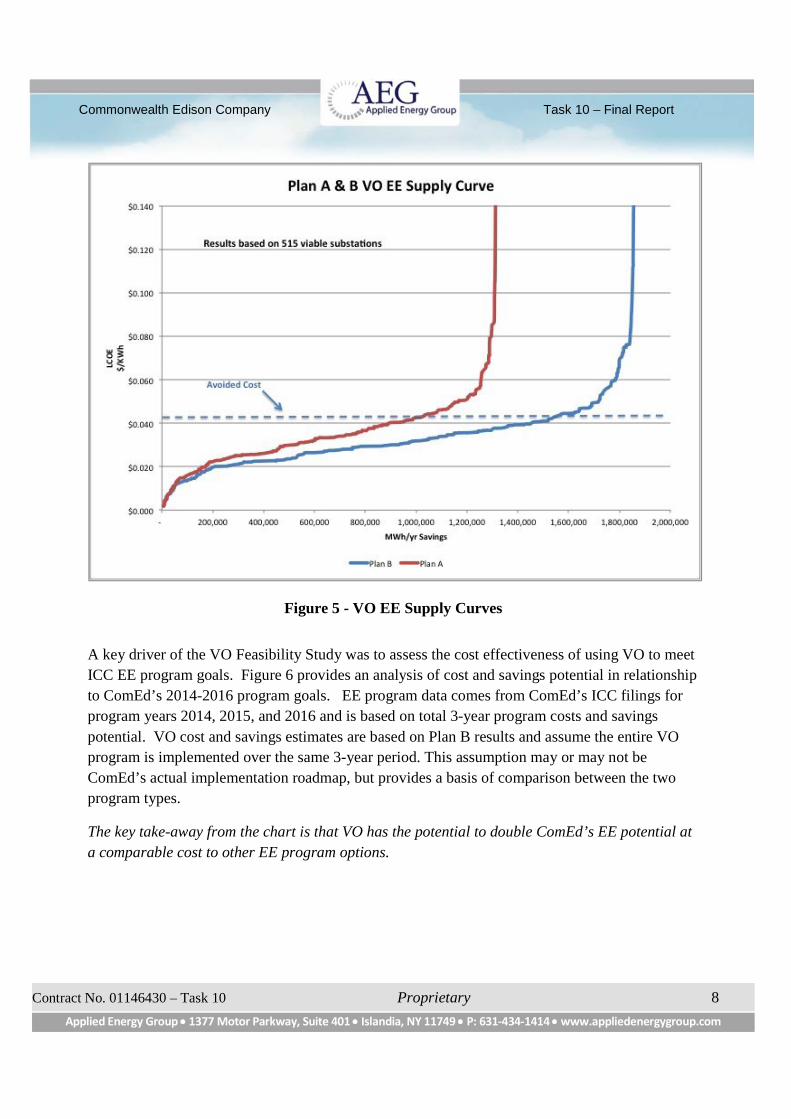
A key study result is the screening and ranking of substations by VO cost and savings potential.
This data can then be used to develop VO energy efficiency (EE) supply curves that present how
much savings is available at a given cost. Figure 5 presents substation-based VO EE supply
curves. While rankings were only developed for substations in the 14-region study group, the
supply curves depicted in Figure 5 have been extrapolated to the system level.
Plan A Plan B
IVVC $28,708,191 $28,136,885
Sensors $56,038,389 $60,404,979
System Upgrades $20,336,883 $73,909,567
Voltage Regulators $50,641,249 $138,897,955
Capacitor Banks $269,742,165 $272,883,121
$0
$100,000,000
$200,000,000
$300,000,000
$400,000,000
$500,000,000
$600,000,000
$700,000,000
Cap
Ex
Comparison of Plan A and Plan BItemized Costs
Commonwealth Edison Company Task 10 – Final Report
Contract No. 01146430 – Task 10 Proprietary 8
Applied Energy Group 1377 Motor Parkway, Suite 401 Islandia, NY 11749 P: 631-434-1414 www.appliedenergygroup.com
Figure 5 - VO EE Supply Curves
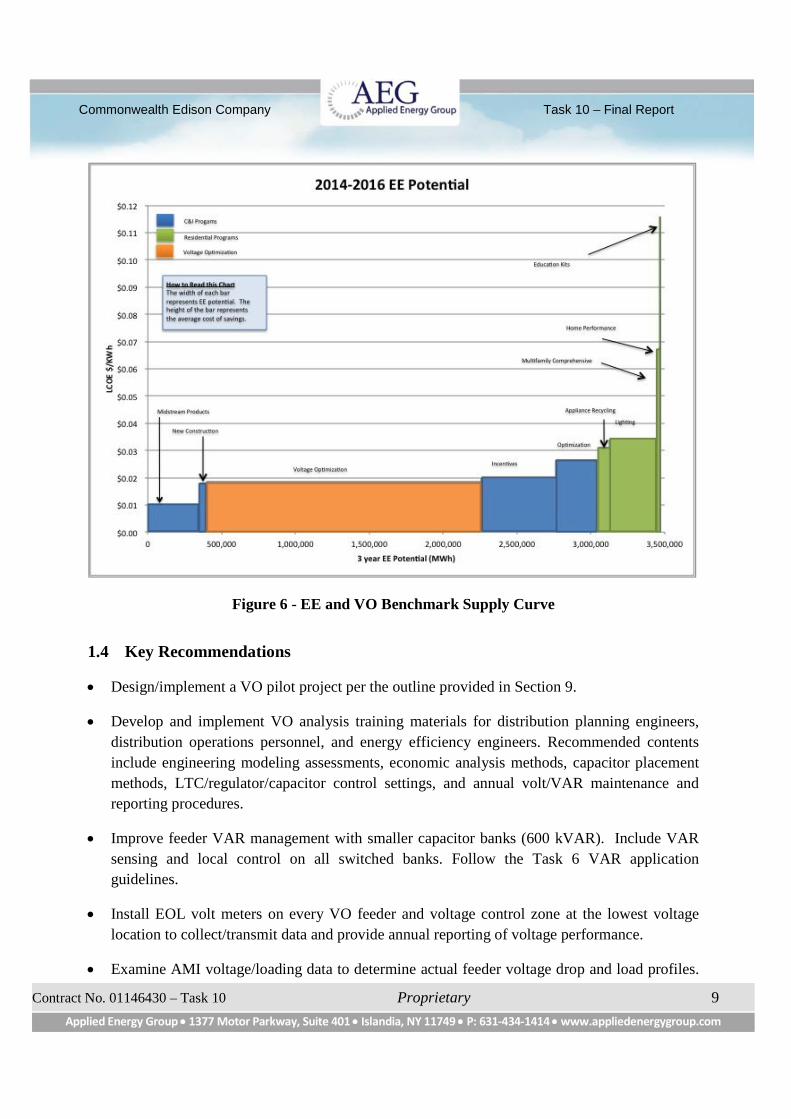
A key driver of the VO Feasibility Study was to assess the cost effectiveness of using VO to meet
ICC EE program goals. Figure 6 provides an analysis of cost and savings potential in relationship
to ComEd’s 2014-2016 program goals. EE program data comes from ComEd’s ICC filings for
program years 2014, 2015, and 2016 and is based on total 3-year program costs and savings
potential. VO cost and savings estimates are based on Plan B results and assume the entire VO
program is implemented over the same 3-year period. This assumption may or may not be
ComEd’s actual implementation roadmap, but provides a basis of comparison between the two
program types.
The key take-away from the chart is that VO has the potential to double ComEd’s EE potential at
a comparable cost to other EE program options.
Commonwealth Edison Company Task 10 – Final Report
Contract No. 01146430 – Task 10 Proprietary 9
Applied Energy Group 1377 Motor Parkway, Suite 401 Islandia, NY 11749 P: 631-434-1414 www.appliedenergygroup.com
Figure 6 - EE and VO Benchmark Supply Curve
1.4 Key Recommendations
Design/implement a VO pilot project per the outline provided in Section 9.
Develop and implement VO analysis training materials for distribution planning engineers,
distribution operations personnel, and energy efficiency engineers. Recommended contents
include engineering modeling assessments, economic analysis methods, capacitor placement
methods, LTC/regulator/capacitor control settings, and annual volt/VAR maintenance and
reporting procedures.
Improve feeder VAR management with smaller capacitor banks (600 kVAR). Include VAR
sensing and local control on all switched banks. Follow the Task 6 VAR application
guidelines.
Install EOL volt meters on every VO feeder and voltage control zone at the lowest voltage
location to collect/transmit data and provide annual reporting of voltage performance.
Examine AMI voltage/loading data to determine actual feeder voltage drop and load profiles.
Commonwealth Edison Company Task 10 – Final Report
Contract No. 01146430 – Task 10 Proprietary 10
Applied Energy Group 1377 Motor Parkway, Suite 401 Islandia, NY 11749 P: 631-434-1414 www.appliedenergygroup.com
Results can be used to establish standards for addressing maximum allowable voltage drops
(distribution transformer and secondary voltage drops) and minimum allowable primary
voltages (i.e., 118.6 volts for an allowed 3.6 volt drop). Evaluate potential impacts
(probability of customer transformers needing replacement) of primary voltages violating
minimum standards. Revise transformer sizing guidelines based on this customer loading
information.
Maintain, correct, and/or upgrade GIS-CYMDist interface, software, and distribution system
models at least annually or as needed.
Commonwealth Edison Company Task 10 – Final Report
Contract No. 01146430 – Task 10 Proprietary 11
Applied Energy Group 1377 Motor Parkway, Suite 401 Islandia, NY 11749 P: 631-434-1414 www.appliedenergygroup.com
2. Introduction
This report provides an overview of the approach used to perform a Voltage Optimization (VO)
assessment of ComEd’s distribution system to quantify energy savings potential (ESP) and
associated cost impacts for each feeder. Prioritization methods, process steps, assumptions, and
related formulations are described. A representative sample set of viable substation and feeder
candidates (consisting of 16 substations and 47 viable feeders, down from 50, as explained in
Section 7) are provided along with a method for extrapolating results to total system values. The
process to develop “what-if” plans (Base Case, Plan A, and Plan B) for each viable feeder is
described. VO thresholds used as the basis for feeder efficiency improvements are summarized
along with application priorities and improvements rationale. VO pilot project recommendations
are described to verify M&V techniques, projected savings, and associated costs. Section 10
summarizes system-wide results, key findings, and recommendations for ESP, associated system
improvements, ComEd standards, and operating practices.
The ComEd distribution system infrastructure and equipment database forms the basis for VO
evaluation, which is obtained from ComEd’s latest Geographical Information System (GIS),
Transformer Load Management (TLM) System, Customer Information System (CIS), and Global
Data sources. All initial screening evaluations are performed using Eaton’s CYMDist load flow
distribution analysis software assuming base case summer peak load conditions. Below is a
summary of system and performance characteristics derived from the screening. All voltages are
on a 120V base unless otherwise indicated.
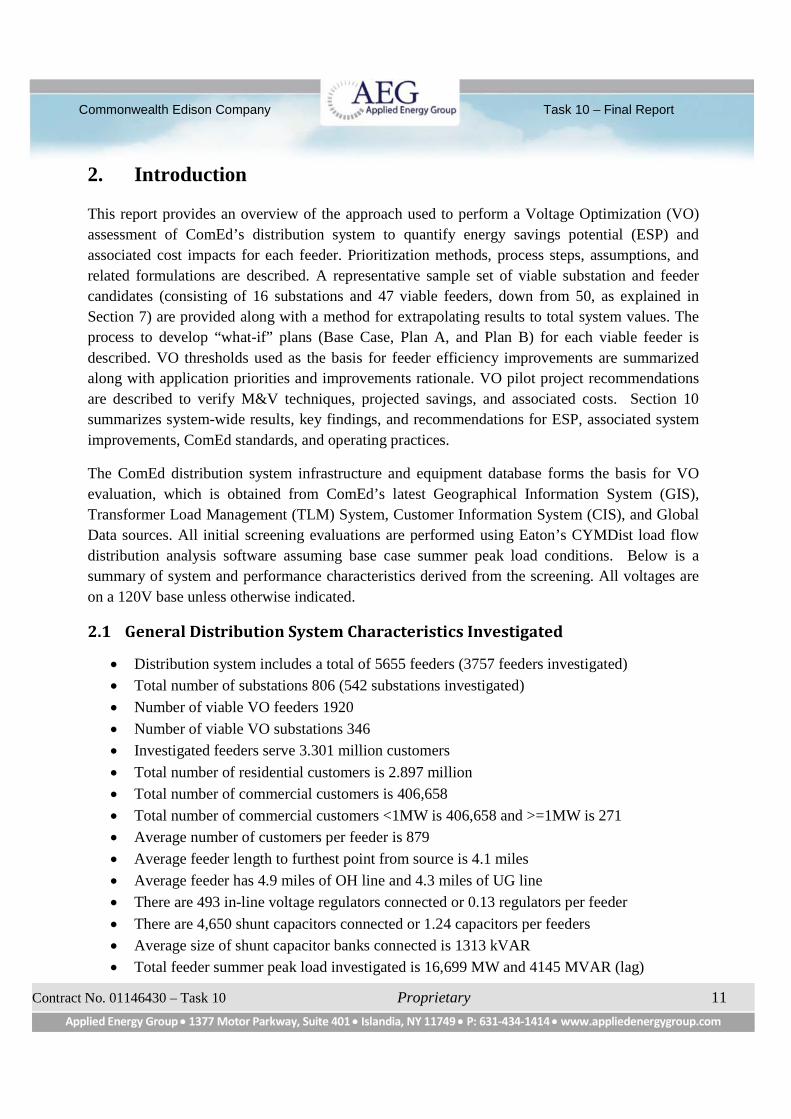
2.1 General Distribution System Characteristics Investigated
Distribution system includes a total of 5655 feeders (3757 feeders investigated)
Total number of substations 806 (542 substations investigated)
Number of viable VO feeders 1920
Number of viable VO substations 346
Investigated feeders serve 3.301 million customers
Total number of residential customers is 2.897 million
Total number of commercial customers is 406,658
Total number of commercial customers <1MW is 406,658 and >=1MW is 271
Average number of customers per feeder is 879
Average feeder length to furthest point from source is 4.1 miles
Average feeder has 4.9 miles of OH line and 4.3 miles of UG line
There are 493 in-line voltage regulators connected or 0.13 regulators per feeder
There are 4,650 shunt capacitors connected or 1.24 capacitors per feeders
Average size of shunt capacitor banks connected is 1313 kVAR
Total feeder summer peak load investigated is 16,699 MW and 4145 MVAR (lag)
Commonwealth Edison Company Task 10 – Final Report
Contract No. 01146430 – Task 10 Proprietary 12
Applied Energy Group 1377 Motor Parkway, Suite 401 Islandia, NY 11749 P: 631-434-1414 www.appliedenergygroup.com
Total distribution transformer capacity is 52.683 million kVA
Average distribution transformer loading is 35.0% of nameplate capacity
Total distribution xfmr screened load is 18.428 million kVA.
Total distribution xfmr screened load for residential is 9.023 million kVA.
Total distribution xfmr screened load for commercial <1MW is 9.003 million kVA.
Total distribution xfmr screened load for commercial >=1MW is 0.402 million kVA.
Note: The number of commercial customers and amount of loads served for primary-fed
services has not been identified for this initial screening evaluation.
2.2 Feeder Performance Characteristics
Length of overloaded conductor is 187.99 miles (approximately 0.3% of system total)
Average feeder source load imbalance is 21.9%
Average source feeder voltage setting average is 124.81V for substation bus.
Average end-of-line lowest voltage is 120.5V three-phase and 120.1V single-phase
All voltage regulation devices have no Line-Drop-Compensation (LDC) applied
Substation voltage regulation bandwidths are 3.0V
In-line voltage regulator average voltage setting is 125.0V
In-line voltage regulators have volt bandwidths of 2.0V
“Native” accumulated average volt-drop per feeder is 5.7V with no capacitors connected,
all in-line volt-regulators on neutral tap, and 98% source power factor
Average feeder average primary voltage is 123.68V
Note: The amount of overloaded conductors of the 3757 feeders screened is based on
power flows using conductor information from GIS and should be verified.
Figure 7 summarizes the number of feeders served by each ComEd substation. Observations:
70% of ComEd substations serve 5 or more feeders. 15% serve between 5 and 15 feeders. 10% serve between 15 and 25 feeders. 5% serve more than 25 feeders.

Commonwealth Edison Company Task 10 – Final Report
Contract No. 01146430 – Task 10 Proprietary 13
Applied Energy Group 1377 Motor Parkway, Suite 401 Islandia, NY 11749 P: 631-434-1414 www.appliedenergygroup.com
Figure 7 - Number of Feeders per Substation
The VO objective is to improve distribution system efficiency by cost-effectively managing
voltages to maximize system loss reductions and end-use energy savings. Typical improvements
include upgrades such as metering, load balancing (line reconfiguration, tap changes, minor phase
upgrades and/or reconductoring), improved VAR (capacitor) management, and the addition of in-
line voltage regulators. System efficiency also includes optimal loading and sizing of equipment
for loss reduction, requiring long-range infrastructure improvements and replacements, expensive
capital outlays, which are not included in this investigation. However, minimum upgrades to
correct marginally overloaded lines or equipment are included.
An ideal (optimal) feeder can be described as one where an incremental change in power/energy
NPV costs equals the incremental change in VO improvement NPV costs. Ideal feeder
characteristics can vary between feeders and among utilities based on customer load type, cost of
purchased power, and feeder electrical configuration. The following list describes ideal feeder
characteristics based on Northwest Planning Conservation Council (NWPCC) Regional Technical
Forum (RTF) VO M&V Protocol guidelines [5]:
Source and in-line voltage regulator voltages near 119.0V for light load conditions
Source and in-line voltage regulator voltages less than 124.0V for peak load conditions
Primary minimum voltages near 119.0V for every hour of operation
In-line voltage regulator bandwidths of 2.0V
Source feeder load imbalance less than 20.0%
Accumulated voltage drops for Voltage Control Zones (VCZ) less than 4.0V
Primary line and distribution transformer no-load energy loss less than 2.0%
0
5
10
15
20
25
30
35
40
45
50
0% 20% 40% 60% 80% 100%
#o
fFe
ee
rsp
er
Sub
stat
ion
Cumulative %
Number of Feeders per Substation
Commonwealth Edison Company Task 10 – Final Report
Contract No. 01146430 – Task 10 Proprietary 14
Applied Energy Group 1377 Motor Parkway, Suite 401 Islandia, NY 11749 P: 631-434-1414 www.appliedenergygroup.com
Source reactive load near 100% compensated for every hour of operation
Minimum allowed primary voltage 118.6V (assume 2.0V BW)
Maximum allowed secondary voltage drop 3.6V (3%VD)
The analysis included development of ComEd-specific VO factors for summer and winter peak
conditions. Factors were determined in Task 4 using empirical relations based on regional climate
data and typical appliance mix by customer class.
All feeders served by a common substation or power transformer were evaluated as an integrated
Voltage Control Zone (VCZ), since each feeder was impacted by the same source voltage
regulator or LTC. Not all feeders can cost-effectively achieve performance thresholds. However,
significant cost-effective savings are possible with some system upgrades.
Initial screening quantified performance indicators (Keywords) for each feeder (derived from load
flow simulations) to identify viable feeder and substation candidates. Screening was based on
summer peak load.
Before assessments could be performed, the following actions were required:
Obtained feeder source MW and MVAR hourly data
Determined residential and commercial VO factors
Modeled and simulated (with CYMDist) distribution system feeder performance
The analysis tabulated the following major feeder characteristics to identify needed upgrades,
approximate potential energy savings, and estimate implementation costs for each plan:
1) Identify and/or establish minimum allowed primary voltage.
2) Identify existing overloaded equipment and make appropriate corrections.
3) Improve source feeder load imbalance and reduce neutral currents.
4) Improve VAR compensation effectiveness to maintain near unity power factor
8760 hr/yr.
5) Reduce accumulated volt-drop for each Voltage Control Zone (VCZ) from source to
lowest voltage point with additional VCZs (by adding voltage regulators).
6) Revise voltage control settings for source transformer LTCs and in-line voltage regulator
to reflect the lowest maximum voltage necessary for peak loads and minimum voltage for
light loads.
Commonwealth Edison Company Task 10 – Final Report
Contract No. 01146430 – Task 10 Proprietary 15
Applied Energy Group 1377 Motor Parkway, Suite 401 Islandia, NY 11749 P: 631-434-1414 www.appliedenergygroup.com
3. Data Collection Process
To facilitate the data collection process, a Global Data Request (GDR) template was populated
with available system information needed for feeder VO prioritization and detailed sample feeder
analyses. Included were the following data categories:
General system information
CYME and GIS database interface information
Utility annual report and five-year capital information
Distribution system equipment identifications and performance
Planning and design voltage guidelines; planning and design loading guidelines
Reactive load management VAR guidelines
Distribution system metering
Customer load data research information
Distribution planning investment cost estimates
Financial data assumptions
In addition to the GDR, the availability of specific distribution system data for the representative
substations and feeders selected for more detailed VO analysis was captured using a set tables.
Data included the following:
General substation information
Substation service area CYME and GIS database modeling data
Substation equipment information
Specific substation feeder information
The detailed data collection process followed a 3-step process as follows:
Step 1: Check-boxes were marked by ComEd based on data availability using a set of
interactive tables to simplify the collection process.
Step 2: Data for a complete substation set (substation and feeders) was collected in the
following formats: Draw File (.dwg), AutoCAD (.dxf), MS Word (.docx), MS Access
(.mdb), PDF (.pdf), and/or Excel (.xlsx).
Step 3: Additional data was requested as the needed during the analysis process.
All information was kept strictly confidential, with access limited to AEG project team members
only.
Commonwealth Edison Company Task 10 – Final Report
Contract No. 01146430 – Task 10 Proprietary 16
Applied Energy Group 1377 Motor Parkway, Suite 401 Islandia, NY 11749 P: 631-434-1414 www.appliedenergygroup.com
4. VO Screening and Representative Feeder Selection
The steps below describe the screening process for VO energy savings, implementation costs (VO
Costs), sorting of results, and selecting representative sample feeders/substations for detailed VO
sample assessments.
Even though not part of the screening process, VO results extrapolation to total-system values is
an important next step. As such, it is helpful to understand the context in which this occurs.
Therefore, the extrapolation method is also provided below as Step 12.
Step 1 Perform an initial screening of all ComEd feeders to identify “viable” and “non-viable”
feeder candidates. NOTE: Due to time and feasibility constraints, only 14 of the total 19
regions were included in the feeder screening process. The five regions that were not
included will be statistically accounted for in the final results.
Step 2 Estimate potential VO energy savings (ESP) for each “viable” feeder.
Step 3 Convert energy savings per feeder to present value (PV) energy savings per feeder
(ESP$).
Step 4 Estimate PV implementation costs per feeder (VO Costs). Allocate Class 1 non-viable
feeder isolation costs to all other viable sister feeders on the same substation. Class 1
refers to feeders that have high amounts of commercial load or overloaded line miles.
Class 2 refers to feeders where the voltage class is too high >25kV or too low <11kV or
is network loop fed.
Step 5 Calculate the Benefit-Cost Ratio (BCR) and the Levelized Cost of Energy (LCOE) for
each “viable” feeder candidate.
Step 6 Sort feeders by ESP. Rank each “viable” feeder consecutively from highest savings to
lowest. The highest feeder rank (e.g., 4178) represents the highest energy savings
potential. “Non-viable” feeders are listed but are ranked “zero” to signify they offer no
cost-effective energy savings potential. Generate VO Energy Efficiency Supply Curves
showing cumulative energy savings potential by LCOE.
Step 7 Group “viable” and “non-viable” feeders from Step 6 by substation name. Each
substation may include many feeders. Since feeders originating from a common
substation bus have the same source voltage regulation, VO is best evaluated on a
substation basis. Each substation is labeled with the total number of feeders, total
potential energy savings, total costs, average energy savings per feeder, and average
costs per feeder.
Step 8 Calculate total substation costs, average costs per feeder, and BCRs.
Commonwealth Edison Company Task 10 – Final Report
Contract No. 01146430 – Task 10 Proprietary 17
Applied Energy Group 1377 Motor Parkway, Suite 401 Islandia, NY 11749 P: 631-434-1414 www.appliedenergygroup.com
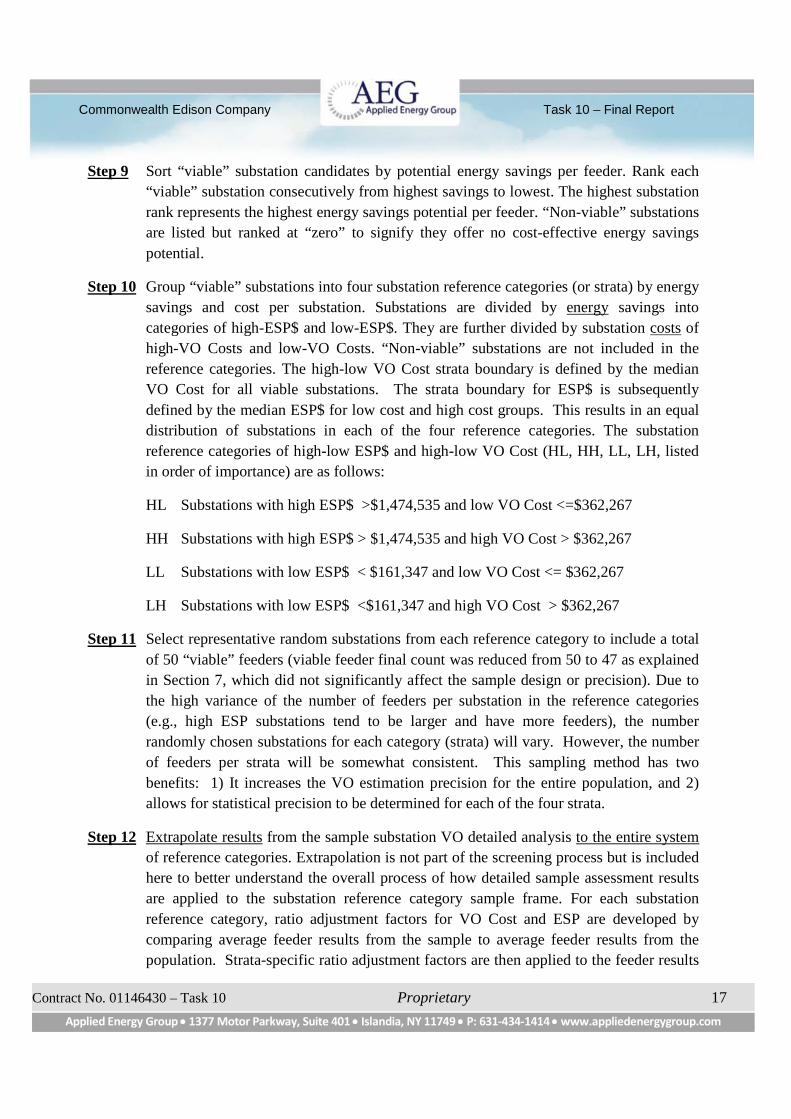
Step 9 Sort “viable” substation candidates by potential energy savings per feeder. Rank each
“viable” substation consecutively from highest savings to lowest. The highest substation
rank represents the highest energy savings potential per feeder. “Non-viable” substations
are listed but ranked at “zero” to signify they offer no cost-effective energy savings
potential.
Step 10 Group “viable” substations into four substation reference categories (or strata) by energy
savings and cost per substation. Substations are divided by energy savings into
categories of high-ESP$ and low-ESP$. They are further divided by substation costs of
high-VO Costs and low-VO Costs. “Non-viable” substations are not included in the
reference categories. The high-low VO Cost strata boundary is defined by the median
VO Cost for all viable substations. The strata boundary for ESP$ is subsequently
defined by the median ESP$ for low cost and high cost groups. This results in an equal
distribution of substations in each of the four reference categories. The substation
reference categories of high-low ESP$ and high-low VO Cost (HL, HH, LL, LH, listed
in order of importance) are as follows:
HL Substations with high ESP$ >$1,474,535 and low VO Cost <=$362,267
HH Substations with high ESP$ > $1,474,535 and high VO Cost > $362,267
LL Substations with low ESP$ < $161,347 and low VO Cost <= $362,267
LH Substations with low ESP$ <$161,347 and high VO Cost > $362,267
Step 11 Select representative random substations from each reference category to include a total
of 50 “viable” feeders (viable feeder final count was reduced from 50 to 47 as explained
in Section 7, which did not significantly affect the sample design or precision). Due to
the high variance of the number of feeders per substation in the reference categories
(e.g., high ESP substations tend to be larger and have more feeders), the number
randomly chosen substations for each category (strata) will vary. However, the number
of feeders per strata will be somewhat consistent. This sampling method has two
benefits: 1) It increases the VO estimation precision for the entire population, and 2)
allows for statistical precision to be determined for each of the four strata.
Step 12 Extrapolate results from the sample substation VO detailed analysis to the entire system
of reference categories. Extrapolation is not part of the screening process but is included
here to better understand the overall process of how detailed sample assessment results
are applied to the substation reference category sample frame. For each substation
reference category, ratio adjustment factors for VO Cost and ESP are developed by
comparing average feeder results from the sample to average feeder results from the
population. Strata-specific ratio adjustment factors are then applied to the feeder results
Commonwealth Edison Company Task 10 – Final Report
Contract No. 01146430 – Task 10 Proprietary 18
Applied Energy Group 1377 Motor Parkway, Suite 401 Islandia, NY 11749 P: 631-434-1414 www.appliedenergygroup.com
of the population, adjusting each individual feeder’s VO Cost and ESP estimate up or
down proportionally by substation, region, and total system. VO energy savings and
costs are then recalculated based on ratio-adjusted feeder results. This extrapolation step
is repeated for each sample VO option evaluated.
Feeder screening requires each feeder be assigned a relative VO potential savings and cost. These
potential values are based on a set of formulations derived to fairly represent typical savings and
implementation costs; and are applied independently to feeders, providing a robust method for
comparing relative feeder potentials.
The formulations determine potential energy savings, costs, and BCR for each feeder. “Non-
viable” feeder candidates have zero energy savings potential. The approach assumes cost-
effective minimal upgrades as a VO pre-requisite. Formulations are described in the Task 3 final
report.
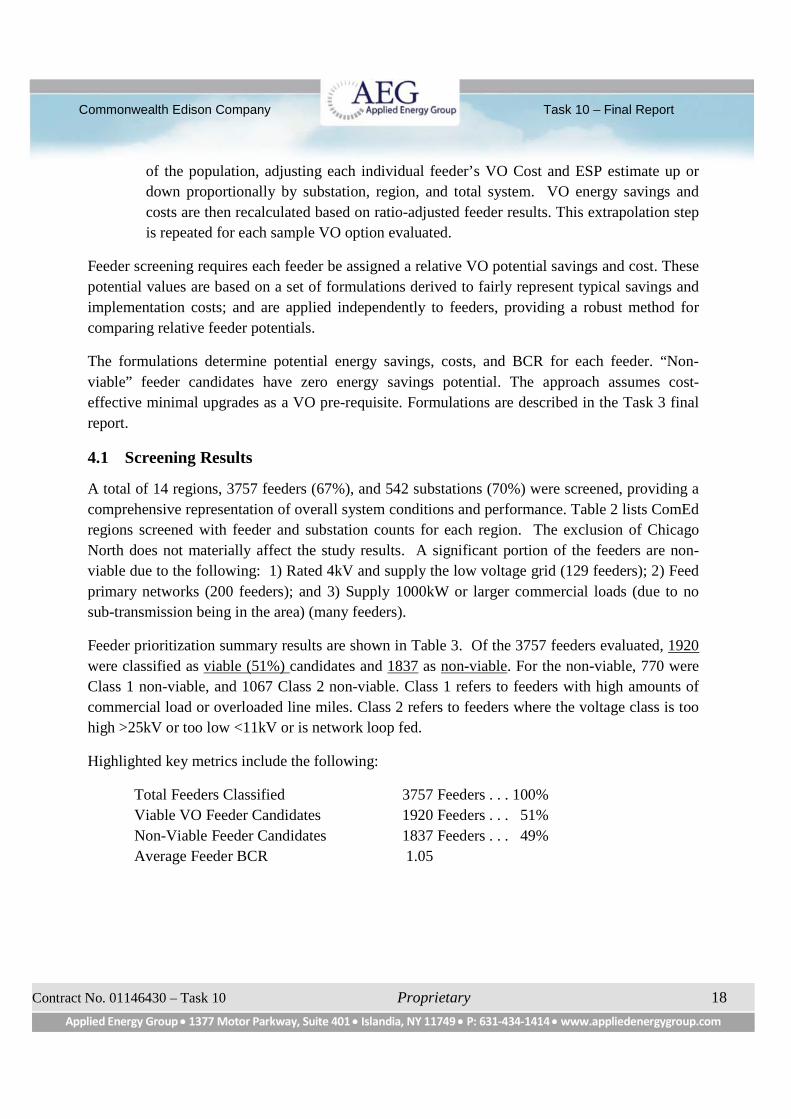
4.1 Screening Results
A total of 14 regions, 3757 feeders (67%), and 542 substations (70%) were screened, providing a
comprehensive representation of overall system conditions and performance. Table 2 lists ComEd
regions screened with feeder and substation counts for each region. The exclusion of Chicago
North does not materially affect the study results. A significant portion of the feeders are non-
viable due to the following: 1) Rated 4kV and supply the low voltage grid (129 feeders); 2) Feed
primary networks (200 feeders); and 3) Supply 1000kW or larger commercial loads (due to no
sub-transmission being in the area) (many feeders).
Feeder prioritization summary results are shown in Table 3. Of the 3757 feeders evaluated, 1920
were classified as viable (51%) candidates and 1837 as non-viable. For the non-viable, 770 were
Class 1 non-viable, and 1067 Class 2 non-viable. Class 1 refers to feeders with high amounts of
commercial load or overloaded line miles. Class 2 refers to feeders where the voltage class is too
high >25kV or too low <11kV or is network loop fed.
Highlighted key metrics include the following:
Total Feeders Classified 3757 Feeders . . . 100%
Viable VO Feeder Candidates 1920 Feeders . . . 51%
Non-Viable Feeder Candidates 1837 Feeders . . . 49%
Average Feeder BCR 1.05
Commonwealth Edison Company Task 10 – Final Report
Contract No. 01146430 – Task 10 Proprietary 19
Applied Energy Group 1377 Motor Parkway, Suite 401 Islandia, NY 11749 P: 631-434-1414 www.appliedenergygroup.com
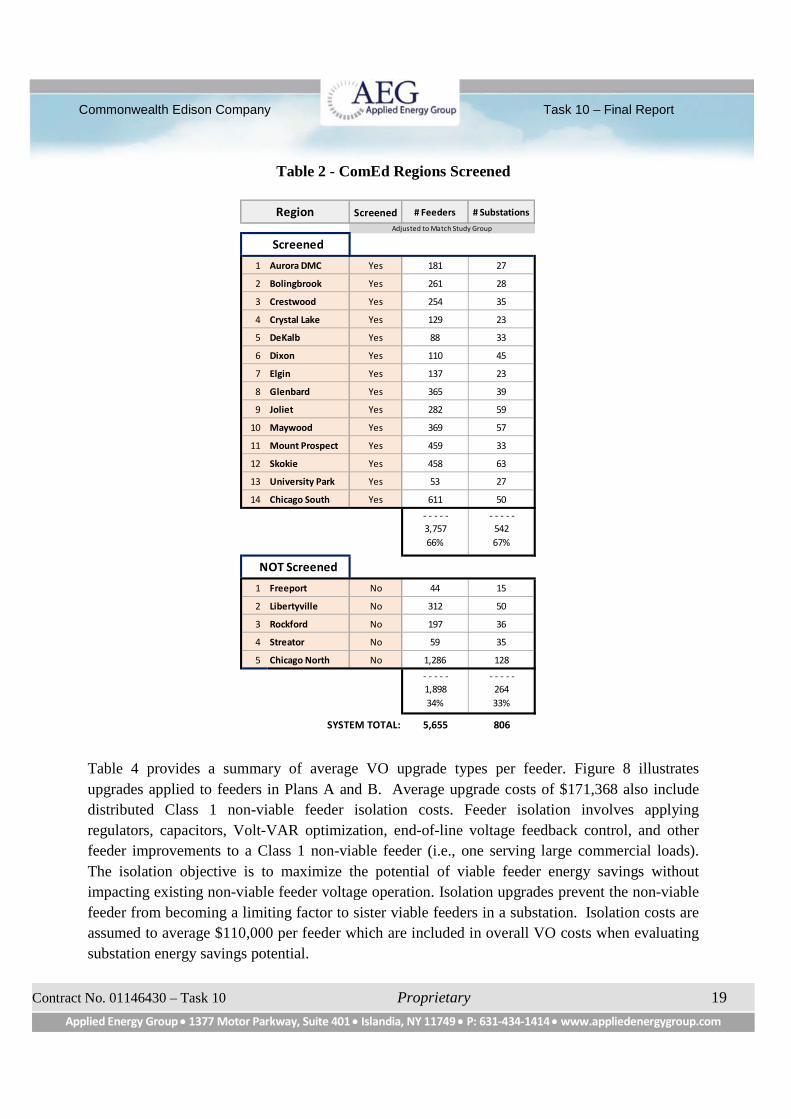
Table 2 - ComEd Regions Screened
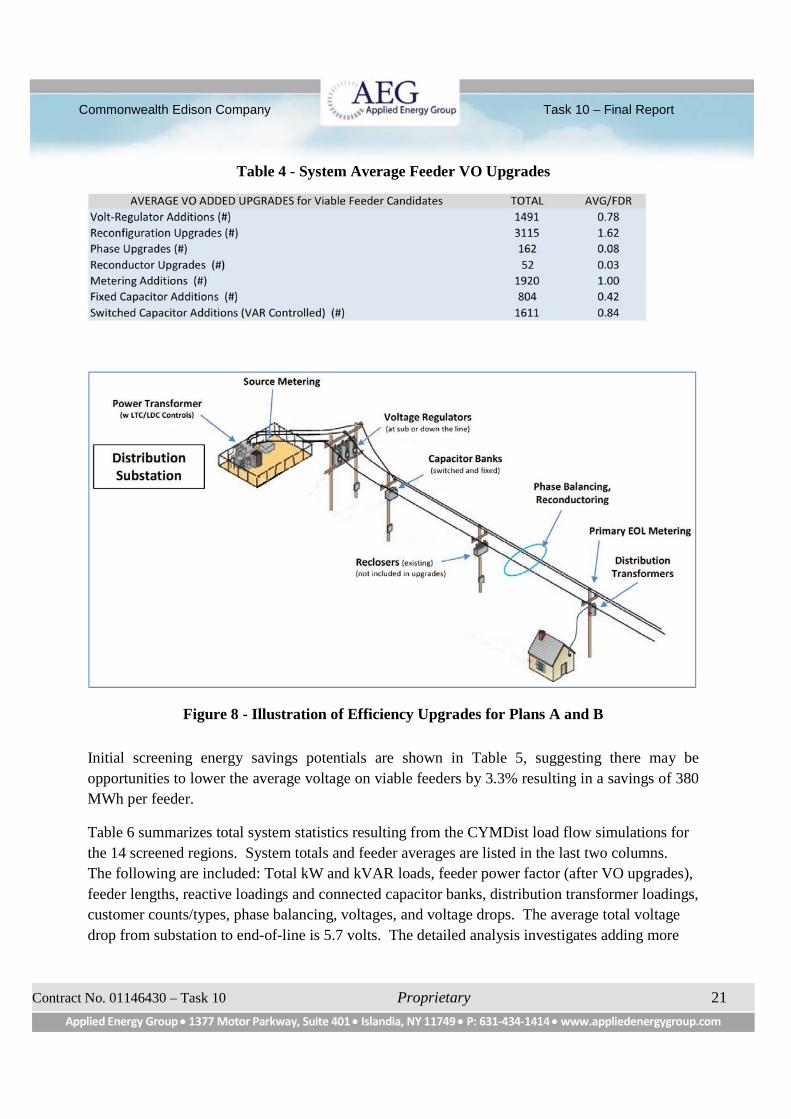
Table 4 provides a summary of average VO upgrade types per feeder. Figure 8 illustrates
upgrades applied to feeders in Plans A and B. Average upgrade costs of $171,368 also include
distributed Class 1 non-viable feeder isolation costs. Feeder isolation involves applying
regulators, capacitors, Volt-VAR optimization, end-of-line voltage feedback control, and other
feeder improvements to a Class 1 non-viable feeder (i.e., one serving large commercial loads).
The isolation objective is to maximize the potential of viable feeder energy savings without
impacting existing non-viable feeder voltage operation. Isolation upgrades prevent the non-viable
feeder from becoming a limiting factor to sister viable feeders in a substation. Isolation costs are
assumed to average $110,000 per feeder which are included in overall VO costs when evaluating
substation energy savings potential.
Screened # Feeders # Substations
1 Aurora DMC Yes 181 27
2 Bolingbrook Yes 261 28
3 Crestwood Yes 254 35
4 Crystal Lake Yes 129 23
5 DeKalb Yes 88 33
6 Dixon Yes 110 45
7 Elgin Yes 137 23
8 Glenbard Yes 365 39
9 Joliet Yes 282 59
10 Maywood Yes 369 57
11 Mount Prospect Yes 459 33
12 Skokie Yes 458 63
13 University Park Yes 53 27
14 Chicago South Yes 611 50
- - - - - - - - - -
3,757 542
66% 67%
1 Freeport No 44 15
2 Libertyville No 312 50
3 Rockford No 197 36
4 Streator No 59 35
5 Chicago North No 1,286 128
- - - - - - - - - -
1,898 264
34% 33%
SYSTEM TOTAL: 5,655 806
Region
Screened
NOT Screened
Adjusted to Match Study Group
Commonwealth Edison Company Task 10 – Final Report
Contract No. 01146430 – Task 10 Proprietary 20
Applied Energy Group 1377 Motor Parkway, Suite 401 Islandia, NY 11749 P: 631-434-1414 www.appliedenergygroup.com
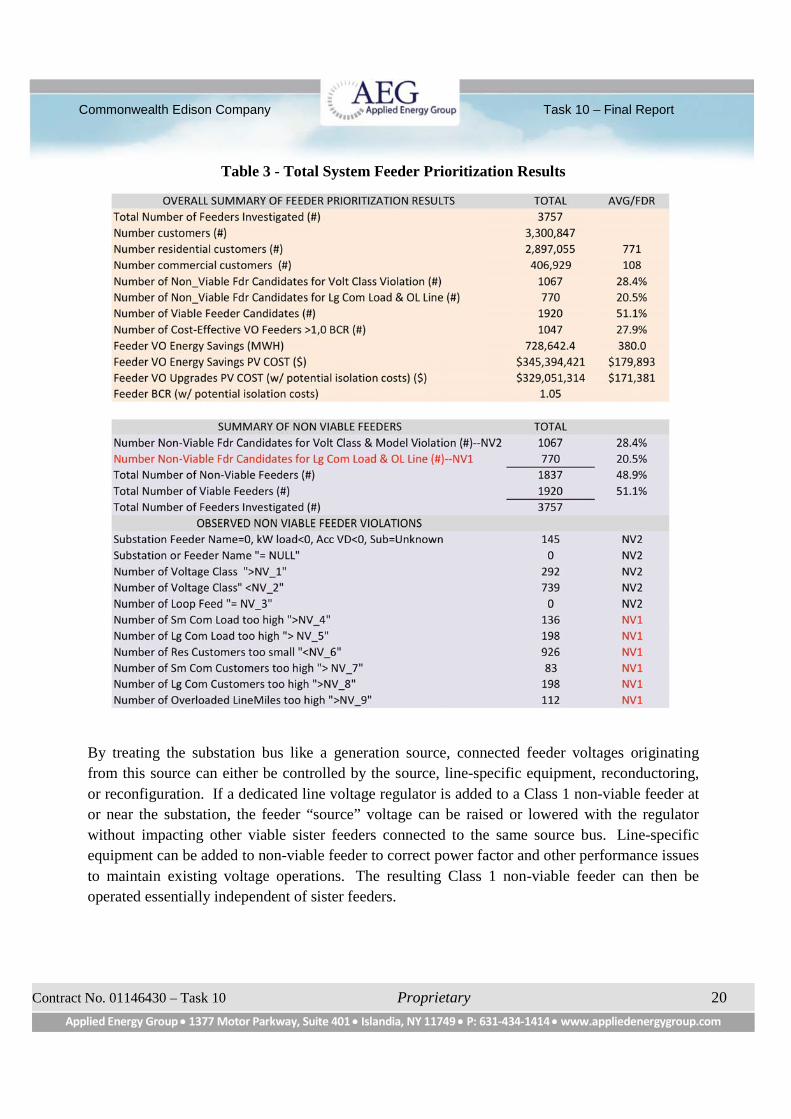
Table 3 - Total System Feeder Prioritization Results
By treating the substation bus like a generation source, connected feeder voltages originating
from this source can either be controlled by the source, line-specific equipment, reconductoring,
or reconfiguration. If a dedicated line voltage regulator is added to a Class 1 non-viable feeder at
or near the substation, the feeder “source” voltage can be raised or lowered with the regulator
without impacting other viable sister feeders connected to the same source bus. Line-specific
equipment can be added to non-viable feeder to correct power factor and other performance issues
to maintain existing voltage operations. The resulting Class 1 non-viable feeder can then be
operated essentially independent of sister feeders.
Commonwealth Edison Company Task 10 – Final Report
Contract No. 01146430 – Task 10 Proprietary 21
Applied Energy Group 1377 Motor Parkway, Suite 401 Islandia, NY 11749 P: 631-434-1414 www.appliedenergygroup.com
Table 4 - System Average Feeder VO Upgrades
Figure 8 - Illustration of Efficiency Upgrades for Plans A and B
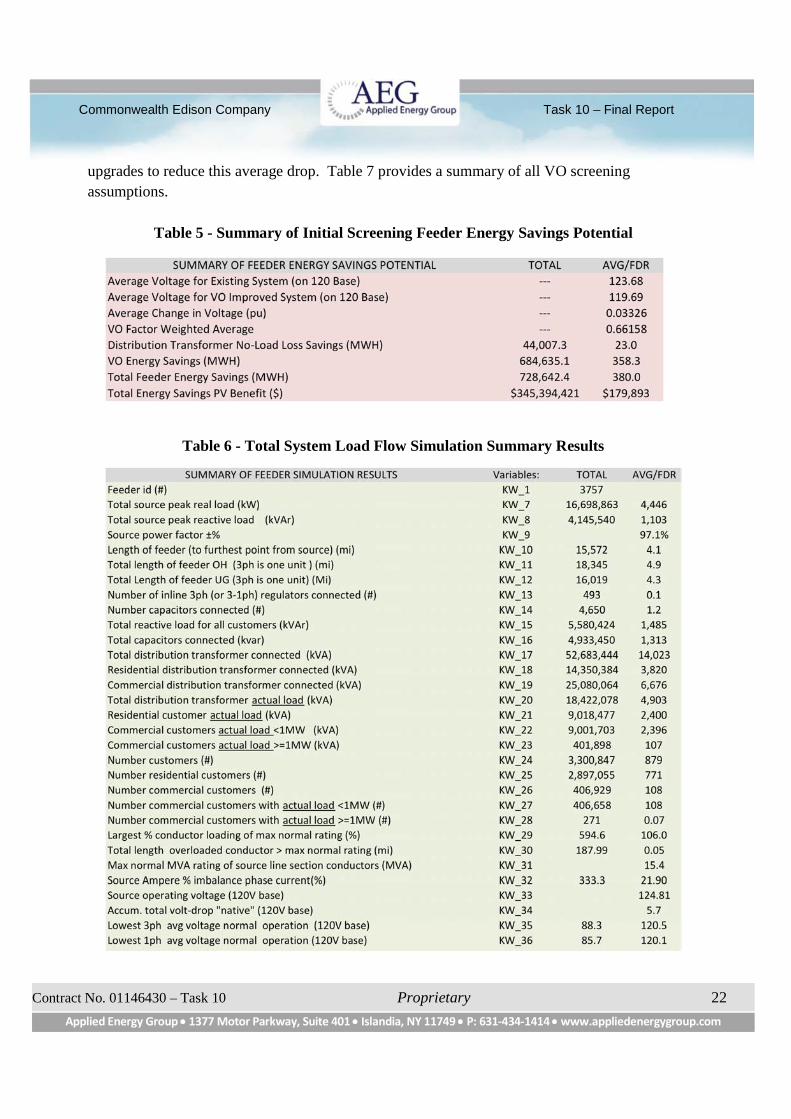
Initial screening energy savings potentials are shown in Table 5, suggesting there may be
opportunities to lower the average voltage on viable feeders by 3.3% resulting in a savings of 380
MWh per feeder.
Table 6 summarizes total system statistics resulting from the CYMDist load flow simulations for
the 14 screened regions. System totals and feeder averages are listed in the last two columns.
The following are included: Total kW and kVAR loads, feeder power factor (after VO upgrades),
feeder lengths, reactive loadings and connected capacitor banks, distribution transformer loadings,
customer counts/types, phase balancing, voltages, and voltage drops. The average total voltage
drop from substation to end-of-line is 5.7 volts. The detailed analysis investigates adding more
Commonwealth Edison Company Task 10 – Final Report
Contract No. 01146430 – Task 10 Proprietary 22
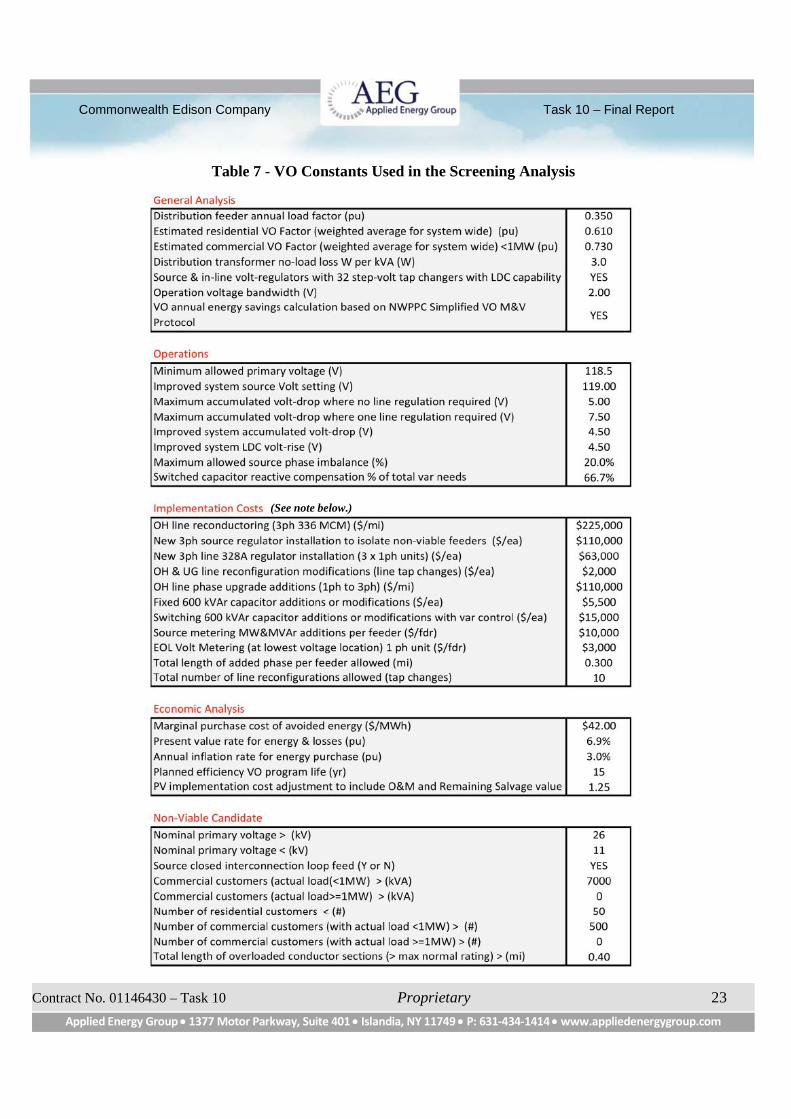
Applied Energy Group 1377 Motor Parkway, Suite 401 Islandia, NY 11749 P: 631-434-1414 www.appliedenergygroup.com
upgrades to reduce this average drop. Table 7 provides a summary of all VO screening
assumptions.
Table 5 - Summary of Initial Screening Feeder Energy Savings Potential
Table 6 - Total System Load Flow Simulation Summary Results
Commonwealth Edison Company Task 10 – Final Report
Contract No. 01146430 – Task 10 Proprietary 23
Applied Energy Group 1377 Motor Parkway, Suite 401 Islandia, NY 11749 P: 631-434-1414 www.appliedenergygroup.com
Table 7 - VO Constants Used in the Screening Analysis
(See note below.)
Commonwealth Edison Company Task 10 – Final Report
Contract No. 01146430 – Task 10 Proprietary 24
Applied Energy Group 1377 Motor Parkway, Suite 401 Islandia, NY 11749 P: 631-434-1414 www.appliedenergygroup.com
Note: Screening and detailed assessments estimated the number of capacitors
needed based on the assumption all feeders would be VAR compensated.
Recommended capacitors per feeder are 600/kVAR units with switched capacitors
being 66% (two-thirds) of the total. Capacitor placement was assumed to be
optimal as described in Section 5 of this report. Capacitor costs were assumed to
be overhead in all cases.
4.2 Sample Selection
The VO Feasibility Study research plan employs two types of VO estimation procedures: a) A
simplified engineering analysis to estimate costs and energy savings potential for all non-screened
“viable” feeders in participating regions of the ComEd service territory (n=1920); and b) detailed
load flow simulations of feeder-specific VO implementation schemes on a representative sample
of feeders. A key goal is the use of statistical sampling methods to extrapolate enhanced precision
gained from the detailed analysis preformed on the sample of feeders to the more generalized cost
and savings estimates derived for the general population of viable feeders.
4.2.1 Feeder Population Study Group
The feeder population study group represents the population of feeders in the ComEd service
territory for which VO is feasible. The study group (sample frame) is a subset of all ComEd
feeders and is defined as follows:
Total System Population: 5655
Less Non-Included Regions (1898)
Less Non-Viable Feeders (1837)
Total Viable Feeder Population Study Group: 1920
4.2.2 Substations and Feeders
It is typical for multiple feeders to be connected to and fed by the same substation transformer.
As such, individual feeders are affected by “sister” feeders on the same transformer. From a
modeling perspective, this means that feeders on the same substation transformers must be
modeled as a group. As a result, substations, not feeders, are the primary sampling unit for the
study. Individual feeder data are aggregated at the substation level to develop substation VO cost
and ESP metrics as explained in Section 4. Statistically, this is referred to as cluster sampling –
the substations each are a collection or “cluster” of feeders from the population, and it is not
feasible to select individual feeders for the detailed analysis without including all feeders on the
same substation bus.
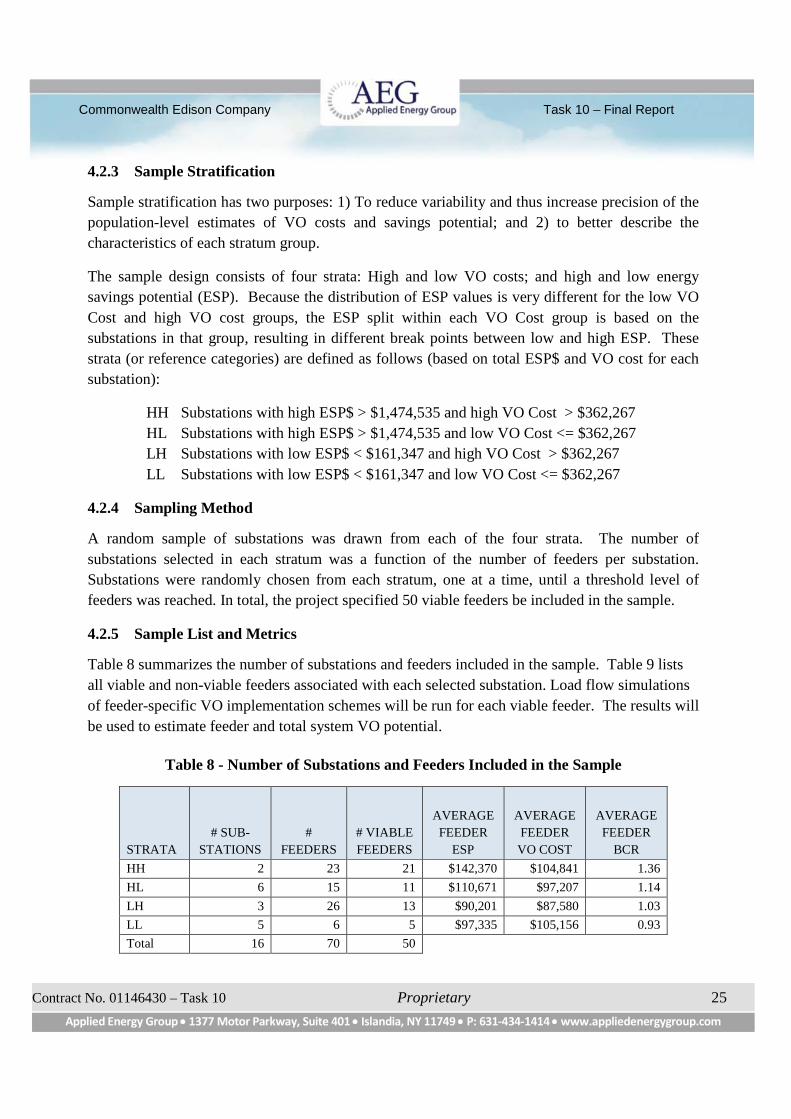
Commonwealth Edison Company Task 10 – Final Report
Contract No. 01146430 – Task 10 Proprietary 25
Applied Energy Group 1377 Motor Parkway, Suite 401 Islandia, NY 11749 P: 631-434-1414 www.appliedenergygroup.com
4.2.3 Sample Stratification
Sample stratification has two purposes: 1) To reduce variability and thus increase precision of the
population-level estimates of VO costs and savings potential; and 2) to better describe the
characteristics of each stratum group.
The sample design consists of four strata: High and low VO costs; and high and low energy
savings potential (ESP). Because the distribution of ESP values is very different for the low VO
Cost and high VO cost groups, the ESP split within each VO Cost group is based on the
substations in that group, resulting in different break points between low and high ESP. These
strata (or reference categories) are defined as follows (based on total ESP$ and VO cost for each
substation):
HH Substations with high ESP$ > $1,474,535 and high VO Cost > $362,267
HL Substations with high ESP$ > $1,474,535 and low VO Cost <= $362,267
LH Substations with low ESP$ < $161,347 and high VO Cost > $362,267
LL Substations with low ESP$ < $161,347 and low VO Cost <= $362,267
4.2.4 Sampling Method
A random sample of substations was drawn from each of the four strata. The number of
substations selected in each stratum was a function of the number of feeders per substation.
Substations were randomly chosen from each stratum, one at a time, until a threshold level of
feeders was reached. In total, the project specified 50 viable feeders be included in the sample.
4.2.5 Sample List and Metrics
Table 8 summarizes the number of substations and feeders included in the sample. Table 9 lists
all viable and non-viable feeders associated with each selected substation. Load flow simulations
of feeder-specific VO implementation schemes will be run for each viable feeder. The results will
be used to estimate feeder and total system VO potential.
Table 8 - Number of Substations and Feeders Included in the Sample
STRATA
# SUB-
STATIONS
#
FEEDERS
# VIABLE
FEEDERS
AVERAGE
FEEDER
ESP
AVERAGE
FEEDER
VO COST
AVERAGE
FEEDER
BCR
HH 2 23 21 $142,370 $104,841 1.36
HL 6 15 11 $110,671 $97,207 1.14
LH 3 26 13 $90,201 $87,580 1.03
LL 5 6 5 $97,335 $105,156 0.93
Total 16 70 50
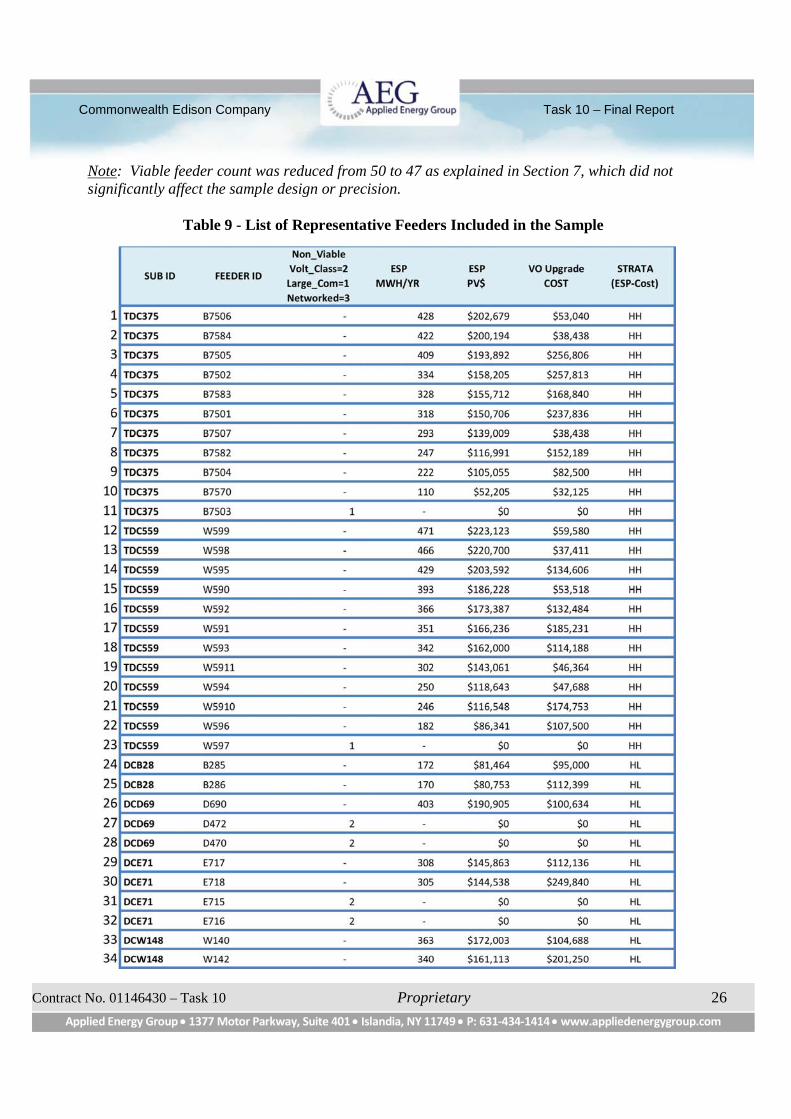
Commonwealth Edison Company Task 10 – Final Report
Contract No. 01146430 – Task 10 Proprietary 26
Applied Energy Group 1377 Motor Parkway, Suite 401 Islandia, NY 11749 P: 631-434-1414 www.appliedenergygroup.com
Note: Viable feeder count was reduced from 50 to 47 as explained in Section 7, which did notsignificantly affect the sample design or precision.
Table 9 - List of Representative Feeders Included in the Sample
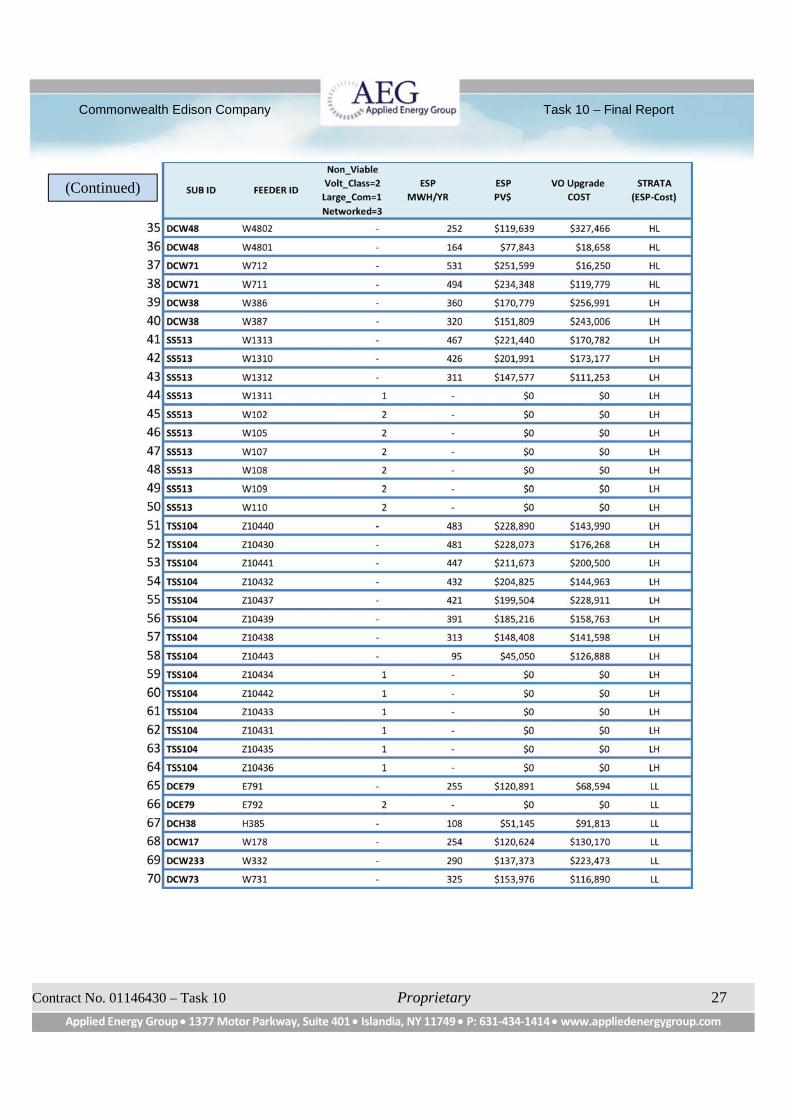
Commonwealth Edison Company Task 10 – Final Report
Contract No. 01146430 – Task 10 Proprietary 27
Applied Energy Group 1377 Motor Parkway, Suite 401 Islandia, NY 11749 P: 631-434-1414 www.appliedenergygroup.com
(Continued)
Commonwealth Edison Company Task 10 – Final Report
Contract No. 01146430 – Task 10 Proprietary 28
Applied Energy Group 1377 Motor Parkway, Suite 401 Islandia, NY 11749 P: 631-434-1414 www.appliedenergygroup.com
5. Scenario Plan Case Development
5.1 Scenario Plan Development Objectives
Case scenarios, or plans, are needed for the “what-if” analysis of Task 6, where each case will be
used to quantify potential energy savings and costs. A systematic approach will then be used to
add/modify feeder equipment, and/or change system configurations/operations to define cost-
effective plans that meet performance and economic constraints. The following plans will be
developed:
Base Case: Meets prerequisite performance thresholds by applying minimal system
improvements to the Existing Case (as-is system conditions). Adjustments may have to be
made to improve low voltage operations.
Plan A: Minimal VO implementation costs; meets or exceeds VO performance efficiency
threshold constraints; BCR2 > 1. Plan A is the lowest cost plan that meets VO thresholds
and is cost effective.
Plan B: Maximum VO potential energy saved; meets or exceeds VO performance
efficiency threshold constraints; BCR >1. Plan B is the highest energy saving scenario that
meets VO thresholds and is cost effective.
Development begins by ensuring all performance thresholds are met. “What-if” scenarios are then
designed to:
Minimize primary voltage drops
Reduce line and no-load losses
Lower regulator/LTC voltage set points
Consider alternative VO technologies
With reduced regulator/LTC set points, annual feeder average voltages will be lower, resulting in
potential energy savings. Upgrades are added incrementally (in order of priority), with energy
saving and cost impacts documented for each iteration.
2BCR = Benefit Cost Ratio
Commonwealth Edison Company Task 10 – Final Report
Contract No. 01146430 – Task 10 Proprietary 29
Applied Energy Group 1377 Motor Parkway, Suite 401 Islandia, NY 11749 P: 631-434-1414 www.appliedenergygroup.com
5.2 Performance Efficiency Thresholds
Performance efficiency thresholds establish conditions around which all cases can be developed.
Thresholds were developed for ComEd-specific feeders based on NWPCC’s Simplified VO
M&V Protocol3, establishing a foundation against which energy savings can be measured and
verified.
Distribution feeder systems are considered inefficient if they have high hourly VAR flows; high
voltage drops during peak load conditions; high amp-phase imbalances; high neutral currents; and
voltages that violate ANSI C84.1 voltage standard ranges. Thresholds cannot always be met
because of specific feeder characteristics. However, reasonable efforts can be made to closely
satisfy the constraints.
Thresholds for this study include the following:
Maximum hourly VAR flow of ±300 kVAR or hourly power factor > 97%
VCZ4 maximum primary voltage drop < 4.8 Volts (on 120 Volt base)
Maximum phase imbalance < 25%
Maximum neutral current < 50 Amperes
Minimum EOL5 voltage > 118.6 Volts (on 120 Volt base)
Primary line conductor loading < 80% of maximum normal rating
Primary line and distribution transformer no-load energy loss < 2%
5.3 Upgrade Priority
Successful VO implementations consistently report the order of upgrades is important when
trying to optimize energy savings at the lowest cost. For example, low-cost improvements (such
as load balancing) can greatly impact voltage drops, and should be done before considering
higher-cost improvements (such as reconductoring). In a similar manner, adding or modifying
capacitors to achieve near-zero VAR flow, reduces voltage drops all year and should be
considered prior to higher-cost alternatives (such as voltage regulators).
Voltage-control threshold settings should be applied last, typically reducing source voltages from
125 volts to lower set points such as 119 volts using compensated R-settings. For properly VAR-
controlled feeders, X-compensation may not be required.
Source metering (hourly MW and MVAR) and primary EOL metering (voltage) are needed on all
3Simplified Voltage Optimization (VO) M&V Protocol, NWPPC-RTF, Portland, OR May 4, 2010.
4VCZ = Voltage Control Zone
5EOL = End of Line
Commonwealth Edison Company Task 10 – Final Report
Contract No. 01146430 – Task 10 Proprietary 30
Applied Energy Group 1377 Motor Parkway, Suite 401 Islandia, NY 11749 P: 631-434-1414 www.appliedenergygroup.com
feeders to assess ongoing performance against thresholds. Metering can be accomplished with
relays, regulator controls, or standalone meter sets.
Typical feeder improvements include the following 12 measures, listed in order of priority, from
lowest cost (higher BCR6) to highest cost (lower BCR):
1. Improve substation and feeder metering – Identify substation metering improvements for
power transformers and feeders (EOL voltages, and the load-side of line voltage regulators).
Substation data collected includes hourly 3ph kWs and kVARs, and single-phase amps at
substation voltage regulators. EOL (lowest voltage location) metering data includes hourly
voltage data.
2. Reconfigure (by switching) – Reconfigure feeder by switching line sections from one feeder to
another (to offload feeder) by opening and closing tie locations, and to offload adjacent line
sections on the same feeder. This reduces line losses and primary voltage drops.
3. Reconfigure (by tap changes) – Reconfigure feeder sections (or transformer connections) from
one phase to another to balance phase amps by relocating phase tap connections. This reduces
line losses and primary voltage drops.
4. Add or modify capacitors – Add or modify fixed/switched capacitor banks to achieve optimal
hourly VAR compensation (throughout the year). Switched capacitors minimize line VAR
flow, reduce line losses, and reduce primary voltage drops. To determine the total amount of
capacitors (fixed and switched), evaluate feeder annual VAR profiles.
5. Add phase upgrades – Add overhead and underground phase upgrades (1ph-to-2ph, 1ph-to-
3ph, 2ph-to-3ph) to rebalance load and reduce voltage drops. This reduces line losses and
primary voltage drops.
6. Add line voltage regulators – Add in-line voltage regulators to reduce primary voltage drops.
Each regulator becomes a new VCZ for all feeder loads served downstream by the regulator.
7. Reconductor line sections - Replace heavily loaded conductors (above > 80% of normal
maximum ratings) with larger capacity conductors. This reduces line losses and primary
voltage drops.
8. Replace distribution transformer/secondary systems – Identify secondary systems where
voltage drops exceed design targets and service voltages are less than 114V at peak. If low
voltages occur before any improvements are made, the cost of the modifications should not be
included in the total VO cost. However, if low voltages are due to reduced voltages from the
6BCR = Benefit Cost Ratio
Commonwealth Edison Company Task 10 – Final Report
Contract No. 01146430 – Task 10 Proprietary 31
Applied Energy Group 1377 Motor Parkway, Suite 401 Islandia, NY 11749 P: 631-434-1414 www.appliedenergygroup.com
VO alternative case, the cost should be included in the total VO cost. This enables lower
voltage set points and reduces overall average system voltages. Typically, few transformer
replacements will be necessary.
9. Add new parallel feeders – This reduces conductor loadings, system losses, and primary
voltage drops.
10. Install EOL feedback voltage sensing and control – Substation load tap changers (LTCs),
substation voltage regulators, and in-line voltage-regulator controls can be integrated with
EOL voltage sensing to control feeder voltages. For VO efficiency measures, these voltage
feedback systems should only be applied after feeders are compliant with VO performance
thresholds. These real-time systems can provide operational intelligence for system dispatch
and can be used where there is a large variation and/or fluctuation in load distribution and/or
distributed generation. EOL voltage feedback sensing is used with line-drop-compensation
(LDC) controls to provide added operational security. They can be best applied as feeder
backup or “emergency” voltage control to avoid voltage violations. SCADA can be interfaced
and integrated with these systems to provide capability for demand response and substation
automation strategies. EOL feedback voltage control systems can help reduce overall average
feeder voltages similar to non-feedback LDC systems.
11. Install Integrated Volt-Var Control (IVVC) – Volt-VAR applications attempt to control line
voltages with capacitors and voltage-regulators. EOL voltage sensing is installed. For VO
efficiency measures, these voltage feedback systems should only be applied after feeders are
compliant with VO performance thresholds. IVVC systems integrate distribution model and
load flow estimating algorithms to predict feeder voltages, amps, VARs, and loss
performance. With some systems, the voltage can be controlled to the lowest level without
violating power factor or EOL voltage constraints. Real-time systems work best when
providing operational intelligence for system dispatch, and can be used where there are large
fluctuations in load and distributed generation. They can be applied as feeder backup or
“emergency” voltage control.
IVVC control systems can reduce overall average voltages similar to what is possible with
non-feedback LDC systems. However, for the typical application of residential and light
commercial loads, in-line voltage-regulator LDC controls are more cost-effective for lowering
average annual voltages. IVVC has distribution automation operational benefits other than
VO that can necessitate/justify their use.
12. Upgrade feeder to higher primary voltage class – Feeders with a voltage class of less than
12kV are more likely to have higher system losses, higher conductor loadings, and higher
voltage drops. Upgrading to a higher voltage class reduces line losses, conductor loadings,
and primary voltage drops.

Commonwealth Edison Company Task 10 – Final Report
Contract No. 01146430 – Task 10 Proprietary 32
Applied Energy Group 1377 Motor Parkway, Suite 401 Islandia, NY 11749 P: 631-434-1414 www.appliedenergygroup.com
5.4 Plan Development Process
The as-is distribution system Existing Case is analyzed to determine load (annual MWh and peak
kW) and no-load losses, and for compliance against performance thresholds. Minimal
improvements are identified; i.e., minimum hourly VAR flow, maximum voltage drop, maximum
phase imbalance, minimum EOL voltage, and no overloaded conductors. The upgraded system
uses the same or similar voltage-control settings as the existing system. Adjustments may be
needed to avoid low voltage operations. The upgraded system then becomes the VO Base Case
from which all other alternative plans are measured. The Existing Case development process is
shown in Figure 9.
Once the Base Case is established, Plan A and Plan B can be developed and measured against the
following measures:
VO performance threshold compliance.
Change in system losses from Existing Case.
Change in weighted annual average voltage from Base Case.
Potential energy savings from Base Case.
Present value cost of energy saved.
Present value cost of upgrades, including threshold compliance upgrades.
Resulting BCR.
Analyses of representative feeders are performed on a substation basis. All feeders served from
the same voltage control bus (i.e., LTC or station voltage regulator) are considered to be in the
same VCZ. Scenarios involving changes to VCZ regulator voltage set points impact all feeders
served by that VCZ.
Plan A includes minimal investments to meet performance and BCR thresholds.
Plan B includes more investments to maximize energy savings while still meeting performance
and BCR thresholds.
For each plan, energy savings and costs will be grouped by substation power transformer with all
other feeders connected to the same VCZ. Once all substation assessments are complete, Plan A
and Plan B results will be extrapolated to system totals.
This development process typically requires more engineering than traditional studies (which
focus on maintaining reliability, avoiding equipment overloads, and preventing customer low
voltages). As a guide, ten (10) assessment steps are performed sequentially (with some iterations
required) until all thresholds and economic constraints are met, and optimal solutions found. The
analysis process is shown in Figure 10.
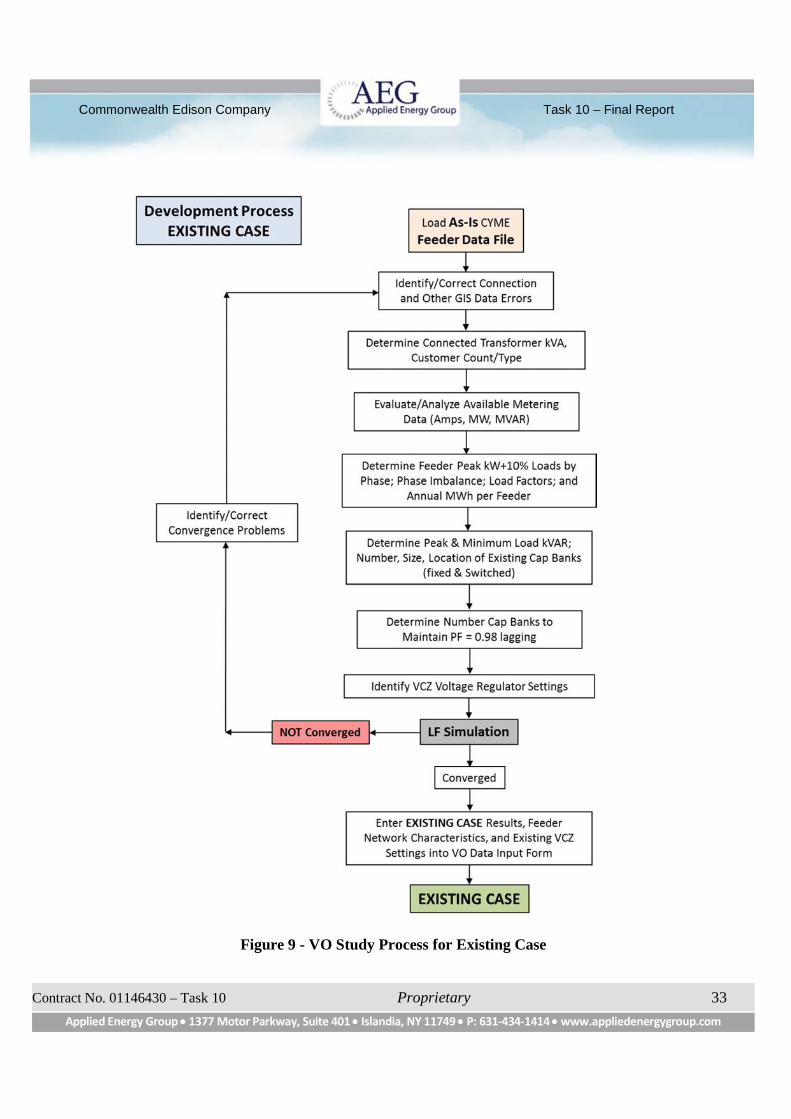
Commonwealth Edison Company Task 10 – Final Report
Contract No. 01146430 – Task 10 Proprietary 33
Applied Energy Group 1377 Motor Parkway, Suite 401 Islandia, NY 11749 P: 631-434-1414 www.appliedenergygroup.com
Figure 9 - VO Study Process for Existing Case
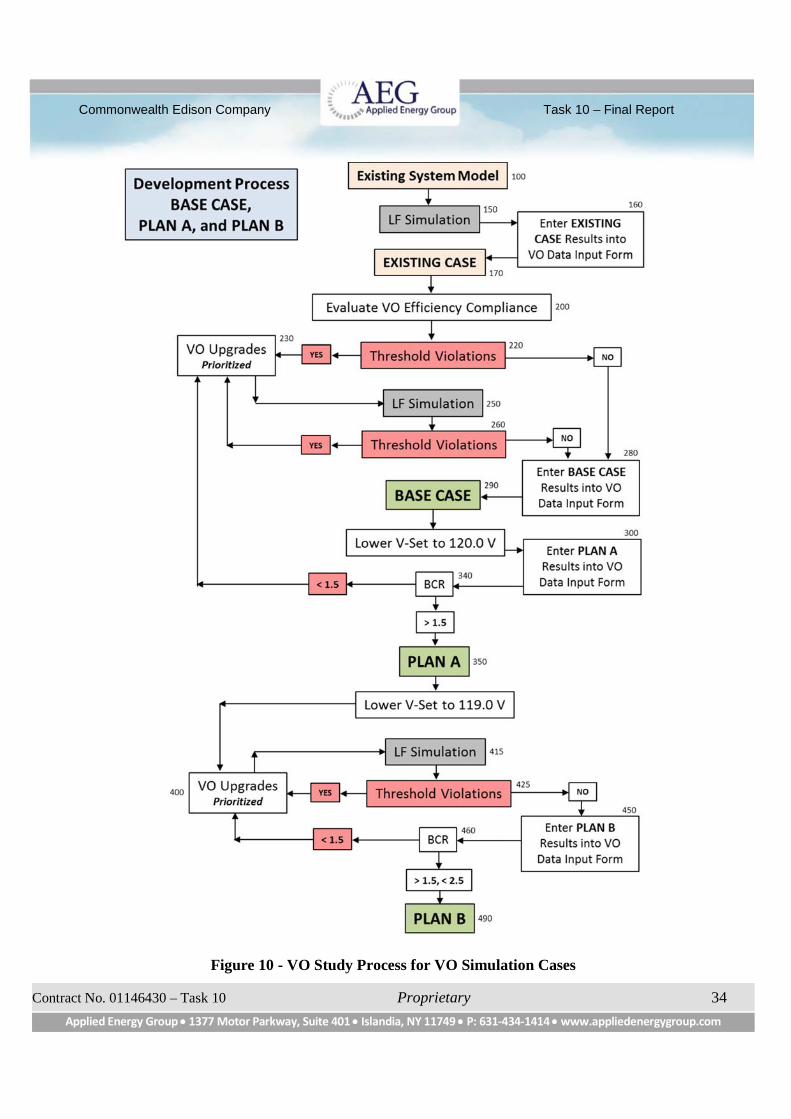
Commonwealth Edison Company Task 10 – Final Report
Contract No. 01146430 – Task 10 Proprietary 34
Applied Energy Group 1377 Motor Parkway, Suite 401 Islandia, NY 11749 P: 631-434-1414 www.appliedenergygroup.com
Figure 10 - VO Study Process for VO Simulation Cases
Commonwealth Edison Company Task 10 – Final Report
Contract No. 01146430 – Task 10 Proprietary 35
Applied Energy Group 1377 Motor Parkway, Suite 401 Islandia, NY 11749 P: 631-434-1414 www.appliedenergygroup.com
The ten steps follow:
1. Gather the following system information for each substation to be addressed:
a. Substation transformer and feeder MW/MVAR hourly meter data.
b. Substation transformer and feeder total annual load MWh.
c. Feeder phase amp peak or hourly meter data.
d. Substation one-line with transformer, regulators, breakers, and switches.
e. Substation transformer nameplate MVA ratings.
f. LDC control vendor, model, PT ratio, CT rating, V-Set, R&X, BW, & TD.
g. Feeder capacitor bank control settings (volt, VAR, amp, time) and TD.
h. Location of large customers (>1000 kW demand).
i. Annual load factors for Winter and Summer peak conditions.
j. MW and MVAR for Winter and Summer peak conditions.
k. VAR management control strategies for existing system.
l. Customer load characteristics for residential and commercial.
m. VO factor (annual energy) estimates for typical residential and commercial customers.
n. Utility construction and voltage drop standards.
o. Economic analysis and DSMore assumptions.
p. Energy and demand efficiency targets.
q. Marginal cost of energy and demand.
r. Existing voltage operational constraints.
s. VO improvement unit costs.
t. System topology mapping.
u. Solved feeder CYMDist load models.
2. Prepare an Existing Case feeder model using CYMDist three-phase unbalanced load flow.
All feeders common to the same VCZ should be analyzed together. Determine peak kW line
losses for all feeders within the same VCZ for annual peak load conditions. Identify the
amount of actual kVA for residential and commercial loads used to determine feeder VO
factors.
3. Assess the Existing Case for compliance against performance thresholds for all feeders.
Include voltage drop, phase amp balance, neutral current, minimum primary voltage, and
minimum and average power factors (or VAR flows).
4. Create a VO Base Case by adding minimal system improvements to the Existing Case to meet
performance thresholds. Feeders common to the same VCZ should be analyzed together. The
Base Case uses the same or similar voltage control settings as the Existing Case. Adjustments
may have to be made to improve low voltage operations.
Commonwealth Edison Company Task 10 – Final Report
Contract No. 01146430 – Task 10 Proprietary 36
Applied Energy Group 1377 Motor Parkway, Suite 401 Islandia, NY 11749 P: 631-434-1414 www.appliedenergygroup.com
The minimum allowed EOL voltage is 118.6V. Improvements typically include the following:
a. Reconfigure the feeder by switching load to adjacent feeders.
b. Reconfigure phases and connected transformers to balance load.
c. Add or modify capacitors (fixed and switched) to improve VAR management.
Determine the amount of fixed and switched capacitors needed and approximate
locations based on annual VAR profiles.
The goal is to achieve near unity power factor for every hour of the year. Capacitor
modeling is not necessary in CYMDist. Instead, 98% power factor is assumed for the
load flow simulations.
d. Add minimal phase upgrades to improve EOL voltages.
e. Add line reconductoring to resolve line overloads.
f. Add necessary feeder metering upgrades.
g. Add necessary source and in-line voltage regulator LDC controls.
5. Determine and document the following using the “VO Data Input Form” application (Excel-
based) for the Base Case:
a. Threshold compatibility.
b. Calculate net change in peak line kW losses and annual MWh losses between the Existing
Case and Base Case (by running a Base Case load flow simulation).
c. Determine VO upgrade investment costs for the Base Case.
d. Determine VCZ max voltage settings (same as Existing Case).
e. Determine VCZ max Volt-Drop and Volt-Rise (from Base Case load flow simulation).
f. Calculate weighted annual average feeder voltages using VO M&V Protocol procedures.
6. Create a Plan A assuming the same performance thresholds as for the Base Case. Plan A
represents the lowest-cost plan meeting efficiency performance and cost thresholds with
BCRs greater than or equal to 1.0. Plan A has the same upgrades as the Base Case.
VCZ voltage settings will be based on the feeder having the highest voltage drops during
annual peak load conditions. VCZ Volt-Set points are at 120.0V with Volt-Drops the same as
in the Base Case (VCZ Volt-Rise equals the Volt-Drop).
Since the creation of Plan A is the same as for the Base Case, VO improvements are added to
limit the maximum voltage drop for each VCZ to less than 4.0V, with the VCZ source-voltage
control being the same as the Existing Case. For Plan A, LDC controls are applied to the
source voltage using a setting of 120V.
Determine and document the following using the “VO Data Input Form” application (Excel-
based) for Plan A:
a. Document the maximum voltage drop for each VCZ.
Commonwealth Edison Company Task 10 – Final Report
Contract No. 01146430 – Task 10 Proprietary 37
Applied Energy Group 1377 Motor Parkway, Suite 401 Islandia, NY 11749 P: 631-434-1414 www.appliedenergygroup.com
b. Determine LDC control settings assuming 120.0V with R settings that result in the
maximum Volt-Rise being equal to the maximum Volt-Drop.
c. Verify threshold compatibilities (should be no change from Base Case).
d. Identify and calculate net changes in line losses (same as Base Case).
e. Identify VO upgrade investment costs (same as Base Case).
f. Determine the weighted average substation area VO factor (pu).
g. Calculate weighted annual average voltage assessments for Plan A feeders using VO
M&V Protocol procedures.
h. Calculate the change in average annual volts.
i. Calculate the change in feeder transformer no-load losses based on 3W per kVA and
square-of-voltage change.
j. Calculate total energy saved between the Base Case and Plan A.
k. Calculated the PV cost of energy saved.
l. Calculate the PV cost of upgrades, including VO threshold compliance upgrades.
m. Calculate Plan A’s overall BCR.
7. Proceed to Step 8 below if Plan A economic analysis results in a BCR that is greater than 1.5.
Otherwise, revise/reduce Base Case upgrades and repeat Steps 4, 5, and 6 until the BCR is
greater than or equal to 1.5.
8. Create a Plan B by adding more system improvements to increase energy savings. Plan B
represents the highest energy savings potential plan. Additional higher-cost VO
improvements will be made such as in-line voltage regulators, more phase upgrades, more
reconductoring, and improved voltage control options (lower voltage settings, EOL line
voltage feedback, IVVC controls, etc.).
VCZ voltage settings will be based on the feeder having the highest voltage drop during
annual peak loading conditions. VCZ Volt-Set points are reduced to 119.0V with the Volt-
Drop same as the Base Case (VCZ Volt-Rise equals the Volt-Drop).
Determine and document the following using the “VO Data Input Form” application (Excel-
based) for Plan B:
a. Document the maximum voltage drop for each VCZ.
b. Determine LDC control settings assuming 119.0V with R settings that result in the
maximum Volt-Rise being equal to the maximum Volt-Drop.
c. Verify threshold compatibilities (should be no change from Base Case).
d. Calculate net change in line losses (same as Base Case).
e. Identify VO upgrades investment costs (same as Base Case).
f. Determine the weighted average substation area VO factor (per unit).
g. Calculate weighted annual average voltage assessments for Plan B feeders using VO
Commonwealth Edison Company Task 10 – Final Report
Contract No. 01146430 – Task 10 Proprietary 38
Applied Energy Group 1377 Motor Parkway, Suite 401 Islandia, NY 11749 P: 631-434-1414 www.appliedenergygroup.com
M&V Protocol procedures.
h. Calculate the change in average annual volts.
i. Calculate the change in feeder transformer no-load losses based on 3W per kVA and
square-of-voltage change.
j. Calculate the total VO energy saved between the Base Case and Plan B.
k. Calculate the PV cost of energy saved.
l. Calculate the PV cost of VO upgrades, including VO threshold compliance upgrades.
m. Calculate Plan B overall BCR.
9. If Plan B results in a BCR less than 1.5, revise/reduce costs and/or reduce average voltage
and repeat Step 8 until the BCR is greater than or equal to 1.0. If Plan B BCR is greater than
2.5, revise/increase upgrades and lower average voltages even more. Repeat Step 8 until the
BCR is greater than or equal to 1.5 and less than 2.5.
10. Document results for each substation and feeder after Plan A (minimal investment) and Plan
B (optimal investment) are determined. Include the following: Energy savings potential; total
present value costs of investment and energy savings; average voltage change; change in
system losses; and change in demand. Map savings to system load profiles for winter and
summer periods to determine hourly demand impacts.
Commonwealth Edison Company Task 10 – Final Report
Contract No. 01146430 – Task 10 Proprietary 39
Applied Energy Group 1377 Motor Parkway, Suite 401 Islandia, NY 11749 P: 631-434-1414 www.appliedenergygroup.com
6. Detailed VO Analysis of Representative Feeders
6.1 Objectives
Satisfying minimum distribution feeder performance criteria is an important pre-requisite to
applying voltage reduction measures.
The process begins by assessing the existing system for VO efficiency threshold compliance.
Improvements are implemented sequentially (with some iteration) until all thresholds and
economic criterion are met. The analysis methods were based on the concept of average system
voltages as defined and developed by the NWPCC Regional Technical Form Committee May
2010 [14]. Total energy savings consist of two components: 1) End-use efficiencies on customer
side of the service meter (energy savings); and 2) System loss reductions on ComEd’s side of the
meter (system loss savings).
Two alternative VO plans were developed (Plan A and Plan B) with potential energy savings,
upgrade costs, and demand reductions identified for each.
Plan A represents the minimum cost to comply with VO efficiency performance thresholds and
achieve BCRs >1.5. Results indicate energy savings can be as much as 60% of the total potential.
Plan A voltage margins are higher than Plan B.
Plan B represents the maximum potential energy saved while meeting VO thresholds and
achieving BCRs between 1.5 and 2.5 (1.5 < BCR < 2.5). The optimum solution is not always
possible or practical due to the system configuration constraints, marginal changes to energy
saved, and high costs. Plan B voltage margins are lower than Plan A.
6.2 Load Flow Simulations
The CYME electric distribution load flow program7 was used to analyze the distribution feeders.
Existing as-is feeder models were corrected with the aid of ComEd personnel to satisfy minimum
performance thresholds.
CYMDist models single-phase or three-phase radial or looped systems for the following
conditions:
Load balancing
Load allocation and load estimation
Optimal capacitor sizing and placement
Optimal voltage regulator placement
7The program used was CYME Power Engineering Software., part of Cooper Power Systems, Division of Eaton,
Commonwealth Edison Company Task 10 – Final Report
Contract No. 01146430 – Task 10 Proprietary 40
Applied Energy Group 1377 Motor Parkway, Suite 401 Islandia, NY 11749 P: 631-434-1414 www.appliedenergygroup.com
Cable ampacity
Real time analysis
Integrated Volt-VAR modeling and control
It was assumed ComEd models were reasonably up to date and accurately reflects real world
conditions. Simulations where performed for the as-is system (Existing Case), an improved
Existing Case to meet VO thresholds (Base Case), and an expanded VO upgrade case (Plan B).
Plan A has same system configuration as the Base Case except for lower voltage set points and
LDC applications.
Most feeder source voltages are fixed at 124.8 Volt (104% of nominal 120 Volts). Some are 124.5
Volts. Load simulations were performed using peak kW load data obtained from forecast
information or the CYMDist database model plus 10% at 98% power factor lagging. All feeder-
connected capacitors were disconnected. In-line volt-regulators were set at 124.8 Volt with
bandwidths at 0.8 Volts. Substation modeling was not performed. It was assumed all necessary
feeder capacitor banks were modified and/or relocated to achieve a near zero VAR flow of ± 300
kVAR for all hours. Capacitor improvement costs are included in Base Case upgrade costs.
As data is available with feeder phase amps, MW and MVAr phase demands, and/or MW and
MVAr hourly load profiles. The peak load and phase contributions were assigned to each feeder.
6.3 Conductor Types and Loading Guidelines
Feeders with voltage classes of 12.47 kV and 13.2 kV were investigated. ComEd loading
guidelines for primary overhead conductors and underground cables were used to evaluate
conductor and cable performance. Feeder conductor and cable capacity ratings were incorporated
in the CYMDist models.
Conductors commonly used for new overhead primary line construction are shown in Table 10.
Conductor capacity ratings for normal (N) and emergency (E) conditions are given. Other
conductors used are listed in ComEd Standard ESP_5.3.7.1.
Applications are provided to assist in the selection of underground cables in ComEd Standards
ESP_5.3.8.2 and ESP_5.3.8.4.
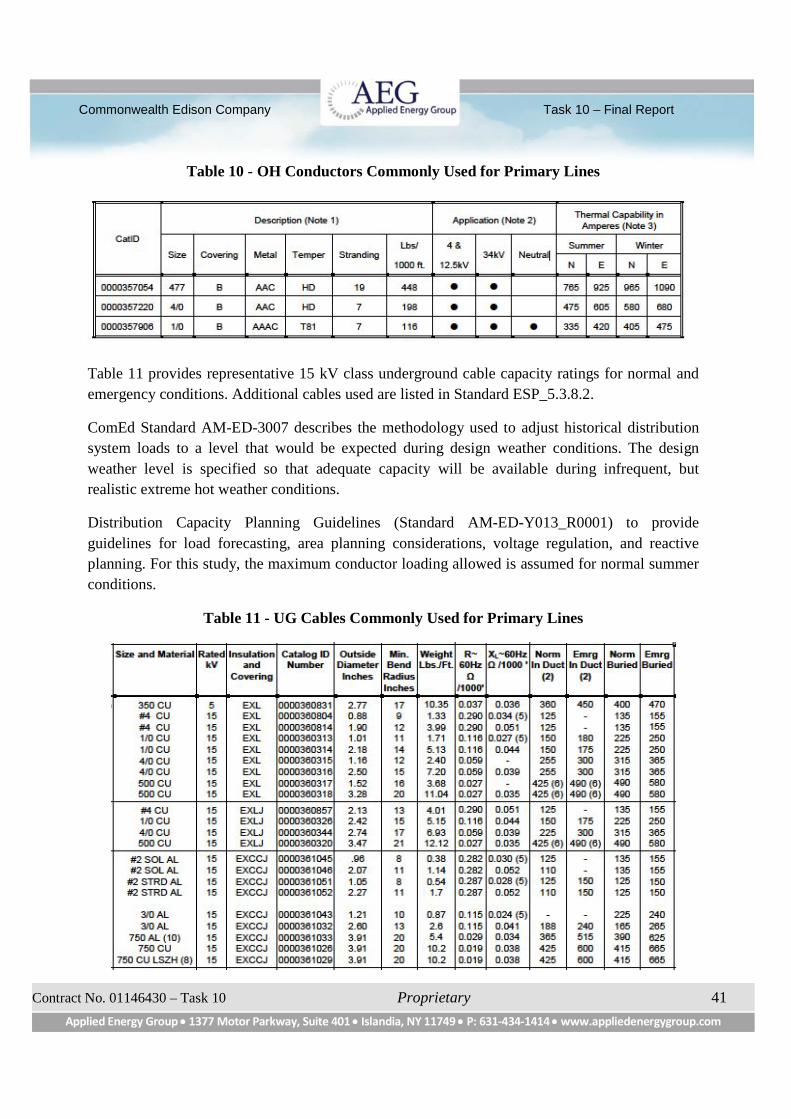
Commonwealth Edison Company Task 10 – Final Report
Contract No. 01146430 – Task 10 Proprietary 41
Applied Energy Group 1377 Motor Parkway, Suite 401 Islandia, NY 11749 P: 631-434-1414 www.appliedenergygroup.com
Table 10 - OH Conductors Commonly Used for Primary Lines
Table 11 provides representative 15 kV class underground cable capacity ratings for normal and
emergency conditions. Additional cables used are listed in Standard ESP_5.3.8.2.
ComEd Standard AM-ED-3007 describes the methodology used to adjust historical distribution
system loads to a level that would be expected during design weather conditions. The design
weather level is specified so that adequate capacity will be available during infrequent, but
realistic extreme hot weather conditions.
Distribution Capacity Planning Guidelines (Standard AM-ED-Y013_R0001) to provide
guidelines for load forecasting, area planning considerations, voltage regulation, and reactive
planning. For this study, the maximum conductor loading allowed is assumed for normal summer
conditions.
Table 11 - UG Cables Commonly Used for Primary Lines
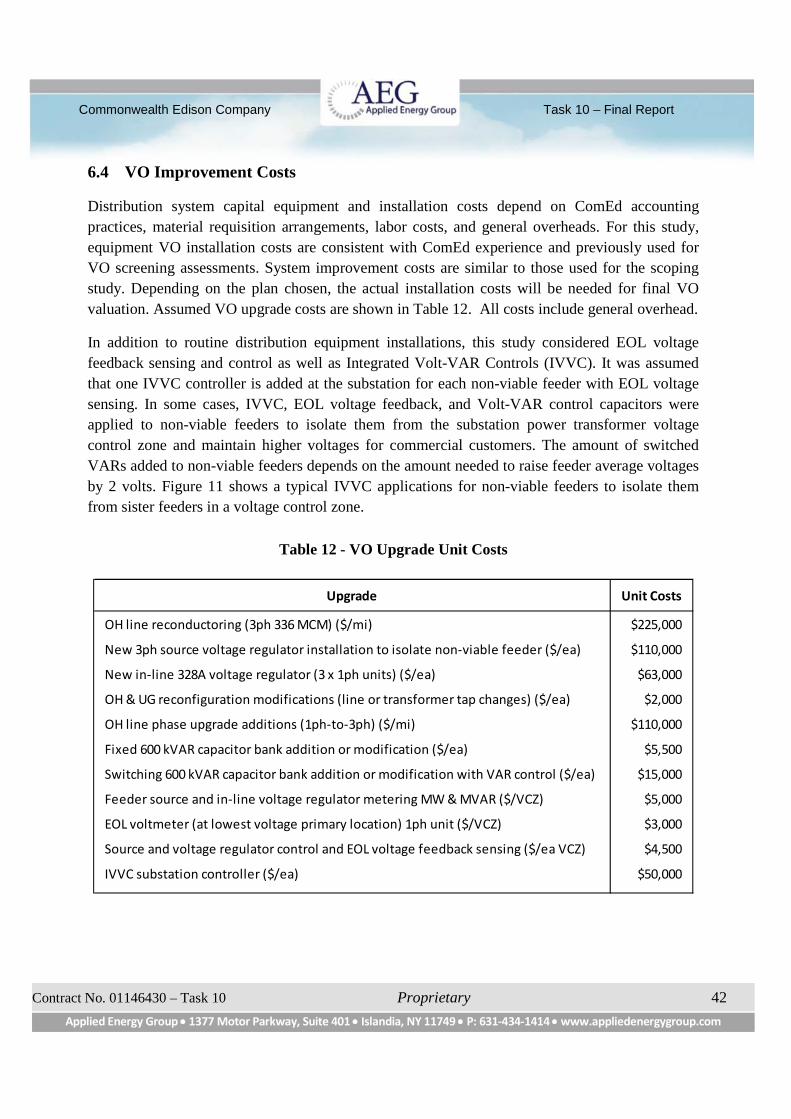
Commonwealth Edison Company Task 10 – Final Report
Contract No. 01146430 – Task 10 Proprietary 42
Applied Energy Group 1377 Motor Parkway, Suite 401 Islandia, NY 11749 P: 631-434-1414 www.appliedenergygroup.com
6.4 VO Improvement Costs
Distribution system capital equipment and installation costs depend on ComEd accounting
practices, material requisition arrangements, labor costs, and general overheads. For this study,
equipment VO installation costs are consistent with ComEd experience and previously used for
VO screening assessments. System improvement costs are similar to those used for the scoping
study. Depending on the plan chosen, the actual installation costs will be needed for final VO
valuation. Assumed VO upgrade costs are shown in Table 12. All costs include general overhead.
In addition to routine distribution equipment installations, this study considered EOL voltage
feedback sensing and control as well as Integrated Volt-VAR Controls (IVVC). It was assumed
that one IVVC controller is added at the substation for each non-viable feeder with EOL voltage
sensing. In some cases, IVVC, EOL voltage feedback, and Volt-VAR control capacitors were
applied to non-viable feeders to isolate them from the substation power transformer voltage
control zone and maintain higher voltages for commercial customers. The amount of switched
VARs added to non-viable feeders depends on the amount needed to raise feeder average voltages
by 2 volts. Figure 11 shows a typical IVVC applications for non-viable feeders to isolate them
from sister feeders in a voltage control zone.
Table 12 - VO Upgrade Unit Costs
Upgrade Unit Costs
OH line reconductoring (3ph 336 MCM) ($/mi) $225,000
New 3ph source voltage regulator installation to isolate non-viable feeder ($/ea) $110,000
New in-line 328A voltage regulator (3 x 1ph units) ($/ea) $63,000
OH & UG reconfiguration modifications (line or transformer tap changes) ($/ea) $2,000
OH line phase upgrade additions (1ph-to-3ph) ($/mi) $110,000
Fixed 600 kVAR capacitor bank addition or modification ($/ea) $5,500
Switching 600 kVAR capacitor bank addition or modification with VAR control ($/ea) $15,000
Feeder source and in-line voltage regulator metering MW & MVAR ($/VCZ) $5,000
EOL voltmeter (at lowest voltage primary location) 1ph unit ($/VCZ) $3,000
Source and voltage regulator control and EOL voltage feedback sensing ($/ea VCZ) $4,500
IVVC substation controller ($/ea) $50,000
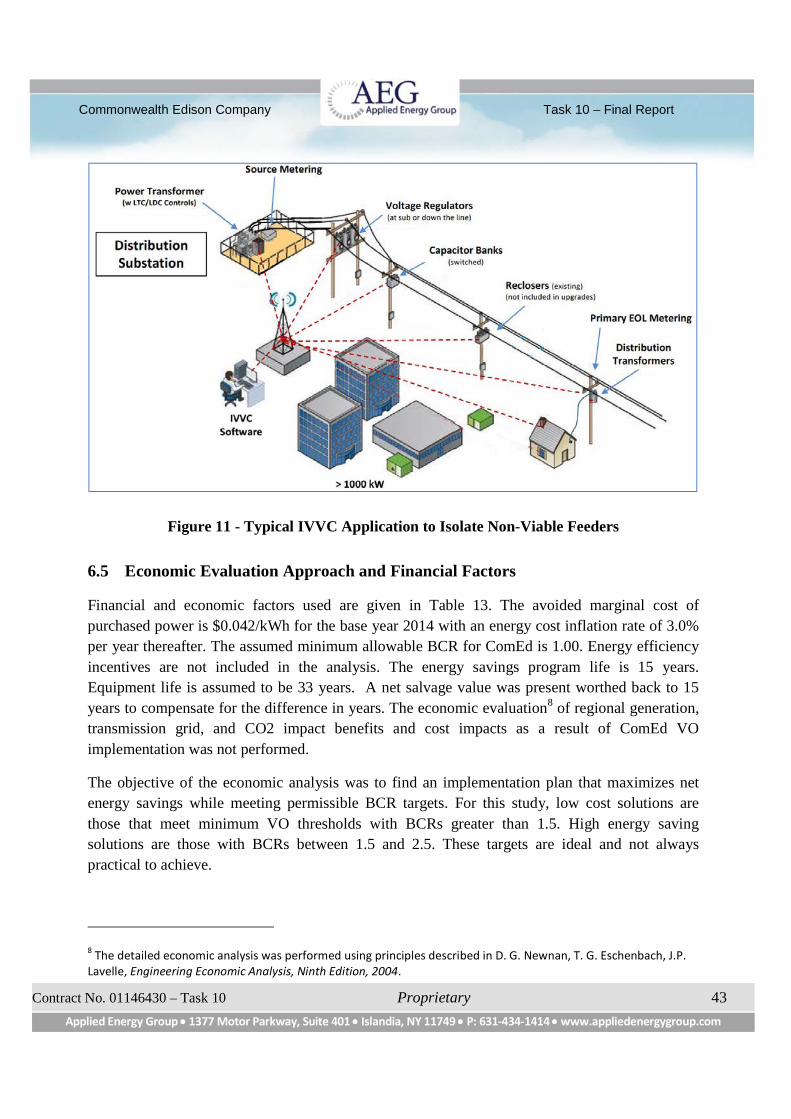
Commonwealth Edison Company Task 10 – Final Report
Contract No. 01146430 – Task 10 Proprietary 43
Applied Energy Group 1377 Motor Parkway, Suite 401 Islandia, NY 11749 P: 631-434-1414 www.appliedenergygroup.com
Figure 11 - Typical IVVC Application to Isolate Non-Viable Feeders
6.5 Economic Evaluation Approach and Financial Factors
Financial and economic factors used are given in Table 13. The avoided marginal cost of
purchased power is $0.042/kWh for the base year 2014 with an energy cost inflation rate of 3.0%
per year thereafter. The assumed minimum allowable BCR for ComEd is 1.00. Energy efficiency
incentives are not included in the analysis. The energy savings program life is 15 years.
Equipment life is assumed to be 33 years. A net salvage value was present worthed back to 15
years to compensate for the difference in years. The economic evaluation8 of regional generation,
transmission grid, and CO2 impact benefits and cost impacts as a result of ComEd VO
implementation was not performed.
The objective of the economic analysis was to find an implementation plan that maximizes net
energy savings while meeting permissible BCR targets. For this study, low cost solutions are
those that meet minimum VO thresholds with BCRs greater than 1.5. High energy saving
solutions are those with BCRs between 1.5 and 2.5. These targets are ideal and not always
practical to achieve.
8The detailed economic analysis was performed using principles described in D. G. Newnan, T. G. Eschenbach, J.P.
Lavelle, Engineering Economic Analysis, Ninth Edition, 2004.
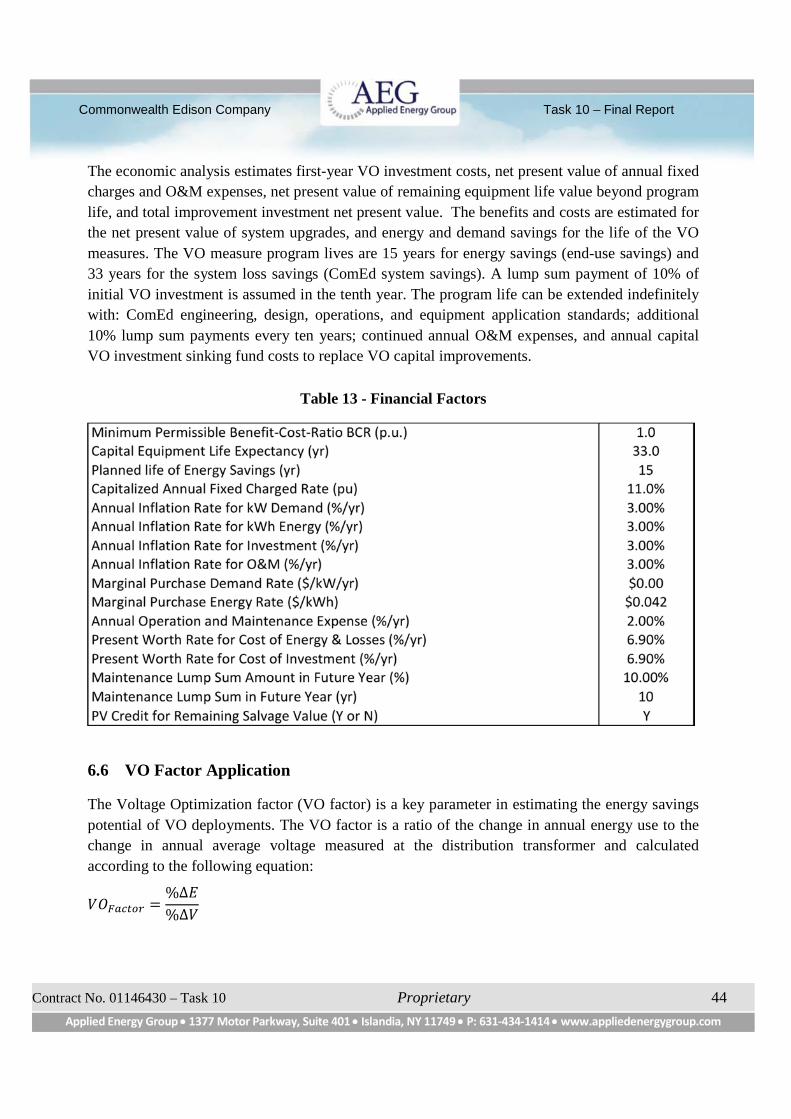
Commonwealth Edison Company Task 10 – Final Report
Contract No. 01146430 – Task 10 Proprietary 44
Applied Energy Group 1377 Motor Parkway, Suite 401 Islandia, NY 11749 P: 631-434-1414 www.appliedenergygroup.com
The economic analysis estimates first-year VO investment costs, net present value of annual fixed
charges and O&M expenses, net present value of remaining equipment life value beyond program
life, and total improvement investment net present value. The benefits and costs are estimated for
the net present value of system upgrades, and energy and demand savings for the life of the VO
measures. The VO measure program lives are 15 years for energy savings (end-use savings) and
33 years for the system loss savings (ComEd system savings). A lump sum payment of 10% of
initial VO investment is assumed in the tenth year. The program life can be extended indefinitely
with: ComEd engineering, design, operations, and equipment application standards; additional
10% lump sum payments every ten years; continued annual O&M expenses, and annual capital
VO investment sinking fund costs to replace VO capital improvements.
Table 13 - Financial Factors
6.6 VO Factor Application
The Voltage Optimization factor (VO factor) is a key parameter in estimating the energy savings
potential of VO deployments. The VO factor is a ratio of the change in annual energy use to the
change in annual average voltage measured at the distribution transformer and calculated
according to the following equation:
� � � � � � � � =%∆�
%∆�
Commonwealth Edison Company Task 10 – Final Report
Contract No. 01146430 – Task 10 Proprietary 45
Applied Energy Group 1377 Motor Parkway, Suite 401 Islandia, NY 11749 P: 631-434-1414 www.appliedenergygroup.com
Where:
%∆� = Change in customer energy consumption
%∆� = Change in annual average voltage at the distribution transformer
Annual energy VO factors are developed for residential, commercial, and industrial loads within
ComEd’s service territory. VO factors were developed in Task 4 by incorporating feeder
characteristics such as load composition, voltage performance thresholds, and customer class.
Table 14 provides examples of common end-use load types.
Table 14 - Common End-Use Load Types
Load Type End Uses
Constant Impedance
Incandescent lighting, resistive water
heaters, electric space heat, electric
stoves, clothes dryers
Constant Current Welding units, electroplating processes
Constant PowerMotors (at rated load), Power supplies,
Fluorescent Lighting, washing machines
Although the end-use load mix for each customer class changes over time, the largest loads
typically remain constant (i.e., HVAC, water heating, lighting and electronics). The annual profile
has a summer peaking characteristic. Less than 10% of residential and commercial customers
apply electric space heating. For the 56 sample feeders investigated, no commercial loads greater
than 1000 kW demand and no industrial customers were included.
Energy VO factors by customer class assumed for this study are shown in Table 15. VO factors
represent a per unit change in energy to per unit change in average annual voltage. Weighted VO
factors were calculated for each feeder based on the residential and commercial kW actual load
and associated customer class. Weighted VO factors for substations are the weighted VO factors
of the feeders served by the substation. Table 16 summarizes calculated weighted average VO
factors for each substation investigated.

Commonwealth Edison Company Task 10 – Final Report
Contract No. 01146430 – Task 10 Proprietary 46
Applied Energy Group 1377 Motor Parkway, Suite 401 Islandia, NY 11749 P: 631-434-1414 www.appliedenergygroup.com
Table 15 - Global Energy VO Factors by Customer Class for ComEd Study
Customer
Class
Energy
VO Factor
Residential 0.69
Commercial 0.90
Industrial 0.47
Table 16 - Substation Annual Energy Weighted VO Factors
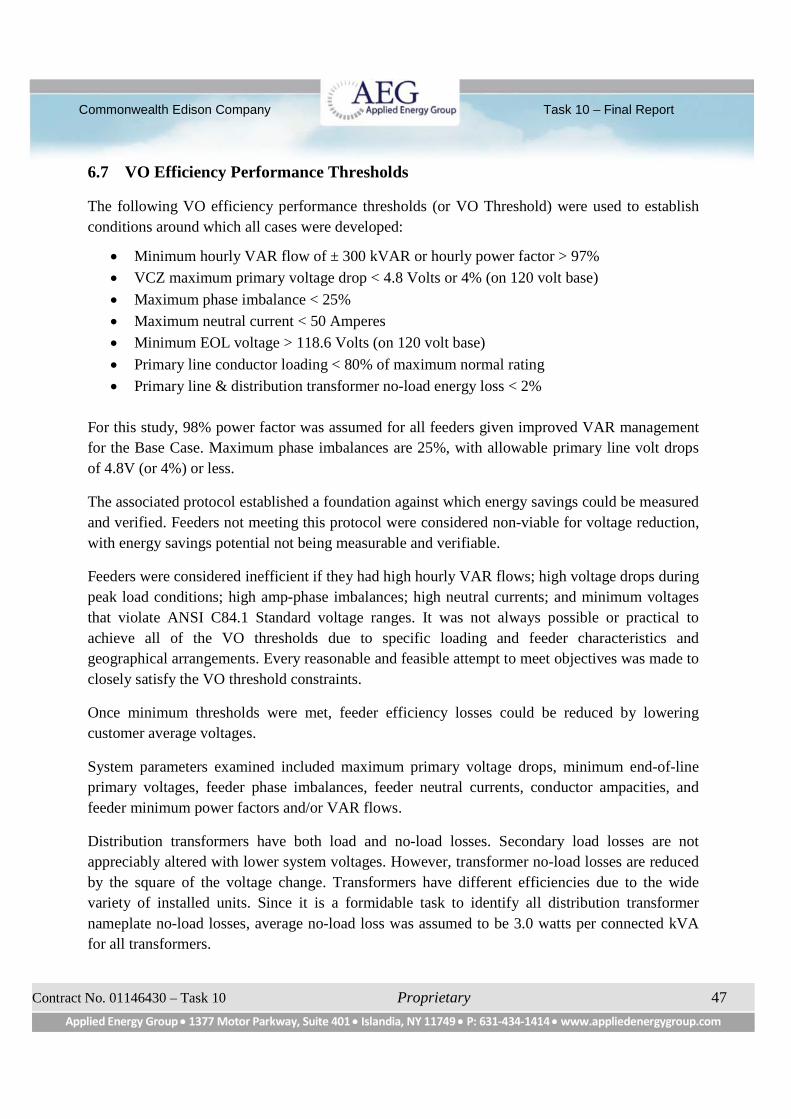
Commonwealth Edison Company Task 10 – Final Report
Contract No. 01146430 – Task 10 Proprietary 47
Applied Energy Group 1377 Motor Parkway, Suite 401 Islandia, NY 11749 P: 631-434-1414 www.appliedenergygroup.com
6.7 VO Efficiency Performance Thresholds
The following VO efficiency performance thresholds (or VO Threshold) were used to establish
conditions around which all cases were developed:
Minimum hourly VAR flow of ± 300 kVAR or hourly power factor > 97%
VCZ maximum primary voltage drop < 4.8 Volts or 4% (on 120 volt base)
Maximum phase imbalance < 25%
Maximum neutral current < 50 Amperes
Minimum EOL voltage > 118.6 Volts (on 120 volt base)
Primary line conductor loading < 80% of maximum normal rating
Primary line & distribution transformer no-load energy loss < 2%
For this study, 98% power factor was assumed for all feeders given improved VAR management
for the Base Case. Maximum phase imbalances are 25%, with allowable primary line volt drops
of 4.8V (or 4%) or less.
The associated protocol established a foundation against which energy savings could be measured
and verified. Feeders not meeting this protocol were considered non-viable for voltage reduction,
with energy savings potential not being measurable and verifiable.
Feeders were considered inefficient if they had high hourly VAR flows; high voltage drops during
peak load conditions; high amp-phase imbalances; high neutral currents; and minimum voltages
that violate ANSI C84.1 Standard voltage ranges. It was not always possible or practical to
achieve all of the VO thresholds due to specific loading and feeder characteristics and
geographical arrangements. Every reasonable and feasible attempt to meet objectives was made to
closely satisfy the VO threshold constraints.
Once minimum thresholds were met, feeder efficiency losses could be reduced by lowering
customer average voltages.
System parameters examined included maximum primary voltage drops, minimum end-of-line
primary voltages, feeder phase imbalances, feeder neutral currents, conductor ampacities, and
feeder minimum power factors and/or VAR flows.
Distribution transformers have both load and no-load losses. Secondary load losses are not
appreciably altered with lower system voltages. However, transformer no-load losses are reduced
by the square of the voltage change. Transformers have different efficiencies due to the wide
variety of installed units. Since it is a formidable task to identify all distribution transformer
nameplate no-load losses, average no-load loss was assumed to be 3.0 watts per connected kVA
for all transformers.
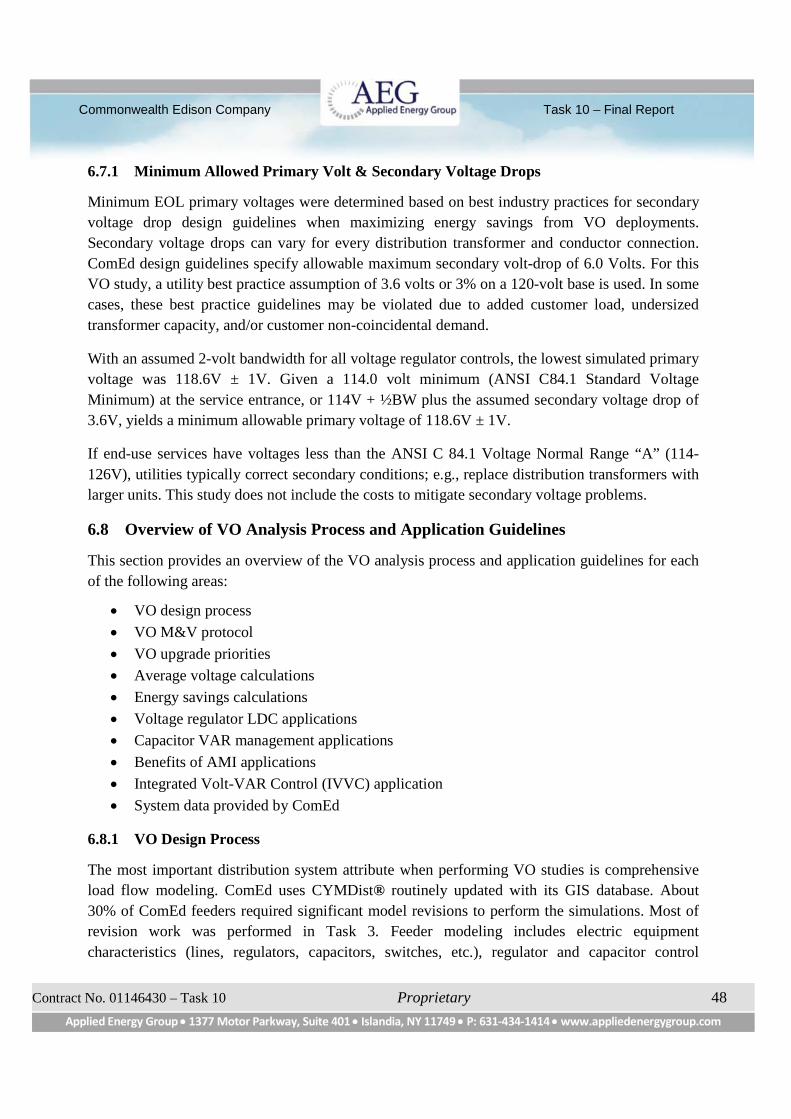
Commonwealth Edison Company Task 10 – Final Report
Contract No. 01146430 – Task 10 Proprietary 48
Applied Energy Group 1377 Motor Parkway, Suite 401 Islandia, NY 11749 P: 631-434-1414 www.appliedenergygroup.com
6.7.1 Minimum Allowed Primary Volt & Secondary Voltage Drops
Minimum EOL primary voltages were determined based on best industry practices for secondary
voltage drop design guidelines when maximizing energy savings from VO deployments.
Secondary voltage drops can vary for every distribution transformer and conductor connection.
ComEd design guidelines specify allowable maximum secondary volt-drop of 6.0 Volts. For this
VO study, a utility best practice assumption of 3.6 volts or 3% on a 120-volt base is used. In some
cases, these best practice guidelines may be violated due to added customer load, undersized
transformer capacity, and/or customer non-coincidental demand.
With an assumed 2-volt bandwidth for all voltage regulator controls, the lowest simulated primary
voltage was 118.6V ± 1V. Given a 114.0 volt minimum (ANSI C84.1 Standard Voltage
Minimum) at the service entrance, or 114V + ½BW plus the assumed secondary voltage drop of
3.6V, yields a minimum allowable primary voltage of 118.6V ± 1V.
If end-use services have voltages less than the ANSI C 84.1 Voltage Normal Range “A” (114-
126V), utilities typically correct secondary conditions; e.g., replace distribution transformers with
larger units. This study does not include the costs to mitigate secondary voltage problems.
6.8 Overview of VO Analysis Process and Application Guidelines
This section provides an overview of the VO analysis process and application guidelines for each
of the following areas:
VO design process
VO M&V protocol
VO upgrade priorities
Average voltage calculations
Energy savings calculations
Voltage regulator LDC applications
Capacitor VAR management applications
Benefits of AMI applications
Integrated Volt-VAR Control (IVVC) application
System data provided by ComEd
6.8.1 VO Design Process
The most important distribution system attribute when performing VO studies is comprehensive
load flow modeling. ComEd uses CYMDist® routinely updated with its GIS database. About
30% of ComEd feeders required significant model revisions to perform the simulations. Most of
revision work was performed in Task 3. Feeder modeling includes electric equipment
characteristics (lines, regulators, capacitors, switches, etc.), regulator and capacitor control
Commonwealth Edison Company Task 10 – Final Report
Contract No. 01146430 – Task 10 Proprietary 49
Applied Energy Group 1377 Motor Parkway, Suite 401 Islandia, NY 11749 P: 631-434-1414 www.appliedenergygroup.com
parameters, number and type of connected customers, circuit configurations, amount and type of
connected load, and spatial location of equipment.
The second most important VO attribute is having complete substation and feeder metering
information, including annual peak loads, annual MWh delivered, phase Amperes, and MW and
MVAr hourly profile data. Because VO studies determine impacts of relatively small system
alterations (voltage control changes, phase upgrades, load balancing, reconductoring, added
regulators, reconfigurations, capacitor control changes, etc.) with high installation costs, accurate
models are necessary to ensure results can be measured and verified.
ComEd substation and feeder metering varies from available amperes by phase only; to MW and
MVAr demand and phase Amperes; to MW and MVAR and ampere phase hourly profile data.
MW & MVAr load data was available on only 7 of the 16 substations. Substation voltage
regulation is provided by power transformer LTCs and substation voltage regulators with control
settings fixed at 124.8 V (on 120 V base) with 2 or 3 V bandwidths. (Note: Metering load profile
data will be needed for any required field VO M&V testing to validate energy savings for VO
implementations.)
The as-is distribution system Existing Case was analyzed to determine load (annual MWh and
peak kW) and no-load losses, and for compliance against performance thresholds. Minimal
improvements were identified; e.g., minimum hourly VAR flows, maximum voltage drops,
maximum phase imbalances, minimum EOL voltages, and no overloaded conductors. The
upgraded system uses the same or similar voltage-control settings as the existing system.
Adjustments may be needed to avoid low voltage operations. The upgraded system becomes the
VO Base Case from which all other alternative plans are measured.
Once the Base Case was established, Plan A and Plan B were developed and results reported for
the following measures:
Substation and Feeder weighted VO Factors
VO performance threshold compliance
Change in system losses from Existing Case
Change in weighted annual average voltage from Base Case
Potential energy savings from Base Case
Potential demand reductions from Base Case
Present value cost of energy saved
Present value cost of upgrades, including threshold compliance upgrades
Resulting BCR >1.5
Commonwealth Edison Company Task 10 – Final Report
Contract No. 01146430 – Task 10 Proprietary 50
Applied Energy Group 1377 Motor Parkway, Suite 401 Islandia, NY 11749 P: 631-434-1414 www.appliedenergygroup.com
An optimal VO Plan is one that maximizes energy savings potential, meets VO thresholds, and
has BCRs >1.0. For this study, BCRs >1.5 were assumed to allow for unforeseen errors and/or
modifications to the data modeling, operational constraints, and/or financial costs.
The VO study process includes the following steps:
1. Gather system information including metering data, customer load characteristics, VO Factor,
financial parameters, efficiency targets, marginal cost of energy and demand, existing voltage
operational parameters and constraints, unit costs, system topology mapping, and utility
construction and voltage drop standards.
2. Prepare a distribution electrical Existing Case model.
3. Identify Existing Case efficiency threshold compliance.
4. Develop Base Case with VO upgrades to comply with VO efficiency thresholds and same
volt setting as Existing Case.
5. Identify system net change in kW peak line losses between the Existing Case and the final
Base Case. Identify the investment cost of system improvements.
6. Create Plan A Case by modifying Base Case with lower volt settings and VO upgrades.
7. Perform Pre-VO average voltage calculations and no-load loss assessments using Base Case
VCZ voltage settings.
8. Perform Post-VO average voltage calculations and no-load loss assessment using Plan A VCZ
voltage settings.
9. Determine changes average voltage, end-use energy consumption, line loss, and transformer
no-load loss.
10. Perform economic analysis of costs and benefits for Plan A Case system.
11. Repeat steps 6 through 10 to create additional plans each by adding additional system
improvements in order of priority. For each plan, if the Benefit Cost Ratio is less than the
BCR target, repeat steps.
12. Prepare findings, results, and recommendations.
A detailed study includes two main development processes: Existing Case development; and VO
Base Case, Plan A, and Plan B development. Existing Case development process steps are shown
in Figure 9. Base Case, Plan A, and Plan B development process steps are shown in Figure 10.
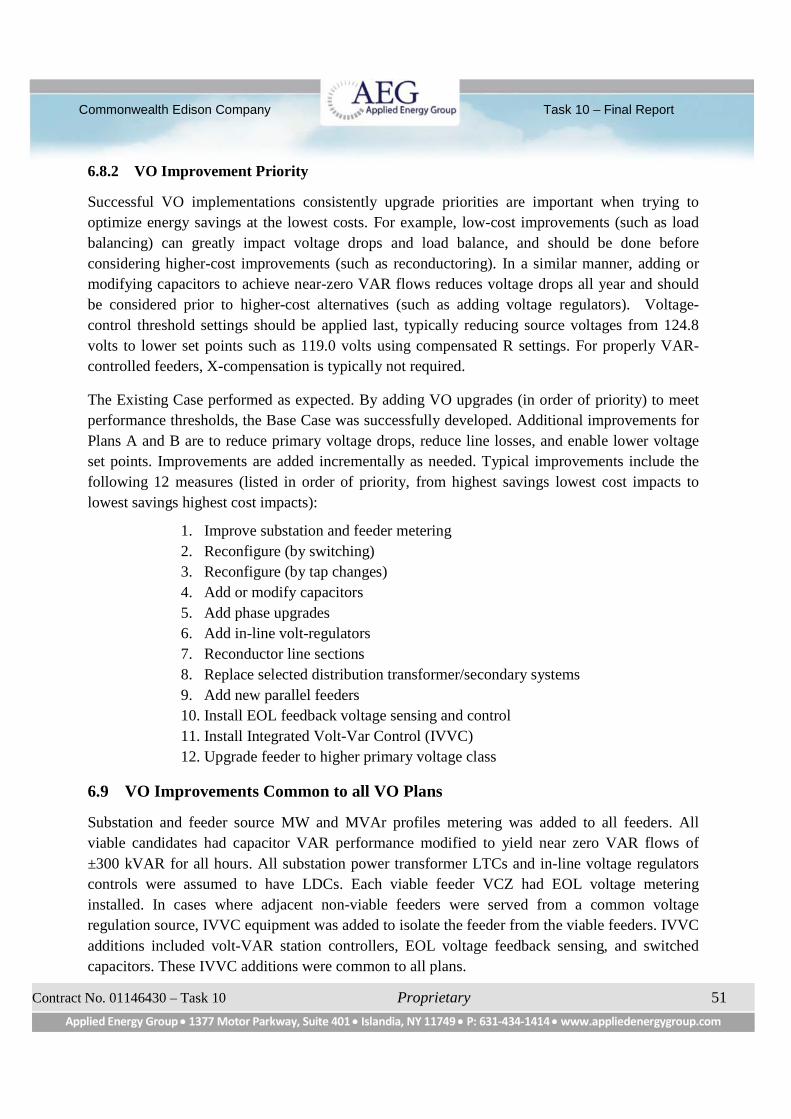
Commonwealth Edison Company Task 10 – Final Report
Contract No. 01146430 – Task 10 Proprietary 51
Applied Energy Group 1377 Motor Parkway, Suite 401 Islandia, NY 11749 P: 631-434-1414 www.appliedenergygroup.com
6.8.2 VO Improvement Priority
Successful VO implementations consistently upgrade priorities are important when trying to
optimize energy savings at the lowest costs. For example, low-cost improvements (such as load
balancing) can greatly impact voltage drops and load balance, and should be done before
considering higher-cost improvements (such as reconductoring). In a similar manner, adding or
modifying capacitors to achieve near-zero VAR flows reduces voltage drops all year and should
be considered prior to higher-cost alternatives (such as adding voltage regulators). Voltage-
control threshold settings should be applied last, typically reducing source voltages from 124.8
volts to lower set points such as 119.0 volts using compensated R settings. For properly VAR-
controlled feeders, X-compensation is typically not required.
The Existing Case performed as expected. By adding VO upgrades (in order of priority) to meet
performance thresholds, the Base Case was successfully developed. Additional improvements for
Plans A and B are to reduce primary voltage drops, reduce line losses, and enable lower voltage
set points. Improvements are added incrementally as needed. Typical improvements include the
following 12 measures (listed in order of priority, from highest savings lowest cost impacts to
lowest savings highest cost impacts):
1. Improve substation and feeder metering
2. Reconfigure (by switching)
3. Reconfigure (by tap changes)
4. Add or modify capacitors
5. Add phase upgrades
6. Add in-line volt-regulators
7. Reconductor line sections
8. Replace selected distribution transformer/secondary systems
9. Add new parallel feeders
10. Install EOL feedback voltage sensing and control
11. Install Integrated Volt-Var Control (IVVC)
12. Upgrade feeder to higher primary voltage class
6.9 VO Improvements Common to all VO Plans
Substation and feeder source MW and MVAr profiles metering was added to all feeders. All
viable candidates had capacitor VAR performance modified to yield near zero VAR flows of
±300 kVAR for all hours. All substation power transformer LTCs and in-line voltage regulators
controls were assumed to have LDCs. Each viable feeder VCZ had EOL voltage metering
installed. In cases where adjacent non-viable feeders were served from a common voltage
regulation source, IVVC equipment was added to isolate the feeder from the viable feeders. IVVC
additions included volt-VAR station controllers, EOL voltage feedback sensing, and switched
capacitors. These IVVC additions were common to all plans.
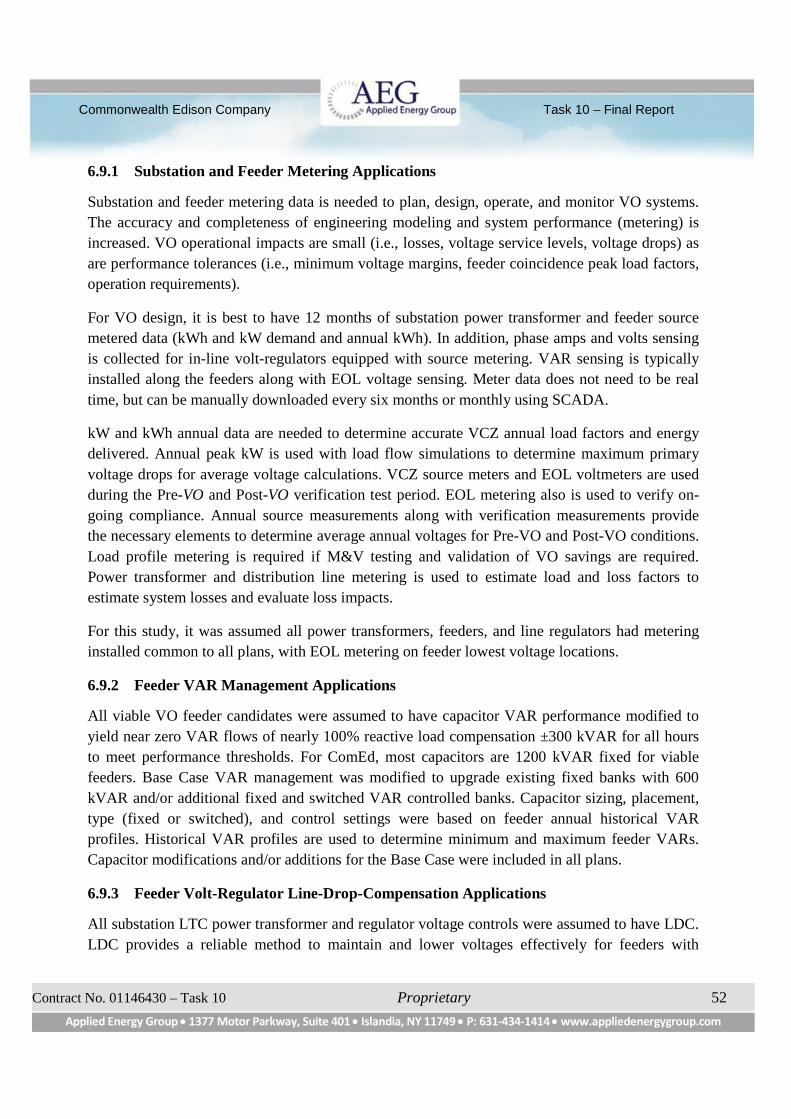
Commonwealth Edison Company Task 10 – Final Report
Contract No. 01146430 – Task 10 Proprietary 52
Applied Energy Group 1377 Motor Parkway, Suite 401 Islandia, NY 11749 P: 631-434-1414 www.appliedenergygroup.com
6.9.1 Substation and Feeder Metering Applications
Substation and feeder metering data is needed to plan, design, operate, and monitor VO systems.
The accuracy and completeness of engineering modeling and system performance (metering) is
increased. VO operational impacts are small (i.e., losses, voltage service levels, voltage drops) as
are performance tolerances (i.e., minimum voltage margins, feeder coincidence peak load factors,
operation requirements).
For VO design, it is best to have 12 months of substation power transformer and feeder source
metered data (kWh and kW demand and annual kWh). In addition, phase amps and volts sensing
is collected for in-line volt-regulators equipped with source metering. VAR sensing is typically
installed along the feeders along with EOL voltage sensing. Meter data does not need to be real
time, but can be manually downloaded every six months or monthly using SCADA.
kW and kWh annual data are needed to determine accurate VCZ annual load factors and energy
delivered. Annual peak kW is used with load flow simulations to determine maximum primary
voltage drops for average voltage calculations. VCZ source meters and EOL voltmeters are used
during the Pre-VO and Post-VO verification test period. EOL metering also is used to verify on-
going compliance. Annual source measurements along with verification measurements provide
the necessary elements to determine average annual voltages for Pre-VO and Post-VO conditions.
Load profile metering is required if M&V testing and validation of VO savings are required.
Power transformer and distribution line metering is used to estimate load and loss factors to
estimate system losses and evaluate loss impacts.
For this study, it was assumed all power transformers, feeders, and line regulators had metering
installed common to all plans, with EOL metering on feeder lowest voltage locations.
6.9.2 Feeder VAR Management Applications
All viable VO feeder candidates were assumed to have capacitor VAR performance modified to
yield near zero VAR flows of nearly 100% reactive load compensation ±300 kVAR for all hours
to meet performance thresholds. For ComEd, most capacitors are 1200 kVAR fixed for viable
feeders. Base Case VAR management was modified to upgrade existing fixed banks with 600
kVAR and/or additional fixed and switched VAR controlled banks. Capacitor sizing, placement,
type (fixed or switched), and control settings were based on feeder annual historical VAR
profiles. Historical VAR profiles are used to determine minimum and maximum feeder VARs.
Capacitor modifications and/or additions for the Base Case were included in all plans.
6.9.3 Feeder Volt-Regulator Line-Drop-Compensation Applications
All substation LTC power transformer and regulator voltage controls were assumed to have LDC.
LDC provides a reliable method to maintain and lower voltages effectively for feeders with
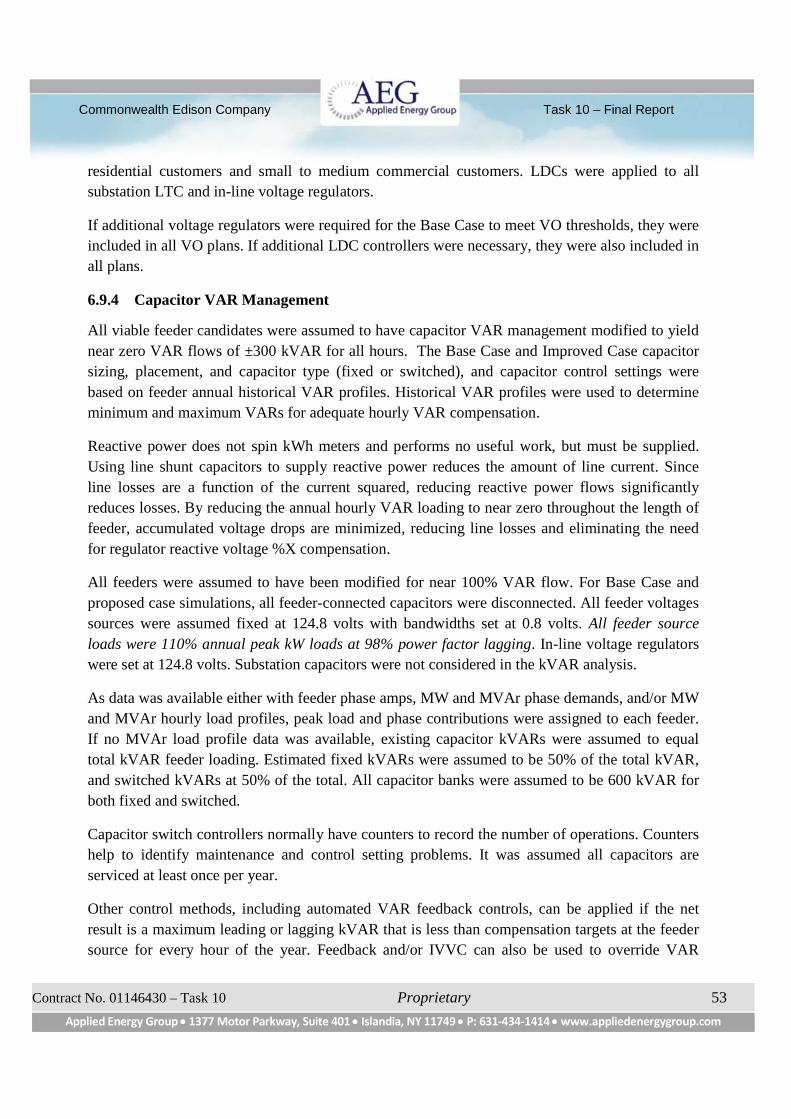
Commonwealth Edison Company Task 10 – Final Report
Contract No. 01146430 – Task 10 Proprietary 53
Applied Energy Group 1377 Motor Parkway, Suite 401 Islandia, NY 11749 P: 631-434-1414 www.appliedenergygroup.com
residential customers and small to medium commercial customers. LDCs were applied to all
substation LTC and in-line voltage regulators.
If additional voltage regulators were required for the Base Case to meet VO thresholds, they were
included in all VO plans. If additional LDC controllers were necessary, they were also included in
all plans.
6.9.4 Capacitor VAR Management
All viable feeder candidates were assumed to have capacitor VAR management modified to yield
near zero VAR flows of ±300 kVAR for all hours. The Base Case and Improved Case capacitor
sizing, placement, and capacitor type (fixed or switched), and capacitor control settings were
based on feeder annual historical VAR profiles. Historical VAR profiles were used to determine
minimum and maximum VARs for adequate hourly VAR compensation.
Reactive power does not spin kWh meters and performs no useful work, but must be supplied.
Using line shunt capacitors to supply reactive power reduces the amount of line current. Since
line losses are a function of the current squared, reducing reactive power flows significantly
reduces losses. By reducing the annual hourly VAR loading to near zero throughout the length of
feeder, accumulated voltage drops are minimized, reducing line losses and eliminating the need
for regulator reactive voltage %X compensation.
All feeders were assumed to have been modified for near 100% VAR flow. For Base Case and
proposed case simulations, all feeder-connected capacitors were disconnected. All feeder voltages
sources were assumed fixed at 124.8 volts with bandwidths set at 0.8 volts. All feeder source
loads were 110% annual peak kW loads at 98% power factor lagging. In-line voltage regulators
were set at 124.8 volts. Substation capacitors were not considered in the kVAR analysis.
As data was available either with feeder phase amps, MW and MVAr phase demands, and/or MW
and MVAr hourly load profiles, peak load and phase contributions were assigned to each feeder.
If no MVAr load profile data was available, existing capacitor kVARs were assumed to equal
total kVAR feeder loading. Estimated fixed kVARs were assumed to be 50% of the total kVAR,
and switched kVARs at 50% of the total. All capacitor banks were assumed to be 600 kVAR for
both fixed and switched.
Capacitor switch controllers normally have counters to record the number of operations. Counters
help to identify maintenance and control setting problems. It was assumed all capacitors are
serviced at least once per year.
Other control methods, including automated VAR feedback controls, can be applied if the net
result is a maximum leading or lagging kVAR that is less than compensation targets at the feeder
source for every hour of the year. Feedback and/or IVVC can also be used to override VAR
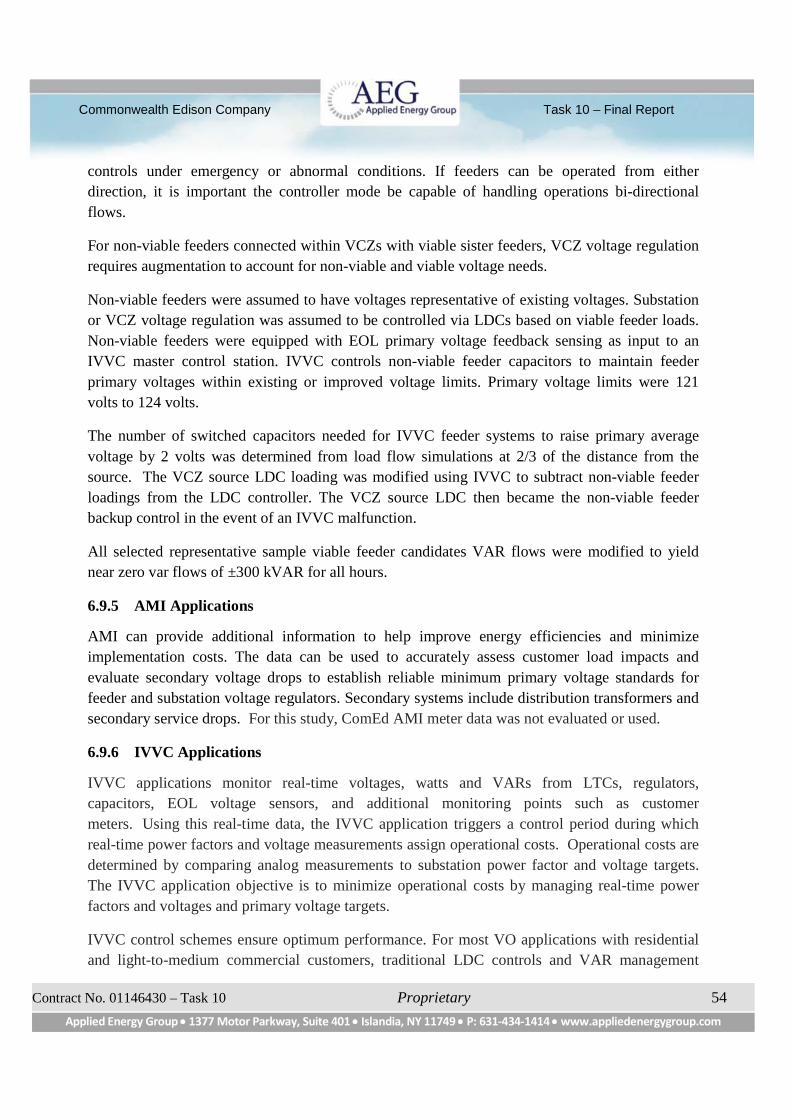
Commonwealth Edison Company Task 10 – Final Report
Contract No. 01146430 – Task 10 Proprietary 54
Applied Energy Group 1377 Motor Parkway, Suite 401 Islandia, NY 11749 P: 631-434-1414 www.appliedenergygroup.com
controls under emergency or abnormal conditions. If feeders can be operated from either
direction, it is important the controller mode be capable of handling operations bi-directional
flows.
For non-viable feeders connected within VCZs with viable sister feeders, VCZ voltage regulation
requires augmentation to account for non-viable and viable voltage needs.
Non-viable feeders were assumed to have voltages representative of existing voltages. Substation
or VCZ voltage regulation was assumed to be controlled via LDCs based on viable feeder loads.
Non-viable feeders were equipped with EOL primary voltage feedback sensing as input to an
IVVC master control station. IVVC controls non-viable feeder capacitors to maintain feeder
primary voltages within existing or improved voltage limits. Primary voltage limits were 121
volts to 124 volts.
The number of switched capacitors needed for IVVC feeder systems to raise primary average
voltage by 2 volts was determined from load flow simulations at 2/3 of the distance from the
source. The VCZ source LDC loading was modified using IVVC to subtract non-viable feeder
loadings from the LDC controller. The VCZ source LDC then became the non-viable feeder
backup control in the event of an IVVC malfunction.
All selected representative sample viable feeder candidates VAR flows were modified to yield
near zero var flows of ±300 kVAR for all hours.
6.9.5 AMI Applications
AMI can provide additional information to help improve energy efficiencies and minimize
implementation costs. The data can be used to accurately assess customer load impacts and
evaluate secondary voltage drops to establish reliable minimum primary voltage standards for
feeder and substation voltage regulators. Secondary systems include distribution transformers and
secondary service drops. For this study, ComEd AMI meter data was not evaluated or used.
6.9.6 IVVC Applications
IVVC applications monitor real-time voltages, watts and VARs from LTCs, regulators,
capacitors, EOL voltage sensors, and additional monitoring points such as customer
meters. Using this real-time data, the IVVC application triggers a control period during which
real-time power factors and voltage measurements assign operational costs. Operational costs are
determined by comparing analog measurements to substation power factor and voltage targets.
The IVVC application objective is to minimize operational costs by managing real-time power
factors and voltages and primary voltage targets.
IVVC control schemes ensure optimum performance. For most VO applications with residential
and light-to-medium commercial customers, traditional LDC controls and VAR management
Commonwealth Edison Company Task 10 – Final Report
Contract No. 01146430 – Task 10 Proprietary 55
Applied Energy Group 1377 Motor Parkway, Suite 401 Islandia, NY 11749 P: 631-434-1414 www.appliedenergygroup.com
schemes with switched VAR capacitor controls provide more cost-effective operation
performance. However, when adjacent (sister) feeders are connected to the same voltage regulator
or power transformer with significantly different load profiles and peak kW coincidence (i.e., <
80%) and high amounts of large commercial and/or industrial customer loading, traditional
voltage regulation and VAR management approaches become less effective.
Large commercial and industrial customers require higher service entrance voltages compared to
residential customers. Higher voltages are needed to coordinate with inefficient end-use electrical
systems typically requiring end-use voltage drops greater than ANSI standards.
For this study, IVVC was used to maintain and isolate voltages for large commercial and
industrial feeders (classified as non-viable candidates) by integrating with switched shunt
capacitor banks, voltage measurement and VAR sensing along the feeder, source voltage
regulation LDC controllers, and monitoring secondary service voltages for customers with AMI
(Figure 11).
6.10 VO Improvements Common to all VO Plans
Substation and feeder source MW and MVAr profiles metering was added to all feeders. All
viable candidates had capacitor VAR performance modified to yield near-zero VAR flows of ±
300 kVAR for all hours. All substation power transformer LTCs and in-line voltage regulators
controls were assumed to have LDCs. Each viable feeder VCZ had EOL voltage metering
installed. In cases where adjacent non-viable feeders were served from a common voltage
regulation source, IVVC equipment was added to isolate the feeder from the viable feeders. IVVC
additions included volt-VAR station controllers, EOL voltage feedback sensing, and switched
capacitors. These IVVC additions were common to all plans.
6.10.1 Substation and Feeder Metering Applications
Substation and feeder metering data is needed to plan, design, operate, and monitor VO systems.
The accuracy and completeness of engineering modeling and system performance (metering) is
increased. Since VO operational impacts are small (i.e., losses, voltage service levels, voltage
drops) as are performance tolerances (i.e., minimum voltage margins, feeder coincidence peak
load factors, operation requirements), accurate data is important to success.
For VO design, it is best to have 12 months of substation power transformer and feeder source
metered data (kWh and kW demand and annual kWh). In addition, phase amps and volts sensing
are collected for in-line volt-regulators equipped with source metering. VAR sensing is typically
installed along the feeders along with EOL voltage sensing. Meter data does not have to be real
time, but can be manually downloaded every six months using SCADA.
kW and kWh annual data is needed to determine accurate VCZ annual load factors and energy
delivered. Annual peak kW is used with load flow simulations to determine maximum primary
Commonwealth Edison Company Task 10 – Final Report
Contract No. 01146430 – Task 10 Proprietary 56
Applied Energy Group 1377 Motor Parkway, Suite 401 Islandia, NY 11749 P: 631-434-1414 www.appliedenergygroup.com
voltage drops for average voltage calculations. VCZ source meters and EOL voltmeters are used
during the Pre-VO and Post-VO verification test period. EOL metering also is used to verify on-
going compliance. Annual source measurements along with verification measurements provide
the necessary elements to determine average annual voltages for Pre-VO and Post-VO conditions.
Load profile metering is required if M&V testing and validation of VO savings are required.
Power transformer and distribution line metering is used to estimate load and loss factors to
estimate system losses and evaluate loss impacts.
For this study, it was assumed all power transformers, feeders, and line regulators had metering
installed common to all plans, with EOL metering on feeder lowest voltage locations.
6.10.2 Feeder VAR Management Applications
All viable VO feeder candidates were assumed to have capacitor VAR performance modified to
yield near zero VAR flows of nearly 100% reactive load compensation ±300 kVAR for all hours
to meet performance thresholds. For ComEd, most capacitors are 1200 kVAR fixed for viable
feeders. Base Case VAR management was modified to upgrade existing fixed banks with 600
kVAR and/or additional fixed and switched VAR controlled banks. Capacitor sizing, placement,
type (fixed or switched), and control settings were based on feeder annual historical VAR
profiles. Historical VAR profiles are used to determine minimum and maximum feeder VARs.
Capacitor modifications and/or additions for the Base Case were included in all plans.
6.10.3 IVVC and EOL Voltage Feedback and Control Application
If IVVC was required in the Base Case, IVVC applications were included in all VO plans. IVVC
was used to isolate non-viable feeders by integrating with switched shunt capacitor banks, voltage
measurement and var sensing along the feeder, EOL voltage sensing, source voltage regulation
LDC controllers, and AMI for secondary service voltages. In some cases, only EOL voltage
feedback, sensing, and control were required for feeders exhibiting lower feeder coincidence
factors when compared to their adjacent (sister) feeders.
All IVVC and EOL voltage feedback control applications required for the Base Case were
included in all VO plans.
6.11 Existing Case VO Performance Threshold Assessment
Minimum efficiency performance VO threshold objectives were identified (e.g., max voltage
drops, min power factors, max phase unbalance, etc.).
System loss reductions and lower the customer average voltages were generally achieved.
However, it was not always possible or practical to achieve all of VO thresholds due to specific
loading and geographical constraints.
Commonwealth Edison Company Task 10 – Final Report
Contract No. 01146430 – Task 10 Proprietary 57
Applied Energy Group 1377 Motor Parkway, Suite 401 Islandia, NY 11749 P: 631-434-1414 www.appliedenergygroup.com
Maximum primary volt drops for substation service areas ranged from 0.30 volts to 13.4 volts.
The average maximum voltage drop was 3.95 volts (lower than the 4.8 volt threshold).
Lowest primary voltages for substation service areas ranged from 124.5 volts to 111.1 volts. The
average lowest voltage was 116.26 volts (higher than the 118.6 volt threshold).
Feeder phase amp imbalances for substation service areas ranged from 1.2% to 31.1% (<25%
phase amp imbalance threshold). The average imbalance was 10.5%.
Maximum feeder conductor and cable length for correcting the substation service area overloads
was 0.62 miles.
Capacitor additions to maintain annual var flow of 300 kVAR for all hours for substation service
areas were 18 fixed 600 kVAR banks and 150 switched 600 kVAR banks. All switched capacitor
banks needed for the Base Case were assumed to have VAR sensing with voltage override
capability.
Existing case compliance with VO thresholds is summarized in Table 17. Highlighted values
indicate non-compliance with VO thresholds.
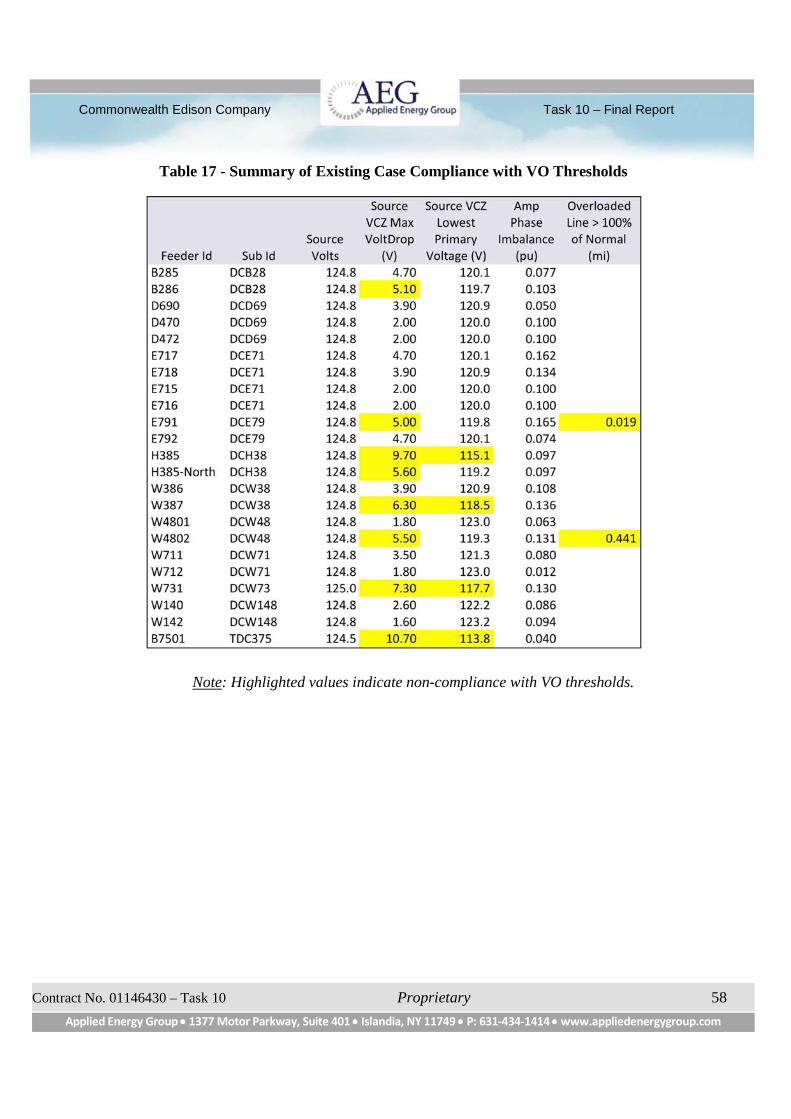
Commonwealth Edison Company Task 10 – Final Report
Contract No. 01146430 – Task 10 Proprietary 58
Applied Energy Group 1377 Motor Parkway, Suite 401 Islandia, NY 11749 P: 631-434-1414 www.appliedenergygroup.com
Table 17 - Summary of Existing Case Compliance with VO Thresholds
Note: Highlighted values indicate non-compliance with VO thresholds.
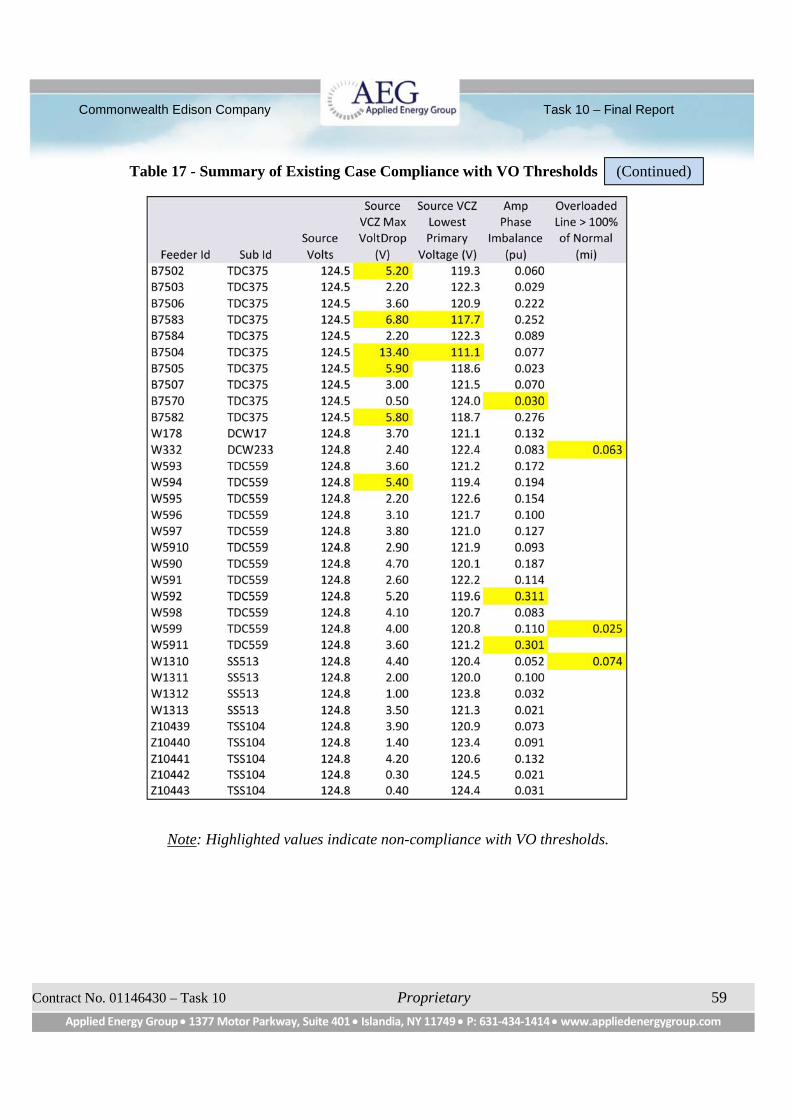
Commonwealth Edison Company Task 10 – Final Report
Contract No. 01146430 – Task 10 Proprietary 59
Applied Energy Group 1377 Motor Parkway, Suite 401 Islandia, NY 11749 P: 631-434-1414 www.appliedenergygroup.com
Table 17 - Summary of Existing Case Compliance with VO Thresholds (contin)
Note: Highlighted values indicate non-compliance with VO thresholds.
(Continued)
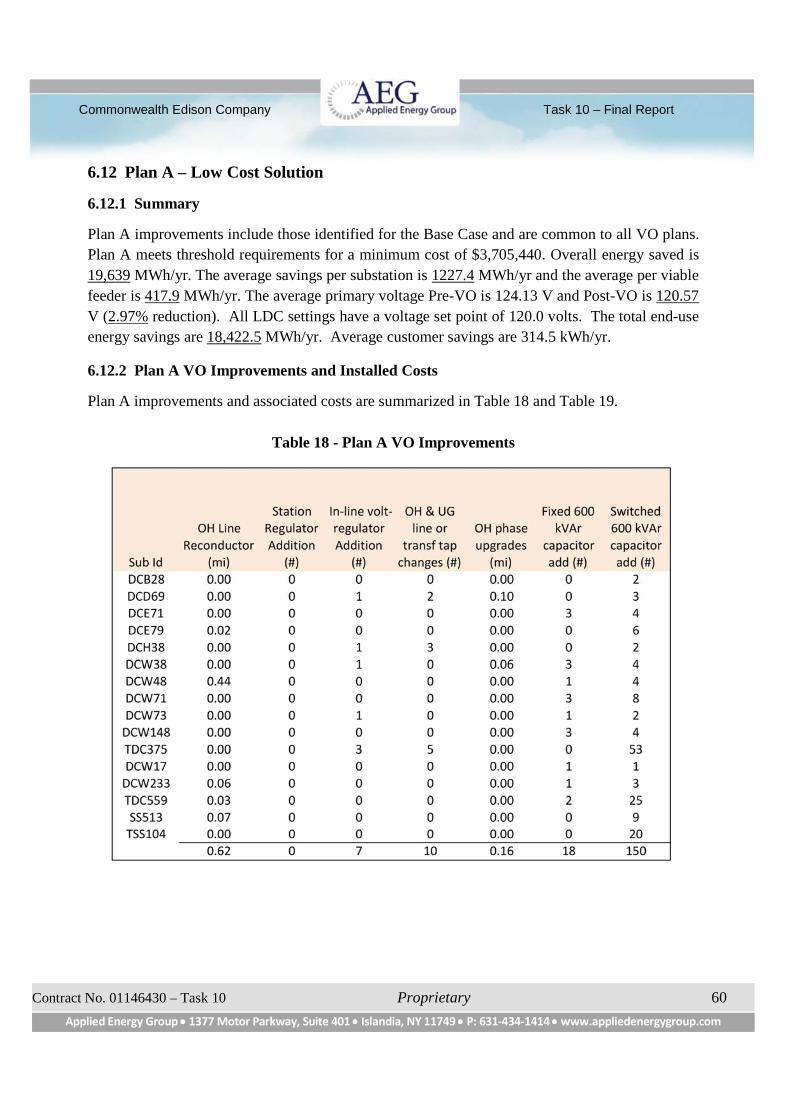
Commonwealth Edison Company Task 10 – Final Report
Contract No. 01146430 – Task 10 Proprietary 60
Applied Energy Group 1377 Motor Parkway, Suite 401 Islandia, NY 11749 P: 631-434-1414 www.appliedenergygroup.com
6.12 Plan A – Low Cost Solution
6.12.1 Summary
Plan A improvements include those identified for the Base Case and are common to all VO plans.
Plan A meets threshold requirements for a minimum cost of $3,705,440. Overall energy saved is
19,639 MWh/yr. The average savings per substation is 1227.4 MWh/yr and the average per viable
feeder is 417.9 MWh/yr. The average primary voltage Pre-VO is 124.13 V and Post-VO is 120.57
V (2.97% reduction). All LDC settings have a voltage set point of 120.0 volts. The total end-use
energy savings are 18,422.5 MWh/yr. Average customer savings are 314.5 kWh/yr.
6.12.2 Plan A VO Improvements and Installed Costs
Plan A improvements and associated costs are summarized in Table 18 and Table 19.
Table 18 - Plan A VO Improvements
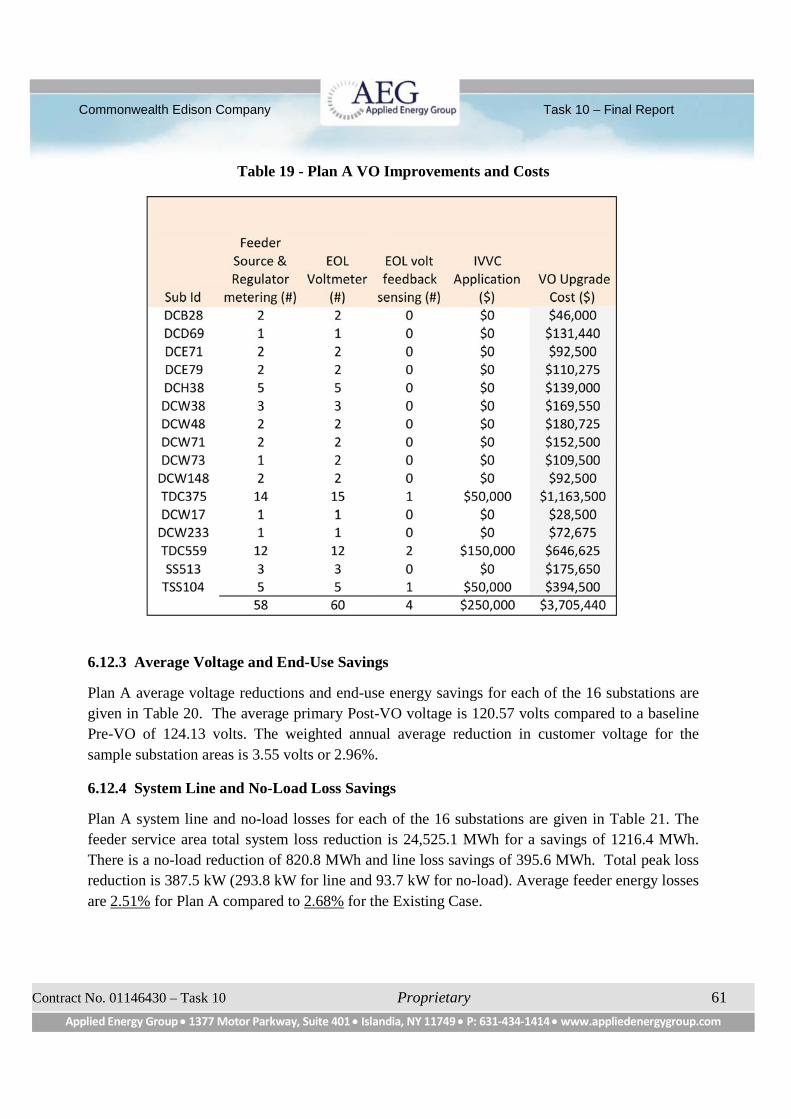
Commonwealth Edison Company Task 10 – Final Report
Contract No. 01146430 – Task 10 Proprietary 61
Applied Energy Group 1377 Motor Parkway, Suite 401 Islandia, NY 11749 P: 631-434-1414 www.appliedenergygroup.com
Table 19 - Plan A VO Improvements and Costs
6.12.3 Average Voltage and End-Use Savings
Plan A average voltage reductions and end-use energy savings for each of the 16 substations are
given in Table 20. The average primary Post-VO voltage is 120.57 volts compared to a baseline
Pre-VO of 124.13 volts. The weighted annual average reduction in customer voltage for the
sample substation areas is 3.55 volts or 2.96%.
6.12.4 System Line and No-Load Loss Savings
Plan A system line and no-load losses for each of the 16 substations are given in Table 21. The
feeder service area total system loss reduction is 24,525.1 MWh for a savings of 1216.4 MWh.
There is a no-load reduction of 820.8 MWh and line loss savings of 395.6 MWh. Total peak loss
reduction is 387.5 kW (293.8 kW for line and 93.7 kW for no-load). Average feeder energy losses
are 2.51% for Plan A compared to 2.68% for the Existing Case.
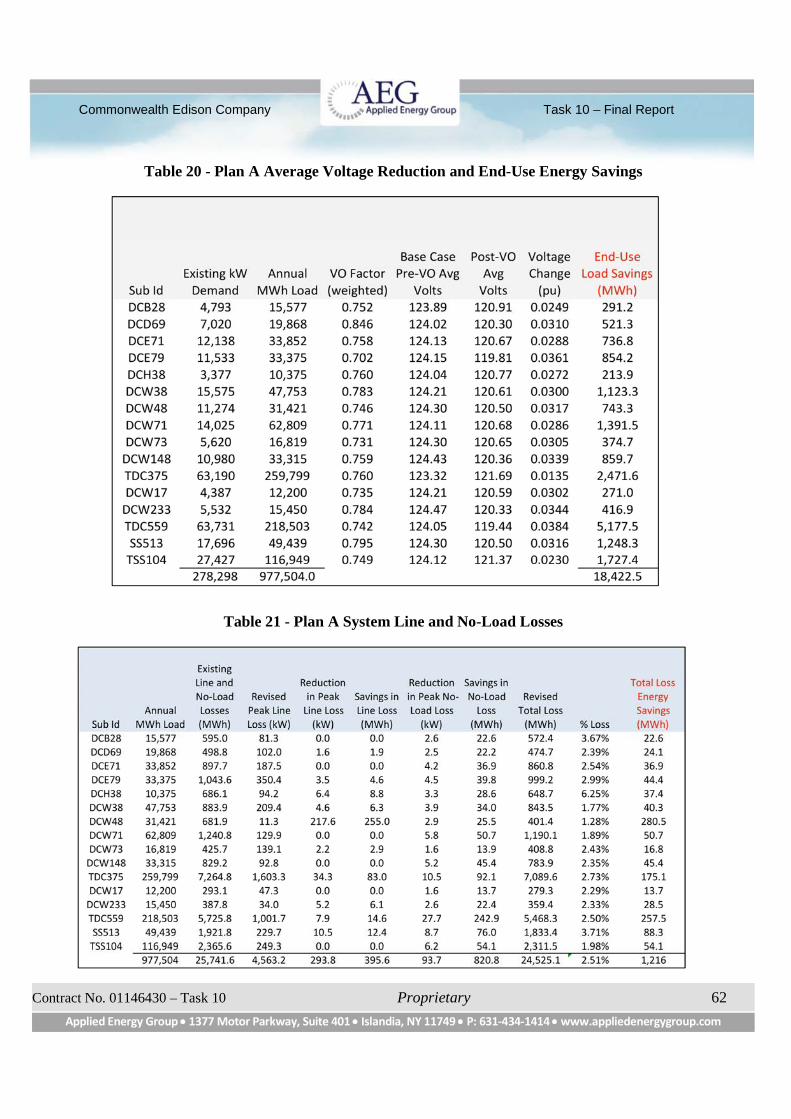
Commonwealth Edison Company Task 10 – Final Report
Contract No. 01146430 – Task 10 Proprietary 62
Applied Energy Group 1377 Motor Parkway, Suite 401 Islandia, NY 11749 P: 631-434-1414 www.appliedenergygroup.com
Table 20 - Plan A Average Voltage Reduction and End-Use Energy Savings
Table 21 - Plan A System Line and No-Load Losses

Commonwealth Edison Company Task 10 – Final Report
Contract No. 01146430 – Task 10 Proprietary 63
Applied Energy Group 1377 Motor Parkway, Suite 401 Islandia, NY 11749 P: 631-434-1414 www.appliedenergygroup.com
6.12.5 VO Economic Analysis
Plan A demonstrates an annual energy savings of 19,639.0 MWh/yr (2.01% reduction) and 3892.6
kW coincidental feeder demand reduction. The feeder system loss is 2.51% of the total energy
delivered compared to existing system losses of 2.63%.
Plan A substations have a relatively moderate overall BCR of 1.928 with total installed costs of
$3,705,440 ($78,839/fdr). The net overall present value reduction in revenue requirements is
$4,054,077 ($86,257/fdr). Total annual energy savings is 19,639.0 MWh/yr (417.9/fdr) for a
program measure life of 15 years.
Plan A substation first year costs, O&M costs, energy saved, demand reduction, and BCR are
shown in Table 22. Overall VO economic results are given in Table 23.
Table 22 - Plan A Economic Analysis Summary by Substation
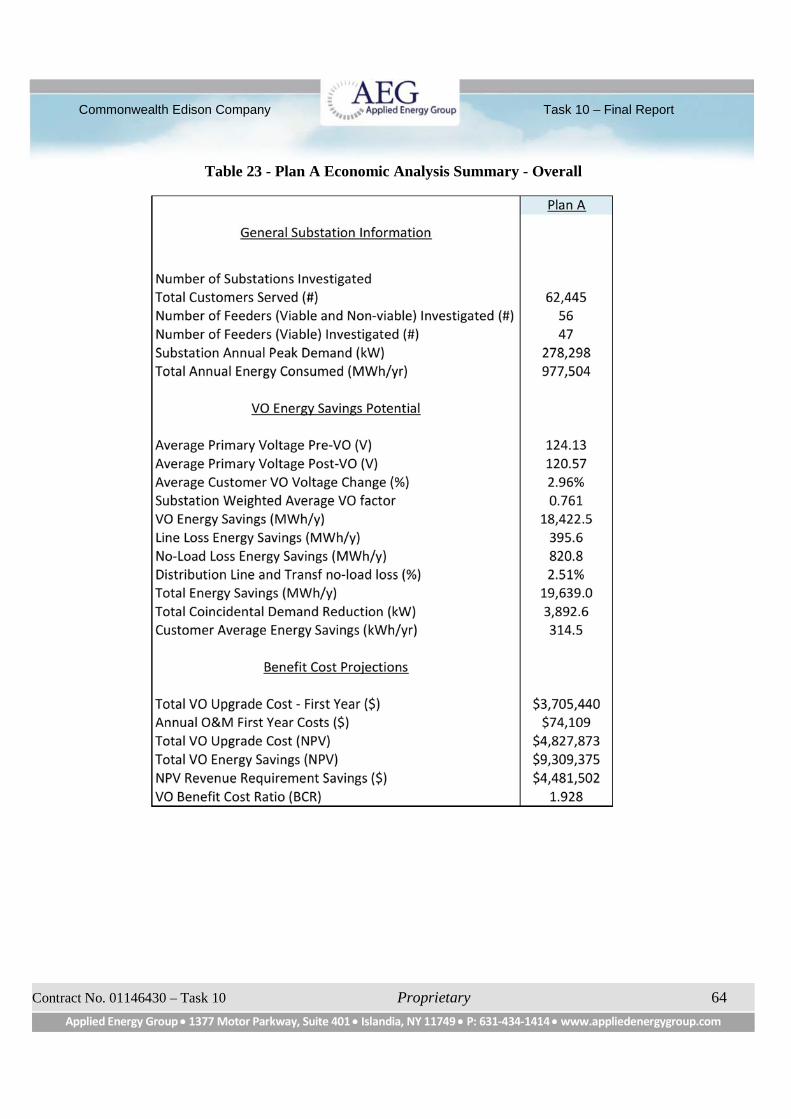
Commonwealth Edison Company Task 10 – Final Report
Contract No. 01146430 – Task 10 Proprietary 64
Applied Energy Group 1377 Motor Parkway, Suite 401 Islandia, NY 11749 P: 631-434-1414 www.appliedenergygroup.com
Table 23 - Plan A Economic Analysis Summary - Overall

Commonwealth Edison Company Task 10 – Final Report
Contract No. 01146430 – Task 10 Proprietary 65
Applied Energy Group 1377 Motor Parkway, Suite 401 Islandia, NY 11749 P: 631-434-1414 www.appliedenergygroup.com
6.13 Plan B – High Savings Solution
6.13.1 Summary
Plan B improvements include those identified for the Base Case plus additional upgrades. Plan B
meets threshold requirements for a cost of $5,142,735. The maximum overall energy saved is
27,138.9 MWh/yr. The average savings per substation is 1696.2 MWh/yr and the average per
viable feeder is 577.4 MWh/yr. The average primary voltage Pre-VO is 124.13 V and Post-VO is
119.56 V (3.81% reduction). Average voltage calculation methods are provided in Sections 2.8.4
and 7. All LDC settings have a voltage set point of 119.0 volts. Average Customer saves 434.6
kWh/yr.
6.13.2 Plan B VO Improvements and Installed Costs
Plan B improvements and associated costs are summarized in Table 24 and Table 25.
Table 24 - Plan B VO Improvements
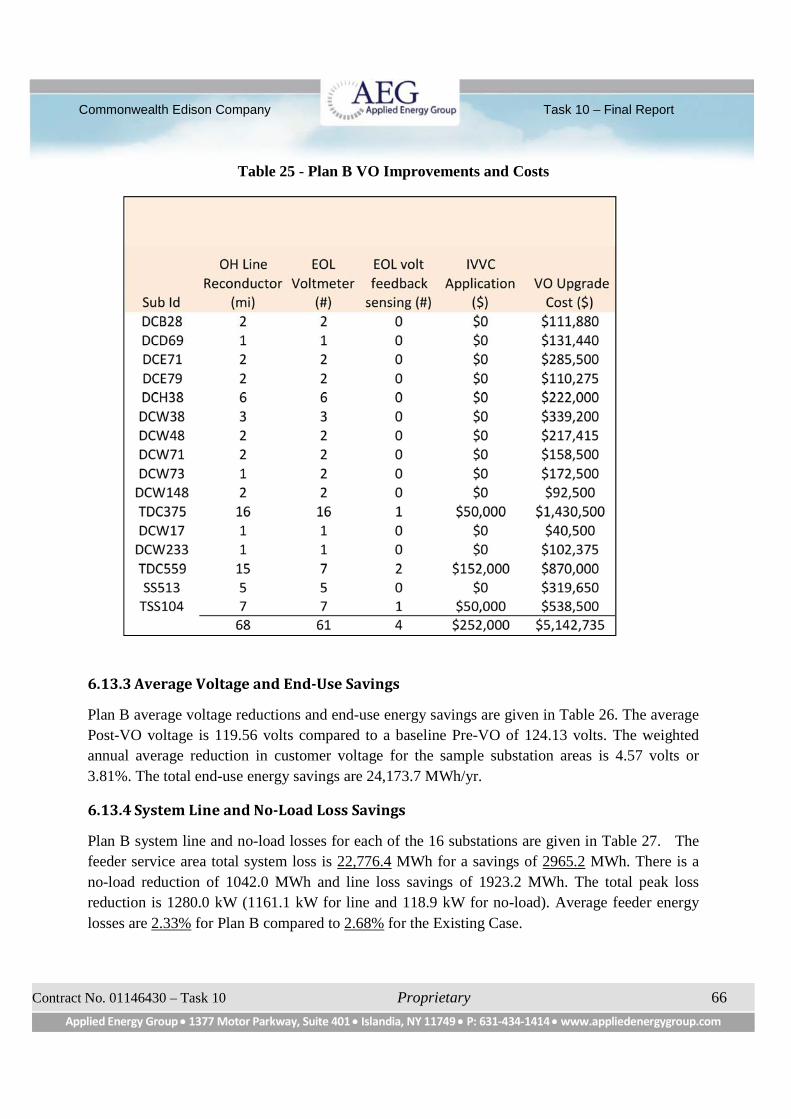
Commonwealth Edison Company Task 10 – Final Report
Contract No. 01146430 – Task 10 Proprietary 66
Applied Energy Group 1377 Motor Parkway, Suite 401 Islandia, NY 11749 P: 631-434-1414 www.appliedenergygroup.com
Table 25 - Plan B VO Improvements and Costs
6.13.3 Average Voltage and End-Use Savings
Plan B average voltage reductions and end-use energy savings are given in Table 26. The average
Post-VO voltage is 119.56 volts compared to a baseline Pre-VO of 124.13 volts. The weighted
annual average reduction in customer voltage for the sample substation areas is 4.57 volts or
3.81%. The total end-use energy savings are 24,173.7 MWh/yr.
6.13.4 System Line and No-Load Loss Savings
Plan B system line and no-load losses for each of the 16 substations are given in Table 27. The
feeder service area total system loss is 22,776.4 MWh for a savings of 2965.2 MWh. There is a
no-load reduction of 1042.0 MWh and line loss savings of 1923.2 MWh. The total peak loss
reduction is 1280.0 kW (1161.1 kW for line and 118.9 kW for no-load). Average feeder energy
losses are 2.33% for Plan B compared to 2.68% for the Existing Case.
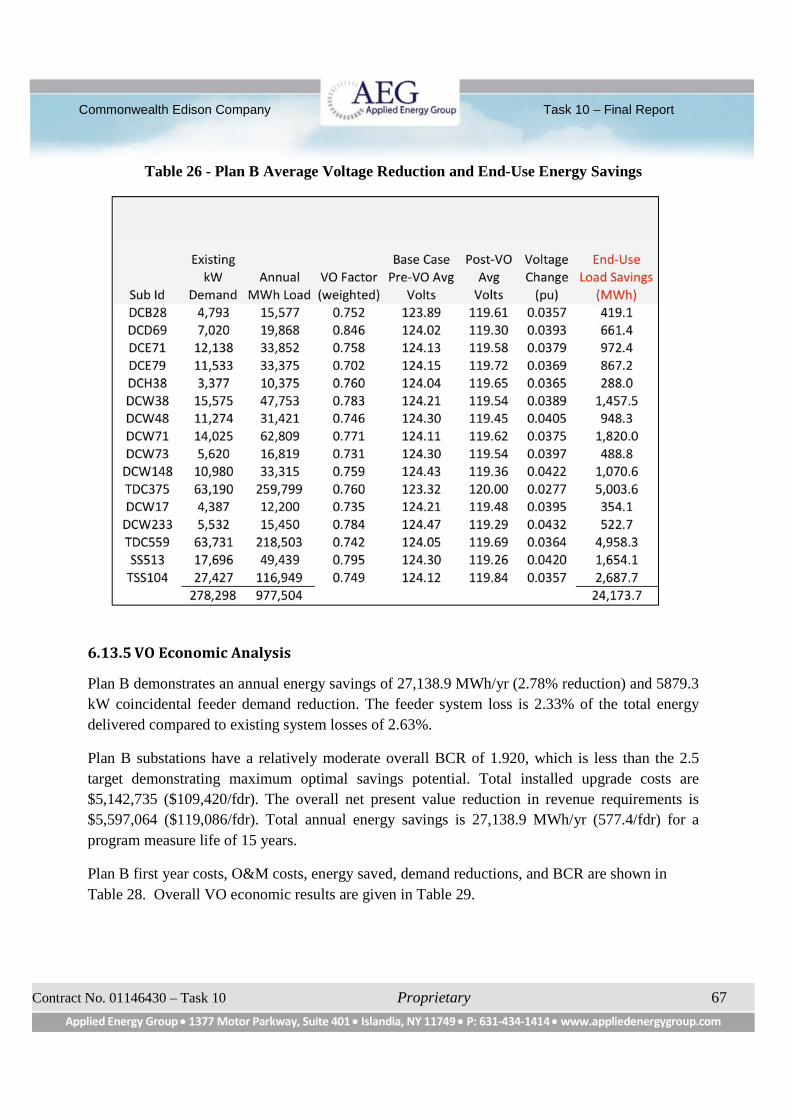
Commonwealth Edison Company Task 10 – Final Report
Contract No. 01146430 – Task 10 Proprietary 67
Applied Energy Group 1377 Motor Parkway, Suite 401 Islandia, NY 11749 P: 631-434-1414 www.appliedenergygroup.com
Table 26 - Plan B Average Voltage Reduction and End-Use Energy Savings
6.13.5 VO Economic Analysis
Plan B demonstrates an annual energy savings of 27,138.9 MWh/yr (2.78% reduction) and 5879.3
kW coincidental feeder demand reduction. The feeder system loss is 2.33% of the total energy
delivered compared to existing system losses of 2.63%.
Plan B substations have a relatively moderate overall BCR of 1.920, which is less than the 2.5
target demonstrating maximum optimal savings potential. Total installed upgrade costs are
$5,142,735 ($109,420/fdr). The overall net present value reduction in revenue requirements is
$5,597,064 ($119,086/fdr). Total annual energy savings is 27,138.9 MWh/yr (577.4/fdr) for a
program measure life of 15 years.
Plan B first year costs, O&M costs, energy saved, demand reductions, and BCR are shown in
Table 28. Overall VO economic results are given in Table 29.
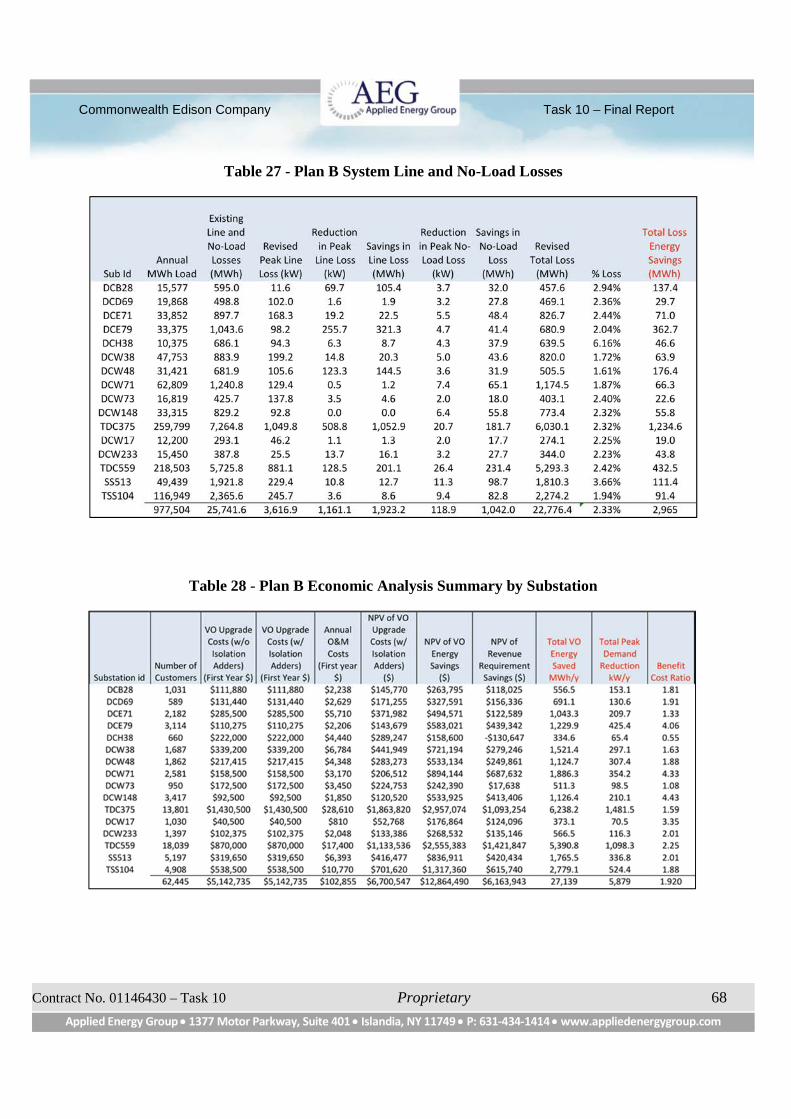
Commonwealth Edison Company Task 10 – Final Report
Contract No. 01146430 – Task 10 Proprietary 68
Applied Energy Group 1377 Motor Parkway, Suite 401 Islandia, NY 11749 P: 631-434-1414 www.appliedenergygroup.com
Table 27 - Plan B System Line and No-Load Losses
Table 28 - Plan B Economic Analysis Summary by Substation
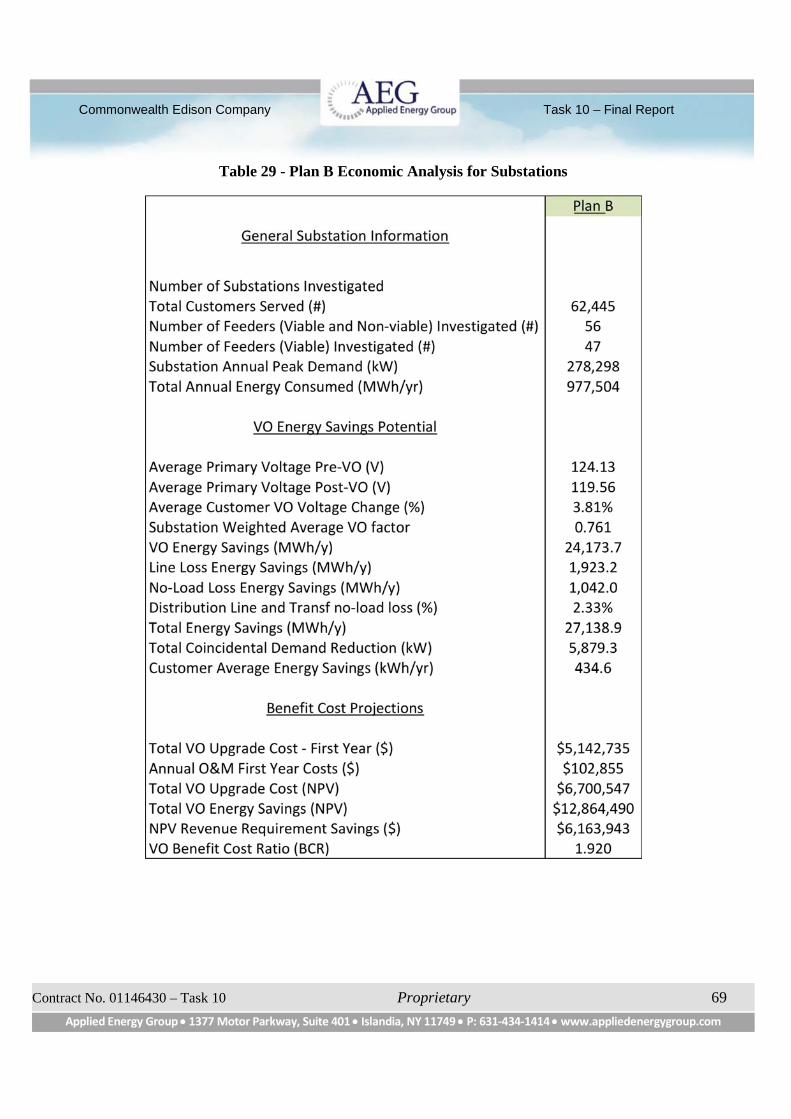
Commonwealth Edison Company Task 10 – Final Report
Contract No. 01146430 – Task 10 Proprietary 69
Applied Energy Group 1377 Motor Parkway, Suite 401 Islandia, NY 11749 P: 631-434-1414 www.appliedenergygroup.com
Table 29 - Plan B Economic Analysis for Substations
____
Commonwealth Edison Company Task 10 – Final Report
Contract No. 01146430 – Task 10 Proprietary 70
Applied Energy Group 1377 Motor Parkway, Suite 401 Islandia, NY 11749 P: 631-434-1414 www.appliedenergygroup.com
6.14 Comparison of Alternative VO Plans
6.14.1 Economic Evaluation Analysis Methodology
The objective of the VO economic evaluations9 was to identify solutions that maximize energy
savings while meeting acceptable VO thresholds and ComEd BCR targets. As more system
improvements were added, incremental energy saved diminished, resulting in lower BCRs. The
economic analysis assumes no incentives are applied to ComEd first-year costs. The equipment
life of 33 years is considered short, which also lowers the BCR.
The net present value of savings (reduced revenue requirements) is another consideration when
comparing alternative plans. If net PV savings are zero, the BCR is 1.0, resulting in no change in
net revenue requirements. The alternative plan development goal is to have BCRs greater than 1.5
to provide a cushion for possible inflation and financial risk (i.e., higher improvement costs,
lower marginal costs, and higher inflation rates).
Net PV system improvement estimates include first year investment costs; net present value of
annual fixed charges and O&M expenses; expected future equipment salvage; present worth value
investment factors; and inflation rates. The energy efficiency measure (EEM) program life is
assumed to be 15 years based on the NWPCC Simplified VO M&V Protocol. The VO savings life
is 15 years, and the system improvement loss saving measure equipment life is set at 33 years.
However, the VO energy savings measure program life can be extended (e.g., 20 years) if costs
are added in a future year (e.g., at year 10 and 20) as a percentage of first year investment costs.
In this study, the VO life is set at 15 years. A lump sum cost adder is included in year 10 costs,
assuming 10% of the initial installed cost is needed to maintain the installation and sustain the
annual savings. All system loss savings benefits and investment costs beyond the program life of
15 years are discounted and credited in the 15th year.
The avoided marginal cost of purchased power is assumed to be $0.042/kWh for the base year
(2014) with an energy cost inflation rate of 3.0% per year thereafter.
9The detailed economic analysis was performed using economic principles described in D. G. Newnan, T. G.
Eschenbach, J. P. Lavelle, Engineering Economic Analysis, Ninth Edition, Oxford University Press, Inc., New York,2004.
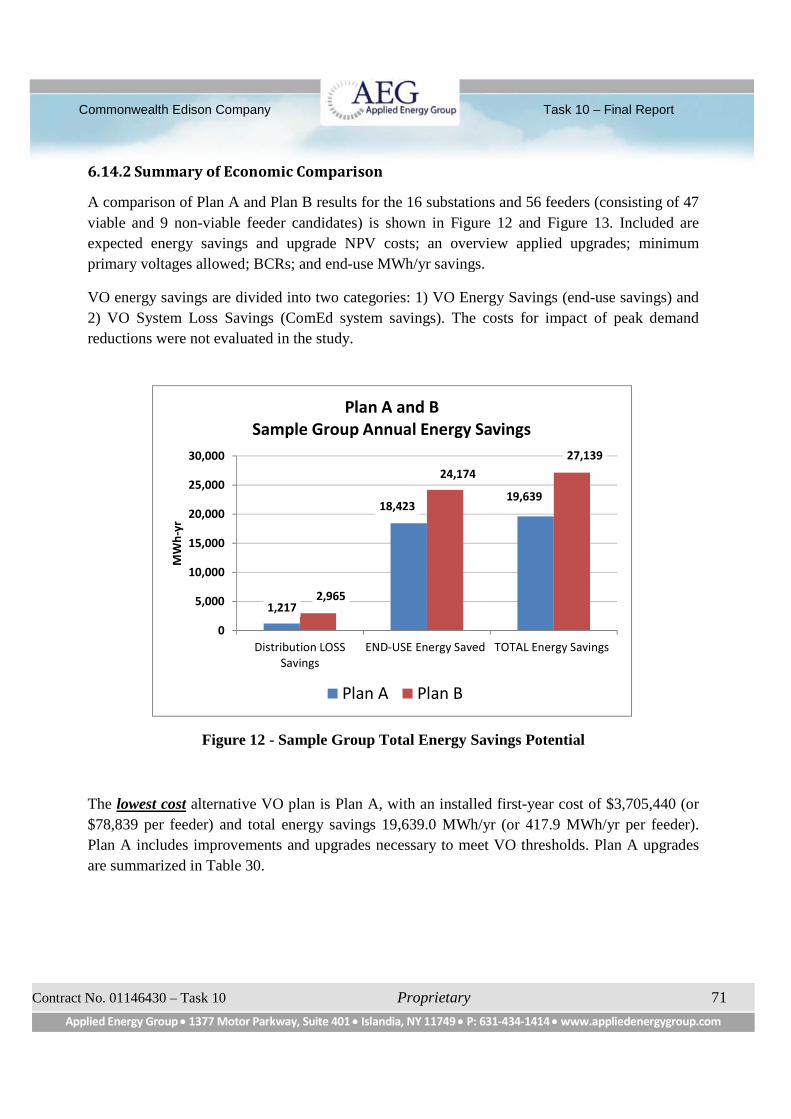
Commonwealth Edison Company Task 10 – Final Report
Contract No. 01146430 – Task 10 Proprietary 71
Applied Energy Group 1377 Motor Parkway, Suite 401 Islandia, NY 11749 P: 631-434-1414 www.appliedenergygroup.com
6.14.2 Summary of Economic Comparison
A comparison of Plan A and Plan B results for the 16 substations and 56 feeders (consisting of 47
viable and 9 non-viable feeder candidates) is shown in Figure 12 and Figure 13. Included are
expected energy savings and upgrade NPV costs; an overview applied upgrades; minimum
primary voltages allowed; BCRs; and end-use MWh/yr savings.
VO energy savings are divided into two categories: 1) VO Energy Savings (end-use savings) and
2) VO System Loss Savings (ComEd system savings). The costs for impact of peak demand
reductions were not evaluated in the study.
Figure 12 - Sample Group Total Energy Savings Potential
The lowest cost alternative VO plan is Plan A, with an installed first-year cost of $3,705,440 (or
$78,839 per feeder) and total energy savings 19,639.0 MWh/yr (or 417.9 MWh/yr per feeder).
Plan A includes improvements and upgrades necessary to meet VO thresholds. Plan A upgrades
are summarized in Table 30.
1,217
18,42319,639
2,965
24,174
27,139
0
5,000
10,000
15,000
20,000
25,000
30,000
Distribution LOSSSavings
END-USE Energy Saved TOTAL Energy Savings
MW
h-y
r
Plan A and BSample Group Annual Energy Savings
Plan A Plan B
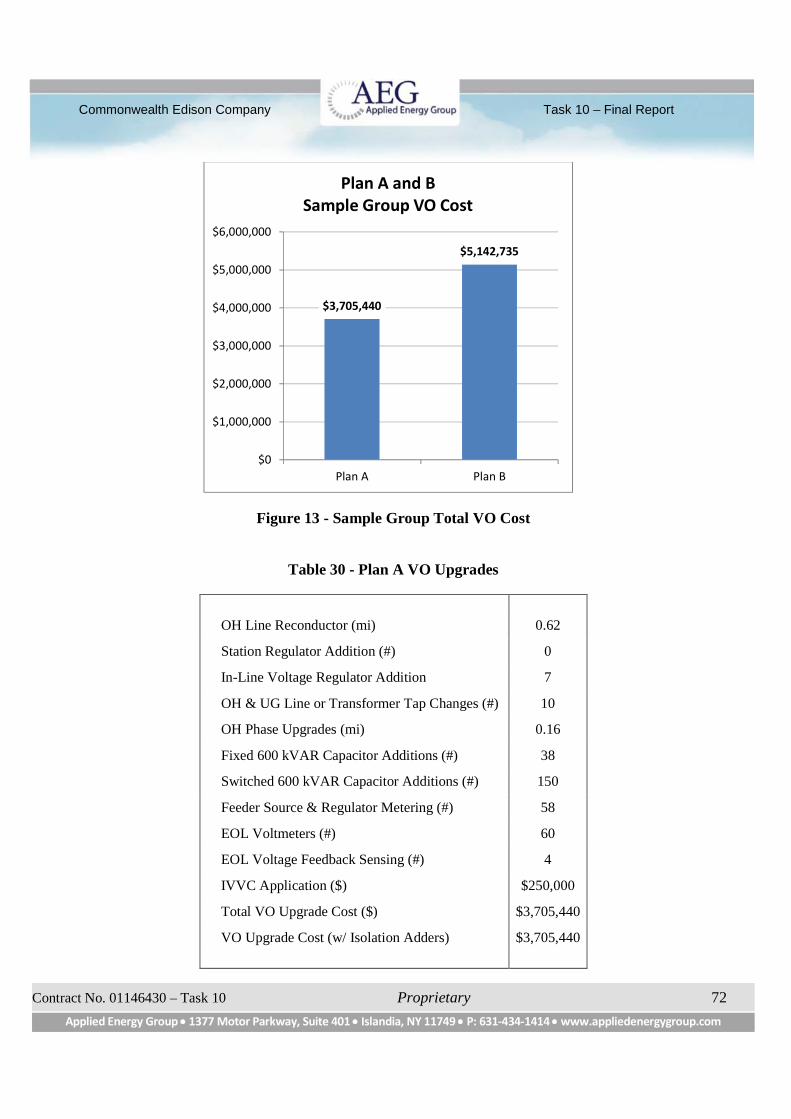
Commonwealth Edison Company Task 10 – Final Report
Contract No. 01146430 – Task 10 Proprietary 72
Applied Energy Group 1377 Motor Parkway, Suite 401 Islandia, NY 11749 P: 631-434-1414 www.appliedenergygroup.com
Figure 13 - Sample Group Total VO Cost
Table 30 - Plan A VO Upgrades
OH Line Reconductor (mi) 0.62
Station Regulator Addition (#) 0
In-Line Voltage Regulator Addition 7
OH & UG Line or Transformer Tap Changes (#) 10
OH Phase Upgrades (mi) 0.16
Fixed 600 kVAR Capacitor Additions (#) 38
Switched 600 kVAR Capacitor Additions (#) 150
Feeder Source & Regulator Metering (#) 58
EOL Voltmeters (#) 60
EOL Voltage Feedback Sensing (#) 4
IVVC Application ($) $250,000
Total VO Upgrade Cost ($) $3,705,440
VO Upgrade Cost (w/ Isolation Adders) $3,705,440
$3,705,440
$5,142,735
$0
$1,000,000
$2,000,000
$3,000,000
$4,000,000
$5,000,000
$6,000,000
Plan A Plan B
Plan A and BSample Group VO Cost
Commonwealth Edison Company Task 10 – Final Report
Contract No. 01146430 – Task 10 Proprietary 73
Applied Energy Group 1377 Motor Parkway, Suite 401 Islandia, NY 11749 P: 631-434-1414 www.appliedenergygroup.com
Plan A system was designed for minimum primary EOL voltages of 120.0 volts. The overall
evaluated BCR is 1.928, with average customer energy savings of 314.5 kWh per year.
The highest energy saving alternative VO plan studied is Plan B, with an installed cost of
$5,142,735 (or $109,420 per feeder) and total energy savings 27,138.9 MWh/yr (or 577.4
MWh/yr per feeder). Plan B has the same system improvements as Plan A plus additional
upgrades as needed. Plan B upgrades are summarized in Table 31.
Plan B is designed for minimum primary EOL voltages of 119.0 volts. The overall evaluated BCR
is 1.920, with customer average savings of 434.6 kWh per year.
6.14.3 Plan A and Plan B Summary Comparison
Table 32 compares Plan A and Plan B general substation/feeder information, VO energy savingspotential, and benefit cost projections.
Plan A benefits and costs for use with energy efficiency measure initiatives are given for VO
Energy Savings (end-use savings) and VO System Loss Savings (ComEd system savings) as
follows:
VO Energy Saving: 17,675.1 kWh/yr, $370,544 cost, $11,117 OM cost, and 15-year life.
VO Loss Saving: 1,963.9 kWh/yr, $3,334,896 cost, $100,046 OM cost, and 33-year life.
Totals: 19,639.0 $3,705,440 $111,163
Plan B benefits and costs for use with energy efficiency measure initiatives are given for VO
Energy Savings (end-use savings) and VO System Loss Savings (ComEd system savings) as
follows:
VO Energy Saving: 24,425.0 kWh/yr, $514,220 cost, $15,427 OM cost, and 15-year life.
VO Loss Saving: 2,713.9 kWh/yr, $4,628,515 cost, $138,855 OM cost, and 33-year life.
Totals: 27,138.9 $5,142,735 $154,282
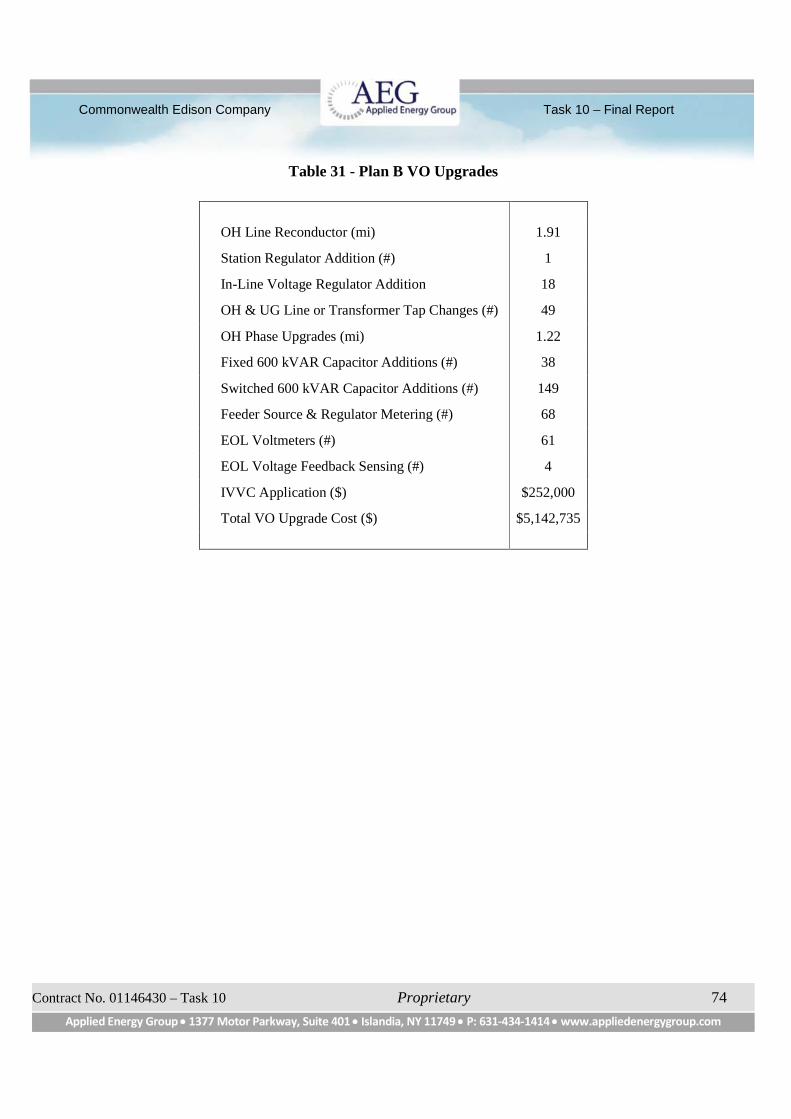
Commonwealth Edison Company Task 10 – Final Report
Contract No. 01146430 – Task 10 Proprietary 74
Applied Energy Group 1377 Motor Parkway, Suite 401 Islandia, NY 11749 P: 631-434-1414 www.appliedenergygroup.com
Table 31 - Plan B VO Upgrades
OH Line Reconductor (mi) 1.91
Station Regulator Addition (#) 1
In-Line Voltage Regulator Addition 18
OH & UG Line or Transformer Tap Changes (#) 49
OH Phase Upgrades (mi) 1.22
Fixed 600 kVAR Capacitor Additions (#) 38
Switched 600 kVAR Capacitor Additions (#) 149
Feeder Source & Regulator Metering (#) 68
EOL Voltmeters (#) 61
EOL Voltage Feedback Sensing (#) 4
IVVC Application ($) $252,000
Total VO Upgrade Cost ($) $5,142,735
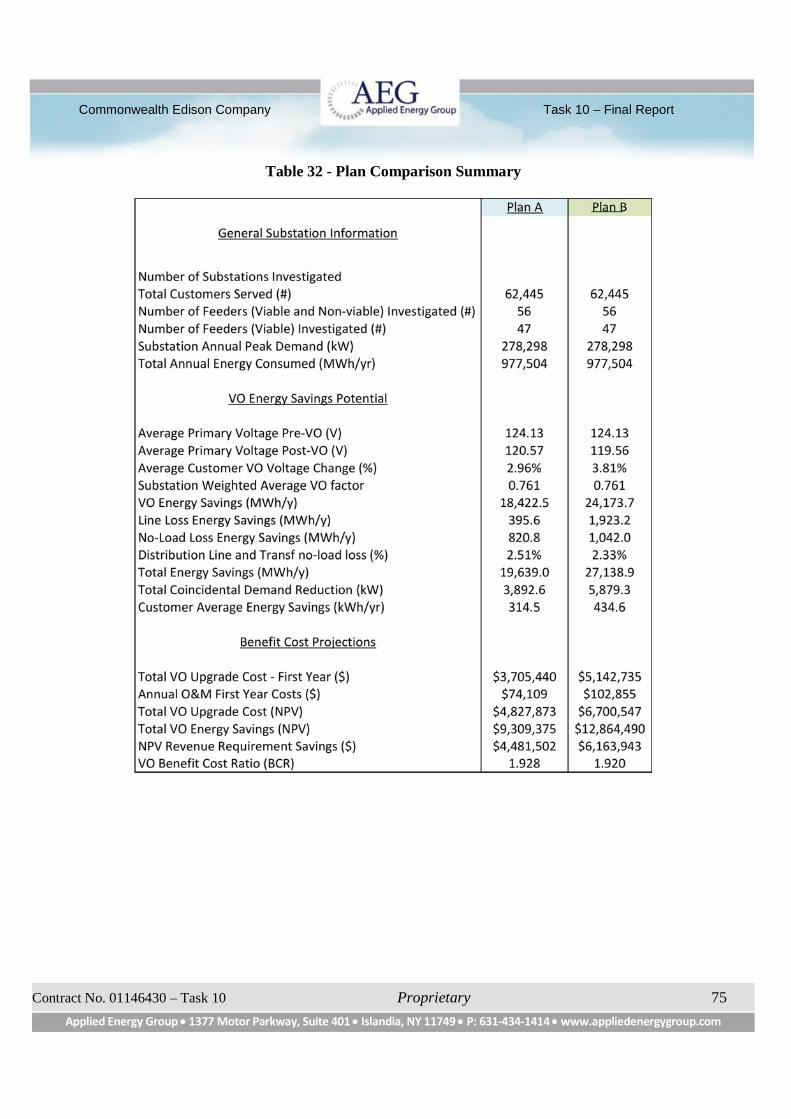
Commonwealth Edison Company Task 10 – Final Report
Contract No. 01146430 – Task 10 Proprietary 75
Applied Energy Group 1377 Motor Parkway, Suite 401 Islandia, NY 11749 P: 631-434-1414 www.appliedenergygroup.com
Table 32 - Plan Comparison Summary
____
Commonwealth Edison Company Task 10 – Final Report
Contract No. 01146430 – Task 10 Proprietary 76
Applied Energy Group 1377 Motor Parkway, Suite 401 Islandia, NY 11749 P: 631-434-1414 www.appliedenergygroup.com
7. Extrapolation to System Level
A primary objective of the feasibility study was to develop accurate and defendable estimates of
VO cost and energy savings potential. The research plan accomplished this through a multi-stage
analysis that applied formula-based engineering to a study group based on feeder-specific load
flow simulations on a representative sample of feeders. Sampling statistics were then used to
extrapolate the results to the system level.
7.1 Project Study Groups
The feasibility study conducted an engineering analysis of individual feeders and substation
groups. From a sample design perspective, VO costs and savings were evaluated at the feeder
level using the four key project groups described below.
Group 1 - ComEd System Population. The ComEd system population is defined as the total
number of primary network feeders and associated substations within ComEd’s service territory,
and is composed of 5655 feeders fed from 806 substations. Specifically excluded are 129
secondary networks in the downtown Chicago area deemed not appropriate for voltage
optimization. The system population was developed based on data provided by ComEd’s
Distribution Planning Group. Individual feeder and substation data was derived primarily from
ComEd’s CYME and GIS databases.
Group 2 - Project Study Group. The project study group is a subset of feeders and substations
included in the analysis. The study group consists of 3757 feeders and 543 substations, which is
approximately two-thirds of the total system population. Not all feeders/substations were
included; i.e., 1898 feeders and 264 substations were excluded. Five (5) of 19 initially selected
ComEd regions were excluded due to unexpected data issues and project time constraints. In
addition, feeders from the included 14 regions were excluded due to data issues. It was assumed
these excluded feeders are adequately represented by feeders included in the study group.
Group 3 - Viable Feeder Study Group. The Task 3 screening analysis was conducted on all
3757 feeders of the project study group. Of these, 1837 were deemed non-viable for VO
application due to their voltage class (less than 11 kV or higher than 29 kV), or customer make-up
(large commercial and industrial >1000 kW). The remaining 1920 feeders and 543 substations
make up the viable feeder study group. Preliminary VO costs and savings based on formula-
based engineering analysis were developed for each of these feeders as documented in the project
Task 3 report.
Group 4 - Sample Group. The sample group identified in Task 3 (screening) consisted of 16
substations and 70 feeders (50 viable and 20 non-viable). A later assessment reduced the total
number of feeders from 70 to 61 as explained below.
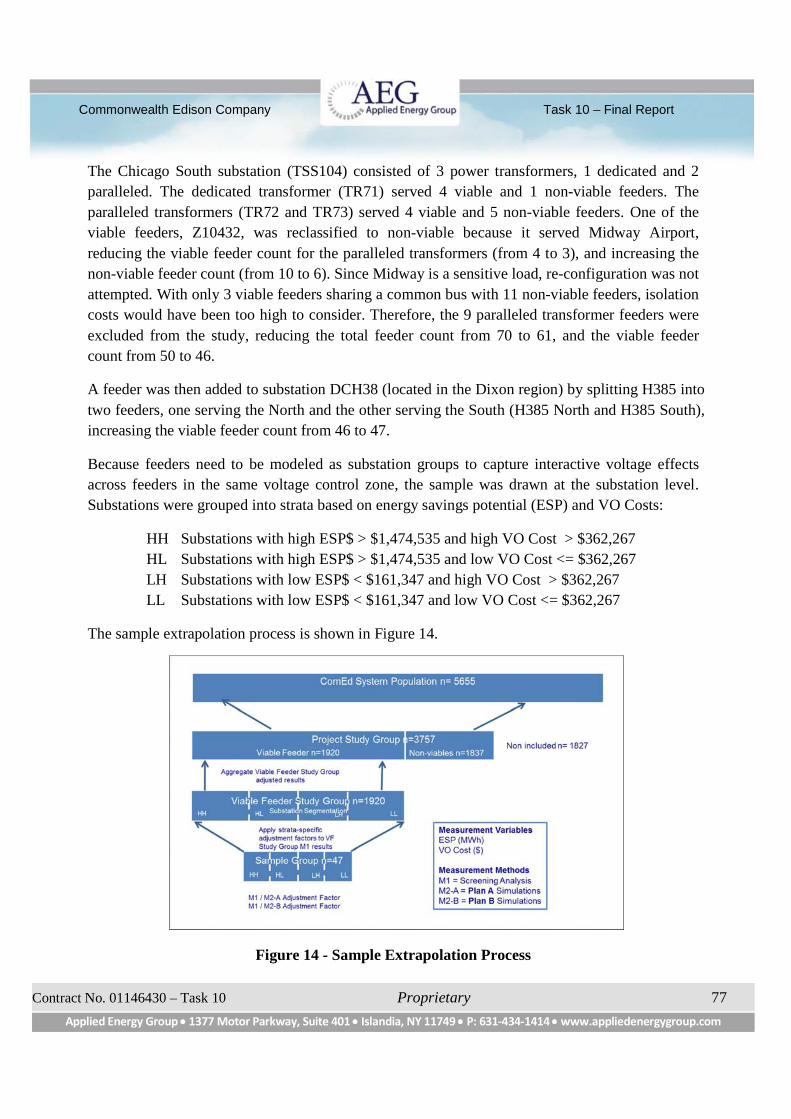
Commonwealth Edison Company Task 10 – Final Report
Contract No. 01146430 – Task 10 Proprietary 77
Applied Energy Group 1377 Motor Parkway, Suite 401 Islandia, NY 11749 P: 631-434-1414 www.appliedenergygroup.com
The Chicago South substation (TSS104) consisted of 3 power transformers, 1 dedicated and 2
paralleled. The dedicated transformer (TR71) served 4 viable and 1 non-viable feeders. The
paralleled transformers (TR72 and TR73) served 4 viable and 5 non-viable feeders. One of the
viable feeders, Z10432, was reclassified to non-viable because it served Midway Airport,
reducing the viable feeder count for the paralleled transformers (from 4 to 3), and increasing the
non-viable feeder count (from 10 to 6). Since Midway is a sensitive load, re-configuration was not
attempted. With only 3 viable feeders sharing a common bus with 11 non-viable feeders, isolation
costs would have been too high to consider. Therefore, the 9 paralleled transformer feeders were
excluded from the study, reducing the total feeder count from 70 to 61, and the viable feeder
count from 50 to 46.
A feeder was then added to substation DCH38 (located in the Dixon region) by splitting H385 into
two feeders, one serving the North and the other serving the South (H385 North and H385 South),
increasing the viable feeder count from 46 to 47.
Because feeders need to be modeled as substation groups to capture interactive voltage effects
across feeders in the same voltage control zone, the sample was drawn at the substation level.
Substations were grouped into strata based on energy savings potential (ESP) and VO Costs:
HH Substations with high ESP$ > $1,474,535 and high VO Cost > $362,267
HL Substations with high ESP$ > $1,474,535 and low VO Cost <= $362,267
LH Substations with low ESP$ < $161,347 and high VO Cost > $362,267
LL Substations with low ESP$ < $161,347 and low VO Cost <= $362,267
The sample extrapolation process is shown in Figure 14.
Figure 14 - Sample Extrapolation Process
Commonwealth Edison Company Task 10 – Final Report
Contract No. 01146430 – Task 10 Proprietary 78
Applied Energy Group 1377 Motor Parkway, Suite 401 Islandia, NY 11749 P: 631-434-1414 www.appliedenergygroup.com
7.2 VO Estimation Methods
The research plan used a sample-based two-stage estimation procedure. First, simplified cost and
savings estimates were developed using a formulaic engineering analysis on all viable feeders in
the study group (referred to as Method 1 or M1). Next, detailed load flow simulations and
customized cost build-ups were performed on a representative sample of substation feeder groups
(Method 2, or M2).
Three scenarios were modeled: a) Base Case; b) Low Cost (M2-A) (Plan A); and c) Maximum
Energy Savings (M2-B) (Plan B). The two study groups are directly linked through a stratified
random sampling approach of substation feeder groups and expanded to the population of viable
feeders using a statistical ratio estimate. This sample design allows for extrapolation of M1 and
M2 results to the ComEd system level with quantifiable levels of precision.
7.3 System Level Results
Summarized in Table 33 are system-level results for VO costs and ESP (MWh-yr). The lower
cost scenario (Plan A) VO approach has a potential total cost of $425 million and results in
energy savings of 1350 GWh per year. This is equivalent to a levelized cost of energy of
$0.035/kWh. The maximum savings scenario approach (Plan B) has a total cost of $574 million
and a savings potential of 1,912 GWh per year, or approximately 2.1% of ComEd’s 2013 retail
kWh sales.
Table 34 summarizes the relative precision of the sample-based M2-A and M2-B results
extrapolated to the system population. The relative precision is calculated at a 90% confidence
level. The precision estimates refer to the sampling error of performing the detailed M2
methodology on only a sample of 47 feeders as compared to results that would have been
achieved had we performed the detailed M2 methodology on all 2,890 viable feeders in the
ComEd population. It does not factor in the measurement error of the M2 simulation
methodology compared to actual field observations.
Table 35 provides feeder-based extrapolation values resulting from sample group, study group
and system population extrapolations. Table 36 provides similar extrapolations results based on
substation values. (See Appendix 12.1 for a prioritized ranking of all 346 viable substations
based on benefit-cost ratios.)
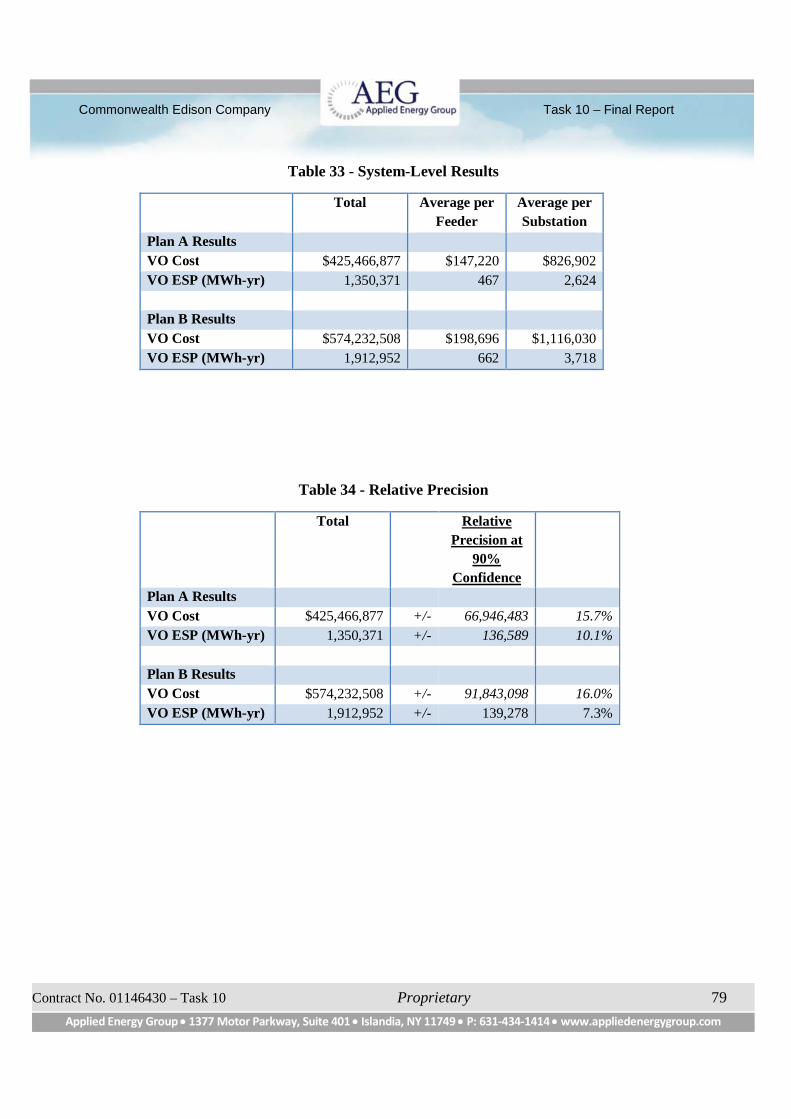
Commonwealth Edison Company Task 10 – Final Report
Contract No. 01146430 – Task 10 Proprietary 79
Applied Energy Group 1377 Motor Parkway, Suite 401 Islandia, NY 11749 P: 631-434-1414 www.appliedenergygroup.com
Table 33 - System-Level Results
Total Average per
Feeder
Average per
Substation
Plan A Results
VO Cost $425,466,877 $147,220 $826,902
VO ESP (MWh-yr) 1,350,371 467 2,624
Plan B Results
VO Cost $574,232,508 $198,696 $1,116,030
VO ESP (MWh-yr) 1,912,952 662 3,718
Table 34 - Relative Precision
Total Relative
Precision at
90%
Confidence
Plan A Results
VO Cost $425,466,877 +/- 66,946,483 15.7%
VO ESP (MWh-yr) 1,350,371 +/- 136,589 10.1%
Plan B Results
VO Cost $574,232,508 +/- 91,843,098 16.0%
VO ESP (MWh-yr) 1,912,952 +/- 139,278 7.3%
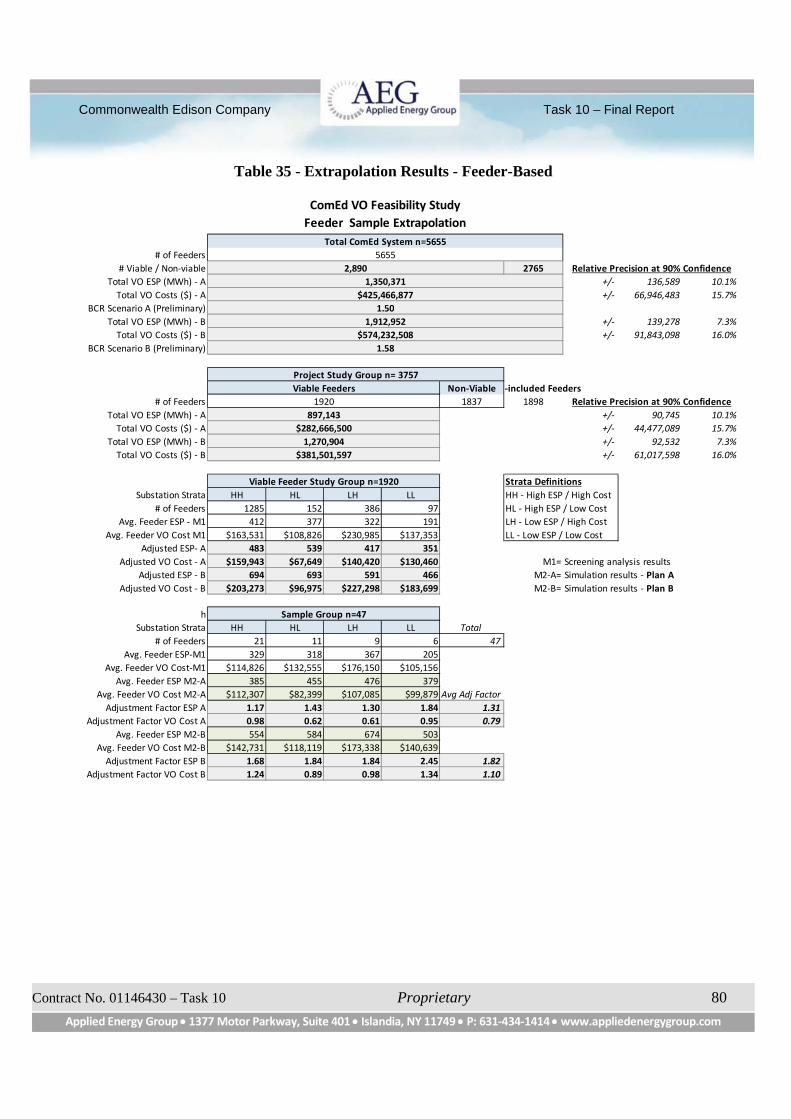
Commonwealth Edison Company Task 10 – Final Report
Contract No. 01146430 – Task 10 Proprietary 80
Applied Energy Group 1377 Motor Parkway, Suite 401 Islandia, NY 11749 P: 631-434-1414 www.appliedenergygroup.com
Table 35 - Extrapolation Results - Feeder-Based
# of Feeders
# Viable / Non-viable 2765 Relative Precision at 90% Confidence
Total VO ESP (MWh) - A +/- 136,589 10.1%
Total VO Costs ($) - A +/- 66,946,483 15.7%
BCR Scenario A (Preliminary)
Total VO ESP (MWh) - B +/- 139,278 7.3%
Total VO Costs ($) - B +/- 91,843,098 16.0%
BCR Scenario B (Preliminary)
Non-ViableNon-included Feeders
# of Feeders 1837 1898 Relative Precision at 90% Confidence
Total VO ESP (MWh) - A +/- 90,745 10.1%
Total VO Costs ($) - A +/- 44,477,089 15.7%
Total VO ESP (MWh) - B +/- 92,532 7.3%
Total VO Costs ($) - B +/- 61,017,598 16.0%
Strata Definitions
Substation Strata HH HL LH LL HH - High ESP / High Cost
# of Feeders 1285 152 386 97 HL - High ESP / Low Cost
Avg. Feeder ESP - M1 412 377 322 191 LH - Low ESP / High Cost
Avg. Feeder VO Cost M1 $163,531 $108,826 $230,985 $137,353 LL - Low ESP / Low Cost
Adjusted ESP- A 483 539 417 351
Adjusted VO Cost - A $159,943 $67,649 $140,420 $130,460 M1= Screening analysis results
Adjusted ESP - B 694 693 591 466 M2-A= Simulation results - Plan A
Adjusted VO Cost - B $203,273 $96,975 $227,298 $183,699 M2-B= Simulation results - Plan B
h
Substation Strata HH HL LH LL Total
# of Feeders 21 11 9 6 47
Avg. Feeder ESP-M1 329 318 367 205
Avg. Feeder VO Cost-M1 $114,826 $132,555 $176,150 $105,156
Avg. Feeder ESP M2-A 385 455 476 379
Avg. Feeder VO Cost M2-A $112,307 $82,399 $107,085 $99,879 Avg Adj Factor
Adjustment Factor ESP A 1.17 1.43 1.30 1.84 1.31
Adjustment Factor VO Cost A 0.98 0.62 0.61 0.95 0.79
Avg. Feeder ESP M2-B 554 584 674 503
Avg. Feeder VO Cost M2-B $142,731 $118,119 $173,338 $140,639
Adjustment Factor ESP B 1.68 1.84 1.84 2.45 1.82
Adjustment Factor VO Cost B 1.24 0.89 0.98 1.34 1.10
1,912,952
$381,501,597
Viable Feeder Study Group n=1920
Sample Group n=47
2,890
$282,666,500
1,270,904
$574,232,508
1.50
1.58
Project Study Group n= 3757
Viable Feeders
1920
897,143
ComEd VO Feasibility Study
Feeder Sample Extrapolation
Total ComEd System n=5655
5655
1,350,371
$425,466,877

Commonwealth Edison Company Task 10 – Final Report
Contract No. 01146430 – Task 10 Proprietary 81
Applied Energy Group 1377 Motor Parkway, Suite 401 Islandia, NY 11749 P: 631-434-1414 www.appliedenergygroup.com
Table 36 - Extrapolation Results - Substation-Based
7.4 Factors Affecting Potential Results
The results presented in this study were generated using ComEd supplied data sources combined
with a variety of industry accepted engineering calculations, statistical methods, commercial load
flow modeling tools (CYME), and professional judgment. At every juncture, care was taken to
ensure that the results from the study are both representative of the ComEd system, and unbiased.
Table 37 provides a qualitative sensitivity analysis of the key parameters or methods used in the
study.
# of Substations
# Viable / Non-viable 291 Relative Precision at 90% Confidence
Total VO ESP (MWh) - A +/- 210,902 16.0%
Total VO Costs ($) - A +/- 50,583,681 12.0%
BCR Scenario A (Preliminary)
Total VO ESP (MWh) - B +/- 215,012 11.6%
Total VO Costs ($) - B +/- 49,938,781 8.8%
BCR Scenario B (Preliminary)
Non-Viable Non-included Substations
# of Substations 196 264 Relative Precision at 90% Confidence
Total VO ESP (MWh) - A +/- 141,823 16.0%
Total VO Costs ($) - A +/- 34,015,329 12.0%
Total VO ESP (MWh) - B +/- 144,586 11.6%
Total VO Costs ($) - B +/- 33,581,662 8.8%
Strata Definitions
Substation Strata HH HL LH LL HH - High ESP / High Cost
# of Substations 86 86 87 87 HL - High ESP / Low Cost
Avg. Feeder ESP - M1 6153 667 1427 212 LH - Low ESP / High Cost
Avg. Feeder VO Cost M1 $2,443,459 $192,343 $1,024,830 $153,140 LL - Low ESP / Low Cost
Adjusted ESP- A 7199 919 1851 294
Adjusted VO Cost - A $2,389,849 $130,175 $623,014 $145,455 M1= Screening analysis results
Adjusted ESP - B 10359 1148 2622 389 M2-A= Simulation results - Plan A
Adjusted VO Cost - B $3,037,275 $177,401 $1,008,471 $204,813 M2-B= Simulation results - Plan B
Substation Strata HH HL LH LL Total
# of Substations 2 6 3 5 16
Avg. Feeder ESP-M1 3454 632 1100 246
Avg. Feeder VO Cost-M1 $1,205,672 $250,140 $528,450 $126,188
Avg. Feeder ESP M2-A 4041 871 1427 341
Avg. Feeder VO Cost M2-A $1,179,220 $169,292 $321,255 $119,855 Avg Adj Factor
Adjustment Factor ESP A 1.17 1.38 1.30 1.38 1.25
Adjustment Factor VO Cost A 0.98 0.68 0.61 0.95 0.79
Avg. Feeder ESP M2-B 5815 1087 2022 451
Avg. Feeder VO Cost M2-B $1,498,678 $230,708 $520,015 $168,767
Adjustment Factor ESP B 1.68 1.72 1.84 1.83 1.74
Adjustment Factor VO Cost B 1.24 0.92 0.98 1.34 1.10
Sample Group n=16
1,861,114
$568,093,150
1.55
Project Study Group n= 542
Viable Substations
346
884,782
$283,578,955
1,251,519
$382,017,974
Viable Substation Study Group n=346
1.48
515
ComEd VO Feasibility Study
Substation Sample Extrapolation
Total ComEd System n=806
806
1,315,746
$421,705,974
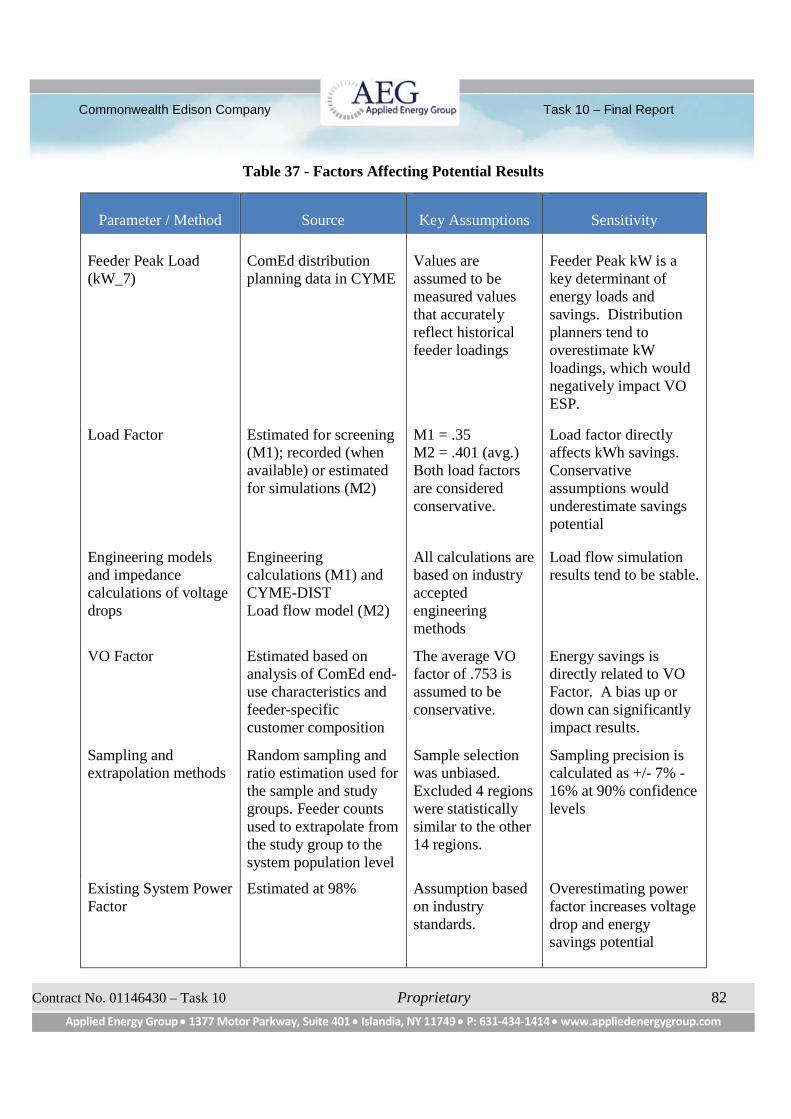
Commonwealth Edison Company Task 10 – Final Report
Contract No. 01146430 – Task 10 Proprietary 82
Applied Energy Group 1377 Motor Parkway, Suite 401 Islandia, NY 11749 P: 631-434-1414 www.appliedenergygroup.com
Table 37 - Factors Affecting Potential Results
Parameter / Method Source Key Assumptions Sensitivity
Feeder Peak Load(kW_7)
ComEd distributionplanning data in CYME
Values areassumed to bemeasured valuesthat accuratelyreflect historicalfeeder loadings
Feeder Peak kW is akey determinant ofenergy loads andsavings. Distributionplanners tend tooverestimate kWloadings, which wouldnegatively impact VOESP.
Load Factor Estimated for screening(M1); recorded (whenavailable) or estimatedfor simulations (M2)
M1 = .35M2 = .401 (avg.)Both load factorsare consideredconservative.
Load factor directlyaffects kWh savings.Conservativeassumptions wouldunderestimate savingspotential
Engineering modelsand impedancecalculations of voltagedrops
Engineeringcalculations (M1) andCYME-DISTLoad flow model (M2)
All calculations arebased on industryacceptedengineeringmethods
Load flow simulationresults tend to be stable.
VO Factor Estimated based onanalysis of ComEd end-use characteristics andfeeder-specificcustomer composition
The average VOfactor of .753 isassumed to beconservative.
Energy savings isdirectly related to VOFactor. A bias up ordown can significantlyimpact results.
Sampling andextrapolation methods
Random sampling andratio estimation used forthe sample and studygroups. Feeder countsused to extrapolate fromthe study group to thesystem population level
Sample selectionwas unbiased.Excluded 4 regionswere statisticallysimilar to the other14 regions.
Sampling precision iscalculated as +/- 7% -16% at 90% confidencelevels
Existing System PowerFactor
Estimated at 98% Assumption basedon industrystandards.
Overestimating powerfactor increases voltagedrop and energysavings potential
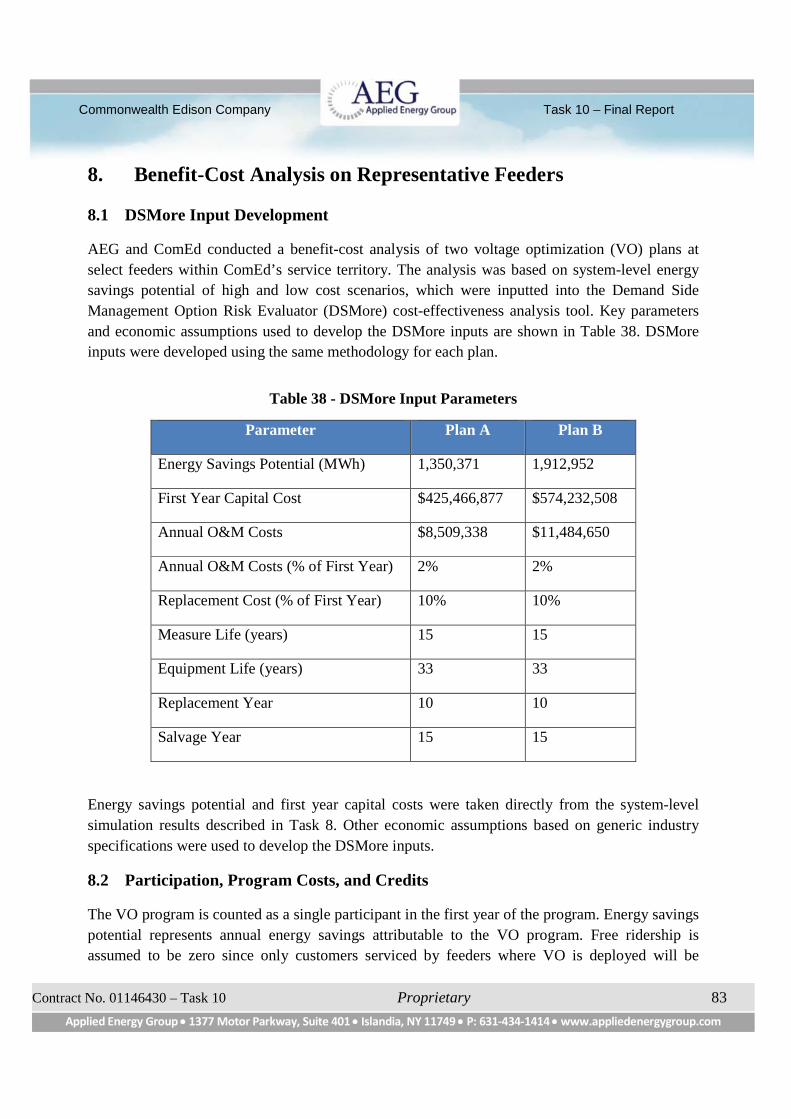
Commonwealth Edison Company Task 10 – Final Report
Contract No. 01146430 – Task 10 Proprietary 83
Applied Energy Group 1377 Motor Parkway, Suite 401 Islandia, NY 11749 P: 631-434-1414 www.appliedenergygroup.com
8. Benefit-Cost Analysis on Representative Feeders
8.1 DSMore Input Development
AEG and ComEd conducted a benefit-cost analysis of two voltage optimization (VO) plans at
select feeders within ComEd’s service territory. The analysis was based on system-level energy
savings potential of high and low cost scenarios, which were inputted into the Demand Side
Management Option Risk Evaluator (DSMore) cost-effectiveness analysis tool. Key parameters
and economic assumptions used to develop the DSMore inputs are shown in Table 38. DSMore
inputs were developed using the same methodology for each plan.
Table 38 - DSMore Input Parameters
Parameter Plan A Plan B
Energy Savings Potential (MWh) 1,350,371 1,912,952
First Year Capital Cost $425,466,877 $574,232,508
Annual O&M Costs $8,509,338 $11,484,650
Annual O&M Costs (% of First Year) 2% 2%
Replacement Cost (% of First Year) 10% 10%
Measure Life (years) 15 15
Equipment Life (years) 33 33
Replacement Year 10 10
Salvage Year 15 15
Energy savings potential and first year capital costs were taken directly from the system-level
simulation results described in Task 8. Other economic assumptions based on generic industry
specifications were used to develop the DSMore inputs.
8.2 Participation, Program Costs, and Credits
The VO program is counted as a single participant in the first year of the program. Energy savings
potential represents annual energy savings attributable to the VO program. Free ridership is
assumed to be zero since only customers serviced by feeders where VO is deployed will be
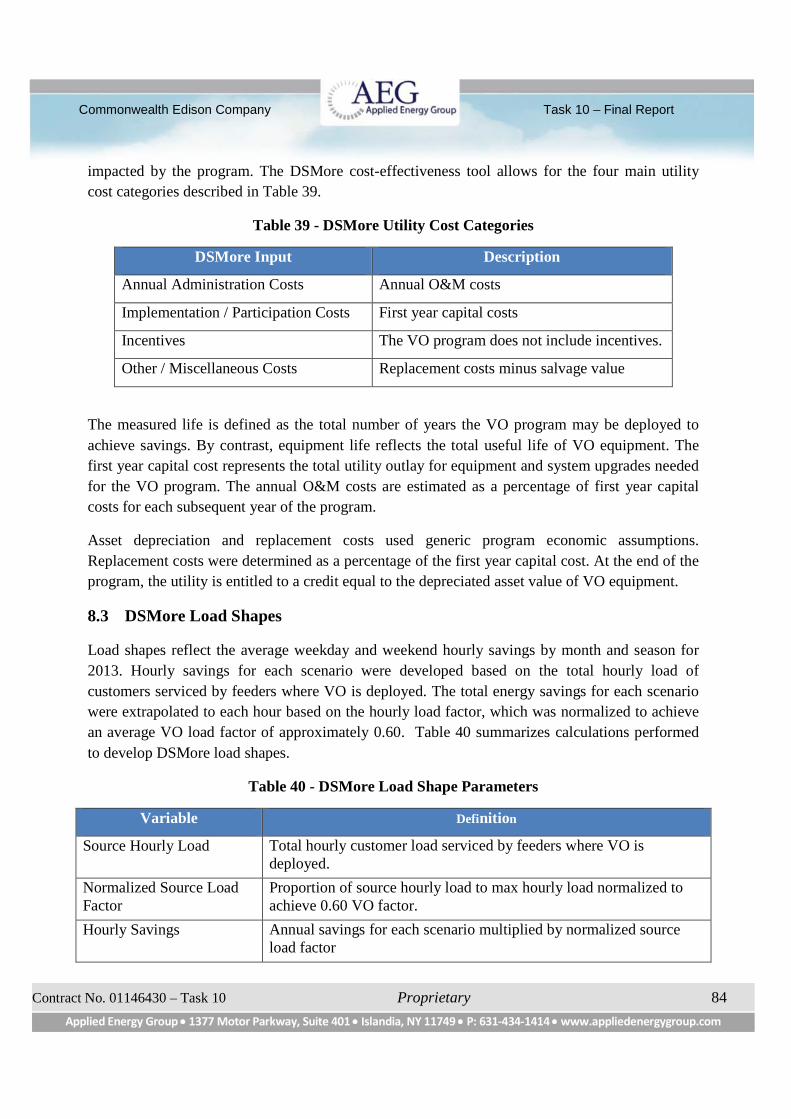
Commonwealth Edison Company Task 10 – Final Report
Contract No. 01146430 – Task 10 Proprietary 84
Applied Energy Group 1377 Motor Parkway, Suite 401 Islandia, NY 11749 P: 631-434-1414 www.appliedenergygroup.com
impacted by the program. The DSMore cost-effectiveness tool allows for the four main utility
cost categories described in Table 39.
Table 39 - DSMore Utility Cost Categories
DSMore Input Description
Annual Administration Costs Annual O&M costs
Implementation / Participation Costs First year capital costs
Incentives The VO program does not include incentives.
Other / Miscellaneous Costs Replacement costs minus salvage value
The measured life is defined as the total number of years the VO program may be deployed to
achieve savings. By contrast, equipment life reflects the total useful life of VO equipment. The
first year capital cost represents the total utility outlay for equipment and system upgrades needed
for the VO program. The annual O&M costs are estimated as a percentage of first year capital
costs for each subsequent year of the program.
Asset depreciation and replacement costs used generic program economic assumptions.
Replacement costs were determined as a percentage of the first year capital cost. At the end of the
program, the utility is entitled to a credit equal to the depreciated asset value of VO equipment.
8.3 DSMore Load Shapes
Load shapes reflect the average weekday and weekend hourly savings by month and season for
2013. Hourly savings for each scenario were developed based on the total hourly load of
customers serviced by feeders where VO is deployed. The total energy savings for each scenario
were extrapolated to each hour based on the hourly load factor, which was normalized to achieve
an average VO load factor of approximately 0.60. Table 40 summarizes calculations performed
to develop DSMore load shapes.
Table 40 - DSMore Load Shape Parameters
Variable Definition
Source Hourly Load Total hourly customer load serviced by feeders where VO isdeployed.
Normalized Source LoadFactor
Proportion of source hourly load to max hourly load normalized toachieve 0.60 VO factor.
Hourly Savings Annual savings for each scenario multiplied by normalized sourceload factor
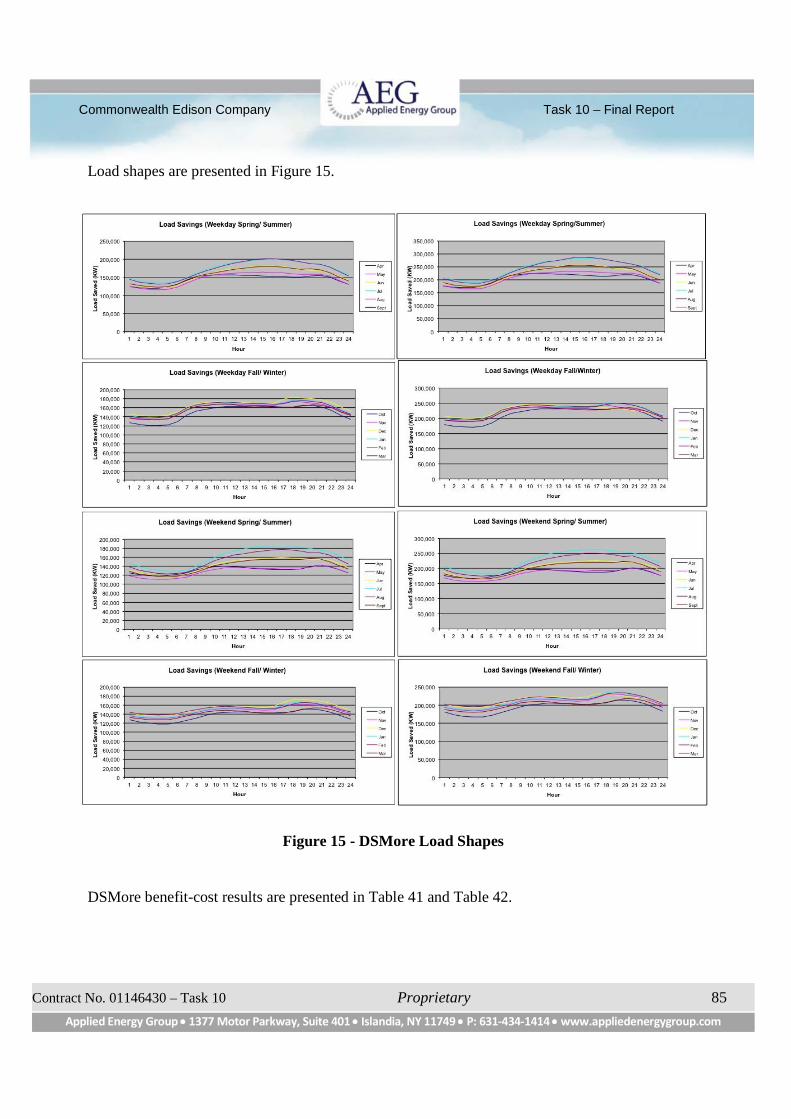
Commonwealth Edison Company Task 10 – Final Report
Contract No. 01146430 – Task 10 Proprietary 85
Applied Energy Group 1377 Motor Parkway, Suite 401 Islandia, NY 11749 P: 631-434-1414 www.appliedenergygroup.com
Load shapes are presented in Figure 15.
Figure 15 - DSMore Load Shapes
DSMore benefit-cost results are presented in Table 41 and Table 42.
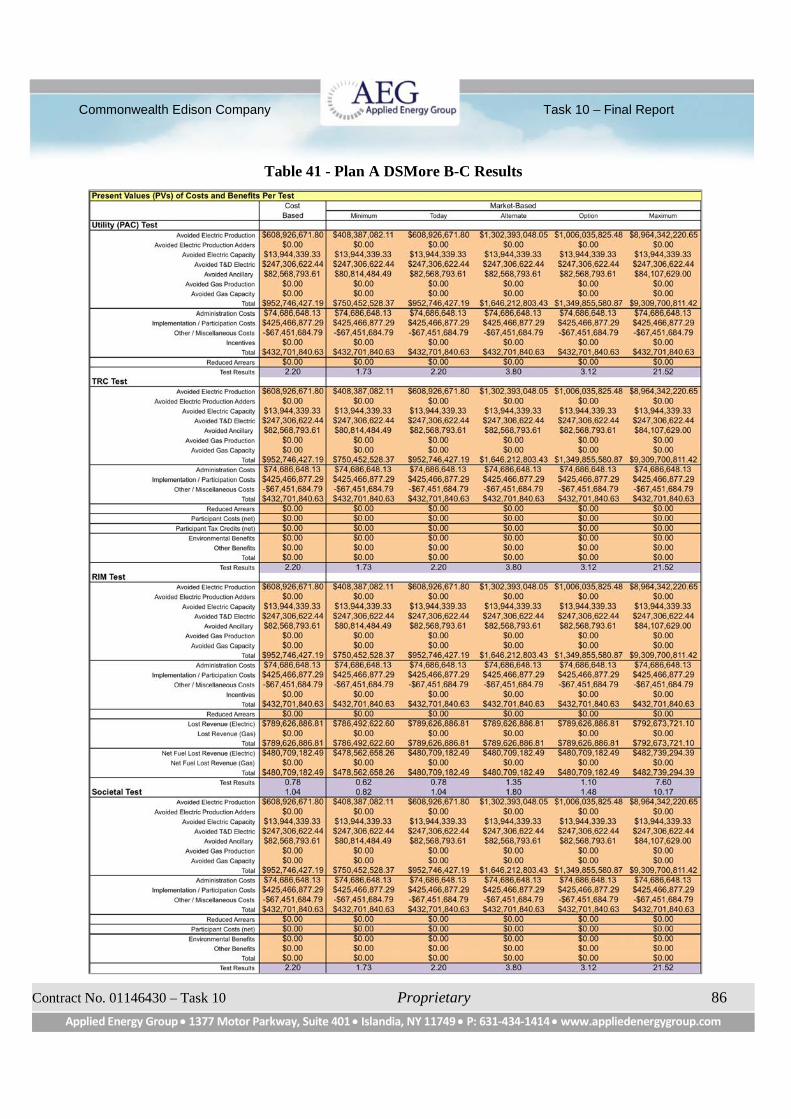
Commonwealth Edison Company Task 10 – Final Report
Contract No. 01146430 – Task 10 Proprietary 86
Applied Energy Group 1377 Motor Parkway, Suite 401 Islandia, NY 11749 P: 631-434-1414 www.appliedenergygroup.com
Table 41 - Plan A DSMore B-C Results
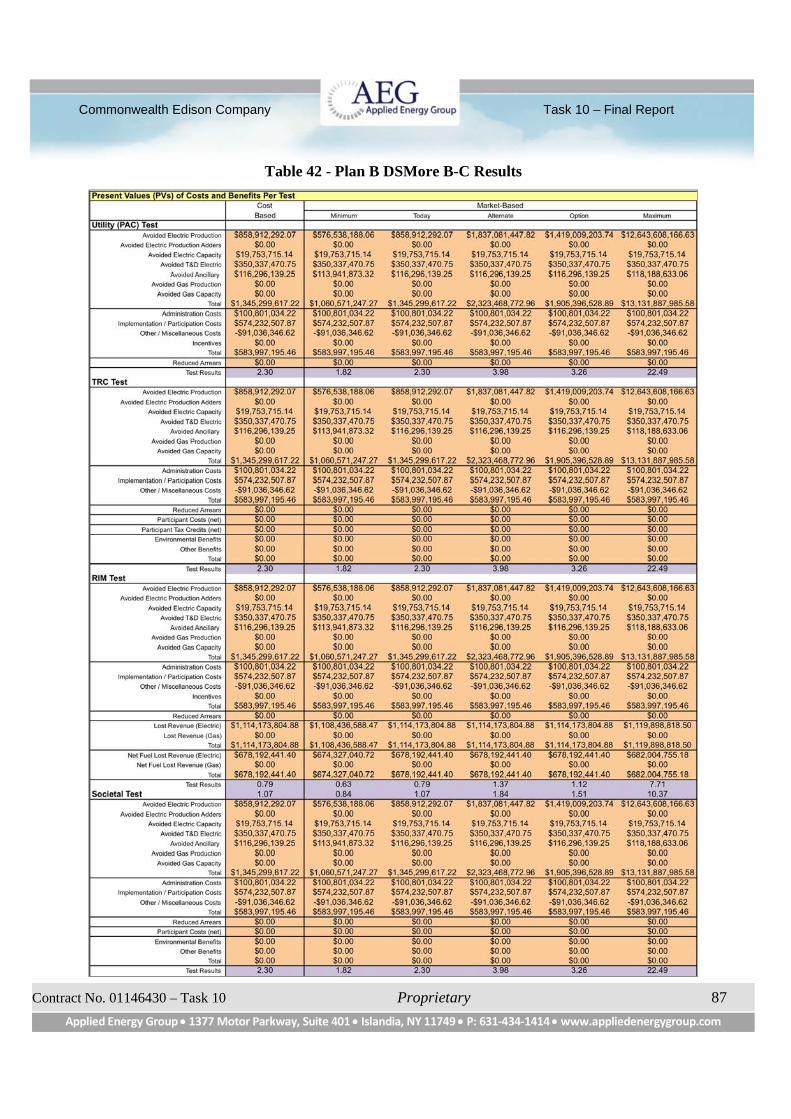
Commonwealth Edison Company Task 10 – Final Report
Contract No. 01146430 – Task 10 Proprietary 87
Applied Energy Group 1377 Motor Parkway, Suite 401 Islandia, NY 11749 P: 631-434-1414 www.appliedenergygroup.com
Table 42 - Plan B DSMore B-C Results
Commonwealth Edison Company Task 10 – Final Report
Contract No. 01146430 – Task 10 Proprietary 88
Applied Energy Group 1377 Motor Parkway, Suite 401 Islandia, NY 11749 P: 631-434-1414 www.appliedenergygroup.com
9. VO Pilot Project Recommendation
A VO pilot project is recommended to accomplish the following objectives:
a) Confirm methods used to estimate energy savings.
b) Validate residential and commercial VO factors.
c) Test voltage optimization strategies.
d) Validate LDC voltage control schemes.
e) Test EOL voltage feedback for overriding LDC controls.
f) Validate switched capacitor VAR control schemes.
g) Validate measurement and verification (M&V) protocol.
h) Test effectiveness of IVVC applications.
A pilot typically consists of at least two distribution substations with 4-to-6 feeders each, has a
mix of at least 8000 residential and 800 commercial commercials (<1000 kW each). All
substation, feeders, and EOL locations typically have primary metering for compliance and
validation testing. If available, AMI customer metering can be used to provide detailed voltage
and loading statistics.
Pre-demonstration engineering and operational characteristics include preparing single-line
diagrams of substations, feeders, voltage control zones, regulator and capacitor locations, and
large load customers. Expected feeder and VCZ maximum loadings, voltage ranges, and VAR
flows must be provided. Service area GIS mapping data and distribution load flow analysis for
each VCZ must be available. Location of meters and data available for each must be known.
Control setting parameters for LDC controllers, capacitor VAR controllers, and IVVC controls
must be available. Normal and emergency operating guidelines for VO controls, line switching,
and outage reporting must be known.
It is recommended VO controls be operated at least once each day (i.e., turned “ON” and “OFF”)
by changing the LDC settings from 119 volts (with R-settings) to 124.8 volts (with no R-settings).
Voltages should be monitored to indicate non-compliance with minimum primary voltage
requirements of 118.6 volts. Capacitor VAR control is continuously applied for both “ON” and
“OFF” operational periods.
The ideal monitoring period is two years, with assessments every three months. However, a one-
year period is acceptable, with assessments every two months. Shorter test periods make it
difficult to adequately account for the large number of small changes that occur every day and
differentiate between “real” and “noise” results. Measurements need to be made at each voltage
control zone (VCZ) source and at end-users (if AMI data is available).
Commonwealth Edison Company Task 10 – Final Report
Contract No. 01146430 – Task 10 Proprietary 89
Applied Energy Group 1377 Motor Parkway, Suite 401 Islandia, NY 11749 P: 631-434-1414 www.appliedenergygroup.com
9.1 Implementation – Comprehensive List of Typical Components
9.1.1 Distribution System Planning and Design Engineering
Pilot distribution substation and associated feeder selection
Distribution system modeling
Load flow simulations
Energy savings estimates
Distribution system upgrades
o Shunt capacitors
o Phase balancing
o Source and line voltage regulators
o Phase upgrades
o Line reconductoring
9.1.2 Distribution Equipment Specification, Procurement, and Installation
In-line voltage regulators
Fixed shunt capacitors 600 kVAR
Switched shunt capacitors 600 kVAR
Capacitor switching VAR controls with voltage backup override
Capacitor Volt-VAR sensing/metering
EOL feedback communication interfaced to IVVC and/or LDC controllers
LDC controllers for power transformers
LDC controllers for in-line voltage regulators
IVVC controllers at substations having one or more isolated feeders
IVVC communication interfaced with station LDC controllers
IVVC communication interfaced with line devices, and metering
9.1.3 Metering Specification, Procurement, and Insulation
Power transformer LTC MW & MVAr, phase amps, and hourly voltage profile metering
Feeder source MW & MVAr and hourly voltage profile metering
Regulator MW & MVAr, phase amps, and hourly voltage profile metering
EOL hourly voltage profile metering
Metering data collection and storage infrastructure
AMI customer profile metering (if available)
Metering data evaluation, analysis, and reporting
Commonwealth Edison Company Task 10 – Final Report
Contract No. 01146430 – Task 10 Proprietary 90
Applied Energy Group 1377 Motor Parkway, Suite 401 Islandia, NY 11749 P: 631-434-1414 www.appliedenergygroup.com
9.1.4 Operation Control Engineering
Line drop compensation
Voltage feedback control
VAR controls with voltage override
IVVC controller parameters
Metering integration and control
SCADA interface communications, alarms, and supervisory controls
9.1.5 Engineering Assessment Standard Guidelines
Application scenario selection strategies
Planning, design, installation, and operation guidelines
Engineering and operations training procedures
System loss assessment methods and procedures
Feeder energy savings and demand reduction M&V protocol development
Engineering savings estimates, economic evaluations, and reporting templates
9.1.6 Implementation and trial testing
Operational performance demonstration
Metering data collection and storage
Pilot trial operations “ON” and “OFF” testing
Trial data statistical assessments (VO factor and average voltage formulations)
Performance review and compliance validation
9.1.7 Operational Performance Assessment
Voltage operational and performance control evaluation
Power transformer LTC voltage bandwidth impact assessment
VAR management performance validation
VO factor assessment for M&V use
M&V protocol guideline, average voltage formulation, and testing validation
Customer impact and response assessments
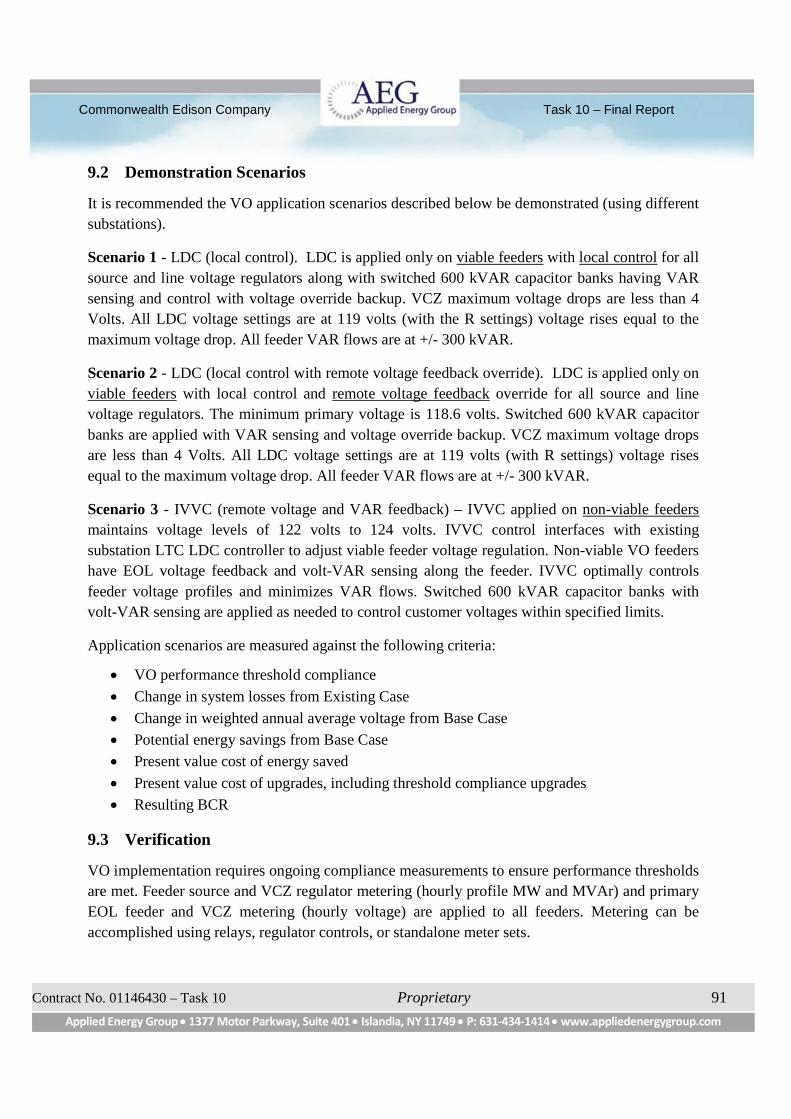
Commonwealth Edison Company Task 10 – Final Report
Contract No. 01146430 – Task 10 Proprietary 91
Applied Energy Group 1377 Motor Parkway, Suite 401 Islandia, NY 11749 P: 631-434-1414 www.appliedenergygroup.com
9.2 Demonstration Scenarios
It is recommended the VO application scenarios described below be demonstrated (using different
substations).
Scenario 1 - LDC (local control). LDC is applied only on viable feeders with local control for all
source and line voltage regulators along with switched 600 kVAR capacitor banks having VAR
sensing and control with voltage override backup. VCZ maximum voltage drops are less than 4
Volts. All LDC voltage settings are at 119 volts (with the R settings) voltage rises equal to the
maximum voltage drop. All feeder VAR flows are at +/- 300 kVAR.
Scenario 2 - LDC (local control with remote voltage feedback override). LDC is applied only on
viable feeders with local control and remote voltage feedback override for all source and line
voltage regulators. The minimum primary voltage is 118.6 volts. Switched 600 kVAR capacitor
banks are applied with VAR sensing and voltage override backup. VCZ maximum voltage drops
are less than 4 Volts. All LDC voltage settings are at 119 volts (with R settings) voltage rises
equal to the maximum voltage drop. All feeder VAR flows are at +/- 300 kVAR.
Scenario 3 - IVVC (remote voltage and VAR feedback) – IVVC applied on non-viable feeders
maintains voltage levels of 122 volts to 124 volts. IVVC control interfaces with existing
substation LTC LDC controller to adjust viable feeder voltage regulation. Non-viable VO feeders
have EOL voltage feedback and volt-VAR sensing along the feeder. IVVC optimally controls
feeder voltage profiles and minimizes VAR flows. Switched 600 kVAR capacitor banks with
volt-VAR sensing are applied as needed to control customer voltages within specified limits.
Application scenarios are measured against the following criteria:
VO performance threshold compliance
Change in system losses from Existing Case
Change in weighted annual average voltage from Base Case
Potential energy savings from Base Case
Present value cost of energy saved
Present value cost of upgrades, including threshold compliance upgrades
Resulting BCR
9.3 Verification
VO implementation requires ongoing compliance measurements to ensure performance thresholds
are met. Feeder source and VCZ regulator metering (hourly profile MW and MVAr) and primary
EOL feeder and VCZ metering (hourly voltage) are applied to all feeders. Metering can be
accomplished using relays, regulator controls, or standalone meter sets.

Commonwealth Edison Company Task 10 – Final Report
Contract No. 01146430 – Task 10 Proprietary 92
Applied Energy Group 1377 Motor Parkway, Suite 401 Islandia, NY 11749 P: 631-434-1414 www.appliedenergygroup.com
Measurements also provide performance information regarding LDC voltage regulation, capacitor
VAR management, and feeder voltage profiles. Demonstration includes adequate annunciation to
allow for corrective SCADA actions in case of equipment or control malfunction. Demonstration
includes assessment guidelines and operational control expectations; and documentation of
customer complaints, equipment malfunctions, and/or control irregularities.
Feeder analysis is done on a substation basis. All feeders served from the same voltage control
substation bus (i.e., LTC or voltage regulator) are considered to be in the same VCZ. Each in-line
voltage regulator also forms a new VCZ. Changes to voltage regulator set points will impact all
feeders and/or loads served by the same VCZ.
Meter data is used to verify average voltage calculation procedures. The protocol is to be revised
to meet ComEd-specific needs. Procedures and application methods are to be developed.
Performance thresholds are to be reviewed and revised as necessary. Application templates are to
be developed to facilitate VO application by regional planning engineers, operations, and energy
efficiency specialists. The protocol should include VO design process and control application
guidelines.
The M&V protocol establishes a basis for measuring and verifying energy savings. Protocol
methods are based on Equipment Condition Monitoring (ECM) guidelines that comply with
requirements set forth in the Federal Energy Management Program (FEMP) M&V guidelines,
Version 2.2, and International Performance Measurement & Verification Protocol (IPMVP),
Volume I, March 2002.
The protocol defines an annual energy VO factor for estimating end-user energy savings from
reduced average annual voltages. Typically, VO factors are based on load types and
characteristics, consumption patterns, appliance use, and ambient weather conditions. Global
residential and commercial annual energy VO factors based on ComEd customer loading and
weather characteristics developed in Task 4.
VO factors are used with average feeder voltage-change formulations to determine total end-use
energy savings. VO factors do not include distribution line or no-load (transformer core) loss
savings, which are calculated separately.
Metering data collected for “ON” and “OFF” demonstration settings validate VO factors to be
used with the protocol. Measurements are typically collected once each hour.
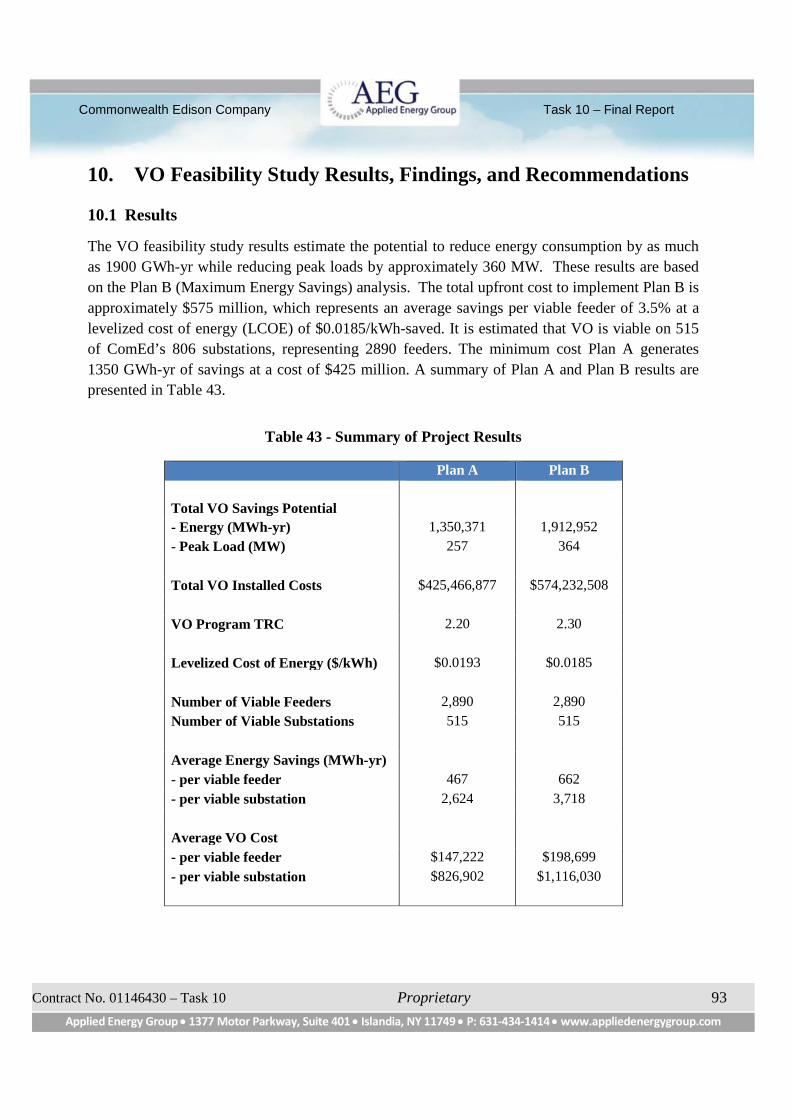
Commonwealth Edison Company Task 10 – Final Report
Contract No. 01146430 – Task 10 Proprietary 93
Applied Energy Group 1377 Motor Parkway, Suite 401 Islandia, NY 11749 P: 631-434-1414 www.appliedenergygroup.com
10. VO Feasibility Study Results, Findings, and Recommendations
10.1 Results
The VO feasibility study results estimate the potential to reduce energy consumption by as much
as 1900 GWh-yr while reducing peak loads by approximately 360 MW. These results are based
on the Plan B (Maximum Energy Savings) analysis. The total upfront cost to implement Plan B is
approximately $575 million, which represents an average savings per viable feeder of 3.5% at a
levelized cost of energy (LCOE) of $0.0185/kWh-saved. It is estimated that VO is viable on 515
of ComEd’s 806 substations, representing 2890 feeders. The minimum cost Plan A generates
1350 GWh-yr of savings at a cost of $425 million. A summary of Plan A and Plan B results are
presented in Table 43.
Table 43 - Summary of Project Results
Plan A Plan B
Total VO Savings Potential
- Energy (MWh-yr) 1,350,371 1,912,952
- Peak Load (MW) 257 364
Total VO Installed Costs $425,466,877 $574,232,508
VO Program TRC 2.20 2.30
Levelized Cost of Energy ($/kWh) $0.0193 $0.0185
Number of Viable Feeders 2,890 2,890
Number of Viable Substations 515 515
Average Energy Savings (MWh-yr)
- per viable feeder 467 662
- per viable substation 2,624 3,718
Average VO Cost
- per viable feeder $147,222 $198,699
- per viable substation $826,902 $1,116,030
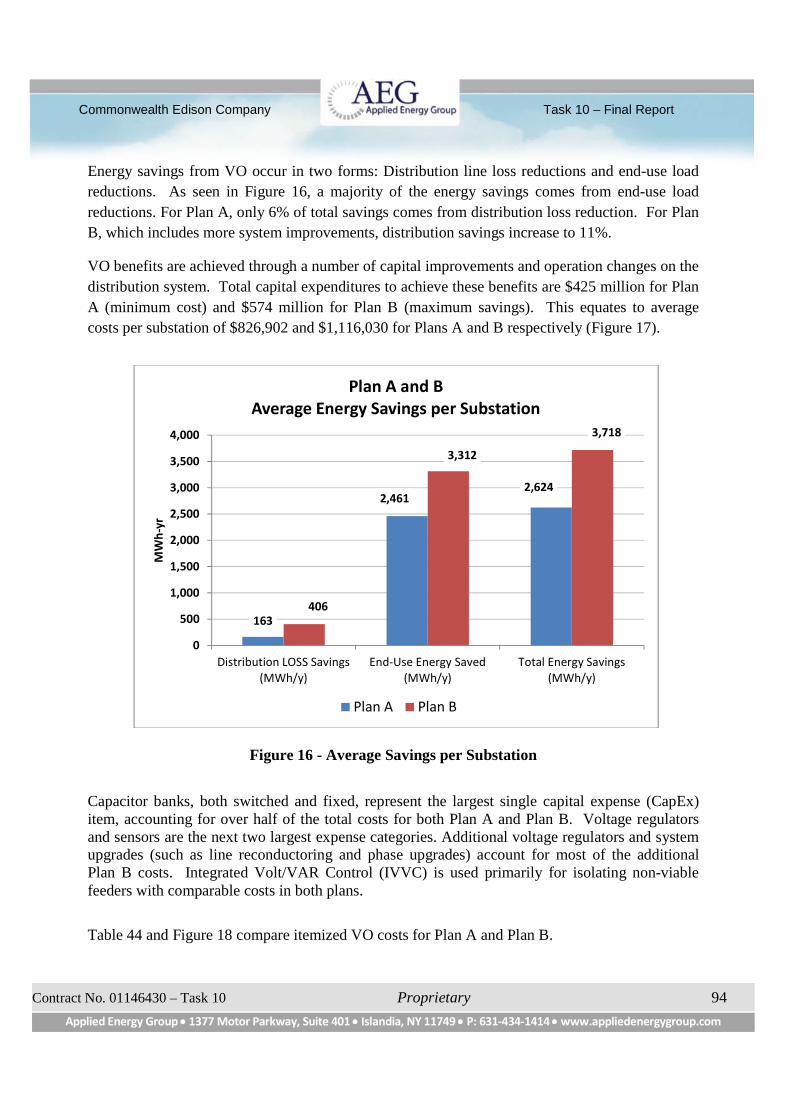
Commonwealth Edison Company Task 10 – Final Report
Contract No. 01146430 – Task 10 Proprietary 94
Applied Energy Group 1377 Motor Parkway, Suite 401 Islandia, NY 11749 P: 631-434-1414 www.appliedenergygroup.com
Energy savings from VO occur in two forms: Distribution line loss reductions and end-use load
reductions. As seen in Figure 16, a majority of the energy savings comes from end-use load
reductions. For Plan A, only 6% of total savings comes from distribution loss reduction. For Plan
B, which includes more system improvements, distribution savings increase to 11%.
VO benefits are achieved through a number of capital improvements and operation changes on the
distribution system. Total capital expenditures to achieve these benefits are $425 million for Plan
A (minimum cost) and $574 million for Plan B (maximum savings). This equates to average
costs per substation of $826,902 and $1,116,030 for Plans A and B respectively (Figure 17).
Figure 16 - Average Savings per Substation
Capacitor banks, both switched and fixed, represent the largest single capital expense (CapEx)item, accounting for over half of the total costs for both Plan A and Plan B. Voltage regulatorsand sensors are the next two largest expense categories. Additional voltage regulators and systemupgrades (such as line reconductoring and phase upgrades) account for most of the additionalPlan B costs. Integrated Volt/VAR Control (IVVC) is used primarily for isolating non-viablefeeders with comparable costs in both plans.
Table 44 and Figure 18 compare itemized VO costs for Plan A and Plan B.
163
2,4612,624
406
3,312
3,718
0
500
1,000
1,500
2,000
2,500
3,000
3,500
4,000
Distribution LOSS Savings(MWh/y)
End-Use Energy Saved(MWh/y)
Total Energy Savings(MWh/y)
MW
h-y
r
Plan A and BAverage Energy Savings per Substation
Plan A Plan B
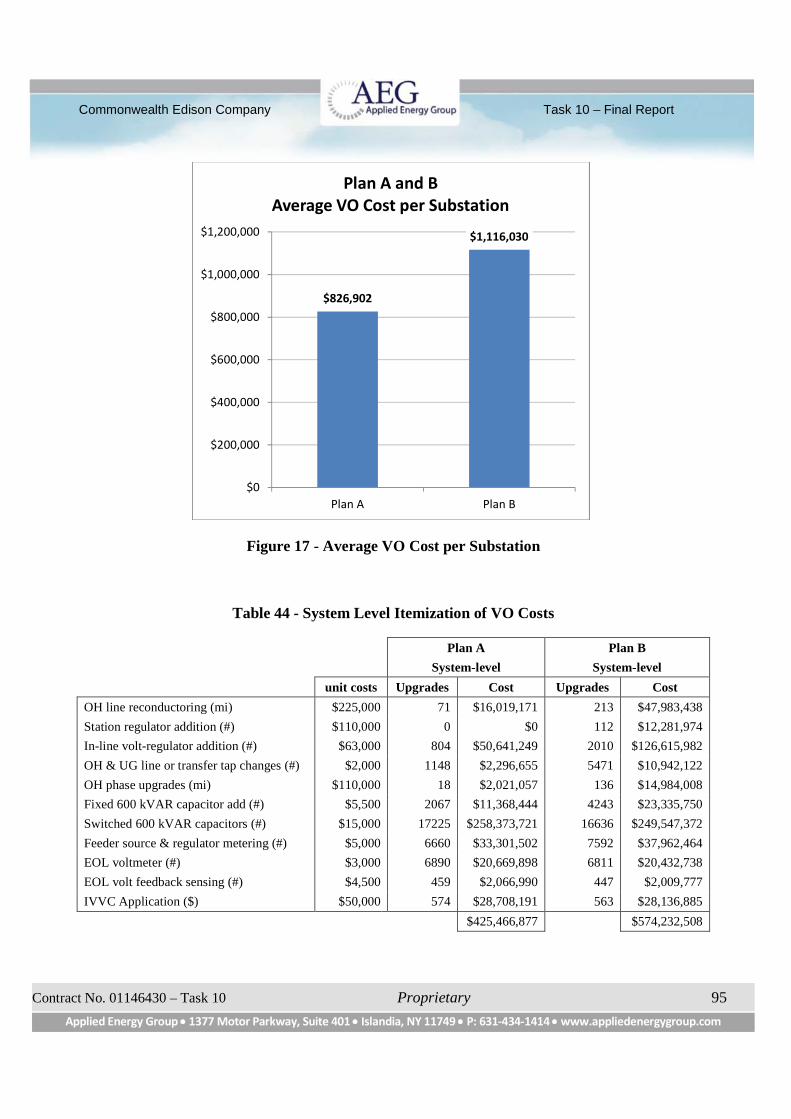
Commonwealth Edison Company Task 10 – Final Report
Contract No. 01146430 – Task 10 Proprietary 95
Applied Energy Group 1377 Motor Parkway, Suite 401 Islandia, NY 11749 P: 631-434-1414 www.appliedenergygroup.com
Figure 17 - Average VO Cost per Substation
Table 44 - System Level Itemization of VO Costs
Plan A Plan B
System-level System-level
unit costs Upgrades Cost Upgrades Cost
OH line reconductoring (mi) $225,000 71 $16,019,171 213 $47,983,438
Station regulator addition (#) $110,000 0 $0 112 $12,281,974
In-line volt-regulator addition (#) $63,000 804 $50,641,249 2010 $126,615,982
OH & UG line or transfer tap changes (#) $2,000 1148 $2,296,655 5471 $10,942,122
OH phase upgrades (mi) $110,000 18 $2,021,057 136 $14,984,008
Fixed 600 kVAR capacitor add (#) $5,500 2067 $11,368,444 4243 $23,335,750
Switched 600 kVAR capacitors (#) $15,000 17225 $258,373,721 16636 $249,547,372
Feeder source & regulator metering (#) $5,000 6660 $33,301,502 7592 $37,962,464
EOL voltmeter (#) $3,000 6890 $20,669,898 6811 $20,432,738
EOL volt feedback sensing (#) $4,500 459 $2,066,990 447 $2,009,777
IVVC Application ($) $50,000 574 $28,708,191 563 $28,136,885
$425,466,877 $574,232,508
$826,902
$1,116,030
$0
$200,000
$400,000
$600,000
$800,000
$1,000,000
$1,200,000
Plan A Plan B
Plan A and BAverage VO Cost per Substation
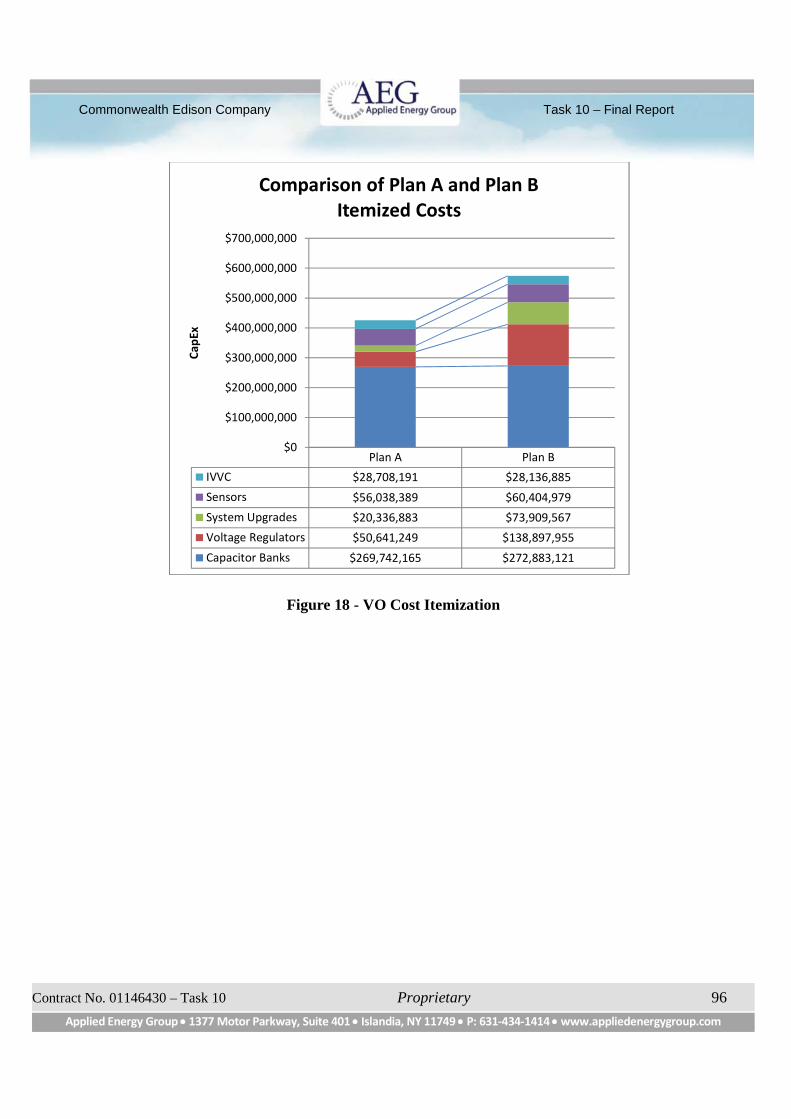
Commonwealth Edison Company Task 10 – Final Report
Contract No. 01146430 – Task 10 Proprietary 96
Applied Energy Group 1377 Motor Parkway, Suite 401 Islandia, NY 11749 P: 631-434-1414 www.appliedenergygroup.com
Figure 18 - VO Cost Itemization
Plan A Plan B
IVVC $28,708,191 $28,136,885
Sensors $56,038,389 $60,404,979
System Upgrades $20,336,883 $73,909,567
Voltage Regulators $50,641,249 $138,897,955
Capacitor Banks $269,742,165 $272,883,121
$0
$100,000,000
$200,000,000
$300,000,000
$400,000,000
$500,000,000
$600,000,000
$700,000,000
Cap
ExComparison of Plan A and Plan B
Itemized Costs

Commonwealth Edison Company Task 10 – Final Report
Contract No. 01146430 – Task 10 Proprietary 97
Applied Energy Group 1377 Motor Parkway, Suite 401 Islandia, NY 11749 P: 631-434-1414 www.appliedenergygroup.com
Figure 19 - VO EE Supply Curves
A key study result is the screening and ranking of substations by VO cost and savings potential.
This data can then be used to develop VO energy efficiency (EE) supply curves that present how
much savings is available at a given cost. Figure 19 presents substation-based VO EE supply
curves. While rankings were only developed for substations in the 14-region study group, the
supply curves depicted in Figure 20 have been extrapolated to the system level.
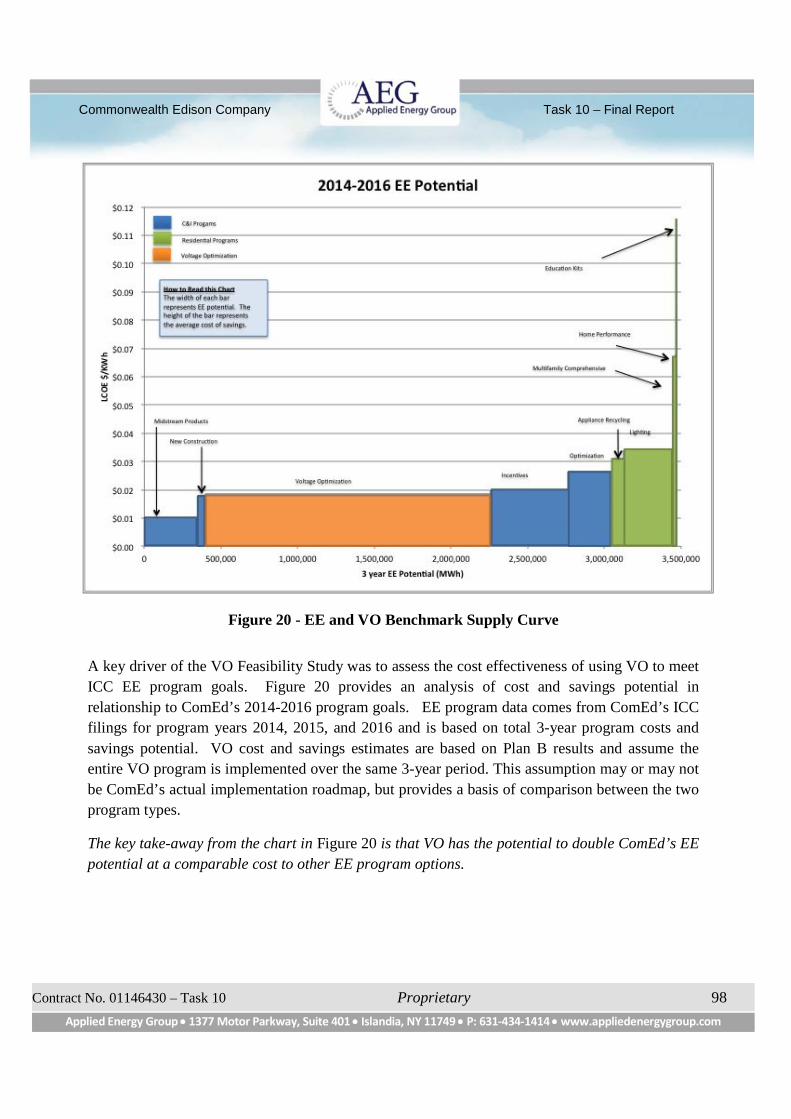
Commonwealth Edison Company Task 10 – Final Report
Contract No. 01146430 – Task 10 Proprietary 98
Applied Energy Group 1377 Motor Parkway, Suite 401 Islandia, NY 11749 P: 631-434-1414 www.appliedenergygroup.com
Figure 20 - EE and VO Benchmark Supply Curve
A key driver of the VO Feasibility Study was to assess the cost effectiveness of using VO to meet
ICC EE program goals. Figure 20 provides an analysis of cost and savings potential in
relationship to ComEd’s 2014-2016 program goals. EE program data comes from ComEd’s ICC
filings for program years 2014, 2015, and 2016 and is based on total 3-year program costs and
savings potential. VO cost and savings estimates are based on Plan B results and assume the
entire VO program is implemented over the same 3-year period. This assumption may or may not
be ComEd’s actual implementation roadmap, but provides a basis of comparison between the two
program types.
The key take-away from the chart in Figure 20 is that VO has the potential to double ComEd’s EE
potential at a comparable cost to other EE program options.
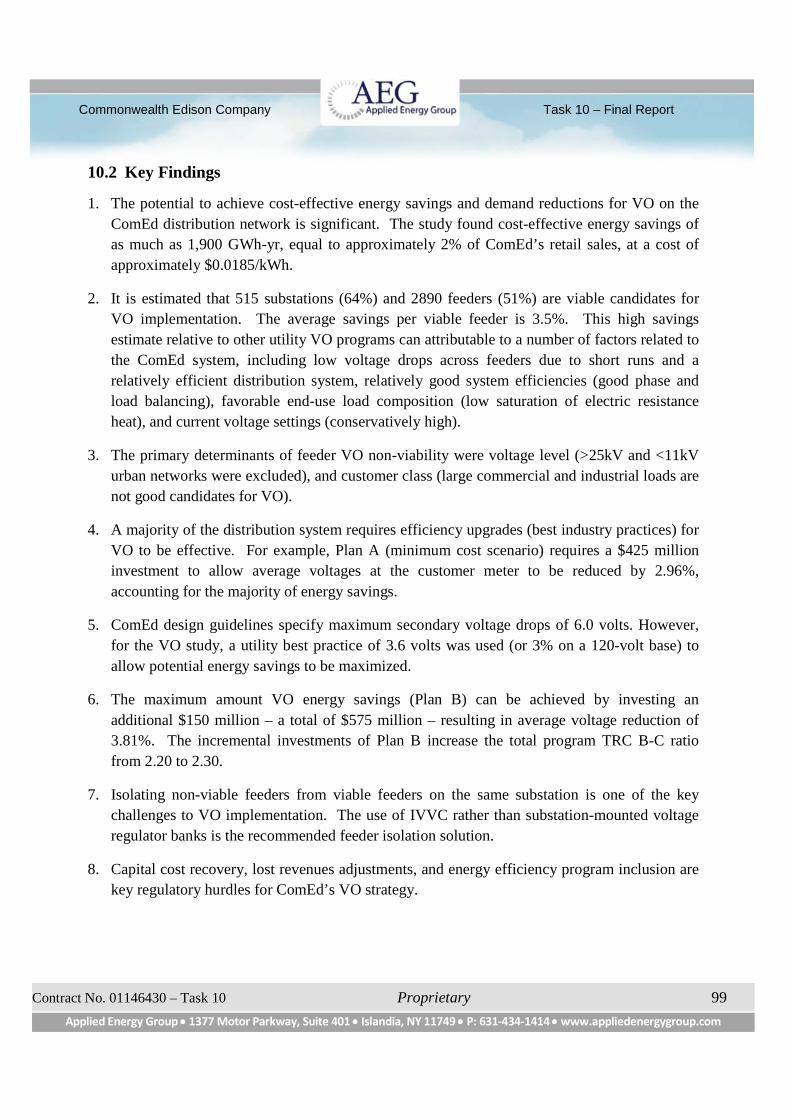
Commonwealth Edison Company Task 10 – Final Report
Contract No. 01146430 – Task 10 Proprietary 99
Applied Energy Group 1377 Motor Parkway, Suite 401 Islandia, NY 11749 P: 631-434-1414 www.appliedenergygroup.com
10.2 Key Findings
1. The potential to achieve cost-effective energy savings and demand reductions for VO on the
ComEd distribution network is significant. The study found cost-effective energy savings of
as much as 1,900 GWh-yr, equal to approximately 2% of ComEd’s retail sales, at a cost of
approximately $0.0185/kWh.
2. It is estimated that 515 substations (64%) and 2890 feeders (51%) are viable candidates for
VO implementation. The average savings per viable feeder is 3.5%. This high savings
estimate relative to other utility VO programs can attributable to a number of factors related to
the ComEd system, including low voltage drops across feeders due to short runs and a
relatively efficient distribution system, relatively good system efficiencies (good phase and
load balancing), favorable end-use load composition (low saturation of electric resistance
heat), and current voltage settings (conservatively high).
3. The primary determinants of feeder VO non-viability were voltage level (>25kV and <11kV
urban networks were excluded), and customer class (large commercial and industrial loads are
not good candidates for VO).
4. A majority of the distribution system requires efficiency upgrades (best industry practices) for
VO to be effective. For example, Plan A (minimum cost scenario) requires a $425 million
investment to allow average voltages at the customer meter to be reduced by 2.96%,
accounting for the majority of energy savings.
5. ComEd design guidelines specify maximum secondary voltage drops of 6.0 volts. However,
for the VO study, a utility best practice of 3.6 volts was used (or 3% on a 120-volt base) to
allow potential energy savings to be maximized.
6. The maximum amount VO energy savings (Plan B) can be achieved by investing an
additional $150 million – a total of $575 million – resulting in average voltage reduction of
3.81%. The incremental investments of Plan B increase the total program TRC B-C ratio
from 2.20 to 2.30.
7. Isolating non-viable feeders from viable feeders on the same substation is one of the key
challenges to VO implementation. The use of IVVC rather than substation-mounted voltage
regulator banks is the recommended feeder isolation solution.
8. Capital cost recovery, lost revenues adjustments, and energy efficiency program inclusion are
key regulatory hurdles for ComEd’s VO strategy.
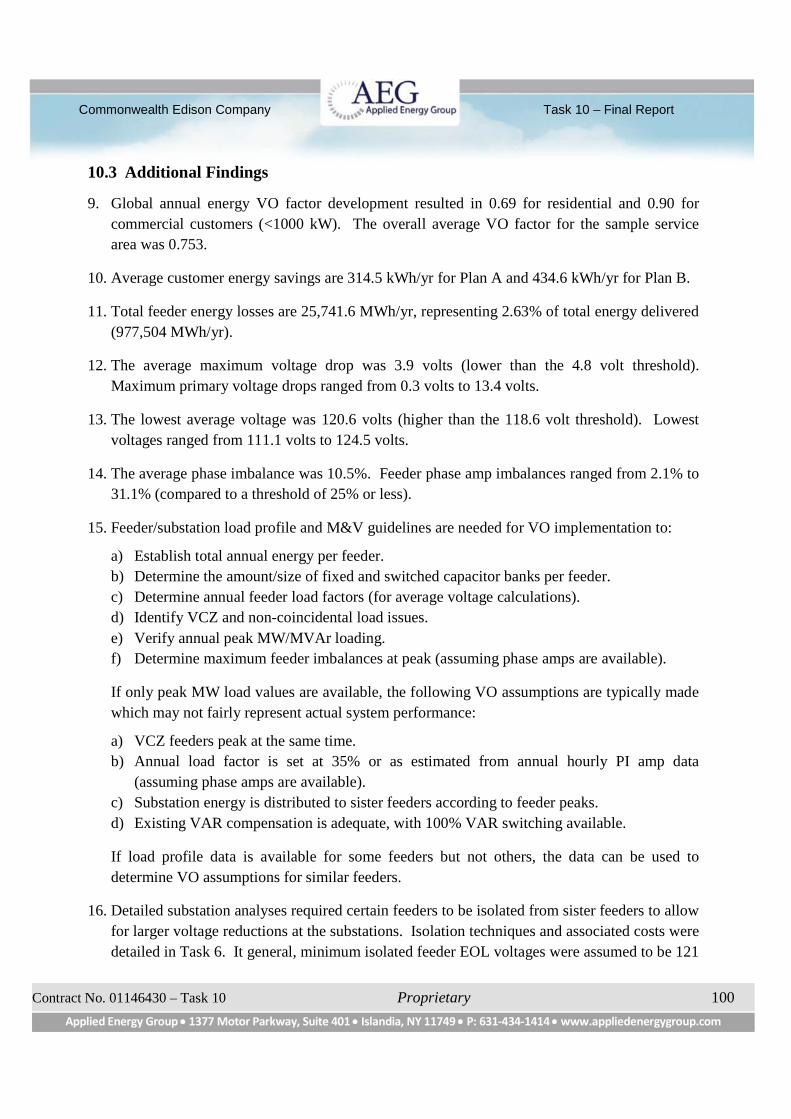
Commonwealth Edison Company Task 10 – Final Report
Contract No. 01146430 – Task 10 Proprietary 100
Applied Energy Group 1377 Motor Parkway, Suite 401 Islandia, NY 11749 P: 631-434-1414 www.appliedenergygroup.com
10.3 Additional Findings
9. Global annual energy VO factor development resulted in 0.69 for residential and 0.90 for
commercial customers (<1000 kW). The overall average VO factor for the sample service
area was 0.753.
10. Average customer energy savings are 314.5 kWh/yr for Plan A and 434.6 kWh/yr for Plan B.
11. Total feeder energy losses are 25,741.6 MWh/yr, representing 2.63% of total energy delivered
(977,504 MWh/yr).
12. The average maximum voltage drop was 3.9 volts (lower than the 4.8 volt threshold).
Maximum primary voltage drops ranged from 0.3 volts to 13.4 volts.
13. The lowest average voltage was 120.6 volts (higher than the 118.6 volt threshold). Lowest
voltages ranged from 111.1 volts to 124.5 volts.
14. The average phase imbalance was 10.5%. Feeder phase amp imbalances ranged from 2.1% to
31.1% (compared to a threshold of 25% or less).
15. Feeder/substation load profile and M&V guidelines are needed for VO implementation to:
a) Establish total annual energy per feeder.
b) Determine the amount/size of fixed and switched capacitor banks per feeder.
c) Determine annual feeder load factors (for average voltage calculations).
d) Identify VCZ and non-coincidental load issues.
e) Verify annual peak MW/MVAr loading.
f) Determine maximum feeder imbalances at peak (assuming phase amps are available).
If only peak MW load values are available, the following VO assumptions are typically made
which may not fairly represent actual system performance:
a) VCZ feeders peak at the same time.
b) Annual load factor is set at 35% or as estimated from annual hourly PI amp data
(assuming phase amps are available).
c) Substation energy is distributed to sister feeders according to feeder peaks.
d) Existing VAR compensation is adequate, with 100% VAR switching available.
If load profile data is available for some feeders but not others, the data can be used to
determine VO assumptions for similar feeders.
16. Detailed substation analyses required certain feeders to be isolated from sister feeders to allow
for larger voltage reductions at the substations. Isolation techniques and associated costs were
detailed in Task 6. It general, minimum isolated feeder EOL voltages were assumed to be 121
Commonwealth Edison Company Task 10 – Final Report
Contract No. 01146430 – Task 10 Proprietary 101
Applied Energy Group 1377 Motor Parkway, Suite 401 Islandia, NY 11749 P: 631-434-1414 www.appliedenergygroup.com
volts. However, if lower voltages are allowed, adjustments can be made accordingly. Adding
in-line voltage regulators has the highest degree of controllability for maintaining voltages but
may not be cost effective or feasible (e.g., physical space limitations).
17. Feeders requiring significant re-conductoring were considered non-viable since this cost is
typically not a VO cost. However, once completed, the feeders should be considered potential
VO candidates.
10.4 Recommendations
1. Design/implement a VO pilot project per the outline in Section 9 and detailed in Task 9.
Provide monthly/annual metering assessment reports to facilitate the VO verification process
outlined in Task 6 and Task 9.
2. Develop and implement VO analysis training materials for distribution planning engineers,
distribution operations personnel, and energy efficiency engineers. Contents to include
engineering modeling assessments, economic analysis methods, capacitor placement methods,
LTC/regulator/capacitor control settings, and annual volt/VAR maintenance and reporting
procedures.
3. Improve feeder VAR management with smaller capacitor banks (600 kVAR). Include VAR
sensing and local control on all switched banks. Follow the VAR application guidelines
developed in Task 6 to determine the number/location of the banks. Apply voltage control
override under emergency conditions. If possible, industry best practices suggest hourly VAR
swings should be limited to less than 300 kVAR lagging and 300 kVAR leading for a total of
600 kVAR swing.
4. Install EOL volt meters on every VO feeder and VCZ at the lowest voltage location to
collect/transmit data and provide annual reporting of voltage performance. Use voltage and
VAR feedback on non-viable feeders for use with IVVC applications.
5. Examine AMI voltage/loading data to determine actual feeder voltage drop and load profiles.
The results can be used to establish standards for addressing maximum allowable voltage
drops (distribution transformer and secondary voltage drops) and minimum allowable primary
voltages (i.e., 118.6 volts for an allowed 3.6 volt drop). Evaluate potential impacts
(probability of customer transformers needing replacement) of primary voltages violating
minimum standards. Revise transformer sizing guidelines based on this customer loading
information.
6. Maintain, correct, and/or upgrade GIS-CYMDist interface, software, and distribution system
models at least annually or as needed.
7. Develop in-house “normal design/operating standards” for maximum allowed phase load
Commonwealth Edison Company Task 10 – Final Report
Contract No. 01146430 – Task 10 Proprietary 102
Applied Energy Group 1377 Motor Parkway, Suite 401 Islandia, NY 11749 P: 631-434-1414 www.appliedenergygroup.com
imbalances of < 25%, maximum allowed primary voltage drops < 4V, conductor loadings <
70% of normal max, station and in-line voltage regulator voltage bandwidths of 2 volts
(plus/minus 1 volt), and maximum allowed secondary voltage drops < 3.6 volts.
8. Provide all in-line feeder voltage regulators with hourly profile metering (MW, MVAr, and
volts). Implement monthly data collection processes.
9. Develop application guidelines for EOL voltage feedback sensing/control and backup
override of LDC controls for VO feeders with less than a 80% coincidence factor compared to
sister feeders in the same VCZ.
10. Apply LDC settings for viable VO feeders with voltage settings at 119 volts with Volt-Rise
equal to the maximum voltage drop under peak conditions. Determine control R settings using
R&X application guidelines developed in Task 6 for a 110% peak load probability. With
hourly power factor near unity, X settings can be set to zero.
11. Apply IVVC to isolate feeders (large commercial/industrial loads, non-coincidental loads) in
the same VCZ to maintain higher sustained voltages using EOL voltage feedback, source
MW/MVAr metering, SCADA supervisory controls, substation IVVC feeder controllers,
switched capacitors (VAR/voltage sensing), and existing LDC controllers. This will allow
viable feeder voltages to be lowered and increase energy savings potential.
12. Provide substation power transformers with load-side 3-phase hourly profile metering (MW,
MVAr, and volts). Implement monthly data collection processes.
13. Conduct annual inspections of capacitor banks and associated controls.
Commonwealth Edison Company Task 10 – Final Report
Contract No. 01146430 – Task 10 Proprietary 103
Applied Energy Group 1377 Motor Parkway, Suite 401 Islandia, NY 11749 P: 631-434-1414 www.appliedenergygroup.com
11. References
11.1 Industry Standards and Protocols
[1] ANSI Electrical Power Systems and Equipment – Voltage Ratings (60Hz), ANSI Standard
C84.1-1995, August 1995.
[2] IEEE Distribution System Practices for Industrial Plants, IEEE Standard 141-1993, Red
Book, August 1993.
[3] National Electrical Code 2005, ANSI/NFPA 70-2005 Standard, National Fire Protection
Association, Quincy, MA.
[4] IEEE Recommended Practice for Electric Power Distribution for Industrial Plants, IEEE
Standard 141-1993.
[5] Simplified Voltage Optimization Measurement & Verification Protocol, May 4, 2010.
http://www.nwcouncil.org/energy/rtf/measures/protocols/ut/VoltageOptimization_Protocol
_v1.pdf
[6] Rural Utility Services, Bulletins 169-4 and 1724D-101A&B, RUS Electric Programs, U.S.
Department of Agriculture, Washington, DC, USA.
11.2 Books and Guides
[7] T. Gönen, Electric Power Distribution System Engineering, McGraw-Hill, New York,
1986.
[8] T. A. Short, Electric Power Distribution Handbook, CRC Press, New York, 1997.
[9] D. G. Newnan, T. G. Eschenbach, J. P. Lavelle, Engineering Economic Analysis, Ninth
Edition, Oxford University Press, Inc., New York, 2004.
[10] W. H. Kersting, Distribution System Modeling and Analysis, CRC Press, LLC, New York,
2002.
[11] D. R. Brown, Distribution System Performance Improvement Guide, APPA Publication,
www.APPAnet.org, March 1997.
[12] IEEE Tutorial Course “Engineering Economic Analysis: Overview and Current
Applications, 1991,” IEEE Trans. 91 EHO 345-9-PWR, IEEE Service Center, 445 Hoes
Lane, P.O. Box1331, Piscataway, NJ 08855-1331.
Commonwealth Edison Company Task 10 – Final Report
Contract No. 01146430 – Task 10 Proprietary 104
Applied Energy Group 1377 Motor Parkway, Suite 401 Islandia, NY 11749 P: 631-434-1414 www.appliedenergygroup.com
11.3 Technical Papers and Research
[13] Department of Energy, Distribution Transformers Rulemaking, Liquid-immersed
Engineering Analysis Results, September 2007.
http://www1.eere.energy.gov/buildings/appliance_standards/commercial/distribution_tran
sformers_finalrule.html
[14] Distribution Efficiency Initiative – Final Report, Northwest Energy Efficiency Alliance
(NEEA), Portland, OR, December 2007.
[15] R. H. Fletcher, K. Strunz, “Optimal Distribution System Horizon Planning Part I
Formulation, and Part II Application,” IEEE Trans. Power Systems Journal, Vol. 5, May
2007.
[16] B. Milosevic, M. Begovic, “Capacitor Placement for Conservative Voltage Reduction on
Distribution Feeders,” IEEE Trans, Power Systems, vol.19, issue 3, July 2004,pp 1360-
1367.
[17] R. H. Fletcher, A. Saeed, “Integrating Engineering and Economic Analysis for
Conservation Voltage Reduction,” 2002 IEEE Power Engineering Society Summer
Meeting, Systems, vol.2, 6-10 June 2002, pp 725-730.
[18] S. Mandal, A. Pahwa, “Optimal Selection of Conductors for Distribution Feeders,” IEEE
Trans, Power Systems, vol.17, issue 1, February 2002, pp 192-197.
[19] R. H. Fletcher, B. W. Kennedy, “Conservation Voltage Reduction at Snohomish County
PUD,” IEEE Trans. on Power Systems, Vol.6, issue 3, August 1991, pp 986-998.
[20] B. W. Brice, “Voltage-Drop Calculations and Power-Flow Studies for Rural Electric
Distribution Lines,” IEEE Trans, Industry Applications, Vol.28, issue 4, July–August
1992, pp 774-781.
[21] Kirshner, Implementation of Conservation Voltage Reduction at Commonwealth Edison,”
IEEE Trans, Power Systems, vol. 5, no. 4, November 1990, pp 1178-82.
[22] J.G. De Steese, S.V. Merrick, R.C. Tepel, and J.W. Callaway, “Assessment of
Conservation Voltage Reduction Applicable in the BPA Service Region,” BPA PNL 6380,
Pacific Northwest laboratories, Richland, Washington, 1987.
[23] D. Kirshner, and P. Gioresetto, “Statistical Tests of Energy Savings Due to Voltage
Reduction,” IEEE Trans on Power Apparatus and Systems, vol. PAS-103, no. 6, pp. 1205-
10, June 1984.
[24] M.S. Chen, R.R. Shoults, J. Fitzer, and H. Songster “Effects of Reduced Voltage on the
Efficiency of Electric Loads,” IEEE Trans. On Power Apparatus and Systems, Vol. PAS-
101(7), July 1982.
Commonwealth Edison Company Task 10 – Final Report
Contract No. 01146430 – Task 10 Proprietary 105
Applied Energy Group 1377 Motor Parkway, Suite 401 Islandia, NY 11749 P: 631-434-1414 www.appliedenergygroup.com
[25] Effects of Reduced Voltage on the Operation and Efficiency of Electric Loads, Volumes 1
and 2, Prepared by M. S. Chen, R. R. Shoults, and J. Fitzer at University of Texas at
Arlington for Electric Power Research Institute, Palo Alto, California, September 1981.
[26] G.A. Amaroli, and J.P. O’Donnell “Conservation Voltage Regulation Calendar Year 1979
Progress Report,” California Public Utilities Commission, Utilities Division, Energy
Branch, San Francisco, California, April 1980.
[27] Opinion Dynamics Corporation, “ComEd Commercial and Industrial Saturation/End,
Market Penetration & Behavioral Study,” Waltham, MA 02451, May 2013.
[28] Opinion Dynamics Corporation, “ComEd Residential Saturation/End, Market Penetration
& Behavioral Study,” Waltham, MA 02451, April 2013.
[29] ICF International and Opinion Dynamics Corporation “ComEd Energy Efficiency
Potential Study Report, 2013-2018,” Fairfax, VA 22031, April 20, 2013.
[30] Illinois Commerce Commission, “Annual Formula Rate Update and Revenue
Requirement Reconciliation,” Section 16-108.5 of the Public Utilities Act, ICC Page 9,
ICC Filing – 376159, May 2014.
[31] Beckwith Electric Co., Inc., “Basic Considerations for the Application of LTC
Transformers and Associated Controls” Tap Changer Application Note #17, Largo,
Florida 33773 Feb, 1998.
[32] National Electrical Manufacturers Association (NEMA), “Volt/VAR Optimization
Improves Grid Efficiency – Case Study Reports,” 1300 North 17th Street, Suite 900,
Arlington, Virginia 22209, Phone: (703) 841-3200, May 2012.
[33] Todd Loggins, “Survalent Technology DVR Case Study” Clinton Utilities Board,
Technical Operations, 1001 N Charles G Seivers Blvd, Clinton, TN 37716, June 2007.
[34] Survalent Technology Smart Distribution Automation “Dynamic Voltage Regulation and
Conservation Voltage Regulation” Technical Spec 110812, 2600 Argentia Road
Mississauga, Ontario L5N 5V4, Canada Nov 2012 (905) 826-5000 phone
www.survalent.com
[35] S&C Electric Company “S&C IntelliTeam Volt-Var Optimization System” Technical
Spec 545-6-5, http://www.sandc.com/products/automation-control/intelliteam-vv.asp
6601 North Ridge Boulevard, Chicago, Illinois 60626-3997, 800-621-5546, June 2012.
[36] Bob Uluski, “Integrated Volt-VAR Control,” IEEE PES Distribution Automation Tutorial,
Quanta Technology, [email protected] DATutorial08Chapter5 Power
Point, Feb 2008.
[37] Cooper Power Systems “Volt/VAR Management – Information Brochure,”
http://www.cooperindustries.com/content/public/en/power_systems/solutions/ivvc.html,
Commonwealth Edison Company Task 10 – Final Report
Contract No. 01146430 – Task 10 Proprietary 106
Applied Energy Group 1377 Motor Parkway, Suite 401 Islandia, NY 11749 P: 631-434-1414 www.appliedenergygroup.com
Cooper Power Systems, Customer Support Center, 1319 Lincoln Avenue, Waukesha, WI
53186, May 2013.
[38] Jeff St. John, “How Smart AMI Meters Are Helping Utilities with Voltage Management,”
www.GreenTechMedia.com, Jan 13, 2014.
[39] The Edison Foundation, Institute for Electric Innovation, “Innovations Across the Grid,
Partnerships Transforming the Power Sector,” The Edison Foundation,701 Pennsylvania
Avenue, N.W., Washington, D.C. 20004-2696, Phone: 202.508.5440
www.edisonfoundation.net/iei, Dec 2013.
[40] Hawaiian Electric Company, Inc., “MicroPlanet High Voltage Regulator Site Test Report
May 31 2006 to August 09 2009,” Customer Technology Applications Division, Sep 29,
2006.
[41] Tom Wilson, “A Comparison of AdaptiVolt and Line Drop Compensation Conservation
Voltage Regulation Implementation Methodologies,” PCS UtiliData, Spokane, WA, Dec
2010.
[42] Jonathan Short, Michael Smith, “BGE Pilots Volt/VAR Trial,” T&D World Magazine,
Baltimore Gas and Electric (BGE), Jun 25, 2014.
[43] Beckwith Electric Company, “Beckwith Electric Controls for LTCs, Regulators, and
Capacitors,” Technical Brochure 122254,
http://www.beckwithelectric.com/products/controls.html, Oct 20, 2014.
[44] Jared Green and Joe Paladino, “Conservation and Optimization Via Volt Control,” and
“The Smart Grid Experience Applying Results, and Reaching Beyond”, Joint conferences
EPRI and DOE, Power Point Slide Show, Oct 27-28, 2014.
11.4 ComEd Standards
[45] “Electric Distribution Capacity Planning Guidelines,” ComEd Standard AM-ED-Y013-
R0001, Rev 0, Effective 10/15/2005.
[46] “Distribution Capacity Planning Weather Adjustment Process,” ComEd Standard AM-
ED-3007, Rev 2, Effective 05/15/2007.
[47] ComEd Training and Reference: “Capacitor Application and Control Setting Guidelines,”
ComEd Standard AM-CE-3033-R0001, Rev 1, Effective 09/09/2013.
[48] System Planning Operating Guide: “Distribution System – Capacitor Switching (Feeder
and Bus),” ComEd Standard SPOG 6-10, Rev 0, Effective 10/14/2005.
[49] “Design of Overhead Transformer, Secondary and Service Combinations,” ComEd
Engineering Standard Practice 5.3.6.2, Effective 07/01/1999.
Commonwealth Edison Company Task 10 – Final Report
Contract No. 01146430 – Task 10 Proprietary 107
Applied Energy Group 1377 Motor Parkway, Suite 401 Islandia, NY 11749 P: 631-434-1414 www.appliedenergygroup.com
[50] “Cable Ratings for 12.5kV Feeder Conduit Systems,” ComEd Engineering Standard
Practice 5.3.8.4, Effective 02/24/2012.
[51] “Underground Distribution Cable Selection and Application,” ComEd Standard Practice
5.3.8.2, Effective 08/30/2012.
[52] “Standard Conductor Sizes and Application and Installation Guidelines,” ComEd
Engineering Standard Practice 5.3.7.1, Effective 02/25/2011.
[53] “Transformer, Buried Secondary and Service Combination Design,” ComEd Engineering
Standard Practice 5.3.6.4, Effective 06/20/2014.
[54] “Sizing Transformers for Steady-State Loads,” ComEd Engineering Standard Practice
5.2.2, Effective 12/01/1999.
11.5 Other Publications
[55] Commonwealth Edison Company “Annual Formula Rate Update and Revenue
Requirement Reconciliation Under Section 16-108.5 of the Public Utilities Act,” Illinois
Commerce Commission, Schedule A-1 FY, Schedule A-2 FY, Schedule A-2 RY,
Schedule A-2.1, Schedule A-3(a), April 2014.
[56] ICF International and Opinion Dynamics Corporation, “ComEd Energy Efficiency
Potential Study Report, 2013-2018,” ICF International 13-034, August 20, 2013.
[57] Opinion Dynamics Corporation, “ComEd Commercial and Industrial Saturation/End Use,
Market Penetration & Behavioral Study,” opiniondynamics.com, May 2013.
[58] Opinion Dynamics Corporation, “ComEd Residential Saturation/End Use, Market
Penetration & Behavioral Study,” opiniondynamics.com, April 2013.
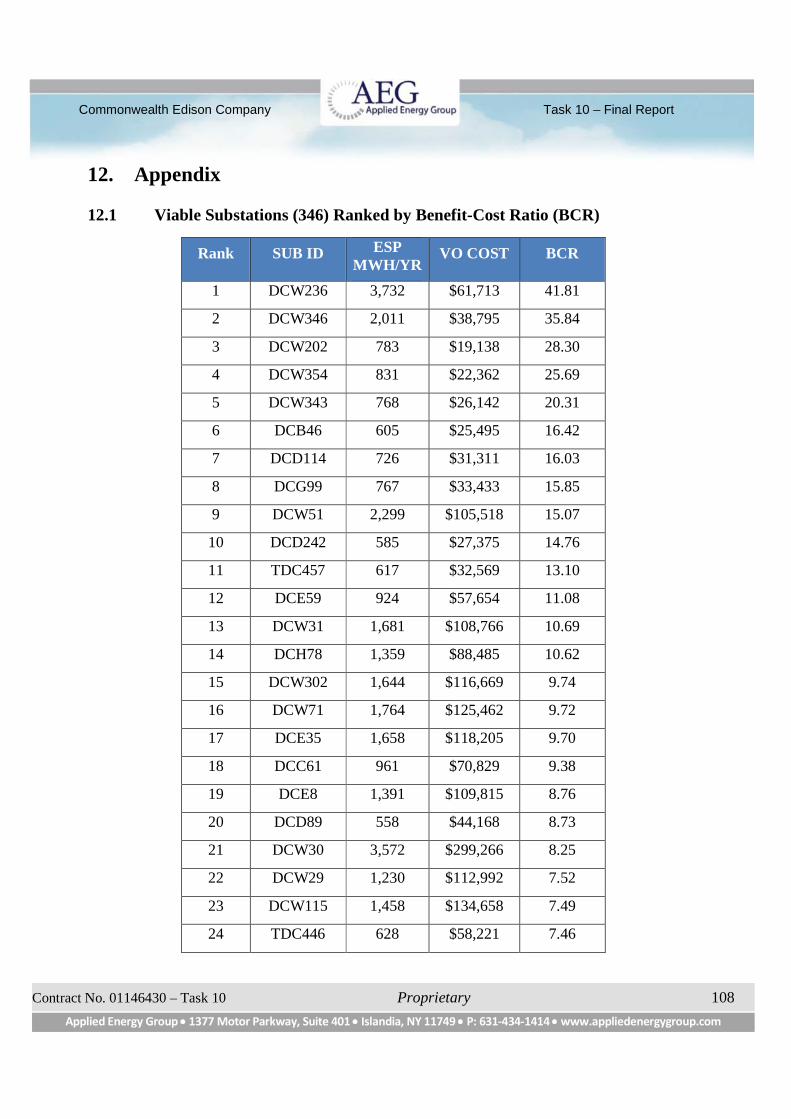
Commonwealth Edison Company Task 10 – Final Report
Contract No. 01146430 – Task 10 Proprietary 108
Applied Energy Group 1377 Motor Parkway, Suite 401 Islandia, NY 11749 P: 631-434-1414 www.appliedenergygroup.com
12. Appendix
12.1 Viable Substations (346) Ranked by Benefit-Cost Ratio (BCR)
Rank SUB ID ESPMWH/YR
VO COST BCR
1 DCW236 3,732 $61,713 41.81
2 DCW346 2,011 $38,795 35.84
3 DCW202 783 $19,138 28.30
4 DCW354 831 $22,362 25.69
5 DCW343 768 $26,142 20.31
6 DCB46 605 $25,495 16.42
7 DCD114 726 $31,311 16.03
8 DCG99 767 $33,433 15.85
9 DCW51 2,299 $105,518 15.07
10 DCD242 585 $27,375 14.76
11 TDC457 617 $32,569 13.10
12 DCE59 924 $57,654 11.08
13 DCW31 1,681 $108,766 10.69
14 DCH78 1,359 $88,485 10.62
15 DCW302 1,644 $116,669 9.74
16 DCW71 1,764 $125,462 9.72
17 DCE35 1,658 $118,205 9.70
18 DCC61 961 $70,829 9.38
19 DCE8 1,391 $109,815 8.76
20 DCD89 558 $44,168 8.73
21 DCW30 3,572 $299,266 8.25
22 DCW29 1,230 $112,992 7.52
23 DCW115 1,458 $134,658 7.49
24 TDC446 628 $58,221 7.46

Commonwealth Edison Company Task 10 – Final Report
Contract No. 01146430 – Task 10 Proprietary 109
Applied Energy Group 1377 Motor Parkway, Suite 401 Islandia, NY 11749 P: 631-434-1414 www.appliedenergygroup.com
Rank SUB ID ESPMWH/YR
VO COST BCR
25 SS311 606 $58,471 7.16
26 DCG121 732 $71,405 7.09
27 DCW50 2,255 $245,743 6.34
28 DCD80 847 $92,808 6.31
29 SS459 1,554 $171,119 6.28
30 DCD62 1,348 $149,177 6.25
31 DCD63 2,043 $226,507 6.24
32 DCH56 387 $43,633 6.13
33 DCG909 333 $37,814 6.09
34 TSS134 13,207 $1,594,750 5.73
35 DCD16 887 $109,273 5.61
36 TDC470 6,030 $746,611 5.58
37 TDC372 3,145 $392,244 5.54
38 TDC435 653 $81,748 5.53
39 DCJ87 927 $117,339 5.46
40 DCC21 325 $41,172 5.45
41 TDC505 8,499 $1,106,653 5.31
42 DCC85 679 $89,119 5.27
43 DCE17 683 $89,695 5.26
44 DCJ19 1,406 $187,939 5.17
45 DCD69 693 $92,817 5.16
46 TDC814 5,759 $773,694 5.15
47 DCE46 614 $82,918 5.12
48 TDC222 687 $92,981 5.11
49 DCD20 672 $92,808 5.01
50 TSS179 556 $76,902 5.00
51 DCW216 805 $112,234 4.96
(Continued)
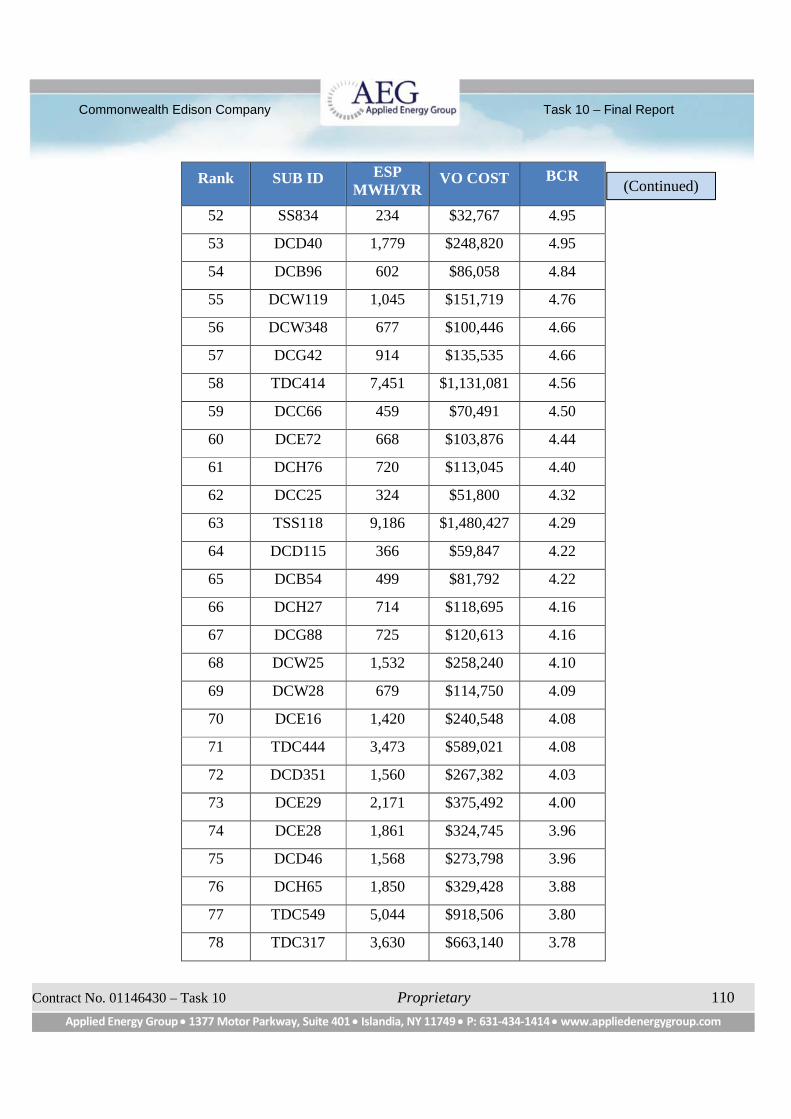
Commonwealth Edison Company Task 10 – Final Report
Contract No. 01146430 – Task 10 Proprietary 110
Applied Energy Group 1377 Motor Parkway, Suite 401 Islandia, NY 11749 P: 631-434-1414 www.appliedenergygroup.com
Rank SUB ID ESPMWH/YR
VO COST BCR
52 SS834 234 $32,767 4.95
53 DCD40 1,779 $248,820 4.95
54 DCB96 602 $86,058 4.84
55 DCW119 1,045 $151,719 4.76
56 DCW348 677 $100,446 4.66
57 DCG42 914 $135,535 4.66
58 TDC414 7,451 $1,131,081 4.56
59 DCC66 459 $70,491 4.50
60 DCE72 668 $103,876 4.44
61 DCH76 720 $113,045 4.40
62 DCC25 324 $51,800 4.32
63 TSS118 9,186 $1,480,427 4.29
64 DCD115 366 $59,847 4.22
65 DCB54 499 $81,792 4.22
66 DCH27 714 $118,695 4.16
67 DCG88 725 $120,613 4.16
68 DCW25 1,532 $258,240 4.10
69 DCW28 679 $114,750 4.09
70 DCE16 1,420 $240,548 4.08
71 TDC444 3,473 $589,021 4.08
72 DCD351 1,560 $267,382 4.03
73 DCE29 2,171 $375,492 4.00
74 DCE28 1,861 $324,745 3.96
75 DCD46 1,568 $273,798 3.96
76 DCH65 1,850 $329,428 3.88
77 TDC549 5,044 $918,506 3.80
78 TDC317 3,630 $663,140 3.78
(Continued)
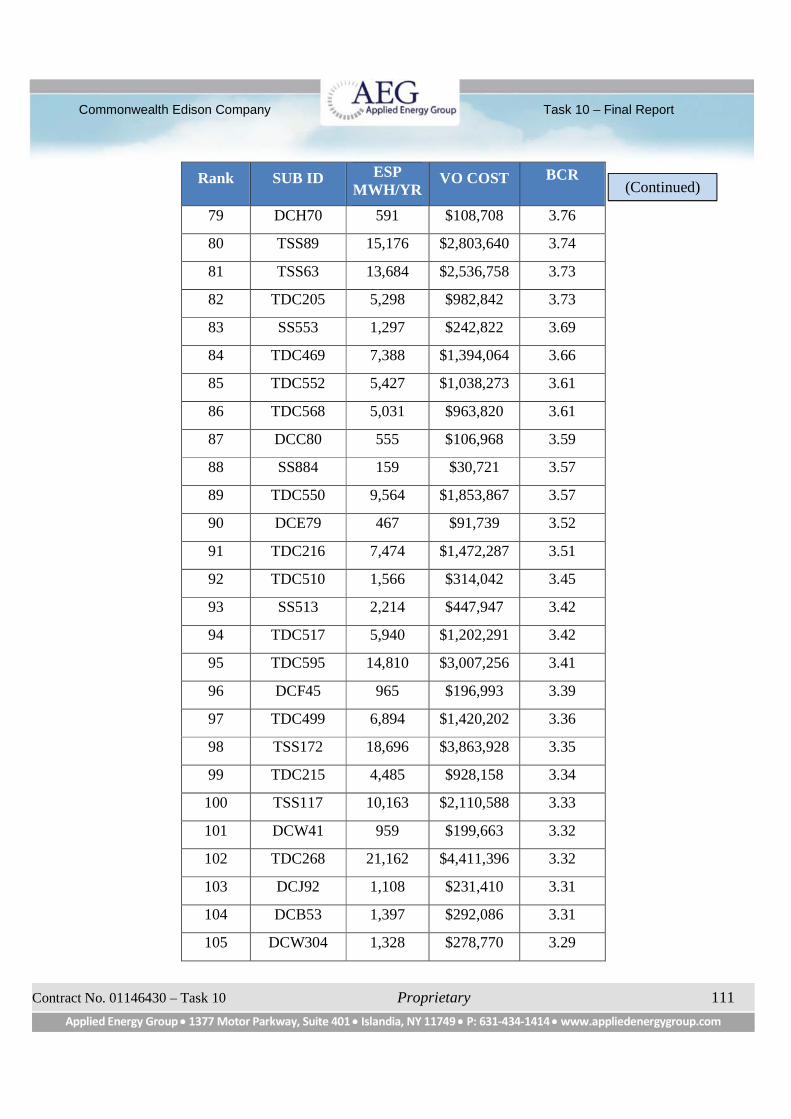
Commonwealth Edison Company Task 10 – Final Report
Contract No. 01146430 – Task 10 Proprietary 111
Applied Energy Group 1377 Motor Parkway, Suite 401 Islandia, NY 11749 P: 631-434-1414 www.appliedenergygroup.com
Rank SUB ID ESPMWH/YR
VO COST BCR
79 DCH70 591 $108,708 3.76
80 TSS89 15,176 $2,803,640 3.74
81 TSS63 13,684 $2,536,758 3.73
82 TDC205 5,298 $982,842 3.73
83 SS553 1,297 $242,822 3.69
84 TDC469 7,388 $1,394,064 3.66
85 TDC552 5,427 $1,038,273 3.61
86 TDC568 5,031 $963,820 3.61
87 DCC80 555 $106,968 3.59
88 SS884 159 $30,721 3.57
89 TDC550 9,564 $1,853,867 3.57
90 DCE79 467 $91,739 3.52
91 TDC216 7,474 $1,472,287 3.51
92 TDC510 1,566 $314,042 3.45
93 SS513 2,214 $447,947 3.42
94 TDC517 5,940 $1,202,291 3.42
95 TDC595 14,810 $3,007,256 3.41
96 DCF45 965 $196,993 3.39
97 TDC499 6,894 $1,420,202 3.36
98 TSS172 18,696 $3,863,928 3.35
99 TDC215 4,485 $928,158 3.34
100 TSS117 10,163 $2,110,588 3.33
101 DCW41 959 $199,663 3.32
102 TDC268 21,162 $4,411,396 3.32
103 DCJ92 1,108 $231,410 3.31
104 DCB53 1,397 $292,086 3.31
105 DCW304 1,328 $278,770 3.29
(Continued)
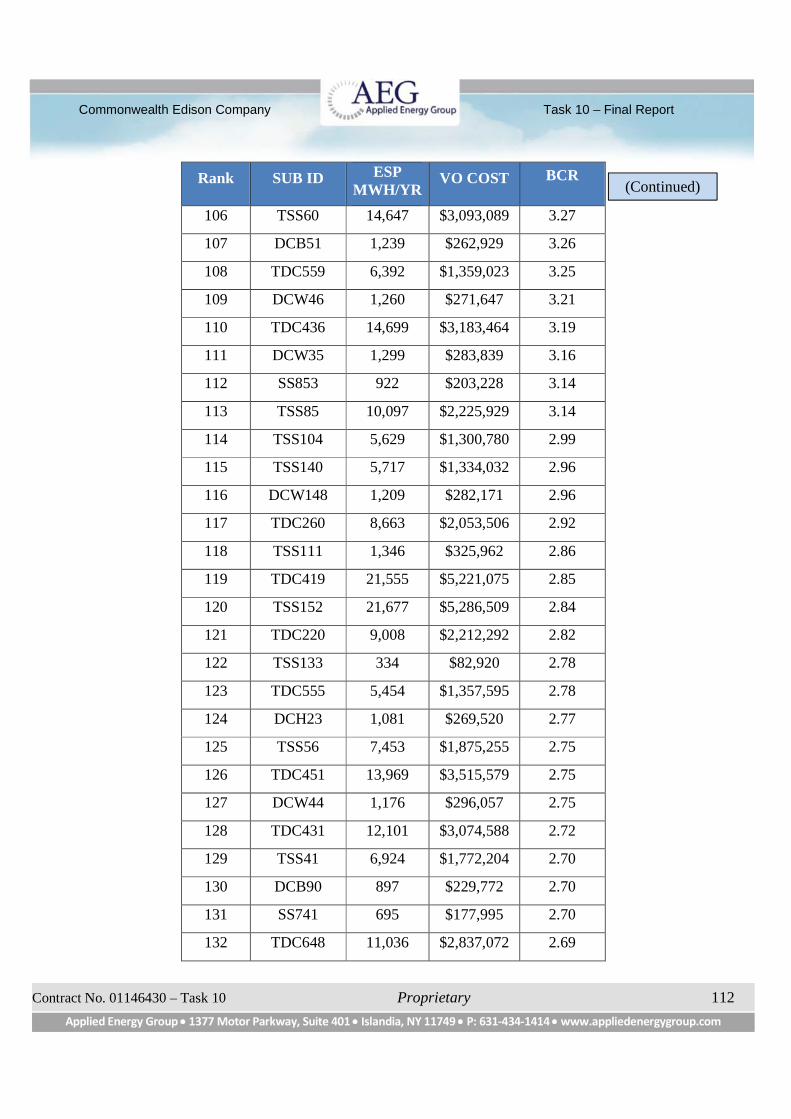
Commonwealth Edison Company Task 10 – Final Report
Contract No. 01146430 – Task 10 Proprietary 112
Applied Energy Group 1377 Motor Parkway, Suite 401 Islandia, NY 11749 P: 631-434-1414 www.appliedenergygroup.com
Rank SUB ID ESPMWH/YR
VO COST BCR
106 TSS60 14,647 $3,093,089 3.27
107 DCB51 1,239 $262,929 3.26
108 TDC559 6,392 $1,359,023 3.25
109 DCW46 1,260 $271,647 3.21
110 TDC436 14,699 $3,183,464 3.19
111 DCW35 1,299 $283,839 3.16
112 SS853 922 $203,228 3.14
113 TSS85 10,097 $2,225,929 3.14
114 TSS104 5,629 $1,300,780 2.99
115 TSS140 5,717 $1,334,032 2.96
116 DCW148 1,209 $282,171 2.96
117 TDC260 8,663 $2,053,506 2.92
118 TSS111 1,346 $325,962 2.86
119 TDC419 21,555 $5,221,075 2.85
120 TSS152 21,677 $5,286,509 2.84
121 TDC220 9,008 $2,212,292 2.82
122 TSS133 334 $82,920 2.78
123 TDC555 5,454 $1,357,595 2.78
124 DCH23 1,081 $269,520 2.77
125 TSS56 7,453 $1,875,255 2.75
126 TDC451 13,969 $3,515,579 2.75
127 DCW44 1,176 $296,057 2.75
128 TDC431 12,101 $3,074,588 2.72
129 TSS41 6,924 $1,772,204 2.70
130 DCB90 897 $229,772 2.70
131 SS741 695 $177,995 2.70
132 TDC648 11,036 $2,837,072 2.69
(Continued)

Commonwealth Edison Company Task 10 – Final Report
Contract No. 01146430 – Task 10 Proprietary 113
Applied Energy Group 1377 Motor Parkway, Suite 401 Islandia, NY 11749 P: 631-434-1414 www.appliedenergygroup.com
Rank SUB ID ESPMWH/YR
VO COST BCR
133 TSS51 5,579 $1,435,086 2.69
134 TDC557 5,321 $1,369,971 2.69
135 DCE82 1,003 $258,422 2.68
136 DCW336 1,949 $502,609 2.68
137 DCW73 594 $156,331 2.63
138 TDC240 4,819 $1,275,694 2.61
139 DCW334 727 $192,473 2.61
140 DCC33 549 $145,963 2.60
141 TSS129 9,313 $2,480,724 2.60
142 TDC487 4,841 $1,301,432 2.57
143 TSS88 6,656 $1,790,984 2.57
144 TDC566 19,305 $5,204,162 2.57
145 TDC213 19,287 $5,203,097 2.56
146 TDC581 13,454 $3,640,984 2.56
147 TDC411 5,360 $1,460,840 2.54
148 TDC221 5,306 $1,448,360 2.53
149 DCD187 1,168 $319,370 2.53
150 TSS120 9,967 $2,741,869 2.51
151 TSS57 8,322 $2,293,854 2.51
152 TDC454 10,370 $2,859,661 2.51
153 TDC440 4,769 $1,318,715 2.50
154 DCW211 852 $238,688 2.47
155 TSS59 4,724 $1,328,461 2.46
156 TDC259 8,744 $2,464,591 2.45
157 TDC416 10,355 $2,938,158 2.44
158 DCD47 585 $165,966 2.44
159 SS501 539 $154,504 2.41
(Continued)

Commonwealth Edison Company Task 10 – Final Report
Contract No. 01146430 – Task 10 Proprietary 114
Applied Energy Group 1377 Motor Parkway, Suite 401 Islandia, NY 11749 P: 631-434-1414 www.appliedenergygroup.com
Rank SUB ID ESPMWH/YR
VO COST BCR
160 TSS64 6,313 $1,824,508 2.39
161 DCH25 1,045 $302,403 2.39
162 TDC569 5,624 $1,638,994 2.37
163 TDC562 14,994 $4,386,073 2.36
164 TDC204 16,637 $4,925,515 2.34
165 DCJ13 636 $188,268 2.33
166 DCW10 1,066 $316,853 2.33
167 TDC439 5,067 $1,508,960 2.32
168 TSS149 1,296 $390,569 2.29
169 TDC572 6,031 $1,827,140 2.28
170 TDC574 13,491 $4,115,462 2.27
171 TSS79 3,585 $1,093,461 2.27
172 DCF17 947 $289,503 2.26
173 DCD255 739 $228,817 2.23
174 DCJ49 1,183 $367,607 2.23
175 TDC592 8,437 $2,621,954 2.23
176 TDC577 6,833 $2,127,235 2.22
177 TDC375 5,237 $1,638,333 2.21
178 DCE71 1,054 $333,857 2.18
179 TDC214 15,991 $5,089,788 2.17
180 DCD99 543 $174,408 2.15
181 DCE69 2,081 $672,593 2.14
182 DCB28 589 $191,288 2.13
183 TSS46 7,667 $2,494,497 2.13
184 TDC531 7,349 $2,397,480 2.12
185 DCJ18 627 $204,462 2.12
186 TDC461 13,024 $4,254,893 2.12
(Continued)

Commonwealth Edison Company Task 10 – Final Report
Contract No. 01146430 – Task 10 Proprietary 115
Applied Energy Group 1377 Motor Parkway, Suite 401 Islandia, NY 11749 P: 631-434-1414 www.appliedenergygroup.com
Rank SUB ID ESPMWH/YR
VO COST BCR
187 DCE12 1,099 $359,228 2.12
188 TDC840 15,393 $5,033,663 2.11
189 TDC443 6,675 $2,193,079 2.10
190 STA13-2 10,395 $3,419,460 2.10
191 DCW384 614 $204,688 2.07
192 TDC563 5,735 $1,912,912 2.07
193 TSS83 5,599 $1,868,220 2.07
194 DCB30 1,716 $575,311 2.06
195 TSS33 6,924 $2,322,893 2.06
196 DCJ68 1,073 $360,289 2.06
197 TDC225 3,214 $1,080,003 2.06
198 TDC580 9,869 $3,320,984 2.05
199 DCD133 544 $183,753 2.05
200 TDC539 6,207 $2,140,700 2.00
201 TDC570 11,571 $3,997,314 2.00
202 TDC561 11,856 $4,110,412 1.99
203 TSS101 8,944 $3,130,191 1.98
204 TDC458 4,016 $1,409,573 1.97
205 DCB35 155 $55,169 1.94
206 DCW340 334 $119,226 1.94
207 TDC465 7,214 $2,576,539 1.94
208 TDC406 6,119 $2,187,681 1.93
209 TSS76 4,932 $1,773,506 1.92
210 TSS136 16,183 $5,826,644 1.92
211 TSS78 5,021 $1,812,478 1.92
212 TDC593 2,970 $1,072,267 1.92
213 TSS43 4,601 $1,664,369 1.91
(Continued)
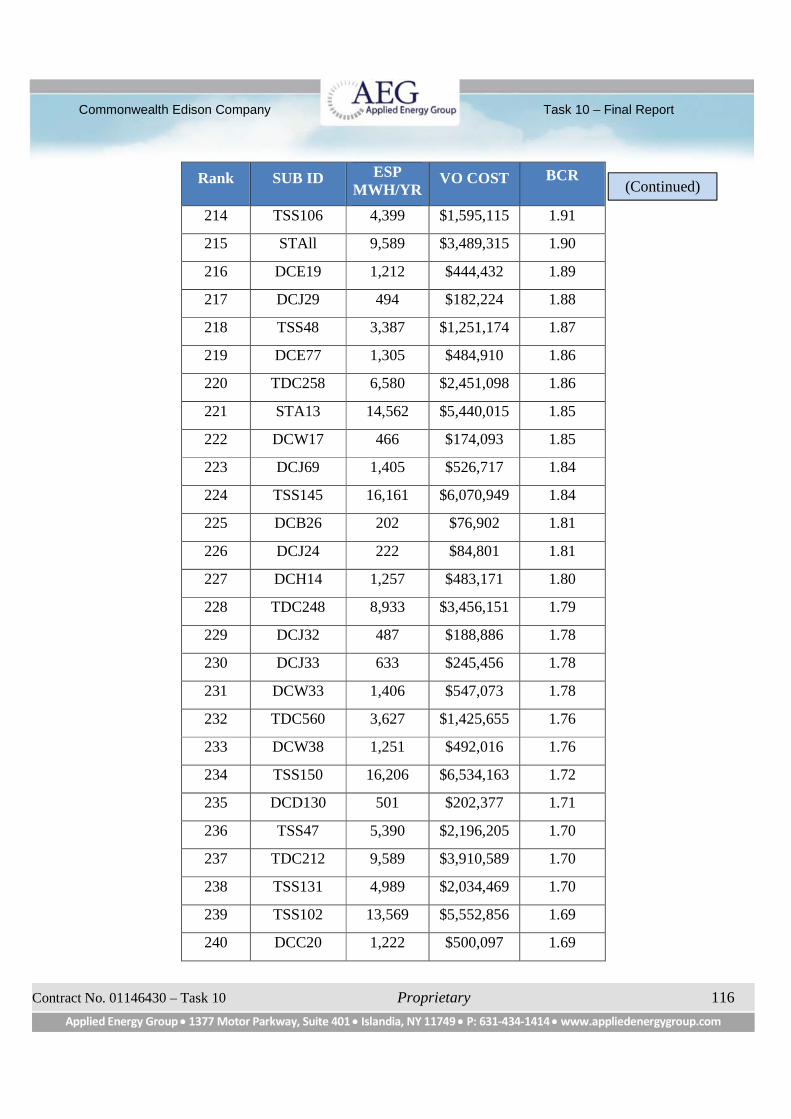
Commonwealth Edison Company Task 10 – Final Report
Contract No. 01146430 – Task 10 Proprietary 116
Applied Energy Group 1377 Motor Parkway, Suite 401 Islandia, NY 11749 P: 631-434-1414 www.appliedenergygroup.com
Rank SUB ID ESPMWH/YR
VO COST BCR
214 TSS106 4,399 $1,595,115 1.91
215 STAll 9,589 $3,489,315 1.90
216 DCE19 1,212 $444,432 1.89
217 DCJ29 494 $182,224 1.88
218 TSS48 3,387 $1,251,174 1.87
219 DCE77 1,305 $484,910 1.86
220 TDC258 6,580 $2,451,098 1.86
221 STA13 14,562 $5,440,015 1.85
222 DCW17 466 $174,093 1.85
223 DCJ69 1,405 $526,717 1.84
224 TSS145 16,161 $6,070,949 1.84
225 DCB26 202 $76,902 1.81
226 DCJ24 222 $84,801 1.81
227 DCH14 1,257 $483,171 1.80
228 TDC248 8,933 $3,456,151 1.79
229 DCJ32 487 $188,886 1.78
230 DCJ33 633 $245,456 1.78
231 DCW33 1,406 $547,073 1.78
232 TDC560 3,627 $1,425,655 1.76
233 DCW38 1,251 $492,016 1.76
234 TSS150 16,206 $6,534,163 1.72
235 DCD130 501 $202,377 1.71
236 TSS47 5,390 $2,196,205 1.70
237 TDC212 9,589 $3,910,589 1.70
238 TSS131 4,989 $2,034,469 1.70
239 TSS102 13,569 $5,552,856 1.69
240 DCC20 1,222 $500,097 1.69
(Continued)
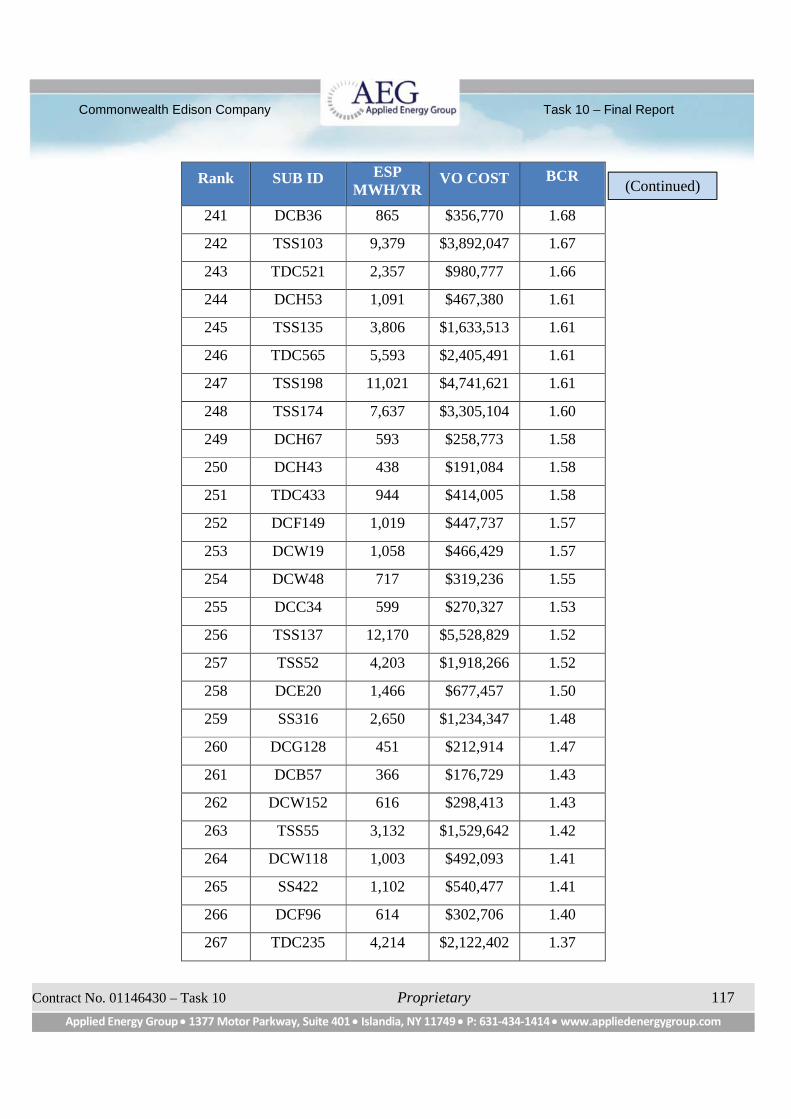
Commonwealth Edison Company Task 10 – Final Report
Contract No. 01146430 – Task 10 Proprietary 117
Applied Energy Group 1377 Motor Parkway, Suite 401 Islandia, NY 11749 P: 631-434-1414 www.appliedenergygroup.com
Rank SUB ID ESPMWH/YR
VO COST BCR
241 DCB36 865 $356,770 1.68
242 TSS103 9,379 $3,892,047 1.67
243 TDC521 2,357 $980,777 1.66
244 DCH53 1,091 $467,380 1.61
245 TSS135 3,806 $1,633,513 1.61
246 TDC565 5,593 $2,405,491 1.61
247 TSS198 11,021 $4,741,621 1.61
248 TSS174 7,637 $3,305,104 1.60
249 DCH67 593 $258,773 1.58
250 DCH43 438 $191,084 1.58
251 TDC433 944 $414,005 1.58
252 DCF149 1,019 $447,737 1.57
253 DCW19 1,058 $466,429 1.57
254 DCW48 717 $319,236 1.55
255 DCC34 599 $270,327 1.53
256 TSS137 12,170 $5,528,829 1.52
257 TSS52 4,203 $1,918,266 1.52
258 DCE20 1,466 $677,457 1.50
259 SS316 2,650 $1,234,347 1.48
260 DCG128 451 $212,914 1.47
261 DCB57 366 $176,729 1.43
262 DCW152 616 $298,413 1.43
263 TSS55 3,132 $1,529,642 1.42
264 DCW118 1,003 $492,093 1.41
265 SS422 1,102 $540,477 1.41
266 DCF96 614 $302,706 1.40
267 TDC235 4,214 $2,122,402 1.37
(Continued)

Commonwealth Edison Company Task 10 – Final Report
Contract No. 01146430 – Task 10 Proprietary 118
Applied Energy Group 1377 Motor Parkway, Suite 401 Islandia, NY 11749 P: 631-434-1414 www.appliedenergygroup.com
Rank SUB ID ESPMWH/YR
VO COST BCR
268 DCW39 1,191 $602,628 1.37
269 TDC474 3,376 $1,725,216 1.35
270 TSS151 4,576 $2,361,906 1.34
271 TSS75 7,954 $4,166,054 1.32
272 DCH91 214 $112,260 1.32
273 DCW20 827 $436,359 1.31
274 DCW12 585 $315,403 1.28
275 DCH44 341 $184,063 1.28
276 DCB86 148 $80,078 1.28
277 TDC456 2,297 $1,249,771 1.27
278 TDC217 2,279 $1,241,554 1.27
279 TSS193 6,029 $3,302,053 1.26
280 DCW335 511 $283,868 1.24
281 DCJ23 517 $287,546 1.24
282 DCE18 791 $440,381 1.24
283 TDC250 915 $511,199 1.24
284 DCW233 530 $298,878 1.23
285 DCJ65 207 $117,740 1.22
286 DCW26 648 $374,188 1.20
287 SS460 1,435 $833,972 1.19
288 DCE21 510 $296,574 1.19
289 DCH39 828 $486,599 1.18
290 DCJ66 528 $315,143 1.16
291 DCB27 521 $311,996 1.15
292 DCE26 1,341 $803,933 1.15
293 DCH47 490 $298,120 1.14
294 DCH38 197 $122,792 1.11
(Continued)
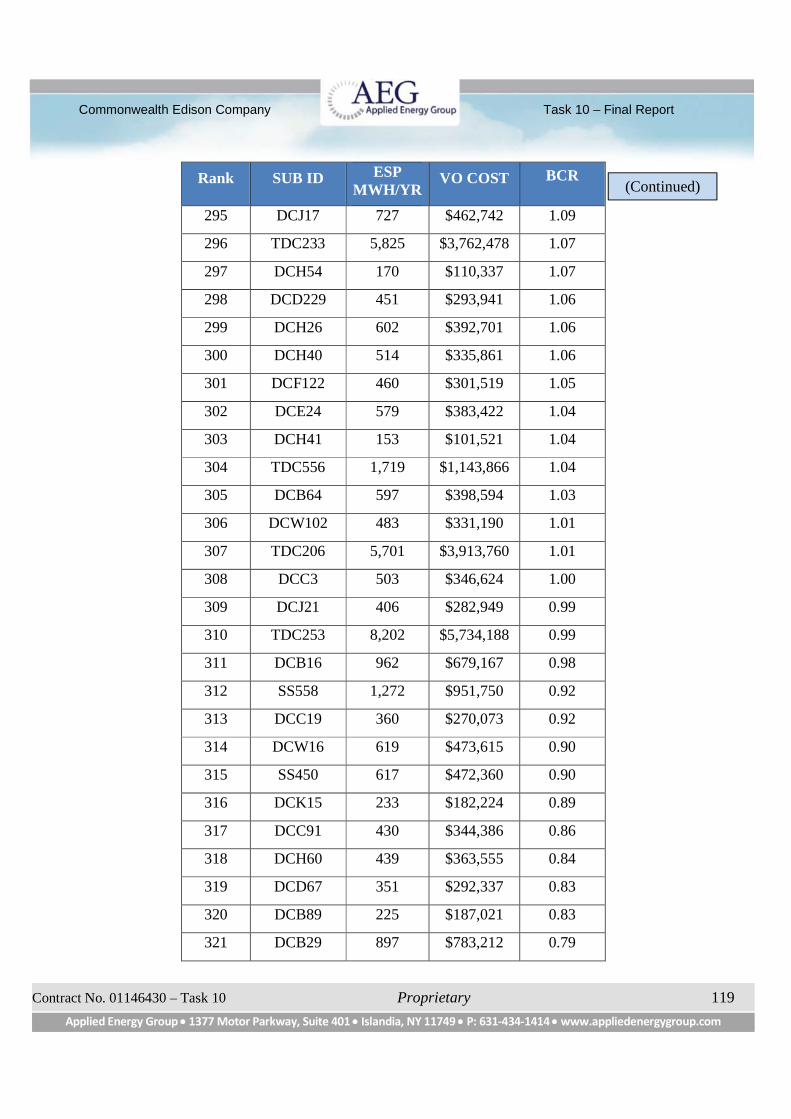
Commonwealth Edison Company Task 10 – Final Report
Contract No. 01146430 – Task 10 Proprietary 119
Applied Energy Group 1377 Motor Parkway, Suite 401 Islandia, NY 11749 P: 631-434-1414 www.appliedenergygroup.com
Rank SUB ID ESPMWH/YR
VO COST BCR
295 DCJ17 727 $462,742 1.09
296 TDC233 5,825 $3,762,478 1.07
297 DCH54 170 $110,337 1.07
298 DCD229 451 $293,941 1.06
299 DCH26 602 $392,701 1.06
300 DCH40 514 $335,861 1.06
301 DCF122 460 $301,519 1.05
302 DCE24 579 $383,422 1.04
303 DCH41 153 $101,521 1.04
304 TDC556 1,719 $1,143,866 1.04
305 DCB64 597 $398,594 1.03
306 DCW102 483 $331,190 1.01
307 TDC206 5,701 $3,913,760 1.01
308 DCC3 503 $346,624 1.00
309 DCJ21 406 $282,949 0.99
310 TDC253 8,202 $5,734,188 0.99
311 DCB16 962 $679,167 0.98
312 SS558 1,272 $951,750 0.92
313 DCC19 360 $270,073 0.92
314 DCW16 619 $473,615 0.90
315 SS450 617 $472,360 0.90
316 DCK15 233 $182,224 0.89
317 DCC91 430 $344,386 0.86
318 DCH60 439 $363,555 0.84
319 DCD67 351 $292,337 0.83
320 DCB89 225 $187,021 0.83
321 DCB29 897 $783,212 0.79
(Continued)
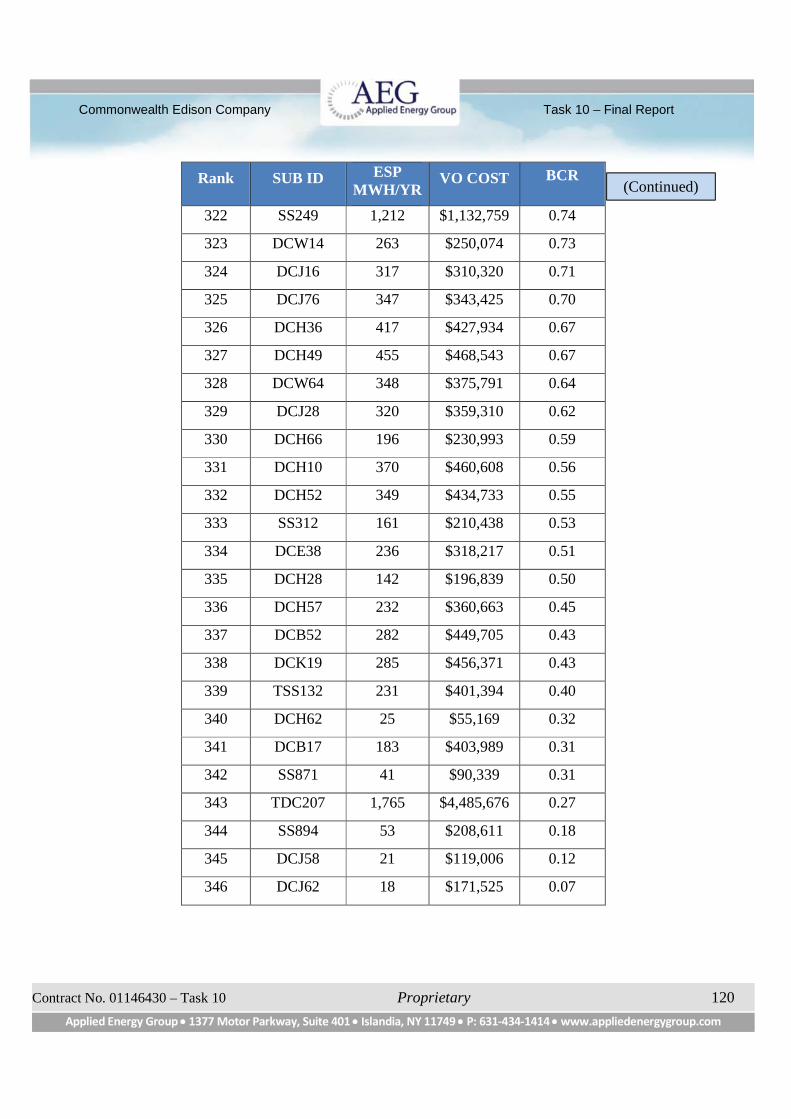
Commonwealth Edison Company Task 10 – Final Report
Contract No. 01146430 – Task 10 Proprietary 120
Applied Energy Group 1377 Motor Parkway, Suite 401 Islandia, NY 11749 P: 631-434-1414 www.appliedenergygroup.com
Rank SUB ID ESPMWH/YR
VO COST BCR
322 SS249 1,212 $1,132,759 0.74
323 DCW14 263 $250,074 0.73
324 DCJ16 317 $310,320 0.71
325 DCJ76 347 $343,425 0.70
326 DCH36 417 $427,934 0.67
327 DCH49 455 $468,543 0.67
328 DCW64 348 $375,791 0.64
329 DCJ28 320 $359,310 0.62
330 DCH66 196 $230,993 0.59
331 DCH10 370 $460,608 0.56
332 DCH52 349 $434,733 0.55
333 SS312 161 $210,438 0.53
334 DCE38 236 $318,217 0.51
335 DCH28 142 $196,839 0.50
336 DCH57 232 $360,663 0.45
337 DCB52 282 $449,705 0.43
338 DCK19 285 $456,371 0.43
339 TSS132 231 $401,394 0.40
340 DCH62 25 $55,169 0.32
341 DCB17 183 $403,989 0.31
342 SS871 41 $90,339 0.31
343 TDC207 1,765 $4,485,676 0.27
344 SS894 53 $208,611 0.18
345 DCJ58 21 $119,006 0.12
346 DCJ62 18 $171,525 0.07
(Continued)