vi1 of chemistry e koheda et unclassified eeeeess~i
TRANSCRIPT
ARD-A1,69 6S2 INTRINSIC S102 FILM STRESS MEASUREMENTS ON THERMALLY vi1p OXIDIZED SI(U) NORTH CAROLINA UNIY AT CHAPEL HILL DEPT
OF CHEMISTRY E KOHEDA ET AL. 26 JUN 96 TR-7
UNCLASSIFIED M99I±4-83-K-0571 F/'G ?/4 M
EEEEEss~i
I Lff..fffffl

'.---- ' -'-,, - -.-. ,,.,., - .,, . . . . . - . .. ' . -- ' -
[*6
- 1 *321111111111f 2.2
11111 1.25 jfjJ;: jjj16.-!~
MICROCOPY RESOLUTION TEST CHART
NATIONAL BOREAU OF STANDARDS-1965-
-...i. ,,,
Z..-.
. . 7 -. -~ -* *- -: .- -
~........................... ,:;N'

0
OD
(OFFICE OF NAVAL RESEARCH
Contract No. N00014-83-K-0571
Task No. NR 625-843
TECHNICAL REPORT NO. 7
INTRINISIC SIO 2 FILM STRESS MEASUREMENTS ON THERMALLYOXIDIZED Si
by
E. Kobeda and E.A. Irene
Dept. of ChemistryThe University of North Carolina
Chapel Hill, NC 27514
in
J. Vac. Sci. and Technology
3 DTELECTEf
L., JUL07 1986'.
~ E
Reproduction in whole or in part is permitted for any purpose of the UnitedStates Government.
This document has been approved for public release and sale; its distribution
is unlimited.
8 7 3 074.

SECURITY CLASSIFICATION OF THIS PAGE/6 60cREPORT DOCUMENTATION PAGE
1. REPORT SEC:URITY CLASSIFICA1 ION lb RESTRICTIVE MARKINGS
Unclassified2e SECURITY CLASSIFICATION AUTHORITY 3 DiSTRIBUTIONAVAILABILITY OF REPORT
Approved for public release; distribution2b OECLASSIFICATION,OOWNGRAOING SCHEDULE unlimited.
4 PERFORMING ORGANIZATION REPORT NUMBERIS) 5 MONITORING ORGANIZATION REPORT NUMBER(S)
Technical Report #7
6. NAME OF PERFORMING ORGANIZATION 6. OFFICE SYMBOL 7a NAME OF MONITORING ORGANIZATIONSIf appicabic,
UNC Chemistry Dept. Office of Naval Research (Code 413)
6c ADDRESS rCi, Slate and ZIP Code, 7b ADDRESS ICty, Stale and ZIP Code)
11-3 Venable Hall 045A Chemistry ProgramChapel Hill, NC 27514 800 N. Quincy Street
Arlinton. Virginia 22217am NAME OF F,)NDING,'SPONSORING Bt OFFICE SYMBOL 9 PROCUREMENT INSTRUMENT DENTIFICATION NUMBER
ORGANIZATION 'If applicable,
Office of Naval Research Contract #N00014-83-K-0571
8. ADDRESS ;t, -ta, and /1' (.,dII,. 10 SOURCE OF F UNDING NOS
Chemistry Program PROGRAM PROJECT TASK WORK UNIT
800 N. Quincy, Arlington, VA 22217 ELEMENT NO NO NO NO
Il TITLE Inc-,,, S.ec..ti C1aIca, n, .. INTRINSIC SiO FILM " NR625-843
STRESS MEASUREMENTS QN THFRMAT-T.Y QYTT7ZFD Si12 PERSONAL AUTHIORISP
E. Kobeda and E.A. Irene13 T PE OF REPORT 13b TIME COvERED 14 DATE OF REPORT lr Ito Ua:, 15 PAGE COUNT
Interim Technical FROM TO _ - 6/20/86 2616 SUPPLEMENTARY NOTATION
Prepared for publication in J. Vac. Sci. and Technol.
17 COSATI CODES 18 SUBJECT TERMS (,ini." on rl't,rs, If nccssa.- and ident.(s by block numb',v
* ELO CRC.P 7 SUB H Silicon OxidationSilicon Dioxide PropertiesThin Film Growth Models
19 ABtJACT (f ntinue on rveew if ne,-,'ssjr- qnd tdent(I bs biock ,v,be
'We have investigated the effects of varying Si oxidation conditions on intrinsic filmstress for SiOl films formed on Si. This study includes stress measurements on four Siorientations: 2(00), (110), (111), and (311); at oxidation temperatures ranging from70]0-II0OC; wet (1190) vs. dry (0) oxidations for (100) and (111) sarfaces; and the effect.(f post-oxidation annealing on stress. We find an orientation dependence for intrinsicstress which scales in the following manner: (110) > (311) > (100) > (111); a reductionin stress or wet vs. dry studies; and an even larger reduction for post-oxidation anneals.A recently proposed step model seems to account for the differences in stress with Siorientation. A number of Si oxidation models based on intrinsic stress are compared intheir ability to describe the observed behavior, and we conclude that within the Deal-grove oxidation model, the linear rate constant is strongly influenced by stress in theinitial regime while stress is also likely to he important for thicker films.
20 DISTRIBUTIONAVAiLABILITY OF ABSTRACT 21 ABSTRACT SECURITY CLASSIFICATION
LINCLASSIFEOUNLIMI-ED K SAMt AS RPT L TIC uSERS Unclassified
22. NAME OF RESPONSIBLE INDIVIDUAL 22t, TE LEP-ONE NUMBLR 22c OFF ICE SYMBOLI,, I I %Jc' ( G .' d)r. David L. Nelson (202) 696-4410
DO FORM 1473,83 APR EDTON OF I jAN 73 oBSoL E
- ,,. . ....... ,: .'.'..', ... ,,., ,.,........,.,,., . -........... -: .........

Intrinsic SiO 2 Film Stress Measurements$2on Thermally Oxidized Si
by
E. Kobeda and E.A. Irene
Dept. of Chemistry
The University of North Carolina
Chapel Hill, N.C. 27514
K r
'NSPET[" "
A44-.

Abstract
We have investigated the effects of varying Si oxidation conditions on
intrinsic film stress for SiO 2 films formed on Si. This study includes stress
measurements on four Si orientations: (100), (110), (111), and (31]); at
oxidation temperatures ranging from 700-1100C; wet (H20) vs. dry (02)
oxidations for (100) and (111) surfaces; and the effects of post-oxidation
annealing on stress. We find an orientation dependence for intrinsic stress
which scales in the following manner: (110) > (311) > (100) > (111); a
reduction in stress for wet vs. dry studies; and an even larger reduction for
post-oxidation anneals. A recently proposed step model seems to account for
the differences in stress with Si orientation. A number of Si oxidation models
based on intrinsic stress are compared in their ability to describe the
observed behavior, and we conclude that within the Deal-Grove oxidation model,
the linear rate constant is strongly influenced by stress in the initial regime
while stress is also likely to be important for thicker films.

TV~~~~~~ ~ ~ ~ ~ ~ I. I. VI. .T.'-17-rr -- 7 .-7.7-7T -7
Introduction
Recent trends in the microelectronics industry have facilitated the need
for smaller and faster MOS devices. For technology to continue to advance, a
greater understanding of processing and characterization of microelectronic
materials is required. The oxidation of Si to SiO 2 for use as gate dielectrics
in lK)SFET's is probably the most important process step in the fabrication of
integrated circuits. As a consequence of scaling, future VLSI advances require
smaller film thickness (<20 0 R) and lower oxidation temperatures (< 900°C).
The kinetics of the thermal oxidation of Si have been explained using the
Deal-Grove linear-parabolic model (1). This model seems to work well for
thicker oxides grown at higher oxidation temperatures, where kinetics are
oxidant transport limited, but does not account for anomalous kinetic behavior
(1-4) observed for the initial oxidation regime. In recent years, several
studies have reported the observation of an intrinsic SiO 2 film stress
resulting from thermal oxidation of Si at low temperatures (5-8). A number of
models have been proposed which consider stress to be influential on either the
interface reaction (9,10) or the diffusivity of oxidant species through a
strained oxide (11,12,13). The origin of the intrinsic film stress has been
attributed to a lack of viscous flow in SiO at lower temperatures ((1000 0C)2
(5,7) arising from an inability to accomodate the volume change in converting
Si to SiO 2 .
We report new measurements on the orientation dependence of stress for
four Si orientations ((100), (110), (111), and (311)) using a previously
3
:7I

described visible light double beam reflection technique (8). An orientation
dependence has been reported (1-4) for the thermal oxidation of Si,
particularly in the early stages of oxidation. More recently, both theoretical
(10) and experimental (14) observations have included the effects of mechanical
properties on the Si-SiO 2 interface and on the early stages of oxidation.
Other studies (11,12,13) also include the effects of interfacial stresses on
oxidation kinetics using the transport limitation of oxidant through a stressed
film. In this study, we utilize the reported stress data to test both the
interface and transport models. Since it was reported that high temperature
annealing (15) and H 20 oxidation ambients (1,16) alter the oxidation kinetics,
we also report in this study the effects of other varying oxidation conditions
on intrinsic film stress, viz. wet vs. dry oxidation, and post-oxidation
annealing, and then compare these results with the models. We find that a
surface step model (17,18) explains our experimental findings and thus surface
steps are a potentially important part of the oxidation phenomena.
Experimental Procedures
Sample preparation.
The measurement of intrinsic SiO 2 film stress was performed on four Si
substrate orientations: (100), (110), (111), and (311). A slightly modified
RCA cleaning method (19) was used to clean all samples prior to oxidation,
which was performed under atmospheric pressure using dry 02 (less than 5 ppm
H 20 and .5 ppm hydrocarbons). For all oxidation experiments performed in this
study, the furnace was maintained with a flowing N2 ambient obtained directly
4

VT
from a LN2 source when oxidations were not in progress. A series of
temperatures from 700-1100C was investigated for all orientations and samples
were usually oxidized together to minimize slight differences in conditions.
The Si wafers used were commercially obtained single crystal Si wafers with the
following characteristics: (100), (110), (111)- 2 ohm-cm, p-type, 1-1.5 in.
diameter; and (311)- 5 ohm-cm, n-type, 1.25 in. diameter. All four orientations
were polished on one side and approximately 8-11 mil thick prior to oxidation.
For the accurate measurement of strains for this substrate thickness,
approximately 10009 of SiO 2 was required to obtain sufficient deformation (8).
The range of oxide thickness was approximately 1000-10,000 R for the
experiments reported in this study. Once the samples were oxidized under
normal conditions the SiO 2 film thickness was measured using ellipsometry with
an accuracy of + 0.010 for the angular settings of the optical components and
the angle of incidence, thus yielding less than 2% error in film thickness.
After oxidation and thickness measurements, the oxide was removed from the
unpolished back side of the wafer and the strain was measured in a manner
previously reported (8) and briefly described below.
The effects of oxidizing Si in a H 20 containing ambient were also
investigated. A quartz bubbler was placed in series with a gas feed line to
the resistively heated furnace, and dry 02 was bubbled through to provide the%"
%2
-' wet oxidation ambient at I atm pressure. These oxidations were performed on
(100) and (111) oriented Si at oxidation temperatures of 700 and 800*C. It
should be noted that this experiment was not an actual steam oxidation, since
the quartz bubbler was kept at room temperature. It was estimated that this
resulted in an order of magnitude less H 20 compared to a typical steam
5
AI

oxidation, but we anticipate similar oxidation behavior (16). It has been
previously established (20,21) that even traces of H 20 profoundly affect the
oxidation rate and many physical properties of the SiO 2 film, but in light of
the concentration of H 20 (105 ppm) in the ambient used here our results are
compared directly with steam oxidations.
Post-oxidation anneals were performed on (100) and (111) samples in N2 for
one hour at 1000C in order to investigate stress relaxation. The samples were
initially dry oxidized at 700 and 80000 in 1 atm 0 and the wafer deformation
(strain) was measured. The samples were remeasured after annealing, and a
direct comparison of unannealed vs. annealed samples was thus obtained.
Strain measurements.
We have previously reported the details of the use of a double beam (He-Ne
laser) reflection technique to measure Si wafer strain resulting from the
oxidation process (8). This is accomplished by measuring the deviation of two
parallel laser beams which are reflected from a sample. From these
measurements the radius of curvature (R) of a sample can be obtained within
about 5% error as determined using calibration standards, and the average total
stress can be derived according to Stoney (22):
20-f Ets2/6(1-v)tf R (1)
whtre E and v are Young's modulus and Poisson's ratio of Si, respectively, and
t and tf are the substrate and film thickness in meters, respectively. The
values of E/l-v for all four Si orientations and SiO are reported in Table 1.2
Equation (1) is based on the assumption that the stress distribution is
isotropic (26) and that no plastic deformation occurs. Since the measurement
6

IV
was performed at room temperature, equation (I) yields the total film stress,
which is the sum of the thermal expansion and the intrinsic stress components.
Thermal expansion stress results from a difference in thermal expansion
coefficients, cK, for Si and SiO 2 as follows:
oth(T) = T° (E/l-v)(SxO-x )Si) dT (2)
where, T and T are the oxidation temperature and the temperature at which theox
stress is measured (room temperature), respectively (27), and E and v are
Young's Modulus and Poisson's ratio of the SiO 2 film. If one assumes that
Young's Modulus and the thermal expansion coefficient of the film do not change
significantly over the temperature range, then equation (2) can be approximated
by
Oth = /\ac/\TE/(I-v) (3)
Note that the thermal expansion stress is zero at the oxidation temperature and
develops as the sample cools to room temperature. Thus, the thermal expansion
stress cannot affect oxidation kinetics at T but could influence other roomox
temperature properties. For Si-SiO 2 samples, o-th results in compression in
the oxide since the thermal expansion coefficient of Si is 2.6 X 1O- 6 °C-1
(28), and is approximately five times that for SiO 2 0.52 X 10- 6 aC-I (25).
By calculating the thermal stress using equation (3), the intrinsic stress
can be determined by the difference between the thermal and total stress (Eq.
(1)). Thus, the intrinsic film stress o. is:1
a-i = -f - Cth (4)
where o-f is the total film stress and o-th the thermal expansion stress as
shown in the previous equations. Measurements of o-. in our laboratory
resulted in an average standard deviation of approximately 0.5xlO9 dyn/cm 2
7
% *2C.K
obtained over all temperatures reported.
Results and Discussion
As pointed out above, a number of relevant oxidation models have been
proposed that contain either an explicit or implicit Si orientation dependence
and/or characteristic behavior with differing oxidation ambient and/or
annealing conditions. In the following sections we discuss some of the
published models in view of both our new stress data and other relevant
published results. It is instructive to point out here that while we have
drawn conclusions from our experimental results on stress, this analysis is
based on oxide thicknesses which are for the most part greater than 000R. It
is conceivable that the observed stresses differ considerably at smaller oxide
thickness (early stages of oxidation). A suitable techniaue for such
measurement is not yet available but work on this topic is currently being
carried out in our laboratory.
Orientation Effects
Figure 1 shows the intrinsic stress as a function of oxidation temperature
for all four orientations studied. We observe that all orientations display an
intrinsic compressive SiO 2 film stress that increases with decreasing oxidation
temperature. This result agrees both with past stress measurement results
(6,7,8) and with the proposed viscous flow model (5,7) which explains the
origin of this intrinsic stress as a result of the unsatisfied volume
requirement of the oxidation reaction of Si to form a SiO 2 film constrained by
8
._ . . . . . .

adhesion in the plane of the Si surface. It should be noted that a small
numerical error in calculating thermal stress was made in our previous results
(8) and in fact no tensile intrinsic stress results in the oxide as suggested
by our previous plots demonstrating viscons flow, Figs. 3 and 4, ref. (8). We
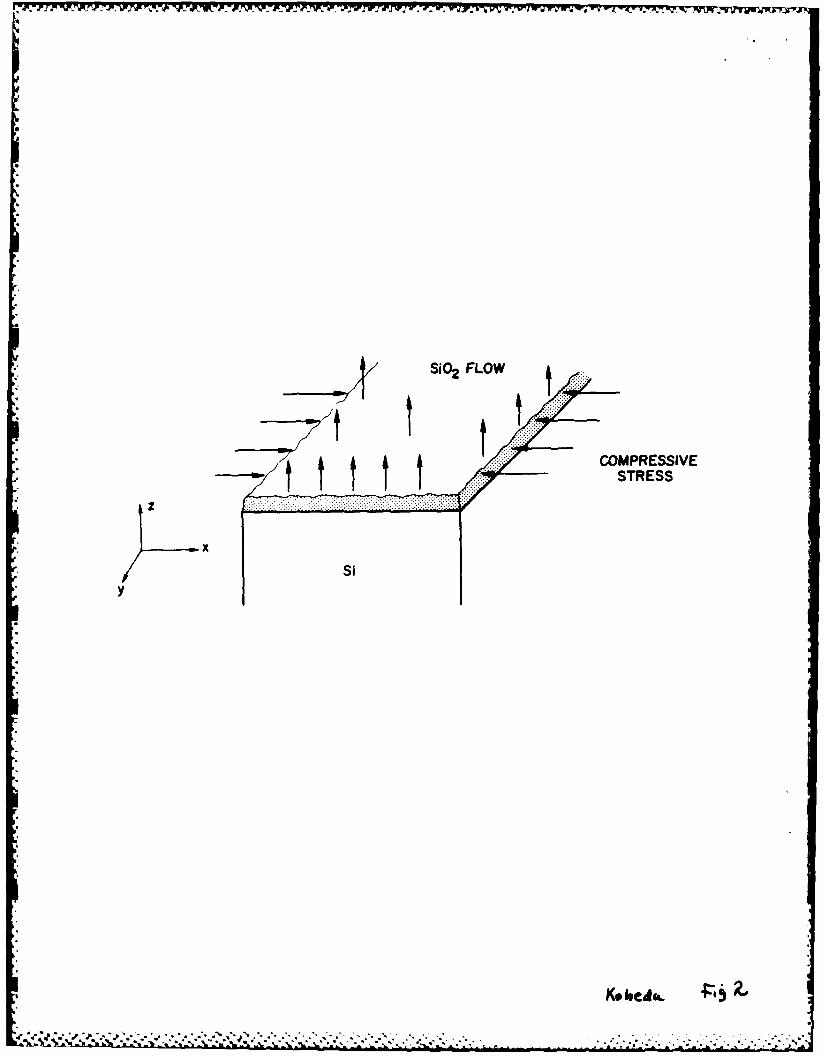
now recount the essential features of the viscous flow model (7). Figure 2
illustrates that the oxidation caused compressive stress in the x,y plane of Si
causes the relaxation of the film into the z direction. Representing SiO 2 as a
Maxwell viscoelastic solid, the rate of viscous flow d4 /dt for a constantz
applied stress in the o- plane isxy
d4z /dt =xy /Oox (5)
where is the oxide viscosity. The rate of viscoelastic relaxation depends
on the temperature coefficient of the viscosity, E0 , as shown below:".
]jox(r) = ]joexp(E]j/RT) (6)
where is a pre-exponential constant and E the energy of activation for
viscosity. At higher temperatures, 0ox decreases rapidly and the SiO 2 flows
freely in the z direction. For low temperature oxidations (< 1000*C), the
substantially larger oxide viscosity precludes relaxation during normal
oxidation times. The Maxwell model results in the following equation for
stress relaxation:
0- = o- exp(-t/tC) (7)0
where o- is the maximum oxide stress, t the oxidation time, and - the0
characteristic relaxation time (7). In a recent publication (8) we confirmed
previous data (5-7) that intrinsic stress increases as a function of decreasing
oxidation temperature according to the predictions of this model.
It is apparent that the linear-parabolic, L-P, oxidation model (1) has
9
neither an explicit Si orientaiton dependence nor any intrinsic stress
dependence. This Si oxidation model that considers a steady state in the
oxidant flux and the interface reaction results in an integrated rate equation
of the form:
t-t (L 2 -L 2 )/k + (L-Lo)/k 1 (8)
where L and t are the oxide thickness and oxidation time, respectively; L and0
t define the initial oxidation regime which does not conform to L-P kinetics;
and kI and k define the linear and parabolic rate constants, respoctively.p
Implicit in k I is the number of Si atoms on the particular orientation in
question. A modified form of the L-P model has recently been proposed (10).
For the present purposes, only the formulation of the revised linear rate
constant is germane. The revised k1 is explicit with respect to the areal
density of Si atoms, GSiy intrinsic stress, o- , and oxide viscosity, as:
k I Sc Csi-xy/ox (9)
The orientation dependence is direct through C Si and indirect within O-xy ,
since the stress is proportional to Young's modulus, E:
o- = E4 (10)
where 4 is the strain. This revised model was recently employed to explain a
crossover effect observed in the very early stages of oxidation (14) for the
* major Si orientations ((111), (110), (100)). It was found that the (110)
surface exhibited a faster oxidation rate than the (I11) in the very early
stages of oxidation, with the (111) surface dominating the rate order after a
crossover point of characteristic oxide thickness (4,14,24). According to
Figuro I and equation 9 above, we deduce that the (110) should be the fastest
oxidizing surface. The (110) not only has the largest areal density of Si
10
-. -" -} - . -.' . . '- ... ' . .- . - --. 6 - . * "- . - . . . . .. *.•* - *--- . - .- .- -*

atoms (29) for these three major orientations, but also has the highest
measured stress. This finding is somewhat different than was previously
reported (14). The previous study was without the benefit of the stress
measurements herein reported and relied on theoretical predictions of the
orientation behavior of the stress, and therefore it was thought that the
orientation dependence of the stress should be ordered according to the
orientation dependence of E/l-v. This is so because the oxidation induced
strain is constant as a result of the same volume change for all the
orientations. This order (24) is as follows:
(111) > (110) > (100)
and this order should dominate in a stress dominant region. With this in mind,
it was previously assumed that this stress dominant regime commenced above the
crossover where the (Ill) Si orientation was found to oxidize the fastest.
Now, however, our stress measurements show that the (111) has a small relative
stress. Therefore, we now conclude that both areal density and measured oxide
stress are important at the outset of the oxidation, and their product scales
initially with the oxidation rates according to equation (9). This conclusion
is reasonable since the intrinsic stress is tensile in the Si and thus the
stretched Si-Si bonds on the surface are likely easier to react. When the
oxide becomes sufficiently thick and the diffusion regime commences, the
intrinsic compressive oxide stress alters the oxidation order in favor of the
(111) since smaller compressive stress in the oxide reduces the diffusivity
least for the (111) surface. This latter idea on the effect of stress on
diffusivity has been discussed by several authors (11,12,13).
The surface step model proposed by Mott (17) in conjunction with very
11
.................................. --. *--*--...

recent results of Leroy (18) show how it may be possible to form SiO2 on Si
without the necessity for the buildup of a large intrinsic stress. This Mott
model is pictorially illustrated in Figure 3 in which a Si surface with an
atomic step is shown. If oxidation takes place predominantly at steps (edge or
kink sites), the oxide film advances with a volume expansion laterally as well
as normal to the surface. In this manner a large fraction of the stress is
relieved as the film grows. While Mott did not discuss an orientation
dependence for the substrate, the work of Hahn and Henzler (30) gives evidence
for such a relationship. These workers used a LEED technique employing spot
broadening measurements to establish that various process parameters such as
substrate orientation and oxidation and annealing conditions alter the number
of surface steps. In the comparison of (Il) and (100) Si orientations under
identical treatments, they report approximately a factor of two larger density
of edge atoms for (il) samples. Thus, combining this finding with the Mott
model we may expect a lower experimental stress than that which is calculated
based on the E/i-v value and a constant volume change strain. Therefore we
conclude that the revised linear rate constant although accounting for stress
and areal Si densities still requires modifications perhaps in accordance with
the Mott step model.
Leroy (18) has recently been able to quantitatively account for the
orientation dependence of our stress data. He considers the resolution of the
biaxial stress in the plane of the variously oxidized Si surfaces to the
appropriate slip plane in the Si. He compares this resolved stress, o-, to the
critical shear stress, -C for Si for the orientations. When t is exceeded,
defects are produced in the Si which are later oxidized away. The result is
12

different residual stress. Leroy's calculations require lateral oxidation at
steps and is therefore consistent with the Kott step model (17).
The (311) orientation was included for study because it has been reported
to have about a 25% greater areal density of Si atoms than the (110) (29) and
an intermediate value for E/l-v, although this value is not isotropic in the Si
surface (24). In accordance with the revised linear rate constant we might
expect a higher initial oxidation rate compared with the (100). However, it
has been observed that the (311) surface shows a very similar oxidation rate
compared to that for the (100) (24), and therefore a considerably lower rate
than the (110) surface. Figure I shows comparable stresses for the (311) and
(100) planes. While we are not yet certain of the reason for these
discrepancies, it is believed that the (311) surface actually has only a
slightly greater areal density than the (100) (31) and thus with a similar
intrinsic stress should display an oxidation rate similar to the (100) as we
observe. This is based on the idea that the (311) plane is vicinal to the
(100) and (111) surfaces (24,32). Further work is in progress on this point.
Three recent models (11,12,13) treat the possible effects of stress on the
transport of oxidant through an SiO 2 film during oxidation. According to
Fargeix et al (12) and Camera Roda et al (13) the conditions that yield the
lowest intrinsic stress should also yield the fastest rate, since these authors
couple an increased compressive stress with decreased diffusivity. The
distribution of stress is also considered to affect the shape of the thickness
time oxidation curves. Not readily explained by these stress-diffusion models
is our finding that the (110) surface displays both the greatest rate and the
largest stress. For larger SiO 2 film thicknesses where the (Ill) orientation
13

* .- - - .- - A , . _ - - j, j : - _ .: : . -, j .l. -. - 4r ; r- - - - .
displays the larger oxidation rate, the stress-diffusion models give the
* correct order. One study (12) uses this stress-diffusion model to predict the
shape of the very initial regime. The model proposed by Doremus (11) has no
explicit orientation dependence, but is very similar to the other proposed
transport models (12,13) in that it considers D to decrease with increasing
compressive stress. Here also the Si orientation dependence in the very
initial regime is not explained. Doremus mentions (11) that his model probably
does not account for dry 02 oxidations which exhibit an anomalous initial
regimo. While with this comment in mind the latter model seems to represent
-h.' cbservations, we show below that intrinsic stress is significantly reduced
.or 11,,k) oxidation ambients and thus less effective in altering the oxidation
Oxidation Ambient and Annealing
igures 4 and 5 show that for both the oxidations carried out in an H 02
ng ambient and for post oxidation inert ambient annealing, the
* V ant intrinsic stress is decreased from, the dry oxidation case for both
* iolis stud ied. Previous oxidation kinetics studies have shown that H20
..ng 02~ nbients exhibit an increased oxidation rate over the rate
e, ov oyto the presence of H 0, a more virulent oxidant than 0,
:nce this rate enhancement effect was seen mainly for the parabolic
* )isLant (16) which is associated with the transport of oxidant (1), this
.a. s xpl.ined by co nsidering the effect of H,0 on transport of the major
0,. H20 is known to react with the Si-O-Si network with the formation
, ! ,H groups. The result is a marked decrease in the oxide viscosity (33).
14

- ~ ~ ~ T -..-. . . .-- 97-
This argument is now further substantiated by the presently reported reduced
intrinsic stresses for oxidations performed in the H20 containing ambients.
Furthermore, the present results are in accord with a previous study that
-. showed a reduced relaxation time for the intrinsic stress and refractive index
for anneals in a H20 containing ambient (7). This previous study (7) has also
reported intrinsic stress relaxation for an inert ambient anneal, but at a
slower rate than for the H 20 containing ambient. This effect of the inert
anneal is also confirmed by the present more extensive results. Recent studies
(15) show that the oxidation rate is enhanced even after the dry inert ambient
anneals. This is consistent with the above mentioned notion that the
compressive stress relaxation itself increases the oxidant diffusivity and thus
the overall oxidation.
Summary and Conclusions
We have reported the results of a number of studies showing the effects of
varying oxidation conditions on intrinsic film stress. It was found that an
orientation dependence exists for film stress which may help explain the
anomolous behavior observed in the initial regime of Si oxidation kinetics.
Other studies included the effects of wet (H 20) oxidations on stress, and the
effects of post-oxidation anneals, where it was found that stress was decreased
in both studies, with greater reductions observed for the oxidant grown at 700
°C as compared to 800 *C. We have used both the viscous flow model and an
a. atomic step model to explain the results obtained in these studies. In
combination, these two models may lead to a more accurate description of the
15
A.

kinetic behavior of low temperature thermal oxidations, and consequently
increase our understanding of the effects of stress on the linear rate constant.
Acknowledgement
This research was supported in part by the Office of Naval Research (ONR).
The authors are particularly indebted to Dr. B. Leroy and E.A. Lewis for their
enlightening discussions.
16
- !* -** ' J I,' ,"'l.* .*€.- .,........ -

REFERENCES
1. B.E. Deal and A.S. Grove, J. Appl. Phys., 36, 3770 (1965).
2. E.A. Irene and Y.J. van der Meulen, J. Electrochem. Soc.,123, 1380 (1976).
3. H.Z. Massoud, J.D. Plummer, and E.A. Irene, J. Electrochem. Soc.,132,1745 (1985).
4. H.Z. Massoud, Ph.D. Thesis, Stanford Univ., Stanford, Cal., (1982).
5. E.P. EerNisse, Appl. Phys. Lett., 30, 290 (1977).
6. E.P. EerNisse, Appl. Phys.Lett., 35, 8 (1979).
7. E.A. Irene, E. Tierney, and J. Angillelo, J. Electrochem. Soc., 129,2594 (1982).
8. E. Kobeda and E.A. Irene, J. Vac. Sci. and Technol. B., 4(3), 720,
(1986).
9. W.A. Tiller, J. Electrochem. Soc., 127, 625 (1980).
10. E.A. Irene, J. Appl. Phys., 54, 5416 (1983).
11. R.H. Doremus, Thin Solid Films, 122, 191 (1984)
12. A. Fargeix and G. Ghibaudo, J. Appl. Phys., 56, 589 (1984).
13. G. Camera Roda, F. Santarelli, and G.C. Sarti, J. Electrochem. Soc.,132, 1909 (1985).
14. E.A. Irene, H.Z. Massoud, and E. Tierney, J. Electrochem. Soc.,
133, 1253 (1986).
15. J.K. Srivastava and E.A. Irene, J. Electrochem. Soc., 132, 2815 (1985).
16. E.A. Irene and R. Ghez, J. Electrochem. Soc., 124, 1757 (1977).
17. N.F. Mott, Phil. Mag. A, 45 (2), 323 (1981).
18. B. Leroy, "Stresses and Silicon Interstitials During the Oxidation of a
Silicon Substrate," presented at the Workshop on Oxidation Mechanisms ofthe University of Paris 7, May 20-22 1986, Paris, France and to be
published in Phil. Mag. 1986/87.
19. W. Kern and D.A. Poutinen, RCA Rev., 31, 187 (1970).
20. W.A. Pliskin, IBM J. of Res. and Develop., 10, 198 (1966).
21. E.A. Irene, J. Electrochem. Soc., 121, 1613 (1974).
17
i.

22. G.G. Stoney, Proc. Royal Soc. (London) A82, 172 (1909).
23. W.A. Brantley, J. Appi. Phys., 44, 534 (1973).
24. E.A. Lewis, E. Kobeda, and E.A. Irene, Proc. of the Fifth InternationalSymposium on Silicon Materials Science and Techaology, TheElectrochemical Society, Ed. by H.R. Huff, Boston, Mass., May (1986).
25. Corning Glass Works, Fused Silica, 7940 Data Sheets, Corning,.1 New York, (1978).
26. R.J. Jaccodine and W.A. Schlegel, J. Appi. Phys., 37, 2429 (1966).
27. M. Jarosz, L. Kocsanyi, and J. Giber, Applications of Surface Science,14, 122 (1982).
28. L. Maissel, J. Appi. Phys., 44, 534 (1973).
*29. J.R. Ligenza, J. Phys. Chem., 65, 2011 (1961).
-30. P.O. Hahn and M. Henzler, J. Vac. Sci. Technol. A 2(2), 574 (1984).
31. E.A. Lewis, private communication.
32. K. Ueda and M. Inoue, Surf. Sci., 161, L578, (1985).
33. R. Bruckner. J. Non-Crystalline Solids, 5, 123 (1970).
18

List of Figures
Figure 1. Intrinsic film stress vs. oxidation temperature for four Si
orientations at 1 atm pressure.
Figure 2. Pictoral representation of viscous flow model for Si-SiO 2
system (Taken from ref. 7 with permission of the ElectrochemicalSoc.).
Figure 3. Pictoral representation of atomic step showing edge or kinksite (Taken from ref. 28).
Figure 4. Intrinsic film stress vs. oxidation temperature for (100) samples
oxidized in dry (02) and wet (H20) oxide, and annealed(N 2 at 1000.C).
Figure 5. Intrinsic film stress vs. oxidation temperature for (111)samples oxidized in dry (02) and wet (H20) oxide, and annealed(N2 at 10000 C).
29
19

EUC7
-- ORIENTATION
-4-- (100)
- - (311)
0E1/ 0 , -¢ - (110)
Cc--
u
cc,z1.--
ci_'-4
0 - -- +-------- I -
700 800 900 1000 1100
TEMPERATURE (oC)
4.F
. . . .. . . . . . . . . . . . . . .
SiO2 FLOW
COMPRESSIVE$4444STRESS
Si* y

14-40
0
* E
0471*Y-4
Ei

I It I
C.-4 (100) s5-S10 2 AMBIENTS------
DRY OX
c WET OX
cn
>,
0 ANNEAL
0
U', -2"
LU 0m
LJ nI.-
zU,
" 0z
'-4
I, I I
700 800 900 1000 1 1O
TEMPERATURE (oC)
~ ~ LI

4 (ii)sl-S'O 2 AMBIENT{
u*- DRY OX
c 0 WET OX
>1-10 0 ANNEAL
0
-2UJ)
z
!00 800 900 1000 1100
TEMPERATURE (0 C)

List of Tables
Table 1. Young's modulus to Poisson's ratio for determination of film stress
for Si-SiO 2 .
22

Si Orientation E/l-v (1012 dyn/cm 2) Reference
(100) 1.805 23
(110) 2.187 24
(111) 2.290 23
(311) 2.007 24
SiO 2 0.88 25
a le I. Young's modulus to Poisson's ratio for determination of film stressfor Si-SiO
t'2'

- - ~
.1
p
I
i