via united parcel service received · implementing such rate mechanisms outweigh any costs...
TRANSCRIPT

FirstEnergy 2800 Pottsville Pike P.O. Box 16001
Reading, PA 19612-6001
Tori L Giesler, Esq. (610) 921-6658 (330) 315-9263 (Fox)
610-929-3601
July 31, 2017
VIA UNITED PARCEL SERVICE RECEIVEDRosemary Chiavetta, Secretary Pennsylvania Public Utility Commission Commonwealth Keystone Building 400 North Street, 2nd Floor
Harrisburg, PA 17120
JUL 31 2017
PA PUBLIC UTILITY COMMISSION SECRETARY'S BUREAU
Re: Alternative Ratemaking MethodologiesDocket No. M-2015-2518883
Dear Secretary Chiavetta:
Pursuant to the Commission’s Tentative Order entered March 2, 2017 in the above- referenced proceeding, enclosed herewith for filing are the Reply Comments of Metropolitan Edison Company, Pennsylvania Electric Company, Pennsylvania Power Company and West Penn Power Company. Please date stamp the extra copy and return it in the postage-prepaid envelope provided.
Please contact me if you have any questions regarding this matter.
Very truly yours,
\
Tori L. Giesler
dimEnclosures
c: As Per Certificate of Service

RECEIVED
BEFORE THEPENNSYLVANIA PUBLIC UTILITY COMMISSION
JUL 31 2017
PA PUBLIC UTILITY COMMISSIOI'' SECRETARY’S BUREAU
Alternative Ratemaking Methodologies Docket No. M-2015-2518883
REPLY COMMENTS OF METROPOLITAN EDISON COMPANY, PENNSYLVANIA ELECTRIC COMPANY, PENNSYLVANIA POWER
COMPANY AND WEST PENN POWER COMPANY
I. INTRODUCTION
On December 31, 2015, the Pennsylvania Public Utility Commission (“Commission”)
issued a secretarial letter announcing that it was opening the above-captioned docket (“December
2015 Secretarial Letter”) in order to explore the efficacy and appropriateness of alternative
ratemaking methodologies, with the goal of removing disincentives for energy utilities to pursue
aggressive energy conservation and efficiency initiatives. It further went on to notify that it would
hold an en banc hearing to be held on March 3,2016, with testimony requested on the following
rate issues: (1) whether revenue decoupling or other similar rate mechanisms encourage energy
utilities to better implement energy efficiency and conservation programs; (2) whether such rate
mechanisms are just and reasonable and in the public interest; and (3) whether the benefits of
implementing such rate mechanisms outweigh any costs associated with implementing the rate
mechanisms (“March 3 en banc"). In addition, the December 2015 Secretarial Letter enclosed a
series of twenty-two topics intended to guide the discussion.
On March 3, 2016, testimony was provided at the en banc hearing by representatives of
the Natural Resources Defense Council (“NRDC”), the Regulatory Assistance Project (“RAP”),
the Edison Electric Institute (“EEI”), H. Gil Peach & Associates (“Peach”), the Keystone Energy

Efficiency Alliance (“KEEA”) in coordination with the Clean Air Council and NRDC, PPL
Electric Utilities Corporation (“PPL”), Columbia Gas of Pennsylvania, Inc. (“Columbia”), the
Office of Consumer Advocate (“OCA”), and Alcoa, Inc. on behalf of the Industrial Energy
Consumers of Pennsylvania (“IECPA”).
The December 2015 Secretarial Letter provided that written comments could be submitted
by all interested parties on these topics and in response to the testimony offered at the March 3 en
banc, to be filed no later than March 16, 2016. Metropolitan Edison Company (“Met-Ed”),
Pennsylvania Electric Company (“Penelec”), Pennsylvania Power Company (“Penn Power”) and
West Penn Power Company (“West Penn”) (individually a “Company” and in any combination,
the “Companies”) collectively filed comments in response to the December 2015 Secretarial
Letter. In addition, comments were filed by American Association of Retired People (“AARP”),
Duquesne Light Company (“Duquesne”), National Association of Water Companies PA chapter,
Pennsylvania Law Project (“CAUSE”), Office of Small Business Advocate (“OSBA”), Citizen
Power, Sierra Club, Environmental Defense Fund (“EDF”), UGI Distribution Company (“UGI”),
The Energy Freedom Coalition of America, PPL, the Penn State University (“PSU”), the Energy
Association of Pennsylvania (“EAP”), PECO Energy Company (“PECO”), Northeast Energy
Efficiency Partnership (“NEEP”), Citizens for Pennsylvania’s Future (“Penn Future”), OCA,
IECPA, Citizens’ Electric Company and Wellsboro Electric Company, and KEEA.
On March 2, 2017, the Commission issued a Tentative Order which requested comments
from interested Parties in response to specific questions (“March 2017 Tentative Order”). At the
public meeting during which the March 2017 Tentative Order was adopted, statements were also
offered on this topic by each of Vice Chairman Place, Commissioner Powelson, and Commissioner
Sweet. Per the March 2017 Tentative Order, comments were to be filed by April 16, 2017, with
2

reply comments to be filed by May 16, 2017. However, on March 23, 2017, the Commission
issued a Secretarial Letter extending the deadline for comments to May 31, 2017 and reply
comments to July 31,2017.
On May 31,2017, comments were filed in response to the March 2017 Tentative Order by
many of the interested parties, including the OCA, CAUSE, OSBA,, PPL, PECO, Citizens and
Wellsboro, EAP, KEEA, the Alliance for Industrial Efficiency, the Advanced Energy Economy
Institute, the Natural Resources Defense Council, Peoples Natural Gas Company LLC and Peoples
TWP LLC (collectively, “Peoples”), the Commission’s Bureau of Investigation and Enforcement
(“I&E”), Philadelphia Gas Works (“PGW”), Aqua Pennsylvania, Inc. (“Aqua”), UGI, Columbia,
National Fuel Gas Distribution Corporation (“NFG”), Duquesne, Met-Ed Industrial Users Group,
Penelec Industrial Customer Alliance, Philadelphia Area Industrial Energy Users Group, PP&L
Industrial Customer Alliance, and West Penn Power Industrial Interveners, American Counsel for
an Energy-Efficient Economy (“ACEEE”) and the Companies. In response to the opinions and
proposals offered in certain of the other interested parties’ comments, the Companies submit the
following reply comments.
II. COMMENTS
Return on Equity Reduction
Various parties made the argument that where a utility’s revenue risk is decreased as a
result of implementation of an alternative ratemaking methodology, then a corresponding
reduction in the return on equity (“ROE”) is appropriate. This is improper and is a
recommendation that should be rejected for several reasons.
In Pennsylvania, the Commission’s regulations for establishing an appropriate level of
return states that an EDC’s rate of return must be sufficient for the utility to furnish safe and reliable
3
distribution service while also being given an opportunity to earn a fair rate of return on its
investment into the distribution system. This is an important concern to keep in mind when
considering the recommendation proffered to reduce ROEs where an alternative ratemaking
methodology is accepted, especially when pairing that requirement against the treatment of utility
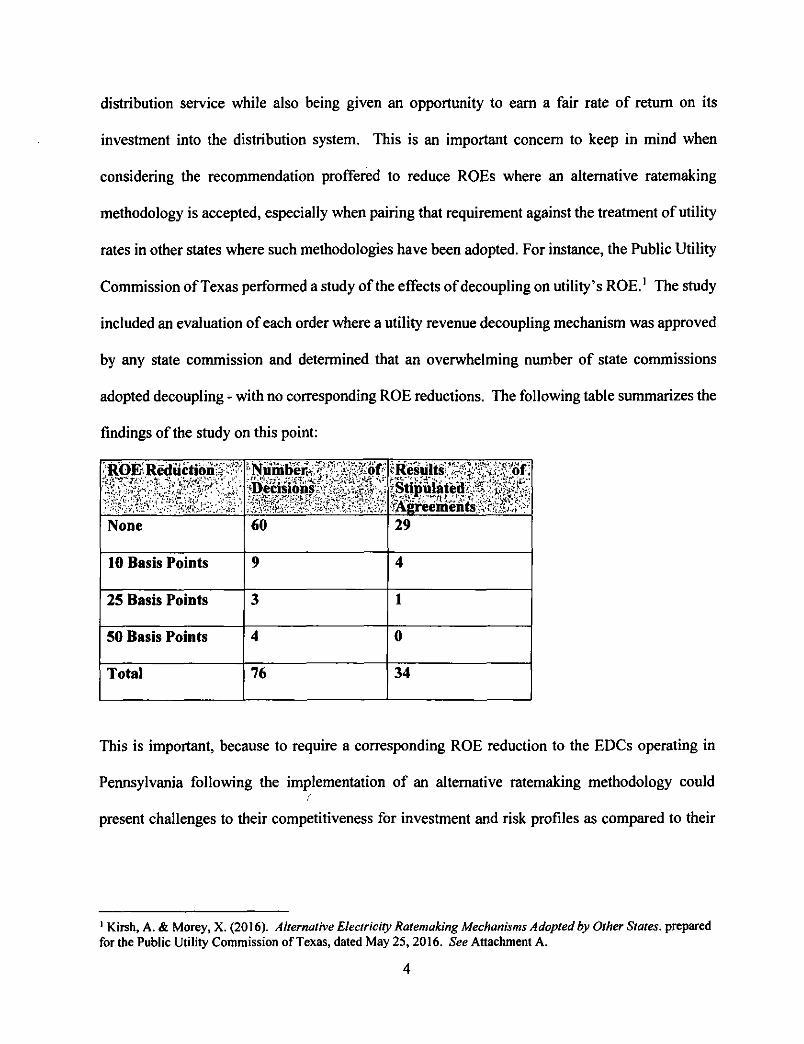
rates in other states where such methodologies have been adopted. For instance, the Public Utility
Commission of Texas performed a study of the effects of decoupling on utility’s ROE.1 The study
included an evaluation of each order where a utility revenue decoupling mechanism was approved
by any state commission and determined that an overwhelming number of state commissions
adopted decoupling - with no corresponding ROE reductions. The following table summarizes the
findings of the study on this point:
/ROE^ Reduction'^ :v;
wmwmsr -11.WA* i’;®ecisionsW.?;;^ArSr:^cRe^its^ySa^f!
^ISreemeiBts^^S^''
None 60 29
10 Basis Points 9 4
25 Basis Points 3 1
50 Basis Points 4 0
Total 76 34
This is important, because to require a corresponding ROE reduction to the EDCs operating in
Pennsylvania following the implementation of an alternative ratemaking methodology could(
present challenges to their competitiveness for investment and risk profiles as compared to their
1 Kirsh, A. & Morey, X. (2016). Alternative Electricity Ratemaking Mechanisms Adopted by Other States, prepared for the Public Utility Commission of Texas, dated May 25,2016. See Attachment A.
4

peer utility companies in other jurisdictions that offer more favorable ratemaking treatment - i.e.,
those that don’t require the corresponding ROE reduction.
Along the same lines, the Brattle Group performed a study released on March 20, 2014
which determined that its “empirical analysis of decoupling in the electric industry do [sic] not
support the hypothesis that utilities with decoupling have a lower cost of capital than utilities
without decoupling.”2 The authors reached this conclusion by identifying what specific type of
risk is reduced as a result of decoupling. Total risk is the sum of diversifiable and non-diversifiable
risk.3 Diversifiable risk is defined as diversification of portfolio and does not have any impact on
cost of capital. However, non-diversifiable risk (also known as business risk) is what affects a
utility’s cost of capital. While credit agencies have praised decoupling for clearly reducing total
risk, which is important to bondholders, the same cannot be said for those that provide equity to
the companies.
One of the primary purposes of alternative ratemaking methods is to ensure that each
customer pays their fair share of the distribution system. When a customer requests distribution
service from an EDC, the distribution service installed is sized to meet the specific needs of a
customer at their maximum, or peak, capacity. Conservation measures may lower a customer’s
overall energy needs, but they do not negate the fact that the original size of the service has not
changed. Therefore, a properly designed alternative ratemaking methodology will better align the
customer’s share of the distribution cost with the cost of service to provide distribution service to
that customer.
2 Vilbert, M., Wharton, J., Gibbons, C., Rosenberg, M., Neo, Y. (2014). The Impact of Revenue Decoupling on the Cost of Capital for Electric Utilities: An Empirical Investigation, prepared for The Energy Foundation by The Brattle Group, March 20,2014, page 3. See Attachment B.3 Vilbert, M., Wharton, J., Gibbons, C., Rosenberg, M., Neo, Y. (2014). The Impact of Revenue Decoupling on the Cost of Capital for Electric Utilities: An Empirical Investigation, prepared for The Energy Foundation by The Brattle Group, March 20,2014, page 8. See Attachment B.
5

The primary risk that an EDC faces is not the surety of the revenue stream, but the ability
to provide safe and reliable service to its customers. The ability to provide that safe and reliable
service is predicated on operating and maintaining the distribution assets for which the EDC earns
a fair rate of return on. The use of an alternative ratemaking methodology has very little impact
on the risk profile that is used to assess the allowed equity rate of return on those assets and is not
the largest risk faced by a utility as the OSBA suggests.4 This is why reducing total risk through
an alternative ratemaking methodology does not remove the risk that justifies the ROE an EDC
would typically be granted and thus the recommendation to reduce ROEs in such instances should
be rejected.
Penalties Associated With Energy Efficiency and Conservation as Performance Incentives
The OCA and OSBA suggest in their filed comments that the penalties incurred by an EDC
where they do not meet the Commission-approved energy efficiency and conservation (“EE&C”)
targets, as required under Act 129 of 2008, amounts to what should be considered a performance
incentive mechanism. While the OCA and OSBA may consider this to be an “incentive,” the
imposition of an additional charge on an EDC for failure to meet EE&C targets is exactly what it
is called - a penalty. An “incentive” is defined as “inducement or supplemental reward that serves
as a motivational device for a desired action or behavior.”5 The penalties that the public advocates
reference are set forth in Act 129 and are to be imposed in instances where an EDC does not meet
a requirement that is set forth in law. Instead of providing an incentive where the EDC is free to
willingly pursue energy conservation goals with a clear reward in exchange, Pennsylvania law
instead imposes a penalty for failure to meet a requirement with a minimum performance threshold
4 OSBA Comments filed May 31,2017, page 5.5 Incentive [Def. 1]. (n.d.) Businessdictionary.com. Retrieved July 31, 2017, from http://www.businessdictionary.com/defmition/incentive.html
6
- as compared to incremental benefits for exceeding these goals. Adjusting that approach by
establishing true performance incentive mechanisms for exceeding goals would better align the
Commission’s public policy goals relative to EE&C measures and performance with an EDC’s
operating performance, as well as the utility’s revenue.6
The Companies encourage a shared savings approach to incentivize utilities to exceed their
statutorily-mandated EE&C reduction goals. While EDCs can minimize their lost distribution
revenues by normalizing energy usage for mandated energy reduction requirements through a
distribution base rate case’s fully projected future test year,7 there is still no incentive under such
a model for a utility to exceed these goals. In fact, EDCs are not only penalized for not meeting
the goals as discussed above, but they’re actually penalized in a less direct way by exceeding these
goals through lost distribution revenue that is not recovered. Therefore, a shared savings approach
would provide the proper signals to EDCs and would encourage conservation over and above
minimum mandates. Under such a proposal, a shared savings mechanism would only be triggered
if an EDC exceeded both its annual and cumulative energy savings targets that are set forth in each
EDC’s Commission-approved EE&C plan. As of today, twenty-eight states already offer a
performance incentive for at least one major electric utility.8
Reliability could suffer if revenue decoupling was implemented
The OCA comments posit that revenue decoupling may reduce EDCs’ incentive to ensure
timely storm restoration, citing financial indifference on the part of EDCs to extended outages.9
The basic premise that an EDC would be less likely to perform repairs despite its requirement
under Pennsylvania law and the Commission’s regulations to provide safe and reliable electric
6 66 Pa.C.S. § 2806(i) grants the Commission authority to implement such a mechanism.7 Recovering lost distribution revenues through a base distribution rate case is administratively burdensome.8 KEEA Comments filed May 31,2017, page 119 OCA Comments filed May 31,2017, page 15.
7

distribution service is flawed thinking and completely without merit. First, there is no evidence to
support such a claim. In fact, many Pennsylvania EDCs have specifically committed to invest in
aging infrastructure through various means, including long term infrastructure improvement plans,
including updated communication equipment used to identify outages. Notwithstanding ratepayer
revenue, whether consumption based or otherwise, it is always in a utility’s best interest - indeed,
it is their obligation - to provide consistent, safe and reliable service to its customers. If EDCs do
not provide service at such levels and their performance begins to suffer, then the Commission has
the authority to and likely would sanction individual utilities for poor reliability. Sanctions could
include a lower return on equity or allowed rate of return until the utility improves its performance
statistics to a certain level - an outcome that would defeat the purpose of the perspective the OCA
warns of.
Lower income customers have lower usage than standard customers
The OCA and PULP comments both claim that low income consumers use less energy than
higher income households, as they tend to live in smaller homes and are more likely to live in
apartments.10 While this may be accurate in some cases, the Companies’ experience, to which
they have testified, is the exact opposite when customers enrolled in the Companies’ Customer
Assistance Programs (“CAP”) are compared to standard residential customers. The following
table illustrates the average usage comparison between the two sets of customers for the
Companies:
10 PULP Comments filed May 31,2017, page 4.

Usage patterns of CAP customers vs. all residential customers11
Company
(1)
CAP Usage (kWh)
(2)
Avg. Usage: AH Res. Customers (kWh)
(3)
Difference
(kWh)
d)-(2)
(4)
% CAP Usage Exceeds All Res. Customers9 Avg.
(3)/(2)
Met-Ed 12,089 11,136 953 8.6%
Penelec 9,668 8,781 888 10.19%
Penn Power 11,456 11,882 (426) (3.6%)
West Penn 15,372 11,774 3,598 30.6%
As clearly shown by the table above, in certain instances and on average, low income customers
in the Companies’ territories tend to use more - not less - energy than standard residential
customers. The impact to low income customers from revenue decoupling mechanisms illustrated
by the OCA and PULP is grossly exaggerated, and is factually inaccurate. In any event, in most
cases, any incremental impact to low income customers could and would be absorbed through
changes to universal service programs.
Residential Demand Charges
The OCA and PULP both strongly oppose the implementation of a demand charge for
residential customers. The primary reason they offer is that the vast majority of residential
customers do not distinguish between power (kW) and energy (kWh). Also, they believe that it
sends the wrong price signals for customers to conserve energy and save money on their monthly
bills. In addition, the OCA opines that residential customers would be outraged to find that a peak
11 Rebuttal Testimony of Kevin M. Siedt, Metropolitan Edison Company, Pennsylvania Electric Company, Pennsylvania Power Company, and West Penn Power Company 2016 Distribution Base Rate Case, Docket Nos. R- 2016-2537349, et al, page 10, based on sales data from 2014 through May 2016.
9
demand that occurred ten months earlier still has an impact on their current bill because of a ratchet
demand.
The Commission should not act to preclude consideration of a demand charge on
residential customers as part of this proceeding. While they are not proposing a demand charge,
the Companies acknowledge that if a demand charge was imposed on residential customers, a
customer education program would be helpful to educate the customers on staggering their usage
to keep the peak demand used for calculating the demand charge as low as possible. If customers
were to become educated, they could use this type of program to their benefit.
Also, it would make sense for the Commission to phase in residential demand charges over
a period of time, allowing residential customers to become accustomed to the mechanics of a
demand charge. The revenue requirement for distribution service to a residential customer is
usually comprised of a customer charge and an energy usage charge. To that end, the Companies
have implemented demand charges in addition to those other charges for residential customers that
have usage of over 10,000 kWh per month. This type of phased approach could similarly be
utilized to implement a demand charge. For instance, with the advent of smart meters, EDCs could
either establish a threshold for eligibility or initiate the demand charge as a small percentage of the
overall distribution service revenue requirement. By implementing these types of small,
incremental measures, the impact to low income customers would be minimal, if at all.
The Companies currently use maximum measured load over a fifteen-minute interval to
measure demand for its commercial and industrial customers. For residential customers, use of a
sixty-minute interval would be appropriate because it would smooth out the shorter period spikes
that could result with the use of a fifteen-minute interval. With that type of time interval, a
residential customer could better manage its peak load usage and not experience abnormal ratchet
10

demands. The billing demand is often equal to the greater of the maximum measured demand for
the current month, or 50% of the highest measured demand in the previous eleven months.
Therefore, it would be unlikely that, with the combination of a sixty-minute interval and only 50%
ratchet demand, a residential customer would experience those abnormal ratchet demands.
Further, a demand charge is much different than a fixed customer charge in that the
customer does have control over the levels that they are charged with demand charges, whereas a
fixed monthly customer charge is the same whether the residential customer changes their usage
behavior. Implementation of demand charges would allow an educated customer to modify its
behavior in order to adapt to charges that are based on its peak usage.
Finally, a primary benefit of the implementation of residential demand charges would be
movement towards a more cost of service-based rate design for residential customers. When a
residential customer signs up for distribution service from the utility, the assets utilized are sized
to meet the needs of the customer at its peak capacity. Demand charges allow a utility to match
the capacity the utility sized its distribution assets with to the kW demand for which the residential
customer is billed. Utilizing a demand-based charge thus enables the utility to allocate its cost of
service to the customers that use that distribution service.
Bi-seasonal Time of Use Rates
KEEA, in its comments, proposed that the Commission study the implementation of bi-
seasonal time-of-use (“TOU”) rates with a peak time rebate feature, as this type of design reduces
energy peak consumption, decreases payback of energy efficiency measures, sends the right price
signals to customers, and reflects the true cost of service for a residential customer.
It is widely recognized and established in such documents as the Electric Utility Cost
Allocation Manual written by the National Association of Regulatory Utility Commissioners that
11
most of the cost of distribution service are fixed and do not fluctuate based on time of use. TOU
distribution rates are a vestige of bundled electric rates that are no longer applicable to the
distribution-only nature of service in Pennsylvania under consideration in this proceeding.
Because distribution service is sized to meet peak capacity, any reduction in usage during peak
times will not change the cost of distribution service. Conversely, because generation costs vary
based on hourly locational marginal prices, it makes sense to align TOU products with the price
signals generated by the customer’s generation portion of the bill. Generation load and cost are
dependent on changes to the peak loads, so encouraging reduced usage from a generation
standpoint allows EDCs to reduce their overall default service costs for those customers that are
not shopping. Electric generation suppliers (“EGSs”) are in a better position to promote more
TOU products similar to the artificial TOU products that are offered for default service customers.
With the installation of smart meters and customer-specific usage data, it will be easier for the
EGS community to begin to offer these types of TOU products.
Net Metering Alternatives
As the growth in solar installation continues, many utilities are faced with challenges such
as the impact on their, distribution systems and how the costs of those impacts are to be recovered.
One goal of alternative ratemaking is to immunize utilities to the increases in distributed generation
and associated net metering rules and regulations. PECO addresses this issue in its filed comments,
where it proposes that separate rate schedules be established for net metered residential customers.
Customers on these rate schedules would be subject to a straight fixed variable (“SFV”) rate
design, whereby such customers would have greater fixed charges than standard residential
customers who do not use net metering. PECO suggests that this proposal would require changes
in legislation in order to enact such a proposal.
12
This approach would effectively allow utilities to properly assign costs to net-metered
customers in a more appropriately cost-based manner. The benefit to residential customers would
in turn be that standard residential customers would no longer subsidize residential net metering
customers due to the fact that the costs of the distribution system would be allocated based on the
true cost of service.
Multi-Year Rate Plans
PPL communicated a proposal for the use of multi-year rate plans in their filed comments.
Under the proposal, a utility would file a detailed investment plan for the next three to five year
period, allowing customers and interested parties to review an EDC’s planned expenses and capital
additions in advance of a base distribution rate change filing.12
While PPL is trying to provide more transparency in their rate planning process, allowing
customers and interested parties a review outside of the traditional and statute-enforced rate case
litigation schedule may result in an unorganized and unsustainable litigation process. The
litigation process that accompanies a rate case filing is well-established and provides for an
organized review of a utility’s budgets and expenditures. PPL’s proposal would follow a similar
format as used when pursuing long term infrastructure improvement plans (“LTIIP”) and
corresponding distribution system improvement charges (“DSICs”). However, this model within
the context of total distribution system rate planning would open up an entire EDC budget outside
of a rate case, creating the likelihood that EDCs would lose the control they need to properly
manage their own budgets and ratemaking process, leading to uncertainty for an EDC and
unending review of a utility’s rates and operations.
12 PPL Comments filed May 31,2017, page 13.
13

As part of this proposal, PPL has also proposed that revenue decoupling rates be adjusted
on a quarterly or semiannual basis to reflect differences between actual and budgeted sales.
Adjustments made with such frequency are likely to cause unnecessary fluctuations to customers’
rates, as well as excessive administrative burden on all parties involved in the effort to process the
changes to those rates.
Standby Rates
The Alliance for Industrial Efficiency discussed in their comments that current standby
tariffs create barriers to the deployment of combined heat and power (“CHP”) projects and should
be modified. In particular, recommended modifications include items such as incorporation of
cost-based price differentials for peak/off-peak demand in TOU provisions within standby tariffs,
as well as credits or rebates to be provided to CHP owners that shift maintenance to shoulder
months or off-peak periods.13
The Companies already offer two types of standby rates - backup service and maintenance
service. Backup service allows a CHP owner to have an outage and call on the utility to provide
backup power during 15% of the customer’s on-peak and off-peak periods over the course of a
year, priced at a discount off the standard applicable rate schedule, which approximates about 75%
of the standard kilowatt (“kW”) demand rate. Maintenance service, on the other hand, is similar
to backup service, but distinct in that CHP owners can only use the service during shoulder or off-
peak months. Both services are premised on a contracted amount of kW demand that is agreed to
by the CHP owner and utility. Where the CHP owner does not exceed the limitations set forth in
the backup and maintenance agreements, the CHP owner will enjoy a discounted price off the
13 Alliance for Industrial Efficiency Comments filed May 31,2017, pages 3-4.
14

standard rate. Therefore, there is no reason to offer an additional discount or rebate to encourage
CHP owners to comply with contracted demands.
Further, because a CHP owner still makes use of a utility’s distribution system, it is critical
that the cost of service accurately account for a calculation of the customer’s demand to ensure
that a CHP owner pays its fair share of the distribution system and is not subsidized by other
customers. As such, it is important for the utility to calculate the demand for a customer with a
CHP as the greater of the customer’s usage or the amount that is generated and exported by the
CHP owner.14 In tum, the utility will reserve capacity up to the level agreed to within the contract,
so the cost of service for allocated distribution service assets are designed to be recovered through
the standby rates.
14 As stated earlier in these reply comments, a utility’s distribution service is not based on time-of-use principles, but rather is designed to meet peak capacity, and therefore, time-of-use rates are better suited to the generation component of a customer’s bill.
15
HI. CONCLUSION
Met-Hd, Penelec, Penn Power and West Penn appreciate the opportunity to provide reply
comments in response to the Commission’s Tentative Order dated March 2, 2017 and the
associated statements issued contemporaneously with its adoption. The Companies look forward
to continued collaboration with the Commission and interested stakeholders on this very important
topic.
Respectfully submitted,
Dated: July 31, 2017
Attorney No. 207742FirstEnergy Service Company2800 Pottsville PikeP.O. Box 16001Reading, PA 19612-6001Phone: (610)921-6658Fax: (330)315-9263Email: [email protected]
Counsel for:Metropolitan Edison Company, Pennsylvania Electric Company, Pennsylvania Power Company and West Penn Power Company
Tori L. GiesTer
\6

Attachment A
RECEIVEDJUL 31 2017
PA PUBLIC UTILITY COMMISSION
SECRETARY'S BUREAU
ALTERNATIVE ELECTRICITY RATEMAKING MECHANISMS
ADOPTED BY OTHER STATES
prepared forPublic Utility Commission of Texas
prepared by Laurence D. Kirsch Mathew J. Morey
Christensen Associates Energy Consulting LLC
May 25, 2016
Christensen Associates Energy Consulting, LLC 800 University Bay Drive, Suite 400 Madison, Wl 53705-2299
Voice 608.231.2266 Fax 608.231.2108

Attachment A
TABLE OF CONTENTS
EXECUTIVE SUMMARY..................................................................................................................................................IV
1. INTRODUCTION.........................................................................................................................................................1
2. RETAIL ELECTRICITY RATEMAKING GOALS................................................................................................... 2
3. TRADITIONAL ELECTRICITY RATEMAKING PRACTICE...............................................................................3
4. THE IMPETUS FOR RETAIL ELECTRICITY RATEMAKING REFORM.......................................................4
4.1. Improving Utilities' Performance Incentives...................................................................44.2. Restructuring of Wholesale Electricity Markets..............................................................54.3. Public Policy Support for Renewable Energy...................................................................54.4. Technological Progress..................................................................................................... 64.5. Declining Sales Growth.......................................................................... 6
5. REVIEW OF ALTERNATIVE RATEMAKING MECHANISMS........................................................................7
5.1. Broad Revisions to Cost-of-Service Ratemaking..............................................................85.1.1. Formula Rate Plans............................................................................................95.1.2. Straight Fixed-Variable Rates.......................................................................... 135.1.3. Revenue Decoupling........................................................................................175.1.4. Lost Revenue Adjustment Mechanisms........................................................ 255.1.5. Multi-Year Rate Plans.......................................................................................345.1.6. Price Cap Plans................................................................................................. 37
5.2. Incremental Revisions to Ratemaking Approaches...................................................... 385.2.1. Future Test Years.............................................................................................385.2.2. Earnings Sharing Mechanisms........................................................................ 405.2.3. Cost Trackers.................................................................................................... 405.2.4. Infrastructure Surcharges............................................................................... 425.2.5. Performance Incentive Regulation'.................................................................43
6. APPLICABILITY OF ALTERNATIVE RATEMAKING MECHANISMS TO TEXAS................................. 45
6.1. Texas' Electricity Industry and Market Structure........................................................ 456.2. Present Regulated Electricity Ratemaking Methods in Texas......................................49
6.2.1. Texas' Cost Trackers.........................................................................................496.2.2. Other Characteristics of Texas Regulation...................................................... 51
6.3. Ratemaking Reform Goals and the Alternative Ratemaking Mechanisms..................516.4. Recommendations for Alternative Ratemaking Mechanisms......................................52
APPENDIX. ABBREVIATIONS.................................................................................................................................... 57
Christensen Associates Energy Consulting, LLC i 5/25/2016

Attachment A
LIST OF TABLES
Table 1 Timing of State Adoption of Straight-Fixed Variable Rate Design for Electric Utilities .. 14Table 2 Timing of States' Adoption of Electric Utility Revenue Decoupling.... ............................19Table 3 State PUC Decisions Regarding Return on Equity Reduction...........................................21Table 4 Timing of State Adoption of LRAMs.................................................................................. 27Table 5 Relative Shares of Texas Electrical Energy Deliveries, by Utility, 2014............................ 47
Christensen Associates Energy Consulting, LLC 5/25/2016
Attachment A
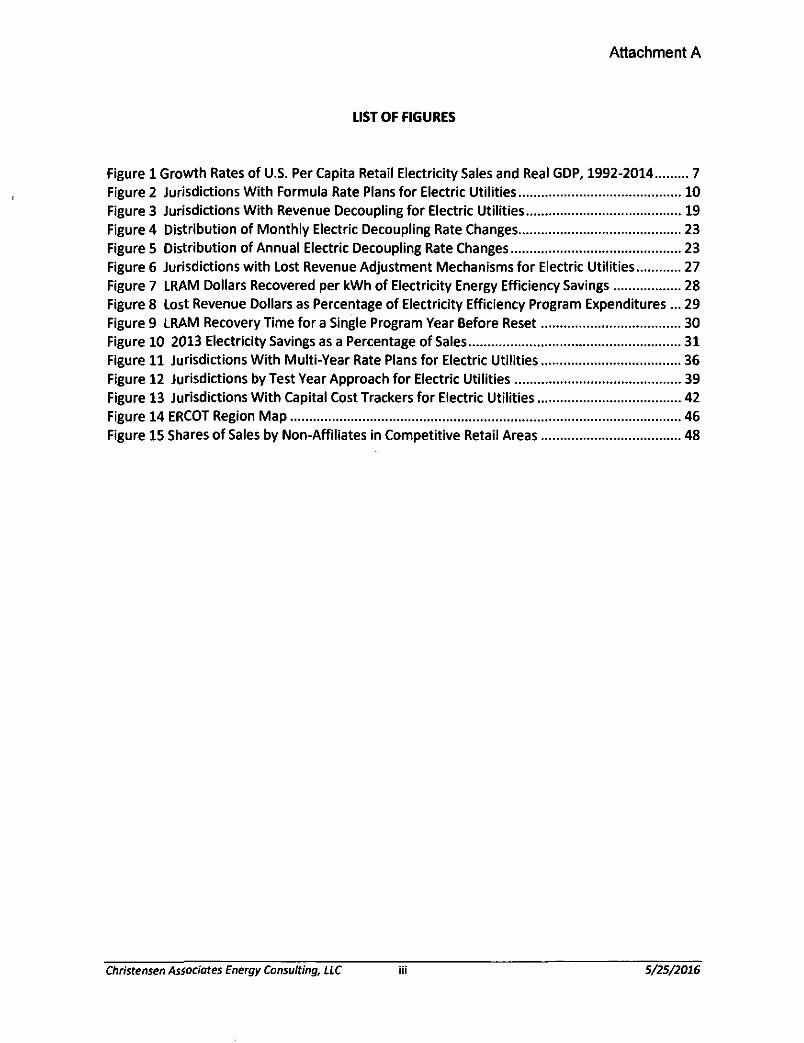
Figure 1 Growth Rates of U.S. Per Capita Retail Electricity Sales and Real GDP, 1992-2014...........7Figure 2 Jurisdictions With Formula Rate Plans for Electric Utilities............................................. 10Figure 3 Jurisdictions With Revenue Decoupling for Electric Utilities........................................... 19Figure 4 Distribution of Monthly Electric Decoupling Rate Changes.............................................23Figure 5 Distribution of Annual Electric Decoupling Rate Changes............................................... 23Figure 6 Jurisdictions with Lost Revenue Adjustment Mechanisms for Electric Utilities.............27Figure 7 LRAM Dollars Recovered per kWh of Electricity Energy Efficiency Savings................... 28Figure 8 Lost Revenue Dollars as Percentage of Electricity Efficiency Program Expenditures... 29Figure 9 LRAM Recovery Time for a Single Program Year Before Reset.......................................30Figure 10 2013 Electricity Savings as a Percentage of Sales.......................................................... 31Figure 11 Jurisdictions With Multi-Year Rate Plans for Electric Utilities.......................................36Figure 12 Jurisdictions by Test Year Approach for Electric Utilities.............................................. 39Figure 13 Jurisdictions With Capital Cost Trackers for Electric Utilities........................................42Figure 14 ERCOT Region Map........................................................................................................... 46Figure 15 Shares of Sales by Non-Affiliates in Competitive Retail Areas.......................................48
LIST OF FIGURES
Christensen Associates Energy Consulting, LLC 5/25/2016

Attachment A
ALTERNATIVE ELECTRICITY RATEMAKING MECHANISMS
ADOPTED BY OTHER STATES
EXECUTIVE SUMMARY
Electricity rates have traditionally been set according to utilities' costs of service. To determine rates, the overall cost of service, called the "revenue requirement," is divided among functions (like generation, transmission, distribution, and customer service), then allocated among customer classes (like residential, commercial, industrial, and street lighting), and then assigned to billing determinants (like electrical energy consumed, peak power demand, and fixed monthly fees). Under traditional ratemaking, the price for each billing determinant for each class is basically the cost assigned to that billing determinant for that class divided by the quantity of that billing determinant for that class.
Over the past forty years, the electric power industry and its regulators have developed and experimented with a range of ratemaking mechanisms that depart from traditional embedded cost-based ratemaking. The development of these non-traditional ratemaking mechanisms has been spurred by the need to deal with uncertainties in input prices (like fuels) that are beyond utility control, by a desire to improve utilities' performance incentives, by the opportunities created by the restructuring of and competition in wholesale electricity markets, by public policy support for renewable energy, by technological progress in generation and information technologies, and by declining rates of electricity sales growth. In short, the evolution of the electric power industry is having and will continue to have substantial impacts on utility costs and on the considerations that influence how electricity should be priced.
This report responds to Senate Bill 774, through which the Texas Legislature has required the Public Utility Commission of Texas (PUCT) to analyze alternative ratemaking mechanisms adopted by other states and to provide a report thereon to the legislature by January 15,2017. The bill reflects concerns that electric transmission and distribution (T&D) costs are increasing substantially over time. While PUCT rules allow T&D utilities (TDUs) to seek timely recovery of transmission infrastructure costs twice yearly, the rate adjustment mechanism that permits timely recovery of distribution infrastructure costs is scheduled to terminate on September 1, 2019. Prior to this expiration, the State of Texas would like to explore the types of ratemaking mechanisms that might be used to ensure timely cost recovery while preserving incentives to achieve the other goals that might be fostered by appropriate rate design.
Descriptions of Alternative Ratemaking Mechanisms
"Just and reasonable" retail electricity rates reflect a balancing of different objectives, including full recovery of utility costs, stable and predictable prices, fair prices, efficient consumption of electricity, reliable service, affordable electricity service, diverse and clean power resources,
Christensen Associates Energy Consulting, LLC iv 5/25/2016
Attachment A
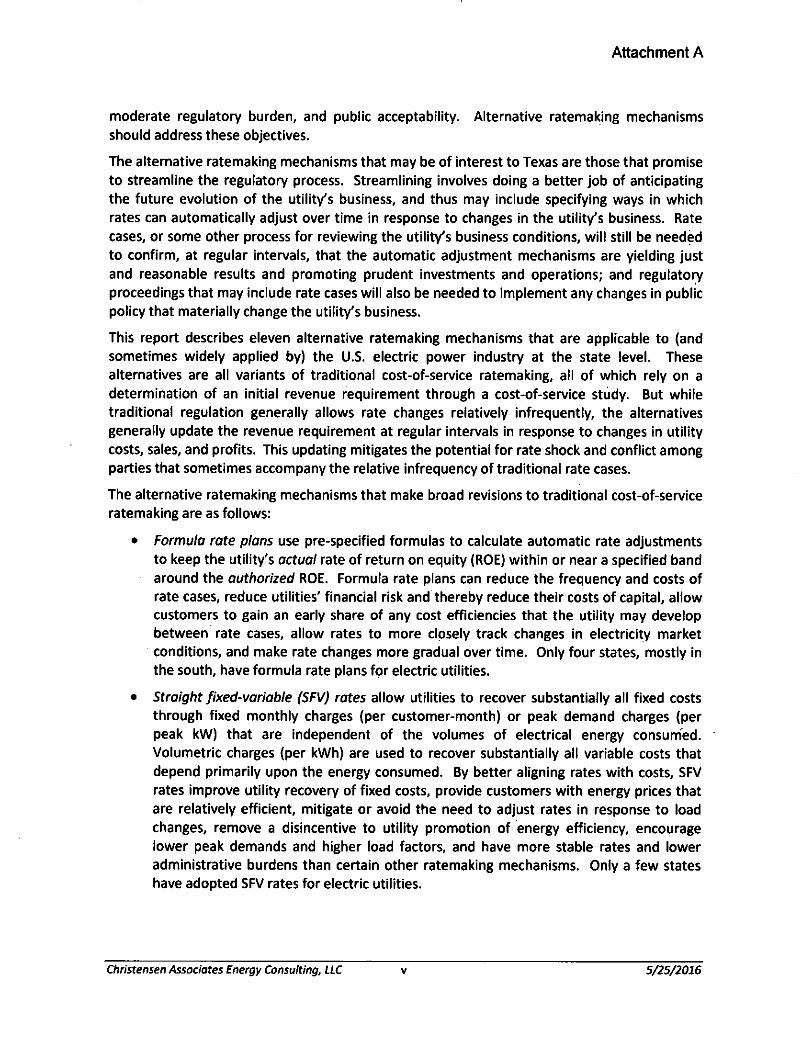
moderate regulatory burden, and public acceptability. Alternative ratemaking mechanisms should address these objectives.
The alternative ratemaking mechanisms that may be of interest to Texas are those that promise to streamline the regulatory process. Streamlining involves doing a better job of anticipating the future evolution of the utility's business, and thus may include specifying ways in which rates can automatically adjust over time in response to changes in the utility's business. Rate cases, or some other process for reviewing the utility's business conditions, will still be needed to confirm, at regular intervals, that the automatic adjustment mechanisms are yielding just and reasonable results and promoting prudent investments and operations; and regulatory proceedings that may include rate cases will also be needed to implement any changes in public policy that materially change the utility's business.
This report describes eleven alternative ratemaking mechanisms that are applicable to (and sometimes widely applied by) the U.S. electric power industry at the state level. These alternatives are all variants of traditional cost-of-service ratemaking, all of which rely on a determination of an initial revenue requirement through a cost-of-service study. But while traditional regulation generally allows rate changes relatively infrequently, the alternatives generally update the revenue requirement at regular intervals in response to changes in utility costs, sales, and profits. This updating mitigates the potential for rate shock and conflict among parties that sometimes accompany the relative infrequency of traditional rate cases.
The alternative ratemaking mechanisms that make broad revisions to traditional cost-of-service ratemaking are as follows:
• Formula rate plans use pre-specified formulas to calculate automatic rate adjustments to keep the utility's actual rate of return on equity (ROE) within or near a specified band around the authorized ROE. Formula rate plans can reduce the frequency and costs of rate cases, reduce utilities' financial risk and thereby reduce their costs of capital, allow customers to gain an early share of any cost efficiencies that the utility may develop between rate cases, allow rates to more closely track changes in electricity market conditions, and make rate changes more gradual over time. Only four states, mostly in the south, have formula rate plans for electric utilities.
• Straight fixed-variable (SFV) rates allow utilities to recover substantially all fixed costs through fixed monthly charges (per customer-month) or peak demand charges (per peak kW) that are independent of the volumes of electrical energy consumed. Volumetric charges (per kWh) are used to recover substantially all variable costs that depend primarily upon the energy consumed. By better aligning rates with costs, SFV rates improve utility recovery of fixed costs, provide customers with energy prices that are relatively efficient, mitigate or avoid the need to adjust rates in response to load changes, remove a disincentive to utility promotion of energy efficiency, encourage lower peak demands and higher load factors, and have more stable rates and lower administrative burdens than certain other ratemaking mechanisms. Only a few states have adopted SFV rates for electric utilities.
Christensen Associates Energy Consulting, LLC v 5/25/2016

Attachment A
• Revenue decoupling adjusts energy prices to compensate for differences between actual sales and test-year sales per customer. Revenue decoupling encourages energy conservation by consumers, removes disincentives to utility promotion of energy efficiency, and protects utility recovery of fixed costs from fluctuations in sales per customer. Twenty states have adopted electric decoupling at one time or another, although five of these states have since let their decoupling mechanisms expire.
• Lost revenue adjustment mechanisms (LRAMs) adjust rates between rate cases to account for the impacts on utility sales of the conservation that was not considered in developing the general rate case forecasts. These mechanisms help make utilities indifferent to sales lost due to conservation, thus removing a disincentive to utility promotion of energy efficiency and reducing the need for frequent rate cases; and they appear to be associated with relatively high energy conservation. Twenty states have adopted LRAMs for electric utilities.
• Multi-year rate plans allow full true-ups to the utility's actual cost of service once every three to five years, with automatic rate adjustments occurring in the interim. These adjustments generally use external factors beyond the utility's control, thus reflecting changes in the utility's business environment rather than changes in the utility's actual revenues or costs. Multi-year rate plans give the utility temporary incentives to cut costs and improve performance, provide more predictable utility revenues and customer rates, spread investment-induced rate increases over relatively long periods, and require fewer general rate cases. Sixteen states have multi-year rate plans, though half of these are merely rate freezes.
• Price cap plans seek to encourage utilities to reduce costs by making retail electricity prices (or average unit revenues) exogenous to the utility. Prices (or average unit revenues) are allowed to increase no faster than some measure of inflation, minus some measure of productivity improvement for the electric power industry. The effect of this productivity adjustment is to mimic a competitive market by giving industry-wide productivity gains to customers and allowing utility shareholders to profit from efficiency gains that beat the industry average productivity improvement. Price caps provide strong incentives for production efficiency. We are not aware of any U.S. electric utilities that have adopted price or revenue caps in more than the narrow sense of indexing some costs to inflation.
The alternative ratemaking mechanisms that make incremental revisions to either traditional or broadly revised versions of cost-of-service ratemaking are as follows:
• Future test years can be used as the source of the projected data used in rate cases. The future test year approach has the advantage of using data that are appropriate for the period to which the data will apply. States are fairly evenly divided between those that use future test years and those that use historical test years.
• Earnings sharing mechanisms allow rate adjustments outside of general rate case proceedings when actual ROEs would otherwise fall outside of specified bands around authorized ROEs. No rate adjustment is made when actual ROEs fall within the band;
Christensen Associates Energy Consulting, LLC vi 5/25/2016

Attachment A
and rates are adjusted to share between customers and shareholders the excess or deficient earnings outside of the band. Earnings sharing mechanisms help hold down procedural costs of assuring that utilities' actual ROEs do not stray far from authorized ROEs due to the operation of automatic rate change mechanisms or to changing business conditions.
• Cost trackers allow utilities to use a formula or predefined rule to recover specific costs from customers outside of general rate cases. They provide timely recovery of significant costs that are beyond utility control, which reduces utilities' financial risk without compromising their performance and without, in the long run, increasing costs to consumers. Cost trackers are ubiquitous throughout the U.S.
• Infrastructure surcharges allow some capital cost recovery prior to the completion of a facility's construction. By spreading capital cost recovery over a longer period of time than is traditional, infrastructure charges mitigate rate shock, improve utilities' cash flow during construction, and avoid delays in capital cost recovery.
• Performance incentive regulation provides incentives for utilities to maintain or improve service quality. Performance incentives can help make regulatory goals and incentives explicit, improve performance, and focus regulatory attention on the achievement of desired outcomes rather than on the means of obtaining those outcomes. Many states have adopted performance incentives of one type or another.
Recommendations for Alternative Ratemaking Mechanisms
The choice among the alternative ratemaking mechanisms and the designs of those mechanisms depend upon Texas' policy priorities. A mechanism that meets one policy goal will fail to address other policy goals, and may even conflict with other policy goals.
To reduce procedural costs, rates should update automatically, with minimal need for review by the PUCT and interveners. Nonetheless, nearly all of the alternative ratemaking mechanisms require at least periodic review of revenue requirements and the prudency of costs; and some, like price cap plans, require significant data that are not otherwise needed for reviewing the reasonableness of costs and rates.
To establish reasonable procedural timetables, there should be a regular timeframe for adjusting rates and reconciling them with utility costs. For example, major rate cases could be scheduled every three to five years, except under extraordinary circumstances; and automatic rate adjustments could occur annually, or perhaps semi-annually. The automatic rate adjustments would be accompanied by utility reports that would assure transparency, allow the PUCT and intervenors to review rate changes, and permit settlement negotiations if necessary.
To decouple cost recovery from load variations, three alternative ratemaking mechanisms are available: SFV rates, revenue decoupling, and LRAMs. They all stabilize utility recovery of fixed costs when loads significantly change, help reduce the importance of load forecasts in rate cases, and help mitigate utility disincentives for energy conservation. For Texas' TDUs, this need for decoupling is an issue only for residential and small non-residential customers, as large non-residentiai customers have no energy charges in their retail T&O rates.
Christensen Associates Energy Consulting, LLC VII 5/25/2016

Attachment A
Although only a few states have adopted SFV rates while many have adopted the two other alternatives/ a competitive market would tend toward SFV rate structures, not revenue decoupling or LRAMs. Competitive markets have many examples of fixed-variable pricing structures in which customers pay a fixed fee that covers the provider's fixed costs and a variable fee that covers the provider's variable costs. By contrast, revenue decoupling and LRAMs are purely artifacts of regulation: in competitive markets, firms will go out of business if they raise the price one customer pays because some other customer decides to consume less.
Thus, to decouple cost recovery from load variations, Texas' basic choice is between a ratemaking alternative (SFV) that mimics competition but requires significant revision of present rates, and two ratemaking alternatives (revenue decoupling and LRAMs) that begin with existing rates but are artifacts of regulation that are relatively burdensome to maintain. Our preference is to gradually move rates from their uneconomic initial levels toward those implied by SFV, not merely based on the theory that SFV is the only one of the three alternatives that mimics competition but also based on the fact that competition is coming - and is already here - in the form of distributed generation. The cross-subsidies that are implicit in present rates will be unsustainable in the face of this competition. The key "virtue" of revenue decoupling and LRAMs that has induced many states to adopt these alternative ratemaking mechanisms is that they allow continuation of the present cross-subsidies.
To assure cost recovery, a limited set of cost trackers is warranted. In principle, Texas' present cost trackers appear to be reasonable and worthy of continuation in some form.
To assure prudency of costs, any streamlined ratemaking process should retain the ability of the PUCT and interveners to review rate changes. To reduce potential conflicts during reviews, the data requirements and the methods for automatic rate adjustments need to be carefully defined at the outset of the design of the automatic adjustment programs.
To assure reasonable ROEs, earnings sharing mechanisms are desirable as a means of maintaining ROEs within bands consistent with market-based returns. At the inception of a TDU's automated rate change mechanisms, bands around the authorized ROE are defined within which no change would be made to the actual ROE. Actual ROEs would be ratcheted up or down when falling outside of the bands. The adjustment of any actual ROE falling outside the band could be limited to a pre-specified number of basis points in order to limit the volatility of rates over the plan period.
To assure service quality, performance incentives should accompany the operation of automatic rate adjustment mechanisms that might induce cost-cutting.
To promote energy conservation, SFV rates, revenue decoupling, and LRAMs can be used to remove a key disincentive to utility promotion of energy efficiency. Revenue decoupling, cost trackers, and performance incentives can be used to encourage energy conservation by
consumers.
To assure rate stability, new alternative ratemaking mechanisms could be phased in over a three- to five-year period. To avoid or mitigate rate shock due to automatic rate adjustments, Texas could place caps on the sizes of such adjustments, particularly rate increases. Rate adjustments that exceed the caps could be deferred for future recovery or refund.
viiiChristensen Associates Energy Consulting, LLC 5/25/2016
Attachment A
ALTERNATIVE ELECTRICITY RATEMAKING MECHANISMS
ADOPTED BY OTHER STATES
1. INTRODUCTION
Since the energy crisis and widespread generation investment cost overruns of the 1970s, the electric power industry and its regulators have developed and experimented with a range of ratemaking mechanisms that depart from traditional embedded cost-based ratemaking. These include, but are not limited to, revenue decoupling, lost revenue adjustment mechanisms (LRAMs), cost-specific trackers and riders, formula-based ratemaking, and performance-based ratemaking. These mechanisms are all currently in use in one or more states, so they can be assessed on the basis of experience. Some of them may prove useful tools in Texas if they meet Texas' various policy goals, such as incorporating adequate incentives for cost control and price efficiency, enhancing the precision and timeliness of utilities' cost recovery, and reducing the costs of rate case proceedings.
Although the development of the non-traditional ratemaking mechanisms was initially spurred by gyrating fuel prices and reconsideration of the incentive effects of traditional ratemaking upon utility performance, their development can usefully be seen as a general response to the rapidly changing business conditions of the electric power industry. These changing conditions are the result of several factors, of which the following are preeminent:
• Improving utilities' performance incentives has been a goal of regulation for decades, as traditional ratemaking provides mixed incentives for cost control and technological innovation.
• Restructuring of wholesale electricity markets fostered a potential for retail competition by facilitating competing firms' ability to deliver power to customers, creating new trading possibilities, and providing vital new market information.
• Public policy support for renewable energy has resulted in substantial investments in wind power and in solar power, causing significant impacts on power system operations and costs, transmission and distribution (T&D) needs and costs, and distributed resource technologies available to retail electricity customers.
• Technological progress in generation and information technologies has improved power system operations and is facilitating development of distributed resources, thus affecting power system costs and competition for sales to retail customers.
• Declining electricity sales growth over the past two decades, and particularly since the financial crisis of 2008-2009, is pressuring utilities to cut costs and reform rate structures so that the fixed and variable components of retail rates better reflect the fixed and variable components of utility costs.
The foregoing factors will continue to induce future change in the power industry's business and operating conditions. They have had substantial impacts on utility costs and on the
Christensen Associates Energy Consulting, LLC 1 5/25/2016

Attachment A
considerations that influence how electricity should be priced, and will continue to do so in the future.
This report responds to Senate Bill 774, through which the Texas Legislature has required the Public Utility Commission of Texas (PUCT) to analyze alternative ratemaking mechanisms adopted by other states and to provide a report thereon to the legislature by January 15, 2017. The bill specifically calls for "recommendations regarding appropriate reforms to the ratemaking process in this state" and "an analysis that demonstrates how the commission's recommended reforms would improve the efficiency and effectiveness of the oversight of electric utilities and ensure that rates are just and reasonable..." The bill reflects concerns that electric T&D costs are increasing substantially over time. While PUCT rules allow T&D utilities (TDUs) to seek timely recovery of transmission infrastructure costs twice yearly, the rate adjustment mechanism that permits timely recovery of distribution infrastructure costs is scheduled to terminate on September 1, 2019. Prior to this expiration, the State of Texas would like to explore the types of ratemaking mechanisms that might be used to ensure timely cost recovery while preserving incentives to achieve the other goals that might be fostered by appropriate rate design.
2. RETAIL ELECTRICITY RATEMAKING GOALS
"Just and reasonable" retail electricity rates reflect a balancing of different objectives. These objectives include the following.
• Full Recovery of Utility Costs. Rates should allow a reasonable opportunity for a prudent utility to receive sufficient revenues to attract new capital and avoid significant financial difficulties.
• Stable and Predictable Prices. Prices should change gradually over time. Rate shocks should be avoided.1
• Fair Prices. Rates should fairly allocate costs and risks among customer classes and between shareholders and customers. Rates should be non-discriminatory, reflect the relative costs of serving different customers, and minimize cross-subsidies.
• Efficient Consumption of Electricity. Rates should encourage customers to use efficient quantities of electricity. This generally means that prices should be based, to the extent possible, upon the utilit/s marginal costs of electricity production and delivery.
• Reliable Service. Rates should be consistent with promotion of power system reliability as measured by the frequency, duration, and magnitude of customer service outages. At a minimum, this means that rates should cover utilities' prudently incurred costs. It
1 Throughout this report, the term "electricity prices" refers to a number of dollars per unit of electricity services
consumed, while the term "electricity rates" encompasses electricity prices as well as other elements of tariff
structures. For example, the electricity rate paid by an industrial customer might include prices for electrical energy consumed, peak power consumption, and a monthly customer charge.
Christensen Associates Energy Consulting, LLC 2 5/25/2016
Attachment A
may also mean that consumers should face high peak-period prices that encourage peak load reductions.
• Affordable Electricity Service. Rates should encourage prudent cost control on the part of the utility.
• Diverse Power Resources. Rates should be consistent with public policy goals regarding fuel diversity and access to less polluting energy resources. This generally means that rates should be sufficient to cover the costs of power plant operations that minimize pollution, land use impacts, and water use; and that customers may be offered options to purchase power from renewable resources.
• Moderate Regulatory Burden. Rates should be designed to minimize the need for regulatory proceedings to update rates.
• Public Acceptability. Rates should be widely acceptable to the public.
The foregoing objectives sometimes conflict with one another, which is why ratemaking inevitably involves policy trade-offs among objectives.
3. TRADITIONAL ELECTRICITY RATEMAKING PRACTICE
Rates are traditionally set according to utilities' costs of service. The overall cost is the "revenue requirement," which is calculated as follows:
Revenue Requirement = Rate Base x Rate of Return + Depreciation + Taxes
+ Operations and Maintenance Expenses
where Rate Base is more or less the depreciated value of fixed assets, Rate of Return is a weighted average of the cost of debt and the return on equity capital, and Operations and Maintenance Expenses include labor and fuel costs.2
To determine rates, the revenue requirement is divided among functions (like generation, transmission, distribution, and customer service), then allocated among customer classes (like residential, commercial, industrial, and street lighting), and then assigned to billing determinants (like electrical energy consumed, peak power demand, and fixed monthly fees). The price for each billing determinant for each class is basically the cost assigned to that billing determinant for that class divided by the quantity of that billing determinant for that class. In
2 The rate base component of the revenue requirement includes an amount determined to be a working capital
allowance for fuel inventory. Certain fuel and purchased power costs are recovered through fuel factors and are not part of the base revenue requirement. TAC § 25.235 establishes the procedures for setting and revising fuel
factors and for regularly reviewing the reasonableness of fuel expenses recovered through the fuel factors. TAC § 25.236 identifies the types of fuel expenses that are eligible for recovery through the fuel factor and reconciled through the fuel reconciliation process, the latter of which must occur at least every three years and may occur outside of a base rate proceeding. TAC § 25.237 provides the instructions for revising fuel factors. TAC § 25.231
describes the working capital allowance for fuel inventory to be included in the invested capital of the utility.
Christensen Associates Energy Consulting, LLC 3 S/25/2016

Attachment A
principle, fixed monthly fees and demand charges are used to recover fixed costs, while energy charges are used to recover variable costs.
The data used to determine rates are for a Test Year, which may be a recent historical year or may be a future year to which the rates will apply.3 Because of variations in circumstances such
as weather, data may be normalized to reflect expectations for a "normal" year.
4. THE IMPETUS FOR RETAIL ELECTRICITY RATEMAKING REFORM
For decades, retail ratemaking reform has been driven by a desire to improve the incentive effects of traditional ratemaking on utility performance. In the wake of the wholesale restructuring of the 1990s and early 2000s, retail electricity ratemaking reform has also been driven by institutional changes at the wholesale level, public policy support for renewable energy sources, and advances in generation and information technologies. Since the financial crisis of 2008, the slowdown in the growth of electricity demand has been an additional consideration in ratemaking reform.
4.1. Improving Utilities' Performance Incentives
Traditional electricity ratemaking provides mixed incentives for cost control and technological innovation. Utilities have strong incentives to cut costs during the regulatory lag between rate cases because they can generally keep any savings resulting from increased efficiency; but cost- of-service ratemaking passes these savings on to customers after a rate case is completed. The relatively poor incentives of traditional electricity ratemaking have contributed to utility performance that is often below that of comparable competitive industries with respect to asset utilization, innovation, and research and development.4
The electric power industry has been dominated by regulated monopolies because monopolies can be the most efficient providers of services with large economies of scale and scope. For electricity, a single firm can provide T&D services in a given area more cheaply than can multiple firms; and, until the 1980s, it was generally believed that a single firm could provide integrated generation and transmission services more cheaply than vertically disaggregated firms. On the other hand, competition can be a spur to technological innovation and cost cutting, which has in fact been a benefit of restructuring of wholesale electric markets.
For the purpose of improving performance, public policy has encouraged competition in generation and customer services. It has also led to retail ratemaking based upon various types of "incentive regulation," also known as "performance-based regulation."
3 Texas uses an historical test year that is adjusted for known and measureable changes. See TAC § 25.231.
4 R. Lehr, "New Utility Business Models: Utility and Regulatory Models for the Modern Era," The Electricity Journal,
26{8): 35-53, 2013, http://www.americaspowerplan.com: and D. Malkin and P.A. Centolella, "Results-Based
Regulation: A more dynamic approach to grid modernization," Fortnightly Magazine, March 2014, http://mae.fortnightlv.com/article/Results-Based+Reeulation/1652496/200086/article.html.
Christensen Associates Energy Consulting, UC 4 5/25/2016

Attachment A
4.2. Restructuring of Wholesale Electricity Markets
In the 1990s, federal law and regulatory action opened electric transmission networks to non- discriminatory access.5 In the late 1990s and early 2000s, the creation of Independent System
Operators and Regional Transmission Organizations provided new centralized markets for trading electric power services and greatly added to the transparency of wholesale electricity prices in most of the U.S. Both of these developments fostered a potential for retail competition, the first by facilitating competing firms' ability to deliver power to customers, the second by creating trading possibilities and providing vital market information that had not existed before. That potential became a reality as, again in the late 1990s and early 2000s, nearly half the states passed laws or reformed regulation so that retail customers could shop for their electricity suppliers, and nearly half the states mandated or strongly encouraged their utilities to divest generation so that wholesale and retail competition could complement each other.
4.3. Public Policy Support for Renewable Energy
Public policy has provided substantial support for renewable energy, particularly wind and solar. Substantial federal tax credits encourage investment in renewable energy resources. States offer a plethora of loan and rebate programs in support of renewable energy, as well as the following major programs:6
• Corporate tax credits for investment in renewable energy resources (40 states);
• Personal tax credits for investment in renewable energy resources (42 states);
• Property tax incentives for investment in renewable energy resources (nearly all states);
• Renewable portfolio standards by which minimum percentages of electricity must be generated by specified renewable energy resources (30 states); and
• Net metering, which effectively pays the full retail rate for some self-generated electricity (42 states).
This public policy support has resulted in substantial investments in wind power and, to a lesser but growing extent, in solar power. These investments have had significant impacts on T&D needs and on how power systems must be operated. They have also had significant impacts on the power resource options available to retail customers, on the power system costs that must be recovered from retail electricity customers, and on the allocation of power system costs among customers.
5 In this regard, the seminal law was the Energy Policy Act of 1992 and the seminal regulatory reform, in 1996, was
Order No. 888 of the Federal Energy Regulatory Commission.
6 The listing and statistics are derived from information found at http://programs.dsireusa.org/. In the listing,
"states" include the District of Columbia.
Christensen Associates Energy Consulting, LLC 5 5/25/2016

Attachment A
4.4. Technological Progress
Technological progress has resulted in substantial improvements in the efficiency and performance of a wide range of generation resource types, including fossil fuel, nuclear, and renewable resources. Technology advances have increased the efficiency of customers' electricity-using equipment and devices, thus contributing to a reduction in electricity consumption relative to gross domestic product (GDP). Startling improvements in information technologies have facilitated significant efficiency gains in the coordination of power system resources, thereby also facilitating the incorporation into power systems of new resources like renewables, demand-side resources, and distributed resources in general. New information technologies have also helped implement competition among resources.
4.5. Declining Sales Growth
The electricity-intensity of the U.S. economy - that is, electricity consumption relative to GDP - has fallen in recent decades due to the technology advances just described as well as due to the shift of the U.S. economy from manufacturing toward service industries. The growth rate of electricity demand is today less than one half that of GDP, and is not expected to return to the higher levels experienced from 1975 to 1995, when electricity demand and GDP grew at about the same rate, or the two decades prior to that when electricity demand growth rates exceeded those of GDP.
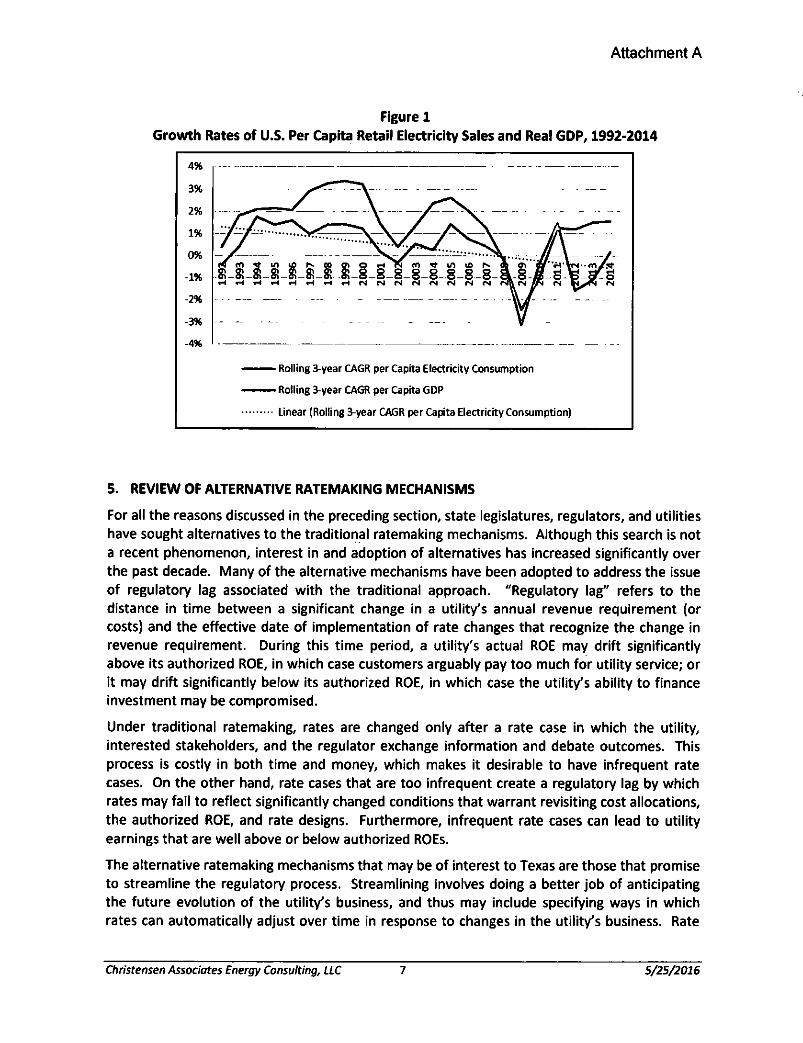
Consistent with this falling electricity-intensity, Figure 1 shows that, over the period 1992 to 2014, the rate of growth of per capita retail electricity sales slowed relative to the rate of growth of per capita real GDP, particularly since the financial meltdown of 2008-2009. To smooth out very short-term fluctuations, the figure shows three-year rolling compound annual growth rates (CAGRs) of sales and GDP. The trend line for retail sales growth signals a generally downward trend over the period, which is a departure from the relationship in previous decades during which electricity sales growth rates exceeded those of GDP. Since 1992, the growth rate of per capita electricity sales has generally lagged far behind that of GDP.
Under traditional ratemaking, a utility's ability to recover its authorized rate of return on equity (ROE) is compromised if its long-term investments are made in anticipation of forecast sales growth that turns out to be higher than actual sales growth. While utilities can substantially reduce variable costs in response to low sales, they cannot significantly reduce fixed costs. For competitive generation services, fixed cost recovery depends upon prices that are set by the market. For non-competitive services, including T&D, fixed costs are recovered through charges that are basically averaged over sales: when sales go down, the per-unit charge for recovery of these fixed costs goes up.
Because sales growth in recent years has been lower than the previous historical trend, and because distributed generation promises to limit future sales growth, utilities are concerned about their ability to recover fixed costs. Consequently, utilities are seeking ways by which rates for T&D services can be adjusted more or less automatically with changes in electricity sales.
Christensen Associates Energy Consulting, LiC 6 5/25/2016
Attachment A
Figure 1
Growth Rates of U.S. Per Capita Retail Electricity Sales and Real GDP, 1992-2014
Rolling 3-year CAGR per Capita Electricity Consumption
Rolling 3-year CAGR per Capita GDP
Linear (Rolling 3-year CAGR per Capita Electricity Consumption)
5. REVIEW OF ALTERNATIVE RATEMAKING MECHANISMS
For all the reasons discussed in the preceding section, state legislatures, regulators, and utilities have sought alternatives to the traditional ratemaking mechanisms. Although this search is not a recent phenomenon, interest in and adoption of alternatives has increased significantly over the past decade. Many of the alternative mechanisms have been adopted to address the issue of regulatory lag associated with the traditional approach. "Regulatory lag" refers to the distance in time between a significant change in a utility's annual revenue requirement (or costs) and the effective date of implementation of rate changes that recognize the change in revenue requirement. During this time period, a utility's actual ROE may drift significantly above its authorized ROE, in which case customers arguably pay too much for utility service; or it may drift significantly below its authorized ROE, in which case the utility's ability to finance investment may be compromised.
Under traditional ratemaking, rates are changed only after a rate case in which the utility, interested stakeholders, and the regulator exchange information and debate outcomes. This process is costly in both time and money, which makes it desirable to have infrequent rate cases. On the other hand, rate cases that are too infrequent create a regulatory lag by which rates may fail to reflect significantly changed conditions that warrant revisiting cost allocations, the authorized ROE, and rate designs. Furthermore, infrequent rate cases can lead to utility earnings that are well above or below authorized ROEs.
The alternative ratemaking mechanisms that may be of interest to Texas are those that promise to streamline the regulatory process. Streamlining involves doing a better job of anticipating the future evolution of the utility's business, and thus may include specifying ways in which rates can automatically adjust over time in response to changes in the utility's business. Rate
Christensen Associates Energy Consulting, LLC 1 5/25/2016

Attachment A
cases, or some other process for reviewing the utilit/s business conditions, will still be needed to confirm, at regular intervals, that the automatic adjustment mechanisms are yielding just and reasonable results and promoting prudent investments and operations; and regulatory proceedings that may include rate cases will also be needed to implement any changes in public policy that materially change the utility's business.
Other alternative ratemaking mechanisms of interest to Texas are those that promise to assure timely and efficient recovery of T&D costs. Senate Bill 774 is particularly motivated by the expiration of the periodic rate adjustment mechanism for recovery of distribution infrastructure costs, though the substantial transmission investment costs associated with connecting renewable resources to the Texas grid are also a motivating factor.
This section describes eleven alternative ratemaking mechanisms that are applicable to (and sometimes widely applied by) the U.S. electric power industry at the state level. These alternatives are all variants of traditional cost-of-service ratemaking, all of which rely on a determination of an initial revenue requirement through a cost-of-service study. But while traditional regulation allows rate changes on an infrequent basis that depends on when the utility determines that it needs to change rates to keep pace with changes in its costs and sales, the alternatives generally update the revenue requirement at regular intervals in response to changes in utility costs, sales, and profits. This updating mitigates the potential for rate shock and conflict among parties that sometimes accompany the relative infrequency of traditional rate cases. The alternatives can also differ from traditional regulation in how they allocate costs to energy, demand, and customer charges.
This section divides the alternative ratemaking mechanisms into two groups: those that make broad revisions to traditional cost-of-service ratemaking; and those that make incremental revisions to either traditional or broadly revised versions of cost-of-service ratemaking. These mechanisms are not entirely distinct, however, partly because they have overlapping elements and characteristics, and partly because different states use the same names to refer to programs that might be quite different. Consequently, the descriptions of these mechanisms reflect both the overlaps and the inconsistencies. For Texas, the substantive challenge is to identify the elements of these mechanisms that are most attractive and to combine them in coherent programs regardless of their names.
5.1. Broad Revisions to Cost-of-Service Ratemaking
This section is concerned with six broad alternatives to cost-of-service ratemaking. Although costs of service serve as the foundation for all these alternatives, the six alternatives each make some fundamental changes in how rates are set.
Christensen Associates Energy Consulting, LLC 8 5/25/2016

Attachment A
5.1.1. Formula Rate Plans
Formula rate plans (FRPs) use pre-specified formulas to calculate automatic rate adjustments to keep the utilit/s actual rate of ROE within or near a specified band around the authorized ROE.7
Such plans require specification of the initial base ROE, the band around the authorized ROE, the sharing between customers and shareholders of actual earnings that fall outside the band, any limits on the size of adjustments to the ROE, any performance standards that the utility must meet to qualify for adjustments to the ROE through performance adders, and monitoring and reporting requirements. Performance-standards are important to assure that quality of service will not be impaired by any cost-cutting that is incented by the plan. The most recent general rate case provides the overall cost allocation and rate design methods, key parameters such as depreciation rates and the cash working capital allowance, and the formula for making rate adjustments.
At regular intervals, the cost basis for FRP rates is re-examined. Utilities are required to provide the cost and revenue information used in the formula. Regulatory review focuses on the prudence of utility costs and the utilit/s application of the formula.
Figure 2 shows that only four states, mostly in the south, have FRPs for electric utilities.8
7 This definition is more or less that of K. Costello, "Formula Rate Plans: Do They Promote the Public Interest?,"
National Regulatory Research Institute, 10-11, August 2010, p. II. M.N. Lowry, "PBR for the Electric 'Utility of the
Future'," presentation, September 24, 2014, p. 20, offers a somewhat equivalent alternative definition under
which FRPs annually adjust the revenue requirement to reflect certain cost changes.
8 A fifth state, Missouri, has recently passed legislation promoting a version of an FRP that the legislation calls
"performance-based" ratemaking.
Christensen Associates Energy Consulting, LLC 9 5/25/2016

Attachment A
Figure 2Jurisdictions With Formula Rate Plans for Electric Utilities9
Benefits and Shortcomings of Formula Rate Plans
The benefits of FRPs include the following:
• They can reduce the frequency and costs of rate cases.
• They can reduce utilities' financial risk, thereby reducing their costs of capital.
• They can allow customers to gain an early share of any cost efficiencies that the utility may develop between rate cases.
• They allow rates to more closely track changes in electricity market conditions.
• They can make rate changes more gradual over time, meeting cost increases through rates that change by moderate amounts annually rather than by a single large amount in the aftermath of a general rate case.
On the other hand, formula rates have the following shortcomings:
• They tend to shift financial risks toward customers.
• Their automatic adjustment of rates can result in less thorough review of utility costs by regulators.
9 M.N. Lowry, M. Makes, and G. Waschbusch, Alternative Regulation for Emerging Utility Challenges: 2015 Update,
prepared for Edison Electric Institute, November 11,2015.
Christensen Associates Energy Consulting, LLC 10 5/25/2016

Attachment A
• Their reduced regulatory lag may reduce utility incentives to control costs between general rate cases.
These shortcomings can be mitigated by limiting the circumstances in which rate adjustments are made. For example, adjustments may be allowed only when particular circumstances cause ROE to fall outside the band. The shortcomings can also be mitigated by requiring utilities to demonstrate the prudence of any unexpected costs that imply the need for a rate increase.
State Experience with Formula Rate Plans
Alabama
Alabama Power Company (APCO) has had an FRP, called the Rate Stabilization and Equalization plan, since 1982. The Alabama Public Service Commission (APSC) annually examines the reasonableness of APCO's costs and compares APCO's expected ROE to its authorized ROE range on its retail business. Public meetings throughout APCO's service territory accompany the annual reviews. If necessary, the APSC adjusts APCO's base revenues and rates to keep the expected ROE within the authorized range. To mitigate rate shock, annual rate increases may not exceed 5% and the average annual rate increase over any two-year period may not exceed 4%.
By December 1 of each year, APCO provides to the APSC its projected retail ROE for the next year, with an analysis of the main causes of the need for any rate adjustment. In December, relevant parties discuss whether and why a rate adjustment may be needed. Any necessary adjustment begins with January billings.
By March 1 of each year, APCO provides to the APSC a calculation of its actual retail ROE for the prior calendar year. If APCO's actual ROE exceeds the authorized range, APCO refunds the excess to customers. If its actual ROE was below the authorized range, no action is taken.
In addition to the annual reviews, the APSC regularly monitors and examines APCO's operations, expenses, and budgets.
The APSC supports the continuation of the Rate Stabilization and Equalization plan because it is less adversarial than the traditional cost-of-service regulation process. Nonetheless, APSC made some revisions to the plan in 2013. To reduce the ROE over time, the APSC changed the ROE range of reasonableness so as to increase APCO's equity ratio.10 The APSC also increased
its oversight of APCO by requiring that APCO make semi-annual rather than annual financial reports, by requiring APCO to produce five-year historical performance reports, and by including the Attorney General in the APSC's ongoing review process.
10 Alabama Public Service Commission, Public Proceeding Established to Consider Any Necessary Modification to
Rate Stabilization and Equalization Mechanism Applicable to Alabama Power Company, Dockets 18117 and 18416, Report and Order, August 21,2013, obtained at:https://www.pscpubiicaccess.alabama.gov/pscpublicaccess/ViewFile.aspx%3Fld%3D13e2bb0b-6bfd-46d7-b5cf-
78966693820a+&cd=4&hl=en&ct=cink&gl=us
Christensen Associates Energy Consulting, LLC 11 S/2S/2016
Attachment A
Illinois
Illinois' FRPs incent the state's two largest utilities to invest in T&D upgrades and advanced metering infrastructure. The two utilities have the option of adopting FRPs for their distribution rates if their investments in such infrastructure over a ten-year period meet certain targets: $360 million to $720 million for Ameren Illinois; and $1.5 billion to $3.0 billion for Commonwealth Edison. During the investment program's peak year, Ameren Illinois and Commonwealth Edison must respectively create at least 450 and 2,000 full-time equivalent jobs or make payments to a state job training program. A utility's failure to meet these requirements or certain other performance targets can result in discontinuation of the formula rate, at which time the utility's rates remain unchanged until reset in the next general rate case.
Authorized ROEs are set at current yields of 30-year U.S. Treasury bonds for the applicable year plus 6%. Rates are adjusted to keep actual ROEs within 0.5% of the authorized levels; but residential rates may not rise by more than 2.5% per year. Rates also depend upon various performance measures, such as budget controls, outage duration and frequency, safety, customer service, efficiency and productivity, and environmental compliance.
The 2011 legislation that authorized the FRPs (Public Act 097-0616) mostly sunsets at the end of 2017. By that time, the Illinois Commerce Commission must report to the legislature on the infrastructure program and the FRPs.
Louisiana
Entergy's three Louisiana affiliates have FRPs that were initiated in the years 1992 through 2008. The 2008 FRP initiated for Entergy New Orleans led to five years of rate reductions, a happy result that may have been less attributable to the FRP than to the happenstance of natural gas price decreases in the years following 2008.
All three FRPs adjust rates annually to bring actual ROEs within bands. ROE deviations greater than 0.05% trigger adjustments to base revenue requirements. Special consideration may be given to extraordinary events that have costs that significantly affect ROEs. The annual evaluation process requires several months and extensive communications among parties.
The FRPs are accompanied by trackers for the costs of environmental compliance, energy efficiency program implementation, renewable generation capacity, and other specific endeavors.
Mississippi
The FRP for Mississippi Power Company was initiated in 1986 and that for Entergy Mississippi was initiated in 1992. These two very similar FRPs use pre-determined formulas to adjust base rates between rate cases in response to changes in economy-wide inflation rates, overall economic activity, and utility costs. Near the end of each year, the utilities file updates to their FRPs for the forthcoming year, which determines whether rates need to be changed to be within 0.50% of the ROE targets. Hearings are scheduled for "major" changes as defined by Mississippi statute.
Christensen Associates Energy Consulting, LLC 12 5/25/2016

Attachment A
Early in each year, the utilities submit calculations of their actual ROEs for the preceding year, if the actual ROEs deviate by more than 0.50% from the ROE targets, the utilities refund to current customers or charge current customers amounts of money sufficient to bring actual ROEs within 0.50% of the targets. In no event, however, may the revenue adjustment for the prior year plus any other revenue adjustment for the same prior year exceed 4% of the utility's annual aggregate retail revenues for that prior year.
The ROE targets are adjusted for each utility's performance rating. The performance rating is based upon an aggregate of three performance metrics:
• The utility's average retail price per kWh relative to those of peer utilities, which are other vertically integrated investor-owned utilities in the Southeastern U.S.
• Customer satisfaction with the utility as measured by a semi-annual Commission- administered customer opinion survey conducted by independent professional survey firms. The current performance rating is based upon the average results of the two
most recent surveys.
• Customer service reliability as measured by the percentage of time that electric service was available to customers during a recent thirty-six month period.
5.1.2. Straight Fixed-Variable Rates
Utilities have variable costs that depend primarily upon the volumes of electrical energy consumed, and they have fixed costs that depend primarily upon numbers of customers or peak loads. Under traditional ratemaking, large shares of fixed costs are recovered through volumetric charges (dollars per kWh) rather than through fixed monthly charges (dollars per customer-month) or peak demand charges (dollars per peak kW). This traditional approach leads to systematic mismatches between utility revenues and costs: growing sales cause utility revenues to rise faster than costs, while shrinking sales cause utility revenues to fall faster than costs. i
To foster a better match between utility revenues and costs, straight fixed-variable (SFV) rates allow utilities to recover substantially all fixed costs through fixed monthly charges or peak demand charges that are independent of the volumes of electrical energy consumed. Volumetric charges are used to recover substantially all variable costs that depend primarily upon the energy consumed.
Most SFV applications have eliminated volumetric charges as a means of recovering the costs of base rate inputs. The lost volumetric revenues are recovered through fixed customer charges or reservation charges that vary with expected peak demand. Fixed charges tend to be used for residential and small non-residential customers, while reservation or other peak demand charges are used for larger customers with interval or other advanced meters.
SFV can be applied with fixed charges or demand charges that are differentiated across time or customer groups. Fixed charges can be constant all year or vary by season, though seasonal variation would not likely improve customer welfare or consumption efficiency. On the other hand, well-designed seasonal or on peak demand charges could improve customer welfare and
Christensen Associates Energy Consulting, LLC 13 5/25/2016
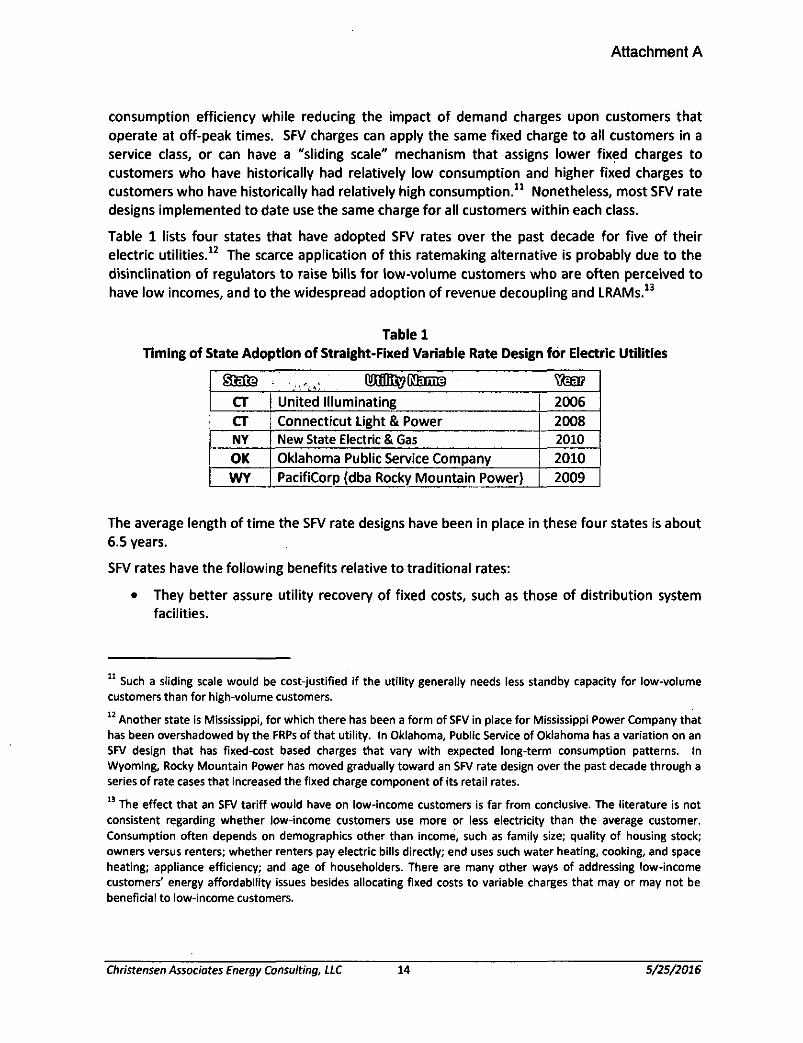
Attachment A
consumption efficiency while reducing the impact of demand charges upon customers that operate at off-peak times. SFV charges can apply the same fixed charge to all customers in a service class, or can have a "sliding scale" mechanism that assigns lower fixed charges to customers who have historically had relatively low consumption and higher fixed charges to customers who have historically had relatively high consumption.11 Nonetheless, most SFV rate
designs implemented to date use the same charge for all customers within each class.
Table 1 lists four states that have adopted SFV rates over the past decade for five of their electric utilities.12 The scarce application of this ratemaking alternative is probably due to the
disinclination of regulators to raise bills for low-volume customers who are often perceived to have low incomes, and to the widespread adoption of revenue decoupling and LRAMs.13
Table 1
Timing of State Adoption of Straight-Fixed Variable Rate Design for Electric Utilities
;.,.v (MBagKfcnre
CT | United Illuminating 2006CT Connecticut Light & Power 2008NY New State Electric & Gas 2010OK Oklahoma Public Service Company 2010WY PacifiCorp (dba Rocky Mountain Power) 2009
The average length of time the SFV rate designs have been in place in these four states is about 6.5 years.
SFV rates have the following benefits relative to traditional rates:
• They better assure utility recovery of fixed costs, such as those of distribution system facilities.
11 Such a sliding scale would be cost-justified if the utility generally needs less standby capacity for low-volume
customers than for high-volume customers.
12 Another state is Mississippi, for which there has been a form of SFV in place for Mississippi Power Company that
has been overshadowed by the FRPs of that utility. In Oklahoma, Public Service of Oklahoma has a variation on an SFV design that has fixed-cost based charges that vary with expected long-term consumption patterns. In Wyoming, Rocky Mountain Power has moved gradually toward an SFV rate design over the past decade through a series of rate cases that increased the fixed charge component of its retail rates.
13 The effect that an SFV tariff would have on low-income customers is far from conclusive. The literature is not
consistent regarding whether low-income customers use more or less electricity than the average customer.
Consumption often depends on demographics other than income, such as family size; quality of housing stock; owners versus renters; whether renters pay electric bills directly; end uses such water heating, cooking, and space heating; appliance efficiency; and age of householders. There are many other ways of addressing low-income customers' energy affordability issues besides allocating fixed costs to variable charges that may or may not be beneficial to low-income customers.
Christensen Associates Energy Consulting, LLC 14 5/25/2016

Attachment A
• They provide customers with energy prices that are relatively efficient in the sense that they reflect variable costs that are related to marginal costs. Ignoring the costs of externalities such as the pollution associated with electricity generation, this may encourage more efficient use of electricity.
• Because of the better match between variable costs and volumetric revenues, they
mitigate or avoid the need to adjust rates in response to changes in load growth.
• They reduce the importance of load forecasts in rate cases, potentially reducing the contentiousness of rate cases.
• They remove a disincentive to utility promotion of energy efficiency, since any revenue declines due to energy efficiency are roughly matched by reductions in variable costs.
• Because of their higher demand charges and lower energy charges, they encourage lower peak demands and higher load factors, thus increasing the use of existing electric power system facilities and potentially slowing the growth of capacity-related costs.
• Higher demand charges may facilitate investment in and use of market-based distributed resources such as load management and energy storage technologies.
• SFV rates tend to be stable relative to revenue decoupling rates.
• Compared to revenue decoupling and LRAMs, the SFV rate design imposes low administrative burdens on regulators and intervenors.
On the other hand, SFV rates have the following actual or perceived shortcomings relative to traditional rates:
• They adversely affect low-volume customers within each customer class, who must pay fixed charges that cover the fixed costs of their service, like those of their own line drops. To the extent that there is a correlation (between customer size and customer income, SFV rates could adversely affect low-income customers.
• They reduce incentives for energy efficiency because of lower electrical energy prices.
• They reduce energy charges to short-term variable cost, which may be lower than the economically efficient level of long-term marginal cost. Such low energy charges could therefore lead to inefficiently high consumption.
• SFV pricing does not avoid the need for occasional price revisions due to inflation.
State Experience With SFV Rate Design
Connecticut
In 2007, Connecticut law was amended to require the state utility commission to decouple the distribution revenues of Connecticut Light & Power (CL&P) from the volume of its electricity
Christensen Associates Energy Consulting, LLC 15 5/25/2016

Attachment A
sales.14 This decoupling was to be achieved either through a mechanism that adjusts actual
distribution revenues so that they equal allowed distribution revenues or through a mechanism that increases the amount of distribution cost recovery that is achieved through fixed distribution charges.
In response to this legislation, CL&P developed an SFV mechanism that has gradually shifted distribution fixed cost recovery from energy charges toward customer and demand charges. This mechanism is weather-normalized: customers are credited with or charged amounts based upon differences between weather-adjusted revenue per customer and the revenue requirement per customer determined in the most recent rate case.
In its 2008 order approving CL&P's SFV mechanism, the state commission said the following:
While the concept of fixed revenue recovery is straightforward, implementing this rate design is not and must be implemented gradually. As noted by CL&P, there are identifiable differentials in the cost to serve residential customers. Therefore, it is appropriate to consider a tiered or sliding structure of residential distribution charges. The Department [of Public Utility Control] considered using monthly consumption to establish sliding customer charges. However, using this standard could subject the Company to frequent changes to the applicable customer charge as customers' monthly usage changes. This in turn could result in revenue instability, a situation that this [sic] contrary to the goal of this policy. Further, basing a customer charge on consumption (i.e., increased consumption warrants the assessment of a higher charge) would continue to link sales and earnings.15
New York
In 2007, the New York Public Service Commission required that the state's utilities adopt revenue decoupling mechanisms, among which it included SFV rate designs.16 The
Commission's explicit goal was to remove disincentives for utility support of energy efficiency, renewable generation, and distributed generation.
In compliance with this requirement, New York State Electric & Gas Company (NYSEG), in 2009, proposed an SFV rate design for both electric and natural gas customers, in which context that rate design has been consistently called a revenue decoupling mechanism. NYSEG's Commission-approved plan, which was the product of negotiations between NYSEG and various consumer representatives, includes the following features:
14 Public Act No. 07-242, An Act Concerning Electricity And Energy Efficiency, effective July 1,2007.
15 Department Of Public Utility Control, Draft Dec/s/on^Application of The Connecticut Light and Power to Amend
Rate Schedules, Docket No. 07-07-01, January 16,2008, p. 117.
16 New York Public Service Commission, Order Requiring Proposals for Revenue Decoupling Mechanisms, Cases 03-
E-0640 and 06-G-0746, April 20,2007.
Christensen Associates Energy Consulting, LiC 16 5/25/2016

Attachment A
• It sets revenue targets by customer class.
• It recovers most fixed costs through demand and customer charges.
• It has an earnings sharing scheme that has two sets of deadbands. The utility retains all earnings variations within the first deadband, 50% of earnings variations between the first and second deadbands, and 15% of earnings variations beyond the second deadband. The deadbands depend upon the utility's reliability performance as measured by a Customer Average Interruption Duration Index and a System Average Interruption Frequency Index: poor utility performance lowers the deadbands and thus shifts earnings toward customers.
Wyoming
In the wake of a stipulation with consumer representatives reached in 2009, Rocky Mountain Power has gradually shifted toward an SFV rate design that recovers most fixed costs through customer and demand charges. For example, by raising the residential customer monthly base charge from $10.18 to $20.00, the utility shifted to the monthly customer charge a significant share of fixed cost recovery from the residential class. The SFV rate design also includes inverted energy rates that have lower energy prices on low levels of consumption than on higher levels of consumption.
The Wyoming commission accepted the stipulation for several reasons.
The Commission... finds the proposed monthly basic charge of $20.00 is supported by the Company's cost of service study which identified a cost of service monthly charge of approximately $26.00 per month... The Commission finds that implementation of the inverted block rate design, which provides reduced energy charges for lower energy usage, sends appropriate pricing signals to customers, and encourages energy conservation. Further, the increase in the basic monthly charge is consistent with the Commission's desire for continued -- but measured-- movement toward cost-based rates.17
5.1.3. Revenue Decoupling
The revenue decoupling concept was developed in the 1980s for the explicit purposes of encouraging energy efficiency and of removing utility incentives to increase sales. While SFV rates address the latter purpose, they do so by reducing the energy component of retail electricity rates, thereby reducing conservation incentives. Revenue decoupling, by contrast, assures utility recovery of fixed costs without significantly reducing retail energy prices.
17 Wyoming Public Service Commission, Memorandum Opinion, Findings And Order Approving Stipulation, In The
Matter Of The Amended Application of Rocky Mountain Power for Approval of a General Rate Increase of Approximately $28.8 Million Per Year (6.1 Percent Overall Average Increase), Docket No. 20000-333-ER-08 (Record
No. 11824), May 20, 2009, p. 21.
Christensen Associates Energy Consulting, LLC 17 S/25/2016

Attachment A
Revenue decoupling accomplishes this by adjusting energy prices to compensate for differences between actual sales and test-year sales per customer.
Many states have also used revenue decoupling as a means of reducing rate case frequency and streamlining electricity regulation.
State Adoption of Revenue Decoupling
Twenty-two states have adopted gas decoupling and twenty states have adopted electric decoupling at one time or another, although five of these states have since let their decoupling mechanisms expire.18 This encompasses 52 local gas distribution utilities and 25 electric
utilities.
Figure 3 depicts the states in which at least one electric utility (but not necessarily all electric utilities) has a revenue decoupling mechanism. Over half of the states adopting decoupling mechanisms are states that also opened their retail markets to competitive retail providers and reside in territories served by Regional Transmission Organizations operating restructured wholesale electricity spot markets. The three states with pending electric decoupling proposals are Arkansas, Colorado, and New Mexico.
18 The twenty-two states that have adopted gas decoupling mechanisms are Arizona, Arkansas, California, Georgia,
Illinois, Indiana, Maryland, Massachusetts, Michigan, Minnesota, Nevada, New Jersey, New York, North Carolina,
Oregon, Rhode Island, Tennessee, Utah, Virginia, Washington, Wisconsin, and Wyoming. The three states with pending gas decoupling proposals are Connecticut, Delaware, and Nebraska. The Arizona commission considered
an electric revenue decoupling mechanism but has instead adopted an LRAM for Arizona Public Service Company. The five states that have let revenue decoupling mechanisms expire are Colorado, Florida, Michigan, Montana, and
Wisconsin.
Christensen Associates Energy Consulting, LLC 18 5/25/2016

Attachment A
Figure 3Jurisdictions With Revenue Decoupling for Electric Utilities19
For each of the states shown in Figure 3 with active programs. Table 2 shows the years in which each state adopted their electric utility revenue decoupling mechanisms. These mechanisms were adopted, on average, in 2009, which gives the average state six years' experience.
Table 2Timing of States' Adoption of Electric Utility Revenue Decoupling
State YearCA 2002CT 2009DC 2009HI 2010ID 2007
State Year
MA 2011MD 2007ME 2009MN 2015NY 2007
State YearOH 2012OR 2009Rl 2011VT 2006WA 2013
Revenue Decoupling Design Issues
Decoupling mechanisms are generally based upon revenues per customer. Authorized revenue per customer is calculated by dividing the last approved revenue requirement by the number of customer accounts assumed in that rate proceeding. Total authorized revenues are calculated 19
19 Lowry, Makos, and Waschbusch, op cit.
Christensen Associates Energy Consulting, LLC 19 5/25/2016
Attachment A
by multiplying the authorized revenue per customer times the number of customers in the current decoupling period. If a utility's actual sales per customer are lower than the level assumed in setting existing rates, retail energy rates would be increased so that actual revenue per customer better approximates authorized revenue per customer. Similarly if sales are higher than assumed, retail energy rates would be reduced.
In designing and implementing a revenue decoupling program, several questions must be addressed, including the following:20
• How often should decoupling adjustments be made? Nineteen electric utilities have annual adjustments, while four have monthly adjustments.
• Should decoupling adjustments be based on the entire difference between actual and authorized revenues, or upon some fraction of that difference? Fifteen electric utilities base their adjustments on fractions of the difference.
• Should actual revenues be adjusted for deviations of actual weather from the normal weather assumed at the time base rates are set? Two electric utilities have such weather adjustments, while twenty-one do not.
• Should authorized revenues change annually by means other than a general rate case? Eleven electric utilities have such "attrition adjustments" for changes in fixed costs.
• Should comparisons of actual revenues to authorized revenues be at the utility level or at a customer class or rate schedule level? Class-level treatment is common, particularly for the purpose of avoiding changes in customer class cost allocations between general rate cases. This can result, however, in rate increases for some classes at the same time as rates are being reduced for other classes.
• Should there be Ijmits on the size of decoupling adjustments? If so, should any excesses be ignored, carried forward to future periods, or handled in some other manner? New York handles this problem by requiring utilities to file for a decoupling adjustment when the accumulated balance reaches a pre-specified limit.
• Does revenue decoupling reduce business risk? If so, should authorized ROEs be reduced for utilities with revenue decoupling programs?
There are a variety of unique or uncommon features in revenue decoupling mechanisms. Four utilities' decoupling schemes provide only for surcharges, not refunds. One utility anticipates the impacts of rate changes on energy demand by making a price elasticity adjustment in its decoupling true-up. Utilities vary in the extent to which the components of the fixed cost revenue requirement are subject to revenue decoupling adjustments.
Almost every state regulatory commission order approving a utility revenue decoupling mechanism has addressed the question of whether adoption of revenue decoupling reduces the utility's business risk and should therefore require a reduction in the authorized ROE. As
20 Most of these questions also must be addressed in considering SFV rate designs.
Christensen Associates Energy Consulting, LLC 20 5/25/2016

Attachment A
shown in Table 3, a large majority of state commission decisions and stipulated agreements for the adoption of decoupling included no ROE reductions. Of the reductions that occurred, 10 basis points was the most common amount. Almost half of the cases including a 10-basis point reduction were approvals of settlement agreements. One of the three decisions making a 25 basis point reduction concerned adoption of a settlement agreement. The largest reductions - 50 basis points - are limited to Maryland and the District of Columbia; but Maryland, with three of these decisions, did not impose an ROE reduction in two other cases.
Tables
State PUC Decisions Regarding Return on Equity Reduction
Benefits and Shortcomings of Revenue Decoupling
Revenue decoupling has the following ostensible benefits:
• It encourages energy conservation by consumers by retaining electrical energy prices that significantly exceed variable costs.
• It removes disincentives to utility promotion of energy efficiency.
• If protects utility recovery of fixed costs from fluctuations in sales per customer.
• It reduces the need for accurate sales forecasts in general rate cases.
On the other hand, revenue decoupling has the following shortcomings:
• Ignoring the costs of externalities, it can encourage inefficiently low consumption of electricity.
• It shifts some risks, like that of weather variability, from the utility to its customers.
• It discourages utilities from trying to make electricity sales for uses that might be beneficial to both consumers and society.
• It is more administratively complex than SFV ratemaking.
Christensen Associates Energy Consulting, LLC 21 S/2S/2016
Attachment A
Gilleo et al found that, when states with LRAM were compared to states with at least one electric utility operating under revenue decoupling, states with decoupling appear to be spending more on energy efficiency relative to revenue, and a similar pattern appears for electricity savings.21 Median incremental electricity savings in 201B was 1.4% for states with
decoupling, compared with median savings of 0.5% for states with LRAM. However, it is important to note that all but one of the decoupling states also had an energy efficiency resource standard policy in place, which is the dominant policy associated with greater energy efficiency spending and savings.
State Implementation Experience
Based on recent research on decoupling mechanisms applied in the U.S., several broad conclusions can be reached:
• Electric decoupling rate adjustments are generally no more than 2% of retail rates. Morgan reports that 65% of monthly electric decoupling rate adjustments and 85% of annual electric decoupling rate adjustments are less than 2%.22
• Decoupling rate adjustments yield both refunds and surcharges. For all electric and gas utility adjustments reported in Morgan, 63% were surcharges and 37% were refunds. Actual revenues deviate from forecast values because of weather, changing economic conditions, energy efficiency programs, customer response to price, and other factors.
• Decoupling rate mechanisms generally fail to normalize revenues for the effects of weather. Because weather is the primary cause of sales volume variations, this lack of normalization adds to the instability of rate adjustments, particularly when such adjustments are made on a monthly basis or are for customer classes (e.g., residential) with particularly weather-sensitive loads.
Figure 4 summarizes the distribution of percentage rate increases (surcharges) and decreases (refunds) for electric utility revenue decoupling mechanisms across 195 monthly rate adjustments each for the residential and commercial classes. For both classes, the monthly adjustments tend to be increases, averaging +0.5% for residential customers and +0.7% for commercial customers. About 90% of residential adjustments are between -2% and +3%, while about 90% of commercial adjustments fall in the wider range of -4% to 3%.
Figure 5 summarizes the distribution of 86 residential and 53 commercial rate adjustments for electric utilities that adjust rates annually. Again, surcharges outnumber refunds, averaging +0.5% for residential customers and +0.2% for commercial customers; and commercial rate adjustments have a slightly wider dispersion.
A. Gilleo, M. Kushler, M. Molina, and D. York, Valuing Efficiency: A Review of Lost Revenue Adjustment Mechanisms, for the American Council for an Energy-Efficient Economy, Report U1503, June 2015.
22 P.A. Morgan, Decade of Decoupling for US Energy Utilities: Rate Impacts Designs, and Observations, Graceful
Systems LLC, February 2013.
Christensen Associates Energy Consulting, LLC 22 S/25/2016

Attachment A
Figure 4Distribution of Monthly Electric Decoupling Rate Changes23
70IS)
€| 60
Vi4r so<0)
% 40 eeM| 30
20
Z io01aI o
Refunds
n
n:
Surcharges
Over *-S% to-4% to -396 to-2% to-1% to 0%to l%to 2% to 3% to 4% to Over 5% -4% -3% -2% -196 0% 1% 2% 3% 4% 5% 5%
□ Residential □ Commercial
Figure 5Distribution of Annual Electric Decoupling Rate Changes24
23 Id., p. 10.
24 Id., p. 11.
Christensen Associates Energy Consulting, LLC 23 5/25/2016

Attachment A
Some of the experiences of individual states are as follows.
California
The California Public Utilities Commission (CPUC) established Electric Revenue Adjustment Mechanisms for its three major electric investor-owned utilities (Pacific Gas & Electric, Southern California Edison, and San Diego Gas & Electric) by 1982. These mechanisms reconciled billed revenues to authorized revenues to "eliminate any disincentives... [the utility] may have to promote vigorous conservation measures and also be fair to ratepayers in assuring that... [the utility] receives no more or no less than the level of revenues intended to be earned."25 These mechanisms were suspended by the CPUC in 1996 with the implementation
of California's electric restructuring.
In the wake of the western power crisis of 2001, Assembly Bill 29 sought to reduce energy usage in part by mandating reintroduction of revenue regulation.26 Beginning in 2004, the
CPUC has implemented this requirement through a process that determines a separate authorized revenue requirement for each functional operating area through a General Rate Case every three years. The determination excludes electric transmission revenue requirements regulated by the Federal Energy Regulatory Commission (FERC), uses a future test year, and has not involved any explicit reduction of ROE. Revenue adjustments are made first through a stair-step method that makes revenue requirement adjustments that are predetermined during a general rate case, and second through additional adjustments for "exogenous" changes in revenue requirements.
Marylandi
Baltimore Gas and Electric and Potomac Electric Power have revenue regulation mechanisms that are intended eliminate utility disincentives for conservation and demand response. These mechanisms compare actual and authorized distribution revenues, adjusted for numbers of customers, for each applicable rate schedule. Reconciliations occur monthly. Differences between actual and authorized revenues are divided by the forecasted sales for the following period to calculate the monthly rate adjustment. Balancing accounts carry adjustments between the times that they are calculated and the times they are billed or refunded. Monthly rate adjustments are limited to 10%, and any excesses are carried forward to future periods. ROEs have been reduced by 50 basis points to reflect the supposed risk reduction due to revenue regulation.
25 California Public Utilities Commission, Decision 93887, December 30,1981.
26 Assembly Bill 29, Ch. 8, 2001 Cal. Stat. http://www.lefiinfo.ca.gov/pub/01-02/bill/asm/ab 0001-
0050/abxl 29 bill 20010412 chaptered.pdf. This became Public Utilities Code section 739.10.
Christensen Associates Energy Consulting, LLC 24 5/25/2016

Attachment A
Maine
Central Maine Power Company's Alternative Rate Plan (ARP) has been approved for four multiyear cycles since 1996. In 2013, the utility asked to revise ARP so that it includes a revenue decoupling mechanism. The Maine Public Utilities Commission staff recommended rejection of the ARP proposal and the revenue decoupling mechanism, and further recommended returning the utility to traditional cost-of-service regulation due to the alleged failure of previous ARPs to meet the key objectives of rate predictability and stability, reduced administrative burden, and adequate incentives for system reliability investments. Aside from Commission staff, all intervenors endorsed the revenue decoupling mechanism with modifications. Separate revenue targets apply to two classes - residential and commercial/industrial - with annual reconciliations for under-recovery limited to 2% revenue increases for each class, with amounts exceeding the cap deferred for recovery in subsequent years, and with unlimited annual reconciliations for over-recovery.
5.1.4. Lost Revenue Adjustment Mechanisms
LRAMs are similar to revenue decoupling in their intention of making utilities indifferent to sales lost due to conservation and, in some instances, distributed generation. To the extent that a utility's fixed costs are recovered through rates dependent upon usage, conservation impinges upon the utilit/s ability to recover its fixed costs. LRAMs enable utilities to recover the fixed costs that would otherwise be lost due to conservation, thus removing some important incentives for the utility to oppose alternatives to utility generation.
Each general rate case includes utility sales forecasts that account for conservation to the extent that it has already occurred, but not necessarily for additional conservation that might occur in the future. LRAMs adjust rates between rate cases to account for the impacts on utility sales of the conservation that was not considered in developing the general rate case forecasts.
The need for lost revenue adjustments arises from the infrequency of rate cases. On the one hand, frequent rate cases mitigate the need for such adjustments. On the other hand, the use of an LRAM reduces the need for frequent rate cases.
Quantifying Lost Revenues
LRAMs' lost revenues are calculated by multiplying the sales lost due to conservation (in kWh) by base rates (in dollars per kWh). Base rates are used because of the need to exclude from the adjustment a variety of non-base rate revenues, such as fuel cost adjustments. LRAM dollars are not additional costs of efficiency programs, but are instead a means of collecting already authorized utility system fixed costs and of thus bringing the utility back in line with its revenue requirement.
Quantifying the sales lost due to conservation is problematic and controversial. Sales are affected by a multiplicity of factors, including weather and economic conditions. Thus, at the outset of an LRAM program, there needs to be agreement among stakeholders upon the methods by which the sales lost due to conservation will be measured. Such methods rely upon a combination of sampling, statistical analysis, and estimation of customer loads, and
Christensen Associates Energy Consulting, LLC 25 5/25/2016

Attachment A
sometimes upon engineering estimates of the energy savings associated with particular energy efficiency investments.27 In addition, LRAMs may need to incorporate true-up mechanisms that
allow for delays in the measurement of lost sales. These methods for measuring lost sales should be transparent and verifiable. Although such measurement could, in principle, be identical to whatever methods the states already use to evaluate the benefits and costs of conservation programs, existing evaluation methods generally face greater scrutiny when they are applied to the new purpose of determining lost revenue adjustments.28
Gilleo et al found that some states exercise little regulatory oversight of evaluation methods or results. Although this speeds the regulatory process, it may reduce the accuracy of the estimated savings. An appropriate evaluation process would include stakeholders in discussions of evaluation methods, set clear evaluation and reporting guidelines for utilities, and include independent evaluators. Smart meters and faster computing technologies may facilitate the evaluation process through better gathering and analysis of data.
Lost revenue calculations can be designed in a number of different ways. Some states make separate LRAM calculations for each rate class. While all states consider revenue losses due to reduced electrical energy consumption, only some states also consider revenue losses due to peak demand reductions.
Extent of State Adoption of LRAM
Figure 6 shows that twenty states have adopted some form of LRAMs for electric utilities. Table 4 summarizes the years in which these states adopted these LRAMs. On average, states adopted LRAMs in 2010, and so have an average of just over five years' experience.
Engineering estimates have dubious reliability. For example, M. Fowlie, M. Greenstone, and C. Wolfram, Do Energy Efficiency Investments Deliver? Evidence from the Weatherization Assistance Program, June 2015 reports the results of an experimental evaluation of the nation's largest residential energy efficiency program conducted in Michigan on a sample of 30,000 households. It finds that "upfront investment costs are about twice the actual [value of] energy savings," that "model-projected savings are roughly 2.5 times the actual savings," and that even "when accounting for the broader societal benefits of energy efficiency investments, the costs still substantially
outweigh the benefits; the average rate of return is approximately -9.5% annually." In a widely cited study, J.A. Dubin, A.K. Miedema, and R.V. Chandran, "Price effects of energy-efficient technologies: A study of residential demand for heating and cooling," The RAND Journal of Economics, 17(3), pp. 310-325, 1986 exploit a small field experiment conducted by a Florida utility in which efficiency improvements were randomly assigned. They find that consumers with improved insulation and more efficient heating equipment conserve 8-13% less energy than would be predicted from engineering models. More recently, L.W. Davis, A. Fuchs, and P. Gertler, "Cash for Coolers: Evaluating a Large-Scale Appliance Replacement Program in Mexico," American Economic Journal: Economic Policy, Vol. 4, No. 4, November 2014, pp. 207-38 use quasi-experimental variation to measure ex post realized energy savings for an appliance replacement program in Mexico. They find upgrading the efficiency of air
conditioners actually increased energy consumption, which they interpret as a large rebound effect.
28 Gilleo et al, op. cit, surveyed key participants in the regulatory process of setting electric utilities' LRAMs, and
found that some consumer advocates are wary of savings estimates, saying that it was impossible to judge whether savings were actually achieved. They also found regulatory staff who were concerned about the lengthy
back-and-forth exchanges between utilities and regulatory staff that are required to change evaluation methodologies.
Christensen Associates Energy Consulting, LLC 26 5/25/2016

Attachment A
Figure 6Jurisdictions with Lost Revenue Adjustment Mechanisms for Electric Utilities29
Table 4Timing of State Adoption of LRAMs29 30
State Year
AL 2010AZ 2012AR 2010CO 2014CT 2013
State Year
OH 2007OK 2009SC 2009SD 2010WY 2007
State YearMS 2013MT 2005NC 2009NM 2010NV 2010
State Year
IN 2013KS 2011KY 2006LA 2013
MO 2012
Some states that had adopted LRAMs have since replaced them with revenue decoupling mechanisms. For example, Hawaii terminated its LRAM in 2010 in favor of revenue decoupling; and Minnesota, having adopted LRAMs for its electric utilities in the 1990s, recently approved a revenue decoupling mechanism for Xcel.
29 Gilleo etal, op. cit.
30 Id.
Christensen Associates Energy Consulting, LLC 27 5/25/2016

Attachment A
Costs and Effectiveness ofLRAM Programs
A recent study of LRAMs by Gilleo et al gathered data for 32 utilities in 17 states covering program expenditures, annual savings, and eligible LRAM dollars in years 2012 and 2013, with a few results from 2011 and 2014. Figure 7 summarizes utilities' LRAM cost recovery per kWh of annual energy saved through electricity efficiency programs. Cost recoveries ranged from $0.02 to $0.13 per kWh, with a median value of $0.05 per kWh.
Figure 7LRAM Dollars Recovered per kWh of Electricity Energy Efficiency Savings31
Gilleo et al also calculated lost revenue recovery as a percentage of energy efficiency program expenditures. As Figure 8 shows, there is wide range of outcomes. While the median recovery was 25% of annual program costs, the entire range was from 1% (for a very small energy efficiency program) up to 70%. 31
31 Id., Figure 4, p. 9.
Christensen Associates Energy Consulting, LLC 28 5/25/2016
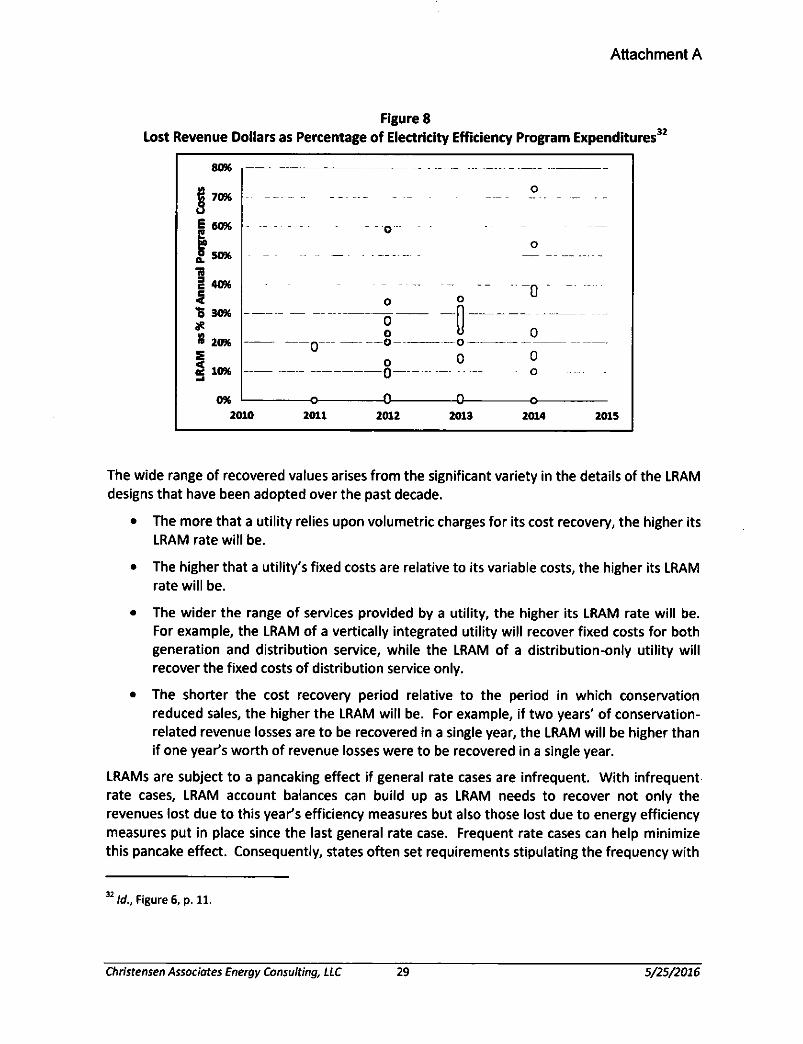
Attachment A
Figure 8Lost Revenue Doilars as Percentage of Electricity Efficiency Program Expenditures32
The wide range of recovered values arises from the significant variety in the details of the LRAM designs that have been adopted over the past decade.
• The more that a utility relies upon volumetric charges for its cost recovery, the higher its LRAM rate will be.
• The higher that a utility's fixed costs are relative to its variable costs, the higher its LRAM rate will be.
• The wider the range of services provided by a utility, the higher its LRAM rate will be. For example, the LRAM of a vertically integrated utility will recover fixed costs for both generation and distribution service, while the LRAM of a distribution-only utility will recover the fixed costs of distribution service only.
• The shorter the cost recovery period relative to the period in which conservation reduced sales, the higher the LRAM will be. For example, if two years' of conservation- related revenue losses are to be recovered in a single year, the LRAM will be higher than if one year's worth of revenue losses were to be recovered in a single year.
LRAMs are subject to a pancaking effect if general rate cases are infrequent. With infrequent rate cases, LRAM account balances can build up as LRAM needs to recover not only the revenues lost due to this year's efficiency measures but also those lost due to energy efficiency measures put in place since the last general rate case. Frequent rate cases can help minimize this pancake effect. Consequently, states often set requirements stipulating the frequency with 32
32 Id., Figure 6, p. 11.
Christensen Associates Energy Consulting, LLC 29 5/25/2016

Attachment A
which utilities must come in for rate cases and reset lost revenues. Figure 9 shows the lengths of time that utilities typically collect lost revenues associated with a particular program year before they must reset lost revenues in a general rate case. Most states limit recovery to between one and three years, while six states allow lost revenue recovery for indefinite periods of time until the next general rate case. One state apparently allows its utilities to recover lost revenue over the full life of an efficiency measure, regardless of rate cases.
Figure 9LRAM Recovery Time for a Single Program Year Before Reset33
Num
ber o
f Sta
tes
.......... — • - - - ------------------------- - — ----------
—
w-
1 Year 2 Years 3 Years Rate Case Measured Life
Typical Timeline for Recovery
Even in the absence of regulatory limits, however, utilities tend to seek relief in general rate cases every two to three years. Apparently, the rejection of LRAM policy in Minnesota was partly due to its utilities not seeking such rate relief.
Gilleo et al attempted to determine whether electric utility LRAMs are associated with greater energy efficiency savings. They found no clear pattern when comparing efficiency budgets between states with and without LRAM policies. Although states with LRAMs have a larger dispersion of budgets, the median budgets in states with and without LRAM, at 0.95% and 0.85% of revenues, respectively, were about the same in 2013. Gilleo et al did find, however, that states with LRAM have higher median electricity savings than those without LRAM, with the savings being 0.55% and 0.30% of loads, respectively, in 2013. It therefore appears that LRAMs induce greater energy efficiency savings for similar relative budget levels. Figure 10 summarizes this comparison.
33 Id., Figure 8, p. 13,
Christensen Associates Energy Consulting, LLC 30 5/25/2016

Attachment A
Figure 102013 Electricity Savings as a Percentage of Sales34
a*#v>to(AM1X£
V
a(OHeN
1.6
1.4
1.2
1
0^
0.6
0.4
0.2
0
O
o
o----o----------
o- o---------
----o----------o
o—0--------------
o-o-----------
O States with No IRANI or Decoupling
------- 0---------------------------------o
— 0 - --------- ---------------e
- -o- - - - - -----e
------0-----------------------------
------o-------------------------
estates with LRAM
In summary, LRAMs do not seem to be associated with higher levels of energy efficiency effort as measured by program spending, but they do appear to be associated with greater achievement as measured by energy savings than is found in states without an LRAM policy.
Benefits and Shortcomings of LRAMs
LRAMs have the following benefit:
• They help make utilities indifferent to sales lost due to conservation, thus removing a disincentive to utility promotion of energy efficiency and reducing the need for frequent
rate cases.
• They appear to be associated with higher energy savings.
On the other hand, LRAMs also have the following shortcomings:
• They require controversial estimates of sales lost due to conservation.
• There is a significant risk of over-estimating efficiency gains, thus over-compensating utilities and over-charging customers.
• They can make utilities indifferent to sales lost due to poor service.
34 Id., Figure 10, p. 15.
Christensen Associates Energy Consulting, LLC 31 S/25/2016

Attachment A
• They do little to actually encourage conservation. Indeed, a utility may be able to profitably increase some electricity sales while providing energy efficiency programs subject to LRAM.
• They do not appear to be associated with higher levels of energy efficiency program spending.
• The regulatory burden can be significant.
To mitigate these problems, it is advisable for regulators to closely monitor the outcomes of the LRAMs, and particularly to reset rates frequently to reflect updated electricity sales and cost forecasts. Furthermore, some states continue to seek simpler and fairer ways to implement their LRAMs. Alternatively, states can pursue energy efficiency through performance incentives tied to specific energy saving levels, and can use revenue decoupling to offset energy efficiency's adverse impacts on utility revenues.
State Experience35
Nevada
Stakeholders have identified a variety of problems with Nevada's LRAM.
• Demand-side program evaluation, measurement, and verification procedures are controversial in terms of both inputs and methodology, and sometimes yield controversial estimates of energy savings.
• Utilities and commission staff have substantially increased their staffing and expenditures on program EV&M.
• The timing of rate cases and demand-side management cases needs improvement. In particular, there are inconsistencies between rate years and demand-side program
years.
• True-up procedures are complex as they are based upon two proceedings, one on demand-side management portfolios and the other on lost sales and rates. Furthermore, true-ups for one year are spread over three or more years.
• As utilities' demand-side programs evolve, there are questions about the types of demand-side programs that should be eligible for lost revenue recovery.
In 2014, the commission began an investigation into the state's LRAM, and received a universal complaint that the current LRAM is overly complex. In 2015, the commission issued a notice of its intent36 to develop a new mechanism that provides utilities with a return on their demand-
32 This section generally relies upon Gilleo et al, op. cit
36 Docket 14-10018.
Christensen Associates Energy Consulting, LLC 32 5/25/2016

Attachment A
side program costs, though there is controversy over the commission's authority to proceed without new legislation.
Oklahoma
Oklahoma's LRAM programs have had problems with the calculations of the energy savings from demand-side programs.
• Some utilities have measured energy savings according to gross savings, while others used net savings.37 In 2014, the commission resolved this inconsistency by requiring all
utilities to use net energy savings as the basis for calculating lost revenues.
• Initially, utilities verified their own energy savings estimates, a process with an inherent conflict of interest. The commission now requires utilities to have energy savings verified by independent contractors, which some stakeholders believe still has a conflict of interest problem because the contractors are hired by the utilities.
• There are questions about the extent to which energy savings estimates include conservation that would have occurred without utilities' demand-side programs.
• There are questions about the extent to which energy savings are double-credited to multiple demand-side programs.
Dealing with these issues has required additional commission staff.
In addition, utilities' reports on energy savings and lost revenues have sometimes been inconsistent with one another and have sometimes not been publicly available. Even when utilities' energy savings estimates have been available, stakeholders have sometimes been surprised by higher-than-expected lost revenue requests. The commission has addressed these problems by requiring utilities' evaluation, measurement, and verification filings to include the data underlying the lost revenue and performance incentive calculations.
Indiana
Indiana has had LRAM since 1995, though energy efficiency programs have grown substantially only since 2009. Energy savings are defined as being net of savings that would have occurred without the programs. The programs are evaluated by independent third parties who are sometimes chosen by each utility and sometimes chosen by committees with utility, consumer, and other stakeholder representatives. The evaluations are used to determine lost revenues and performance incentives.
LRAMs are contentious because the recent growth in Indiana's energy efficiency programs has caused a large increase in lost revenues being recovered by utilities. Because Indiana has no
Gross savings are the changes in energy consumption and/or demand that result from an energy efficiency
program, regardless of why consumers participated or changed consumption. Net savings include only the changes in energy consumption and/or demand that are specifically attributable to an energy efficiency program.
Christensen Associates Energy Consulting, LLC 33 5/25/2016

Attachment A
dollar limit or time limit on lost revenue recovery; pancaking of lost revenues adds to amount of money subject to recovery; with the total lost revenue recovery for some programs threatening to exceed program costs. Indiana has experienced contention over the measurement of energy savings and lost revenues, inconsistencies among utilities' measurement methods, the timeliness of utilities' data submissions, and the difficulties of tracking lost revenues that are recovered over multiple years.
Because of the foregoing problems, major changes have been proposed for Indiana's energy efficiency programs and LRAMs. Some parties, including Vectren in 2011, have sought to replace LRAM with decoupling; but thus far, the commission has rejected this alternative.38 In
2014, Senate Bill 340 limited and in some cases prohibited the commission's energy efficiency savings targets, so that future projected savings are projected to be roughly half of what they had been in recent years.
5.1.5. Multi-Year Rate Plans
Multi-year rate plans allow full true-ups to the utility's actual cost of service once every three to five years, with automatic rate adjustments occurring in the interim. These adjustments generally use external factors beyond the utility's control, like fuel prices, to reflect changing business conditions. The adjustments thus reflect changes in the utility's business environment rather than changes in the utility's actual revenues or costs. This use of external factors gives the utility incentives to cut costs and improve performance during the multi-year period, after which the benefits of better performance are shared with customers.39
Multi-year rate plans are established during general rate case proceedings, and establish future rate changes according to future conditions that are forecast during these proceedings. With the occasional exception of indexation to external cost factors as described below, multi-year rate plans do not adjust rates in response to the future conditions that actually occur. General rate case filings are generally prohibited during the term of the multi-year plan.
38 Indiana Utility Regulatory Commission, Final Order in Petition of Southern Indiana Gas and Blectric Company
d/b/a Vectren Energy Delivery of Indiana, Inc ("Petitioner") for Approval of and Authority for (1) An Increase in its Rates and Charges for Electric Utility Service Including a Second Step That Will Include the Revenue Requirement for Its Dense Pack Projects; (2) New Schedules of Rates and Charges Applicable Thereto; (3) The Sharing of Wholesale Power Margins Between Petitioner and Its Electric Customers; (4) A Sales Reconciliation To Decouple Fixed Cost Recovery From the Amount of Customer Usage for Certain Rate Classes; (S) A Demand Side Management Program Which Will Include a Mechanism for the Timely Recovery of Costs Relating Thereto and Performance Incentives Based On Achieved Savings; (6) An Alternative Regulatory Plan Allowing Petitioner To Retain Its Share of Wholesale Power Margins and Demand Side Management Performance Incentives; and (7) Approval of Various Changes To Its Tariff for Electric Service Including New Net Metering, Alternate Feed Service, Temporary Service, and Standby or Auxiliary Service Riders, Revisions To Its Existing MISO Cost and Revenue Adjustment (Including the Addition of a Component to Track Variable Production Costs) and Revisions To Its General Terms and Conditions for Service, Cause No. 43839, April 27, 2011.
39 Pacific Economics Group Research, Alternative Regulation for Evolving Utility Challenges: An Updated Survey, prepared for the Edison Electric Institute, January 2013, p. 35.
Christensen Associates Energy Consulting, LLC 34 5/25/2016

Attachment A
Multi-year rate plans can be accompanied by elements of other alternative ratemaking mechanisms. For example, they can include earnings-sharing components that limit the extent to which the utility's actual ROE can deviate from its authorized ROE, which would reduce the incentives for cost-cutting and performance improvement. In addition, there can be trackers for some specific cost categories, as well as performance-based awards or penalties that provide incentives for certain behavior or outcomes, like highly reliable power service.
Some multi-year rate plans specify the maximum dollar amounts of each year's allowable revenue changes, while others use formulas to determine maximum allowable changes. Multiyear rate plans may involve use of a "stairstep" approach to rate increases, allowing prespecified percentage rate increases in each year of the plan; while other plans may involve some form of indexation of rate increases to forecast or actual values of external cost factors. Other plans freeze rates at an agreed-upon level between rate cases.
Multi-year rate plans differ from FRPs. While a multi-year rate plan escalates rates over time according to assumptions about the rates of escalation of specified utility costs, an FRP adjusts rates to meet banded ROE targets, perhaps adjusted according to measures of performance such as customer satisfaction and local distribution system reliability. Multi-year rate plans thus focus on the utility's costs, while FRPs focus on ROEs.
Figure 3 identifies the states where multi-year plans are applied using a variety of approaches including stairstep, indexation, combinations of stairstep and indexation, and rate freezes. Rate freezes are the most common form of multi-year plan, with the stairstep approach coming in second. Only two states use indexation, which means that only two states have multi-year rate plans that adjust rates to reflect actual business conditions. The scant use of indexation is due to the relative complexity of the indexation approach, which generally requires agreement on the external factors to which prices will be indexed, on the determination and quantification of a productivity offset factor, and on the other factors (e.g., major plant additions, storm recovery costs) that will automatically change rates during the plan period.
Christensen Associates Energy Consulting, LLC 35 5/25/2016
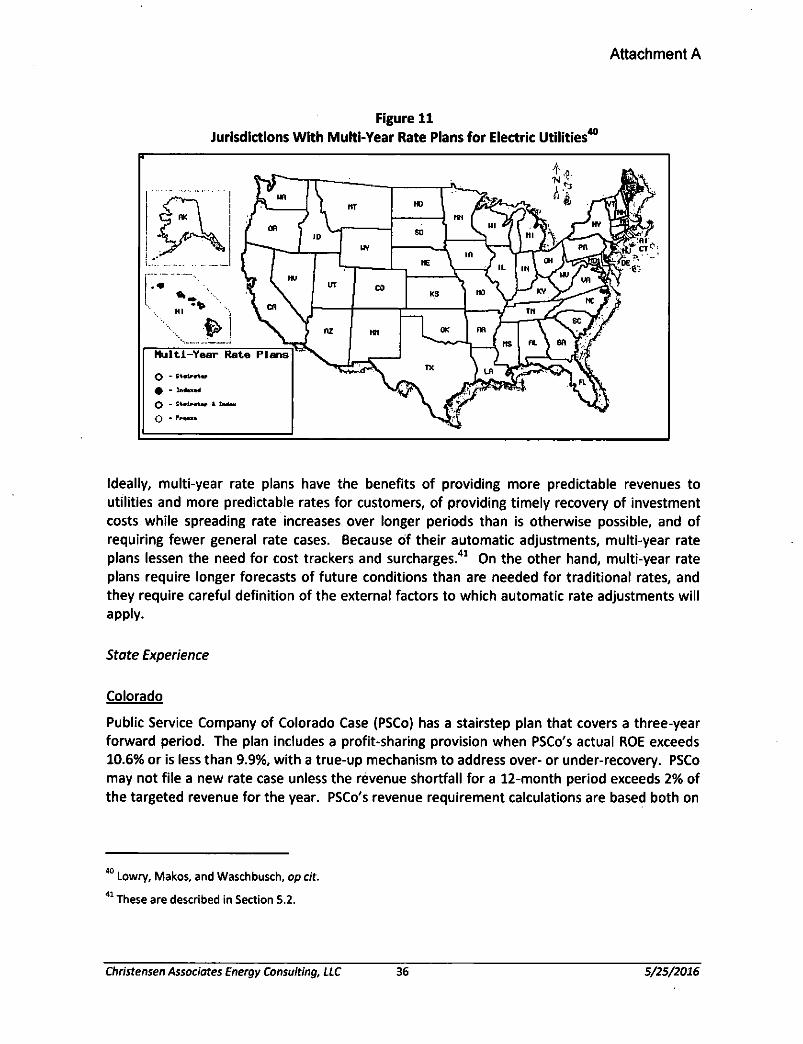
Attachment A
Figure 11Jurisdictions With Multi-Year Rate Plans for Electric Utilities40
Ideally, multi-year rate plans have the benefits of providing more predictable revenues to utilities and more predictable rates for customers, of providing timely recovery of investment costs while spreading rate increases over longer periods than is otherwise possible, and of requiring fewer general rate cases. Because of their automatic adjustments, multi-year rate plans lessen the need for cost trackers and surcharges.40 41 On the other hand, multi-year rate
plans require longer forecasts of future conditions than are needed for traditional rates, and they require careful definition of the external factors to which automatic rate adjustments will apply.
State Experience
Colorado
Public Service Company of Colorado Case (PSCo) has a stairstep plan that covers a three-year forward period. The plan includes a profit-sharing provision when PSCo's actual ROE exceeds 10.6% or is less than 9.9%, with a true-up mechanism to address over- or under-recovery. PSCo may not file a new rate case unless the revenue shortfall for a 12-month period exceeds 2% of the targeted revenue for the year. PSCo's revenue requirement calculations are based both on
40 Lowry, Makes, and Waschbusch, op cit.
41 These are described in Section 5.2.
Christensen Associates Energy Consulting, LLC 36 5/25/2016
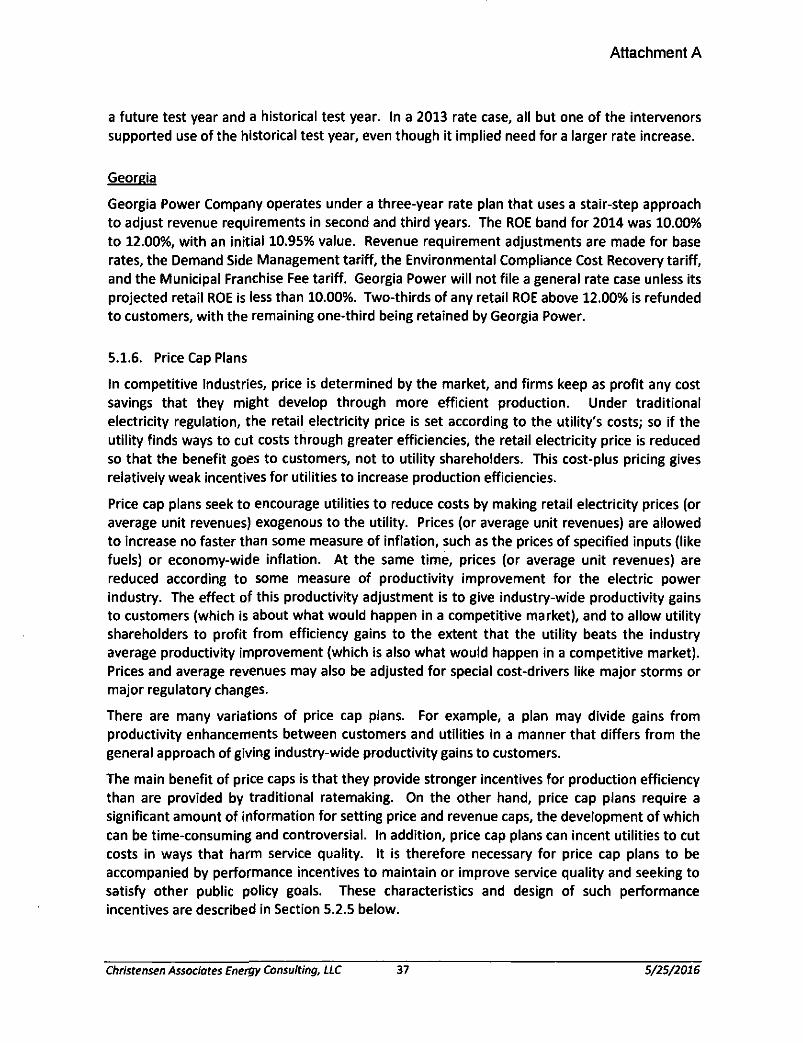
Attachment A
a future test year and a historical test year. In a 2013 rate case, all but one of the intervenors supported use of the historical test year, even though it implied need for a larger rate increase.
Georgia
Georgia Power Company operates under a three-year rate plan that uses a stair-step approach to adjust revenue requirements in second and third years. The ROE band for 2014 was 10.00% to 12.00%, with an initial 10.95% value. Revenue requirement adjustments are made for base rates, the Demand Side Management tariff, the Environmental Compliance Cost Recovery tariff, and the Municipal Franchise Fee tariff. Georgia Power will not file a general rate case unless its projected retail ROE is less than 10.00%. Two-thirds of any retail ROE above 12.00% is refunded to customers, with the remaining one-third being retained by Georgia Power.
5.1.6. Price Cap Plans
In competitive industries, price is determined by the market, and firms keep as profit any cost savings that they might develop through more efficient production. Under traditional electricity regulation, the retail electricity price is set according to the utility's costs; so if the utility finds ways to cut costs through greater efficiencies, the retail electricity price is reduced so that the benefit goes to customers, not to utility shareholders. This cost-plus pricing gives relatively weak incentives for utilities to increase production efficiencies.
Price cap plans seek to encourage utilities to reduce costs by making retail electricity prices (or average unit revenues) exogenous to the utility. Prices (or average unit revenues) are allowed to increase no faster than some measure of inflation, such as the prices of specified inputs (like fuels) or economy-wide inflation. At the same time, prices (or average unit revenues) are reduced according to some measure of productivity improvement for the electric power industry. The effect of this productivity adjustment is to give industry-wide productivity gains to customers (which is about what would happen in a competitive market), and to allow utility shareholders to profit from efficiency gains to the extent that the utility beats the industry average productivity improvement (which is also what would happen in a competitive market). Prices and average revenues may also be adjusted for special cost-drivers like major storms or major regulatory changes.
There are many variations of price cap plans. For example, a plan may divide gains from productivity enhancements between customers and utilities in a manner that differs from the general approach of giving industry-wide productivity gains to customers.
The main benefit of price caps is that they provide stronger incentives for production efficiency than are provided by traditional ratemaking. On the other hand, price cap plans require a significant amount of information for setting price and revenue caps, the development of which can be time-consuming and controversial. In addition, price cap plans can incent utilities to cut costs in ways that harm service quality. It is therefore necessary for price cap plans to be accompanied by performance incentives to maintain or improve service quality and seeking to satisfy other public policy goals. These characteristics and design of such performance incentives are described in Section 5.2.5 below.
Christensen Associates Energy Consulting, LLC 37 5/25/2016

Attachment A
We are not aware of any U.S. electric utilities that have adopted price or revenue caps in more than the narrow sense of indexing some costs to inflation. The lack of electricity price or revenue cap plans may be due to the limited opportunities for "regulatory bargains" in the electricity sector and to the limited competition in the T&D components of the sector.42
5.2. Incremental Revisions to Ratemaking Approaches
This section describes incremental revisions in ratemaking methods that could be applied either to traditional cost-of-service ratemaking or to the alternatives just described. These revisions address important details of either the procedures by which rates are set or the manner in which particular categories of costs are recovered from customers.
5.2.1. Future Test Years
The rates and rate designs established in general rate cases depend upon the utility's revenues and costs. The data used to determine these revenues and costs may come from the recent actual experience of an historical test year, or from forecasts applicable to the future test years to which updated rates will apply, or from some combination thereof.
An historical test year is usually a twelve-month period that ends a few months before the rate case filing. There is typically a two-year lag between the historical test year and the first rate year to which updated rates would apply.43 Consequently, although the historical test year
approach has the advantage of using relatively objective data, it has the disadvantage of using stale data that may poorly predict future conditions. To compensate for this disadvantage, historical test year data are often adjusted to make them more relevant to business conditions anticipated for the first rate year, with normalizations for weather or business conditions being common. For example, if the historical test year had an unusually hot summer, load data could be adjusted to reflect normal summer weather conditions. As another example, known changes in union labor rates could be used to adjust historical test year data.
A future test year is usually the first twelve-month period to which new rates would apply, and usually begins after the general rate case is complete. The future test year approach has the advantage of using data that are appropriate for the period to which the data will apply, but has the disadvantage of being susceptible to bias and error. This disadvantage is compounded by information asymmetries: the utility usually has better information about the future than is available to regulators and other stakeholders, which gives the utility some extra ability to manipulate the ratemaking process.
Some utilities use hybrid test years that are based upon a combination of history and forecasts.
42 D.E.M. Sappington and D. L Weisman, 'The Price Cap Regulation Paradox in the Electricity Sector," The
Electricity Journal, April 2016, 29(3): 1-5.
43 For example, a utility filing for new rates applicable to calendar 2020 might request new rates in April 2019 using
data from calendar 2018; so the rates applicable in 2020 would be based upon business conditions in 2018.
Christensen Associates Energy Consulting, LLC 38 5/25/2016
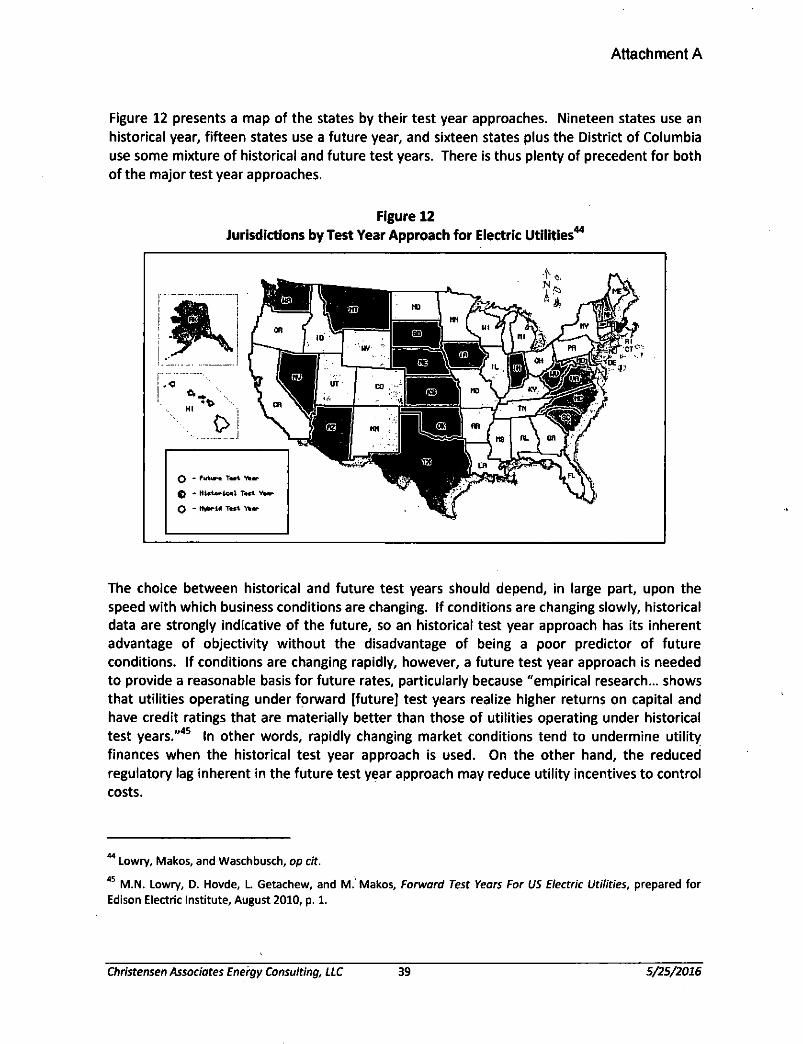
Attachment A
Figure 12 presents a map of the states by their test year approaches. Nineteen states use an historical year, fifteen states use a future year, and sixteen states plus the District of Columbia use some mixture of historical and future test years. There is thus plenty of precedent for both of the major test year approaches.
Figure 12Jurisdictions by Test Year Approach for Electric Utilities44
The choice between historical and future test years should depend, in large part, upon the speed with which business conditions are changing. If conditions are changing slowly, historical data are strongly indicative of the future, so an historical test year approach has its inherent advantage of objectivity without the disadvantage of being a poor predictor of future conditions. If conditions are changing rapidly, however, a future test year approach is needed to provide a reasonable basis for future rates, particularly because "empirical research... shows that utilities operating under forward [future] test years realize higher returns on capital and have credit ratings that are materially better than those of utilities operating under historical test years."44 45 In other words, rapidly changing market conditions tend to undermine utility
finances when the historical test year approach is used. On the other hand, the reduced regulatory lag inherent in the future test year approach may reduce utility incentives to control costs.
44 Lowry, Makos, and Waschbusch, op cit.
45 M.N. Lowry, D. Hovde, L. Getachew, and M. Makos, Forward Test Years For US Electric Utilities, prepared for
Edison Electric Institute, August 2010, p. 1.
Christensen Associates Energy Consulting, LLC 39 S/2S/2016

Attachment A
5.2.2. Earnings Sharing Mechanisms
Earnings sharing mechanisms allow rate adjustments outside of general rate case proceedings when actual ROEs would otherwise fall outside of specified bands around the authorized ROE. No rate adjustment is made when actual ROEs fall within the band; and rates are adjusted to share between customers and shareholders the excess or deficient earnings outside of the band. There is often a second set of outer bands beyond which customers get all excess earnings or pay for all earnings shortfalls. The bands allow utilities to enjoy for a period of time some of the efficiencies that they create, and eventually pass substantial shares of such efficiencies to customers.
Earnings sharing mechanisms help hold down procedural costs of assuring that utilities' actual ROEs do not stray far from targets due to the operation of automatic rate change mechanisms or to changing business conditions. They are a type of FRP that focuses on earnings rather than on specific costs or revenues. As such, it shares the aforementioned benefits and shortcomings of FRPs. Its focus on earnings has the benefit of avoiding the need to track specific costs and revenues, and the shortcoming of overlooking special cost and revenue developments that might arguably warrant special treatment.
5.2.3. Cost Trackers
Cost trackers allow utilities to recover specific costs from customers outside of general rate cases. The recoverable costs may be zero-based (so that the cost adjustment equals the whole amount of the cost) or may be relative to a baseline cost included in the general rate case (so that the cost adjustment equals the actual cost minus the baseline amount). Utilities recover these costs based upon some formula or predefined rule.
In principle, cost trackers should be used only for those items of cost that are substantial, unpredictable, volatile, recurring, or beyond utility control. Such items arguably include the following:46
• Fuel costs, due to significant fluctuations in fuel commodity prices;
• Capital costs;
• Transmission costs, for firms paying wholesale transmission charges;
• Distribution costs, to reflect changes in the costs of owning or maintaining distribution plant;
• Storm fund costs;
• Environmental compliance costs, which can change suddenly with changes in law or regulation;
46 The following lists are partly drawn from C. Harder, Alternatives to Traditional Rate Processes, presentation,
CenterPoint Energy, Inc., 2013 and J.W. Rogers, The Two Sides of Cost Trackers: Why Regulators Must Consider Both, NRRI Teleseminar, October 27,2009.
Christensen Associates Energy Consulting, LLC 40 S/25/2016

Attachment A
• Tax costs, due to changes in tax rates or tax codes; and
• Bad debt, because the percentage of uncollectible receivables can suddenly rise during recessions.
Nonetheless, the use of cost trackers has greatly expanded to include items that may fail the test of being substantial, unpredictable, volatile, recurring, or beyond utility control. These additional cost trackers include the following:
• Basic service administrative cost adjustment;
• Cumulative capital tracker;
• Forward capital tracker;
• Inflation adjustment;
• Pension and other post-retirement benefits;
• Attorney General rate case consultant cost;
• System inspection costs;
• Plant reclassification adjustment mechanism;
• Net metering charge, to recover net revenue losses due to net metering;
• Energy efficiency charge, to recover the costs of funding energy efficiency programs;
• Solar investment charge; and
• Smart grid charge, to recover costs of smart grid investments.
Figure 13 presents a map of jurisdictions with one type of cost tracker, namely that for capital costs. The figure shows that most states have this type of cost tracker. Similar maps would show that other types of cost trackers are widespread (as is the case for fuel adjustment clauses) while others are not.
Christensen Associates Energy Consulting, LLC 41 5/25/2016
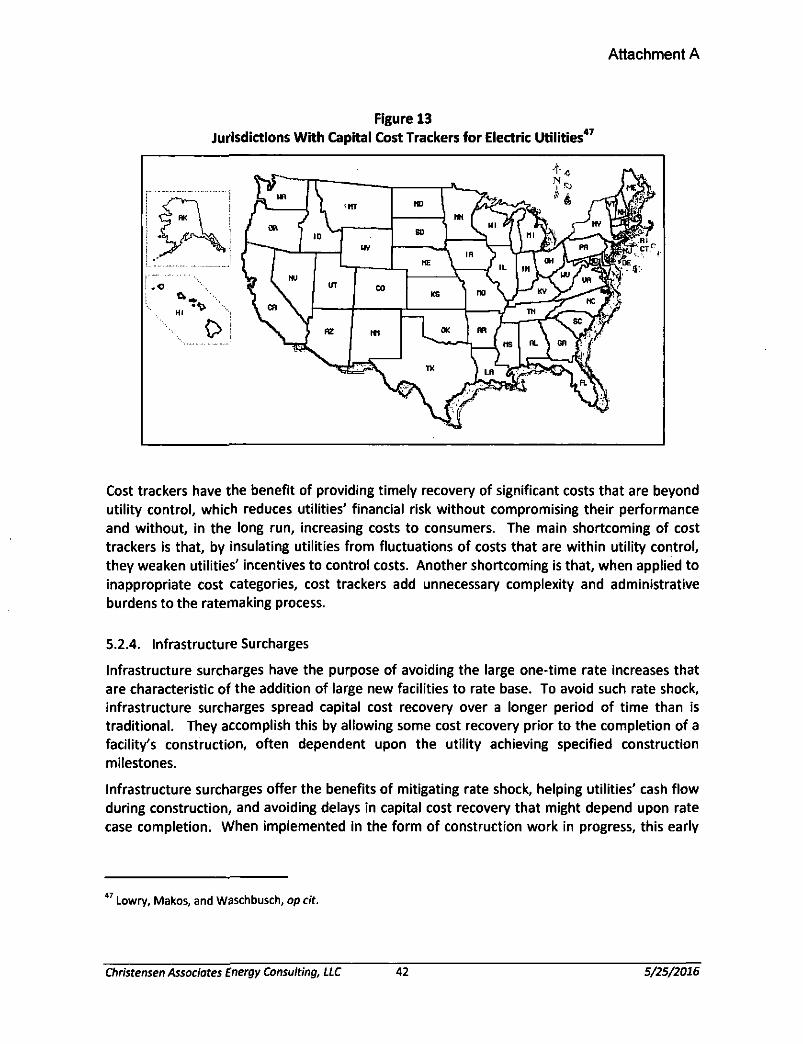
Attachment A
Figure 13Jurisdictions With Capital Cost Trackers for Electric Utilities47
Cost trackers have the benefit of providing timely recovery of significant costs that are beyond utility control, which reduces utilities' financial risk without compromising their performance and without, in the long run, increasing costs to consumers. The main shortcoming of cost trackers is that, by insulating utilities from fluctuations of costs that are within utility control, they weaken utilities' incentives to control costs. Another shortcoming is that, when applied to inappropriate cost categories, cost trackers add unnecessary complexity and administrative burdens to the ratemaking process.
5.2.4. Infrastructure Surcharges
Infrastructure surcharges have the purpose of avoiding the large one-time rate increases that are characteristic of the addition of large new facilities to rate base. To avoid such rate shock, infrastructure surcharges spread capital cost recovery over a longer period of time than is traditional. They accomplish this by allowing some cost recovery prior to the completion of a facility's construction, often dependent upon the utility achieving specified construction milestones.
Infrastructure surcharges offer the benefits of mitigating rate shock, helping utilities' cash flow during construction, and avoiding delays in capital cost recovery that might depend upon rate case completion. When implemented in the form of construction work in progress, this early 47
47 Lowry, Makos, and Waschbusch, opcit.
Christensen Associates Energy Consulting, LLC 42 5/25/2016

Attachment A
recovery of capital costs may enable the utility to secure project financing at a lower cost than it would otherwise.
On the other hand, infrastructure surcharges can erode utility incentives for capital cost management if they lead to less regulatory scrutiny of those costs, which may occur because capital costs are partially recovered from customers before regulators review these costs. Infrastructure surcharges also have the shortcoming of requiring customers to pay for facilities that are not yet used and useful, which violates the beneficiary pays principle because no benefits can flow from a facility before its construction is complete.
Infrastructure surcharges are band-aids that address the symptom of new facilities' rate shock without addressing the causes of such rate shock. There are two such causes. First, new facilities periodically turn out to be high-cost, sometimes due to capital cost overruns or poor management, sometimes due to the misfortune of the facilities entering service during a period of recession or low fuel prices. This first cause is addressed by regulatory proceedings on prudency. Second, one-time rate increases are perennially due to the ubiquitous financing convention of recovering capital costs through levelized nominal dollars rather than levelized real dollars. The effect of this convention is that the inflation-adjusted value of capital cost recovery is always higher in the early years of a facility's life than it is later in the facility's life, with the distortion being greatest during periods of high inflation. Because the convention of levelized nominal capital cost recovery is set by the financial industry, regulators lack the power to overturn it. Infrastructure surcharges are a very imperfect tool for addressing the levelization problem; but that is, at root, the problem that infrastructure charges address.
5.2.5. Performance Incentive Regulation48,49
Performance incentive regulation provides incentives for utilities to maintain or improve service quality. Although such incentives are particularly essential to the implementation of price cap plans, they can also be useful in the context of other broad rate design approaches.
For example, performance incentive regulation can provide rewards or penalties that depend
upon:
• the level of actual customer service outages (such as measured by the frequency, extent, or duration of outages, or more specifically by the system average interruption duration index or the system average interruption frequency index);
• actual employee safety performance (such as measured by lost-time injuries); * 49
43 Some of the ideas in this section are from M. Whited, T. Woolf, and A. Napoleon, Utility Performance Incentive
Mechanisms, prepared for the Western Interstate Energy Board, March 9,2015.
49 "Performance-based rate regulation" is the term generally used to refer to performance incentive regulation
combined with price cap regulation or other alternative ratemaking mechanisms. In this report, we separate performance incentive regulation from other components of performance-based rate regulation because the former can be implemented on its own or in combination with several other alternative ratemaking mechanisms.
Christensen Associates Energy Consulting, LLC 43 5/25/2016

Attachment A
• actual customer service performance (such as measured by complaints or telephone response time); and
• other performance measures (such as measured by average days to interconnect distributed generation).
In each case, the reward or penalty would depend upon actual performance relative to an appropriate benchmark.
Ideally, performance targets should be realistic, flexible, long-term, bounded by deadbands, promising of net benefits, responsive to stakeholder input, and related to policy goals. Performance metrics should be clearly defined, readily quantifiable with reasonably available data, reasonably objective, largely within utility control, easily interpreted, easily verifiable, and related to policy goals. Rewards and penalties should be related to the customer benefits and costs attributable to utility action.
Potential benefits of utility performance incentives include the following:
• They may help make regulatory goals and incentives explicit.
• They may help identify incentives that are well aligned with the public interest and that may help improve performance.
• They may allow regulators to focus on whether desired outcomes are achieved rather than on the costs and means of obtaining those outcomes.
• They may be applied incrementally and flexibly.
On the other hand, utility performance incentives have significant shortcomings:
• They may provide rewards or penalties that are disproportionately large or small relative to customer benefits or associated utility costs.
• They may provide rewards or penalties that inappropriately depend upon factors that are beyond utility control.
• They may depend upon poorly defined metrics.
• They depend upon information that can be controversial and time-consuming to develop, and that are better available to utilities than to regulators and other stakeholders.
• They may focus utility management attention on some aspects of performance to the detriment of focusing on other important aspects of performance.
• They may be subject to gaming and manipulation by utilities.
As the examples provided in earlier sections of this report demonstrate, many states have adopted performance incentives of one type or another. For example, long-standing FRPs in place in Alabama, Mississippi, and Louisiana adjust utilities' authorized ROEs according to how well they meet certain performance targets; and Missouri may soon do so as well. When a utility exceeds its performance targets, its authorized ROE is adjusted upward by a specified number of basis points; and when it falls short of the targets, the ROE is adjusted downward.
Christensen Associates Energy Consulting, LLC 44 5/25/2016

Attachment A
Performance metrics may be measured annually or may be computed as rolling averages over three- to five-year periods.
6. APPLICABILITY OF ALTERNATIVE RATEMAKING MECHANISMS TO TEXAS
We begin with a description of Texas' electric power industry and its present methods for setting electricity rates. We then assess the applicability of alternative ratemaking mechanisms to the Texas electric power industry and recommend a course for ratemaking reform.
6.1. Texas' Electricity Industry and Market Structure
Electrical energy50 51 52 is produced by generators and delivered to consumers through T&D systems.
Since 2002, Texas legislation has required that the service territories of the investor owned T&D systems located in the Electric Reliability Council of Texas (ERCOT), shown in Figure 14, be open to retail competition in the provision of electrical energy, in the hope that such competition would reduce consumers' electricity prices and foster greater customer choice.51,52 Although
municipal and electric cooperative utilities located in the ERCOT region are allowed to open their systems to retail competition in electrical energy services, only one electric cooperative has chosen to do so.
50 For simplicity, the text implies that "electrical energy" is the only service provided by generators, though
generators also provide frequency regulation, operating reserve, voltage control, and black start services, the first two of which are potentially competitive.
51 ERCOT covers about 75% of Texas' land area and serves about 85% of Texas' electricity use. The rest of Texas is
in reliability regions overseen by the Midcontinent Independent System Operator (Entergy's service territory in east Texas), the Southwest Power Pool (Texas' panhandle and northeast corner), and the Western Electricity Coordinating Council (the western-most part of Texas).
52 The Texas legislation creating retail competition was Senate Bill 7, passed in 1999. Its Section 39.001 defines the
purpose of the legislation in generalities about the benefits of competition: "The legislature finds that the
production and sale of electricity is not a monopoly warranting regulation of rates, operations, and services and that the public interest in competitive electric markets requires that, except for transmission and distribution
services and for the recovery of stranded costs, electric services and their prices should be determined by customer choices and the normal forces of competition. As a result, this chapter is enacted to protect the public
interest during the transition to and in the establishment of a fully competitive electric power industry." In signing this law, however. Governor George Bush said "Competition in the electric industry will benefit Texans by reducing rates and offering consumers more choices."
Christensen Associates Energy Consulting, LLC 45 5/25/2016

Attachment A
Figure 14ERGOT Region Map53
Texas has its own unique jargon for the different types of players in its electricity markets. "Retail electric providers" buy wholesale electricity and T&D services, seek retail customers, and set their own retail electricity prices. "Transmission and distribution service providers" are TDUs that own and operate T&D systems, though there are also "transmission service providers" that own and operate only transmission systems and "distribution service providers" that own and operate only distribution systems.
Within ERGOT, the supply and pricing of electrical energy are determined by competitive processes, though competition and prices are affected by Texas' policies regarding renewable energy. Meanwhile, the supply and pricing of wholesale transmission services within Texas as well as investor-owned TDD services are determined through traditional regulatory processes that are under the jurisdiction of the PUCT, with transmission investment decisions somewhat influenced (again) by Texas' renewable energy policies.54 Interstate wholesale transmission
services are under the jurisdiction of FERC.
53 http://www.ercot.com/content/news/mediakit/maps/ercotRegionMap.jpg.
54 Texas is building transmission to serve its Competitive Renewable Energy Zones (CREZ), in which there is
substantial wind power that would be difficult to deliver to consumers without such transmission investment. See
Christensen Associates Energy Consulting, LLC 46 5/25/2016

Attachment A
Table 5 shows that, in 2014, 61% of the Texas electricity market was served by investor-owned TDUs within ERGOT. Another 22% of the Texas electricity market was served by municipal utilities and cooperative utilities within ERGOT. The remaining 15% of Texas load was served by utilities outside of ERGOT.
Table 5Relative Shares of Texas Electrical Energy Deliveries, by Utility, 201455
MWh Shares
ERGOT:
Oncor 114,905,829 29%CenterPoint 82,025,715 21%AEP Central 24,813,888 6%TNMP 9,877,771 3%AEP North 5,476,300 1%Sharyland 2,517,299 1%municipal utilities 46,132,830 12%cooperative utilities 39,339,642 10%Total ERGOT 325,089,274 83%
Non-ERCOT:
investor-owned utilities 45,557,593 12%municipal utilities 2,855,119 1%cooperative utilities 9,154,941 2%Total non-ERCOT 57,567,653 15%
Discrepancy 7,012,893 2%Total Texas 389,669,820 100%
Figure 15 shows the patterns of growth of non-affiliate sales in the ERGOT region and displays the percentage shares of MWh sales for each of the three major customer types. As shown by the solid green line, competing suppliers made half of sales to the large commercial and industrial customers within a few months of the opening of competition, a share that has thereafter grown to nearly 90%. As shown by the dashed red line, it took competing suppliers a couple of years to take half of the small commercial market, a share that has since grown to 55
http://www.puc.texas.gov/industrv/maDs/maps/transmission scenario2dev crez.pdf for one example of a transmission planning response to CREZ power delivery needs.
55 From https://www.puc.texas.gov/industry/electric/reports/RptCard/Default.aspx, Market Share Data.xls; and
U.S. Energy Information Administration, Electricity Data Browser,http://www.eia.gOv/electricity/data/browser/#/topic/57aggs0,l&geo=g407vww3wo&endsec=vg&freq=A&start= 2001&end=2015&ctype=linechart<ype=pin&rtype=s&maptype=0&rse=0&pin=, and EIA 20X4 Form No. 861. The
2% discrepancy arises from inconsistencies between the PUCT and EIA datasets.
Christensen Associates Energy Consulting, LLC 47 5/25/2016
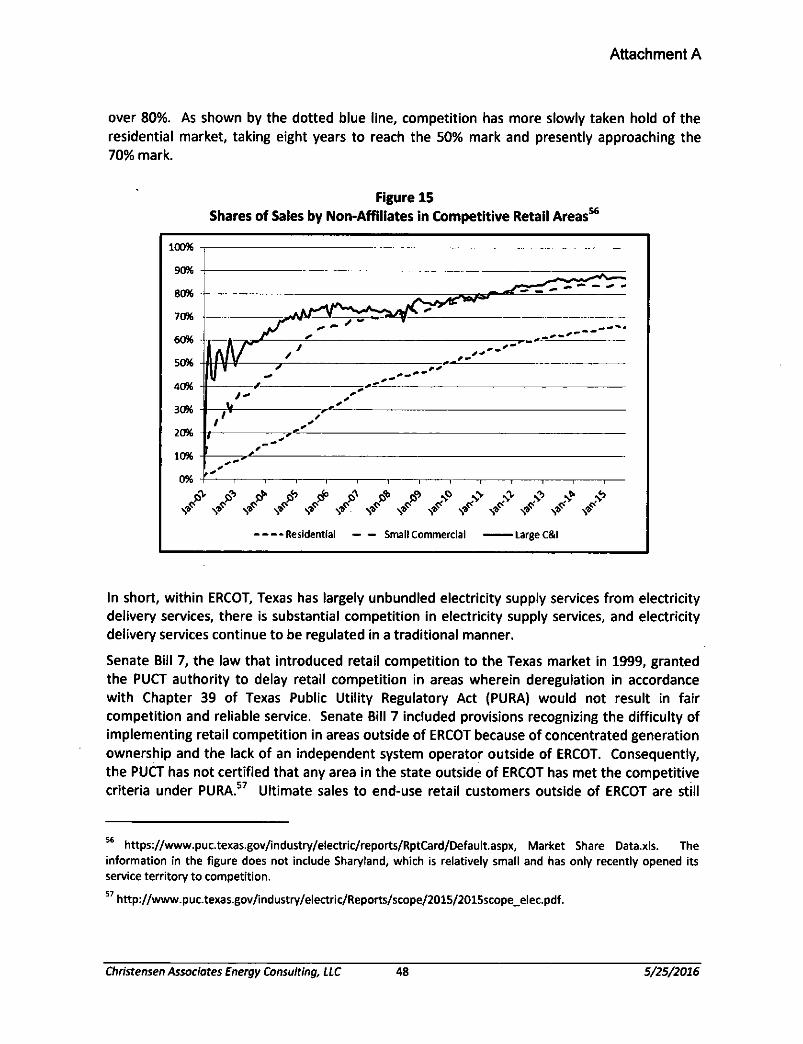
Attachment A
over 80%. As shown by the dotted blue line, competition has more slowly taken hold of the residential market, taking eight years to reach the 50% mark and presently approaching the 70% mark.
Figure 15Shares of Sales by Non-Affiliates in Competitive Retail Areas56
In short, within ERGOT, Texas has largely unbundled electricity supply services from electricity delivery services, there is substantial competition in electricity supply services, and electricity delivery services continue to be regulated in a traditional manner.
Senate Bill 7, the law that introduced retail competition to the Texas market in 1999, granted the PUCT authority to delay retail competition in areas wherein deregulation in accordance with Chapter 39 of Texas Public Utility Regulatory Act (PURA) would not result in fair competition and reliable service. Senate Bill 7 included provisions recognizing the difficulty of implementing retail competition in areas outside of ERGOT because of concentrated generation ownership and the lack of an independent system operator outside of ERGOT. Consequently, the PUCT has not certified that any area in the state outside of ERGOT has met the competitive criteria under PURA.56 57 Ultimate sales to end-use retail customers outside of ERGOT are still
56 https://www.puc.texas.gov/industry/electric/reports/RptCard/Default.aspx, Market Share Data.xls. The
information in the figure does not include Sharyland, which is relatively small and has only recently opened its
service territory to competition.
57 http://www.puc.texas.gov/industry/electric/Reports/scope/2015/2015scope_elec.pdf.
Christensen Associates Energy Consulting, LLC 48 5/25/2016
Attachment A
limited to electric utilities legally certified to provide electric service within each utility service territory.58 Retail rates outside of ERCOT are subject to traditional ratemaking and regulatory
processes under the jurisdiction of the PUCT.
6.2. Present Regulated Electricity Ratemaking Methods In Texas
Electricity ratemaking in Texas is governed by PURA, as amended. PURA Section 36.051 gives each utility "a reasonable opportunity to earn a reasonable return on the utility's invested capital used and useful in providing service to the public in excess of the utility's reasonable and necessary operating expenses."
The ERCOT investor-owned TDUs have very similar tariffs for delivery of electricity to retail consumers. For residential and small non-residential customers, cost recovery is through fixed monthly charges and energy charges.59 Excluding riders, energy charges constitute roughly 80% of both residential and small commercial bills.60 The riders increase these percentages. For
larger non-residential customers, cost recovery is through fixed monthly charges and demand charges, with demand charges accounting for most cost recovery. Because T&D costs are largely fixed, energy usage changes result in revenue changes that are larger than the associated cost changes. The energy usage-related variability in cost recovery is more significant for the smaller customer classes than for the larger customer classes because energy consumption tends to be more variable than peak loads.
6.2.1. Texas' Cost Trackers
To help assure timely cost recovery, the Texas legislature and the PUCT have authorized several cost trackers. The tariffs of ERCOT's TDUs have trackers for the following cost categories:
• Advanced metering system cost riders recover advanced metering deployment costs from customers.
• Energy efficiency cost riders recover the costs of energy efficiency programs not already included in base distribution service rates. These riders allow annual adjustments for each utility's forecasted efficiency program costs, any incentives earned for the prior year, any adjustment for past over- or under-recovery of energy efficiency revenues, and certain other energy efficiency program costs.
• Transmission cost recovery factors (TCRFs) allow investor-owned distribution service providers to recover changes in wholesale transmission charges under tariffs approved
58 http://www.puc.texas.gov/industry/electric/reports/scope/1999/1999scope_elec.pdf.
59 For Texas-New Mexico Power Company, small commercial customers are those with peak loads up to 5 kW. For
the other four utilities, small commercial customers are those with peak loads up to 10 kW.
60 The percentage figures assume that an average residential customer consumes 1,000 kWh per month and that
an average small commercial customer consumes 1,440 kWh per month (i.e., 4 kW at a 50% load factor).
Christensen Associates Energy Consulting, LLC 49 5/25/2016
Attachment A
by the PUCT to the extent that the costs vary from those used to set base rates. TCRFs must be updated twice per year.61
• Interim transmission cost of service adjustments offer a streamlined mechanism that allows electric transmission service providers to update their wholesale transmission rates up to twice per year to allow for recovery of the costs of new transmission investments. The recovery includes updates to returns, depreciation, and taxes, though not for changes any other categories of expense.
• Distribution cost recovery factors (DCRFs) allow utilities to adjust non-fuel rates to reflect changes in certain distribution investment costs, including changes to returns, depreciation, and taxes.62 The PUCT-authorized formula provides an expedited
ratemaking process for a utility to request approval for an adjustment to incorporate changes in the utility's distribution invested capital since its most recent base rate case. Utilities are allowed to use this mechanism once per year; though among ERCOTTDUs, only CenterPoint Energy has an approved DCRF mechanism in place.63 64 65
Three of the six ERCOT investor-owned TDUs (AEP Texas Central, AEP Texas North, and Oncor) have cost trackers for rate case expenses, and one (CenterPoint Energy) has a tracker for system restoration costs following a major weather-related event or natural disaster.64,65
Of the foregoing trackers, those related to T&D investments are most valuable to the utilities because of the magnitude of these costs. Timely recovery of distribution investment is particularly important because it constitutes roughly two-thirds of TDUs' rate bases.
The Texas legislature and the PUCT have also authorized cost trackers that apply to specific vertically integrated investor-owned utilities operating outside of ERCOT, where the Commission has delayed retail competition. For non-ERCOT utilities, the TCRF mechanism combines the TRCF and interim transmission cost of service adjustments applicable to ERCOT utilities. That is, the non-ERCOT TCRF recovers both changes in FERC-approved wholesale transmission charges and incremental transmission investment costs. For non-ERCOT utilities, there is also a DCRF that is the same as that applicable to ERCOT utilities.
61TAC Section 25.193.
62 PURA Section 36.210.
63 in April 2016, AEP Texas Central and AEP Texas North filed their initial DCRF applications, and CenterPoint Energy
filed its second DCRF application.
64 TAC Section 25.245.
65 The TDU tariffs also include a variety of riders that address a variety of side issues. These riders pertain to
Accumulated Deferred Federal Income Tax Credits, Competitive Metering Credits, Municipal Account Franchise Credits, Nuclear Decommissioning Charges, State College & Universities Discounts, and competition transition charges. For residential and small commercial customers, these riders recover costs by means of volumetric rates even though most of the costs recovered by these riders are fixed in nature.
Christensen Associates Energy Consulting, LLC 50 5/25/2016

Attachment A
6.2.2. Other Characteristics of Texas Regulation
Non-ERCOT utilities may also take advantage of a new provision of PURA that permits them to file rate cases using estimated data that is updated with actual data 45 days after filing.66 The final rates for such utilities are effective on the 155th day after the filing of a rate case.67
The commission is presently working to adopt rules implementing these provisions, with the intentions of reducing regulatory lag and allowing non-ERCOT utilities to begin to recover investment costs closer to the time investments are placed in service.
Another new provision of PURA requires non-ERCOT utilities to file rate cases within four years of the final order in their last rate cases or after two years of the utility's actual earned rate of return materially exceeding its authorized rate of return on investment, on a weather- normalized basis.68
6.3. Ratemaking Reform Goals and the Alternative Ratemaking Mechanisms
In seeking this study of alternative ratemaking mechanisms, Texas is investigating effective and efficient means of implementing a broad philosophy that the regulated rates of monopoly utilities should, to the extent feasible, replicate competitive market outcomes. Through a wholesale spot market and retail choice, Texas has implemented competition for generation services. Unfortunately, however, while it is possible to create or replicate competition for generation services that have significant short-run marginal costs; it is difficult to do so for monopoly T&D services for which the overwhelming majority of costs are fixed.
Texas is exploring modified regulatory approaches that create processes for adjusting T&D revenue requirements and rates that are less administratively burdensome and more regular and predictable than the present ratemaking process. Traditional cost-of-service ratemaking is time-consuming in part because it is subject to infrequent rate cases initiated by the utility whenever it perceives a significant difference between its allowed revenue requirement and its actual or future revenue requirement. This quite often means that revised rates may be based upon outdated data, that rates can fail to reflect current market conditions, that customers are subject to rate shock, and that the ratemaking process is costly and highly contested for many involved stakeholders.
Ideally, a modified ratemaking approach would provide timely and automatic adjustments to revenue requirements that would reduce utilities' uncertainty about cost recovery, improve incentives for utilities' investments in prudent T&D infrastructure, reduce the conflicts associated with rate changes, and obviate the need to conduct expensive rate cases for matters that are small or non-contentious. Such an approach should not sacrifice the necessary critical oversight from the PUCT and interveners to ensure that utilities incur prudent costs and earn
66 PURA Section 36.112.
67 PURA Section 36.211.
68 PURA Section 36.212.
Christensen Associates Energy Consulting, LLC 51 5/25/2016
Attachment A
reasonable returns while fulfilling particular public policy goals. Furthermore, the adoption of alternative ratemaking mechanisms should retain or improve the cohesion of utilities' rates, allowing the PUCT to consider the entirety of each utility's rates.
Consistent with these needs, most of the alternative ratemaking mechanisms discussed in this report have the merits of regularizing certain dimensions of the process: adjustments to the revenue requirement are made on a predefined schedule to coincide as closely as possible with changes in costs, investment, and sales. Under these alternatives, changes to revenue requirements and rates would better reflect - and more quickly reflect - changing business and economic conditions.
/ '
It is apparent that no single alternative ratemaking mechanism has all of the desirable characteristics or is capable of satisfying all policy goals. However, each of the alternative rate mechanisms has some of the desirable characteristics and capabilities, particularly when coupled with certain other mechanisms. Consequently, to meet Texas' needs, the alternative ratemaking mechanisms need to be combined into a coherent composite package. Indeed, nearly all states (including Texas) have ratemaking approaches that embrace components of several of the mechanisms discussed in this report.
6.4. Recommendations for Alternative Ratemaking Mechanisms
The choice among the alternative ratemaking mechanisms and the designs of those mechanisms depend upon Texas' policy priorities. A mechanism that meets one policy goal will fail to address other policy goals, and may even conflict with other policy goals.
This section presents our recommendations by policy goal, identifying the alternatives that we believe best meet those goals, with the understanding that different Texas stakeholders will have differing policy priorities. Without implying our own priorities, we begin with goals related to procedure, continue with goals related to cost recovery, and conclude with goals related to other aspects of electricity service. We understand that many elements of these recommendations are already in place in Texas; so our implicit recommendations about such elements are that they continue in some form.
Reducing Procedural Costs
Procedural costs can be reduced to the extent that rates update automatically, with minimal need for review by the PUCT and interveners, or to the extent that ratemaking mechanisms do not inherently require rate updates. Nonetheless, nearly all of the alternative ratemaking mechanisms require at least periodic review of revenue requirements and the prudency of costs; and some, like price cap plans, require significant data that are not otherwise needed for reviewing the reasonableness of costs and rates.
In the recommendations that follow, note will be made of means by which the burdens associated with rate updates may be mitigated or, in a few cases, avoided.
Christensen Associates Energy Consulting, LLC 52 5/25/2016

Attachment A
Establishing Reasonable Procedural Timetables
There should be a regular timeframe for adjusting rates and reconciling them with utility costs. For example, major rate cases could be scheduled every three to five years, except under extraordinary circumstances; and automatic rate adjustments could occur annually, or perhaps semi-annually. The automatic rate adjustments would serve the purpose of keeping rates aligned with costs and thus avoiding rate shock from accumulation of differences between rates and costs over time. The automatic rate adjustments would be accompanied by utility reports that would assure transparency, allow the PUCT and interveners to review rate changes, and permit settlement negotiations if necessary.
The automatic rate adjustments would apply to all applicable rate mechanisms, including performance incentives and cost trackers. With regard to the latter, a shortcoming of the current interim transmission cost of service adjustment mechanism is that rate adjustments occur only when transmission providers make investments, which causes rates and costs to diverge when transmission providers do not make investments for a period of time. Requiring automatic rate adjustments at regular intervals would avoid this problem.
To inform the PUCT and intervenors about utilities' plans and expectations about the future, utilities would be required to make annual filings that describe their intentions for major infrastructure investments for (perhaps) the next five years.
The PUCT would be responsible for rendering decisions on rate adjustments within timeframes suitable to each ratemaking mechanism, with acceptance being the default in the absence of PUCT action under specified circumstances.
Decoupling Cost Recovery from Load Variations
SFV rates, revenue decoupling, and LRAMs all stabilize utility recovery of fixed costs when loads significantly change. Not incidentally, they also all help reduce the importance of load forecasts in rate cases and help mitigate utility disincentives for energy conservation. For Texas' TDUs, these needs for stability and mitigating disincentives are an issue only for residential and small non-residential customers, for whom between 76% and 89% of the fixed costs of the six major ERCOT-based distribution utilities are recovered through energy-based (per kWh) rates. These needs are not an issue for large non-residential customers who, aside from the Energy Efficiency Cost Recovery Rider, have no energy charges in their retail T&D base rates.
SFV rates have the relative merits of: a) providing a close match between retail pricecomponents and the ways (i.e., fixed or variable) that costs are incurred, so that changes in sales lead to roughly equal changes in revenues and costs; b) providing rates that do not need to change with load changes; and c) imposing low administrative burdens on regulators and intervenors. The relative shortcoming of SFV rates is they require significant revisions to present rates, with adverse impacts on low-volume customers who are generally perceived to be low-income customers. To address this shortcoming, SFV rate reform needs to be introduced gradually, preferably with a "sliding scale" mechanism that assigns lower fixed charges to customers who place relatively low demands on T&O systems.
Christensen Associates Energy Consulting, LLC S3 5/25/2016
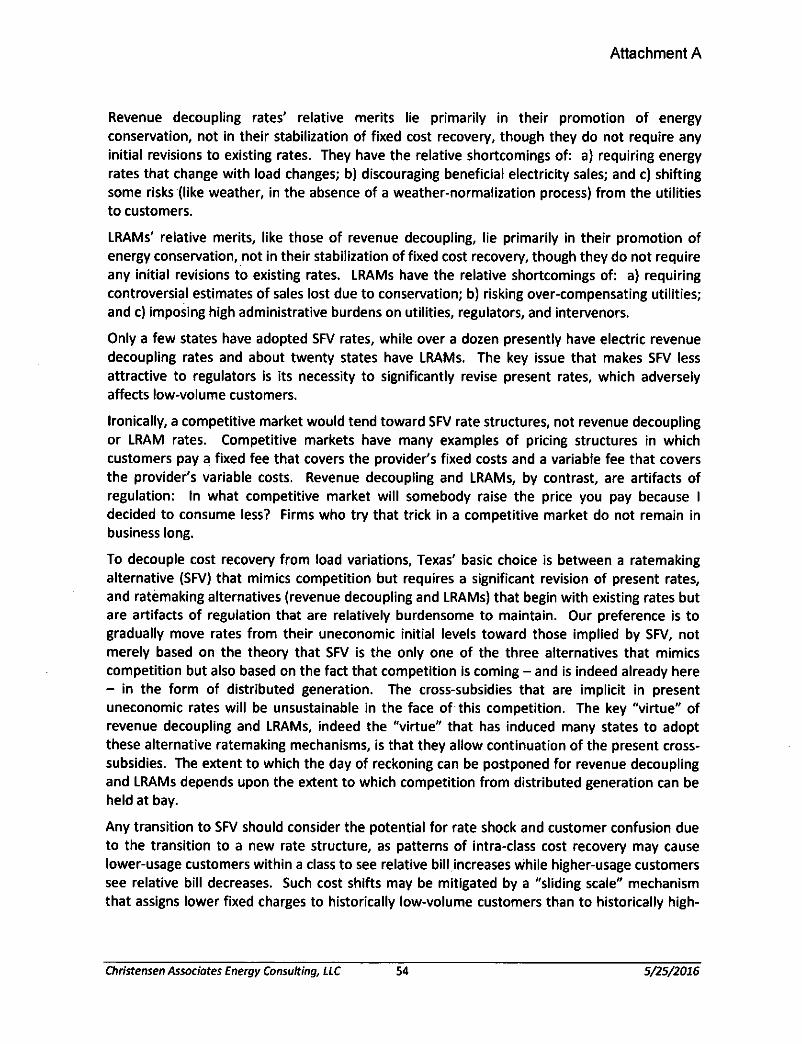
Attachment A
Revenue decoupling rates' relative merits lie primarily in their promotion of energy conservation, not in their stabilization of fixed cost recovery, though they do not require any initial revisions to existing rates. They have the relative shortcomings of: a) requiring energy rates that change with load changes; b) discouraging beneficial electricity sales; and c) shifting some risks (like weather, in the absence of a weather-normalization process) from the utilities to customers.
LRAMs' relative merits, like those of revenue decoupling, lie primarily in their promotion of energy conservation, not in their stabilization of fixed cost recovery, though they do not require any initial revisions to existing rates. LRAMs have the relative shortcomings of: a) requiring controversial estimates of sales lost due to conservation; b) risking over-compensating utilities; and c) imposing high administrative burdens on utilities, regulators, and intervenors.
Only a few states have adopted SFV rates, while over a dozen presently have electric revenue decoupling rates and about twenty states have LRAMs. The key issue that makes SFV less attractive to regulators is its necessity to significantly revise present rates, which adversely affects low-volume customers.
Ironically, a competitive market would tend toward SFV rate structures, not revenue decoupling or LRAM rates. Competitive markets have many examples of pricing structures in which customers pay a fixed fee that covers the provider's fixed costs and a variable fee that covers the provider's variable costs. Revenue decoupling and LRAMs, by contrast, are artifacts of regulation: In what competitive market will somebody raise the price you pay because I decided to consume less? Firms who try that trick in a competitive market do not remain in business long.
To decouple cost recovery from load variations, Texas' basic choice is between a ratemaking alternative (SFV) that mimics competition but requires a significant revision of present rates, and ratemaking alternatives (revenue decoupling and LRAMs) that begin with existing rates but are artifacts of regulation that are relatively burdensome to maintain. Our preference is to gradually move rates from their uneconomic initial levels toward those implied by SFV, not merely based on the theory that SFV is the only one of the three alternatives that mimics competition but also based on the fact that competition is coming - and is indeed already here - in the form of distributed generation. The cross-subsidies that are implicit in present uneconomic rates will be unsustainable in the face of this competition. The key "virtue" of revenue decoupling and LRAMs, indeed the "virtue" that has induced many states to adopt these alternative ratemaking mechanisms, is that they allow continuation of the present crosssubsidies. The extent to which the day of reckoning can be postponed for revenue decoupling and LRAMs depends upon the extent to which competition from distributed generation can be held at bay.
Any transition to SFV should consider the potential for rate shock and customer confusion due to the transition to a new rate structure, as patterns of intra-class cost recovery may cause lower-usage customers within a class to see relative bill increases while higher-usage customers see relative bill decreases. Such cost shifts may be mitigated by a "sliding scale" mechanism that assigns lower fixed charges to historically low-volume customers than to historically high-
Christensen Associates Energy Consulting, LLC 54 5/25/2016

Attachment A
volume customers. It may also be advisable for a transition to SFV to occur gradually over a period of perhaps five years.
Assuring Cost Recovery
A limited set of cost trackers is warranted as a means of assuring recovery of costs that are substantial, unpredictable, volatile, recurring, or beyond utility control. Such cost trackers can help hold down procedural costs, update rates to reflect new market conditions, and facilitate more gradual rate changes over time. By providing timely recovery of significant costs; with appropriate safeguards for confirming the prudency of those costs, cost trackers can reduce utilities' financial risk without compromising their performance.
In principle, Texas' present cost trackers - for advanced metering systems, energy efficiency programs, transmission cost passthroughs, and T&D investment costs - appear to be reasonable and worthy of continuation in some form. As previously mentioned, the desirability of timely updates suggests that there may be annual updates to all cost trackers.
Alternatively, Texas could use multi-year rate plans to change rates to reflect cost changes as measured by external factors beyond the utility's control, like fuel prices. Such plans offer the benefits of giving the utility temporary incentives to cut costs and improve performance, of providing more predictable utility revenues and customer rates, and of spreading investment- induced rate increases over relatively long periods. On the other hand, such plans can also be data-intensive and relatively burdensome to develop. Given the fact that Texas already has a basically satisfactory set of cost trackers, we do not recommend shifting to multi-year rate plans.
Assuring Prudency of Costs
Costs should be recovered only to the extent that they are prudent. As with traditional ratemaking, any streamlined ratemaking process should retain the ability of the PUCT and intervenors to review rate changes. To reduce potential conflicts during reviews, the cost basis data requirements, and methods for automatic rate adjustments need to be carefully defined at the outset of the design of the automatic adjustment programs. If there are to be any true- ups for differences between forecast costs and actual costs or between actual revenues and actual costs, the data requirements, methods, and any applicable carrying charges for the true- ups also need to be defined in advance.
Assuring Reasonable ROEs
Because automatic rate change mechanisms can result in actual ROEs that differ significantly from authorized ROEs, earnings sharing mechanisms are desirable as a means of maintaining ROEs within bands considered to be consistent with market-based returns. Authorized ROEs are set through the regulatory process at levels consistent with prevailing TDD ROEs, with financial market data, and with the risk profile of the particular utility to which the ROE would apply. Authorized ROEs may also depend upon the utility's achievement of certain operating performance metrics, as described below. Authorized ROEs may be updated annually.
Christensen Associates Energy Consulting, LLC 55 5/25/2016
Attachment A
At the inception of a TDU's automated rate change mechanisms, bands around the authorized ROE are defined within which no change would be made to the actual ROE. Similar to the FRPs of utilities in Alabama and Mississippi, the actual ROE could be ratcheted up or down if it falls outside of the bands. The adjustment of any actual ROE falling outside the band could be limited to a pre-specified number of basis points in order to limit the volatility of rates over the plan period. The treatment of adjustments could be symmetric (the same when actual ROEs are too high as when they are too low) or asymmetric. Adjustments to the authorized ROE would entail sharing between customers and shareholders the difference between the actual ROE and the relevant band, which would be accomplished by reducing customers' rates when the actual ROE is too high and increasing rates when the actual ROE is too low.
Assuring Service Quality
To assure that the operation of automatic rate adjustment mechanisms does not induce costcutting that compromises service quality, it may be wise to develop performance incentives to accompany such mechanisms. Texas may consider following the examples of Alabama, Mississippi and Louisiana in adjusting authorized ROEs in accordance with utilities' achievement of certain operating performance metrics.
Promoting Energy Conservation
SFV rates, revenue decoupling, and LRAMs can be used to remove a key disincentive to utility promotion of energy efficiency. Revenue decoupling, cost trackers, and performance incentives can be used to encourage energy conservation by consumers. The extent to which these ratemaking alternatives should be used for these purposes depends upon state policy.
Assuring Rate Stability
To avoid or mitigate rate shock due to the inauguration of a new alternative ratemaking mechanism, such mechanisms could be phased in over a period of three to five years.
To avoid or mitigate rate shock due to automatic rate adjustments, Texas could place caps on the sizes of such adjustments, particularly rate increases. Rate adjustments that exceed the caps could be deferred for future recovery or refund.
Christensen Associates Energy Consulting, LLC 56 S/25/2016

Attachment A
APCO
APSC
ARP
CAGR
CL&P
CPUC
ERGOT
FERC
FRP
GDP
kW
kWh
LRAM
NYSEG
PSCo
PUCT
PURA
ROE
SFV
TAG
TCRF
T&D
APPENDIX.
ABBREVIATIONS
Alabama Power Company
Alabama Public Service Commission
Alternative Rate Plan
compound annual growth rate
Connecticut Light & Power
California Public Utilities Commission
Electric Reliability Council of Texas
Federal Energy Regulatory Commission
formula rate plan
gross domestic product
kilowatt
kilowatt-hour
lost revenue adjustment mechanism
New York State Electric & Gas Company
Public Service Company of Colorado
Public Utility Commission of Texas
Texas' Public Utility Regulatory Act
rate of return on equity
straight-fixed variable
Texas Administrative Code
transmission cost recovery factor
transmission and distribution
Christensen Associates Energy Consulting, LLC 57 5/25/2016

Attachment B
The Impact of Revenue Decoupling on the Cost of Capital for Electric Utilities: An Empirical Investigation
The Energy Foundation
Michael J. Vilbert
Joseph B. Wharton
Charles Gibbons
Melanie Rosenberg
Yang Wei Neo
March 20, 201 4
PREPARED FOR
JlJi 31 2op
PREPARED BY’s sureau
THE Brattle GROUP

Attachment B
---------itj -----------------------------------------------------------------------------------
This report was prepared for The Energy Foundation. All results and any errors are the
responsibility of the authors and do not represent the opinion of The Brattle Group, Inc. or its
clients.
Acknowledgement: We acknowledge the valuable contributions of many individuals to this
report and to the underlying analysis, including members of a peer review group that included
Sheryl Carter, Ralph Cavanagh, Marty Kushler and Devra Wang.
Copyright © 2014 The Brattle Group, Inc.
Attachment B
Table of Contents
I. OVERVIEW AND SUMMARY...................................................................................................................1
II. DEVELOPMENTS IN THE POLICY OF REVENUE DECOUPLING............................................ 4
HI. COST OF CAPITAL THEORY AND THE IMPACTS OF DECOUPLING.................................7
IV. CREATING A DECOUPLING SAMPLE OF REGULATED ELECTRIC UTILITIES................. 8
V. ESTIMATION OF THE COST OF CAPITAL FOR THE ELECTRIC INDUSTRY.................... 13
VI. AN EMPIRICAL TEST OF THE EFFECT OF DECOUPLING ON THE COST OF
CAPITAL.......................................................................................................................................................... 16
VII. CONCLUSION................................................................................................................................................18
i | Brattle.com
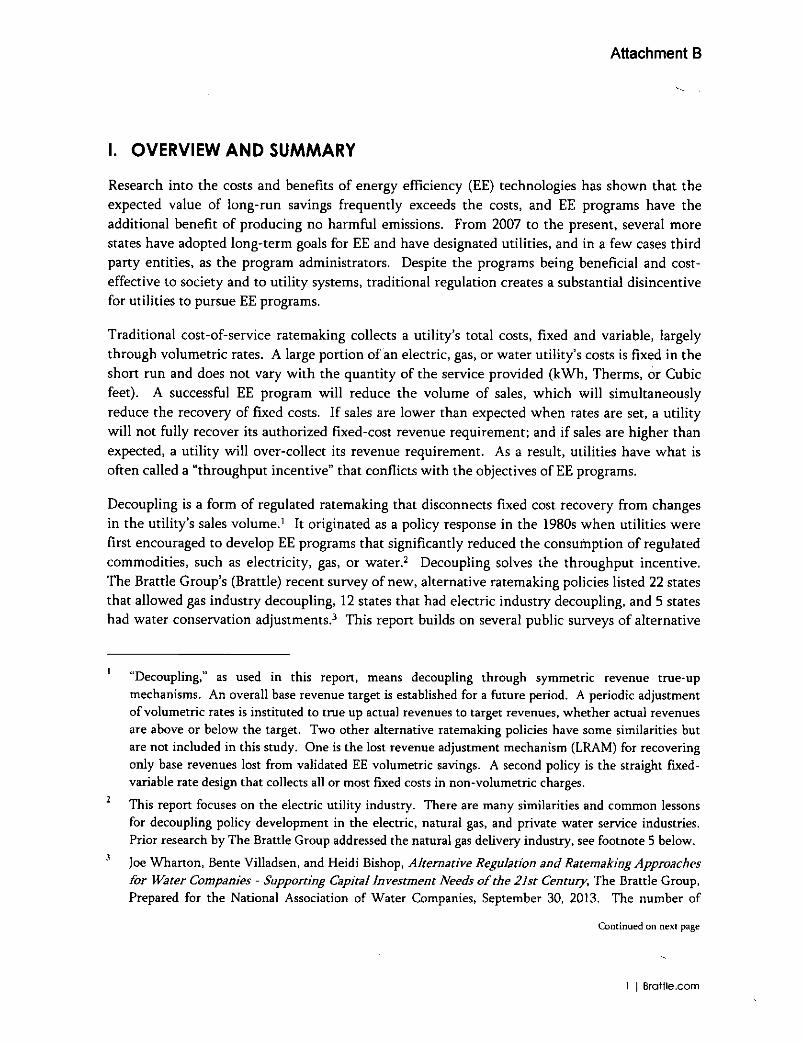
Attachment B
I. OVERVIEW AND SUMMARY
Research into the costs and benefits of energy efficiency (EE) technologies has shown that the expected value of long-run savings frequently exceeds the costs, and EE programs have the additional benefit of producing no harmful emissions. From 2007 to the present, several more states have adopted long-term goals for EE and have designated utilities, and in a few cases third party entities, as the program administrators. Despite the programs being beneficial and cost- effective to society and to utility systems, traditional regulation creates a substantial disincentive for utilities to pursue EE programs.
Traditional cost-of-service ratemaking collects a utility’s total costs, fixed and variable, largely through volumetric rates. A large portion of an electric, gas, or water utility’s costs is fixed in the short run and does not vary with the quantity of the service provided (kWh, Therms, or Cubic feet). A successful EE program will reduce the volume of sales, which will simultaneously reduce the recovery of fixed costs. If sales are lower than expected when rates are set, a utility will not fully recover its authorized fixed-cost revenue requirement; and if sales are higher than expected, a utility will over-collect its revenue requirement. As a result, utilities have what is often called a “throughput incentive” that conflicts with the objectives of EE programs.
Decoupling is a form of regulated ratemaking that disconnects fixed cost recovery from changes in the utility’s sales volume.1 It originated as a policy response in the 1980s when utilities were first encouraged to develop EE programs that significantly reduced the consumption of regulated commodities, such as electricity, gas, or water.2 Decoupling solves the throughput incentive. The Brattle Group’s (Brattle) recent survey of new, alternative ratemaking policies listed 22 states that allowed gas industry decoupling, 12 states that had electric industry decoupling, and 5 states had water conservation adjustments.3 This report builds on several public surveys of alternative
“Decoupling,” as used in this report, means decoupling through symmetric revenue true-up
mechanisms. An overall base revenue target is established for a future period. A periodic adjustment of volumetric rates is instituted to true up actual revenues to target revenues, whether actual revenues
are above or below the target. Two other alternative ratemaking policies have some similarities but
are not included in this study. One is the lost revenue adjustment mechanism (LRAM) for recovering only base revenues lost from validated EE volumetric savings. A second policy is the straight fixed-
variable rate design that collects all or most fixed costs in non-volumetric charges.
2 This report focuses on the electric utility industry. There are many similarities and common lessons
for decoupling policy development in the electric, natural gas, and private water service industries.
Prior research by The Brattle Group addressed the natural gas delivery industry, see footnote 5 below.
3 Joe Wharton, Bente Villadsen, and Heidi Bishop, Alternative Regulation and Ratemaking Approaches
for Water Companies - Supporting Capital Investment Needs of the 21st Century, The Brattle Group, Prepared for the National Association of Water Companies, September 30, 2013. The number of
Continued on next page
1 | Brattle.com

Attachment B
ratemaking policies that include decoupling.4 In the last half dozen years, decoupling has grown rapidly in the electric industry coincident with the upsurge in expenditures for conservation programs, efficiency standards, and the general flattening of electricity sales growth.
Because of the potential effect on the cost of equity (COE), the adoption of EE programs accompanied by a decoupling policy is sometimes resisted by both regulated companies and interveners for opposite reasons. Some interveners and commission staffs have argued that the allowed return on equity (ROE) should be reduced because decoupling, by design, reduces the variability of revenues, which they believe translates directly into reduced business risk. If the allowed ROE is not reduced, those interveners may not support decoupling. Utilities fear that adoption of decoupling will result in a reduction in the allowed ROE even if there is no proof that decoupling actually reduces the cost of capital. Determining the actual, empirical effect of decoupling on the utility’s cost of capital is critical to answering the question of whether the regulated company’s allowed cost of capital should be reduced at the time of adoption.
The Brattle authors have considerable experience with the issues of decoupling rate policy and the frequently asked question as to whether it has a measurable impact on the cost of capital (COG) of regulated companies, as assessed in financial markets. In 2010 and again in 2013, the authors empirically tested the hypothesis in the natural gas delivery industry and found that there was no statistically measurable effect on the COG with decoupling.5 In this report, we test
Continued from previous page
companies and states with decoupling changes relatively frequently. For example, Washington State returned to decoupling in mid-2013, a change that was not in the Brattle survey, Op. Cit.
4 Sources of information on decoupling and other alternative regulatory policies beyond the Brattle
survey Op. Cit. include Pamela Morgan, A Decade of Decoupling for U.S. Energy Industries: Rate Impacts, Designs, and Observations, Dec. 2012; Edison Electric Institute (EEI), Alternative Regulation for Evolving Utility Challenges: An Updated Survey, Pacific Economics Group Research
LLC, Jan. 2013; Institute of Electric Efficiency (IEE), State Electric Efficiency Regulatory Frameworks, July 2013; and American Gas Association (AGA), Natural Gas Innovative Rates, Non-Volumetric
Rates, and Tracking Mechanisms Current List, Cynthia J. Marple, power point presentation, Sept. 2012. For this study, Brattle reviewed many of the sources and updated the periods that decoupling
policies have been in place for different states.
5 In the previous research, the authors analyzed a sample of 12 natural gas delivery holding companies
(HCs) and their 31 regulated gas subsidiaries over the period 2005 to 2012. The number of gas subsidiary companies operating under decoupling grew from 8 to 22 over the period. This analysis
made accurate measurements of the cost of capital and developed consistent measurements of the degree of decoupling of each HC for a decoupling “metric”. The findings were that decoupling shows
no statistically significant impact on the COG either up or down. See J. Wharton, M. Vilbert, C.
Gibbons, and S. Lagos, An Empirical Study of Impact of Decoupling on Cost of Capital, Power Point
presentation to the Western Conference of the Rutgers University Center for Research in Regulated Industries (CRRI), June 21, 2013.
2 | Brattle.com
Attachment B
the same hypothesis for a different set of utilities which are predominantly in the electric utility business.
Theoretical arguments for reducing the cost of capital are frequently offered by interveners in decoupling regulatory proceedings for electric and natural gas companies and have been accepted in a small number of commission decisions.6 In some proceedings, different interveners have suggested that the effect of decoupling on ROE is anywhere from 25 basis points (bps) to 300 bps.7 In the past, the Brattle authors have testified that in these regulated, high fixed cost industries, the determinants of the cost of capital are complicated,8 and there should be no presumption that decoupling automatically lowers the cost of capital. Adoption of decoupling policies could be coincident with other influences that may be increasing non-diversifiable risk.9 Any reduction in the allowed return on equity should be based upon evidence that decoupling reduces the cost of capital.
The results of our empirical analysis of decoupling in the electric industry do not support the hypothesis that utilities with decoupling have a lower cost of capital than utilities without decoupling. Our study finds that decoupling is not associated with a statistically significant decrease in the estimated cost of capital. This result is consistent with our previous findings for the natural gas distribution industry.
6 Pamela Morgan reports that the return on equity (ROE) was not reduced in 78% of the Commission
decisions adopting decoupling. The remaining decisions reduced the allowed ROE by 10 and 50 basis
points. In settlements, 85% had no ROE reductions and the remaining 15% were between 10 and 25 basis points. See “A Decade of Decoupling for U.S. Energy Industries: Rate Impacts, Designs, and
Observations”, Dec. 2012, p. 14.
7 For example, see pp. 19-20 of “Phase IB Testimony of Terry L. Murray on behalf of the Division of
Ratepayer Advocates on Return on Equity Adjustments” before the California Public Utilities
Commission, filed October 19, 2007 in Docket No. I. 07-01-022. Also see a recent discussion on p. 44
of Washington Utilities and Transportation Commission, Puget Sound Energy, Final Order Granting
Petition, Docket UE-121697, Section D.2.b “Decoupling - Cost of Capital," June 25, 2013.g See Chapters 7-9, Brealey, Myers and Allen, Principles of Corporate Finance, lllh edition, McGraw
Hill Irwin, 2014 for a discussion of the cost of capital.
9 Diversifiable risks, such as weather, do not affect the cost of capital because diversifiable risks can be
eliminated by investing in a portfolio of unrelated assets.
3 | Brattle.com

Attachment B
II. DEVELOPMENTS IN THE POLICY OF REVENUE DECOUPLING
Adoption of a revenue decoupling policy10 severs the link between recoveries of base or fixed revenues11, from volumetric sales of kWh, which would normally be the case under traditional cost-of-service regulation. Cost recovery is not based upon actual kWh sales, but instead on a revenue target. Revenues are adjusted to achieve the target. For example, the percent growth in revenues relative to the base period could be set at actual net percentage growth in the numbers of customers over the base period. Over a pre-established period, such as a year, there is an adjustment of rates that will true-up the actual revenues to the target, whether actual sales are higher or lower than expected.
Current decoupling policies frequently evolve from the same policy basis as the earliest version, which was instituted in California in 1980 for natural gas utilities and in 1982-83 for electric utilities.12 California policy makers determined that decoupling would be “in the public interest” in part because it provided relief for differences in actual revenues compared to forecast revenues when utilities carried out policy directives to pursue aggressive energy efficiency goals. Customers are protected if sales are greater than forecast, and utilities recover their fixed costs if EE programs are more effective than expected.13
Figure 1 illustrates the substantial increase in EE expenditures by electric utilities since 2007 as well as two projections of expenditures in 2025.14 The growth of EE programs, the consequent installation of efficiency measures (equipment and structures), and the concurrent decline in
10 The treatment of decoupling in this study is straight forward: at a given time for a given state-
regulated electric company, a decoupling policy is in place, or it is not. Beyond what is discussed in
footnote 1, we recognize but do not attempt to differentiate the several different kinds of decoupling mechanisms. Decoupling policies can vary in several dimensions: the companion revenue adjustment
mechanism, the coverage and independence of rate classes; the inclusiveness of causes of demand
fluctuation (weather fluctuations may be excluded); the adjustment over time using revenue target adjustment mechanism (numbers of customers and certain cost categories can be used to adjust targets
over time).
11 Lost revenues for the recovery of variable costs, such as fuel and purchased power, are not included in
decoupling true-ups because variable costs are avoided with the reduction in kWh consumption.
Fixed costs only change in the long-term when depreciation and conservation leads to less system
investment.
12 Dr. John L. Jurewitz, Decoupling and Energy Efficiency Incentives: The California Experience, EEI
2007 Spring Legal Conference, Charleston, SC, April 16, 2007.
13 In addition, disputes over sales forecasts may be reduced because the earnings of the regulated company are not affected by differences in forecasts.
14 Institute of Electric Efficiency (IEE); State Electric Efficiency Regulatory Frameworks, July 2013, p. 2.
The values are spending and budgets for customer-funded electric efficiency programs.
4 | Brattle.com

Attachment B
kWh sales growth, especially for small customers on volumetric rates, highlights the importance of addressing the throughput incentive of regulated utilities.
Figure 1: U.S. Energy Efficiency Expenditures (Customer Funded, in $ Billions)
Source: Institute for Electric Efficiency, 2013
Figure 2 displays a map of the states that at present or in the recent past have had a policy of
decoupling.15 This is the starting point of the analysis. Utilities in California, Washington, and
Rhode Island (shown in green) were not used in our sample. National Grid is the holding
company for Narragansett Electric in Rhode Island. Observations were removed in the financial
data screening because National Grid is a company based in the United Kingdom, so capital
market information may not be compatible.16 The major California utilities had the policy of
decoupling or its equivalent across the entire study period 2005 - 2012, and saw no change in
policy, so there was no way to compare the cost of capital before and after adoption of
15 In principle and practice, decoupling can be ended. Our sample includes utilities in Michigan where
decoupling for electric utilities was instituted by the commission for several electric companies and
later determined to be illegal under state law.
16 National Grid is traded as an American Depository Receipt (ADR) and so is excluded from the analysis.
5 | Brattle.com
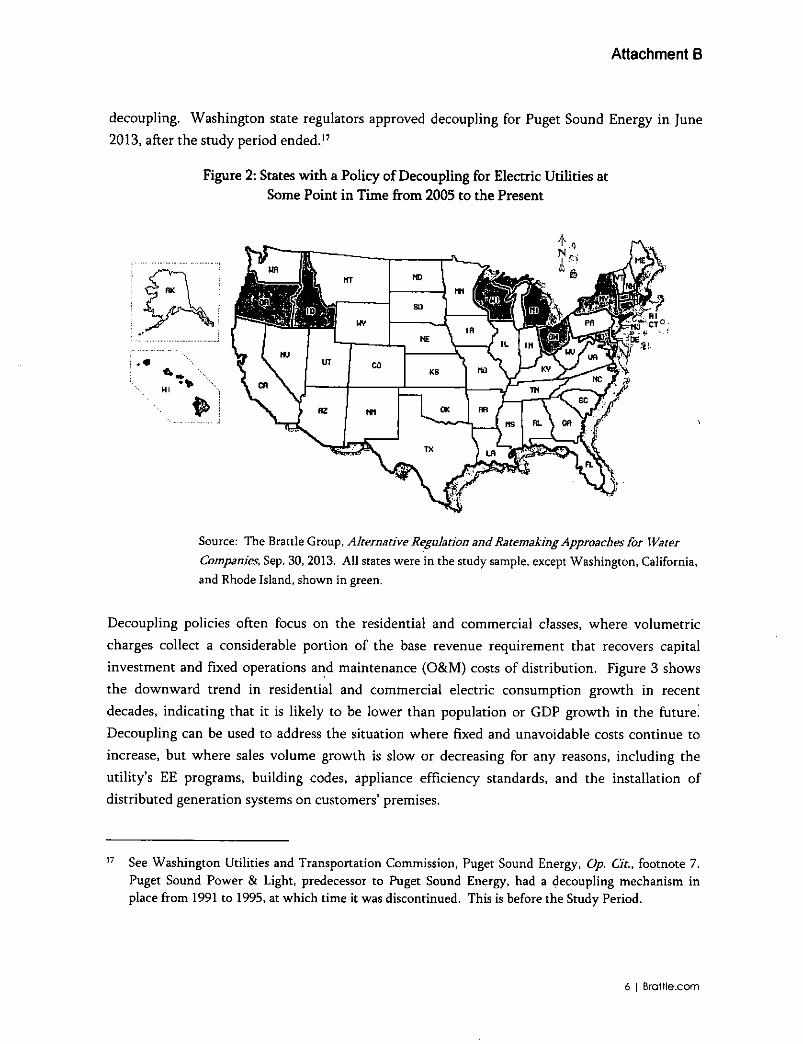
Attachment B
decoupling. Washington state regulators approved decoupling for Puget Sound Energy in June
2013, after the study period ended.17
Figure 2: States with a Policy of Decoupling for Electric Utilities at Some Point in Time from 2005 to the Present
Source: The Brattle Group, Alternative Regulation and Ratemaking Approaches for Water
Companies, Sep. 30, 2013. All states were in the study sample, except Washington, California,
and Rhode Island, shown in green.
Decoupling policies often focus on the residential and commercial classes, where volumetric
charges collect a considerable portion of the base revenue requirement that recovers capital
investment and fixed operations and maintenance (O&M) costs of distribution. Figure 3 shows
the downward trend in residential and commercial electric consumption growth in recent
decades, indicating that it is likely to be lower than population or GDP growth in the future.
Decoupling can be used to address the situation where fixed and unavoidable costs continue to
increase, but where sales volume growth is slow or decreasing for any reasons, including the
utility’s EE programs, building codes, appliance efficiency standards, and the installation of
distributed generation systems on customers’ premises.
17 See Washington Utilities and Transportation Commission, Puget Sound Energy, Op. Cit., footnote 7.
Puget Sound Power & Light, predecessor to Puget Sound Energy, had a decoupling mechanism in place from 1991 to 1995, at which time it was discontinued. This is before the Study Period.
6 | Brattle.com

Attachment B
Figure 3: Trends in Electric Consumption Growth by Decade: 1951 - 2010
III. COST OF CAPITAL THEORY AND THE IMPACTS OF DECOUPLING
A regulated utility’s operating earnings (i.e., earnings before income taxes) are the difference between base revenues (non-fuel) and the sum of all prudent costs, including O&M, administrative and general (A&G), depreciation, and interest. There are several sources of variability in the base revenue stream that can be eliminated by the decoupling mechanism analyzed here. EE programs normally decrease revenues because they decrease sales. Other increases and/or decreases in base revenues are driven by changes in weather, business activity over the business cycle, the number of net new customers, local, state and federal building and appliance codes and standards, and the number of delinquent bills. By design, decoupling ratemaking eliminates or significantly weakens the linkage between revenues and the volume sold, independently from the sources of variability.
Decoupling should stabilize revenues, but net income can still vary. Although depreciation and interest expense are relatively stable, other costs can change materially between rate cases. At times of rapid capital investment, for example, when utilities face significant environmental retrofits and replacements, depreciation and interest may also increase rapidly and put pressure on earnings unless there are more frequent rate cases to adjust base revenues.
If decoupling stabilizes the revenue side of the earnings equation, does it stabilize operating earnings as well? This leads directly to the question: does decoupling reduce non-diversifiable risk since this is the risk that determines the cost of capital in financial markets? We shall see that the answer is not a simple “yes.”
7 | Brattle.com
Attachment B
Not all risks or sources of variance in earnings affect the cost of capital equally, because investors can avoid certain risks. Diversification through portfolio formation can remove diversifiable risks; therefore, diversifiable risks do not affect the cost of capital. For example, extreme weather will cause variance in a single utility’s revenues and are a risk factor for that utility’s earnings. However, investors can assemble a portfolio of utility stocks from across the climate zones in the United States, thus mitigating the effects of weather on individual stocks. For a portfolio of utility stocks, the effect of weather variations should largely cancel out, removing weather as a source of investment risk, and negating its effect on the cost of capital. Non-diversifiable risks (also known as “business risks”) are the risks that remain after diversification. Because investors must bear them, these risks affect a company’s cost of capital. The distinction between diversifiable risk and non-diversifiable business risk is important to recognize when evaluating the effect of decoupling, or other regulatory policies, on a company’s cost of capital. Simply reducing total risk, i.e., the sum of diversifiable and non-diversifiable risk, does not imply that the cost of capital has been reduced. The risk reduced must be part of a company’s business risk, i.e., its non-diversifiable risk, to affect its cost of capital.
Decoupling is often praised by credit rating agencies because it clearly reduces total risk, which is the risk important to bond holders. Adoption of decoupling could reduce the overall cost of capital for a company through a reduction in the cost of debt, but that would not justify a reduction in the allowed ROE. Only reductions in business risk justify a reduction in a regulated company’s allowed ROE.
The effect of decoupling on the cost of capital in the current electric environment of low growth and high investment cannot be determined solely on theoretical reasoning. Empirical analysis is needed, looking at the record compiled by utilities across the nation, both before and after adoption of decoupling mechanisms.
IV. CREATING A DECOUPLING SAMPLE OF REGULATED ELECTRIC UTILITIES
We start with a large sample of regulated electric company subsidiaries and their holding companies, then compile data on which have a decoupling policy and when it was officially adopted. We immediately note an important dichotomy. Holding companies, not their subsidiaries, have publicly traded stock that provides the financial information necessary to estimate the cost of capital. On the other hand, individual, state-regulated subsidiaries, not the holding companies themselves, apply for, and are granted, the policy of decoupling. Our methodology addresses this dichotomy. We measure the degree of decoupling of each holding company by examining the decoupling policies of its subsidiaries after differentiating each state
8 | Brattle.com
Attachment B
in which a subsidiary operates. We use the subsidiary’s share of the holding company’s asset to establish the weights of the different subsidiaries.18
Another feature of the study design is to analyze only a sample of regulated utilities that have experienced a change in decoupling policy within the study period, 2005 to 2012.19 As mentioned above, adoption of decoupling has been increasing along with the surge in spending on EE programs. There are several recent public surveys of alternative ratemaking policies that include decoupling.20 In the fall of 2013, Brattle, and specifically one of this report’s authors, completed a major study comparing the alternative ratemaking schemes of electric utilities on behalf of the National Association of Water Companies.21 The report used and supplemented the public survey data on regulated electric utilities that had adopted decoupling as of the summer of 2013. This report supplements the earlier sources with additional information on the Specific Date on which the regulatory policy of decoupling was adopted for each state subsidiary.22
18 In this report, we use the term “subsidiary” to refer to the segment of a utility that is regulated at the
state level. A particular holding company might own two utilities that are separate corporations.
Assume the first is located in a single state, while the second has a service territory extending over
three states. In our analysis, this holding company would have four “subsidiaries” for purposes of calculating its degree of decoupling. There are also situations, such as Con Edison in NY, where a
holding company owns more than one subsidiary within a single state, and the individual subsidiaries
get decoupling at different times. Our weighted average decoupling metric captures this.
19 The choice of the study period was deliberate. The study started with the first quarter of 2005 when
no holding companies in our sample had an electric subsidiary under decoupling. That continued for
seven quarters until first quarter of 2007, when Idaho Power was decoupled. Thus, the study period has eight quarters of data for observing cost of capital without decoupling. There followed steady growth in decoupling across the sample states for the next six years, as shown in Figure 4. Our project
and the data collection were initiated in the middle of 2013, so the last quarter of 2012 was used as an end point.
20 Sources of information on decoupling and other alternative regulatory policies are cited in footnotes 3
and 4. Where there are disagreements. Brattle investigated and decided which policies to include for
a state.
21 The Brattle Group, Alternative Regulation and Ratemaking Approaches for Water Companies, Op.
Cit. Footnote 3. See Appendix A, “Tabulation of the Alternative Regulatory and Rate Approaches in the Three Infrastructure Industries.”
22 We assume that for a particular state subsidiary, this Specific Date of approval is the likely date when
any uncertainty in capital markets about adoption of decoupling is fully resolved, resulting in the possible change in cost of capital from a reassessment of the future risk for the holding company that
owned the state regulated electric utility at issue. Capital markets are forward looking, and investors
are aware of regulatory proceedings that potentially affect future risk. We report in the final section
some results that test whether the capital markets anticipate the adoption of decoupling by one, two or three quarters prior to the Specific Date.
9 | Brattle.com

Attachment B
Each Specific Date was initially defined as the month and year of adoption. This was then converted to a quarter and year, so as to match the financial data. Decoupling for a state- regulated electric subsidiary is a binary variable, 0 or 1. On its Specific Date, each state subsidiary goes from 0, not decoupled, to 1, decoupled, or in the reverse direction. In general, a holding company may have several subsidiaries, and the Decoupling Index for the holding company is a weighted average of its subsidiaries. The decoupling index changes on each Specific Date, with the weights being the relative book value of assets in the subsidiaries with decoupling compared to the total book value of total assets of the holding company. Thus, for each sample holding company, we calculate a percentage of total assets that are decoupled as of each quarter in the study period. For example, a company with two subsidiaries, one decoupled representing 40 percent of the total assets and the other not decoupled, would have a decoupling index of 0.40 in the quarter.
The calculation of the decoupling index is sometimes complicated by the fact that some regulated subsidiaries cover more than one state and could have decoupling in one state and not the other. In that circumstance, we estimate the percentage of assets that are decoupled for that subsidiary by reference to the percentage of MWh of electricity consumed in the separate jurisdictions compared to the total MWh for the entire subsidiary. This is necessary because the distribution of assets of a multistate subsidiary is not generally reported.
The decoupling sample development started with the Brattle Alternative Rates Report of September 2013, supplemented by additional information. The initial list included 98 state regulated electric companies in 42 states. The final sample contains a subset of the following size:
• 14 electric holding companies;• 21 state-regulated electric subsidiaries of the holding companies. The subsidiaries
operate in 11 states and during some quarters in the study period had decoupling;• 32 quarters from 2005 through 2012, when growth in the policy of decoupling was rapid;
and• 291 observations, each pertaining to a holding company and consisting of the cost of
capital in that quarter, the decoupling index value in that quarter, and a set of explanatory or dummy variables, as discussed below in Section V. Holding company data financial data are screened for potential bias, using a set of standard financial and other criteria that Brattle uses continuously when estimating the cost of capital. The criteria are discussed in Section V.
10 | Bra1tle.com

Attachment B
Figure 4 shows the increase in the total state subsidiaries in our sample with decoupling over the study period.
Figure 4: Count of State Regulated Subsidiaries In Sample with Decoupling over the Study Period 2005 - 2012
11 | Brottle.com
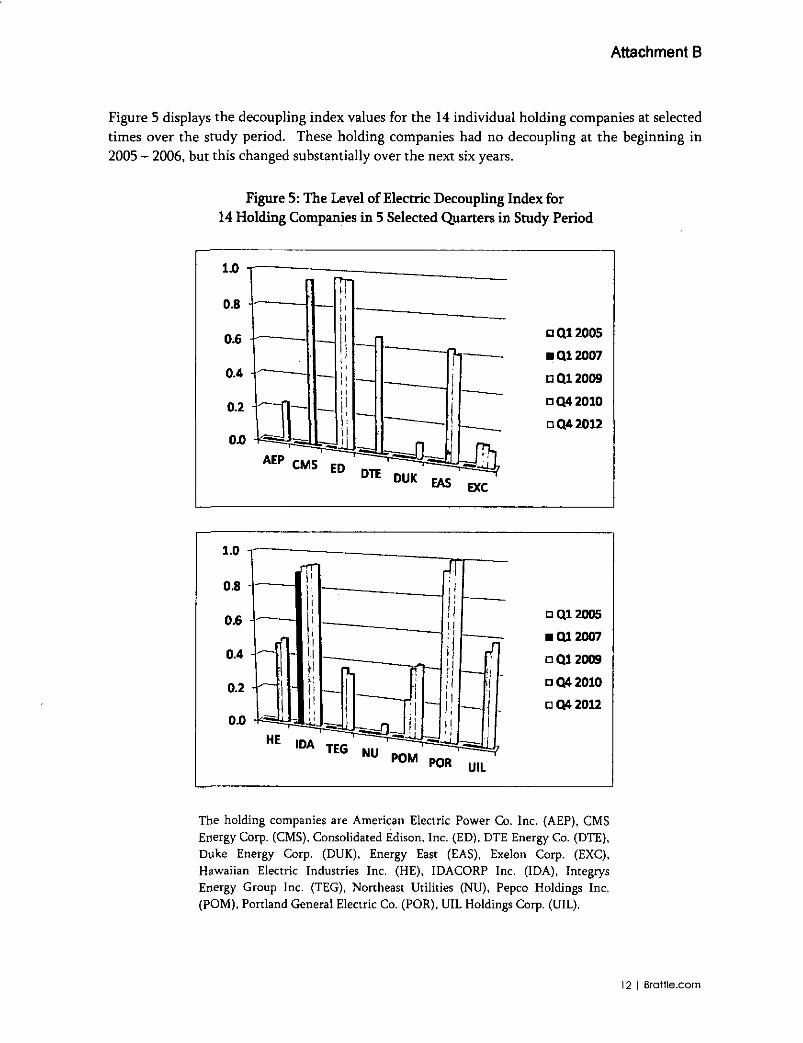
Attachment B
Figure 5 displays the decoupling index values for the 14 individual holding companies at selected times over the study period. These holding companies had no decoupling at the beginning in 2005 - 2006, but this changed substantially over the next six years.
Figure 5: The Level of Electric Decoupling Index for 14 Holding Companies in 5 Selected Quarters in Study Period
□ Q12005
■ Q12007
□ Q12009
□ Q42010
□ Q4 2012
□ 012005
■ 012007
□ Q1 2009
□ Q4 2010
□ 04 2012
The holding companies are American Electric Power Co. Inc. (AEP), CMS Energy Corp. (CMS), Consolidated Edison, Inc. (ED), DTE Energy Co. (DTE), Duke Energy Corp. (DUK), Energy East (EAS), Exelon Corp. (EXC), Hawaiian Electric Industries Inc. (HE), IDACORP Inc. (IDA), Integrys Energy Group Inc. (TEG), Northeast Utilities (NU), Pepco Holdings Inc. (POM), Portland General Electric Co. (POR), UIL Holdings Corp. (UIL).
12 i Brottle.com
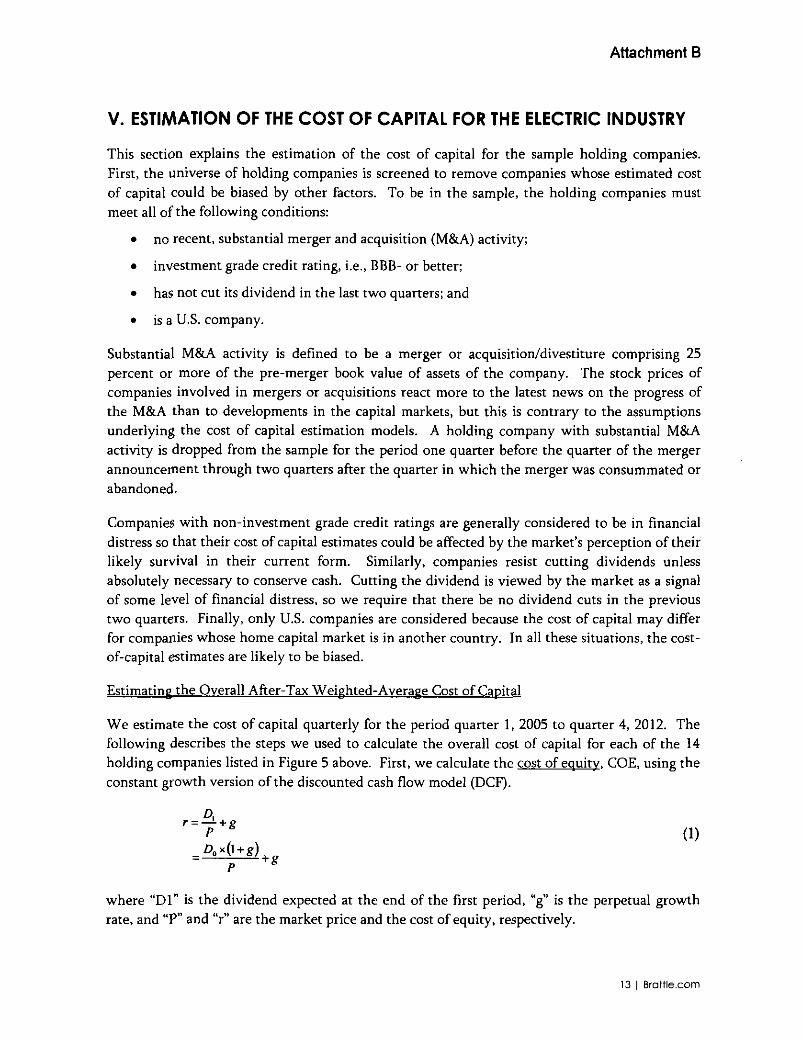
Attachment B
V. ESTIMATION OF THE COST OF CAPITAL FOR THE ELECTRIC INDUSTRY
This section explains the estimation of the cost of capital for the sample holding companies. First, the universe of holding companies is screened to remove companies whose estimated cost of capital could be biased by other factors. To be in the sample, the holding companies must meet all of the following conditions:
• no recent, substantial merger and acquisition (M&A) activity;
• investment grade credit rating, i.e., BBB- or better;
• has not cut its dividend in the last two quarters; and
• is a U.S. company.
Substantial M&A activity is defined to be a merger or acquisition/divestiture comprising 25 percent or more of the pre-merger book value of assets of the company.. The stock prices of companies involved in mergers or acquisitions react more to the latest news on the progress of the M&A than to developments in the capital markets, but this is contrary to the assumptions underlying the cost of capital estimation models. A holding company with substantial M&A activity is dropped from the sample for the period one quarter before the quarter of the merger announcement through two quarters after the quarter in which the merger was consummated or abandoned.
Companies with non-investment grade credit ratings are generally considered to be in financial distress so that their cost of capital estimates could be affected by the market’s perception of their likely survival in their current form. Similarly, companies resist cutting dividends unless absolutely necessary to conserve cash. Cutting the dividend is viewed by the market as a signal of some level of financial distress, so we require that there be no dividend cuts in the previous two quarters. Finally, only U.S. companies are considered because the cost of capital may differ for companies whose home capital market is in another country. In all these situations, the cost- of-capital estimates are likely to be biased.
Estimating the Overall After-Tax Weighted-Average Cost of Capital
We estimate the cost of capital quarterly for the period quarter 1, 2005 to quarter 4, 2012. The following describes the steps we used to calculate the overall cost of capital for each of the 14 holding companies listed in Figure 5 above. First, we calculate the cost of equity. COE, using the constant growth version of the discounted cash flow model (DCF).
r =Z?0x(l+g)
P *
(1)
where “Dl” is the dividend expected at the end of the first period, “g” is the perpetual growth rate, and “P” and “r” are the market price and the cost of equity, respectively.
13 | Brattle.com
Attachment B
The COE is the information of interest to regulators when they set the allowed ROE for a utility, so our focus is ultimately on whether there is a measurable reduction in the COE from the policy of decoupling,23 In general, the COE increases not only with increased business risk but also with increased financial risk.24 Therefore, in testing for an impact on the cost of capital from decoupling, we systematically account for differences in the COE in different holding companies in the samples that arise from different levels of financial risk, which has nothing to do with decoupling.
This analysis relies on the DCF model instead of the Capital Asset Pricing Model (CAPM) because the DCF model is the more forward looking model. The beta parameter in the CAPM is normally estimated using three to five years of historical data, but historical data would not capture the effect of a change in risk from the adoption of decoupling. In contrast, the DCF model relies upon the current stock price and a forecast of the future growth of earnings and dividends. We use an average over 15 trading days for the current stock price and security analyst earnings five-year forecasts from Thomson-Reuters.
Second, we calculate the company’s after-tax weighted-average cost of capital (ATWACC) which measures the overall cost of capital for the firm. To control for the effect of differences in capital structure (i.e., differences in financial risk) among the sample companies, we converted estimates of the COE into corresponding estimates of the overall ATWACC.25 The ATWACC measures the cost of capital for the business itself, while the COE estimate represents the cost of equity capital taking into account the equity-holders’ additional financial risk from the company’s level of debt financing. In other words, the ATWACC measures business risk, while the COE is also affected by financial risk. We use the ATWACC in our statistical analysis below to control for differences in financial risk. Of course, the effect of decoupling on the cost of capital would primarily be reflected in the COE, but it could also affect the cost of debt, albeit with a lag.
The ATWACC is a better measure of the relevant cost of capital for our investigation because it takes differences in capital structure among the sample firms into consideration. Firms with
23 In general, the regulator sets the allowed return on equity equal to the estimated cost of equity in order to provide the regulated company a fair opportunity to earn its cost of capital. In some
circumstances the regulator may set the allowed ROE above or below the COE to compensate for differences in risk between the regulated company and the sample companies.
24 Financial risk, as distinct from business risk, is related to the degree to which the company’s assets are
debt financed. The greater the share of debt in the capital structure, the greater the interest that must
be paid out of operating revenues before any shareholder earnings are available.
25 To be specific, the ATWACC is the measure we use; it is a weighted average of both the cost of equity and cost of debt after taking into account the tax deductibility of interest payments. The weights used
in the calculation are the market values of debt and equity in the capital structure. See Chapter 20 of Brealey, Myers and Allen, Op Cit.
14 | Brattle.com
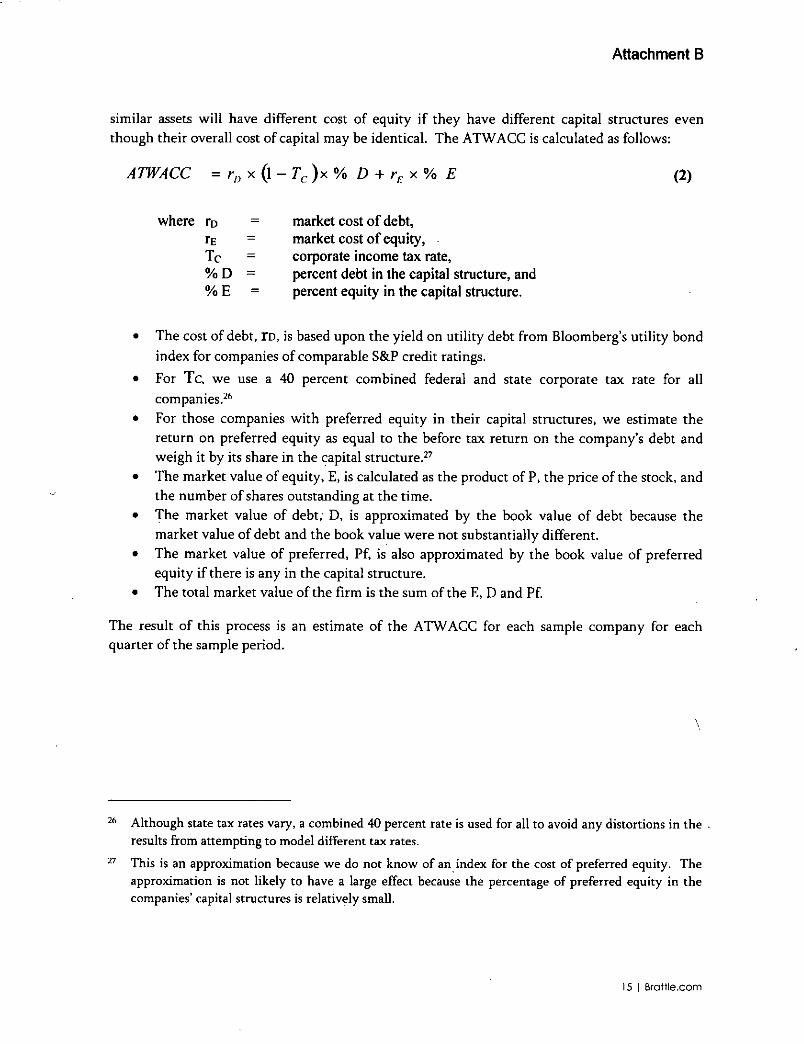
Attachment B
similar assets will have different cost of equity if they have different capital structures even though their overall cost of capital may be identical. The ATWACC is calculated as follows:
ATWACC = rD x (l - Tc )x% D + rF x % E
where ro = market cost of debt,te market cost of equity,Tc = corporate income tax rate.% D = percent debt in the capital structure, ai% E = percent equity in the capital structure.
• The cost of debt, ID, is based upon the yield on utility debt from Bloomberg’s utility bond
index for companies of comparable S&P credit ratings.
• For Tc, we use a 40 percent combined federal and state corporate tax rate for all
companies.26• For those companies with preferred equity in their capital structures, we estimate the
return on preferred equity as equal to the before tax return on the company’s debt and weigh it by its share in the capital structure.27
• The market value of equity, E, is calculated as the product of P, the price of the stock, and the number of shares outstanding at the time.
• The market value of debt, D, is approximated by the book value of debt because the market value of debt and the book value were not substantially different.
• The market value of preferred, Pf, is also approximated by the book value of preferred equity if there is any in the capital structure.
• The total market value of the firm is the sum of the E, D and Pf.
The result of this process is an estimate of the ATWACC for each sample company for each quarter of the sample period.
\
26 Although state tax rates vary, a combined 40 percent rate is used for all to avoid any distortions in the .
results from attempting to model different tax rates.
27 This is an approximation because we do not know of an index for the cost of preferred equity. The
approximation is not likely to have a large effect because the percentage of preferred equity in the companies’ capital structures is relatively small.
15 | Brattle.com

Attachment B
VI. AN EMPIRICAL TEST OF THE EFFECT OF DECOUPLING ON THE COST OF CAPITAL
Finally, we test the effect of decoupling on the overall cost of capital by regression analysis on the time series of our estimated ATWACCs for the sample of holding companies. The dependent variable is the overall cost of capital, i.e., the ATWACC, and the prime explanatory variable is the decoupling index. We use dummy variables to capture the fixed effects for the different holding companies and for different time periods. These are discussed in more detail below in the section on the Regression Model.
Regression Model
We estimate the following regression model:
ATWACCit = p0 + Pi* Decoupling lndexit + p2* QTRt + ft * Companyi + Eit (3)
For the ROE estimate in the ATWACC, we use the single-stage version of the DCF model based upon security analysts’ 5-year forecasts of company-specific earnings growth. QTRt is a dummy variable for the quarter (period t) of the estimate, and Companyi ls a dummy variable for the specific company (company i).
In assembling the data set, we recognize that detecting the effect on decoupling will be affected by a number of factors. The Company dummy variable captures the difference in the average ATWACC by company, which can be due to such factors as the average amount of unregulated assets compared to regulated assets in the holding company or due to differences in regulation in the various states. There are 14 companies in the sample, so there are 13 Company variables. Unlike our previous study of gas LDCs, the 14 company electric sample is not nearly as close to a “pure-play” sample. That is, the electric utility holding companies are larger and more diverse than the gas LDC sample. There may be changes in the risk of unregulated assets that we are not fully capturing.
The QTR dummy variable captures the variation in average ATWACC across companies in a quarter due to differences in interest rates or other economic conditions. Our period covers eight years or 32 quarters so there are 31 QTR variables. The QTR dummy variables are intended to control for macro-economic effects on the average cost of capital for the sample, which is important given that our study covers a very unusual period for the U.S. economy. The U.S. suffered the worst recession since the Great Depression. Interest rates generally declined.
Decoupling could be signaling the company is entering a period of higher risk. Decoupling reduces both the upside and the downside for a regulated company. If a company believes that policies or economic conditions impose additional risk, the company may request decoupling to mitigate rising risk. On the other hand, state policy makers and commissions may seek to impose decoupling to ensure success of EE programs. Perhaps decoupling reduces risk but not enough to offset the increase in risk due to other associated policies or circumstances.
16 | Brattle.com
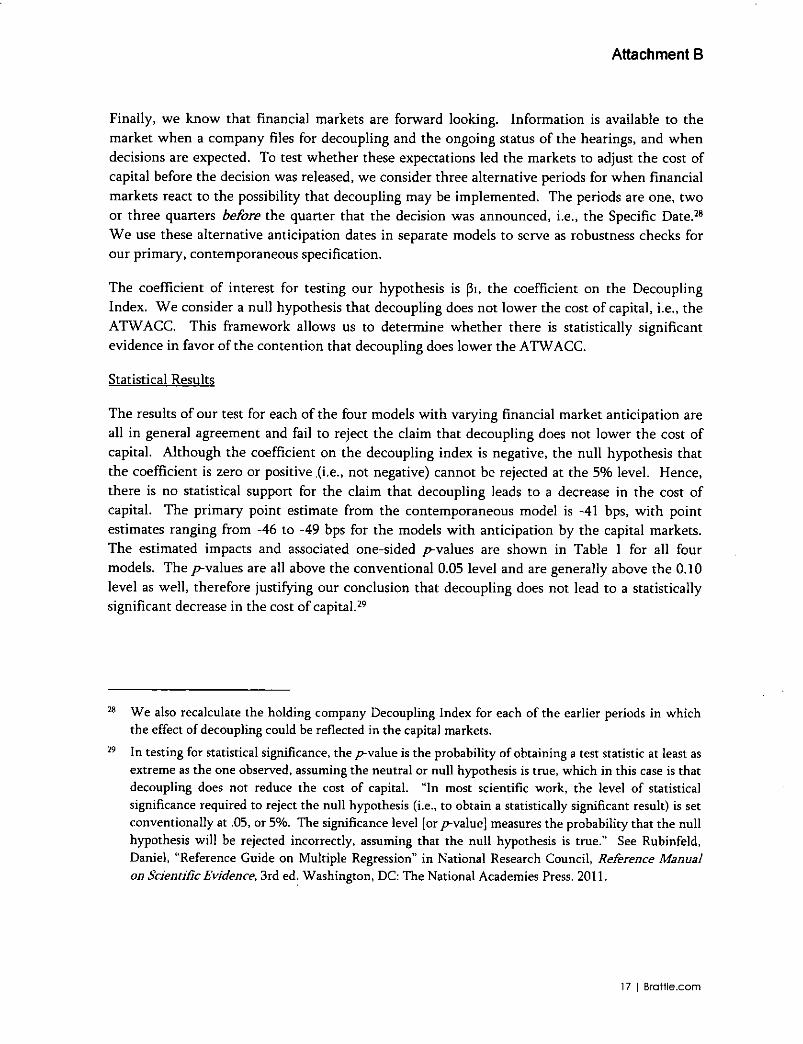
Attachment B
Finally, we know that financial markets are forward looking. Information is available to the market when a company files for decoupling and the ongoing status of the hearings, and when decisions are expected. To test whether these expectations led the markets to adjust the cost of capital before the decision was released, we consider three alternative periods for when financial markets react to the possibility that decoupling may be implemented. The periods are one, two or three quarters before the quarter that the decision was announced, i.e., the Specific Date.28 We use these alternative anticipation dates in separate models to serve as robustness checks for our primary, contemporaneous specification.
The coefficient of interest for testing our hypothesis is |3i, the coefficient on the Decoupling Index. We consider a null hypothesis that decoupling does not lower the cost of capital, i.e., the ATWACC. This framework allows us to determine whether there is statistically significant evidence in favor of the contention that decoupling does lower the ATWACC.
Statistical Results
The results of our test for each of the four models with varying financial market anticipation are all in general agreement and fail to reject the claim that decoupling does not lower the cost of capital. Although the coefficient on the decoupling index is negative, the null hypothesis that the coefficient is zero or positive (i.e., not negative) cannot be rejected at the 5% level. Hence, there is no statistical support for the claim that decoupling leads to a decrease in the cost of capital. The primary point estimate from the contemporaneous model is -41 bps, with point estimates ranging from -46 to -49 bps for the models with anticipation by the capital markets. The estimated impacts and associated one-sided />-values are shown in Table 1 for all four models. The /^values are all above the conventional 0.05 level and are generally above the 0.10 level as well, therefore justifying our conclusion that decoupling does not lead to a statistically significant decrease in the cost of capital.29
28 We also recalculate the holding company Decoupling Index for each of the earlier periods in which the effect of decoupling could be reflected in the capital markets.
29 In testing for statistical significance, the /rvalue is the probability of obtaining a test statistic at least as
extreme as the one observed, assuming the neutral or null hypothesis is true, which in this case is that
decoupling does not reduce the cost of capital. “In most scientific work, the level of statistical
significance required to reject the null hypothesis (i.e., to obtain a statistically significant result) is set
conventionally at .05, or 5%. The significance level [or /rvalue] measures the probability that the null hypothesis will be rejected incorrectly, assuming that the null hypothesis is true.” See Rubinfeld,
Daniel, “Reference Guide on Multiple Regression” in National Research Council, Reference Manual on Scientific Evidence, 3rd ed. Washington, DC: The National Academies Press. 2011.
17 | Brattle.com

Attachment B
In our models, we account for differences in the estimated cost of capital due to economy-wide impacts by quarter and due to company-specific variation through the use of time period-specific and company-specific indicator variables respectively. We also use clustered standard errors to account for correlation in each company’s performance across time.
Table 1: Impact of Electric Decoupling in Basis Points and Test Results:Primary Model and Three Alternative Models of Financial Market Anticipation
Primary
model x1 Qtr.
anticipation2 Qtr.
anticipation
3 Qtr.
anticipation
Estimate -40.88 -46.5 -48.7 -45.9
p-value 0.14 0.12 0.08 0.11
VII. CONCLUSION
Our statistical tests do got support the claim that the cost of capital is reduced by the adoption of decoupling. The results of our models of the effect of decoupling on the cost of capital are consistent and collectively demonstrate that there is no statistically significant evidence of a decrease in the cost of capital following adoption of decoupling. If decoupling policy decreases the cost of capital, these tests strongly suggest that the effect must be relatively small because we are not able to detect it statistically.
As decoupling continues to grow in importance, cases will frequently come up where interveners and commission staff may explore the extent to which decoupling reduces business risk and the utility’s cost of capital. To date, in a small minority of cases in which decoupling was approved, the utility explicitly had their allowed ROE reduced. Our research leads us to conclude that these reductions were implemented without reliable empirical analysis to support the ROE reduction. The results of our analysis show that if such empirical analysis had been done, it is unlikely that it would have supported even the moderate reductions in allowed ROE that were imposed on the utilities.
Although the point estimate of the coefficient on decoupling is negative, this result is not statistically significant (for this sample over this period). Further, there is another reason for the regulator not to simply deduct some amount from the allowed rate of return: the cost of capital comparison samples used in regulatory proceedings are not generally restricted to holding companies without any subsidiaries with decoupling. Whatever effect adoption of decoupling may have on the cost of capital, it will be reflected in the sample results. Reducing the allowed ROE relative to the sample average cost of capital estimate would risk “double counting” the effect of decoupling, because that effect is already captured by the sample estimates.
18 1 Brottle.com

Attachment B
Even if decoupling does not reduce a company’s cost of capital, it is still a beneficial policy if it is effective in removing the utility’s disincentive to pursue conservation programs. Where decoupling is associated with implementing enhanced EE programs (as is frequently the case), adopting a reduction in allowed ROE in essence punishes a utility for pursuing EE programs. If a utility’s management fears an unjustified reduction in the allowed ROE as a result of decoupling, the original disincentive to pursue EE programs is recreated in a new form, and the purpose of decoupling to align the interests of customers, shareholders, and society as a whole may be frustrated.
19 Brattle.com
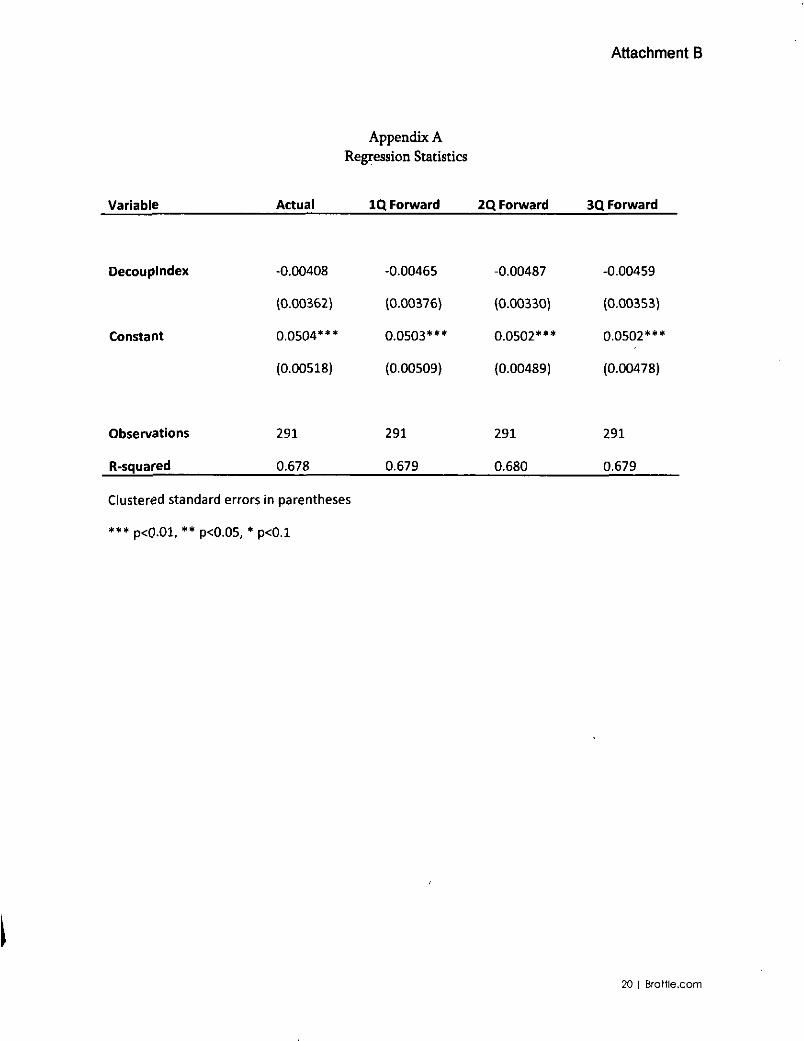
Attachment B
Appendix A Regression Statistics
Variable Actual IQ Forward 2Q Forward 3Q Forward
Decouplndex -0.00408 -0.00465 -0.00487 -0.00459
(0.00362) (0.00376) (0.00330) (0.00353)
Constant 0.0504*** 0.0503*** 0.0502*** 0.0502***
(0.00518) (0.00509) (0.00489) (0.00478)
Observations 291 291 291 291
R-squared 0.678 0.679 0.680 0.679
Clustered standard errors in parentheses
*** p<0-01, ** p<0.05, * p<0.1
20 | Brotlle.com

BEFORE THEPENNSYLVANIA PUBLIC UTILITY COMMISSION
Alternative Ratemaking Methodologies : Docket No. M-2015-2518883
CERTIFICATE OF SERVICE
I hereby certify that I have this day served a true and correct copy of the foregoing document upon the individuals listed below, in accordance with the requirements of 52 Pa. Code § 1.54 (relating to service by a participant).
Service by first class mail, as follows:
John R. EvansOffice of Small Business Advocate Suite 1102, Commerce Building 300 North Second Street Harrisburg, PA 17101
Richard A. KanaskieBureau of Investigation and EnforcementPennsylvania Public Utility CommissionP.O. Box 3265Harrisburg, PA 17105-3265
Tanya J. McCloskeyOffice of Consumer Advocate555 Walnut Street, 5th Floor Forum Place
Harrisburg, PA 17101
RECEIVEDJUL U 2017
PA PUBLIC UTILITY COMMISSION SECRETARY'S BUREAU
Dated: July 31, 2017Tori L. Giesler 'Attorney No. 207742 FirstEnergy Service Company 2800 Pottsville Pike P.O. Box 16001Reading, Pennsylvania 19612-6001 (610) 921-6658 [email protected]

UPSi^extsPay'Aif^UPSiWorldwide Expr^^J^
S'-Mi pSk-i n.g■ .D^o-A .«L.. -i.
mm
LTR
£PAK
□WEIGHT'
ADIMENSIONAL
Weight ..•.IIApplicaWe-
i
LARGEPackage
□
Do not use this en\
i I -•*' v-
.'iO-';
• rv
REFERENCE.NUMBER
A-g\ Ni\
t&ySQO I ' (l\vm cowu ® Tb^j', . blbitl-LL,'
'I; i £n{/(jt'Z$co 1W^€ac\'"^ 'PA
C DELIVERY TO'TELEPHONE
it
^O:-
•O I /*\ IflEPHONE^, -I @Kc^ mau C iti w.tt^ ^
"PA y^iVxiC l. I'Vi.l»'vV'
1Id© Co^VV:.^
^ ^ ^1 pA 1*1.17,(
f *T-010101120CS 6/14 RRD - United Parcel Sefvlce/Loulsville, KY \
___...................... Li—__ t£__ _)
/p,^^fC7l;i0n; etlab"s^d ^Y the Conwntiwi fa. .he Umlicatlon of Certain Rules Relating to InternaCal Carriage by Ai, (t^ 1 (‘fVr.
Warsaw Convention*) and/or j V^^^^ationRegulations:'Diversion contrary to US. law prohibited. 01019511212 f05/t