vibration control of newly designed tool and tool-holder for internal treading of hydraulic...
TRANSCRIPT

International
OPEN ACCESS Journal
Of Modern Engineering Research (IJMER)
| IJMER | ISSN: 2249–6645 | www.ijmer.com | Vol. 4 | Iss. 6| June. 2014 | 46|
Vibration control of newly designed Tool and Tool-Holder for
internal treading of Hydraulic Steering Gear Nut
D. R Kotkar1, Wakchaure V. D2
1, 2 (Mechanical Department (Design),
Assistant Professor Mechanical Department Amrutvahini
College of Engineering, Pune University, Pune, India)
I. Introduction Machining processes are manufacturing methods for ensuring processing quality, usually within
relatively short periods and at low cost. Several machining parameters, such as cutting speed, feed rate, work
piece material, and cutting tool geometry have significant effects on the process quality. Many researchers have
studied the impact of these factors. The cutting tool overhang affects the surface quality, especially during the
internal turning process, but this has not been reviewed much [9].
Achieve the desired surface quality of the work piece. For the internal threading operation in
particular, a longer tool overhang may be required depending on the geometry of the work piece. In this study,
we investigate the effects of changes in the tool –holder over hang and cutting parameter on the tool and tool-
holder vibration which will directly effect on both surface quality of the work piece as well as tool wear (tool
life), during the internal threading operation. Because the tool holder is subject to bending and buckling
depend on effect point of the cutting force (Axial and tangential force), cutting tool displaced. This situation
has negative effects on the surface quality as shown in Fig.1 [2]
Fig 1: Tool holder undergoing deflection, δ due to the Axial and tangential force
Abstract: In the internal turning operation, vibration is a frequent problem, which affects the result of
the machining and in particular the surface finish. There will be several different actions to consider
when solving this problem. Reducing the process parameters is one such consideration; however, this
could have a negative effect on productivity. Our focus, therefore, will be easy hands on
recommendations for productive solutions and easy to use products. In the internal turning process, the
importance of machining parameter choice is increased, as it controls the surface quality required. It is
appropriate to keep the tool overhang as short as possible; however, a longer tool overhang may be
required depending on the geometry of the work piece and when using the hole-turning process in
particular. In this study, we investigate the effects of changes in the tool–holder over hang and cutting
parameter on the vibration which will directly effect on surface quality of the work piece, during the
internal threading operation. To increase the buoyancy and reliability of the experiments, a full Taguchi
L9 experimental design was used. Experimental data controlled were tested with analysis of variance
(ANOVA) to understand the influences of the cutting parameter along with changes in tool-Holder
overhang. Taguchi method L9 experimental design has shown that the depth of cut with changes in tool-
holder overhang has significant role to play in producing the surface roughness followed by constant
feed rate. The Cutting speed has lesser role on surface roughness from the tests.
Keywords: ANOVA, Cutting parameter, Surface roughness, Tool- Holder Overhang.

Vibration control of newly designed Tool and Tool-Holder for internal treading of Hydraulic
| IJMER | ISSN: 2249–6645 | www.ijmer.com | Vol. 4 | Iss. 6| June. 2014 | 47|
The determination of optimal cutting condition and tool-holder overhang for specified surface
roughness and accuracy of product are the key factors in the selection of machining process. Internal threading
operations are associated with serious vibration-related problems. To reduce the problem of vibration and
ensure that the desired shape and tolerance are achieved, extra care must be taken with production planning
and in the preparations for the machining of a work-piece. A thorough investigation of the vibrations involved
is therefore an important step toward solving the problem. In internal threading operation, the performances of
cutting tools are depending on a few cutting conditions and parameters. The proper selection of depth of cut
has direct effect to the product surface roughness. Internal turning process by maximizing cutting speed and
depth of cut will optimize the cutting process and minimize the production cost. The tool life, machined
surface integrity and cutting forces are directly dependent on cutting parameters and will determine the cutting
tool performances. The study of surface roughness form will resolve the characteristic and phenomena
happening during the machining process. The questions to be answered at the end of the study are how the tool
overhangs length and diameter influences the surface roughness during internal threading operation. The study
was carried out to investigate the effects of cutting tool overhang and cutting parameter on the surface quality
in internal threading processes. Because the tool holder is subject to bending and buckling depend on effect
point of the cutting force (Axial and tangential force), cutting tool displaced.(1) To evaluate the effects of
different process parameter on internal threading operation.(2) To develop a mathematical model for
predicting surface roughness for internal threading operation by using design of experiment approach.(3)
Study the microstructure of the work piece internal threading operation. Machining operations tend to leave
characteristic evidence on the machined surface [10].
The Taguchi process helps to select or to determine the optimum cutting conditions with proper tool-
holder overhang for internal threading operation. Many researchers developed many mathematical models to
optimize the cutting parameters to get lowest surface roughness by internal turning process. The variation in
the material hardness, alloying elements present in the work piece material and other factors affecting surface
finish and tool wear [4].
II. System Description And Design
2.1. MATERIAL SELECTION
2.1.1 Tool holder: - 20MnCr
Table 2.1.1.a):-Chemical Composition of Tool Holder 20MnCr5.
Fig 2.1.1.a) Drawing of Tool Holder
2.1.2 TOOL: - High speed steel (HSS)
Grade
C
%
Si
%
Mn% Cr% S% Other
20MnCr5 0.20 0.25 1.25 1.15 0.035 Pb
Grade C
%
Vanadium
%
Tungsten
%
Cr%
HSS 0.7 1.00 18.00 4.00

Vibration control of newly designed Tool and Tool-Holder for internal treading of Hydraulic
| IJMER | ISSN: 2249–6645 | www.ijmer.com | Vol. 4 | Iss. 6| June. 2014 | 48|
Fig 2.1.2.a) Drawing of HSS Tool
2.1.3 WORK PIECE: - 17CrNimo6
Mechanical Properties of 17CrNiMo6:-
Fig 2.1.3.a) Drawing of Work piece
2.2. DESIGN OF EXPERIMENT
It is methodology based on statistics and other discipline for arriving at an efficient and effective
planning of experiments with a view to obtain valid conclusion from the analysis of experimental data. Design
of experiments determines the pattern of observations to be made with a minimum of experimental efforts. To
be specific Design of experiments (DOE) offers a systematic approach to study the effects of multiple variables
/ factors on products / process performance by providing a structural set of analysis in a design matrix. More
specifically, the use of orthogonal Arrays (OA) for DOE provides an efficient and effective method for
determining the most significant factors and interactions in a given design problem. [11]
Table No.2.2: Level of Experimental Parameters
2.3 EXPERIMENTAL SETUP
The experimental setup and layout diagram for this project are as shown in figure 8 and8.1
respectively. It includes a MKU-8 CNC turning lathe.
Grade C% Cr Mn% Si% P% S% Ni
17CrNiM06 0.15-0.21 1.50-1.8 0.50-0.90 0.4 0.025 0.015 1.40-1.7
Parameter Level I Level II Level III
Cutting speed 250 300 350
D.O.C 0.16 0.18 0.20
Tool holder Overhang 3.54 3.95 4.37

Vibration control of newly designed Tool and Tool-Holder for internal treading of Hydraulic
| IJMER | ISSN: 2249–6645 | www.ijmer.com | Vol. 4 | Iss. 6| June. 2014 | 49|
Fig 2.3 EXPERIMENTAL SETUP
In this study, I selected the Speed, DOCs and tool overhang as variable experimental parameters and
keeping feed rate constant and measured the surface roughness of the work piece. Our experimental studies
were carried using a CNC turning Lathe. As the cutting tool, we used HSS and Tool-Holder. The work pieces
used in the experiments were 40 mm (External) and 32 (internal) in diameter and Length 45mm. The
Company provided information about selection of the work piece material which is 17CrNiMo6, The tool
overhang lengths were 85, 95 and 105 mm. The DOCs we selected were 0.16, 0.18and 0.20 mm. The cutting
speed was selected as 250, 300 and 350 rpm and constant feed rate 14±0.01 mm/rev (for internal Threading
pitch is the feed rate). The external turning processes were carried out using the anticipated parameters. The
processes can be seen Fig 8.1.
A Carl Zeiss Surface Roughness measuring instrument show in Figure 3.4 was used to process the
measured profile data. The Carl Zeiss Surface Roughness measuring instrument is capable of evaluating
surface textures including waviness with the variety of parameters according to various digitally/graphically on
the touch panel and output to built-in printer. The stylus of the Carl Zeiss Surface Roughness measuring
instrument detector unit traces the minute irregularities of the work piece surface. Surface roughness is
determined from the vertical stylus displacement produced during the detector traversing over the surface
irregularities and the measuring setup shows in Fig 4. The Lathe Tool VM=82 Vibrometer has been designed
so that sensor can be directly fixed on to the tool- Holder. The dynamometer can measure 2 forces in mutually
perpendicular directions, i.e. Axial and Tangential. Cutting condition need to setup in this experiment, to
make sure all the experiment run follow according the data given. A fractional factorial is selected so that all
intersection between the independent variables could be investigated. The dependent variable is the resulting
first 28 cut surface roughness. The level was selected to cover the normal cutting operation [6]
2.4 FINAL EXPERIMENTATION
Design of Experiment (DOE) approach is selected for investigation effect of varying controllable
parameter and Overhang of Tool-Holder on acceleration at three levels, since Taguchi design of 9 runs is
efficient to study the effect of two or more factors these three levels of factor are referred as low, intermediate
& high level. In this experiment amplitude of vibration and surface roughness are measured with and without
damping pad.

Vibration control of newly designed Tool and Tool-Holder for internal treading of Hydraulic
| IJMER | ISSN: 2249–6645 | www.ijmer.com | Vol. 4 | Iss. 6| June. 2014 | 50|
Table 2.4.1 Observation Table
III. Results And Discussion
3.1 EFFECT AND COMPARISONS OFWITH & WITHOUT SLEEVE.
The vibration phenomenon for various cutting condition has been analyzed using Lab VIEW software.
The plan of the experiment was developed not only to assess the effect of cutting speed, depth of the cut and
overhang but also to study the effect of damping pad (sleeve) on the cutting tool vibration, surface roughness.
Table 8.3 illustrates the experimental result of vibration in both tangential and axial cutting direction. After
analysis of the vibration, sleeve is provided to tool-Holder for fitting into the turret of the CNC Lathe. Now the
same experiment was carried out for various cutting condition and with and without sleeve, also corresponding
cutting tool vibration and surface roughness are measured.
1 2 3 4 5 6 7 8 9
Series 1 1.51 1.74 2.55 1.94 2.85 2.09 2.55 2.31 2.4
Series 2 1.24 1.55 2.27 1.64 2.1 1.77 2.05 1.95 1.97
1.511.74
2.55
1.94
2.85
2.09
2.552.31 2.4
1.241.55
2.27
1.64
2.11.77
2.05 1.95 1.97
0
0.5
1
1.5
2
2.5
3
RM
S V
alu
e
Readings
Graph 3.1.1 Comparison of with sleeve & without sleeve Base on Axial Vibration
From Graph 3.1.1 it is observed that after using sleeve as damping pad, axial acceleration of machine
tool is get reduced.
Sr.No C.S D.O.C L/D Amplitude of Acceleration of Tool-Holder
in m/s2
Surface Roughness
Ra in µm
Axial
direction(R.M.S))
Tangential
direction (R.M.S)
Without
sleeve
With
Sleeve
Without
sleeve
With
sleeve
Without
sleeve
With
sleeve
1 250 0.16 3.54 1.51 1.24 0.34 0.26 3.19 3.08
2 250 0.18 3.95 1.74 1.55 0.37 0.28 3.22 3.12
3 250 0.20 4.37 2.55 2.27 0.44 0.31 3.88 3.35
4 300 0.16 3.95 1.94 1.64 0.33 0.27 3.46 3.32
5 300 0.18 4.37 2.85 2.10 0.54 0.36 4.56 3.39
6 300 0.20 3.54 2.09 1.77 0.49 0.29 3.37 3.27
7 350 0.16 4.37 2.55 2.05 0.55 0.39 4.77 3.92
8 350 0.18 3.54 2.31 1.95 0.51 0.32 3.86 3.76
9 350 0.20 3.95 2.40 1.97 0.48 0.31 4.02 3.89

Vibration control of newly designed Tool and Tool-Holder for internal treading of Hydraulic
| IJMER | ISSN: 2249–6645 | www.ijmer.com | Vol. 4 | Iss. 6| June. 2014 | 51|
1 2 3 4 5 6 7 8 9
Series 1 0.34 0.37 0.44 0.33 0.54 0.49 0.55 0.51 0.48
Series 2 0.26 0.28 0.31 0.27 0.36 0.29 0.39 0.32 0.31
0.340.37
0.44
0.33
0.540.49
0.550.51
0.48
0.26 0.280.31
0.27
0.36
0.29
0.39
0.32 0.31
0
0.1
0.2
0.3
0.4
0.5
0.6
RM
S V
alu
e
Readings
Graph 3.1.2 comparison of with sleeve & without sleeve base on tangential accretion
From Graph 3.1.2 it is observed that after using sleeve, tangential acceleration of machine tool is get
reduced.
1 2 3 4 5 6 7 8 9
Series 1 3.19 3.22 3.88 3.46 4.56 3.37 4.77 3.86 4.02
Series 2 3.08 3.12 3.35 3.32 3.39 3.27 3.92 3.76 3.89
3.19 3.22
3.883.46
4.56
3.37
4.77
3.86 4.02
3.08 3.12 3.35 3.32 3.39 3.27
3.92 3.76 3.89
0
1
2
3
4
5
6
Ro
ugh
ne
ss
Readings
Graph 3.1.3 comparison of with sleeve & without sleeve base on surface roughness.
From Graph 3.1.3 it is observed that after using sleeve, surface roughness of work piece is get
reduced.
3.2 ANALYSIS OF RESULT
3.2.1 Introduction to Taguchi Method:-
The task of developing a methodology to meet the challenge was assigned to Dr. Genichi Taguchi,
who at that time was a manager in charge of developing certain telecommunications products at the electrical
Communications Laboratories (ECL) of Nippon Telephone and Telegraph Company (NIT).
The two major tools used in taguchi method are
a. Signal to Noise ratio, which measure quality.
b. Orthogonal array, which are used to study many design parameters simultaneously.
Vibration control of newly designed Tool and Tool-Holder for internal treading of Hydraulic
| IJMER | ISSN: 2249–6645 | www.ijmer.com | Vol. 4 | Iss. 6| June. 2014 | 52|
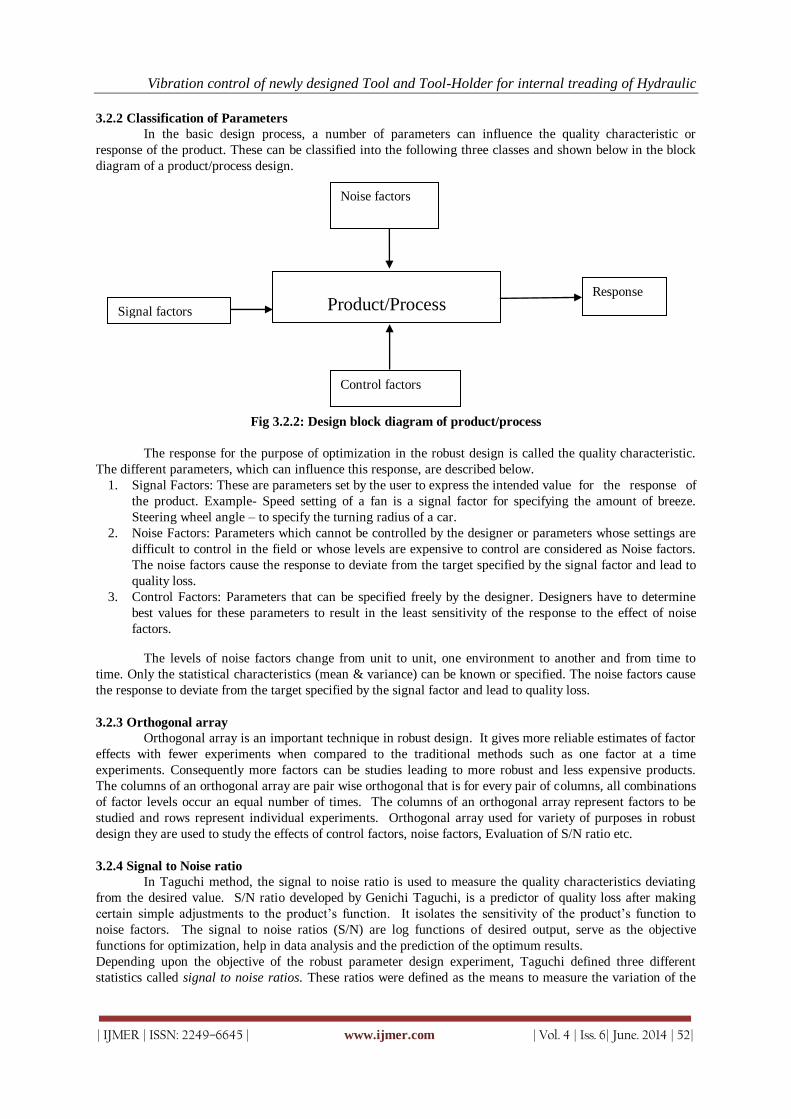
3.2.2 Classification of Parameters
In the basic design process, a number of parameters can influence the quality characteristic or
response of the product. These can be classified into the following three classes and shown below in the block
diagram of a product/process design.
Fig 3.2.2: Design block diagram of product/process
The response for the purpose of optimization in the robust design is called the quality characteristic.
The different parameters, which can influence this response, are described below.
1. Signal Factors: These are parameters set by the user to express the intended value for the response of
the product. Example- Speed setting of a fan is a signal factor for specifying the amount of breeze.
Steering wheel angle – to specify the turning radius of a car.
2. Noise Factors: Parameters which cannot be controlled by the designer or parameters whose settings are
difficult to control in the field or whose levels are expensive to control are considered as Noise factors.
The noise factors cause the response to deviate from the target specified by the signal factor and lead to
quality loss.
3. Control Factors: Parameters that can be specified freely by the designer. Designers have to determine
best values for these parameters to result in the least sensitivity of the response to the effect of noise
factors.
The levels of noise factors change from unit to unit, one environment to another and from time to
time. Only the statistical characteristics (mean & variance) can be known or specified. The noise factors cause
the response to deviate from the target specified by the signal factor and lead to quality loss.
3.2.3 Orthogonal array
Orthogonal array is an important technique in robust design. It gives more reliable estimates of factor
effects with fewer experiments when compared to the traditional methods such as one factor at a time
experiments. Consequently more factors can be studies leading to more robust and less expensive products.
The columns of an orthogonal array are pair wise orthogonal that is for every pair of columns, all combinations
of factor levels occur an equal number of times. The columns of an orthogonal array represent factors to be
studied and rows represent individual experiments. Orthogonal array used for variety of purposes in robust
design they are used to study the effects of control factors, noise factors, Evaluation of S/N ratio etc.
3.2.4 Signal to Noise ratio
In Taguchi method, the signal to noise ratio is used to measure the quality characteristics deviating
from the desired value. S/N ratio developed by Genichi Taguchi, is a predictor of quality loss after making
certain simple adjustments to the product’s function. It isolates the sensitivity of the product’s function to
noise factors. The signal to noise ratios (S/N) are log functions of desired output, serve as the objective
functions for optimization, help in data analysis and the prediction of the optimum results.
Depending upon the objective of the robust parameter design experiment, Taguchi defined three different
statistics called signal to noise ratios. These ratios were defined as the means to measure the variation of the
Product/Process Response
Signal factors
Noise factors
Control factors

Vibration control of newly designed Tool and Tool-Holder for internal treading of Hydraulic
| IJMER | ISSN: 2249–6645 | www.ijmer.com | Vol. 4 | Iss. 6| June. 2014 | 53|
response with respect to the noise factors .There are three forms of signal to noise (S/N) ratio that are common
interest for optimization of static problems.
Smaller-the-better expressed as
η = -10Log [mean of sum of squares of measured data]
This is usually the chosen S/N ratio for all the undesirable characteristics like defects for which the ideal value
is zero. When an ideal value is finite and its maximum or minimum value is then the difference between the
measured data and the ideal value is expected to be as small as possible. Thus, the generic form of S/N ratio
becomes,
η = -10Log [mean of sum of squares of {measured-ideal}]
Larger-the-better expressed as
η = -10Log [mean of sum of squares of reciprocal of measured data]
Nominal-the-better expressed as
η = -10 Log [square of mean/variance]
3.3 Analysis of variance
The purpose of analysis of variance (ANOVA) is to investigate which design parameters significantly
affect the quality characteristic. This is accomplished by separating the total variability of the signal to noise
ratios, which is measured by the sum of the squared deviations from the total mean S/N ratio, into
contributions by each of the design parameters and error. [9]
The S/N ratio is evaluated using the equation.
S/N ratio = -10Log (MSD)
The effect of parameter level is defined as the deviation it causes from the overall mean. Hence as a first step,
calculating the overall mean value of S/N ratio for the experimental region defined by the factor levels in Table
6.3.
Mean= = ( + +….. )
The signal to noise ratios nine set of experiments shown in Table 6.The mean and the S/N ratios are.
*S/N Ratio= -10Log(n)²
*Sum of square due to parameter A=
[(number of experiments at level A1)x (mA1-m)]+
[(number of experiments at level A2)x (mA2-m)]
+[(number of experiments at level A3)x (mA3-m)]. Where m= medium of S/N Ratio
3.3.A) Average S/N for different parameter levels for axial acceleration
Table 3.3.A.1: Average S/N for different parameter levels Optimum setting A1 B1 C1
Table 3.3.A.2: ANOVA for S/N ratio of axial acceleration
Symbol DOF Parameters Sum of squares Mean square F Contribution (%)
A. 2 CS 4.4121 2.206
29.21
B. 2 DOC 5.3341 2.66 1.20 35.31
C. 2 L/D 5.3578 2.67 1.21 35.47
Error 2 4.4121
Total 6 15.1040
Error 2 4.4121 2.205
Parameters Levels
1 2 3
A CS -4.264* -5.233 -5.974
B DOC -4.133* -5.350 -5.989
C L/D -4.209* -4.663 -5.959
Vibration control of newly designed Tool and Tool-Holder for internal treading of Hydraulic
| IJMER | ISSN: 2249–6645 | www.ijmer.com | Vol. 4 | Iss. 6| June. 2014 | 54|
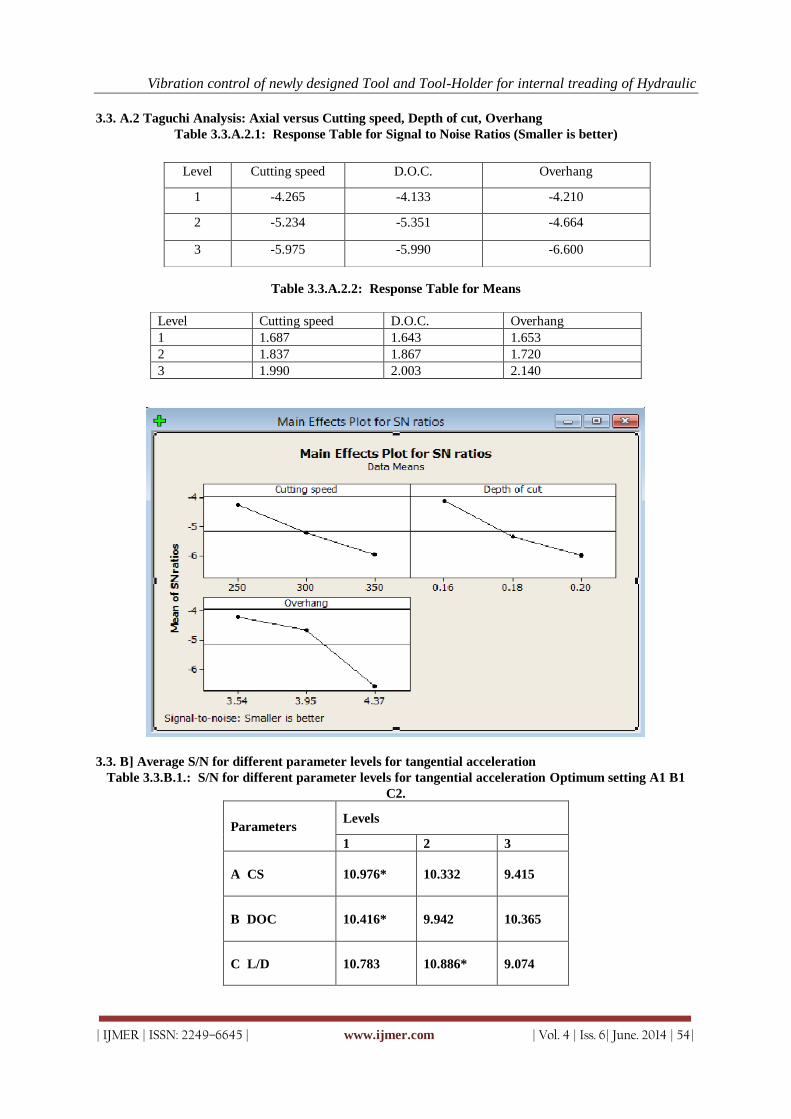
3.3. A.2 Taguchi Analysis: Axial versus Cutting speed, Depth of cut, Overhang
Table 3.3.A.2.1: Response Table for Signal to Noise Ratios (Smaller is better)
Table 3.3.A.2.2: Response Table for Means
3.3. B] Average S/N for different parameter levels for tangential acceleration
Table 3.3.B.1.: S/N for different parameter levels for tangential acceleration Optimum setting A1 B1
C2.
Parameters Levels
1 2 3
A CS 10.976* 10.332 9.415
B DOC 10.416* 9.942 10.365
C L/D 10.783 10.886* 9.074
Level Cutting speed D.O.C. Overhang
1 -4.265 -4.133 -4.210
2 -5.234 -5.351 -4.664
3 -5.975 -5.990 -6.600
Level Cutting speed D.O.C. Overhang
1 1.687 1.643 1.653
2 1.837 1.867 1.720
3 1.990 2.003 2.140

Vibration control of newly designed Tool and Tool-Holder for internal treading of Hydraulic
| IJMER | ISSN: 2249–6645 | www.ijmer.com | Vol. 4 | Iss. 6| June. 2014 | 55|
Table 3.3.B.2: ANOVA for S/N ratio Of Tangential acceleration
Symbol DOF Parameters Sum of
squares
Mean
square F
Contribution
(%)
A. 2 CS 3.6923 1.8461 9.0896 39.35
B. 2 DOC 0.4058 0.2031
4.32
C. 2 L/D 5.2838 2.6419 13.00 56.31
Total 6 9.3819
Error 2 0.4058 0.2031
3.3. B.3 Taguchi Analysis: Tangential versus Cutting speed, Depth of cut, Overhang
Table 3.3.B.3: Response Table for Signal to Noise Ratios Smaller is better
Table 3.3.B.4: Response Table for Means
3.3. C] Average S/N for different parameter levels for surface roughness. Table 3.3.C.1 Average S/N for different parameter levels for surface roughness Optimum setting A1 B2
C1
Parameters Levels
1 2 3
A CS -10.051* -10.438 -11.722
B DOC -10.686 -10.663* -10.862
C L/D -10.521* -10.701 -10.989
Table 3.3.C.2: ANOVA for S/N ratio of surface roughness
Level Cutting speed D.O.C. Overhang
1 10.977 10.417 10.783
2 10.333 9.943 10.867
3 9.416 10.366 9.075
Level Cutting speed D.O.C. Overhang
1 0.2833 0.3067 0.2900
2 0.3067 0.3200 0.2867
3 0.3400 0.3033 0.3533

Vibration control of newly designed Tool and Tool-Holder for internal treading of Hydraulic
| IJMER | ISSN: 2249–6645 | www.ijmer.com | Vol. 4 | Iss. 6| June. 2014 | 56|
3.3. C.3 Taguchi Analysis: Roughness versus cutting speed, Depth of cut, Overhang
Table 3.3.B.3: Response Table for Signal to Noise Ratios Smaller is better
3.3.B.4 Table : Response Table for Means
IV. Results And Discussions The calculated S/N ratio corresponding to nine set of experiments given in Observation Table. The
average S/N ratios of parameter at each level for parameters of axial acceleration are shown in Table 9.2.A.
Optimum setting for axial acceleration by Taguchi method is A1,B1,C1 (Cutting speed, depth of cut, L/D).
Having values (-4.204,-4.133,-4.209). By ANOVA percentage contribution for A (cutting speed) is 29.21%, for
B (depth of cut) is 35.31%, for C (L/D) is 35.47%. The average S/N ratios of parameter at each level for
parameters of Tangential acceleration are shown in Table 9.2.E.Optimum setting for Tangential acceleration
by taguchi method is A1,B1,C2 (Cutting speed, depth of cut, L/D). Having values (10.976,10.416,10.886). By
ANOVA percentage contribution for A (cutting speed) is 39.35%, for B (depth of cut) is 4.32%, for C (L/D) is
56.31%.
Symbol DOF Parameters Sum of
squares
Mean
square F
Contribution
(%)
A. 2 CS 4.597 2.2973 9.9149 90
B. 2 DOC 0.1279 0.0639
2.52
C. 2 L/D 0.3356 0.1678 0.7242 6.63
Total 6 5.0605
Error 4 0.4635 0.2317
Level Cutting speed D.O.C. Overhang
1 -10.05 -10.69 -10.52
2 -10.44 -10.66 -10.70
3 -11.72 -10.86 -10.99
Level Cutting speed D.O.C. Overhang
1 3.183 3.44 3.370
2 3.327 3.423 3.443
3 3.857 3.503 3.553

Vibration control of newly designed Tool and Tool-Holder for internal treading of Hydraulic
| IJMER | ISSN: 2249–6645 | www.ijmer.com | Vol. 4 | Iss. 6| June. 2014 | 57|
The average S/N ratios of parameter at each level for parameters of surface Roughness are shown in
Table 9.2.I.Optimum setting for Roughness by taguchi method is A1,B2,C1 (Cutting speed, depth of cut, L/D).
Having values (-10.051,-10.663,-10.521). By ANOVA percentage contribution for A (cutting speed) is 90%,
for B (depth of cut) is 2.52%, for C (L/D) is 6.63%.
As we know that tangential acceleration is much lesser than axial acceleration. Hence it can be
neglected for overall optimum selection of parameters. Value of cutting speed is same for all above which is
250 rpm. Value of D.O.C. has large contribution in axial acceleration than others. Hence D.O.C. is selected for
axial acceleration, which is (B1) 0.16mm. Value for L/D Ratio has large contribution in axial acceleration as
tangential acceleration has been neglected. Hence the value of L/D ratio is 3.54.
4.1 Conclusion of Taguchi Method In this study, the optimum parameter for high percentage yield was selected by varying parameters
through Taguchi method. With an orthogonal array (L-9) a total set of nine experiments having three
parameters each at three levels indicated that the Taguchi method was an efficient method of determining the
optimum parameters for internal threading of hydraulic steering gear nut. ANOVA helped to estimate the
contribution of each parameter in Axial, Tangential Acceleration & Roughness values.
4.2 Conclusions & Recommendations for Future
4.2.1 Conclusions From Analytical Calculations, Graphs, and Taguchi Analysis conclusions Interpreted are as follows:
By using passive Damping (sleeve) machine tool vibration is minimize.
Sleeve having good damping capacity which results into less vibration, less average tool temperature
and good surface finish
Overhang is major influencing parameter for combine axial acceleration and surface roughness.
Cutting speed and depth of cut are closely correlated to axial acceleration and surface roughness.
4.2.2 Recommendations for Future In many machining process vibration is one of the harmful factor which is minimize by controlling
cause parameter and using damper.
Passive damping:
Passive damping is use for present work, but damping capacity of passive damper is always constant
due to constant strength value .In machining processes intensity of vibration is varying but due to limitation of
vibration absorbing capacity proper damping is not possible. To achieve proper damping, needs a proper
damper which having varying damping capacity, this can be achieved by using active damping. For active
damping damper of MR fluid can be use, of which strength will change with single send by controller.
Controller takes signal from sensor which mounts on machine tool.
Tool-Holder Overhang:
The design and dimensions of the component decide the diameter and length of the Tool-Holder for
internal machining operation. Internal turning is very sensitive to vibration. Minimize the tool overhang and
select the largest possible tool size in order to obtain the best possible stability and accuracy.
REFERENCES [1] “E.J.A. Armarego, R.H. Brown, The Machining of Metals, Prentice-.Hall, Englewood Cliffs, (1969), PP 122-134.
[2] “Zhang, Bonifacio, A.E. Diniz, Correlating tool wear, tool life, surface.roughness, and vibration in finish urning
with coated carbide tools,Wear (1994),PP 137–144.
[3] “Industrial management &engineering” by A. K. Bewoor, PP. 50-26.
[4] “Adams Tooling structure: interface between cutting edge and machine tool Annals of the …..CIRP (2000), PP
591–634.
[5] M.B. Cai, et al., Crack initiation in relation to the tool edge radius and cutting conditions .in nanoscale cutting of
silicon, International Journal of Machine Tools and Manufacture …. (2007),PP 562–569.
[6] D. Zhang, D. Chen, Optimization of cutting parameters in vibration tapping of titanium ….alloys, Acta Aeronautica
et Astronautica Sinica 13 (10) (1992).PP (B571-B573), PP. 6-8.
[7] “Metal cutting machine tool’s” by G.Thirupati Reddy, 3rd edition.v, PP. 1-15.
[8] “Metal cutting machine tool’s” by G.Thirupati Reddy, 3rd edition, PP. 25-45.
[9] Sandvik Silent tools - user´s guide.
[10] Sandvik internal threading - user´s guide.