vibration isolation for coriolis mass-flow meters · pdf filethe working principle of a cmfm...
TRANSCRIPT

Abstract: A Coriolis Mass-Flow Meter (CMFM) is an active device based on the Coriolis force principle for direct mass-flow measurements, with high accuracy, range-ability and repeatability. The working principle of a CMFM is as follows: a fluid conveying tube is actuated to oscillate at a low ampli-tude, whereby a resonance frequency is used to minimise the amount of re-quired energy. A fluid-flow in the vibrating tube induces Coriolis forces, which are proportional to the mass-flow, and affect the tube motion resulting in a change of the mode shape. External vibrations create additional components in the CMFM sensor signals and such additional components can introduce a measurement error. This thesis presents a comprehensive analysis on how narrow-band vibration isolation of more than 40 dB can be achieved. The active vibration isolation control is successfully implemented in a design of a CMFM, for the first time.
Bert van de Ridder was born on 22nd of April, 1987 in Putten, The Netherlands. After he finished second-ary school in 2005, he started with Mechanical Engi-neering at the University of Twente. He finished his Bachelor of Science cum laude in 2008. He contin-ued his study in the group of Mechanical Automation to obtain the Master of Science in 2011. In the same group he performed his PhD research and finished it in 2015. The results of the research project are pre-sented in this thesis.
ISBN 978-90-365-3874-9
Vib
ration
Isolatio
n fo
r Co
riolis M
ass-F
low
Me
ters
L. va
n d
e R
idd
er
Vibration Isolation for Coriolis Mass-Flow Meters
Bert van de RidderPhD Thesis
act
act
ss
aaaxy
z
Invitation
to the public defence of my PhD thesis, entitled
Vibration Isolation for Coriolis Mass-Flow
Meters
on Wednesday, June 24th 2015 at 16:30 in the prof.
dr. G. Berkhoff room, building Waaier of the University of Twente.
After the defence, there will be a reception.
Bert van de Ridder+31 (0)6 1654 0863
Paranymphs:
Gerrald GelderblomHenk-Jan van de Ridder


VIBRATION ISOLATION FORCORIOLIS MASS-FLOW METERS
L. (BERT) VAN DE RIDDER

Composition of the Graduation Committee:
Chairman and secretary:
prof.dr. G.P.M.R. Dewulf University of Twente
Promotor:
prof.dr.ir. A. de Boer University of Twente
Co-promotors:
dr.ir. J. van Dijk University of Twentedr.ir. W.B.J. Hakvoort University of Twente & DEMCON Advanced Mechatronics
Members:
prof.dr.ir. M. Verhaegen Delft University of Technologyprof.dr.ir. A. Preumont Université Libre de Bruxellesprof.dr.ir. J.C. Lötters University of Twente & Bronkhorst High-Tech BVprof.dr.ir. H. van der Kooij University of Twente & Delft University of Technologyprof.dr.ir. L. Abelmann University of Twente & KIST Europe
This work was performed at the Laboratory of Mechanical Automation and Mechatronics,Department of Mechanics, Solids, Surfaces & Systems (MS3), Faculty of Engineering Tech-nology, University of Twente, P.O. Box 217, 7500 AE Enschede, the Netherlands.
This research was financed by the support of the Dutch association Pieken in de Delta Pro-gramme, project PID092051, of the Dutch Ministry of Economic Affairs.
On the cover: a SPACAR model of a CMFM and on the back a functional model of a CMFMwith integrated active vibration control.
Vibration Isolation for Coriolis Mass-Flow MetersLubbert van de RidderEmail: [email protected] Thesis, University of Twente, Enschede, the Netherlands
ISBN 978-90-365-3874-9DOI 10.3990/1.9789036538749Copyright © June 2015 by L. van de Ridder, the NetherlandsPrinted by: Ipskamp Drukkers - Enschede
VIBRATION ISOLATION FORCORIOLIS MASS-FLOW METERS
DISSERTATION
to obtainthe degree of doctor at the University of Twente,
on the authority of the rector magnificus,prof.dr. H. Brinksma,
on account of the decision of the graduation committee,to be publicly defended
on Wednesday the 24th of June, 2015 at 16:45
by
LUBBERT VAN DE RIDDER
born on the 22nd of April, 1987in Putten, the Netherlands

This thesis has been approved by the promotor
prof.dr.ir. A. de Boer
and the assistant-promotors
dr.ir. J. van Dijkdr.ir. W.B.J. Hakvoort

Summary
A Coriolis Mass-Flow Meter (CMFM) is an active device based on the Coriolis force prin-ciple for direct mass-flow measurements, with high accuracy, range-ability and repeatability.The working principle of a CMFM is as follows: a fluid conveying tube is actuated to oscil-late at a low amplitude, whereby a resonance frequency is used to minimise the amount ofrequired energy. A fluid-flow in the vibrating tube induces Coriolis forces, which are propor-tional to the mass-flow, and affect the tube motion resulting in a change of the mode shape.Measuring the tube displacement in such a way that the change of its mode shape is deter-mined, allows calculating the mass-flow.
External vibrations create additional components in the CMFM sensor signals and suchadditional components can introduce a measurement error. For low flows (< 1 kg/h), theCoriolis force induced motion is relatively small compared to motions induced by externalvibrations, thus CMFMs designed to be sensitive to low flows are rather sensitive to externalvibrations.
Mainly external vibrations around the meter’s drive and Coriolis frequencies produce ameasurement error, regardless of the phase detection algorithm used. A model-based, quanti-tative estimation of the expected mass-flow error in response to external vibrations is obtainedfrom the transmissibility function of external vibrations to the tube displacement measure-ment.
Narrow-band vibration isolation is required to improve the sensor performance. In thisthesis the sensitivity to external vibrations is reduced, using passive and active vibration iso-lation solutions. Passive vibration isolation consists of a mass-spring-damper system betweenan excitation source and an influenced receiver (e.g. the floor and the measurement device).
The performance is insufficient, because the suspension frequency is limited by the max-imum stress in the connection tubes and a maximum allowable sag due to gravity. Thereforethe passively suspended stage is extended with voice-coil actuators and absolute motion sen-sors to apply active vibration isolation control. Feedback and feed-forward control algorithmsare compared. Increased narrow-band vibration attenuation is achieved using loop shapingfeedback control. Alternatively, an innovative feed-forward strategy is used, where by theparameters, which are tuned using an adaptive FxLMS technique, are based on the dampingand stiffness properties of the stage.
ii Summary
A second alternative concept is also presented; an absolute tube displacement measure-ment is achieved by balancing the displacement sensor. The sensitivity for external vibrationsis reduced by tuning the resonance frequency and damping ratio of the balancing mechanismto those of the tube. Active control is added to compensate for the tube dynamics variationdue to the different fluid densities.
Based on the theoretic models, two proof of principles mechanisms are realised for vali-dation. Attenuation of more than 40 dB (factor 100) is achieved for a CMFM with integratedactive vibration isolation for both the feedback and feed-forward scheme. The performanceis limited by sensor noise and for the feedback solution by the destabilising effect of higherorder dynamics. The balanced sensor mechanism shows another 24 dB (factor 16) reduction,which is limited by the higher order dynamics of the fluid conveying tube.
The thesis presents a comprehensive analysis on how vibration isolation can be achieved.It is mainly focussed on narrow-band vibration isolation applied to a CMFM, but not lim-ited thereto. Active vibration isolation control is successfully implemented in a design of aCMFM, for the first time. A reduced sensitivity for external vibrations revealed other depen-dencies of disturbances on the measurement value. Future research is needed to identify thoseparameters affecting the accuracy and precision of a CMFM and to increase robustness forparameter changes.

Samenvatting
Een Coriolis Massa-Flow Meter (CMFM) is een actief instrument, gebaseerd op het Cori-olis effect, voor een rechtstreekse meting van de massastroom. De meting heeft een hogenauwkeurigheid, een groot bereik en een hoge herhaalbaarheid. De werking van een CMFMis als volgt: een met fluïdum (vloeistof of gas) gevulde buis wordt geactueerd, zodat dezegaat resoneren met een kleine amplitude op zijn eigenfrequentie. Een bewegend fluïdum inde trillende buis zorgt voor Coriolis krachten, welke evenredig zijn met de massastroom.Deze hebben een effect op de buisbeweging, zodanig dat de trilvorm verandert. Het metenvan de buisverplaatsingen, zodanig dat de verandering van de trilvorm kan worden bepaald,maakt het mogelijk om de massastroom te bepalen.
Externe trillingen resulteren in extra componenten in de CMFM sensorsignalen. Deze ex-tra componenten kunnen leiden tot een meetfout. Voor instrumenten met een klein door-stroombereik (<1 kg/h) is de beweging ten gevolge van de Coriolis kracht relatief kleinvergeleken met de beweging ten gevolge van externe trillingen. Daarom is een CMFM, welkegevoelig is voor een kleine massatroom, erg gevoelig voor externe trillingen.
Voornamelijk externe trillingen rond de aandrijf en Coriolis frequentie resulteren in eenmeetfout, onafhankelijk van het gebruikte algoritme om het faseverschil te bepalen. Er is eenmodel gerealiseerd om de meetfout ten gevolge van externe trillingen kwantiatief te kunnenschaten. Deze schatting is gebaseerd op de overdrachtsfunctie van externe trillingen naar degemeten buisverplaatsingen.
Om de gevoeligheid voor externe trillingen te verminderen is trillingsisolatie in een kleinfrequentiegebied noodzakelijk. In dit proefschrift is de gevoeligheid voor externe trillin-gen verkleind door gebruik te maken van passieve en actieve trillingsisolatieoplossingen.De passieve trillingsisolatieoplossing bestaat uit een massa-veer-demper systeem tussen deexterne trillingsbron en de ontvanger. (In het beschouwde geval, de vloer en het meetinstru-ment).
De onderdrukking is onvoldoende, omdat de frequentie van de afgeveerde platform wordtbeperkt door de maximaal toelaatbare spanning in de aansluitbuizen en de maximale zakkingten gevolgde van de zwaartekracht. Daarom is de passieve platform uitgebreid met voice-coilactuatoren en absolute bewegingsensoren om actieve trillingsisolatie toe te kunnen passen.Een terugkoppel en een vooruitkoppelstrategie zijn met elkaar vergeleken. Trillingsisolatie

iv Samenvatting
in een klein frequentiegebied is verkregen door de terugkoppelregelaar versterking in dit fre-quentiegebied te maximaliseren. Een innovatieve vooruitkoppelstrategie is geïmplementeerd,waarbij de parameters worden bijgesteld met behulp van een FxLMS algoritme. De para-meters zijn afhankelijk van de demping en de stijfheid tussen de behuizing en de afgeveerdeplatform.
Verder is een tweede alternatief concept gepresenteerd. Een absolute meting van debuisverplaatsing is verkregen door het balanceren van de verplaatsingssensor. De gevoel-igheid voor externe trillingen is verminderd door het aanpassen van de resonantiefrequentieen de dempingsratio van het gebalanceerde mechanisme aan die van de buis. Actieve ele-menten zijn toegevoegd om te kunnen compenseren voor de veranderingen in de buisdyna-mica, bijvoorbeeld ten gevolge van een andere dichtheid van het fluïdum.
Gebaseerd op de theoretische modellen zijn twee opstellingen gerealiseerd voor de va-lidatiestap. Een onderdrukking van meer dan 40 dB (een factor 100) is gerealiseerd met deexperimentele opstelling voor de terugkoppel en de vooruitkoppelstategie. De onderdrukkingwordt beperkt door de ruis van de acceleratiesensoren en voor de terugkoppelstrategie tevensdoor het destabiliserende effect van de hogere orde dynamica van de afgeveerde platform.De opstelling met de gebalanceerde sensor laat een onderdrukking van 24 dB (een factor 16)zien. Deze wordt beperkt door de hogere orde dynamica van buis.
Het proefschrift presenteert een uitgebreide analyse,die laat zien hoe trillingsisolatie incombinatie met een CMFM kan worden gerealiseerd. De strategie is voornamelijk gericht ophet verkleinen van de trillingsgevoeligheid in een klein frequentiegebied. Actieve trillings-isolatie is voor het eerst, succesvol geïmplementeerd in het ontwerp van een CMFM. Eengereduceerde gevoeligheid voor externe trillingen, laat zien dat dat er nu andere verstoringendominant zijn. Dit is onderwerp voor toekomstig onderzoek.

Contents
Summary . . . . . . . . . . . . . . . . . . . . . . . . . . . . . . . . . . . . . . . . . . . . . . . . . . . . . . . . . . . . . . . . . . i
Samenvatting . . . . . . . . . . . . . . . . . . . . . . . . . . . . . . . . . . . . . . . . . . . . . . . . . . . . . . . . . . . . . . iii
Contents . . . . . . . . . . . . . . . . . . . . . . . . . . . . . . . . . . . . . . . . . . . . . . . . . . . . . . . . . . . . . . . . . . v
Nomenclature . . . . . . . . . . . . . . . . . . . . . . . . . . . . . . . . . . . . . . . . . . . . . . . . . . . . . . . . . . . . . . vii
Part I Thesis
1 Introduction . . . . . . . . . . . . . . . . . . . . . . . . . . . . . . . . . . . . . . . . . . . . . . . . . . . . . . . . . . . 31.1 Background . . . . . . . . . . . . . . . . . . . . . . . . . . . . . . . . . . . . . . . . . . . . . . . . . . . . . . . 31.2 Current state of the art . . . . . . . . . . . . . . . . . . . . . . . . . . . . . . . . . . . . . . . . . . . . . . 41.3 Research objective and approach . . . . . . . . . . . . . . . . . . . . . . . . . . . . . . . . . . . . . . 61.4 Contributions . . . . . . . . . . . . . . . . . . . . . . . . . . . . . . . . . . . . . . . . . . . . . . . . . . . . . . 71.5 Outline . . . . . . . . . . . . . . . . . . . . . . . . . . . . . . . . . . . . . . . . . . . . . . . . . . . . . . . . . . . 9
2 Quantification of the influence of external vibrations . . . . . . . . . . . . . . . . . . . . . . . 112.1 Introduction . . . . . . . . . . . . . . . . . . . . . . . . . . . . . . . . . . . . . . . . . . . . . . . . . . . . . . . 122.2 Modelling method . . . . . . . . . . . . . . . . . . . . . . . . . . . . . . . . . . . . . . . . . . . . . . . . . . 132.3 Model evaluation . . . . . . . . . . . . . . . . . . . . . . . . . . . . . . . . . . . . . . . . . . . . . . . . . . . 162.4 Model validation . . . . . . . . . . . . . . . . . . . . . . . . . . . . . . . . . . . . . . . . . . . . . . . . . . . 252.5 Discussion . . . . . . . . . . . . . . . . . . . . . . . . . . . . . . . . . . . . . . . . . . . . . . . . . . . . . . . . 302.6 Conclusions . . . . . . . . . . . . . . . . . . . . . . . . . . . . . . . . . . . . . . . . . . . . . . . . . . . . . . . 32
3 Active vibration isolation feedback control . . . . . . . . . . . . . . . . . . . . . . . . . . . . . . . . 333.1 Introduction . . . . . . . . . . . . . . . . . . . . . . . . . . . . . . . . . . . . . . . . . . . . . . . . . . . . . . . 343.2 Material . . . . . . . . . . . . . . . . . . . . . . . . . . . . . . . . . . . . . . . . . . . . . . . . . . . . . . . . . . 353.3 Control design . . . . . . . . . . . . . . . . . . . . . . . . . . . . . . . . . . . . . . . . . . . . . . . . . . . . . 413.4 Experimental results . . . . . . . . . . . . . . . . . . . . . . . . . . . . . . . . . . . . . . . . . . . . . . . . 453.5 Discussion . . . . . . . . . . . . . . . . . . . . . . . . . . . . . . . . . . . . . . . . . . . . . . . . . . . . . . . . 49

vi Contents
3.6 Conclusions . . . . . . . . . . . . . . . . . . . . . . . . . . . . . . . . . . . . . . . . . . . . . . . . . . . . . . . 50
4 CMFM with integrated Active Vibration Isolation Control . . . . . . . . . . . . . . . . . . 514.1 Introduction . . . . . . . . . . . . . . . . . . . . . . . . . . . . . . . . . . . . . . . . . . . . . . . . . . . . . . . 524.2 1D modelling . . . . . . . . . . . . . . . . . . . . . . . . . . . . . . . . . . . . . . . . . . . . . . . . . . . . . . 534.3 Control design . . . . . . . . . . . . . . . . . . . . . . . . . . . . . . . . . . . . . . . . . . . . . . . . . . . . . 554.4 Mechanism design . . . . . . . . . . . . . . . . . . . . . . . . . . . . . . . . . . . . . . . . . . . . . . . . . . 644.5 Experimental validation . . . . . . . . . . . . . . . . . . . . . . . . . . . . . . . . . . . . . . . . . . . . . 694.6 Discussion . . . . . . . . . . . . . . . . . . . . . . . . . . . . . . . . . . . . . . . . . . . . . . . . . . . . . . . . 774.7 Conclusions . . . . . . . . . . . . . . . . . . . . . . . . . . . . . . . . . . . . . . . . . . . . . . . . . . . . . . . 78
5 Vibration isolation by compliant sensor mounting . . . . . . . . . . . . . . . . . . . . . . . . . 795.1 Introduction . . . . . . . . . . . . . . . . . . . . . . . . . . . . . . . . . . . . . . . . . . . . . . . . . . . . . . . 805.2 Performance criteria . . . . . . . . . . . . . . . . . . . . . . . . . . . . . . . . . . . . . . . . . . . . . . . . 815.3 Conceptual design . . . . . . . . . . . . . . . . . . . . . . . . . . . . . . . . . . . . . . . . . . . . . . . . . . 835.4 Mechanical design . . . . . . . . . . . . . . . . . . . . . . . . . . . . . . . . . . . . . . . . . . . . . . . . . . 885.5 Experimental validation . . . . . . . . . . . . . . . . . . . . . . . . . . . . . . . . . . . . . . . . . . . . . 895.6 Discussion . . . . . . . . . . . . . . . . . . . . . . . . . . . . . . . . . . . . . . . . . . . . . . . . . . . . . . . . 955.7 Conclusions . . . . . . . . . . . . . . . . . . . . . . . . . . . . . . . . . . . . . . . . . . . . . . . . . . . . . . . 955.8 Appendix: Optimal CMS frequency . . . . . . . . . . . . . . . . . . . . . . . . . . . . . . . . . . . 96
6 Evaluation . . . . . . . . . . . . . . . . . . . . . . . . . . . . . . . . . . . . . . . . . . . . . . . . . . . . . . . . . . . . 976.1 Performance criteria . . . . . . . . . . . . . . . . . . . . . . . . . . . . . . . . . . . . . . . . . . . . . . . . 976.2 CMFM designs . . . . . . . . . . . . . . . . . . . . . . . . . . . . . . . . . . . . . . . . . . . . . . . . . . . . 1076.3 Vibration isolation configurations . . . . . . . . . . . . . . . . . . . . . . . . . . . . . . . . . . . . . 1096.4 Conclusions . . . . . . . . . . . . . . . . . . . . . . . . . . . . . . . . . . . . . . . . . . . . . . . . . . . . . . . 116
7 Conclusions and Recommendations . . . . . . . . . . . . . . . . . . . . . . . . . . . . . . . . . . . . . . 1197.1 Conclusions . . . . . . . . . . . . . . . . . . . . . . . . . . . . . . . . . . . . . . . . . . . . . . . . . . . . . . . 1197.2 Recommendations . . . . . . . . . . . . . . . . . . . . . . . . . . . . . . . . . . . . . . . . . . . . . . . . . . 123
References . . . . . . . . . . . . . . . . . . . . . . . . . . . . . . . . . . . . . . . . . . . . . . . . . . . . . . . . . . . . . . . . . 125
Part II Appendices
A Commercially available CMFMs . . . . . . . . . . . . . . . . . . . . . . . . . . . . . . . . . . . . . . . . . 135
B 2-DOF CMFM model . . . . . . . . . . . . . . . . . . . . . . . . . . . . . . . . . . . . . . . . . . . . . . . . . . . 137
C Patent: CMFM with active vibration isolation control . . . . . . . . . . . . . . . . . . . . . . 145
Dankwoord . . . . . . . . . . . . . . . . . . . . . . . . . . . . . . . . . . . . . . . . . . . . . . . . . . . . . . . . . . . . . . . . 167
Nomenclature
Mathematical notation
x Scalarxxx VectorXXX Matrix• First derivative of • with respect to time• Second derivative of • with respect to time• Estimate of ••′
Filtered signal ••(t) Continuous time signal•(s) Laplace transformed variable or continuous system•(z) Discrete-time system•(ω) Fourier transformed variable or value of • at ω•T Transverse of ••−1 Inverse of ••† Pseudo inverse of ••·• Inner product•×• Outer product|•| Absolute value of •ℜ(•) Real part of •ℑ(•) Imaginary part of •
Abbreviations
#D # DimensionalAVIC Active Vibration Isolation ControlCMFM Coriolis Mass-Flow MeterCMS Compliantly Mounted SensorDFT Discrete Fourier Transform

viii Nomenclature
DN Diameter NominalDOF Degree Of FreedomDUT Device Under TestFB FeedbackFEM Finite Element MethodFF Feed ForwardFRF Frequency Response FunctionFxLMS Filtered reference Least Mean SquareHPF High Pass FilterIIR Infinite Impulse ResponseLPF Low Pass FilterMIMO Multiple Input Multiple OutputNF Nominal FlowPCB Printed Circuit BoardPI Proportional IntegralPSD Power Spectral DensityRMS Root Mean SquareROI Region of InterestSISO Single Input Single OutputSVD Singular Value DecompositionVC Vibration CriterionVI Vibration IsolationZS Zero Stability
Greek symbols
α Cut-off frequency in feedforward controller (rad/s)α Ratio between Coriolis and actuation frequencyΓΓΓ First order geometric transfer functionζ Relative dampingζ Trajectory parameter of the tube-windowζf Damping ratio of second-order LPF in controllerζr Damping ratio of second-order HPF in controllerθswing Angle of rotation around the swing-axisθtwist Angle of rotation around the twist-axisµ Adaptation rateν Frequency range (rad/s)ν Dynamic viscosity (m2/s)ρ Density (kg/m3)σ• Root mean square of signal •φ• Phase of signal • (rad)∆φ Phase difference (rad)Φm Mass-flowΦΦΦ• Power spectral density of signal •

Nomenclature ix
ω1 Suspension mode frequency (rad/s)ω2 Internal mode frequency (rad/s)ωact Actuation frequency (rad/s)ωar Anti-resonance frequency (rad/s)ωcor Coriolis frequency (rad/s)ωf Corner frequency of second-order LPF in controller (rad/s)ωi Resonance frequency (rad/s)ωind Induction pole actuator (rad/s)ωr Corner frequency of second-order HPF in controller (rad/s)ωx Centre frequency of bandpass filter (rad/s)ωz High frequency zero (rad/s)
Roman symbols
a0 External vibrationa1 Stage vibrationact• Tube actuator •A Cross sectional areaCCC Velocity sensitive matrix (Ns/m)C ControllerC Set of complex numbersd Tube diameter (m)d1 Suspension dampingd2 Tube dampingDDD Damping matrix (Ns/m)e Error signalfi Resonance frequency (Hz)F Bandpass filter in phase demodulation algorithmF Filter in adaptive feedforward algorithmFa Actuator forceFcor Coriolis forceFdis Disturbance forceg GainG Transfer functionH Part of controlleri =
√−1 Imaginary unit
j =√−1 Imaginary unit
J Quadratic cost functionk1 Suspension stiffnessk2 Tube stiffnesskm Motor constant (N/A)Ka Proportional gainKv Integral gainKKK Stiffness matrix (N/m)

x Nomenclature
L Induction (mH)L Effective tube length (m)m1 Stage massm2 Tube massMact Actuation momentMMM Mass matrix (kg)n• Noise signal •n• Number of signals •NNN Dynamic stiffness matrix (N/m)N Bandpass filterP Plant transfer functionP Pressure (N/m2)∆P Pressure difference (N/m2)qqq Degree of freedomQ Quality factorr Half pitch of the tube displacement sensorsRRR Transformation matrixR Resistance (Ω)R Set of real numberss Laplace s-transforms• Tube displacement sensor •S Sensitivity for flowS Sensitivity transfer functionT TransmissibilityTs Sample time (s)u Fluid velocity (m/s)uuu Input vectorvvvi Eigen vectorVVV Modal matrix VVV = [vvv1,vvv2, · · · ,vvvn]www Weights vectorx Filtered reference signalxxx Orthogonal coordinates xxx = (x,y,z,θx,θy,θz)
T
xxx State vectoryyy Output vectoryact Actuation displacementycor Coriolis displacementz Modal coordinate

Part I
Thesis


1
Chapter 1
Introduction
Vibration isolation for Coriolis Mass-Flow Meters (CMFM) is the main topic of this thesis.This chapter starts with a discussion on the advantages of using a CMFM for a mass-flowmeasurement. Thereafter, the current state of the art is presented and the necessity for vibra-tion isolation is explained. The research objective and approach of this thesis are discussednext, followed by the scientific contributions of this research and the thesis outline.
1.1 Background
Flow measurement is a technique used in many processes, requiring a determinable amountof a material transported from one point to another [3, 21]. It can be used for quantifying anamount of material or controlling a specific flow rate. Application examples are: (i) flow-ratemeasurement of oil or gas consumption, (ii) batch filling of food and beverage containers and(iii) additive dosage (Fig. 1.2) of flavours or fragrances to a main flow [9]. A measure of thetransported mass can be achieved by integration of the flow rate over time. The measurementof mass-flow rate (kg/s) has certain advantages over volume flow rate (m3/s) measurements,namely pressure, temperature, and density of the fluid do not have to be considered to obtainthe transported amount of a fluid.
A Coriolis Mass-Flow Meter (CMFM) is based on measuring the force or induced motion,as a measure of the mass-flow, when subjecting the fluid stream to a Coriolis acceleration. Theacceleration is named after Gustave Coriolis [15], see Gerkema and Gostiaux [22] for a briefhistory of the Coriolis force. This principle can be used for true mass-flow measurements,in which the measured parameter is directly related to mass-flow, independently of the fluidproperties. Market research studies show an increasing acceptance of the CMFMs by variousindustries, making it one of the fastest growing flow meter markets [20, 78].
A typical tube design of a CMFM is depicted in Fig. 1.1(a), to explain the working prin-ciple. The design consists of a window-shaped tube. The tube is actuated to oscillate in reso-nance with a low amplitude around the θtwist-axis. A fluid flow in the vibrating tube inducesa Coriolis force on the tube, proportional to the mass-flow Φm:

1
4 Chapter 1 Introduction
Φm θswing
θtwist
x
y
z
L
Fcor
Mact
(a)
x
y
(b) Actuation mode shape - without flow
x
y
(c) Actuation mode shape - with flow
Fig. 1.1 Explanation of the Coriolis principle, using a window-shaped fluid-conveying tube. The tube isactuated to resonate around the θtwist-axis. Due to the Coriolis effect the tube also oscillates around the θswing-axis, proportional to the mass-flow Φm, resulting in an altered mode-shape.
Fcor =−2L · θtwist × Φm (1.1)
where, L is the effective length of the tube and θtwist the angular velocity. Due to the geometryand dynamic properties of the tube, this force results in a rotation around the θswing-axis. Theposition of the axis is dependent on the tube-fixation, dimensions and fluid density. The forceis 90° out-of-phase with the actuation displacement, and thus the mode shape of the actuationmode is affected, see Fig. 1.1(b) and 1.1(c). The effect of a mass-flow is in the order ofnanometres for micrometre actuation displacements. Measuring the tube motion at severallocations, allows measuring the rotations around the twist- and swing-axis of which the ratiois directly proportional to the mass-flow. The actuation mode shape without flow is depictedin the bottom right corner of the odd pages and on the even pages on the bottom left forthe mode shape with flow. An extended explanation of the measurement principle follows inChapter 2 and 6.
A CMFM is a mechatronic system used to measure the mass-flow of liquids or gases witha high accuracy, range-ability and repeatability and without prior knowledge of the fluid. Thedensity can also be determined, from its effect on the resonance frequency, so also the volumeflow-rate can be calculated indirectly.
1.2 Current state of the art
Many CMFMs for various flow ranges are available nowadays. An example of a low-flowCMFM is given in Fig. 1.3. In Appendix A an overview and in Table. 1.1 a specification sum-mary is given of commercially available CMFMs. Since the ‘Coriolis mass flowmeter’ wasmentioned first by White [80] in 1958, the design improved significantly. Recently Wang andBaker [78] presented the developments over the past 20 years, showing the recent advances

1
1.2 Current state of the art 5
Fig. 1.2 Example of using a CMFM for additivedosage [8].
Fig. 1.3 Bronkhorst mini Cori-Flow M13 with a mea-surement range of 1-1000 g/h [8].
Table 1.1 Specification summary of commercially available Coriolis Mass-Flow Meters [1, 78].
Measured variables Mass-flow, volume-flow, density, viscosity, temperature, concentrationNominal flow range From 1 g/h up to 4100 t/hFluids Liquids, slurries, gases, liquefied gasesTube diameter From less than 0.25 mm to 205 mmOperating pressure Up to 413 barOperating temperature From -240 up to 427 °CMaterials Stainless steel 316/316L, Alloy C-22, Titanium, Tantalum and othersAccuracy Typically 0.05% to 0.5% for liquids and 0.35% to 0.75% for gasesZero stability From 0.002% to 0.1% of the nominal flow rateRepeatability Typically half the accuracy specificationRange-ability 1000:1
in fundamental understanding and technology development. They also outlined several openquestions.
For the understanding of the fluid-structure interaction, there are a large number of publi-cations. Païdoussis [51] presented various fundamental theories and also the governing equa-tions of a CMFM. Sultan and Hemp [61] modelled a CMFM to predict the phase shifts dueto flow. Later, Hemp [28] presented a weight vector approach to calculate the sensitivity forflow. Those, and even more, models [25, 35, 37, 54] resulted in CMFMs with better and betterspecifications to be an ‘ideal’ flow meter.
However, besides measuring the mass-flow, there are various types of disturbances affect-ing the measurement value. Anklin et al. [1] mentioned several factors: the effect of tem-perature and flow profiles on the sensitivity and measurement value, external vibrations andflow pulsations. More factors are investigated by Enz et al. [18]: Flow pulsations, asymmet-rical actuator and detector positions and structural non-uniformities, and more recently alsoby Kazahaya [35]: uneven flow rates in two flow tubes, vibration effects, temperature effects
1
6 Chapter 1 Introduction
and the inner pressure effects. Further Bobovnik et al. [5, 6] studied the effect of disturbedvelocity profiles due to the shape of the fluid supply tubes and other influencing factors liketwo-phase or even three-phase flow effects were studied by Henry et al. [29]. Wang and Baker[78] discussed recently also the different signal processing and control techniques. Recent de-velopments in digital hardware bring improved performance, which actually affects the mea-surement value. Coriolis forces and tube imperfections, like asymmetric distribution of themass, damping and stiffness properties, both result in static phase shifts [19, 62, 68]. No dis-tinction can be made yet, and thereby those imperfections affect the zero measurement value.Furthermore, external stresses and vibrations may affect the measurement value [12, 14]. Ex-ternal vibrations at the meter’s drive frequency produce a measurement error, regardless ofthe flow measurement algorithm [13].
Before starting this project, experimental results showed an increased sensitivity for exter-nal vibrations, especially when scaling down the nominal flow range (<1 kg/h). Therefore,the focus in this thesis will be on developing a quantitative model and obtaining vibrationisolation for a CMFM.
1.3 Research objective and approach
The continuous effort for improving the performance of CMFMs is hampered by the effect ofexternal vibrations on the measurement value, especially when scaling down the flow range.The effect of vibrations is known, but so far the effect has not been clearly quantified, whichhinders the implementation of effective measures. Therefore, the research objective of thisthesis is formulated as:
Investigate the effect of external vibrations on the performance of a Coriolis Mass-Flow
Meter by quantitative modelling of the influence of external vibrations. Based on these
insights, develop methods to reduce the effect of vibrations significantly (factor 100 or
40 dB) without changing the performance and validate these conceptual solutions exper-
imentally.
The approach to achieve the research objective starts with developing a flexible multi-body model of a CMFM, using the MATLAB package SPACAR [31, 33]. A flexible fluid-conveying tube-element [47] is used to determine the mode shapes, including the mass-flowinduced effects, due to the Coriolis force. The model is also able to quantify the effect ofvibrations on the tube motion. Based on these results and knowledge of the algorithms thatcompute the fluid flow, the sensitivity of the measurement value for flow and external vibra-tions is quantified. This result is the basis for the investigation of various passive and activevibration isolation concepts, which reduce the effect of external vibrations but leave the sen-sitivity for flow unaffected.
To reduce the influence of external vibrations, passive or active vibration isolation canbe used. Passive isolation consists of one or multiple stages of mass-spring-damper systemsbetween an excitation source and an influenced receiver (e.g. the floor and the casing of a

1
1.4 Contributions 7
machine) [53]. The parameters are adjusted to achieve high-frequency attenuation, whichis suitable for many applications. However, the performance of passive isolation applied toa CMFM is limited due to a minimal suspension frequency, which is caused by the para-sitic stiffness of the fluid-connecting-tubes and the maximum allowable gravitational saggingof the stage. Large deformations in the fluid-connecting-tubes would result in high internalstresses. An alternative approach is to apply active vibration isolation control to a flexiblysuspended single-tube configuration. This is an application of active hard mount isolation forprecision equipment [64, 76].
Active vibration isolation control is used, in Chapter 3 - 5, to achieve attenuation in a lim-ited frequency band, while maintaining the positive effects of the passive support stiffness.This is sufficient for minimisation of the influence of external vibrations on the mass-flowmeasurement. Therefore, different control algorithms based on feedback and feedforwardstrategies are compared. The control algorithm for feedback is a combination of known feed-back strategies for vibration isolation [34, 52, 77]. The novelty is the smart combination ofthose algorithms -acceleration feedback, velocity feedback, internal mode damping, cascadecontrol and loop shaping- tuned, modified and applied to the specific application of CMFMs.
The feedforward approach is based on a novel strategy, using Infinite Impulse Responsefilters with fixed poles and adaptive weights. The weights only depend on the physical pa-rameters - stiffness, damping and actuator dynamics - between the floor and the suspendedstage. The amount of weights is much lower than for conventional adaptive feedforward ap-proaches [36, 38]. This strategy is developed together with Beijen et al. [4], who presentedthe general approach to use it as feedfoward control for vibration isolation of precision ma-chines. The requirement that the flow measurement should not be affected, is used in thiswork to make some dedicated modifications to the strategy to make it even more effective fora CMFM.
The concepts are elaborated in two functional models to validate the modelling and isola-tion concepts. Based on these results it is discussed, how vibration isolation can be integratedin CMFMs in the future.
1.4 Contributions
The scientific output of this research is presented at various international conferences and ispublished in various journals. The research also resulted in several patent applications. Anoverview of all scientific output:
Journal articles:
• L. van de Ridder, W. B. J. Hakvoort, D. M. Brouwer, J. van Dijk, J. C. Lötters, andA. de Boer. Coriolis mass-flow meter with integrated multi-dof active vibration isolation.2015. Submitted to Mechatronics (Elsevier),
• L. van de Ridder, W. B. J. Hakvoort, J. van Dijk, J. C. Lötters, and A. de Boer. Vibra-tion isolation by an actively compliantly mounted sensor applied to a coriolis mass-flowmeter. 2015. Submitted to Dynamic Systems, Measurement and Control (ASME),

1
8 Chapter 1 Introduction
• L. van de Ridder, M. A. Beijen, W. B. J. Hakvoort, J. van Dijk, J. C. Lötters, andA. de Boer. Active vibration isolation feedback control for coriolis mass-flow meters.Control Engineering Practice, 33C:76–83, 2014. URL http://dx.doi.org/10.1016/
j.conengprac.2014.09.007,• L. van de Ridder, W. B. J. Hakvoort, J. van Dijk, J. C. Lötters, and A. de Boer. Quantifi-
cation of the influence of external vibrations on the measurement error of a coriolis mass-flow meter. Flow Measurement and Instrumentation, 40C:39–49, 2014. URL http://
dx.doi.org/10.1016/j.flowmeasinst.2014.08.005.
Conference Proceedings:
• L. van de Ridder, W. B. J. Hakvoort, and J. van Dijk. Active vibration isolation control:comparison of feedback and feedforward control strategies applied to coriolis mass-flowmeters. In ACC 2015 The American Control Conference, Chicago, IL, USA, 1-3 July2015. URL http://doc.utwente.nl/95710/,
• K. Staman, L. van De Ridder, W. B. J. Hakvoort, D. M. Brouwer, and J. van Dijk. Amulti-dof active vibration isolation setup for a coriolis mass-flow meter. In 29th Annual
Meeting of the American Society for Precision Engineering, Boston, Massachusetts USA,9-14 November 2014. URL http://doc.utwente.nl/93719/,
• J. Groenesteijn, L. van de Ridder, J. C. Lötters, and R. J. Wiegerink. Modelling of amicro coriolis mass flow sensor for sensitivity improvements. In Proceedings of the
Thirteenth IEEE Sensors Conference, IEEE Sensors 2014, Valencia, Spain, pages 954–957, Valencia, Spain, 2-5 November 2014. IEEE Service Center. URL http://doc.
utwente.nl/92825/,• L. van de Ridder, W. B. J. Hakvoort, and J. van Dijk. Vibration isolation by compliant
sensor mounting applied to a coriolis mass-flow meter. In ASME 2014 12th biennial
conference on engineering systems design and analysis (ESDA2014), Copenhagen, Den-mark, 25-27 June 2014. URL http://doc.utwente.nl/91292/,
• L. van de Ridder, W. B. J. Hakvoort, J. van Dijk, J. C. Lötters, and A. de Boer. Quan-titative estimation of the influence of external vibrations on the measurement error of acoriolis mass-flow meter. In Z. Dimitrovová, J.R. de Almeida, and R. Gonçalves, editors,11th International Conference on Vibration Problems (ICOVP-2013), Lisbon, Portugal,9-12 September 2013. URL http://doc.utwente.nl/89168/,
• L. van de Ridder, W. B. J. Hakvoort, J. van Dijk, and J. C. Lötters. Influence of ex-ternal damping on phase difference measurement of a coriolis mass-flow meter. InEUROMECH Colloquium 524, Enschede, 27-29 February 2012. URL http://doc.
utwente.nl/89167/.
Patents:
• J. C. Lötters, L. van de Ridder, W. D. Kruijswijk, W. B. J. Hakvoort, and M. R. Katerberg.Coriolis flow meter with active vibration isolation, Patent pending, 25 November 2013,
• J. C. Lötters, L. van de Ridder, W. D. Kruijswijk, W. B. J. Hakvoort, and M. R. Katerberg.Coriolis flow meter with passive vibration isolation, Patent pending, 24 March 2014.

1
1.5 Outline 9
1.5 Outline
The main part of this thesis is a collection of journal articles, appearing as reprints in Chap-ters 2 to 5. The journal articles are self-contained and can be read independently. Note, thatpieces are repeated in multiple chapters. The articles are supplemented by a comparison,discussion and conclusion in Chapters 6 and 7. The content of all the chapters is describedbelow:
Chapter 2 describes a flexible 3D multi-body model of a CMFM. This model is used toinvestigate and quantify the influence of external vibrations. Experimental results confirmthat the transfer function from external vibrations to the Coriolis displacement can be used toestimate the influence.
In Chapter 3 an active vibration isolation feedback strategy is analysed to reduce the trans-fer function from external vibrations to the Coriolis displacement. The casing of an existingCMFM is passively suspended and active means are added to apply acceleration feedback.
Chapter 4 presents an on-scale functional model of a CMFM with integrated active vibra-tion isolation control. In addition, the feedback strategy is compared to an adaptive feedfor-ward strategy, whereby the weights are updated to minimise the measurement error.
In Chapter 5 a second strategy to apply vibration isolation to a CMFM is analysed. Insteadof an absolute measurement of the tube displacements, a relative displacement is introducedby a flexible mounting of the displacement sensors. This configuration also reduces the trans-fer function from vibrations to the Coriolis displacement. A functional model is presented,validating that this concept can realise vibration isolation.
Chapter 6 starts with a reduced model of a CMFM to show the effect of scaling downthe flow range on the vibration sensitivity. Further, an overview is given of the analysedconfigurations to apply vibration isolation to a CMFM.
Conclusions of this research are presented in Chapter 7, followed by recommendations forfurther research.

1

2
Chapter 2
Quantification of the influence of external vibrations
Abstract In this paper the influence of external vibrations on the measurement value of aCoriolis Mass-Flow Meter (CMFM) for low flows is investigated and quantified. Model re-sults are compared with experimental results to improve the knowledge on how external vi-brations affect the mass-flow measurement value. A flexible multi-body model is built andthe working principle of a CMFM is explained. Some special properties of the model areevaluated to get insight in the dynamic behaviour of the CMFM. Using the model, the trans-fer functions between external vibrations (e.g. floor vibrations) and the flow error are derived.The external vibrations are characterised with a PSD. Integrating the squared transfer func-tion times the PSD over the whole frequency range results in an RMS flow error estimate.In an experiment predefined vibrations are applied on the casing of the CMFM and the erroris determined. The experimental results shows that the transfer functions and the estimatedmeasurement error correspond with the model results. The agreement between model andmeasurements implies that the influence of external vibrations on the measurement is fullyunderstood. This result can be applied in two ways; firstly that the influence of any externalvibration spectrum on the flow error can be estimated and secondly that the performance ofdifferent CMFM designs can be compared and optimised by shaping their respective transferfunctions.
This chapter is reprinted from: L. van de Ridder, W. B. J. Hakvoort, J. van Dijk, J. C.Lötters, and A. de Boer. Quantification of the influence of external vibrations on the mea-surement error of a coriolis mass-flow meter. Flow Measurement and Instrumentation, 40C:39–49, 2014. URL http://dx.doi.org/10.1016/j.flowmeasinst.2014.08.005, withpermission from Elsevier.

2
12 Chapter 2 Quantification of the influence of external vibrations
2.1 Introduction
A Coriolis Mass-Flow Meter (CMFM) is an active device based on the Coriolis force prin-ciple for direct mass-flow measurements with a high accuracy, range-ability and repeatabil-ity [1]. The working principle of a CMFM is as follows: a fluid conveying tube is actuatedto oscillate with a low amplitude at a resonance frequency in order to minimise the amountof supplied energy. A fluid flow in the vibrating tube induces Coriolis forces, proportional tothe mass-flow, which affect the tube motion and change the mode shape. Measuring the tubedisplacement, such that the change of its mode shape is determined, allows calculating themass-flow.
Besides the sensitivity for a mass-flow, there are many factors influencing the measure-ment value. Anklin et al. [1] mentioned several factors: the effect of temperature and flowprofiles on the sensitivity and measurement value, external vibrations and flow pulsations.More factors are investigated by Enz et al. [18]: Flow pulsations, asymmetrical actuator anddetector positions and structural non-uniformities. And more recent also by Kazahaya [35]:uneven flow rates in two flow tubes, vibration effects, temperature effects and the inner pres-sure effects. Further Bobovnik et al. [5] studied the effect of disturbed velocity profiles dueto installation effects and other influencing factors like two-phase or even three-phase floweffects were studied by Henry et al. [29]
In our research we focus mainly on the effect of floor/mechanical/external vibrations.These vibrations create additional components in the CMFM sensor signals [14], those ad-ditional components can introduce a measurement error. The effect of mechanical vibrationson the sensor response of a CMFM is also studied by Cheesewright [12, 13]. The analyticalstudy showed that external vibrations at the meter’s drive frequency produces a measurementerror, regardless of the flow measurement algorithm. There is no attempt made to quantify theerror in any particular meter, since such an error depends on dimensions, type of actuatorsand sensors and the used flow measurement algorithm.
A solution to reduce the influence of external vibrations is to apply a robust balancingsystem. (e.g. a twin tube configuration) [1, 35]. There are many types of CMFMs available,whereby the size depends on the flow range. One category is the CMFM for low flows [44].For low flows, the Coriolis force induced motion is relative small compared to external vi-brations induced motions, thus CMFM’s designed to be sensitive to low flows, are rathersensitive to external vibrations. Applying a twin tube configuration is not an option, becausesome structural non-uniformities [18] can lead to large differences between the two tubes,due to their small dimensions. This has an negative impact on the measurement sensitivity ofthe instrument and reduces the decoupling of external vibrations to the internal measurementsystem.
A quantitative model of the influence of external vibrations is not yet available. In thisstudy the effect of external vibrations on the measurement error is quantified using an exper-imentally validated model. The results presented in this study are an extension of previouswork [69]. First, a model of a CMFM is derived, using the multi-body package SPACAR [31]resulting in a linear state space representation [32]. In the modelling, a tube-element [47]is used to model the inertial interaction between flow and the tube dynamics. Secondly, themodel is extended to be able to predict the influence of external vibrations, with the eventual

2
2.2 Modelling method 13
goal to find and test designs that reduce the influence of external vibrations on an erroneousmass-flow reading.
2.2 Modelling method
In this section, the Finite Element Method (FEM) model is explained. Subsequently, the sys-tem equations are derived and the inputs and outputs are defined to derive the input-outputrelations. This results in a state space representation of a CMFM in the final subsection.
2.2.1 Coriolis Mass-Flow Meter
For this research a functional model of the patented design [44, 45] (see Fig. 2.1) is used.First, a FEM model is derived, using the multi-body package SPACAR [31]. The graphicalrepresentation of the model is shown in Fig. 2.2. The model consists of a tube-window, con-veying the fluid flow, which is actuated by two actuators act1 and act2. The displacementsof the flexible tube-window are measured by two displacements sensors s1 and s2. On thecasing a vector aaa0, representing the external vibrations and consisting of three translationand three rotational movements, is imposed. The model is made out of multi-body beam,truss and tube elements. The beam elements are used to model the rigid casing and the trusselements to measure relative displacements and to apply a force on the tube-window. Fur-ther, a tube-element [47] is used to model the inertial interaction between flow and the tubedynamics.
2.2.2 System equations
The linearised system equations of the FEM model, with n degrees of freedom of tube de-formations qqq and the imposed casing movements (rheonomic degrees of freedom: xxx0,vvv0 =xxx0,aaa0 = xxx0), can be written as [32]:[
MMM11 MMM12
MMM21 MMM22
][qqq
aaa0
]
+[CCC(Φm)+DDD
][
qqq
vvv0
]
+[KKK +NNN(Φ2
m)][
qqq
xxx0
]
=
[fff
FFF0
]
(2.1)
The other terms are the mass matrix MMM, stiffness matrix KKK, damping matrix DDD, the veloc-ity sensitive matrix CCC, the dynamic stiffness matrix NNN, the actuation input vector fff and thereaction force FFF0. The matrices CCC and NNN depend linear and quadratic on the mass-flow Φm
respectively, and are representing the forces induced by respectively the Coriolis and cen-trifugal acceleration of the flow. The matrices CCC, DDD, KKK and NNN can be divided in same partsas the mass matrix MMM. Using the multi-body package SPACAR [31] the system matrices

2
14 Chapter 2 Quantification of the influence of external vibrations
Fig. 2.1 Coriolis Mass-Flow Meter, used as a ref-erence instrument in this study. Details on thepatented design are given in [44, 45]. The in-strument is connected to a pipeline; a fluid flowenters the instrument (6), flows trough the tube-window (2) and exits the instrument (7). The flex-ible tube-window (2) is actuated in resonance byan Lorentz actuator (8) and the displacementsare measured by optical displacements sensors(11abc) [46].
Casing
Tube-window
act1
act2
s1s2
aaa0
θswing
θtwist
ζ
xy
z
Fig. 2.2 CMFM multi-body model, the flexibletube-window is actuated by two Lorentz actua-tors act1 and act2. The trajectory of the curvedtube-window is parametrised by ζ, starting at thefixation point of the tube-window to the casing.The displacement are measured by two displace-ments sensors s1 and s2. On the casing a vectoraaa0 with floor movements is imposed.
with respect to the element deformations and the imposed floor movements of the model arederived.
The matrices DDD12,KKK12 and their transposed matrices appears to be zero, due to the choiceof element deformations as degrees of freedom. (E.g. KKK12 = 000, because there is no couplingbetween the location of the casing xxx0 and the internal deformations qqq.)
The casing motion is prescribed and thus the only dynamic degrees of freedom are thetube deformations, for which the equations of motion are derived from the top row of Eq. 2.1:
MMM11qqq = fff + fff dis −CCC11qqq−DDD11qqq−KKK11qqq−NNN11qqq (2.2)
including a external disturbance force, consisting of imposed external accelerations:
fff dis =−MMM12aaa0 (2.3)
whereby CCC12vvv0 and NNN12xxx0 are omitted, because their magnitude is orders lower then MMM12aaa0.The vector of imposed external accelerations, three translations and three rotations, is equalto: aaa0 =
ax ay az αRx αRy αRz
T

2
2.2 Modelling method 15
To gain more insight in the model, the degrees of freedom are reduced by applying a modalreduction method. For the modal reduction, the eigenvalue problem (KKK11+NNN11−ω2
i MMM11)vvvi =0 is solved, which results in natural frequencies ωi and the corresponding eigenvector vvvi, themode shape. The equations of motion are rewritten in the modal coordinates, defined as:qqq =VVV zzz, where VVV = [vvv1,vvv2, ...,vvvn] is a matrix, normalised such that VVV T MMM11VVV = III, of the firstn mode shapes and zzz is the vector of modal amplitudes. Eq. 2.2 can now be written as:
zzz+VVV TCCC11(Φm)VVV zzz+VVV T DDD11VVV zzz+VVV T KKK11VVV zzz+VVV T NNN11(Φ2m)VVV zzz =VVV T fff +VVV T fff dis (2.4)
The reaction forces on the floor can be derived from the lower row of Eq. 2.1:
FFF0 = MMM21qqq+CCC21qqq+NNN21qqq+MMM22aaa0 +(CCC22 +DDD22)vvv0 +(KKK22 +NNN22)xxx0 (2.5)
2.2.2.1 Actuation
The flexible tube-window is actuated to have an oscillation around the θtwist-axis (seeFig. 2.2), therefore in the model a moment is applied by two forces between the tube andthe casing. In model terms the actuator input is equal to:
fff =1
rM(ΓΓΓact1 −ΓΓΓact2)Mact (2.6)
where ΓΓΓact1 and ΓΓΓact2 are vectors with the elongation of the actuator element with respect tothe coordinates qqq of the model, rM the distance between the two actuator elements and Mact
the actuator moment input.
2.2.2.2 Sensing
The movement of the tube-window is measured by two sensors, s1 and s2. In model terms thesensor displacements are equal to:
si = ΓΓΓsiqqq = ΓΓΓsi
VVV zzz (2.7)
where ΓΓΓsiis a vector with the elongation of the ith sensor element with respect to the coordi-
nates qqq of the model.
2
16 Chapter 2 Quantification of the influence of external vibrations
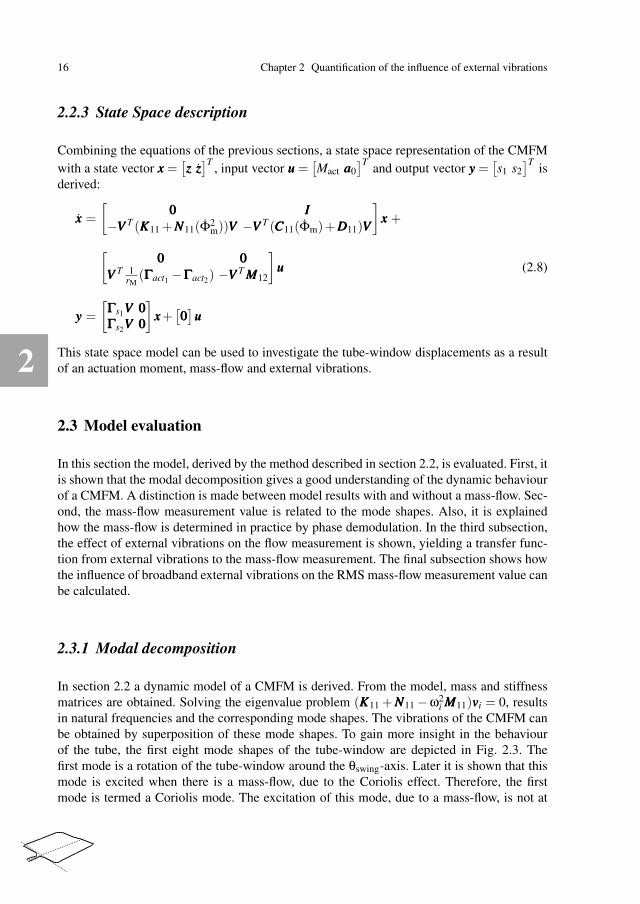
2.2.3 State Space description
Combining the equations of the previous sections, a state space representation of the CMFMwith a state vector xxx =
[zzz zzz]T
, input vector uuu =[Mact aaa0
]Tand output vector yyy =
[s1 s2
]Tis
derived:
xxx =
[000 III
−VVV T (KKK11 +NNN11(Φ2m))VVV −VVV T (CCC11(Φm)+DDD11)VVV
]
xxx +
[000 000
VVV T 1rM(ΓΓΓact1 −ΓΓΓact2) −VVV T MMM12
]
uuu
yyy =
[ΓΓΓs1VVV 000ΓΓΓs2VVV 000
]
xxx+[000]
uuu
(2.8)
This state space model can be used to investigate the tube-window displacements as a resultof an actuation moment, mass-flow and external vibrations.
2.3 Model evaluation
In this section the model, derived by the method described in section 2.2, is evaluated. First, itis shown that the modal decomposition gives a good understanding of the dynamic behaviourof a CMFM. A distinction is made between model results with and without a mass-flow. Sec-ond, the mass-flow measurement value is related to the mode shapes. Also, it is explainedhow the mass-flow is determined in practice by phase demodulation. In the third subsection,the effect of external vibrations on the flow measurement is shown, yielding a transfer func-tion from external vibrations to the mass-flow measurement. The final subsection shows howthe influence of broadband external vibrations on the RMS mass-flow measurement value canbe calculated.
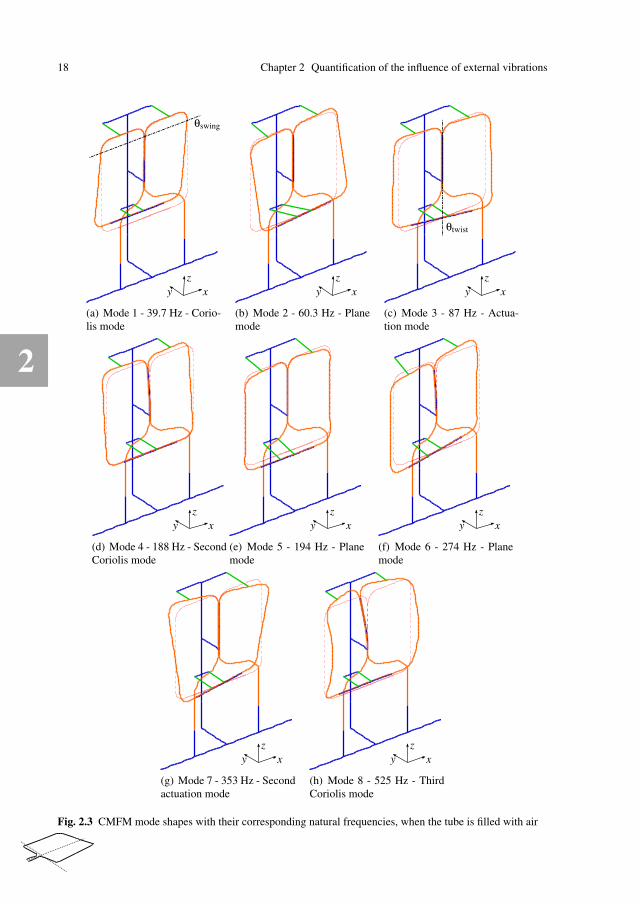
2.3.1 Modal decomposition
In section 2.2 a dynamic model of a CMFM is derived. From the model, mass and stiffnessmatrices are obtained. Solving the eigenvalue problem (KKK11 +NNN11 −ω2
i MMM11)vvvi = 0, resultsin natural frequencies and the corresponding mode shapes. The vibrations of the CMFM canbe obtained by superposition of these mode shapes. To gain more insight in the behaviourof the tube, the first eight mode shapes of the tube-window are depicted in Fig. 2.3. Thefirst mode is a rotation of the tube-window around the θswing-axis. Later it is shown that thismode is excited when there is a mass-flow, due to the Coriolis effect. Therefore, the firstmode is termed a Coriolis mode. The excitation of this mode, due to a mass-flow, is not at
2
2.3 Model evaluation 17
the frequency of this mode, but at the actuation frequency. The second mode is termed an in-plane mode, because it has no displacement in the direction of the sensors. The tube-windowis actuated to oscillate in resonance around the θtwist-axis, so the third mode is termed theactuation mode. The fourth mode is also influenced by a Coriolis force and therefore termedthe second Coriolis mode. The modes five and six are in-plane modes again. Mode seven isalso a rotation around the θtwist-axis and therefore called the second actuation mode, althoughpossible this mode is not used for actuation in our case. And finally, mode eight is again aCoriolis mode.
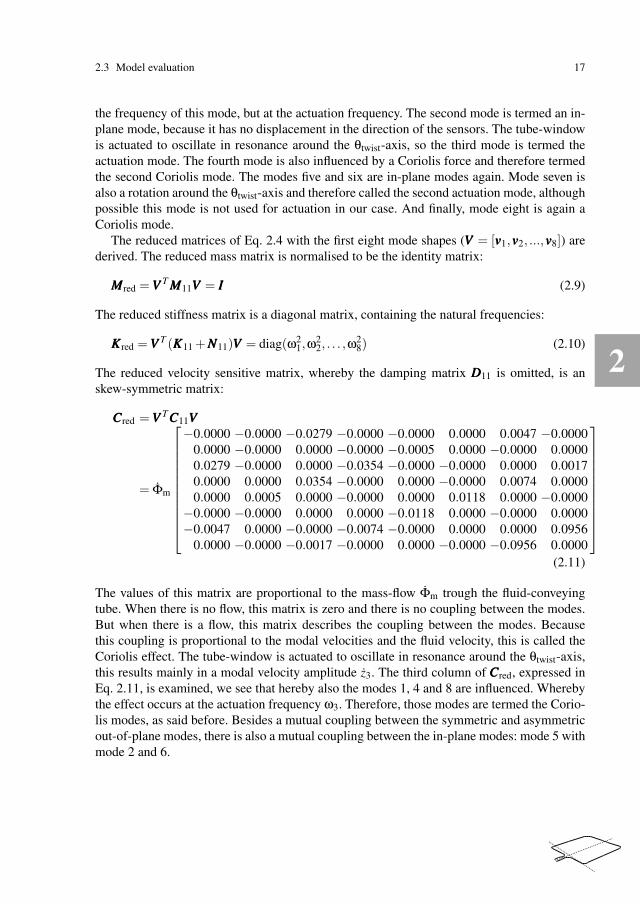
The reduced matrices of Eq. 2.4 with the first eight mode shapes (VVV = [vvv1,vvv2, ...,vvv8]) arederived. The reduced mass matrix is normalised to be the identity matrix:
MMMred =VVV T MMM11VVV = III (2.9)
The reduced stiffness matrix is a diagonal matrix, containing the natural frequencies:
KKKred =VVV T (KKK11 +NNN11)VVV = diag(ω21,ω
22, . . . ,ω
28) (2.10)
The reduced velocity sensitive matrix, whereby the damping matrix DDD11 is omitted, is anskew-symmetric matrix:
CCCred =VVV TCCC11VVV
= Φm
−0.0000 −0.0000 −0.0279 −0.0000 −0.0000 0.0000 0.0047 −0.00000.0000 −0.0000 0.0000 −0.0000 −0.0005 0.0000 −0.0000 0.00000.0279 −0.0000 0.0000 −0.0354 −0.0000 −0.0000 0.0000 0.00170.0000 0.0000 0.0354 −0.0000 0.0000 −0.0000 0.0074 0.00000.0000 0.0005 0.0000 −0.0000 0.0000 0.0118 0.0000 −0.0000
−0.0000 −0.0000 0.0000 0.0000 −0.0118 0.0000 −0.0000 0.0000−0.0047 0.0000 −0.0000 −0.0074 −0.0000 0.0000 0.0000 0.0956
0.0000 −0.0000 −0.0017 −0.0000 0.0000 −0.0000 −0.0956 0.0000
(2.11)
The values of this matrix are proportional to the mass-flow Φm trough the fluid-conveyingtube. When there is no flow, this matrix is zero and there is no coupling between the modes.But when there is a flow, this matrix describes the coupling between the modes. Becausethis coupling is proportional to the modal velocities and the fluid velocity, this is called theCoriolis effect. The tube-window is actuated to oscillate in resonance around the θtwist-axis,this results mainly in a modal velocity amplitude z3. The third column of CCCred, expressed inEq. 2.11, is examined, we see that hereby also the modes 1, 4 and 8 are influenced. Wherebythe effect occurs at the actuation frequency ω3. Therefore, those modes are termed the Corio-lis modes, as said before. Besides a mutual coupling between the symmetric and asymmetricout-of-plane modes, there is also a mutual coupling between the in-plane modes: mode 5 withmode 2 and 6.
2
18 Chapter 2 Quantification of the influence of external vibrations
xy
z
θswing
(a) Mode 1 - 39.7 Hz - Corio-lis mode
xy
z
(b) Mode 2 - 60.3 Hz - Planemode
xy
z
θtwist
(c) Mode 3 - 87 Hz - Actua-tion mode
xy
z
(d) Mode 4 - 188 Hz - SecondCoriolis mode
xy
z
(e) Mode 5 - 194 Hz - Planemode
xy
z
(f) Mode 6 - 274 Hz - Planemode
xy
z
(g) Mode 7 - 353 Hz - Secondactuation mode
xy
z
(h) Mode 8 - 525 Hz - ThirdCoriolis mode
Fig. 2.3 CMFM mode shapes with their corresponding natural frequencies, when the tube is filled with air
2
2.3 Model evaluation 19
Tube-window (ζ)
Re(
Γyv i)
(nor
mal
ised
to1
bym
ode
3)
mode 1mode 2mode 3mode 4
0 0.2 0.4 0.6 0.8 1-1.5
-1
-0.5
0
0.5
1
1.5
(a) Tube-window y-displacement as function of thetube-length ζ, as shown in Fig. 2.2, for the first fourmode shapes
Tube-window(ζ)
Im(Γ
yv i)
(nor
mal
ised
onR
e(Γ
yv 3))
mode 3mode 1 (scaled)mode 4 (scaled)
0 0.2 0.4 0.6 0.8 1-3
-2
-1
0
1
2
3
4
5
6×10⁻⁵
(b) Flow induced y-displacement as function of thetube-length ζ. The amplitude is proportional to themass-flow Φm
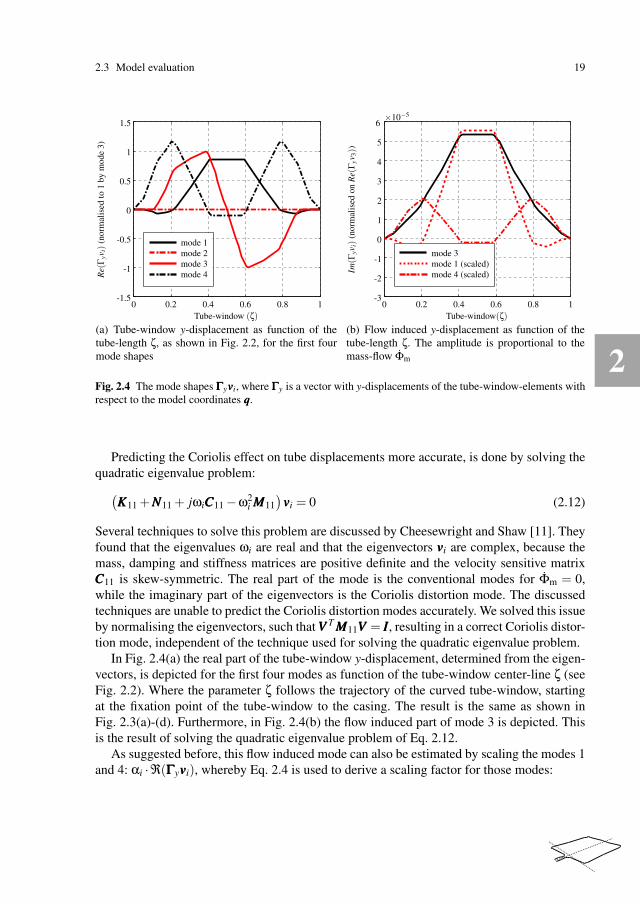
Fig. 2.4 The mode shapes ΓΓΓyvvvi, where ΓΓΓy is a vector with y-displacements of the tube-window-elements withrespect to the model coordinates qqq.
Predicting the Coriolis effect on tube displacements more accurate, is done by solving thequadratic eigenvalue problem:
(KKK11 +NNN11 + jωiCCC11 −ω2
i MMM11)
vvvi = 0 (2.12)
Several techniques to solve this problem are discussed by Cheesewright and Shaw [11]. Theyfound that the eigenvalues ωi are real and that the eigenvectors vvvi are complex, because themass, damping and stiffness matrices are positive definite and the velocity sensitive matrixCCC11 is skew-symmetric. The real part of the mode is the conventional modes for Φm = 0,while the imaginary part of the eigenvectors is the Coriolis distortion mode. The discussedtechniques are unable to predict the Coriolis distortion modes accurately. We solved this issueby normalising the eigenvectors, such that VVV T MMM11VVV = III, resulting in a correct Coriolis distor-tion mode, independent of the technique used for solving the quadratic eigenvalue problem.
In Fig. 2.4(a) the real part of the tube-window y-displacement, determined from the eigen-vectors, is depicted for the first four modes as function of the tube-window center-line ζ (seeFig. 2.2). Where the parameter ζ follows the trajectory of the curved tube-window, startingat the fixation point of the tube-window to the casing. The result is the same as shown inFig. 2.3(a)-(d). Furthermore, in Fig. 2.4(b) the flow induced part of mode 3 is depicted. Thisis the result of solving the quadratic eigenvalue problem of Eq. 2.12.
As suggested before, this flow induced mode can also be estimated by scaling the modes 1and 4: αi ·ℜ(ΓΓΓyvvvi), whereby Eq. 2.4 is used to derive a scaling factor for those modes:

2
20 Chapter 2 Quantification of the influence of external vibrations
αi =zzzi
zzz3=
CCCred (i,3)ω3
ω23 −ω2
i
i (2.13)
where i is the mode to scale. Using Eq. 2.11 and the natural frequencies ωi, we see that onlythe modes 1 and 4 have a significant contribution to the flow induced mode. Both scaledmodes are also shown in Fig. 2.4(b). The analysis above thus shows that a mass-flow onlyaffects the out-of-phase component of the tube’s motion, which can be reconstructed fromscaling the other modes.
2.3.2 Mass-flow measurement
In the previous subsection the effect of a mass-flow on the mode shapes is shown. In thissection it is discussed how a mass-flow can be measured using two displacement sensorss1 and s2. The tube-window is actuated to oscillate in its third eigen mode. In Fig. 2.4(a)we see the effect of actuation on the y-displacement of the tube-window. For ζ = 0.5, thedisplacement is zero, this is the rotation axis θtwist. In Fig. 2.2 we see that the sensors areplaced on both sides of this rotation axis, resulting in a phase-difference between the sensorsignals of 180.
In Fig. 2.4(b) the flow induced vibration mode due to the Coriolis effect is depicted. Thecontribution to both sensor signals is equal in amplitude and phase, but this vibration modeoccurs 90 out of phase with the actuation mode, because it is the imaginary part of themode. So, when a mass-flow is affecting the vibration mode of the tube-window, the phase-difference between the sensor signals s1 and s2 is not 180 anymore, but is dependent on themass-flow. The phase-difference between the two sensor signals is expressed as:
∆φ = arg(s1)− arg(s2)+π = arctan
(ℑ(s1)
ℜ(s1)
)
− arctan
(ℑ(s2)
ℜ(s2)
)
≈ ℑ(s1)
ℜ(s1)− ℑ(s2)
ℜ(s2)≈ 2
ℑ(s1 + s2)
ℜ(s1 − s2)(2.14)
where s1 and s2 represent the complex displacement amplitudes, calculated solving Eq. 2.12.Further the first approximation (arctan(x) ≈ x) is valid for small radian angles only and forthe second approximation is used that the two sensors are placed on equal distance of therotation axis (ℜ(s1) ≈ ℜ(−s2)). The phase difference equation is made more distinct bydefining two new displacements, based on the sensor signals:
yact =12(s1 − s2) (2.15)
ycor =12(s1 + s2) (2.16)
where the differential-mode s1−s2 is named the actuation displacement yact and the common-mode s1 + s2 the Coriolis displacement ycor. This results in a new equation of the phase-

2
2.3 Model evaluation 21
difference (Eq. 2.14):
∆φ ≈ 2ℑ(s1 + s2)
ℜ(s1 − s2)= 2
ℑ(ycor)
ℜ(yact)(2.17)
The approximation is valid for small flows, because then the Coriolis displacement is smallcompared to the actuation displacement. Another advantage of this new definition is the con-nection with the mode shapes, presented in the previous subsection. Using Eq. 2.7, the actu-ation displacement value is written as a combination of the modal displacements:
yact =12(s1 − s2) =
12(ΓΓΓs1 −ΓΓΓs2)VVV zzz
= [−0.00 0.00 28.30 −0.00 −0.00 −0.00 −27.74 −0.00] zzz (2.18)
The actuation displacement is a combination of the modal amplitudes of the modes 3 and 7.The actuation modes, as presented in Fig. 2.3. The same holds for the Coriolis displacement,which is a combination of the modes 1, 4 and 8:
ycor =12(s1 + s2) =
12(ΓΓΓs1 +ΓΓΓs2)VVV zzz
= [154.47 0.00 −0.00 21.47 0.00 −0.00 0.00 −51.39] zzz (2.19)
A controlled oscillation in the third mode results in excitation, proportional to the mass-flow Φm, of the modes 1,4 and 8 with the third mode frequency, see Eq. 2.11. The Coriolisdisplacement is a combination those modal amplitudes and therefore this displacement is alsoproportional to the mass-flow. And, equally important, also proportional to the actuation dis-placement. This results in a phase difference, proportional to the mass-flow, but independentof the actuation displacement. A measurement sensitivity is defined as, the phase differenceper unit mass-flow:
S =∆φ
Φm(rad s/kg) (2.20)
The mass-flow is calculated from the measured phase difference and the measurement sen-sitivity. The measurement sensitivity S is instrument, design, fluid density and temperaturedependent. In case of large flows or in the transition between laminar and turbulent the re-lation is non-linear and thus the sensitivity becomes also flow dependent [1]. A numericalvalue of the measurement sensitivity is not given for the used instrument (Fig. 2.1), but thephase difference ∆φ is also a valid measure for the mass-flow as these are related.
2.3.2.1 Phase demodulation
In practice the phase of the sensor signals is measured directly, without determining the am-plitudes of the sensor signals. There are different digital signal processing methods that canbe applied. A method is to apply dual quadrature demodulation, the method applied to a

2
22 Chapter 2 Quantification of the influence of external vibrations
CMFM is described by Mehendale [44]. A phase-locked loop algorithm is implemented tocompute the frequency ωact = ω3 of the oscillating tube. The filtered frequency is used tocreate two waveforms: a sine and a cosine. The measured sensor signal is multiplied withboth waveforms and then filtered with a low-pass filter (LPF):
s1 sin(ωactt) = A1 sin(ωactt +φ1)sin(ωactt)
=A1
2(cos(φ1)− cos(2ωactt +φ1))
LPF−−→=A1
2cos(φ1) (2.21)
s1 cos(ωactt) = A1 sin(ωactt +φ1)cos(ωactt)
=A1
2(sin(φ1)+ sin(2ωactt +φ1))
LPF−−→=A1
2sin(φ1) (2.22)
This calculation thus results in two DC values, dependent on the phase difference φ1, betweenthe sensor signal s1 and the newly introduced waveform. Effectively the phase demodulationshifts the frequency of the sensor signals by the actuation frequency. The phase, independentof the amplitude A1 of the sensor signals, is calculated as follows:
A12 sin(φ1)
A12 cos(φ1)
= tanφ1 → φ1 (2.23)
The same is done for the second sensor, resulting in φ2. This results in a phase differencebetween the two sensor signals:
∆φ = φ1 −φ2 (2.24)
The phase difference divided by the measurement sensitivity (Eq. 2.20) results in an estima-tion of the mass-flow.
The low pass filter is the key in the trade-off between speed of the flow measurement andthe measurement noise. A lower cut-off frequency reduces the amount of measurement noise,but also reduces the response time.
2.3.3 Transmissibility external vibrations
In the previous subsection we showed that the Coriolis displacement is a measure to calculatethe mass-flow. In this section we show that besides a mass-flow, external vibrations result ina Coriolis displacement. The influence of external vibrations on the Coriolis displacement,expressed in the Laplace s-domain, is equal to:
ycor(s) = TTT ycor,aaa0(s)aaa0(s) (2.25)
where TTT ycor,aaa0(s) is determined using the State Space model (Eq. 2.8) and the Coriolis dis-
placement definition (Eq. 2.16). The model has in total 6 inputs, 3 translations and 3 rotations,

2
2.3 Model evaluation 23
Bode diagram
Frequency (Hz)
Mag
nitu
de(d
B)
Tyact,aRz
Tycor,ay
Tycor,aRx
100 101 102-200
-150
-100
-50
Fig. 2.5 Transmissibility of external vibrations to theCoriolis and actuation displacement (The rest of thetransfer functions have a gain lower then -300 dB)
Bode diagram
Frequency (Hz)
Mag
nitu
de(d
B)
Tycor,ay
Tycor,ay F10Hz
100 101 102-160
-140
-120
-100
-80
-60
-40
Fig. 2.6 Transmissibility of external vibrations in thedominant direction ay to a Coriolis displacement,with and without the phase demodulation includinga 10 Hz band-pass filter.
combined in one vector aaa0 = ax,ay,az,αRx ,αRy ,αRzT . Besides the Coriolis displacement asan output, we also define the actuation displacement (Eq. 2.15) as output. The MIMO systemhas 2 outputs and 6 inputs. This is a model with in total 12 transfer functions. The transmis-sibility functions of external accelerations aaa0 to the actuation and Coriolis displacements aredepicted in Fig. 2.5.
The figure only shows three transfer functions, instead of the 12 we calculated. This isbecause the magnitude of the other nine is below -300 dB, which is approximatively zero,compared to the three remaining transfer functions.
The Coriolis displacement is influenced by a translation in y-direction and a rotationaround the x-axis. Resonance frequencies are visible at the Coriolis modes (39.7, 188 and525 Hz). And the actuation displacement is influenced by a rotation around the z-axis. In thetransfer function, resonance frequencies are visible at the actuation modes. (87 and 353 Hz).The different modes are depicted in Fig. 2.3. Those three dominant directions can be ex-plained using the couplings matrix between the modes of mechanism and the input vector:
VVV T MMM12aaa0 = FFFdisaaa0
=
0.00000 −0.00703 0.00000 0.00007 0.00000 −0.00000−0.00684 −0.00000 −0.00001 −0.00000 −0.00010 0.00018
0.00000 0.00000 0.00000 −0.00000 0.00000 −0.000130.00000 0.00598 −0.00000 0.00015 0.00000 −0.00000
−0.00003 0.00000 0.00837 0.00022 0.00000 0.000000.00425 0.00000 0.00003 0.00000 −0.00015 −0.00011
−0.00000 0.00000 0.00000 −0.00000 −0.00000 −0.000020.00000 0.00151 0.00000 0.00003 −0.00000 −0.00000
aaa0
(2.26)

2
24 Chapter 2 Quantification of the influence of external vibrations
The Coriolis displacement, see Eq. 2.19, measures only the displacements of the first, fourthand eighth mode. When we look at the rows 1, 4 and 8, we see that there are only non-zerovalues in the columns two and four. This indicates that the Coriolis displacement is onlyinfluenced by a translation in y-direction and a rotation around the x-axis.
The phase difference is a function of the Coriolis and actuation displacement (Eq. 2.17).Those displacements is not only introduced by the actuation and due to a mass-flow, but alsoby external vibrations, resulting in an erroneous phase difference:
∆φ(s) = 2ycor(s)
yact(s)≈ 2
|yact|TTT ycor,aaa0(s)aaa0(s) (2.27)
where |yact| is the amplitude of the actuation mode. This amplitude is kept constant, usingfeedback control.
2.3.4 Measurement error
In section 2.3.2.1, is explained how a phase difference between the sensor signals is calcu-lated, using phase demodulation. In the frequency domain, this is similar to a bandpass filteraround frequency ω3 and a frequency shift. First, we add the bandpass filter to Eq. 2.27 andobtain a transmissibility of external vibrations to the phase difference:
TTT ∆φ,aaa0(s) =2
|yact|TTT ycor,aaa0(s)F(s) (2.28)
where F(s) is a band-pass filter with a bandwidth two times the cut-off frequency of the low-pass filter, used in the phase demodulation algorithm. In Fig. 2.6 the dominant transmissibilityincluding a 10 Hz band-pass filter around the frequency ω3 is depicted.
The external vibrations can be a broadband disturbance and the output is a low-frequentmeasurement value, due to the frequency shift. The cumulative influence is investigated bylooking to the cumulative mean square response over the whole frequency range ν, which isgiven by:
σ2∆φ =
∫ ∞
−∞|TTT ∆φ,aaa0(ν)|2ΦΦΦaaa0(ν)dν (2.29)
where ΦΦΦaaa0 is the Power Spectral Density (PSD) function of the disturbance and TTT ∆φ,aaa0 themodelled transmissibility of external vibrations to a phase difference, as partly depicted inFig. 2.6.
Due to the low-pass filter in the phase demodulation, only disturbances around the actu-ation frequency and the Coriolis frequency have an influence on the phase difference, seeFig. 2.6. The result is that a disturbance with a frequency close to the actuation frequency hasa direct impact on a mass-flow reading. In the following section the modelled influence ofexternal vibrations on a mass-flow measurement value is validated experimentally.

2
2.4 Model validation 25
2.4 Model validation
In this section the modelled influence of external vibrations on a mass-flow measurementis validated. The first subsection explains the experimental setup. Second, the transmissibil-ity functions of external vibrations to the actuation and Coriolis displacement are validated.Third, the influence of broadband external vibrations on the mass-flow measurement value iscompared with the estimated value from the model.
2.4.1 Experimental setup
To estimate the transmissibility functions, the reference instrument is mounted on a 6-DOFvibration isolation setup (Fig. 2.7). The platform is suspended at a low frequency in all di-rections (about 22 Hz), using a Stewart type platform, mounted on a rigid floor plate. Theplatform is actuated by six voice coil actuators. For each direction, the vibrations of the plat-form are measured using accelerometers. Using a rigid body model, the relation between thesensor coordinates qqq and Cartesian coordinates xxx = x,y,z,θx,θy,θzT , is derived as:
xxx = RRRqqq (2.30)
The accelerometers on the platform are colocated with the voice coil actuators. Therefore,the matrix RRR−1 is used also to apply forces in the Cartesian coordinate system. The inverseis possible because the use of 6 sensors and 6 Cartesian coordinates. More details of theexperimental setup are given by Tjepkema [64].
CMFM
Platform
Floor
Actuator + Sensor (6x)
Fig. 2.7 Shaker setup - The CMFM (Fig. 2.1) is mounted on a Stewart platform. Voice coil actuators are usedto apply forces on the low frequent (22 Hz) suspended platform and accelerometers are used to measure theplatform vibrations aaa0.

2
26 Chapter 2 Quantification of the influence of external vibrations
The measurements are performed using a National Instruments NI4472 card using a 24kHz sample-rate with 24-bit resolution. To determine the transmissibilities, the platform isexcited using the voice coil motors as shakers. These shakers provide a multi-sine signal,containing frequencies between 1 and 550 Hz. Accelerometers (Endevco 7703A-1000) onthe platform body are used to measure the input disturbance aaa0, while optic sensors insidethe CMFM are used to measure the tube-window displacement.
Power Spectral Densities (PSD) of the different discrete-time signals are estimated viaWelch’s method. To apply the method, we use the Matlab function pwelch. In total a datasetof 60 s of measurement is used. To reduce the noise level, the method uses a 24k-pointsymmetric Hanning window. The performance is evaluated by the transmissibility function.This transfer function is estimated with the Matlab function tfestimate. Again, using adataset of 60 s and a 24k-point symmetric Hanning window.
2.4.2 Transmissibility
In this subsection the transmissibilities of external vibrations to the actuation and Coriolisdisplacement are validated. The modelled functions are given in section 2.3.3. First, the threedominant directions are estimated and second, we validate that the three functions are suffi-cient enough to describe the sensitivity of external vibrations.
2.4.2.1 Dominant directions
In section 2.3.3, we explained that are three dominant directions of the 6 external vibrationsto the actuation and Coriolis displacement. In this section, we validate those three directions,using the setup described in section 2.4.1. The actuators excite the platform with a randomsignal in one direction only and the sensors measure the displacement of the tube-windowand the accelerations of the platform. Based on both datasets a transfer function is estimated.This is done for all three dominant directions.
The results of the three experiments are given in Fig. 2.8. The modelled results agreewell with the experimental results. Clearly visible are the undamped resonance frequenciesof 42 and 88 Hz and the gain is as expected. The estimated transmissibility Tycor,αRx
showsan extra peak at 22 Hz. This is a resonance frequency of the platform. In this measurementthe platform is not only rotating, but also translating in y-direction with frequencies mainlyaround the suspension frequencies. Because the transmissibility Tycor,ay is larger than Tycor,αRx
,we cannot assume an uncoupled system and we see the effect in the estimation of Tycor,αRx
.

2
2.4 Model validation 27
ay to ycor
Frequency (Hz)
Mag
nitu
de(d
B)
αRx to ycor
Frequency (Hz)
αRz to yact
Frequency (Hz)101 102101 102101 102
-200
-180
-160
-140
-120
-100
-80
-200
-180
-160
-140
-120
-100
-80
-160
-140
-120
-100
-80
-60
-40
Fig. 2.8 Transmissibility of external vibrations to the actuation and Coriolis displacement. Experimentalresults ( ) are compared to the modelled results ( ) , as given in Fig. 2.5
2.4.2.2 Broadband 3D disturbance
In the previous subsection we showed three dominant directions. Now, we need to knowif those three functions are indeed the important directions. Therefore, we apply a frequencydependent force in all six directions and measure the actuation and Coriolis displacement, andthe six disturbances. Now, the measured and the estimated displacement can be compared.The frequency content of a signal can be described by its Power Spectral Density (PSD), sowe will compare the PSDs of both signals. The estimated PSDs are calculated as:
ΦΦΦyact = |TTT yact,aaa0 |2ΦΦΦaaa0 ≈ |Tyact,αRz|2ΦΦΦαRz
(2.31)
ΦΦΦycor = |TTT ycor,aaa0 |2ΦΦΦaaa0 ≈ |Tycor,ay |2ΦΦΦay + |Tycor,αRx|2ΦΦΦαRx
(2.32)
The actuation displacement is, according to the model, only dependent on an Rz-disturbance,while the Coriolis displacement is dependent on a y- and Rx-disturbance. The PSDs ΦΦΦaaa0 ofthe applied external vibrations are shown in Fig. 2.10 (Experiment 4). This is an approxi-mately broadband flat disturbance in all translation and rotational directions. Clearly visibleare the resonance frequencies of the platform. The disturbance is acquired with a multi-sinedisturbance between 1 and 550 Hz. For comparison, the Vibration Criterion (VC) curves [23]are added. The VC-curves are meant as upper bounds for the peaks in the external vibrationspectrum. The applied broadband disturbance is not a realistic external vibration, but is usedto compare different CMFMs.
In Fig. 2.9 the measured PSDs of the actuation and Coriolis displacements are comparedto the estimated ones (Eq. 2.31 and 2.32), which are similar. For ΦΦΦyact , the largest difference isthat there are resonance frequencies visible at 42, 61, 88 and 183 Hz. This clearly are modesof the system and do have an influence on the actuation displacement. In the model they do

2
28 Chapter 2 Quantification of the influence of external vibrations
a0 to yact
Frequency (Hz)
PS
D(m
2/H
z)
a0 to ycor
Frequency (Hz)101 102101 102
10−10
10−12
10−14
10−16
10−18
10−20
10−14
10−16
10−18
10−20
10−22
Fig. 2.9 Measurement ( ) compared to the estimation ( ), based on Eq. 2.31 and 2.32
Table 2.1 Comparison of natural frequencies between model and experiment
Mode Model Experiment Descriptionf (Hz) f (Hz)
1 39.7 42.2 Coriolis mode2 60.3 61.1 In plane mode3 87.0 88.3 Actuation mode4 188 183 Second Coriolis mode5 194 193 In plane mode6 274 238 In plane mode7 353 335 Second actuation mode8 525 500 Third Coriolis mode
not turn up, because we assumed perfect sensors: a pure y-displacement and an equal sensorgain. At low and high frequencies the noise-level of the sensor is visible.
In practice the actuation displacement is of less importance, because the actuated displace-ment is much larger than the effect of external disturbances. For the mass-flow measurement,the Coriolis displacement is more important.
The other approximation ΦΦΦycor is better. The power density is equal, except a pole-zerocancellation is visible at 61 Hz. This is an in-plane mode of the tube-window (Fig. 2.3(b)).This comparison confirms that there are indeed only two dominant directions, regarding theCoriolis displacement.
Another result of this experiment is that the resonance frequencies of the tube-window areestimated. The comparison, for the first eight resonance frequencies, is given in Table 2.1.This comparison confirms that there is a good dynamical model available.

2
2.4 Model validation 29
Frequency (Hz)
PS
D((
m/s
2)2
/Hz)
Residental
VC-A
VC-C
VC-E
Experiment 1
Experiment 2
Experiment 3
Experiment 4
Experiment 5
101 10210−9
10−7
10−5
10−3
(a) Translational disturbances - ax,ay,az
Frequency (Hz)
PS
D((
rad/
s2)2
/Hz)
Experiment 1
Experiment 2
Experiment 3
Experiment 4
Experiment 5
101 10210−7
10−5
10−3
10−1
(b) Rotational disturbances - αRx ,αRy ,αRz
Fig. 2.10 Measured external vibration PSDs ΦΦΦaaa0 of 5 experiments compared to VC-curves to show the mag-nitude of the disturbance. The applied disturbances are relatively large in comparison to real floor spectra.x ( ), y ( ), z ( )
Table 2.2 RMS measurement error due to applied disturbance (Fig. 2.10), values are normalised by the firstvalue.
Experiment Disturbance az Measurement value instrument Model estimation σ∆φ
RMS (m/s2) RMS (rad) (Eq. 2.29) (rad)
1 0.0078 1.000 0.20452 0.0091 2.037 1.8313 0.0174 5.680 5.7454 0.0527 17.63 18.255 0.1684 56.20 56.81
2.4.3 Flow error
In section 2.3.4, we explained how the influence of external vibrations cumulatively add up tothe RMS measurement error. In this subsection we apply disturbances in all directions with adifferent magnitude. Then we compare the RMS measurement value with the estimated one(Eq. 2.29), to validate the influence of external vibrations. The PSDs of several experiments,with a multi-sine disturbance between 1 and 550 Hz, are given in Fig. 2.10. Using this data,σ∆φ is calculated. The results are given in Table 2.2. For experiment 2-5 the estimation isconsistent with the measured value. In the first experiment the measured value is comparableto the noise floor of the measurement value and the estimation shows that the noise floor islarger than the effect of external vibrations.

2
30 Chapter 2 Quantification of the influence of external vibrations
Referring back to Fig. 2.6, we see that the influence is mainly due to external disturbanceswith frequencies around the Coriolis (42 Hz) and the actuation frequency of 88 Hz. Theeffect around the actuation frequency can only be reduced, without affecting the mass-flowmeasurement, by lowering the transmissibility function TTT ycor,aaa0 .
2.5 Discussion
In section 2.4, we validated the model and saw that we can quantitatively estimate the in-fluence of external vibrations on the mass-flow measurement. In this section we show firstthat the number of relevant degrees of freedom can be reduced further and secondly how themeasurement error can be reduced.
2.5.1 Direction dependency
Section 2.4.2 showed that the Coriolis displacement is influenced by one translational andone rotational external vibration. Especially for the rotational input, the point where the ex-ternal accelerations are imposed is important. In Fig. 2.11(a), the front view of the CMFMFEM model (Fig. 2.2) is shown. At the bottom, the coordinate system xyz is given. A y-translation and Rx-rotation result both in a Coriolis displacement, which is also an out-of-plane y-translation.
The flow induced displacement is mainly due to the first Coriolis mode shape, seeFig. 2.4(b). In Eq. 2.26, we saw that this mode is actuated by a y-translation and Rx-rotation,due to the non-zero values in the columns two and four, on the first row. Now, we can trans-late the coordinate system xyz with a z-displacement, resulting in the new coordinate systemx′y′z′ (see Fig. 2.11(a)). Then again the matrix FFFdis is calculated to see the effect of exter-nal vibrations on the first mode. The effect of a Rx-rotation on the first mode is shown inFig. 2.11(b), by means of FFFdis(1,4). The result shows that when the coordinate system xyz
is translated by zh≈ 0.4, the influence of a Rx-rotation on the first mode is approximating
zero. Whereby the location is dependent on the dimensional properties of the tube-window.Note that thus the measurement of external vibration in the y-direction on this new point issufficient to quantitatively estimate the RMS mass-flow error.
Therefore, the influence of external vibrations can be approximated quite well by a 1Dmodel of one translational external vibration to the Coriolis displacement. This can be donewith a mass-spring model, containing the modal mass and stiffness of the first Coriolis mode.

2
2.5 Discussion 31
ζ
h
x
z
x′
z′
(a) Front view of the FEM model of theCMFM. The instrument has a height h and ex-ternal vibrations are imposed at the origin of thecoordinate system xyz.
Axis z-translation zh(−)
|Fdi
s(1,
4)|
0 0.2 0.4 0.6 0.8 10
1
2
×10−4
(b) Influence of a Rx-rotational disturbance on the firstmode shape, by depicting FFFdis(1,4) (Eq. 2.26) as functionof the displacement
Fig. 2.11 Influence of shifting the coordinate system xyz
2.5.2 Reducing influence of external vibrations
The influence of external vibrations can be estimated, using the disturbance ΦΦΦaaa0 and thetransmissibility TTT ∆φ,aaa0 (Eq. 2.29):
σ2∆φ =
∫ ∞
−∞|TTT ∆φ,aaa0(ν)|2ΦΦΦaaa0(ν)dν =
∫ ∞
−∞
∣∣∣∣
2|yact|
TTT ycor,aaa0(ν)F(ν)
∣∣∣∣
2
ΦΦΦaaa0(ν)dν (2.33)
Reducing the disturbance ΦΦΦaaa0 by implying stringent requirements on the surroundings isnot possible in many applications. Therefore, the transmissibility TTT ∆φ,aaa0 should be minimal,implying a good filter algorithm and/or mechanical design of the instrument.
The transmissibility can be reduced by applying passive vibration isolation. Passive isola-tion consist of several stages of mass-spring-damper systems between the floor and the casingof a machine [53]. The parameters should be adjusted to achieve high-frequency attenuation.The reduction of the transmissibility will be subject of future research.

2
32 Chapter 2 Quantification of the influence of external vibrations
2.6 Conclusions
In this study a model of a CMFM is derived to understand and quantify the influence ofexternal vibrations on the mass-flow measurement. In an experiment predefined vibrationsare applied on the casing of the CMFM and the RMS measurement error is determined. Theexperimental results correspond well on a qualitative and quantitative level with the modelledresults.
The result is an significant extension of the work of Cheesewright [13], not only the fre-quencies are shown where the CMFM is sensitive for external vibrations, but also a quanti-tative estimation of the expected mass-flow error is given, based on the modelled transmissi-bility function.
The agreement between model and measurements implies firstly that the influence of anyexternal vibration spectrum on the flow error, with some limitations due to linearity of themodel, can be estimated. Thereby, the suitability of a certain location for the placement ofa CMFM can be determined. Secondly, the insight in the relation between vibration spectraand the flow error, the transmissibility, can be used to compare the performance of differentCMFM designs and to optimise the performance by shaping their respective transfer func-tions.
3
Chapter 3
Active vibration isolation feedback control
Abstract Active Vibration Isolation Control (AVIC) can be used to reduce the transmissibil-ity of external vibrations to internal vibrations. In this paper a proposal is made for integratingAVIC in a Coriolis Mass-Flow Meter (CMFM). Acceleration feedback, virtual mass and vir-tual skyhook damping are added to a passively suspended CMFM, resulting in a loweredsuspension frequency. In addition, position feedback of the internal deformation is used todamp the internal mode. The controller design is based on a simplified model and is validatedon an experimental setup. Results show that the sensitivity to external vibrations is reducedby 40 dB for the RMS measurement error.
This chapter is reprinted from: L. van de Ridder, M. A. Beijen, W. B. J. Hakvoort, J. vanDijk, J. C. Lötters, and A. de Boer. Active vibration isolation feedback control for coriolismass-flow meters. Control Engineering Practice, 33C:76–83, 2014. URL http://dx.doi.
org/10.1016/j.conengprac.2014.09.007, with permission from Elsevier.

3
34 Chapter 3 Active vibration isolation feedback control
3.1 Introduction
A Coriolis Mass-Flow Meter (CMFM) is an active device based on the Coriolis force prin-ciple for direct mass-flow measurements, with high accuracy, range-ability and repeatabil-ity [1]. The working principle of a CMFM is as follows: a fluid conveying tube is actuated tooscillate at a low amplitude, whereby a resonance frequency is used to minimise the amountof required energy. A fluid-flow in the vibrating tube induces Coriolis forces, which are pro-portional to the mass-flow, and affect the tube motion resulting in a change of the modeshape. Measuring the tube displacement in such a way that the change of its mode shape isdetermined, allows calculating the mass-flow.
External vibrations create additional components in the CMFM sensor signals and suchadditional components can introduce a measurement error [14]. For low flows, the Coriolisforce induced motion is relatively small compared to motions induced by external vibrations,thus CMFMs designed to be sensitive to low flows are rather sensitive to external vibrations.The effect of external vibrations on the sensor response of a CMFM has been studied previ-ously in Chapter 2. This study showed that external vibrations around the meter’s drive andCoriolis frequencies produce a measurement error, regardless of the phase detection algo-rithm used. A quantitative estimation of the expected mass-flow error in response to externalvibrations can be obtained from the transmissibility function (Chapter 2).
To reduce the sensitivity of the flow measurement with respect to external vibrations, pas-sive or active vibration isolation can be used. Passive isolation consists of several stages ofmass-spring-damper systems between the floor and the casing of a machine [53]. The pa-rameters are adjusted to achieve high-frequency attenuation, which is suitable for many ap-plications. However, the performance of passive isolation applied to a CMFM is limited dueto a minimal suspension frequency, which is caused by the parasitic stiffness of the fluid-connecting-tubes and the maximum allowable gravitational sagging of the stage. Those largedeformations in the fluid-connecting-tubes result in high internal stresses. An alternative ap-proach is to apply active vibration isolation control to a flexible-suspended single-tube con-figuration. This is an application of active hard mount isolation for precision equipment [64].
In this paper, active vibration isolation is applied to a CMFM is investigated, to optimisethe shape of the transmissibility function of a CMFM from external vibrations to the mea-surement value. The objectives of the present work are summarised as follows:
1. Shaping the transmissibility from external vibrations to the internal displacement by ac-tively reducing the suspension mode to lower the transmissibility at the actuation fre-quency of the CMFM.
2. Adding damping to the internal deformation mode, the Coriolis mode, to limit the effectof shock disturbances.
3. Avoiding that the flow measurement sensitivity changes.
A control algorithm that satisfies the stated objectives is presented and tested. The algo-rithm is a combination of known feedback strategies for vibration isolation [34, 77, 52]. Thenovelty is the smart combination of those algorithms: acceleration feedback, velocity feed-back, internal mode damping, cascade control and loop shaping; tuned, modified and appliedto the specific application of Coriolis Mass-Flow Meters. Notably, the requirement that the

3
3.2 Material 35
flow measurement should not be affected, requires some dedicated modifications to the algo-rithms. The algorithm is not yet integrated within a commercial CMFM, but implemented ata test setup, consisting of an external isolator platform and a CMFM. Therefore, we presenta proof-of-principle of the feasibility of integrating active vibration control into the design ofCMFMs.
In section 3.2, the reference instrument and the experimental test-setup are discussedbriefly, including the model describing the influence of external vibrations. In section 3.3,a simplified dynamic model of the essential dynamics is presented and a control algorithm isdesigned to meet the objectives stated above, the main contribution of this paper. Experimen-tal results of the proposed control design that validate the model are presented in section 3.4.The results are discussed in section 3.5 and section 3.6 finalises this paper by drawing con-clusions.
3.2 Material
In this section, the materials used and the analysis methods are described. In the first subsec-tion, a model of a CMFM is presented and is further explained; how the external vibrationsaffect the measurement value. A vibration isolator setup is presented in section 3.2.2, whichwill be used to provide external vibrations and active vibration isolation to the casing of aCMFM. In the final subsection a simplified model is given, consisting of the CMFM and thevibration isolator setup, to meet the performance objectives.
3.2.1 Reference instrument
For this research a functional model of the patented design [45, 44] (see Fig. 3.1) is used. First,a Finite Element Method (FEM) model is derived, using the multi-body package SPACAR[31]. The graphical representation of the model is shown in Fig. 3.2. The model consistsof a tube, conveying the fluid flow, which is actuated by two actuators act1 and act2. Themoving part of the tube has a rectangular shape and is referred to as the tube-window. Thedisplacements of the flexible tube-window are measured by two displacements sensors s1
and s2. On the casing a vector aaa0 ∈ R6x1, representing the external vibrations and consisting
of three translations and three rotational movements, is imposed. The model is made out ofmulti-body beam, truss and tube elements [47]. The beam elements are used to model therigid casing and the truss elements to measure relative displacements and to apply a force onthe tube-window. Further, a tube-element is used to model the inertial interaction between theflow and the tube dynamics.
The mass, damping and stiffness matrices are the result of the multi-body model, whichare used to compute the mode-shapes and resonance frequencies of the tube-window. Thefirst mode is a rotation of the tube-window around the θswing-axis, with a natural frequency of39 Hz. This first mode is termed a Coriolis mode, because this mode is mainly excited when

3
36 Chapter 3 Active vibration isolation feedback control
Fig. 3.1 Coriolis Mass Flow Meter [45]. The in-strument is connected to a pipeline; a fluid flowenters the instrument (6), flows trough the tube-window (2) and exits the instrument (7). The flex-ible tube-window (2) is actuated in resonance byan Lorentz actuator (8) and the displacements aremeasured by optical displacements sensors (11a-c) [46].
Casing
Tube-window
act1
act2
s1s2
aaa0
θswing
θtwist
xy
z
Fig. 3.2 CMFM multi-body model (Chapter 2);the flexible tube-window is actuated by twoLorentz actuators act1 and act2. The displace-ment is measured by two displacements sensors,s1 and s2. On the casing, a vector aaa0 with floormovements is imposed.
CMFM
Platform
Floor
Actuator (VCM) + Sensor (6x)
Actuator (Piezo) (4x)
Fig. 3.3 Shaker setup - the CMFM is mounted on a Stewart platform. Voice coil actuators are used to applyforces on the low frequency (22Hz) suspended platform and accelerometers are used to measure the platformvibrations aaa1 and external vibrations aaa0.
there is a mass-flow, due to the Coriolis effect. The second mode, with a natural frequencyof 60 Hz, is termed an in-plane mode, because it has no displacement in the direction ofthe sensors. The third mode is the actuation mode, because the tube-window is actuated tooscillate in resonance around the θtwist-axis at 87 Hz. When the third mode is actuated and

3
3.2 Material 37
there is a mass-flow, the Coriolis mode is also actuated at the actuation frequency, due tothe anti-symmetric elements of the damping matrix. This coupling occurs due to the Corioliseffect and is proportional to the mass-flow Φm and angular velocity θtwist of the tube. Anexpression for the Coriolis force Fcor is given by:
Fcor =−2L(θtwist × Φm
)(3.1)
where L is the effective length of the Coriolis tube.The CMFM is equipped with two displacements sensors s1 and s2 to measure internal
deformations. The differential-mode yact =1/2(s1 − s2) is termed the actuation displace-
ment, because it indicates a rotation around the θtwist-axis which is controlled actively bythe Lorentz actuator (act1 and act2). The common-mode ycor =
1/2(s1 + s2) is termed theCoriolis displacement, which indicates a rotation around the θswing-axis. When there is nomass-flow, the tube window is rotating around the θtwist-axis, such that the phase between thesignals s1 and s2 is equal to 180. When there is a mass-flow, the phase of the sensor signalswill change, because the Coriolis effect is 90 out of phase with the actuation. Where thephase-difference between the two sensor signals is approximately proportional to the mass-flow [61]. The phase-difference between the sensor displacements s1 and −s2 is approximatedas:
∆φ = φ1 −φ2 ≈ 2|s1 + s2||s1 − s2|
= 2|ycor||yact|
(3.2)
where the actuation amplitude |yact| is controlled in a feedback loop, resulting in an oscillationwith a constant amplitude. The Coriolis displacment |ycor| is the amplitude of the sine, 90 outof phase with the actuation sine. But this displacement ycor is not a pure sine, it is a functionof the Coriolis force Fcor and the external vibrations aaa0. In the Lapace s-domain, it is writtenas:
ycor(s) = Tycor,Fcor(s)Fcor(s)+TTT ycor,a0(s)aaa0(s) (3.3)
The force Fcor only occurs at the actuation frequency, see Eq. 3.1, but the external vibrationsmight be broadband. The transmissibility TTT ycor,a0
(s) gives the influence of external distur-bances on the Coriolis displacement. The transfer function Tycor,Fcor(s) gives the influence ofthe Coriolis force Fcor on the Coriolis displacement. Both transfer functions are obtained fromthe SPACAR model. To determine the amplitude of the Coriolis displacement at the actua-tion frequency, the signal is filtered to remove all information outside the actuation frequencyband:
ycor,filt(s) = ycor(s)F(s) (3.4)
where F(s) is a 10 Hz bandpass filter around the actuation frequency ωact = 87 ·2π rad/s. Toobtain the amplitude at the actuation frequency ωact, a frequency-shift is applied:
ycor,filt,shift(s) = ycor,filt(s− iωact) (3.5)

3
38 Chapter 3 Active vibration isolation feedback control
Besides a mass-flow, also external vibrations have an influence on this displacement, seeEq. 3.3. Those external vibrations are mostly broadband and can be characterised by a powerspectral density ΦΦΦaaa0 , which describes how the power of the signal aaa0 is distributed over thevarious frequencies. The influence of each frequency adds up in the cumulative RMS value,using Parseval Theorem:
σ2ycor,filt
=∫ ∞
−∞ΦΦΦycor,filt(ν)dν =
∫ ∞
−∞
∣∣∣TTT ycor,aaa0
(ν)F(ν)∣∣∣
2ΦΦΦaaa0(ν)dν (3.6)
where the mass-flow effect, which adds up linearly, has been omitted. To estimate the in-fluence of external vibrations on the Coriolis displacment, the filtered Coriolis displacement(Eq. 3.4) is used, because the frequency shift only changes the integration interval. UsingEq. 3.2 and 3.6, the influence of external vibrations on the phase difference can be estimated:
σ∆φ =2
|yact|σycor,filt =
√∫ ∞
−∞
∣∣∣∣
2|yact|
TTT ycor,aaa0(ν)F(ν)
∣∣∣∣
2
ΦΦΦaaa0(ν)dν (3.7)
Reducing the influence for a certain disturbance ΦΦΦaaa0 can be realised by: reducing the trans-missibility TTT ycor,aaa0(s), applying a smaller band-pass filter F(s) or increasing the actuationamplitude yact. A smaller band-pass filter has a direct impact on the response time of theCMFM and is therefore undesirable. The actuation amplitude is also limited in practice, e.g.,by actuator saturation, sensor range or material strength. The transmissibility TTT ycor,aaa0(s) canbe reduced using passive or active vibration isolation. The feasibility of both is explored inthis paper, whereby attenuation is needed in a band around the actuation frequency, where theband-pass filter has high gain.
In Chapter 2 it has been shown that the only relevant disturbance is a translation of thecasing in the direction of the sensors, since this direction actuates the Coriolis mode directly.Therefore, only this direction is considered in this paper. Moreover, it has been shown thatthe essential dynamics of the response to vibrations in this direction can be modelled by amass-spring model representing the Coriolis mode (Chapter 2). The parameters of this modelare obtained from modal reduction.
3.2.2 Vibration isolator setup
To evaluate the possibilities for active vibration isolation, the reference instrument is mountedon a 6-DOF vibration isolation setup (Fig. 3.3). The platform is suspended at a low frequencyin all directions (about 22 Hz), using a Stewart type platform, mounted on a rigid floor plate.The platform is actuated by six voice coil actuators. The floor plate is equipped with fourpiezoelectric actuators to apply external vibrations. The vibrations of the floor and platformcan be measured using accelerometers, for each direction. More details about the experimen-tal setup can be found in Tjepkema [64].

3
3.2 Material 39
Using a rigid-body model, the relation between the sensor coordinates qqq and the accel-erations in Cartesian coordinates xxx = (x,y,z,θx,θy,θz), based on the Cartesian coordinatesystem, is derived as
xxxi = RRRiqqqi, RRRi ∈ R6x6, i = 0,1 (3.8)
Vectors qqq0 and qqq1 describe the measured floor and platform motion, respectively, while xxx0
and xxx1 describe the same motions transformed to cartesian coordinates. The accelerometerson the platform are orientated in the direction of the voice coil actuators. Therefore, the matrixRRR−1
1 is used to apply forces in the Cartesian coordinate system.For active vibration isolation, the setup is controlled by a dSpace digital signal processor
system using a sample frequency of 6.4 kHz. Accelerometers on the platform are used toimplement acceleration feedback. The measurements of the internal deformations are used todamp the Coriolis mode and to determine the mass-flow.
Power Spectral Densities (PSD) of the different discrete-time signals are estimated viaWelch’s method. To apply the method, the Matlab function pwelch is used. In total a datasetof 60 s of measurement is used. To reduce the noise level, the method uses a 24k-pointsymmetric Hanning window. The performance is evaluated by the transmissibility function,which is estimated using the aforementioned PSDs.
3.2.3 Combined model for control
In this subsection, we describe the model of the total system, i.e. when the CMFM is mountedon the vibration isolator, see Fig. 3.3. This model, shown in Fig. 3.4, is used to design thefeedback controllers.
A multi-body model of a CMFM was derived in previous work and summarised in sec-tion 3.2.1. The CMFM is represented by the masses m1 and m2, representing the casing andthe moving tube respectively. The equivalent stiffness k2 and equivalent mass m2 representthe Coriolis mode. The internal displacement ycor is measured by displacement sensors. Themounting of the CMFM onto the vibration isolator, is represented by the additional casingmass m1 and mounting stiffness k1. The total actuator force of the voice coil actuators isrepresented by Fa.
In this model, the actuation mode is omitted, because this mode is orthogonal to the Cori-olis mode. However, the actuation mode is coupled with the Coriolis mode by means of theCoriolis force (eq. 3.1):
Fcor ∝ yact × Φm (3.9)
This force induces a Coriolis displacment ycor. By applying this model, the effect of externalvibrations y0 on ycor can be compared to the effect of flow Φm, see Eq. 3.3.
This model is used to design a controller that meets the objectives as defined in section 3.1.In terms of the model variables, these objectives can be described as follows. First the trans-missibility from y0 to ycor is reshaped using a passive suspension and active feedback (first

3
40 Chapter 3 Active vibration isolation feedback control
y1
y2
y0
m1
m2
k1
k2
d1
d2
Fa
Fcor
y1
ycor
C(s)
Floor
Suspended platform+ CMFM casing
CMFM tube
Fig. 3.4 Mass-spring model for active vibration isolation. External vibrations are denoted by y0. The mass ofthe suspended platform including the CMFM casing is represented by m1 and the suspension of the platformis formed by spring k1. The Coriolis mode of the CMFM tube is represented by m2 and k2. Sensors are placedto measure y1 and ycor = y2 − y1. Force Fa represents the actuator.
and second objective):
TYcor,Y0(s) =
Ycor(s)
Y0(s)(3.10)
Second, no interference with the flow measurement (third objective) is realised by leaving thefollowing transfer function unchanged:
GYcor,Fcor(s) =Ycor(s)
Fcor(s)(3.11)
In this study, three different configurations are considered: (1) a reference model configura-tion, whereby the CMFM is connected rigidly to the floor; (2) the case, whereby the CMFMis passively suspended on the vibration isolator; and (3) the case in which active vibrationisolation is added to the passively suspended CMFM. The passive and active model have thesame physical parameters, as given in Table 3.1. Notice the ratio between the masses m1 andm2; the mass of the Coriolis tube is small compared to that of the casing mass.
Table 3.1 Model parameters for all presented configurations of mass-spring model given in Fig. 3.4
Model m1 d1 k1 m2 d2 k2
(kg) (N s/m) (N/m) (kg) (N s/m) (N/m)
Reference 1.2 ∞ ∞ 5.2×10⁻⁵ 9×10⁻⁶ 3.6Passive 6.5 20 1.25×10⁵ 5.2×10⁻⁵ 9×10⁻⁶ 3.6Active 6.5 20 1.25×10⁵ 5.2×10⁻⁵ 9×10⁻⁶ 3.6

3
3.3 Control design 41
3.3 Control design
In this section, it is explained how active vibration isolation control can be used to improvethe performance of a CMFM. In the first subsection, a feedback controller design is proposedthat fulfils the first performance criterion. Second, an additional controller is presented todamp the internal mode, fulfilling the second and third criteria. In the final subsection theperformance of the designed controllers is discussed.
3.3.1 Reducing the transmissibility
Reconsider the model from Fig. 3.4. We will use acceleration feedback, by measuring y1, toreduce the transmissibility of external vibrations to the platform. The following system hasto be controlled:
Gpl(s) =Y1(s)
Fa(s)=
1m1
s2(s2 +2ζωars+ω2ar)
(s2 +2ζω1s+ω21)(s
2 +2ζω2s+ω22)
(3.12)
≈ 1m1
s2
s2 +2ζω1s+ω21
(3.13)
Where ω1 and ω2 are the resonance frequencies and ωar is the anti-resonance frequency ofthe mass-spring system of Fig. 3.4. The approximation in Eq. 3.13 is valid because m2 ≪ m1,see Table 1. In that case, a pole/zero cancellation occurs because ω2 ≈ ωar =
√
k2/m2, whileω1 ≈
√
k1/m1.In van Dijk [77] a method is described to reduce the transmissibility of external vibrations
using feedback control. In this method, virtual mass and virtual skyhook damping are addedto m1. The effect of adding virtual mass is that the suspension frequency is actively reduced,resulting in more vibration isolation in the region of interest. A virtual skyhook damper addsdamping to the suspension mode without affecting the vibration isolation at high frequen-cies [34]. A PI controller is used to add virtual mass by the proportional (P) action and virtualskyhook damping by the integrating (I) action [77]:
C1(s) =Fa(s)
Y1(s)=−
(
Ka +Kv
s
)
(3.14)
According to van Dijk [77], Ka and Kv are calculated as follows:
Ka = m1
(
f 2susp
f 2n
−1
)
(3.15)
Kv = 2ζnm1fsusp
fn
(2π fsusp
)(3.16)

3
42 Chapter 3 Active vibration isolation feedback control
In these equations, fn is the desired closed loop suspension frequency with relative dampingζn and fsusp = ω1/2π = 22 Hz is the passive suspension frequency of the platform. The lowerthe value of fn, the greater the isolation. The achievable fn is limited to 14 Hz, due to closedloop stability limitations of the experimental setup. Therefore, we set fn = 14 Hz with 70%skyhook damping (ζn = 0.7). The corresponding controller gains for C1(s) are Ka = 9.6 andKv = 1977. The attenuation at the actuation frequency of the CMFM is approximated by:
TY1,Y0(s)≈ ω2
1
s2 +ω21
→ |attenuation|= ω21
ωact2
(ωact
2 >> ω21
)(3.17)
This results in an attenuation at the actuation frequency of 24 dB for the passive case withfsusp = 22 Hz. Adding active vibration control, the attenuation becomes 32 dB, as shownin Fig. 3.6. In the region of interest, the improvement is only 8 dB with respect to passiveisolation. The figure also shows that this controller has an infinite bandwidth, because theplot of the active system is under the plot of the passive system at all frequencies. Therefore,this controller cannot be implemented in practice.
To improve the performance of the active system, three loop shaping filters are added toC1(s). This results in an expression for controller C2(s):
C2(s) =Fa(s)
Y1(s)=C1(s)
s2
s2 +2ζfω f s+ω2f
︸ ︷︷ ︸
H1(s)
ω2r
s2 +2ζrωrs+ω2r
︸ ︷︷ ︸
H2(s)
s+ωz
ωz︸ ︷︷ ︸
H3(s)
(3.18)
The term H1(s) is a second-order highpass filter at ωf = 1 ·2π rad/s with ζf = 0.7. This filter isused to cut off the integrating action at low frequencies and to prevent actuator saturation. Theterm H2(s) is a second-order low-pass filter at ωr = 87 ·2π rad/s which is equal to the actuationfrequency of the CMFM tube. This low-pass filter limits the open-loop controller bandwidth,which is necessary to prevent instability due to higher-order dynamics. The relative dampingof H2(s) is set sufficiently low (ζr = 0.07) such that a resonance peak appears in the controllerat 87 Hz. The resonance peak strongly increases the controller action -and thus the vibrationisolation- in a narrow frequency band around ωr. In our case, this narrow frequency band isdesigned such that vibration isolation is increased in the region of interest, adding 1
2ζr= 17
dB of extra attenuation. The term H3(s) is a zero at ωz = 140 ·2π rad/s. For stability reasonsthis zero is added to increase the phase margin at the high cross-over frequency, which is thefrequency where the loop gain Gpl(s)C2(s) is equal to 1. Bode plots of the controllers C1 andC2 are depicted in Fig. 3.5.
The vibration isolation performance of the active system using C2(s) is also shown in Fig.3.6. Compared with C1(s), controller C2(s) provides more vibration isolation in the region ofinterest because of the poorly damped resonance filter in H2(s). Furthermore, it is observedthat the bandwidth is limited to 140 Hz, because at this frequency the performance of theactive system equals that of the passive system. Therefore, controller C2(s) performs betterthen C1(s).

3
3.3 Control design 43
Frequency (Hz)
Mag
nitu
de(d
B)
Bode diagram: Controllers
C1(s)C2(s)Ccor(s)
10−1 100 101 102 103-20
0
20
40
60
80
100
120
Fig. 3.5 Bode magnitude plot, showing the three different controllers
Frequency (Hz)
Mag
nitu
de(d
B)
Bode diagram: Transmissibility from y0 to ycor
Region of InterestNo VIPassive VIActive VI C1(s)Active VI C2(s)
100 101 102-200
-180
-160
-140
-120
-100
-80
-60
-40
Fig. 3.6 Bode magnitude plot, showing the vibration isolation (VI) transmissibility in the case of no VI,passive VI and active VI. The focus for VI is on the region of interest, because the CMFM uses this frequencyband to measure the mass flow, see Eq. 3.5
3.3.2 Damping the Coriolis mode
Controller C2(s) increases the vibration isolation in the region of interest. However, the 39 HzCoriolis mode of the tube is still undamped. See Fig. 3.6; the internal mode is invisible forthe acceleration sensors because of a pole/zero cancellation, zie Eq. 3.13, because m1 ≫ m2.Although the Coriolis mode is outside the region of interest, it must be damped to prevent

3
44 Chapter 3 Active vibration isolation feedback control
that the tube moves out of the sensor range. Moreover, the definition of the region of interestis not very strict, so a high peak just outside this region will still increase the sensitivityfor external vibrations.. Therefore, a second controller Ccor(s) is added to the system thatdamps the Coriolis mode of the tube. This is achieved by measuring ycor and feeding thisdisplacement back to Ccor(s). The output of Ccor(s) is provided to the same actuators as usedfor C2(s). The block scheme in Fig. 3.7 shows the resulting controller structure. In this figure,Gpl(s) is given by Eq. (3.12), and Gcor(s) is given by:
Gcor(s) =Ycor(s)
Fa(s)=
−s2
m1(s2 +2ζω1s+ω21)(s
2 +2ζω2s+ω22)
(3.19)
y1Gpl(s)
Gcor(s)Fa
ycorPcor(s)
Ccor(s)
C2(s)
Fig. 3.7 Structure of the combined control loop, formed by the Coriolis mode damping controller Ccor(s) incombination with the previously designed controller C2(s) for reducing the transmissibility.
Before Ccor(s) is designed, first the control loop for controller C2(s) is closed. The closedloop system including C2(s) is then considered as a new "open loop" plant Pcor(s) (see Fig.3.7), for which Ccor(s) is designed. Pcor(s) has the following expression:
Pcor(s) =1
1+C2(s)Gpl(s)Gcor(s) (3.20)
Conventionally, just a differentiating action (D-action) would be used in Ccor(s) to damp theCoriolis mode in Pcor(s). Such a D-action has a phase angle of +90. However, the D-actionis only necessary in the frequency range around the Coriolis mode. At low frequencies, thecontroller gain must be low to prevent stability problems due to the suspension mode. Torealize a controller behaving like a D-action around the Coriolis mode, a second-order high-pass filter for Ccor(s) is used The filter frequency is ωl = 39 · 2π rad/s and relative dampingζl = 0.5. This type of controller is also used in positive position feedback [52], which is usedto damp a specific mode in a system. The filter frequency is set equal to the Coriolis frequencyof the tube, such that at ωl the phase angle is +90. This high-pass filter limits the controlleraction at low frequencies. At high frequencies, the controller gain must be small to preventstability problems caused by unmodeled higher-order dynamics, therefore a single pole is

3
3.4 Experimental results 45
added at 2ωl. Furthermore, Ccor(s) may not influence the actuation mode at 87 Hz, becausethen the flow-induced Coriolis displacement at 87 Hz, which is used to measure the massflow, is reduced by this controller. To ensure that absolutely no control action is performedat the actuation frequency (Third objective), a notch filter will be applied at the actuationfrequency (87 Hz). Omitting the notch filter results in an offset in the measurement value.The notch filter frequency is made adaptive, so that it moves with the actuation frequency,which is dependent on the density of the medium flowing through the tube. This leads to thefollowing design for Ccor(s):
Ccor(s) =Fa(s)
Ycor(s)= kp
s2
(s2 +2ζlωls+ω2l )
2ωl
s+2ωlN(s) (3.21)
The controller gain kp = 200 · 103 is tuned such that the Coriolis mode is damped withoutmaking the closed loop system unstable. The term N(s) represents the adaptive notch filter.The controller is depicted in Fig. 3.5.
3.3.3 Control performance
The modelled transmissibility of the active system with the combined control loop is shownin Fig. 3.8. Compared to the active system using only C2(s), the combined control loop dampsthe resonance peak of the Coriolis mode with 40 dB, while the performance is not negativelyaffected in the region of interest.
The combination of C2(s) and Ccor(s) applied to Coriolis Mass-Flow meters results in alarge attenuation of 49 dB at the actuation frequency, without affecting the sensitivity forflow measurements. Therefore, the control algorithm satisfies the stated objectives and willbe validated in the next section.
3.4 Experimental results
In this section, the model results are validated using the experimental setup, which was de-scribed in section 3.2.2. First, the influence of external vibrations on a Coriolis displacementis validated. Second, the effect of vibration isolation on a mass-flow measurement with andwithout a mass-flow is shown.
3.4.1 Model validation
The frequency response from floor acceleration y0 to Coriolis displacement ycor is measuredto validate the transmissibilities from Fig. 3.8, using the setup described in section 3.2.2.

3
46 Chapter 3 Active vibration isolation feedback control
Frequency (Hz)
Mag
nitu
de(d
B)
Bode diagram: Transmissibility from y0 to ycor
Region of InterestNo VIPassive VIActive VI C2(s)Active VI C2(s)+Ccor(s)
100 101 102-200
-180
-160
-140
-120
-100
-80
-60
-40
Fig. 3.8 Compared to the previously designed active vibration iso-lation system using C2(s), the combined control loop also dampsthe Coriolis mode in the transmissibility.
Frequency (Hz)
Mag
nitu
de(d
B)
Bode diagram: Transmissibility from y0 to ycor
Region of InterestNo VIPassive VIActive VI C2(s)Active VI C2(s)+Ccor(s)
100 101 102-200
-180
-160
-140
-120
-100
-80
-60
-40
Fig. 3.9 Experimental validation of the modelled transmissibilitiesshown in Fig. 3.8.
The experimental results are shown in Fig. 3.9. The measurements show a good agreementwith the modelled results in Fig. 3.8 for the mid-frequency range. At low and high frequencies(< 5 Hz and > 200 Hz), the measurements become noisy because the Coriolis displacement is

3
3.4 Experimental results 47
too low to be measured by the optical sensors and at these frequencies there is no disturbanceprovided to the floor plate. When only passive vibration isolation is used, the poorly dampedsuspension mode of the platform at 22 Hz is clearly visible. Compared to the non-isolatedcase, passive vibration isolation adds 20 dB attenuation in the area of interest. In the case ofactive vibration isolation with controller C2(s), the suspension mode is damped and reducedto 14 Hz. Active vibration isolation results in 46 dB attenuation of vibrations around theactuation frequency, compared to the non-isolated case. Using the combined control loop, theresonance peak of the Coriolis mode at 42 Hz has been dropped by 40 dB, while keeping the46 dB attenuation in the region of interest.
A large difference is the resonance frequency at 188 Hz. This is a higher order mode of thesystem, which is not included in the mass-spring model (Fig. 3.4). Small differences betweenthe modelled and measured transmissibility are also visible. In the case of active vibrationisolation, an additional peak shows up at 150 Hz. This peak is caused by the induction polesof the voice coil actuators, which decrease the phase margin at the cross-over frequency. At30 Hz, a platform suspension mode in another direction is visible as a dip in the transferfunction. At 60 Hz, a pole/zero cancellation shows up, which is caused by the in-plane modeof the flow tube. At the actuation mode at 87 Hz, a pole/zero cancellation also occurs becauseof a small misalignment of the optic sensors. Neither of these differences are expected toaffect the performance significantly. This will be shown in the next subsection.
3.4.2 Influence of external vibrations on the mass-flow measurement
In this subsection, the impact of reducing the transmissibility Tycor,y0 on the measurementvalue ∆φ is shown. For a broadband external disturbance, the influence of each frequency addsup in the cumulative RMS measurement value σ∆φ of a CMFM measurement; see Eq. 3.6. InFig. 3.10, the Power Spectral Density (PSD) of several disturbance levels for the performedexperiments are given. To indicate the level of those disturbances, Vibration Criterion (VC)curves [23] are added. The VC-curves are meant as upper bounds for the peaks in the floorvibration spectrum. For disturbance 1, only the background vibration level of the setup isused. For disturbance levels 2 and 3, the input is shaped to achieve a flat disturbance between10 and 100 Hz with PSD levels of 10−5 and 10−4 (m/s2)2/Hz respectively, provided by thepiezo shakers of the setup. Those levels are chosen for easy comparison of different CMFMinstruments and the bandwidth is chosen such that it contains both the Coriolis and actuationfrequency. The resulting RMS error is given in Table 3.2.
The transmissibility Tycor,y0 is different for each of the four different configurations (ref-erence, passive and active with and without Coriolis mode damping), and the model claimsan attenuation of 24 dB and 49 dB for the passive and active configuration respectively bythe same disturbance input for frequencies around the actuation frequency, see Fig. 3.8. InTable 3.2 is shown that for disturbance 1: the influence reduces for the passive and activeconfigurations with 8.8 dB with respect to the reference configuration. The reduction is lim-ited, because the value, 0.36 rad, is the lower limit due to the measurement noise of thedisplacement sensors, independent of external vibrations. For disturbance 2, the influence re-

3
48 Chapter 3 Active vibration isolation feedback control
PSD of External vibrations
Frequency (Hz)
PS
D((
m/s
2)2
/Hz)
Workshop
Residental
VC-A
VC-C
VC-E Dist. 3Dist. 2Dist. 1
100 101 102 10310−10
10−8
10−6
10−4
10−2
Fig. 3.10 Applied disturbances y0 of the three levels, compared to vibration criterion (VC) curves [23]
Table 3.2 Experimental RMS flow error results of disturbances given in Fig. 3.10 with 10 Hz filter. Valuesare normalised by the first value.
Disturbance Flow Reference Passive Active ActiveC2(s) C2(s) + Ccor(s)
% (rad) (dB) (rad) (dB) (rad) (dB) (rad) (dB)
1 0 1.000 0 0.3762 -8.49 0.3618 -8.83 0.3607 -8.8630 1.125 0 0.3696 -9.67 0.3629 -9.83 0.3441 -10.29100 0.966 0 0.3940 -7.79 0.3596 -8.58 0.3585 -8.61
2 0 17.43 0 1.497 -21.32 0.4018 -32.75 0.3851 -33.1130 18.34 0 1.528 -21.59 0.4129 -32.95 0.3929 -33.38100 17.91 0 1.544 -21.29 0.4029 -32.96 0.3973 -33.08
3 0 45.64 0 3.638 -21.97 0.5549 -38.30 0.4606 -39.9230 45.45 0 3.852 -21.44 0.5838 -37.83 0.4706 -39.70100 46.73 0 3.721 -21.98 0.5760 -38.18 0.4573 -40.19
duces for the passive case with 21 dB and with active vibration isolation with 33 dB. For thepassive configuration, the reduction is as expected, but for the active case the reduction is stilllimited, because of the lower limit due to measurement noise. For disturbance 3, the influencereduces for both configurations with 22 and 38 dB. The result is close to the expected valuesfrom the validation described in section 3.4.1
Adding extra damping to the Coriolis mode to prevent non-linear behaviour due to largetube-displacements is only expected to be effective for large external vibrations. Disturbance3 is not large enough to demonstrate this effect. Due to limitations in the setup, a higherdisturbance level (see Fig. 3.10) is unachievable. Therefore, the effect of the second objective

3
3.5 Discussion 49
cannot be proved for this controller design, but there is an attenuation gain of 2 dB achievedby damping the Coriolis mode.
The third objective requires that vibration isolation does not affect the mass-flow measure-ment. Therefore the RMS noise levels are compared for the various disturbance levels whena fluid (air) is also flowing through the CMFM. The results for a 0, 30 and 100% flow levelare also given in Table 3.2. A 100% flow is a flow resulting in a 1 bar pressure drop overthe CMFM. Comparing all the data, it is concluded that vibration isolation has no significantinfluence on the mean value of the flow measurement. Furthermore, it can be concluded thatthere is a minimal influence on the RMS level of the flow measurement value. Therefore, theactive vibration isolation does not affect proper mass-flow measurements of the CMFM.
3.5 Discussion
In this section, the significance of the results of the presented work is discussed. First, the lim-itations of the feedback control system are discussed. Second, the implementation of activevibration isolation into a commercial CMFM design is considered.
3.5.1 Limitations
The presented values are dependent on the tube-window design and filter characteristics of thereference instrument used, but they give a realistic indication of the achievable performance.Compared to the reference system, the broadband external disturbances can be increased by40 dB before they influence the measurement value of the actively suspended CMFM.
The minimum noise level of the measurement value is dependent on the noise levels ofthe tube displacement sensors. The minimum measurement noise level cannot be reduced byactive vibration isolation, but only by improving the specifications of the tube displacementsensors, which is beyond the scope of this study.
Based on the transmissibility function, the attenuation at the actuation frequency is 49 dB,but the reduction in the measurement value is only 40 dB as a result of the width of the mea-surement filter. The transmissibility function needs to be lowered over a wider bandwidth(e.g. by adjusting the second-order low-pass filter in C2(s) (Eq. 3.18)). Furthermore, the per-formance is limited due to the limited bandwidth of the feedback control, which is due to thehigher-order dynamics of the experimental setup. Therefore, the suspension frequency cannotbe reduced to values lower than 14 Hz. However, by improving the experimental setup, theperformance can be improved.
The presented control algorithm design is only one-directional. Although external distur-bances can occur in all translational and rotational directions, this is no limitation, because inChapter 2.5.1 it is concluded that there is only one dominant direction in which a translationdisturbance has an effect on the mass-flow measurement value. This means that the sensitiv-ity for external vibrations, occurring in all directions, can be sufficiently reduced by applying

3
50 Chapter 3 Active vibration isolation feedback control
active vibration isolation in only one direction. However, a limitation of this approach isthat the acceleration measurement orientation needs to be precise in the dominant direction.Also a passively isolated design can perform worse than the reference design, because of theincreased gain around the suspension frequency in the transmissibility function.
3.5.2 Implementation
Using the shaker setup (Fig. 3.3), including a reference CMFM, allowed fast validation of theapproach, but increases the total cost, size and the weight of a flow measurement instrumentenormously. With only one active direction, the number of actuators and sensors can be re-duced and the dimensions of the platform can be minimised. It is yet unknown whether anyscaling effects will occur when reducing the size. For example, with the current mass-ratioof the tube and platform, the internal tube-window actuator and a fluid flow have a mini-mal effect on the platform displacement. However, this will not necessarily be the case for aminiaturized setup, and will be subject of future research.
3.6 Conclusions
An active vibration isolation strategy for reducing the influence of external vibrations on aCoriolis Mass Flow Meter (CMFM) measurement was presented. The active vibration isola-tion control results in 40 dB reduction of the influence of external vibrations, without affectingthe mass-flow measurement.
A suspension was added to the CMFM to obtain passive isolation, attenuating the ef-fect of high-frequency disturbances. Parasitic stiffness and high internal stresses of the fluid-conveying connection-tubes limit the passive suspension frequency and thus the passive vi-bration isolation performance. The transmissibility of external vibrations is reduced furtheractively in the region of interest by acceleration feedback. A PI-controller is implementedto lower the suspension frequency and to add skyhook damping. Furthermore, the poorlydamped internal mode is damped using positive position feedback of the internal deforma-tion. These known vibration isolation strategies are adapted and tuned for the CMFM. Theroll-off of the acceleration feedback is tuned such that additional suppression is obtained inthe region of interest. Furthermore a notch filter is included in the positive position feedbackloop to remove its effect on the flow measurement.
The model results are validated by mounting a CMFM on a six degrees-of-freedom plat-form with six actuators and accelerometers, thus creating an active suspension mode. Exper-imental results agree with the modelled results, both (1) for the transmissibility of externalvibrations to the internal deformation and (2) broadband disturbances on the CMFM mea-surement value. The integrated mechanical design of the instrument with active vibrationisolation will be a subject of future research.
4
Chapter 4
CMFM with integrated Active Vibration Isolation
Control
Abstract Vibration isolation of more than 40 dB is achieved for a Coriolis Mass-Flow Meter(CMFM) with integrated Active Vibration Isolation. A CMFM is an active device based onthe Coriolis force principle for direct mass-flow measurements independent of fluid proper-ties. The mass-flow measurement is derived from tube displacement measurements. Supportexcitations can introduce motions that cannot be distinguished from the Coriolis force in-duced motion, thus introducing a measurement error. Therefore, the measurement stage ispassively suspended at 30 Hz in the 3 out-of-plane directions. Active vibration isolation isadded to increase the attenuation.In this paper the system model and controller design are presented. Based on the model anon-scale proof of principle is built and the model and controller are validated in multi-DOF.Acceleration feedback and a novel adaptive feedforward control strategy are compared Afiltered-reference least-mean-square (FxLMS) adaptive scheme is used to determine the op-timal feedforward controller parameters to minimise a squared error signal; the motion ofthe measurement stage. Both strategies result in an attenuation of 10 to 20 dB at 175 Hz inaddition to the 30 dB attenuation obtained by the 30 Hz passive vibration isolation stage. Theperformance of the feedback strategy is limited by robust stability and the the feedforwardperformance is limited by sensor noise.
This chapter is preprinted from: L. van de Ridder, W. B. J. Hakvoort, D. M. Brouwer,J. van Dijk, J. C. Lötters, and A. de Boer. Coriolis mass-flow meter with integrated multi-dofactive vibration isolation. 2015. Submitted to Mechatronics (Elsevier)

4
52 Chapter 4 CMFM with integrated Active Vibration Isolation Control
Φm θswing
θtwist
x
y
z
L
Fcor
Mact
Fig. 4.1 Simplified model of a window-shaped fluid-conveying tube to show the main Coriolis force contribu-tion. The tube is actuated to resonate around the θtwist-axis. Due to the Coriolis effect the tube also oscillatesaround the θswing-axis, proportional to the mass-flow Φm.
4.1 Introduction
A Coriolis Mass-Flow Meter (CMFM) is an active device based on the Coriolis force prin-ciple for direct mass-flow measurements independent of fluid properties [1, 78]. The CMFMcontains a fluid-conveying tube. An example of a window-shaped tube is depicted in Fig. 4.1.The tube is actuated to oscillate in resonance with a low amplitude around the θtwist-axis bythe moment Mact. A fluid flow in the vibrating tube induces Coriolis forces, proportional tothe mass-flow Φm:
Fcor =−2L · θtwist × Φm (4.1)
This force results in a rotation around the θswing-axis and thus affects the modeshape of theactuation mode. The rotation around the swing-axis can be derived from the tube displace-ment measurements and is directly proportional to the mass-flow. The motions induced by theCoriolis force are in the order of nanometres for micrometre actuation displacement. Supportexcitations can introduce motions that cannot be distinguished from the Coriolis force in-duced motion, thus introducing a measurement error [14, 72].
To reduce the sensitivity of the flow measurement to external vibrations, passive or activevibration isolation can be used. Passive isolation consists of one or multiple stages of mass-spring-damper systems between the floor and the frame of a machine [53]. The parametersare adjusted to achieve sufficient attenuation at certain frequency domains. However, theperformance of passive isolation applied to a CMFM is limited (see Chapter 3). An alternativeand widely used approach is to apply active vibration isolation control (AVIC). For recentexamples of active vibration isolation for precision equipment, see [10, 64, 42, 43].
In this paper we investigate self-tuning feedforward control, as introduced in [4], and com-pare it to a feedback strategy [77, 52], both applied to a CMFM. These strategies are comparedon the ability to reduce the influence of external vibrations on the mass-flow measurementvalue. Several advances are made on previous work [70, 74, 59]: (i) the feedforward strat-
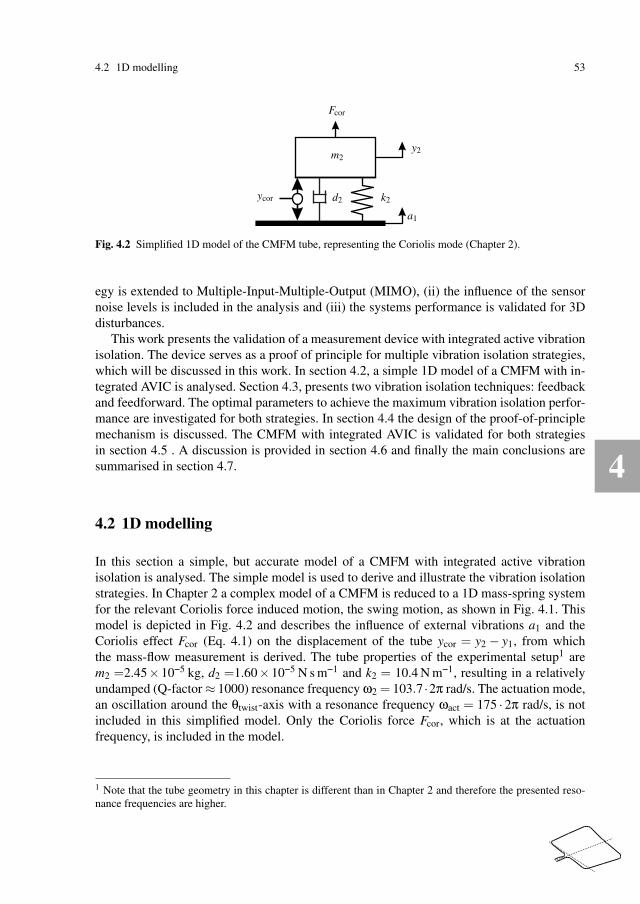
4
4.2 1D modelling 53
y2
a1
m2
k2d2
Fcor
ycor
Fig. 4.2 Simplified 1D model of the CMFM tube, representing the Coriolis mode (Chapter 2).
egy is extended to Multiple-Input-Multiple-Output (MIMO), (ii) the influence of the sensornoise levels is included in the analysis and (iii) the systems performance is validated for 3Ddisturbances.
This work presents the validation of a measurement device with integrated active vibrationisolation. The device serves as a proof of principle for multiple vibration isolation strategies,which will be discussed in this work. In section 4.2, a simple 1D model of a CMFM with in-tegrated AVIC is analysed. Section 4.3, presents two vibration isolation techniques: feedbackand feedforward. The optimal parameters to achieve the maximum vibration isolation perfor-mance are investigated for both strategies. In section 4.4 the design of the proof-of-principlemechanism is discussed. The CMFM with integrated AVIC is validated for both strategiesin section 4.5 . A discussion is provided in section 4.6 and finally the main conclusions aresummarised in section 4.7.
4.2 1D modelling
In this section a simple, but accurate model of a CMFM with integrated active vibrationisolation is analysed. The simple model is used to derive and illustrate the vibration isolationstrategies. In Chapter 2 a complex model of a CMFM is reduced to a 1D mass-spring systemfor the relevant Coriolis force induced motion, the swing motion, as shown in Fig. 4.1. Thismodel is depicted in Fig. 4.2 and describes the influence of external vibrations a1 and theCoriolis effect Fcor (Eq. 4.1) on the displacement of the tube ycor = y2 − y1, from whichthe mass-flow measurement is derived. The tube properties of the experimental setup1 arem2 =2.45×10⁻⁵ kg, d2 =1.60×10⁻⁵ N s m−1 and k2 = 10.4 N m−1, resulting in a relativelyundamped (Q-factor ≈ 1000) resonance frequency ω2 = 103.7 ·2π rad/s. The actuation mode,an oscillation around the θtwist-axis with a resonance frequency ωact = 175 · 2π rad/s, is notincluded in this simplified model. Only the Coriolis force Fcor, which is at the actuationfrequency, is included in the model.
1 Note that the tube geometry in this chapter is different than in Chapter 2 and therefore the presented reso-nance frequencies are higher.

4
54 Chapter 4 CMFM with integrated Active Vibration Isolation Control
y1
y2
a0
m1
m2
k1
k2
d1
d2
Fa
Fcor
a1
ycor
C(s)
Floor
Suspension
CMFM tube
Fig. 4.3 Mass-damper-spring model: 1D representation of multi-DOF suspension system. For passive vi-bration isolation the force Fa and controller C(s) are omitted. Feedback uses the sensor signal a1 and thefeedforward strategy uses also the sensor signal a0.
The displacement ycor, expressed in the Laplace domain, is equal to:
ycor(s) =−1
s2 + d2m2
s+ k2m2
a1(s)+1
m2s2 +d2s+ k2Fcor(s), (4.2)
this displacement is dependent on the external vibrations a1 and the Coriolis force Fcor, whichis proportional to the mass-flow Φm (Eq. 4.1). The mass-flow measurement value is calculatedfrom the phase-difference between two tube displacement sensors on equal distance of theθtwist-axis. The phase-difference is determined by a phase demodulation algorithm, usingonly information around the actuation frequency (Chapter 2).
An external vibration with a frequency content around the actuation frequency has a directinfluence on the mass-flow measurement value (Chapter 2). The transmissibility from a1 toycor describes this influence. Minimising this transmissibility, without affecting the transferfunction of Fcor to ycor, results in a reduction in the sensitivity for external vibrations. Theattenuation is only needed in a relatively small (50 Hz) frequency band around the actuationfrequency, because the influence outside this band can easily filtered out of the sensor signals,when calculating the mass-flow. Therefore, only attenuation around the actuation frequencyωact is needed. This is indicated by a 50 Hz wide region of interest (ROI) in all the bodediagrams in this paper.
A possible solution is to add a flexible suspension between de CMFM tube and the floor.This results in an extension of Fig. 4.2 as depicted in Fig. 4.3. The acceleration of the newlyintroduced stage can be described as:
a1(s) =d1s+ k1
m1s2 +d1s+ k1a0(s)+
s2
m1s2 +d1s+ k1Fa(s), (4.3)

4
4.3 Control design 55
where the dynamics of the tube are neglected, which is only valid if m2 ≪ m1. When alsoneglecting the actuator Fa, we have a form of passive vibration isolation [53]. However, theperformance is insufficient, because the suspension frequency has a lower bound, limitingthe attenuation. The frequency is limited by the maximum stress in the connection tubes anda maximum allowable sag of the stage due to gravity. Therefore sensors and actuators areadded to the model for active vibration isolation control (AVIC). In our model, we choosefor a suspension mode with a resonance frequency of ω1 = 30 · 2π rad/s. Given the stagemass m1 =0.2 kg and relative damping ζ = 0.01, this results in d1 =0.75 N s m−1 and k1 =7.1×10³ N m−1.
The actuator is operated in voltage-mode in order to obtain the least amount of actuatornoise, resulting in an additional pole in the transfer function, which is dependent on the motor-constant km, induction L and resistance R of the actuator coil:
Fa(s) =km
Ls+RU(s)≈ ωind
s+ωindU(s), (4.4)
whereby the low frequency gain is assumed to be 1. The model for control can be summarisedas follows. A primary path, also called the transmissibility:
P(s) =a1(s)
a0(s)=
d1s+ k1
m1s2 +d1s+ k1, (4.5)
and a secondary path, the actively controlled part:
S(s) =a1(s)
U(s)=
s2
m1s2 +d1s+ k1· ωind
s+ωind, (4.6)
both result in an acceleration a1, which needs to be minimised to reduce the influence ofexternal vibrations on the mass-flow measurement. Both transfer functions are depicted inFig. 4.5.
4.3 Control design
Actively reducing the influence of external vibrations can be done in several ways. In thissection a feedback and an adaptive feedforward strategy are compared on the ability to reducethe transmissibility and to handle sensor noise. For clarity, the model and the control strategiesare presented SISO. Only the adaptive algorithm is presented in MIMO, since this is notstraightforward.

4
56 Chapter 4 CMFM with integrated Active Vibration Isolation Control
a0
a1
n1P(s)
S(s)
C1(s)
U
++
+++
Fig. 4.4 Feedback scheme, based on Eq. 4.3 and 4.7. Noise n1 is added to the acceleration sensor, measuringa1.
4.3.1 Feedback
Reconsider the model in Fig. 4.3. The transmissibility from external vibrations a0 to theCoriolis displacement ycor gives the influence of external vibrations on the measurement valueof a CMFM (Chapter 2). In Chapter 3 and in more detail in [65], a strategy is presented to useacceleration feedback to add virtual mass and skyhook damping to m1. This results in a lowersuspension frequency and thus a lower transmissibility. The expression for the controller isgiven by:
C1(s) =U(s)
a1(s)=−
(
Ka +Kv
s
)s2
s2 +2ζfωfs+ω2f
︸ ︷︷ ︸
H1(s)
ω2r
s2 +2ζrωrs+ω2r
︸ ︷︷ ︸
H2(s)
s+ωz
ωz︸ ︷︷ ︸
H3(s)
, (4.7)
where Ka = 0.172 is the added virtual mass and Kv = 30.8 the added skyhook damping todamp the suspension mode with frequency ω1. The gains Ka and Kv are calculated as fol-lowed [77]:
Ka = m1
(ω2
1
ω2new
−1
)
, Kv = 2ζnewm1ω2
1
ωnew, (4.8)
where ωnew = 22 · 2π rad/s is the new frequency of the suspension with a relative dampingζnew = 0.3. The term H1(s) is a second-order high-pass filter with a corner frequency ωf =1 · 2π rad/s and ζf = 0.7, used to prevent actuator saturation. The term H2(s) is an slightlydamped second-order low-pass filter at the tube actuation frequency ωr = 175 ·2π rad/s. Thisfilter limits the control bandwidth and adds extra attenuation in the region of interest due toa low ζr = 0.07. The term H3(s) is a zero at ωz = 200 ·2π rad/s and is added to increase thephase-margin at the cross-over frequency, around 300 Hz.
The strategy is depicted schematically in Fig. 4.4, the plant and controller are depictedin Fig. 4.5 and 4.6 respectively. The resulting transmissibility is depicted in Fig. 4.9, show-

4
4.3 Control design 57
Mag
nitu
de(d
B)
Frequency (Hz)
Pha
se(d
eg)
ROIP(s)S(s)
101 102 103
-180
-90
0
90
180
-40
-20
0
20
40
60
Fig. 4.5 Model of the plant design, the primary and secondary path according to Eq. 4.5 and 4.6.
ing an attenuation of 50 dB in the region of interest. The strategy has disadvantages: Highperformance requires a high controller bandwidth, but the bandwidth is limited by the highfrequency dynamics of the system, which might induce instability. Therefore, knowledge ofthe high-frequency system dynamics is required to guarantee a robust and stable system. Inthe validation of the mechanical design, the MIMO system is uncoupled to multiple SISOsystems, all using the SISO strategy presented in this subsection.
4.3.2 Adaptive feedforward
Alternatively a feedforward strategy can be applied. An extra sensor measures the externalvibrations a0, see Fig. 4.3, and this signal is used for compensation of the stage movements.The schematic is depicted in Fig. 4.7. Optimal compensation is achieved with the followingcontroller:
CFF(s) =U(s)
a0(s)=−S−1(s)P(s) =−d1s+ k1
s2 · s+ωind
ωind(4.9)
Since P(s) and S(s) have poles in common, they cancel out. Therefore, the controller is onlydependent on the physical parameters - stiffness, damping and actuator dynamics - betweenthe floor and the suspended stage, no knowledge of the internal dynamics is needed. This can
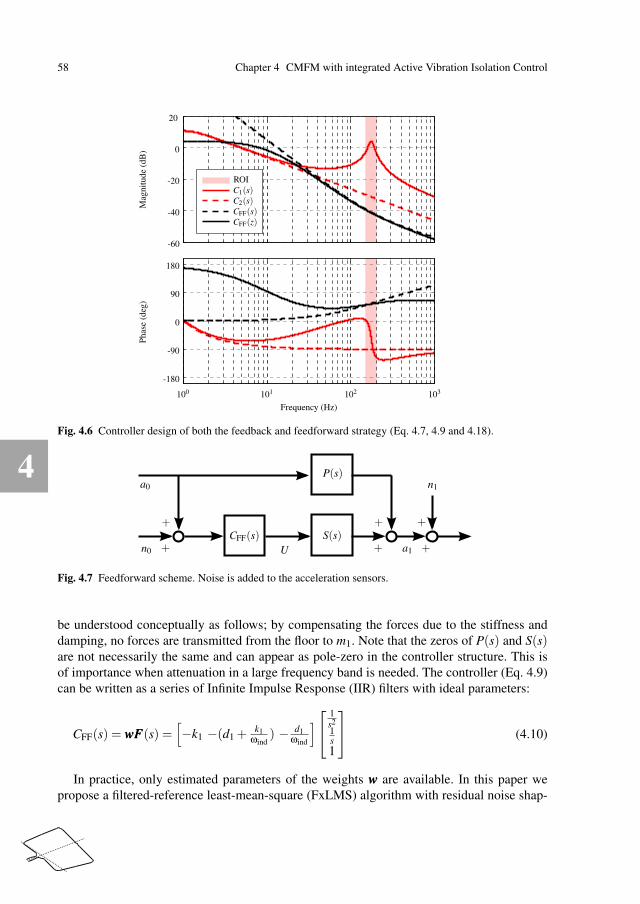
4
58 Chapter 4 CMFM with integrated Active Vibration Isolation Control
Mag
nitu
de(d
B)
Frequency (Hz)
Pha
se(d
eg)
ROIC1(s)C2(s)CFF(s)CFF(z)
100 101 102 103
-180
-90
0
90
180
-60
-40
-20
0
20
Fig. 4.6 Controller design of both the feedback and feedforward strategy (Eq. 4.7, 4.9 and 4.18).
a0
a1n0
n1
P(s)
S(s)
U
CFF(s)+
+
++
++
Fig. 4.7 Feedforward scheme. Noise is added to the acceleration sensors.
be understood conceptually as follows; by compensating the forces due to the stiffness anddamping, no forces are transmitted from the floor to m1. Note that the zeros of P(s) and S(s)are not necessarily the same and can appear as pole-zero in the controller structure. This isof importance when attenuation in a large frequency band is needed. The controller (Eq. 4.9)can be written as a series of Infinite Impulse Response (IIR) filters with ideal parameters:
CFF(s) = wwwFFF(s) =[
−k1 −(d1 +k1
ωind) − d1
ωind
]
1s21s
1
(4.10)
In practice, only estimated parameters of the weights www are available. In this paper wepropose a filtered-reference least-mean-square (FxLMS) algorithm with residual noise shap-

4
4.3 Control design 59
a0
a1n0
n1P(s)
S(s)
C2(s)
F w
CFF(s)
x e
x′ e′S N(s)N(s) LMS
+ +++
+++ +r f
Fig. 4.8 Modified FxLMS adaptive feedforward control scheme, an extension of the schema in Fig. 4.7.
ing [4, 36] to update the weights. The weights are adapted such that the squared error isminimal, resulting in an optimal feedforward controller. The algorithm is explained in the re-maining part of this subsection. The scheme is depicted in Fig. 4.8. The algorithm minimisesthe following quadratic cost function:
J(n) = e′(n)T e′(n), (4.11)
with n the iteration step. The filtered error is given by:
e′(n) = Ne(n) = N(P+SwwwFFF)a0(n), (4.12)
whereby the controller C2(s) is omitted. This controller will be introduced at the end of thissubsection. The error is filtered using the filter N(s) in order to minimise the error in only asmall frequency band. N(s) is defined as a 50 Hz bandpass filter between 150 and 200 Hz (theregion of interest). The weights are determined, using the following gradient-based updatelaw [36]:
www(n+1) = www(n)− µ(n)
2
(∂J(n)
∂www(n)
)T
(4.13)
For updating the weights, the gradient of the quadratic cost function is needed:
∂J(n)
∂www(n)=
∂J(n)
∂e′(n)∂e′(n)∂www(n)
≈ 2e′(n)NSxxx(n) = 2e′(n)xxx′(n), (4.14)
where xxx = FFFa0 is the filtered reference signal a0. Merging (4.13) and (4.14) gives the updatelaw:
www(n+1) = www(n)−µ(n)xxx′(n)T e′(n), (4.15)

4
60 Chapter 4 CMFM with integrated Active Vibration Isolation Control
with adaptation rate µ(n), depending on the reference signals, [36]:
µ(n) =µ
ε+ xxx′T (n)xxx′(n), (4.16)
where ε > 0 is a small value to prevent division by zero and µ the adaptation rate to preventinstability of the adaptation process. To determine xxx′(n) the secondary path S(s) is needed.The multiplication with the secondary path is needed to align the error and reference signalsin time. The estimation of the secondary path is not required to be very accurate, the stabil-ity of adaptive algorithms is assured for a phase error even up to ±90° [17, 49]. Therfore, anon-dynamic gain matrix with real numbers is used as estimate S, because the phase of S(s)is approximated to be constant in the small frequency band of N(s). Note that this approxi-mation results in a lower convergence of the weights. A discrete-time formulation of the IIRfilter (Eq. 4.10) is proposed, with tame integrators to prevent drift and actuator saturation, andthe IIR filters have fixed poles to make the adaptation inherently stable, as:
FFF(z) =[
ω2xT 2
s
(z−(1−αTs))2
ωxTs(z−(1−αTs))
1]
, (4.17)
where Ts is the sample time and the integrators have a cut-off frequency at α = 10 ·2π rad/s.The gain ωx is the center frequency of the bandpass filter N(s), this scaling factor is chosensuch that the power of each of the signals in the vector xxx′(n) is equal. The residual noise filterN(s) tunes the weights such that the transmissibility is minimal in the region of interest. Theideal controller CFF(s) (Eq. 4.9) is compared, in Fig. 4.6, to the controller CFF(z) = wwwFFF(z), whereby the weights are obtained using the update law above (Eq. 4.15). In the region ofinterest the phase and gain of the controllers are equal.
Further, damping of the suspension mode is desirable, therefore a simple feedback sky-hook damper is added to the feedforward strategy:
C2(s) =U(s)
a1(s)=−Kv
s·H1(s), (4.18)
where Kv = 30.8 is the added sky-hook damping and the second-order high-pass filter H1(s)limits the controller to prevent integrator saturation. The controller C2(s) is depicted inFig. 4.6. Compared to the controller C1(s) the controller has only a high gain for low fre-quencies. The result of the feedforward strategy is discussed in section 4.3.3.

4
4.3 Control design 61
4.3.2.1 MIMO formulation
The feedforward strategy is presented in SISO, but for the implementation a MIMO formula-tion is needed, because there are multiple reference and error sensors and multiple actuatorsin the experimental setup. Therefore the following formulation, introduced by [7], is used:
xi,l(n) = Flri(n)
x′i, j,k,l(n) = NS j,kxi,l(n)
µ(n) =µ
ε+ x′i, j,k,l(n)x
′i, j,k,l(n)
wi, j,l(n+1) = wi, j,l(n)−µ(n)x′i, j,k,l(n)ek(n)
f j(n) = wi, j,l(n)xi,l(n)
where:
I : number of reference signals
J : number of actuators
K : number of error sensors
L : number of weights in each filter
ri : reference signal
ek : error signal
S j,k : estimate of the secondary path
wi, j,l : weights
f j(n) : feedforward actuator input
4.3.3 Model results
In the previous subsections two active strategies are presented to reduce the influence ofexternal vibrations on the mass-flow measurement value of a CMFM. In Fig. 4.9 the trans-missibility from external vibrations a0 to the compliantly suspended stage accelerations a1 isdepicted for all strategies. The best attenuation in the region of interest is achieved using thefeedforward strategy, which gives an attenuation of more than 50 dB.

4
62 Chapter 4 CMFM with integrated Active Vibration Isolation Control
Frequency (Hz)
Mag
nitu
de(d
B)
Transmissibility from a0 to a1
ROIPassiveActive C1(s)Active CFF(z)CFF(z)+C2(s)
101 102 103-60
-40
-20
0
20
40
Fig. 4.9 Modelled transmissibilities from a0 to a1 for the passive and active systems
4.3.3.1 Limitations by sensor noise
AVIC is able to reduce the influence of external vibrations. However, the noise of the addi-tional acceleration sensors may be sources of extra disturbances. The sensitivity for sensornoise is determined in this section.
The effect of the noise of the sensors measuring the external and stage vibrations, re-spectability a0 and a1, is considered. In the analysis, the noise signals n0 and n1 are addedin the feedback and feedforward strategies in Fig. 4.4 and 4.8. For the feedback strategy, thesensitivity is equal to:
SFB =a1(s)
n1(s)=
S(s)C1(s)
1−S(s)C1(s)(4.19)
In the fixed-gain feedforward strategy, there are two sensitivity functions, because there aretwo types of sensors:
SFF,0 =a1(s)
n0(s)=
S(s)CFF(s)
1−S(s)C2(s)(4.20)
SFF,1 =a1(s)
n1(s)=
S(s)C2(s)
1−S(s)C2(s)(4.21)
The sensitivity functions are depending on the secondary path (Eq. 4.6) and the designedcontrollers (Eq. 4.7,4.10 and 4.18). All three sensitivity functions are depicted in Fig. 4.10.

4
4.3 Control design 63
For the feedback strategy the sensitivity is close to unity in the region of interest, becausethe feedback tries to compensate for the sensor noise, imposing the stage to move in anti-phase with the noise. The sensitivity for the fixed-gain feedforward strategy is much lower,because it compensates for a0 and its effect is thus reduced by the attenuation of the passivestage. Thus, the requirements on the noise-level for the fixed-gain feedforward strategy canbe significantly higher than for the feedback strategy. For the adaptive feedforward strategythe weights are obtained by minimising a cost function (Eq. 4.11), therefore the quality ofthe weights is dependent on the noise of the error sensor. An error in the weights introducesan error in the compensation and thus the attenuation of the adaptive feedforward scheme isdependent on the ratio between error sensor noise and the level of external vibrations.
Frequency (Hz)
Mag
nitu
de(d
B)
Transfer function from noise of sensors to a1
ROINoise n1 - FBNoise n0 - FFNoise n1 - FF
101 102 103-40
-30
-20
-10
0
10
Fig. 4.10 Sensitivity transfer functions from sensor noise to stage accelerations a1 (Eq. 4.19, 4.20 and 4.21).
The previous analysis can be used to select proper acceleration sensors for the active vi-bration isolation strategies. The contribution of the acceleration sensor noise to the Coriolis-displacement should be less than the noise already present in the measurement of the Coriolis-displacement, which is 3.16e−10 m/
√Hz. The influence of external vibrations and the noise
levels of the acceleration sensors on the tube displacement sensor ycor is obtained from thefollowing relation:
Φycor = |Tycor,a1(s)Sa1,n(s)|2 ·Φn + |Tycor,a1(s)Pa1,a0(s)|2 ·Φa0 , (4.22)
where Φ is the Power Spectral Density of respectively the contribution to the error in ycor, theacceleration sensor noise n and the external vibrations a0, Sa1,n is one of the above sensitivityfunctions (Eq. 4.19, 4.20 and 4.21) and the transmissibility Tycor,a1 is given in Eq. 4.2. Theresult of Eq. 4.22, at the actuation frequency of 175 Hz, is depicted in Fig. 4.11. From thefirst figure it can be concluded that for the feedback strategy a sensor with a noise level of lessthan 25 µg/
√Hz is needed, without affecting the Coriolis displacement. For the feedforward

4
64 Chapter 4 CMFM with integrated Active Vibration Isolation Control√
Φy c
orat
175
Hz
(m/√
Hz)
√Φn at 175 Hz (µg/
√Hz)
Influence on ycor extitation
Noise level displ.Tycor,a1 Sa1,n1 - FBTycor,a1 Sa1,n0 - FFTycor,a1 Sa1,n1 - FF
100 101 102 103 104
10−11
10−10
10−9
10−8
10−7
10−6
(a) Sensors noise level influence
√Φa0 at 175 Hz (µg/
√Hz)
Influence on ycor extitation
Noise level displ.Tycor,a0 - Ref.Tycor,a1 Pa1,a0 - Pas.Tycor,a1 Pa1,a0 - FBTycor,a1 Pa1,a0 - FF
100 101 102 103 104
(b) External vibrations influence
Fig. 4.11 Influence of external vibrations (b) and the acceleration sensors noise levels (a) on the PSD of ycor
(Eq. 4.22), compared to the noise level of the displacement sensor. The noise level of the displacement sensorsis 1e−13 mm2/Hz = 3.16e−10 m/
√Hz at 175 Hz.
strategy the noise level can be higher, respectively 800 µg/√
Hz and 250 µg/√
Hz for themeasurement of a0 and a1. In the second figure is shown, that the passive and active strategieshave an tremendous effect on reducing the influence of external vibrations.
4.4 Mechanism design
An experimental setup is needed to validate the control designs presented in Section 4.3.In Section 4.2 a simple mass-spring 1D model of a CMFM including AVC was presented.In the first subsection the multi-DOF concept is explained and dimensions are presentedin the second subsection. Thirdly, the chosen actuators and sensors are presented. In thefinal subsection the multi-DOF model results are compared to the 1D model. Details of themodelling and design of the mechanism are presented in more detail in Staman [58].
4.4.1 Conceptual design
Based on the 1D model, shown in Fig. 4.3, a multi-DOF concept is developed. Because thevibration sensitivity of the CMFM is dominated by two directions, a y-translation and a x-axisrotation (see Fig. 4.1), both directions will be passively suspended. Furthermore, the setupwill be used to test if the tube-window can be actuated by the stage. In total, this results in a

4
4.4 Mechanism design 65
x y
z
Tube actuation PCB
Transformer coils
Readout PCB
Optical sensors
Frame plate
Magnet parts
Tube-window
Fig. 4.12 SolidWorks model of the measurement stage [59] (Note that the top PCBs are made transparentfor clarity). The functional part of a CMFM, used as a module in the CMFM with integrated active vibrationisolation.
3-DOF stage, whereby the out-of-plane directions are passively suspended. Active means areadded to make the 3-DOF motions measurable and controllable The attenuation is a functionof the suspension frequency (Chapter 3). The designed suspension frequency will be 30 Hz,to limit the maximum stresses in the connection tubes and a maximum allowable sag due togravity.
4.4.2 Dimensional design
The design of a Coriolis Mass-Flow Meter with integrated Active Vibration Isolation Controlis based on a patented design ( [45, 46]) of an existing CMFM for low flows. Therefore, afunctional model of a CMFM is striped from the casing to only the core of the instrument; themeasurement stage. In Fig. 4.12 this stage is shown. It contains a frame plate with mountedon it: a tube-window (Fig. 4.1), actuation means to actuate the tube-window and optical dis-placement sensors to measure the tube displacements. The measurement stage has a mass ofabout 110 g.
The measurement stage is compliantly suspended in 3 directions, an exact constraint de-sign [57]. The 3-DOF type 1 suspension [30] is depicted in Fig. 4.13(a). The length, heightand width of each flexure are chosen such that the stage is suspended around 30 Hz in allthree out of the xz-plane directions.

4
66 Chapter 4 CMFM with integrated Active Vibration Isolation Control
x y
z
Suspended stage
Flexure (3x)
Base
(a) Solidworks model of the 3 DOF suspension.
x
yz
a1,error
(b) Solidworks model of the acceleration sensors(purple) and PCB (green) on the suspension. In-cluding the location of the error sensor a1,error.
x
yz
(c) Solidworks model of the actuator locations.
x
yz
(d) Solidworks model of the active vibration iso-lation system with a simplified measurement stage(Fig. 4.12)
Fig. 4.13 Design of CMFM with integrated active vibration isolation [59].
On the suspension a PCB with three accelerometers is mounted to measure the stage ac-celerations aaa111 (Fig. 4.13(b)). Below the suspension three voice coil actuators are mounted tocontrol the stage movements (Fig. 4.13(c)). The measurement stage (Fig. 4.12) is mountedon top of the suspension as shown in Fig. 4.13(d). A photo of the final setup is shown inFig. 4.16.

4
4.4 Mechanism design 67
4.4.3 Sensor and actuator choice
In Fig. 4.13(c), the suspension with the voice coil actuators and acceleration sensors is shown.For the stage, small and low noise acceleration sensors are required. The effect of sensor noiseis discussed in subsection 4.3.3.1. The used one-axis acceleration sensors are Silicon Design1221-2g sensors, selected on their size (9x9x3 mm), their noise performance (5 µg/
√Hz) and
their relatively low costs.The voice coil motors are Lorentz type actuators and are designed in-house. One actuator
is able to produce a force of about 0.8 N at a current of 1 A, while the resistance of the coil isapproximately 4.2 Ω and the coil inductance is about L = 4.5 mH. Further, it has a diameterof 20 mm and a height of about 10 mm.
4.4.4 Model results
The entire system has been modelled using the non-linear finite element flexible multibodysoftware package SPACAR [31]. The real experimental parameters are implemented in themodel. Modal analysis is used for tuning the suspension design. The multibody packageproduces the input-output relations, those transfer functions are used for the necessary controlsynthesis [32]. First, the transfer functions of external vibrations to the stage movement aredetermined and depicted in Fig. 4.14. Whereby the applied external vibriations aaa0 consist ofthree translations and three rotations. As output an acceleration of the platform in y-directionis chosen (see Fig. 4.13(b), which is defined as:
a1,error = [−0.2516,0.6258,0.6258]aaa1 = RRRyaaa1, (4.23)
where aaa1 is a vector with the top, left and right sensor of the stage (Fig 4.13(b)). This point ischosen because it is the percussion point of the tube-window. Only a y-translation in this pointwill result in a Coriolis displacement. Fig. 4.14 shows clearly that the resonance frequenciesof the suspension are around 30 Hz. For the y- disturbance, which is the dominant direction atlow frequencies, the attenuation in the region of interest (around the tube actuation frequencyof 175 Hz) is as expected. However, this direction is not the dominant direction in the regionof interest any more. A disturbance in z-direction is causing the stage to tilt and results inan acceleration in the y-direction at the sensor positions. This occurs due to the fact that thecentre of mass and the centre of compliance are not in the same position for the realisedmechanism.
For the application the direction of the disturbance is unknown and can alternate. Becausethe direction is frequency dependent, a Singular Value Decomposition (SVD) of the transmis-sibility function is performed for each frequency. The maximum singular value as functionof the frequency is shown in Fig. 4.15. The maximum singular value for the transmissibilityis also shown for each of the vibration isolation strategies of section 4.3, which have beenextended to MIMO. The gained attenuation for the active strategies is with respect to the pas-sive system as expected from the 1D model (Fig. 4.9). But the total attenuation is less than

4
68 Chapter 4 CMFM with integrated Active Vibration Isolation Control
Frequency (Hz)
Mag
nitu
de(d
B)
Transmissibility aaa0 to a1,error
x
y
z
Rx
Ry
Rz
101 102-100
-80
-60
-40
-20
0
20
40
Fig. 4.14 Modelled passive transmissibility from aaa0 to a1,error of the 3-DOF stage.
Frequency (Hz)
Mag
nitu
de(d
B)
SVD Transmissibility aaa0 to a1,error
ROIPassive VIActive VI FBActive VI FF
101 102-60
-40
-20
0
20
40
Fig. 4.15 Modelled active SVD transmissibility from aaa0 to a1,error for the passive and active vibration isolation(VI). Whereby the attenuation in the region of interest is minimised.
the expected 50 dB, because the flexible suspension of the stage has a dominant direction thathas not been taken into account in the 1D model.
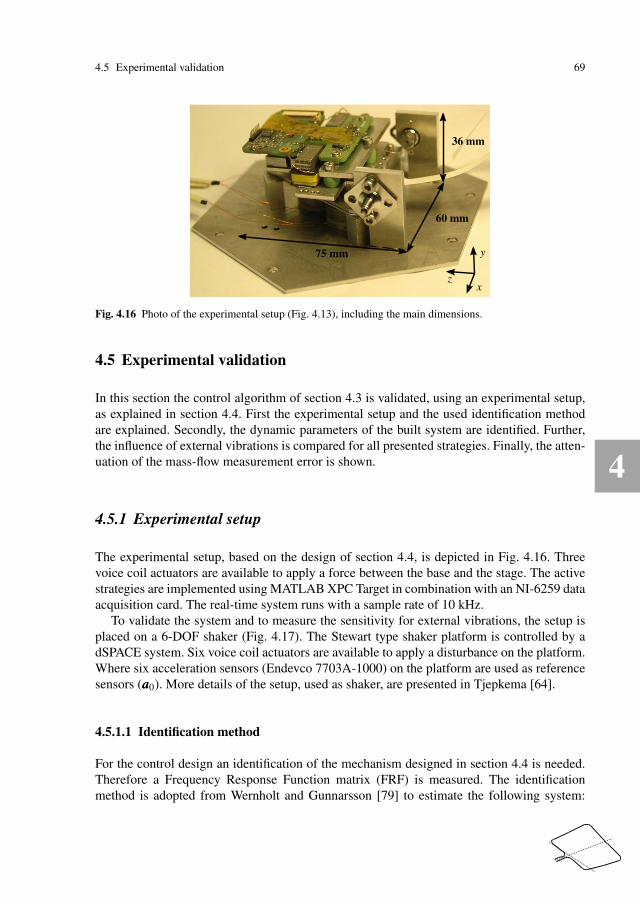
4
4.5 Experimental validation 69
x
y
z
36 mm
60 mm
75 mm
Fig. 4.16 Photo of the experimental setup (Fig. 4.13), including the main dimensions.
4.5 Experimental validation
In this section the control algorithm of section 4.3 is validated, using an experimental setup,as explained in section 4.4. First the experimental setup and the used identification methodare explained. Secondly, the dynamic parameters of the built system are identified. Further,the influence of external vibrations is compared for all presented strategies. Finally, the atten-uation of the mass-flow measurement error is shown.
4.5.1 Experimental setup
The experimental setup, based on the design of section 4.4, is depicted in Fig. 4.16. Threevoice coil actuators are available to apply a force between the base and the stage. The activestrategies are implemented using MATLAB XPC Target in combination with an NI-6259 dataacquisition card. The real-time system runs with a sample rate of 10 kHz.
To validate the system and to measure the sensitivity for external vibrations, the setup isplaced on a 6-DOF shaker (Fig. 4.17). The Stewart type shaker platform is controlled by adSPACE system. Six voice coil actuators are available to apply a disturbance on the platform.Where six acceleration sensors (Endevco 7703A-1000) on the platform are used as referencesensors (aaa0). More details of the setup, used as shaker, are presented in Tjepkema [64].
4.5.1.1 Identification method
For the control design an identification of the mechanism designed in section 4.4 is needed.Therefore a Frequency Response Function matrix (FRF) is measured. The identificationmethod is adopted from Wernholt and Gunnarsson [79] to estimate the following system:

4
70 Chapter 4 CMFM with integrated Active Vibration Isolation Control
CMFM (DUT)
6-DOF Platform
Shaker actuator (6x)
Fig. 4.17 6-DOF Shaker used to apply an external vibration aaa0 on the base plate of the experimental setup(Fig. 4.16).
y(t) = GGGu(t), (4.24)
where GGG is a ny ×nu system between the input u(t) ∈ Rnu×1 and output y(t) ∈ R
ny×1 signals,whereby the noise is assumed to be zero. A Discrete Fourier Transform (DFT) of the systemat the frequencies ωk with sample time Ts reads as:
YYY (ωk) = GGG(ejωkTs)UUU(ωk), (4.25)
where GGG(ejωkTs) ∈ Cny×nu is the FRF-matrix and, YYY (ωk) ∈ C
ny×ne and UUU(ωk) ∈ Cnu×ne are
the DFTs of the input and output signals of ne experiments. To extract the FRF-matrix at leastne ≥ nu different experiments are needed. An estimate is given by the H1-estimator:
GGG(ejωkTs) = YYY (ωk)UUU†(ωk), (4.26)
where UUU†(ωk) is the pseudo-inverse of UUU(ωk). The system is excited using orthogonal ran-dom phase multi-sine signals to minimise the variance of the FRF estimate [79]. For theidentifications a multi-sine with frequencies between 5 and 500 Hz is used.
4.5.2 System identification
The primary and secondary path of the designed mechanism are estimated using the methoddescribed in section 4.5.1.1. First the secondary path FRF-matrix SSS(ωk) between the actuatorinput UUU and the stage sensors aaa1 is estimated. The location of the actuators and sensorsresults in a MIMO system with interaction between the inputs and the outputs. To use the

4
4.5 Experimental validation 71
SISO controllers, designed in section 4.3, we need a diagonal plant:
GGGdiag(s) = TTT yGGG(s)TTT u (4.27)
Many decoupling procedures have been developed in the past to determine the transformationmatrices TTT y and TTT u. A general decoupling transformation is using Dyadic Transfer functionMatrices. The method was first introduced by Owens [50]. If GGG(s) is dyadic, TTT−1
y can be
calculated as the eigenvectors of GGG(jω2)GGG−1(jω1) and TTT u can be calculated as the eigen-
vectors of GGG−1(jω1)GGG(jω2), whereby ω1 and ω2 are two frequencies chosen from the FRF-matrix [2]. When the system is not dyadic, the calculated transformation matrices are com-plex. Real matrices are obtained using an align-method [41], introducing off-diagonal ele-ments in GGGdiag(s). The decoupling quality strongly depends on the choice of ω1 and ω2 [66].In the decoupling ω1 = 20 · 2π rad/s and ω2 = 300 · 2π rad/s are used, because we want tohave proper decoupling at the cross-overs of the open-loop system S(s)C1(s). The calculatedtransformation matrices for SSS(ωk) are:
TTT y =
1.6639 −0.3032 −0.06220.0552 0.7172 −0.71531.1981 −0.8207 −0.8712
,TTT u =
0.9831 0.0544 0.7074−0.1792 0.7070 −0.4846−0.0368 −0.7051 −0.5144
(4.28)
The result of the decoupled plant is depicted in Fig. 4.18. At low frequencies three reso-nance frequencies around 30 Hz are clearly visible, these are the three suspension frequenciesof the designed stage. At high frequencies an anti- and resonance-frequency of an internalmode around 280 Hz is visible. Because the system is still co-located, no stability issues areexpected. Based on Eq. 4.28 and the geometry, as shown in Fig. 4.16, by approximation thefirst direction is a translation in y-direction, the second a rotation around the z-axis and thethird a rotation around the x-axis.
Secondly, the FRF-matrix PPP(ωk) between the base sensors aaa0 and the stage sensors aaa1 isestimated. This is the transmissibility of external vibrations to the stage vibrations. Sufficientvibration isolation of the flow-measurement is achieved when the dominant y-translation ofthe stage in the percussion point is minimised (Chapter 2). The result TTT (ωk) = RRRyPPP(ωk)RRR0
is depicted in Fig. 4.19, whereby RRR0 is the relation between the three translations and threerotations of the base and the aaa0 sensor coordinates. The magnitude in the region of interestis the gained attenuation using vibration isolation. The dominant disturbance directions area translation in y and z-direction. The sensitivity in z-direction was not expected, but it isdue to the fact that the centre of mass and the centre of compliance are in different points.Therefore, a disturbance in z-direction results in tilting of the stage and thus a y-translation atthe aaa1 sensor positions.

4
72 Chapter 4 CMFM with integrated Active Vibration Isolation Control
Mag
nitu
de(d
B)
Frequency (Hz)
Pha
se(d
eg)
101 102 103-360
-270
-180
-90
0
-40
-20
0
20
40
Fig. 4.18 System TTT ySSS(ωk)TTT u identification of the secondary path. Only the diagonal terms are depicted. Thethree suspension frequencies of the 3-DOF stage at [25.8, 27.0, 31.7] Hz are visible. The transfer functionS(s) of the model is depicted in Fig. 4.5
Frequency (Hz)
Mag
nitu
de(d
B)
Transmissibility aaa0 to a1,error
x
y
z
Rx
Ry
Rz
101 102-100
-80
-60
-40
-20
0
20
40
Fig. 4.19 Experimental passive transmissibility RRRyPPP(ωk)RRR0 from aaa0 to a1,error. The transmissibility P(s) ofthe model is depicted in Fig. 4.5.

4
4.5 Experimental validation 73
Frequency (Hz)
Mag
nitu
de(d
B)
Transmissibility a0,y to a1,error
ROIPassive VIActive VI FBActive VI FF
101 102-60
-40
-20
0
20
40
Fig. 4.20 Active SISO transmissibility from a0,y to a1,error. The modelled transmissibility is depicted inFig. 4.9.
4.5.3 Active vibration isolation
The achieved passive vibration isolation is limited, as shown in Fig. 4.19. In this subsectionthe results of active vibration isolation with the controllers, as designed in section 4.3, areshown. First in one direction, as considered in the 1D model, and thereafter for multipledirections.
4.5.3.1 SISO
First the active vibration isolation strategy is validated with a 1-DOF input disturbance inthe dominant y-translation direction. The results are shown in Fig. 4.20. To obtain a stablefeedback system, addition of notch filters at the frequencies [845, 950, 2190, 2270, 2787] Hzwas needed to suppress the higher order dynamics. Attenuation in the region of interest isachieved up to 40 dB for both strategies. Compared to the passive vibration isolation the activesystem adds only a minimal extra attenuation. Which is about 10 dB for both the feedbackand feedforward strategy. Outside the region of interest the undamped suspension modes(around 30 Hz) is clearly visible. The result is as expect from the model, see Fig. 4.9, of morethan 40 dB attenuation. The feedforward result is noisy, because sensor noise makes the FRFestimate noisy. This can be reduced by increasing the level of applied external vibrations aaa0.

4
74 Chapter 4 CMFM with integrated Active Vibration Isolation Control
Frequency (Hz)
Mag
nitu
de(d
B)
SVD Transmissibility aaa0 to a1,error
ROIPassive VIActive VI FBActive VI FF
101 102-60
-40
-20
0
20
40
Fig. 4.21 Active SVD transmissibility from aaa0 to a1,error. The modelled transmissibility is depicted inFig. 4.15.
4.5.3.2 MIMO
There is not one dominant direction, but there are multiple directions, as shown in Fig. 4.19.The same figure can be shown for the active vibration strategies, but there are too manylines for a clear result. Therefore only the dominant direction is shown. This is realized bya Singular Value Decomposition (SVD) for each frequency. The largest singular value givesthe influence for the dominant direction for that certain frequency. In any other direction thevibration isolation is better. The result of passive vibration isolation can now be summarisedin one line, as shown in shown in Fig. 4.21, which is approximately the largest point inFig. 4.19 for each frequency for the passive isolation.
First the active strategies, presented in section 4.3, are adapted to the 3x3 MIMO systemof the 3-DOF stage. In Fig. 4.18 three decoupled transfer functions are depicted, all three areused as a SISO system. For this validated secondary path, the gains of the feedback controllersare calculated, using Eq. 4.8. Note that also for the MIMO feedback, the added notch filtersare needed for a stable system.
The MIMO formulation of the feedforward strategy is presented in subsection 4.3.2.1.For feedforward the weights are made adaptive to achieve maximum attenuation, see sub-section 4.3.2. As error signal the combined stage acceleration a1,error is used. In Fig. 4.19is shown that the two dominant disturbances are aaa0-accelerations in yz-direction. Both mea-sured accelerations are used as reference signals. For the y-disturbance the primary path andsecondary path (Fig. 4.19 and 4.18) are according to the model. Therefore, the controller

4
4.5 Experimental validation 75
structure, given in Eq. 4.10, is used. For three actuators and one error signal, this results in3x3 = 9 weights.
For a z-disturbance the primary path has a different structure. In the region of interest theslope is 0 dB/decade in stead of -40 dB/decade (see Fig. 4.19). This changes the optimal con-troller structure CFF(s) for a a0,z-disturbance. The ideal controller structure for a z-disturbanceis:
CFF,z(s) =−gd + k
s2 · s+ωind
ωind=[
−k −(d + kωind
) − dωind
]
1s
s2
, (4.29)
where the stiffness k, damping d and gain g can be determined by the system identification(Section 4.5.2). The main difference between Eq. 4.10 and 4.29 is the filter F(s). For a z-disturbance a IIR different filter, compared to Eq. 4.17, is proposed:
FFFz(z) =[
1 1Tsωx(z−1)
] α22T 2
s
(z− (1−α2Ts))2 , (4.30)
where the differentiator has a cut-off frequency at α2 = 500 ·2π rad/s to limit the infinite gainand the double integrator is omitted, because of its high gain for the higher frequencies. Forthree actuators and one error signal, this results in 3x2 = 6 extra weights.
Summarising, there are two reference signals and three actuators, resulting in a 3x2 MIMOcontroller with 15 weights in total. The settling of the weights is depicted in Fig. 4.22 for µ =0.01 and ε = 1. The weights are not a real estimate for the stiffness, damping and inductionpool, because these are adapted such that the influence of external vibrations is minimal inthe region of interest in the presence of the residual noise shape filter N(s).
In Fig. 4.21 the MIMO results of the active vibration strategies are shown. The results areless than expected from the 1D model, because of the influence of a disturbance in z-direction.For both strategies a minimum of 30 dB attenuation is achieved, for each direction of the inputdisturbance. The feedforward strategy results in a lower gain at the higher frequencies, whileusing the feedback strategy results in a magnification compared to the passive system.
4.5.4 Measurement error
So far the reduction from the base to the platform acceleration is considered. However, activevibration isolation is integrated in a CMFM to reduce the influence of external vibrationson the measurement value. The experimental setup is shown in Fig. 4.16. In this section thenewly achieved performance is determined for a disturbance in the dominant y-direction. InFig. 4.23 the measurement signal is compared for the different configurations with an appliedbroadband y-disturbance of 4e−6 g2/Hz between 5 and 500 Hz. The RMS values of thoseexperiments are given in Table 4.1. Attenuation of the RMS measurement error is 36 dBand is achieved for both the feedback and feedforward strategy. Whereby the attenuation isreduced to the noise level of the measurement value without a vibrational disturbance.
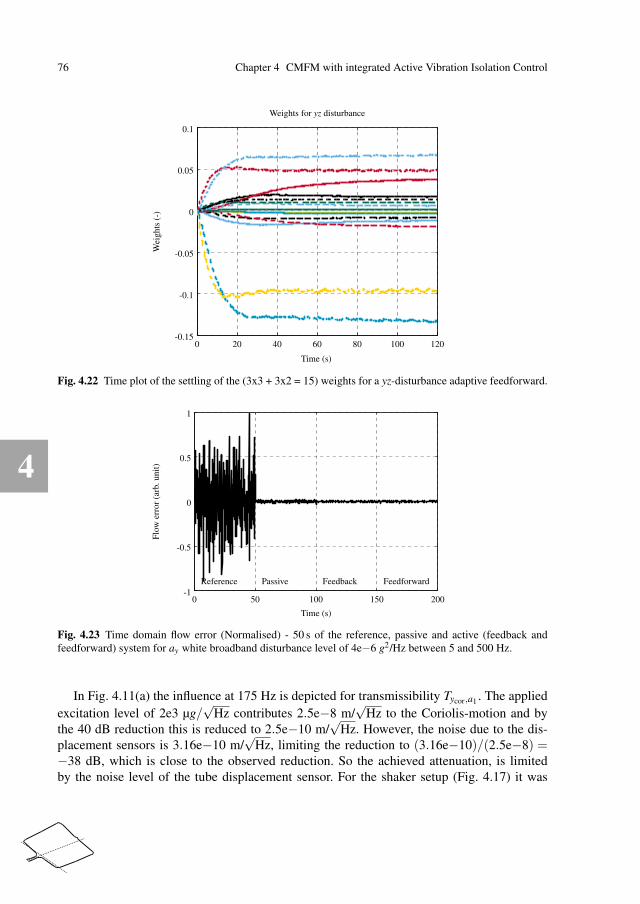
4
76 Chapter 4 CMFM with integrated Active Vibration Isolation Control
Time (s)
Weights for yz disturbance
Wei
ghts
(-)
0 20 40 60 80 100 120-0.15
-0.1
-0.05
0
0.05
0.1
Fig. 4.22 Time plot of the settling of the (3x3 + 3x2 = 15) weights for a yz-disturbance adaptive feedforward.
Reference Passive Feedback Feedforward
Time (s)
Flo
wer
ror
(arb
.uni
t)
0 50 100 150 200-1
-0.5
0
0.5
1
Fig. 4.23 Time domain flow error (Normalised) - 50 s of the reference, passive and active (feedback andfeedforward) system for ay white broadband disturbance level of 4e−6 g2/Hz between 5 and 500 Hz.
In Fig. 4.11(a) the influence at 175 Hz is depicted for transmissibility Tycor,a1 . The appliedexcitation level of 2e3 µg/
√Hz contributes 2.5e−8 m/
√Hz to the Coriolis-motion and by
the 40 dB reduction this is reduced to 2.5e−10 m/√
Hz. However, the noise due to the dis-placement sensors is 3.16e−10 m/
√Hz, limiting the reduction to (3.16e−10)/(2.5e−8) =
−38 dB, which is close to the observed reduction. So the achieved attenuation, is limitedby the noise level of the tube displacement sensor. For the shaker setup (Fig. 4.17) it was

4
4.6 Discussion 77
not possible to increase the excitation level further, so the expected attenuation of more than40 dB, as presented in section 4.5.3.1, could not be verified.
Table 4.1 RMS flow measurement error values for a broadband disturbance of 4e−6 g2/Hz = 2e3 µg/√
Hz
RMS error (arb. unit) Attenuation (dB)
no Dist. 0.0045 -Reference 0.3043 -Passive 0.0096 -30.0Feedback 0.0044 -36.8Feedforward 0.0049 -35.9
4.6 Discussion
With vibration isolation a reduction of the influence of external vibrations is achieved on thetransmissibility and on the measurement value. Several improvements can be made to obtainthe attenuation expected from the 1D model and even more attenuation can be obtained. Firstthe design of the compliantly suspended stage should be improved. As shown in Fig. 4.19,the passive suspension is not giving the attenuation belonging to the suspension frequencyof 30 Hz, because a translation causes an unexpected tilt of the stage. This can be improvedby placing the centre of mass in the centre of compliance, or by making the stage stiff inrotation direction. The flexible suspension in the y-direction still guarantees the attenuationfor rotational disturbances.
To lower the noise level of the measurement value further, tube-displacement sensors witha lower noise level should be used. This displacement sensors can also be used in the feed-forward strategy as error sensors instead of the acceleration sensors a1.
Further the feedforward controller structure should be changed, if the influence of a z-disturbance cannot be minimised in the design. As shown in the validation of the system insubsection 4.5.2, the structure of the secondary path is not as in the model (Eq. 4.6). Thereforethe optimal feedforward controller (Eq. 4.9) is different.
The performance of active vibration isolation is always dependent on the noise level of thesensors. In subsection 4.3.3.1 the effect of sensor noise on the stage acceleration a1 is given.Showing that for the feedback strategy compared to the feedforward strategy, sensors with alower noise floor are needed. The performance of the adaptive feedforward is also dependenton noise of the error sensor. In our validation the stage acceleration sensors are used andthe weights are tuned such that the stage accelerations approach the noise level of the stageaccelerometers. For the level of applied external disturbances, this maximises the attenuationat 175 Hz to about 50 dB. To increase the attenuation of the adaptive feedforward strategy,the noise level of the error sensors should be decreased. Alternatively and even better, thetube displacement ycor can be used as error sensor.

4
78 Chapter 4 CMFM with integrated Active Vibration Isolation Control
4.7 Conclusions
Vibration isolation of more than 40 dB is achieved for a Coriolis Mass-Flow Meter (CMFM)with integrated Active Vibration Isolation. The measurement stage is passively suspended at30 Hz in the 3 out-of-plane directions and active vibration isolation is added to increase theattenuation. In this paper the modelled system and controller design are presented. Based onthe model an on-scale proof of principle is built and validated in multi-DOF. Active vibra-tion isolation increases the attenuation of 10 to 20 dB at 175 Hz in addition to the 30 dBattenuation obtained by a 30 Hz passive vibration isolation stage.
A feedback and feedforward strategy are compared and both result in a large attenuationof the influence of external vibrations on the measurement value. A filtered-reference least-mean-square (FxLMS) adaptive scheme is used to determine the optimal feedforward con-troller parameters to minimise a squared error signal; the motion of the measurement stage.The performance of the feedback control, based on acceleration feedback, is limited due toissues to guarantee stability and therefore the attenuation is less, compared to the feedforwardstrategy. The overall active vibration isolation performance is limited by the noise levels ofthe used sensors. Even lower noise sensors means more costly sensors, but an increased per-formance. The results obtained in this paper can be used to find the balance between propersensors and vibration isolation performance.
The designed stage had more than one dominant direction of influence of external vibra-tions. This will be resolved in future research by placing the centre of mass in the centre ofcompliance, or by changing the number of degrees-of-freedom of the suspended stage.

5
Chapter 5
Vibration isolation by compliant sensor mounting
Abstract In this paper a vibration isolated design of a Coriolis Mass-Flow Meter (CMFM) isproposed, by introducing a compliant connection between the casing and the tube displace-ment sensors, with the objective to obtain a relative displacement measurement of the fluidconveying tube, dependent on the tube actuation and mass-flow, but independent of externalvibrations. The transfer from external vibrations to the relative displacement measurementis analysed and the design is optimised to minimise this transfer. The influence of externalvibrations on a compliant sensor element and the tube are made equal by tuning the reso-nance frequency and damping of the compliant sensor element and therefore the influence onthe relative displacement measurement is minimised. The optimal tuning of the parameters isdone actively by acceleration feedback. Based on simulation results, a prototype is built andvalidated. The validated design shows more than 24 dB reduction of the influence of externalvibrations on the mass-flow measurement value of a CMFM, without affecting the sensitivityfor mass-flow.
This chapter is preprinted from: L. van de Ridder, W. B. J. Hakvoort, J. van Dijk, J. C.Lötters, and A. de Boer. Vibration isolation by an actively compliantly mounted sensor ap-plied to a coriolis mass-flow meter. 2015. Submitted to Dynamic Systems, Measurement andControl (ASME)

5
80 Chapter 5 Vibration isolation by compliant sensor mounting
5.1 Introduction
Vibration isolation is extremely important in high precision machines for surface treat-ments (e.g. lithography machines) or measurements (e.g. scanning electron microscopes) thatshould be accurate to nanometre level. Vibration isolation can be achieved with passive iso-lators. Passive isolation consist of several stages of mass-spring-damper systems between thefloor and the casing of a machine [53], the parameters are adjusted to achieve high-frequencyattenuation, which is appropriate for many applications. The better the vibration isolationsystem the better the decoupling of the internal measurement system from any environmentaldisturbances. However, the performance of passive isolation can be limited due to a minimalrequired suspension stiffness. An alternative approach is to apply active vibration isolationcontrol [77, 52]. In this paper an active vibration isolated measurement system applied to aCoriolis Mass-Flow Meter (CMFM) is presented.
A CMFM is an active device based on the Coriolis force principle for direct mass-flowmeasurements independent of fluid properties [1, 78]. The CMFM contains a fluid conveyingtube, which is actuated to oscillate in resonance with a low amplitude. A fluid flow in thevibrating tube induces Coriolis forces, proportional to the mass-flow, which affect the mode-shape of the actuation mode. Measuring the tube displacements allows measuring the mass-flow. Besides an effect of the mass-flow on the modeshape, external vibrations can introducemotions that cannot be distinguished from the Coriolis force induced motion [13, 14], thusintroducing a measurement error. The influence of external vibrations on the measurementvalue can be estimated quantitatively as shown in Chapter 2.
It is necessary to incorporate a a balancing mechanism for flow meters, which allows ac-curate measurements for various process conditions and changing fluid densities [1]. There isonly attenuation needed in a relative small range around the actuation frequency (Chapter 2),vibration isolation solutions can be applied, without interfering with the accurate measure-ment of the displacements of the internal actuation modeshape.
In this paper a novel design of a CMFM is proposed, by introducing a compliant connec-tion between the casing and the tube displacement sensors with the objective to obtain a rel-ative displacement measurement of the tube, dependent on the tube actuation and mass-flow,though independent of external vibrations. The design is analysed to optimise the transferfunction from the external vibrations to the relative displacement measurement. The influ-ence of external vibrations on the compliant sensor element and the tube are made equal byactively tuning the resonance frequency and damping of the compliant sensor element andthereby the influence on the relative displacement measurement is minimised. Based on sim-ulation results, a prototype is built and validated. This paper is an extension of [71]: (i) theeffects of changing the internal dynamics due to a fluid-density change are addressed in de-tail, (ii) the optimal suspension frequency of the compliant sensor element is determined and(iii) the attenuation is maximised by active tuning of the compliant sensor element resonancefrequency.
In the next section the performance criterion is given for the level of vibration isolation. Insection 5.3, the novel design is introduced and the transmissibility from external vibrationsto an internal deformation is derived, based on a model for a reference instrument and forthe new design in the passive and active configuration. In section 5.4 a mechanical design is

5
5.2 Performance criteria 81
Casing
Tube-window
act1
act2
s1s2
aaa0
θswing
θtwist
xy
z
Fig. 5.1 Multibody model of the CMFM, adopted from Chapter 2. The tube-window is actuated, by means ofact1 and act2, to oscillate around the θtwist-axis. On the casing, external vibrations aaa0 are applied. Sensors (s1
and s2) measure the relative tube displacements, affected by the actuation, a mass-flow and external vibrations.
presented, based on the concept presented in section 5.3. The design is validated experimen-tally in section 5.5. Results are discussed in section 5.6 and the conclusions of this paper arepresented in the final section 5.7.
5.2 Performance criteria
Prior to the design and analysis of a vibration isolator, a performance criterion is needed.In this section a definition is given, taking into account how external vibrations affect themass-flow measurement of a CMFM.
A functional model of a CMFM is presented in various patents [45, 46]. Of this instru-ment a flexible multibody model (see Chapter 2) is made to derive the influence of externalvibrations on the measurement value, using [31, 48]. An illustration of the model is givenin Fig. 5.1. The model consists of a rigid casing and a flexible tube-window, conveying thefluid flow, which is actuated by two Lorentz actuators act1 and act2. The displacement of thetube-window is measured by two optical displacements sensors s1 and s2 [46]. On the casingan input vector aaa0, consisting of three translation and three rotational casing movements, isimposed.
A Lorentz actuator is used to oscillate the tube-window around the θtwist-axis in its res-onance frequency ωact. In the model the measured actuation displacement is the difference

5
82 Chapter 5 Vibration isolation by compliant sensor mounting
between the two sensor signals, located at equal distance r of the rotation axis:
yact = r ·θtwist =12(s1 − s2) (5.1)
Due to a rotating reference frame, the tube, and a moving mass, the fluid, there is a Coriolisforce. This force is acting on the tube-window and is proportional to the angular velocity andthe mass-flow Φm through the tube:
Fcor =−2Leff · θtwist × Φm (5.2)
where Leff is the effective length of the tube. The force Fcor results in a rotation of the tube-window around the θswing-axis (see Fig. 5.1). A rotation around this axis results in a dis-placement at the location of the sensors. This measured displacement is defined as a Coriolisdisplacement:
ycor =12(s1 + s2) (5.3)
The Coriolis displacement, due to a fluid flow, is a harmonic with the same frequency ωact asthe actuation displacement, though 90° out of phase. This is due to the velocity dependency ofthe force, expressed by Eq. 5.2. A phase difference between the two harmonic sensor signalss1 and s2, which are shifted 180° nominally, can be approximated by:
∆φ ≈ 2
∣∣∣∣
s1 + s2
s1 − s2
∣∣∣∣= 2
∣∣∣∣
ycor
yact
∣∣∣∣
(5.4)
The actuation displacement yact is controlled with an internal actuator to be constant and theCoriolis displacement ycor is due to a mass-flow through the instrument, resulting in a phasedifference ∆φ which is proportional to the mass-flow Φm.
Thus, the mass-flow measurement value is obtained from the phase difference betweentwo harmonics, which are the tube displacements measured by two sensors. The frequencyof the harmonic is known to be the actuation frequency of the tube window. Only the phasedifference of this particular harmonic is needed for obtaining the mass-flow measurement.The phase difference is acquired by phase demodulation, which can be seen as a band passfilter on the Coriolis displacement signal around the actuation frequency (see Chapter 2), ofwhich the width is dependent on the required response time of the measurement value due toa flow rate change.
A Coriolis displacement ycor that is not related to a mass-flow through the instrument, butfor instance as a result of external vibrations, can result in a measurement error. The effect ofexternal vibrations is undesirable, therefore its transmissibility should be minimised.
In this paper the performance criterion is defined as: minimisation of the transmissibilityTycor,aaa0(s) of external vibrations aaa0(s) to an internal deformation ycor(s) around the actuationfrequency ωact without affecting the transmissibility Tycor,Fcor(s) of a Coriolis force Fcor(s) tothe internal deformation ycor(s) . The attenuation is defined as the ratio by which Tycor,aaa0(s) isreduced.

5
5.3 Conceptual design 83
5.3 Conceptual design
In this section a solution is proposed to minimise the transmissibility Tycor,aaa0(s), which is theperformance criterion, explained in the previous section. First, the transmissibility is derivedfor the reference system and for the new design. In the second subsection the main designparameters for minimising the transmissibility are presented. In the final subsection the designis extended with an active part to actively optimise the transmissiblity.
5.3.1 Simplified model
Earlier modelling results indicate one dominant direction for the mass-flow measurement,a translation in the direction out of the tube-window plane (See Chapter 2). Therefore theeffect of external vibrations and the mass-flow are modelled in a simple and elegant mannerby a simple mass-spring model, as depicted in Fig. 5.2. The tube parameters1 are modelledwith the modal mass m2 = 1.133e−4 kg, damping d2 = 6.836e−5 Ns/m and stiffness k2 =41.25 N/m and there are two inputs, an external vibration ay = y0 and a Coriolis force Fcor andone output ycor, which is a relative displacement measurement between the mass m2 and thecasing. The modelled mode has a resonance frequency ωcor =
√k2/m2 = 96.0 · 2π rad/s. The
Coriolis force, due to a mass-flow, is a harmonic with the frequency ωact = 170.0 · 2π rad/s.The modal model reduction of the system is presented in Chapter 2.
Fcor
ycor
y2m2
d2 k2
y0
Fig. 5.2 1D CMFM model, representing the Coriolis mode. The Coriolis displacement ycor is affected by theCoriolis force Fcor and an external displacement y0.
According to this model (Fig. 5.2) of the reference system, the relative displacement in theLaplace s-domain is equal to:
ycor(s) = y2(s)− y0(s)= Tycor,Fcor(s)Fcor(s)+Tycor,ay(s)ay(s)
= 1m2s2+d2s+k2
Fcor(s)+−1
s2+d2m2
s+k2m2
ay(s)(5.5)
1 Note that the tube geometry in this chapter is different than in Chapter 2 and therefore the presented reso-nance frequencies are higher.

5
84 Chapter 5 Vibration isolation by compliant sensor mounting
This expression shows that the displacement is indeed dependent on the Coriolis Force andthe external vibration ay. The influence is dependent on the magnitude of the disturbance, thefrequency and the physical parameters of the system. Those physical parameters cannot bechanged without changing the sensitivity for a mass-flow.
y0
m2
k2d2
y2
y′cor
Fcor
Fdis
m1
k1d1
y1
Fig. 5.3 1D CMFM CMS model. Compared to the CMFM model (Fig. 5.2) the measured Coriolis displace-ment is relative to the flexibly suspended mass m1.
Table 5.1 Modal parameters of CMFM model for two different fluid densities ρ
ρ (kg/m3) g1 (-) g2 (-) ωcor,1 (rad/s) ωcor,2 (rad/s) ωact (rad/s) Q (-)
1 (Air) -1.133 0.2107 96.03·2π 378.3·2π 170.0·2π 1000998 (Water) -1.137 0.2153 91.35·2π 356.1·2π 160.2·2π 1000
To increase vibration isolation, without changing the mass-flow sensitivity, it is proposedto use a compliantly mounted sensor (CMS). The model is shown in Fig. 5.3. The relativedisplacement measurement is no longer between the casing and the internal mass m2, butbetween an extra mass m1 and again m2. There is a certain stiffness k1 and damping d1
between the new mass and the casing. In this model the new relative displacement is equalto:
y′cor(s) = y2(s)− y1(s) = ycor(s)−q1(s) =
= Tycor,Fcor(s)Fcor(s)+Tycor,ay(s)ay(s)−Tq1,ay(s)ay(s)
=1
m2s2 +d2s+ k2Fcor(s)
+
(d2m2
− d1m1
)
s+(
k2m2
− k1m1
)
(
s2 + d1m1
s+ k1m1
)(
s2 + d2m2
s+ k2m2
)ay(s) (5.6)

5
5.3 Conceptual design 85
where q1(s) = y1(s)−y0(s). The sensitivity for flow is equal, but the transmissibility of exter-nal vibrations to the Coriolis displacement is dependent on the newly introduced parameters.By choosing the mass, damping and stiffness of the compliantly mounted sensor, the influ-ence of the external vibrations ay can be minimised. An optimal result, according to Eq. 5.6,can be achieved when the following conditions are met:
d1 =m1
m2d2, k1 =
m1
m2k2 (5.7)
This is achieved when the resonance frequency(
ω =√
k/m
)
and damping ratio (ζ = d/2√
km)
are equal for the internal mode of the tube-window and the compliantly mounted sensor.
5.3.2 Design parameters
In this section, the choice of the design parameters (m1, d1 and k1) of the CMS are elaborated.The result, whereby ω and ζ are equal for the tube and the internal mode, is depicted as dashedline in Fig. 5.4, whereby the transfer function Tycor,ay of the model depicted in Fig. 5.1 is used.The use of those parameters does not result in a zero transmissibility, because the simplifiedmass-spring-damper model (Fig. 5.2) does not represent the higher order dynamics of thetube-window. In the region of interest, this transmissibility can be approximated by addingthe next mode in the sensitive direction:
Ty′cor,ay
(s) = Tycor,ay(s)−Tq1,ay(s)
≈ g1
s2 + 1Q
ωcor,1s+ω2cor,1
+g2
s2 + 1Q
ωcor,2s+ω2cor,2
− −1
s2 + d1m1
s+ k1m1
(5.8)
which is a function of the modal parameters of the CMFM-tube and of the compliantlymounted sensor properties. In Table 5.1 the modal parameters of the CMFM tube modelare given.
Evaluating Eq. 5.8 shows that the parameters, given in Eq. 5.7, do not minimise the trans-missibility T
y′cor,ay
(s) in the region of interest. Based on Eq. 5.8, two design parameters are
defined: the resonance frequency ωCMS =√
k1m1
and the damping ratio ζCMS = d12√
k1m1of the
CMS. In Fig. 5.5 the attenuation of the transmissibility Ty′cor,ay
(s) at the actuation frequency,as function of the variation of those parameters is depicted. The attenuation is defined as:
Attenuation (dB) = 20 · log10
(∣∣∣∣∣
Ty′cor,ay
(iωact)
Tycor,ay(iωact)
∣∣∣∣∣
)
(5.9)

5
86 Chapter 5 Vibration isolation by compliant sensor mounting
Frequency (Hz)
Mag
nitu
de(d
B)
Transmissibility ay to ycor
ROIReferenceCMS - 96 HzCMS - 116 Hz
101 102 103-200
-180
-160
-140
-120
-100
-80
-60
-40
Fig. 5.4 Transmissibility from external vibrations ay to the Coriolis displacement ycor of the reference systemand the CMS system (Eq. 5.8). The CMS transmissibility is depicted for the stiffness and damping parametersaccording to Eq. 5.7 and for ωCMS = 116 · 2π rad/s and ζCMS = 0.01. The region of interest is a 25 Hz bandaround the actuation frequency ωact.
From Fig. 5.5 can be concluded that the CMS resonance frequency ωCMS should be about15 Hz higher than the Coriolis frequency ωcor,1 and that the damping should be minimal. InFig. 5.4, also the transmissibility T
y′cor,ay
(s) is depicted for ωCMS = 116 ·2π rad/s and ζCMS =
0.01. It clearly shows the newly introduced resonance frequency, but also an anti-resonancein the region of interest. The appearance of this anti-resonance is used to reduce the influenceof external vibrations in the region of interest.
For example, in case the fluid medium is air, tuning the resonance frequency of the CMSto 110 Hz and minimise the damping, results in an attenuation of more than 30 dB around theactuation frequency.
5.3.3 Actively compliantly mounted sensor
The maximum attenuation is not only dependent on the suspension frequency ωCMS, it is alsoa function of the damping ζCMS and the modal parameters of the transmissbility Ty‘
cor,ay(s)
(Eq. 5.8). As shown in Table 1, the latter are dependent on the fluid density of the medium inthe CMFM-tube. Therefore an active version of the CMS is suggested. In Fig. 5.6 the passivemodel (Fig. 5.3) is extended with an extra sensor a1, to measure the accelerations of the massm1, and an actuator Fa to apply a force on the mass m1.

5
5.3 Conceptual design 87
Suspension frequency ωCMS (Hz)
Mag
nitu
de(d
B)
Attenuation at ωact
ζCMS = 0.01 (Air)ζCMS = 0.02 (Air)ζCMS = 0.01 (WaterζCMS = 0.02 (Water)
80 90 100 110 120 130-35
-30
-25
-20
-15
-10
-5
0
Fig. 5.5 Influence of the suspension frequency ωCMS on the attenuation of at the actuation frequency ωact fortwo different fluids (air and water) and the dampings ratio ζCMS of the CMS.
y0
m2
k2d2
y2
y′cor
Fcor
Fdis
m1
k1d1
y1
a1
Fa
C(s)
Fig. 5.6 1D CMFM active CMS model. Compared to the CMFM CMS model (Fig. 5.3) actuation and sensingmeans are added to flexibly suspended mass m1.
A transfer function between the input F to the output a1 is derived as:
P(s) =a1(s)
Fa(s)=
1m1
· s2
s2 + d1m1
s+ k1m1
(5.10)
Proportional acceleration feedback is proposed to add extra mass and thus decrease the initialsuspension frequency, which is set at ωCMS = 116 ·2π rad/s.

5
88 Chapter 5 Vibration isolation by compliant sensor mounting
Ca1(s) =Fa(s)
a1(s)=−ka (5.11)
For this controller, the transmissibility from external vibrations to the displacement of themass is equal to:
Tq1,ay(s) =q1(s)
ay(s)=
−1(m1 + ka)s2 +d1s+ k1
(5.12)
resulting in a new suspension frequency ωCMS,active =√
k1m1+ka
, where the gain ka of the
feedback can be adjusted to achieve the desired suspension frequency:
ka = m1
(
ω2CMS,passive
ω2CMS,active
−1
)
(5.13)
A second advantage of an active CMS, is the possibility to add relative damping to the mea-sured, relative displacement y
′cor. This limits the effect of shock disturbances on the amplitude
of the undamped modes. The added damping prevents the relative displacement to go beyondthe measurement range. To damp the internal mode, positive position feedback is added incombination with a notch filter at the actuation frequency [52]. This notch filter is added toprevent a change in the transfer function between Fcor(s) and y‘
cor(s) and thus in a change insensitivity for a mass-flow. Therefore the controller is equal to:
Cycor(s) =Fa(s)
ycor(s)(5.14)
= kp ·ω2
cor
s2 +0.01ωcors+ω2cor
︸ ︷︷ ︸
LowPass
· s2 +0.0001ωacts+ω2act
s2 +0.1ωacts+ω2act
︸ ︷︷ ︸
Notch
In Fig. 5.7 the new transmissibility is depicted for the active CMS. Showing that an atten-uation of more than 20 dB is possible. In the magnified part of the figure is shown that themagnitude of the resonance peak is lowered due to the controller presented in Eq. 5.14.
5.4 Mechanical design
In the previous section a concept is proposed to reduce the influence of external vibrationson the measured sensor displacements. In this section the conceptual design is extended to amechanical design.
First, the model of the reference system (Fig. 5.1) and the 1D active CMS (Fig. 5.6) arecombined. The combined model is depicted in Fig. 5.8. The sensors measuring the tube dis-placement (s1 and s2) are no longer measuring it relative to the casing, due to the introduction
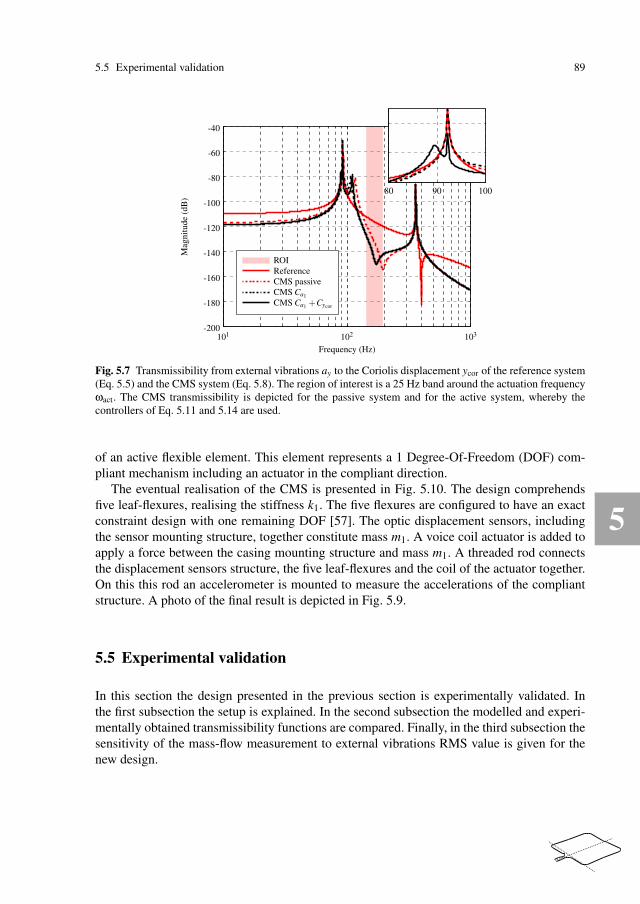
5
5.5 Experimental validation 89
Frequency (Hz)
Mag
nitu
de(d
B)
ROIReferenceCMS passiveCMS Ca1
CMS Ca1 +Cycor
80 90 100
101 102 103-200
-180
-160
-140
-120
-100
-80
-60
-40
Fig. 5.7 Transmissibility from external vibrations ay to the Coriolis displacement ycor of the reference system(Eq. 5.5) and the CMS system (Eq. 5.8). The region of interest is a 25 Hz band around the actuation frequencyωact. The CMS transmissibility is depicted for the passive system and for the active system, whereby thecontrollers of Eq. 5.11 and 5.14 are used.
of an active flexible element. This element represents a 1 Degree-Of-Freedom (DOF) com-pliant mechanism including an actuator in the compliant direction.
The eventual realisation of the CMS is presented in Fig. 5.10. The design comprehendsfive leaf-flexures, realising the stiffness k1. The five flexures are configured to have an exactconstraint design with one remaining DOF [57]. The optic displacement sensors, includingthe sensor mounting structure, together constitute mass m1. A voice coil actuator is added toapply a force between the casing mounting structure and mass m1. A threaded rod connectsthe displacement sensors structure, the five leaf-flexures and the coil of the actuator together.On this this rod an accelerometer is mounted to measure the accelerations of the compliantstructure. A photo of the final result is depicted in Fig. 5.9.
5.5 Experimental validation
In this section the design presented in the previous section is experimentally validated. Inthe first subsection the setup is explained. In the second subsection the modelled and experi-mentally obtained transmissibility functions are compared. Finally, in the third subsection thesensitivity of the mass-flow measurement to external vibrations RMS value is given for thenew design.
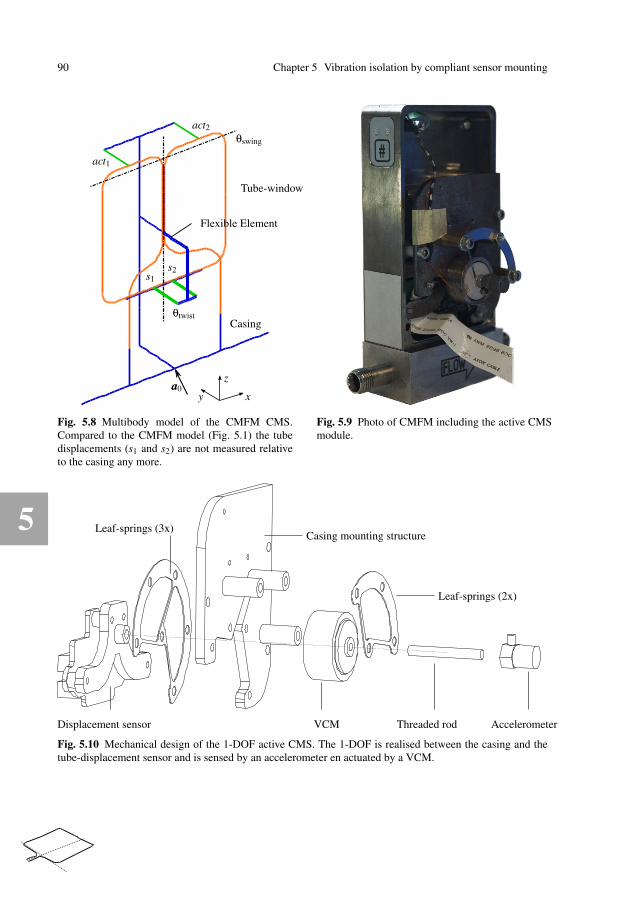
5
90 Chapter 5 Vibration isolation by compliant sensor mounting
Casing
Tube-window
act1
act2
s1s2
aaa0
θswing
θtwist
xy
z
Flexible Element
Fig. 5.8 Multibody model of the CMFM CMS.Compared to the CMFM model (Fig. 5.1) the tubedisplacements (s1 and s2) are not measured relativeto the casing any more.
Fig. 5.9 Photo of CMFM including the active CMSmodule.
Displacement sensor VCM Threaded rod Accelerometer
Casing mounting structure
Leaf-springs (2x)
Leaf-springs (3x)
Fig. 5.10 Mechanical design of the 1-DOF active CMS. The 1-DOF is realised between the casing and thetube-displacement sensor and is sensed by an accelerometer en actuated by a VCM.

5
5.5 Experimental validation 91
5.5.1 Setup
The experimental setup is depicted in Fig. 5.11. The device under test (DUT) is a functionalmodel of a CMFM including the CSM (Fig. 5.9). The CSM design is presented in section 5.4and more details of the patented design of a CMFM are presented in [45]. The DUT is placedon a 6-DOF shaker to be able to apply external vibrations. A broadband white disturbance, amulti-sine between 5 and 500 Hz, is applied on the 6-DOF platform, using the six actuators.More details of the shaker-setup are given in [64]. The active strategy, using a Brül&Kjær4393 accelerometer, is implemented using MATLAB XPC Target in combination with a NI-6259 data acquisition card. The real-time system runs at a sample rate of 10 kHz.
6-DOF Platform
CMFM (DUT)
Actuator (6x)
Fig. 5.11 6-DOF shaker platform, including Device Unter Test (DUT), to apply an external vibrations on thecasing of a CMFM.
5.5.2 Transmissibility
First the transfer function from an actuator input U in Volts to the acceleration sensor a1
is validated, where Fa =kmR
U with a motor constant km and resistance R of the voice coil
actuator. From an experiment the equivalent mass is estimated: meq =m1Rkm
= 4.8 Vs2
m . Besidesthe physical mass, this includes the characteristics of the actuator, the used amplifier andthe accelerometer signal conditioner. The measured transfer function is compared with themodel (Eq. 5.10) in Fig. 5.12. From this experiment the relevant CMS parameters can beestimated. The resonance frequency is ωCMS,passive ≈ 116 ·2π rad/s and the damping ζCMS ≈0.01. Around 375 Hz an internal mode of the CMS is visible.
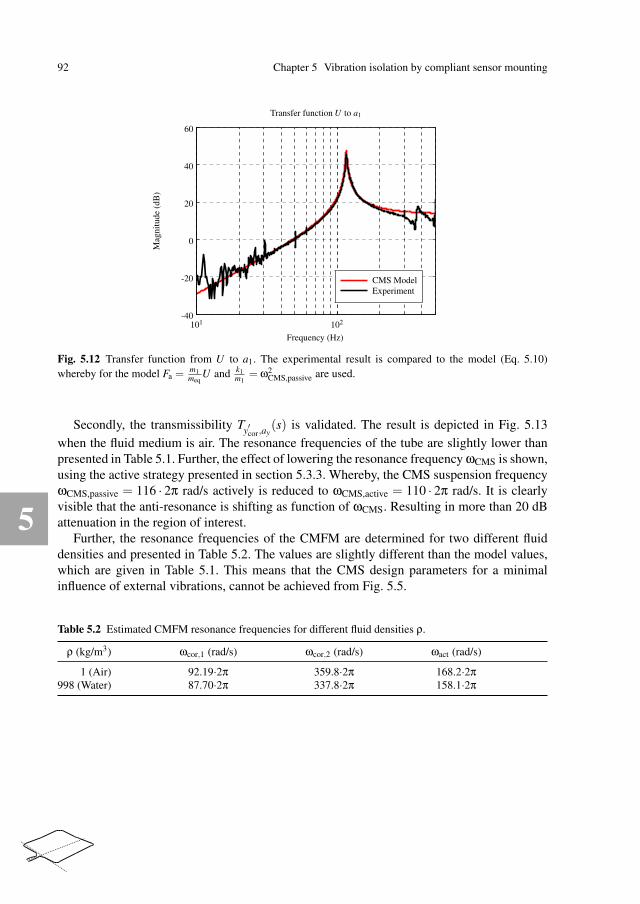
5
92 Chapter 5 Vibration isolation by compliant sensor mounting
Frequency (Hz)
Mag
nitu
de(d
B)
Transfer function U to a1
CMS ModelExperiment
101 102-40
-20
0
20
40
60
Fig. 5.12 Transfer function from U to a1. The experimental result is compared to the model (Eq. 5.10)whereby for the model Fa =
m1meq
U and k1m1
= ω2CMS,passive are used.
Secondly, the transmissibility Ty′cor,ay
(s) is validated. The result is depicted in Fig. 5.13when the fluid medium is air. The resonance frequencies of the tube are slightly lower thanpresented in Table 5.1. Further, the effect of lowering the resonance frequency ωCMS is shown,using the active strategy presented in section 5.3.3. Whereby, the CMS suspension frequencyωCMS,passive = 116 · 2π rad/s actively is reduced to ωCMS,active = 110 · 2π rad/s. It is clearlyvisible that the anti-resonance is shifting as function of ωCMS. Resulting in more than 20 dBattenuation in the region of interest.
Further, the resonance frequencies of the CMFM are determined for two different fluiddensities and presented in Table 5.2. The values are slightly different than the model values,which are given in Table 5.1. This means that the CMS design parameters for a minimalinfluence of external vibrations, cannot be achieved from Fig. 5.5.
Table 5.2 Estimated CMFM resonance frequencies for different fluid densities ρ.
ρ (kg/m3) ωcor,1 (rad/s) ωcor,2 (rad/s) ωact (rad/s)
1 (Air) 92.19·2π 359.8·2π 168.2·2π998 (Water) 87.70·2π 337.8·2π 158.1·2π

5
5.5 Experimental validation 93
Frequency (Hz)
Mag
nitu
de(d
B)
Transmissibility ay to ycor for ρ = 1 kg/m3 (Air)
ROIReferenceCMS modelCMS exp. - PassiveCMS exp. - Active
101 102-200
-180
-160
-140
-120
-100
-80
-60
-40
Fig. 5.13 Validation of the transmissibility from external vibrations ay to the Coriolis displacement ycor ofthe CMS system (Eq. 5.8) for the passive and active CMS compared to the model. The CMS suspensionfrequency ωCMS,passive = 116 · 2π rad/s is actively reduced to ωCMS,active = 110 · 2π rad/s. Model parametersare based on the estimated parameters when the CMFM tube is filled with air.
5.5.3 Disturbance sensitivity
In the previous section the transmissibility function is validated. In earlier research it wasshown that minimising this function in the region of interest results in a lower disturbancesensitivity (Chapter 2). In that paper the influence of broadband external vibrations on theRMS measurement error of a CMFM is explained and validated. The influence is dominatedby the gain of the transmissibility at the actuation frequency, the sensitivity for the mass-flowand the width of the bandpass filter in the mass-flow measurement algorithm. In this subsec-tion the influence of external vibrations on the mass-flow measurement value, in combinationwith a 10 Hz bandpass filter, is shown for the newly presented design.
Table 5.3 RMS measurement error (in normalised units), including attenuation in dB compared to the refer-ence, for the different applied disturbance levels. The values are depicted in Fig. 5.14
Disturbance Reference Passive (air) Active (Air) Passive (water) Active (water)((m/s2)2/Hz) (units) (units) (dB) (units) (dB) (units) (dB) (units) (dB)
0 1.000 0.628 -4.05 0.693 -3.19 0.733 -2.70 0.974 -0.231e−7 1.457 0.666 -6.80 0.686 -6.54 0.784 -5.39 0.997 -3.301e−6 4.577 0.700 -16.3 0.765 -15.5 1.436 -10.1 1.031 -12.91e−5 13.87 1.296 -20.6 0.998 -22.9 3.692 -11.5 1.046 -22.51e−4 45.33 4.754 -19.6 2.764 -24.3 12.56 -11.2 4.137 -20.84e−4 93.36 13.80 -16.6 9.325 -20.0 26.44 -11.0 8.411 -20.9

5
94 Chapter 5 Vibration isolation by compliant sensor mounting
Fig. 5.14 RMS measurement error for the different applied disturbance levels. Numerical values are given inTable 5.3.
Therefor a broadband multi-sine disturbance between 5 and 500 Hz is applied on the cas-ing of the CMFM. In Table 5.3 the normalised RMS measurement error is shown for differ-ent disturbance levels and the different configurations. The data is also graphically shown inFig. 5.14. The RMS errors are compared to the reference instrument (without CMS) resultingin an attenuation in dB. The influence is determined for both cases when the tube is filled withair and water. For the active configurations the resonance frequency of the CMS is activelylowered, using the strategy as presented in section 5.3.3. For the active CMS, the suspensionfrequency ωCMS is lowered to respectively 113 ·2π rad/s and 109 ·2π rad/s for the the case thefluid medium is air or water. Those values are different than the values depicted in Fig. 5.5,because the modal parameters of the CMFM are different for the CMFM compared to themodel (See Table 5.1 and 5.2).
From the results is concluded that the parameters of the passive CMS are not optimal forthe both cases when the tube is filled with air or with water. Actively tuning the resonancefrequency improves the result. For low external disturbance levels the attenuation is small,because of the noise floor of the tube displacement sensors. This is also visible in Fig. 5.14:for low disturbance levels the error line trend is horizontal due to the noise level of the tubedisplacement sensors.
The optimal CMS suspension parameters are obtained when the transmissibility Tycor,a0(s)is minimal around the actuation frequency. In Appendix 5.8 the an approximation of theoptimal CMS suspension frequency ωCMS is determined as function of the modal parametersg1, g2, ωcor,1, ωcor,2 and ωact. Experiments shows that an attenuation of more than 24 dB canbe achieved by the use of an active CMS.

5
5.7 Conclusions 95
5.6 Discussion
In the previous section the achievable attenuation of the vibration sensitivity of a CMFM bya CMS is presented. The attenuation of a passive CMS is dependent on both the design of thefluid-conveying tube and the compliantly mounted sensor module. The dynamic propertiesof the tube alter for different fluid densities. Therefore the performance is dependent on thedensity of the fluid.
The sensitivity for the properties of the tube can be reduced by using an active CMS tolower the suspension frequency. For robustly stable control the suspension frequency can onlybe lowered. A disadvantage is that the feedback introduces extra damping, due to back-emf,resulting in less attenuation, but this can be resolved using the actuator in current-mode. Infuture, the optimal parameters can be found when using adaptive feedback control. Alterna-tively to the active feedback method, a compromise can be found, when the design parametersof the CMS for high and low fluid densities are averaged. For example, the CMS can be de-signed with an suspension frequency ωCMS = 107 ·2π rad/s, to achieve a combined maximumattenuation (See Fig. 5.5).
The presented CMS module is a proof of principle and is rather large, but the concept canbe miniaturised, for example like the optic reading head in DVD-players. Further, instead ofan acceleration sensor also displacement or velocity sensors can be used to alter the dynamicbehaviour of the CMS. Another advantage of the CMS is that the influence of the gravitationalsagging is minimal. Therefore, the displacement sensors are always in the same part of thecharacteristic sensor response curve, independent of the orientation of the instrument.
The presented CMS module can also be used in combination with other vibration reductiontechniques, e.g. passive suspension between the casing and the surroundings (Chapter 2) orextended with active vibration isolation control (Chapter 3), to increase the reduction evenmore.
5.7 Conclusions
Vibration isolation for a Coriolis Mass-Flow Meter (CMFM) is achieved using an activelycompliantly mounted sensor (CMS). More than 24 dB attenuation is realised compared tothe reference system. The CMFM measurement value depends on a displacement measure-ment of the fluid-conveying tube movements. The measurement signal is also influenced byexternal vibrations. To achieve the 24 dB attenuation, a new design is introduced: A compli-ance between the casing and the displacement sensor is added, to enable a true displacementmeasurement of the tube.
Optimal attenuation is achieved by tuning the resonance frequency and the relative damp-ing of the CMS. The optimal values depend on the dynamic properties of the tube, whichchange by the density of the fluid inside the tube. The parameters of the CMS are tuned ac-tively, with acceleration feedback, to have a maximum attenuation, independently of the fluiddensity. An attenuation of more than 24 dB is demonstrated for a CMFM with an active CMS,in case the tube filled with both water and air.

5
96 Chapter 5 Vibration isolation by compliant sensor mounting
5.8 Appendix: Optimal CMS frequency
The achievable attenuation of the influence of external vibrations is dependent on the locationof the zero of Eq. 5.8, as depicted in Fig. 5.4. This zero location is dependent on several modalparameters (g1, g2, ωcor,1, ωcor,2, ωact, Q, ωCMS and ζCMS). From Eq. 5.8 the location of thezero can be estimated by solving:
g1(s2 +
1Q
ωcor,2s+ω2cor,2)(s
2 +2ζCMSωCMSs+ω2CMS)
+g2(s2 +
1Q
ωcor,1s+ω2cor,1)(s
2 +2ζCMSωCMSs+ω2CMS)
+(s2 +1Q
ωcor,1s+ω2cor,1)(s
2 +1Q
ωcor,2s+ω2cor,2) = 0 (5.15)
To minimise the attenuation at the actuation frequency, the zero should be placed at thisfrequency, so s = iωact. Now Eq. 5.15 can be solved for ωCMS:
ωCMS ≈√
−((g1 +g2)ω2act −g1ω2
cor,2 −g2ω2cor,1) · . . .
(ω2actω
2cor,1 +ω2
actω2cor,2 −ω2
cor,1ω2cor,2 − . . .
(g1 +g2 +1)ω4act +g1ω2
actω2cor,2 +g2ω2
actω2cor,1)
/((g1 +g2)ω2act −g1ω2
cor,2 −g2ω2cor,1) (5.16)
In this approximation the damping parameters are omitted (Q = ∞ and ζCMS = 0), becausethose do not change the location of the minimum (see Fig. 5.5), they only affects the achiev-able attenuation. With this equation, the optimal CMS frequency can be calculated, when theneeded modal parameters are estimated.

6
Chapter 6
Evaluation
The design rules for the next generation CMFMs for low flows (< 1 kg/h) are evaluated inthis chapter. First the main performance criteria of a CMFM, based on a simple model, arediscussed. Secondly, different CMFM tube designs are evaluated on their performance. In thethird section the configurations analysed in this thesis are shown and it is discussed how thoseconfigurations can be used in commercial products.
6.1 Performance criteria
A CMFM is an active device based on the Coriolis force principle for direct mass-flow mea-surements independently of fluid properties [1, 78]. In this section a simple modal model ofa CMFM is presented. Such model can be used to represent complex tube shapes as well, asvalidated in Chapter 2. Based on the model parameters, the flow range and the measurementsensitivity for flow are determined. Next, the sensitivity for disturbances is determined, withthe focus on external vibrations.
6.1.1 Modelling
In the past, many examples have been presented that show how the fluid-tube interaction,including the Coriolis effect, can be modelled [25, 35, 54, 61, 72]. The modelling shows aCMFM sensitive for a mass-flow, but also that the measurement value is affected by all kindof disturbances. A summary of those disturbances is given in section 1.2. In Appendix B amodel of a simple CMFM with two degrees-of-freedom is derived. These two degrees-of-freedom represent the Coriolis and actuation mode only. The model is depicted in Fig. 6.1.

6
98 Chapter 6 Evaluation
uu
L
Lk
kk
r
s2 s1
y1
y0
θ1
θ0
Fig. 6.1 2-DOF CMFM model: a rigid fluid-conveying tube of length L, flexibly mounted to the surroundingsby stiffness k. The tube-movements are measured by two sensors, placed on equal distance r of the rotationaxis.
Based on this model, the equations of motion, for a symmetric undamped system with aconstant mass-flow Φm = ρfAfu, are derived:
[m+ρfAfL 0
0 J+ 112 ρfAfL
3
][y1
θ1
]
+
[0 ΦmL
−ΦmL 0
][y1
θ1
]
+
[2k 00 1
2 kL2k
][y1
θ1
]
=
[Fy +2ky0
Mθ +12 kL2
kθ0
]
(6.1)
Where m and J = 112 mL2 are respectively the modal mass and modal moment of inertia of
an empty tube. The tube has a length L and a modal stiffness k and Lk is the ratio betweenthe translational and rotational stiffness. The cross sectional area of the fluid is Af =
14 πd2,
where the fluid has a density ρf and flow velocity u. The structural damping is omitted in thismodel, because the Coriolis tubes are normally designed with high Q-factors [44]. Using amodal decomposition method even CMFM models with complex tube shapes can be reducedto this simple model with only the Coriolis mode and actuation mode. This approximation isvalidated in Chapter 2.
For the no-flow condition (u = 0), the tube has two clear resonance frequencies:
ω1 =
√
2k
m+ρfAfL, ω2 =
√12 kL2
k
J+ 112 ρfAfL3
=
√3Lk
L
√
2k
m+ρfAfL= αω1, (6.2)
belonging respectively to the translational and rotational mode of the tube. The resonancefrequencies depend on the geometry, but also on the density ρf of the fluid. The model isused to identify the effects of scaling down the flow-range of the CMFM [26]. The maindimensions of the CMFM are the length L and the diameter d of the tube. The mass scaleswith the length and diameter of the tube as m ∼ d2L. The modal stiffness k in the model isdue to the bending and torsion of the tube and also scales with the length and diameter as
k ∼ d4
L3 . Thus the resonance frequencies scales with ω ∼ dL2 .
The fluid conveying tube is actuated to oscillate in resonance with a low amplitude. Afluid flow in the vibrating tube induces Coriolis forces, proportional to the mass-flow, which

6
6.1 Performance criteria 99
affect the modeshape of the actuation mode, which is modelled by the coupling terms in thedamping matrix (see Eq. 6.1). To measure the change of the modeshapes, two relative-motionsensors are added to the model, located at equal distance r from the rotation axis of actuation:
[s1
s2
]
=
[−1 1 −r r
−1 1 r −r
]
y0
y1
θ0
θ1
(6.3)
Using these two sensor signals, the modeshape can be measured and the mass-flow Φm canbe calculated.
In the remainder of this subsection, the measurement sensitivity for mass-flow of themodel, depicted in Fig. 6.1, is determined. The mass-flow measurement sensitivity is cal-culated for two cases, a translational and a rotational actuation mode.
The tube is actuated to resonate in one of its modeshapes. The Coriolis-effect results in a90 degree out-of-phase actuation of the other modeshape. The actuation displacement and theinduced Coriolis displacement both occur at the actuation frequency. Two sensors, on bothsides of the rotation axis, measure the translation and rotation of the tube, ideally just oneharmonic. The phase difference between both sensors, in case the translational mode is usedas actuation mode, is approximated as (see Appendix B):
∆φ1 ≈ 2ℑ(s1 − s2)
ℜ(s1 + s2)=
2rL
(J+ 112 ρfAfL3)
ω1
ω22 −ω2
1
Φm (6.4)
whereby the Fourier transforms of the sensor signals (s1 and s2, see Eq. 6.3) at the trans-lational resonance frequency ω1 are used, which are determined by evaluating the Laplacetransform of the model (Eq. 6.1) for the argument s = iω1. In this phase difference calcula-tion, the external displacements (y0 = θ0 = 0) and external forces (Fy = Mθ = 0) are omitted.
In practice the phase difference is estimated using a phase demodulation algorithm, this isexplained in section 2.3.2. The phase difference is actuation frequency dependent, in contrastto the time difference:
∆t1 =∆φ1
ω1=
2rL
(J+ 112 ρfAfL3)
1
ω22 −ω2
1
Φm =24r
L
12k(α2 −1)
Φm (6.5)
The same holds, when the rotational mode is used as actuation mode:
∆φ2 ≈ 2ℑ(s1 + s2)
ℜ(s1 − s2)=
2L
r(m+ρfAfL)
ω2
ω22 −ω2
1
Φm (6.6)
∆t2 =2L
r(m+ρfAfL)
1
ω22 −ω2
1
Φm =2L
r
12k(α2 −1)
Φm (6.7)

6
100 Chapter 6 Evaluation
The measurement sensitivity for flow is defined as:
Si =∆ti
Φm(6.8)
The sensitivity is dependent on the sensor position ratio rL
, the tube stiffness k and thefrequency separation factor α. Note that the sensitivity for flow is not a constant, e.g. thestiffness depends on the temperature.
6.1.2 Pressure drop
In the previous section a simple model of a CMFM is derived. No dimensions are givenyet, because those dimensions are inherent to the flow range in which the sensor is used.The nominal flow through a CMFM is defined as the water flow at nominal temperature andpressure, resulting in 1 bar pressure drop over the instrument. The pressure drop across thetube can be estimated by the Darcy-Weisbach equation:
∆P =f Lρu2
2d(6.9)
besides the dependency on the length L and diameter d of the tube, the velocity u and densityρf of the fluid, the pressure drop ∆P is dependent on the friction coefficient f , between thetube and the fluid. For a hydraulically smooth tube, this factor is defined as:
flaminar =64Re
(Re < 2300) (6.10)
fturbulent =0.3164
4√
Re(Re > 2300) (6.11)
For a circular tube, the Reynolds number is equal to:
Re = νud (6.12)
where ν is the kinematic viscosity of the fluid. For Re > 2300 the fluid is assumed to beturbulent. Using Eq. 6.9-6.12 the mass-flow Φm = ρfAfu as function of the pressure drop isdetermined:
Φm =πd4∆P
128νL(Re < 2300) (6.13)
Φm =πρ
37 d
197 ∆P
47
1.3946ν17 L
47
(Re > 2300) (6.14)
In Fig. 6.2 the nominal flow, for 1 bar pressure drop and water as fluid (density ρf =998 kg/m3 and dynamic viscosity ν = 1e6 m2/s), is depicted with the assumption that the

6
6.1 Performance criteria 101
diameter (mm)
NF
(kg/
h)
Nominal flow as function of the tube-diameter for a constant actuation frequency
Medium flow range
Low flow range
Very-low flow range
Ultra-low flow range
LaminarTurbulentCombined
10−2 10−1 100 101 10210−6
10−3
100
103
106
Fig. 6.2 The Nominal Flow (water flow at nominal temperature and pressure, resulting in 1 bar pressure drop)versus the tube diameter. The NF is different for laminar and turbulent flow. The flow ranges are adoptedfrom Wang and Baker [78].
resonance frequencies (ω1 and ω2) are constant, by scaling the length of the tube with itsdiameter (L = L0(
dd0)
12 = 8.9d
12 ). The nominal dimensions L0 and d0 of a functional model
of a CMFM are used [45]. For smaller diameters the fluid becomes laminar and the pressuredrop larger, resulting in a lower nominal flow. For a turbulent flow the nominal flow scales asΦm ∼ d17/7 = d2.429. A similar correlation Φm ∼ d2.312 for the turbulent flow regime was alsoobserved by Wang and Baker [78] for different flow sensor designs of three manufactures.
6.1.3 Sensitivity scaling
In subsection 6.1.1 the measurement sensitivity for mass-flow of the model, depicted inFig. 6.1, is determined. In this subsection the effect on the measurement sensitivity of scalingdown the nominal flow range of a CMFM is analysed.
Reconsider Eq. 6.5 and 6.7, where the mass-flow measurement sensitivity is calculatedfor two cases, a translational and a rotational actuation mode. The sensitivity depends onthe sensor position ratio r
L, the tube stiffness k and the frequency separation factor α. For a
constant sensor position, actuation frequency and α, the sensitivity scales with S ∼ d− 52 . The
sensitivity as function of the nominal flow is depicted in Fig. 6.3. From this figure can beconcluded, that when scaling down the instrument, the sensitivity for flow is decreasing. i.e.the sensitivity is lower than it would be, if the flow would stay turbulent. Secondly, the totalmeasured phase or time difference is scaling down for decreasing laminar flows, while forturbulent flows this value is constant.
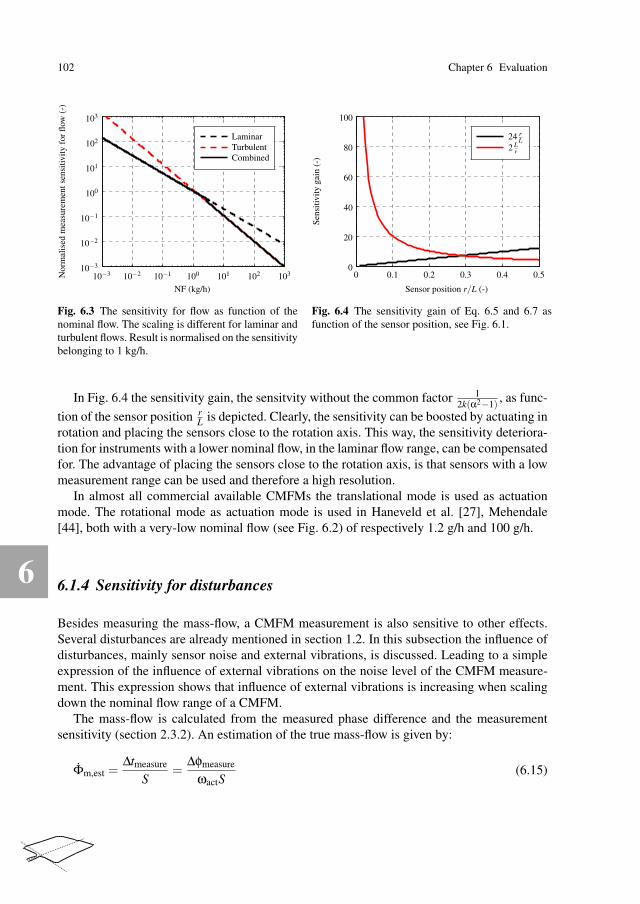
6
102 Chapter 6 Evaluation
NF (kg/h)
Nor
mal
ised
mea
sure
men
tsen
sitiv
ity
for
flow
(-)
LaminarTurbulentCombined
10−3 10−2 10−1 100 101 102 10310−3
10−2
10−1
100
101
102
103
Fig. 6.3 The sensitivity for flow as function of thenominal flow. The scaling is different for laminar andturbulent flows. Result is normalised on the sensitivitybelonging to 1 kg/h.
Sensor position r/L (-)
Sen
sitiv
ity
gain
(-)
24 rL
2 Lr
0 0.1 0.2 0.3 0.4 0.50
20
40
60
80
100
Fig. 6.4 The sensitivity gain of Eq. 6.5 and 6.7 asfunction of the sensor position, see Fig. 6.1.
In Fig. 6.4 the sensitivity gain, the sensitvity without the common factor 12k(α2−1)
, as func-
tion of the sensor position rL
is depicted. Clearly, the sensitivity can be boosted by actuating inrotation and placing the sensors close to the rotation axis. This way, the sensitivity deteriora-tion for instruments with a lower nominal flow, in the laminar flow range, can be compensatedfor. The advantage of placing the sensors close to the rotation axis, is that sensors with a lowmeasurement range can be used and therefore a high resolution.
In almost all commercial available CMFMs the translational mode is used as actuationmode. The rotational mode as actuation mode is used in Haneveld et al. [27], Mehendale[44], both with a very-low nominal flow (see Fig. 6.2) of respectively 1.2 g/h and 100 g/h.
6.1.4 Sensitivity for disturbances
Besides measuring the mass-flow, a CMFM measurement is also sensitive to other effects.Several disturbances are already mentioned in section 1.2. In this subsection the influence ofdisturbances, mainly sensor noise and external vibrations, is discussed. Leading to a simpleexpression of the influence of external vibrations on the noise level of the CMFM measure-ment. This expression shows that influence of external vibrations is increasing when scalingdown the nominal flow range of a CMFM.
The mass-flow is calculated from the measured phase difference and the measurementsensitivity (section 2.3.2). An estimation of the true mass-flow is given by:
Φm,est =∆tmeasure
S=
∆φmeasure
ωactS(6.15)

6
6.1 Performance criteria 103
Probabilitydensity
True value
Accuracy
PrecisionValue
Fig. 6.5 Difference between the accuracy and the pre-cision of the flow measurement value.
NF (kg/h)
ZS
/NF
(-)
LaminarTurbulentCombined
10−3 10−2 10−1 100 101 102 10310−2
10−1
100
101
102
Fig. 6.6 The zero stability (ZS) as function of thenominal flow. Result is normalised on the ZS belong-ing to 1 kg/h.
Disturbances can influence the measurement of the phase difference and actuation frequencyor change the calibrated sensitivity for flow. An offset in the phase difference or a change inthe flow sensitivity can result in a drift of the measurement value, losing accuracy. A fluctu-ating phase difference results in a noisy measurement value, losing precision (see Fig. 6.5).The lower limit of the measurement range of a CMFM is specified by the zero stability. Thisvalue is dependent on the maximal measured phase difference, unrelated to a mass-flow, themeasurement sensitivity and actuation frequency (Eq. 6.15):
ZS =∆φnoise
ωactS(6.16)
The zero stability value is normally specified by a percentage of the nominal flow. In Fig. 6.6the zero stability value is depicted as function of the nominal flow for a constant actuation
frequency and phase noise level. Thus, the zero stability scales with ZS ∼ d52 . For lower flow
ranges the sensitivity for flow decreases, and thus the zero stability increases, decreasing therange-ability of a CMFM.
The measured phase difference is the sum of various contributions that are approximatelyindependent. Those are, among others, a contribution due to a mass-flow, sensor noise andexternal vibrations. We focus on the effects of sensor noise and external vibrations, which aremainly affecting the precision of the the measurement value.
The phase difference can be approximated as the ratio of the actuation amplitude yact =12 (s1 − s2) and Coriolis displacement amplitude ycor =
12 (s1 + s2) (Eq. 3.2):
∆φ ≈ 2|ycor||yact|
(6.17)

6
104 Chapter 6 Evaluation
Frequency (Hz)
Tra
nsm
issi
bili
ty(d
B)
Tycor,a0
5 Hz Bessel5 Hz + Notch25 Hz Bessel25 Hz + Notch
101 102 103
-250
-200
-150
-100
Fig. 6.7 The transmissibility Tycor,a0 , unfiltered andwith a bandpass filter at the actuation frequency of170 Hz and a notch filter at the Coriolis frequency of96 Hz.
Frequency (Hz)C
umul
ativ
epo
wer
spec
trum
(-)
5 Hz Bessel5 Hz + Notch25 Hz Bessel25 Hz + Notch
101 102 10310−8
10−6
10−4
10−2
100
Fig. 6.8 Cumulative power spectrum of the measure-ment error of the filtered transmissibility of Fig. 6.7.The result is normalised to the maximum value.
The actuation amplitude is kept constant, using feedback control, and the Coriolis displace-ment is composed of contributions due to the mass-flow, sensor noise, external vibrations. Inthe remaining of this section, the effect of a mass-flow is omitted.
The quantification of the influence of external vibrations on the RMS measurement valueis presented in Chapter 2. Using Parseval’s theorem the influence of a Coriolis displacement,uncorrelated with the mass-flow, on the measurement precision can be computed from:
σ2Φm
=∫ ∞
−∞
∣∣∣∣
2FLP(ν−ωact)
yactSωact
∣∣∣∣
2
Φycor(ν)dν (6.18)
The input is a Power Spectral Density (PSD) Φycor of the Coriolis displacement, inducedby the disturbances. The phase demodulation algorithm, which is explained in section 2.3.2,mixes the sensor signals with the actuation frequency and subsequently filters with a low-pass Bessel filter FLP. The mixing shifts the signal by the actuation frequency and thereby thelow-pass filter effectively acts on the effect of disturbances as a band-pass filter around theactuation frequency. The total PSD of the Coriolis displacement due to disturbances is thesum of the effects induced by sensor noise and floor vibrations::
Φycor = Φnoise +Φvib = Φnoise + |Tycor,aaa0(s)|2Φaaa0 (6.19)
where Tycor,aaa0(s) is the transmissibility of external vibrations aaa0 to the Coriolis displacement.Using Eq. 6.18 and 6.19, the noise level of the CMFM measurement vale is specified as:
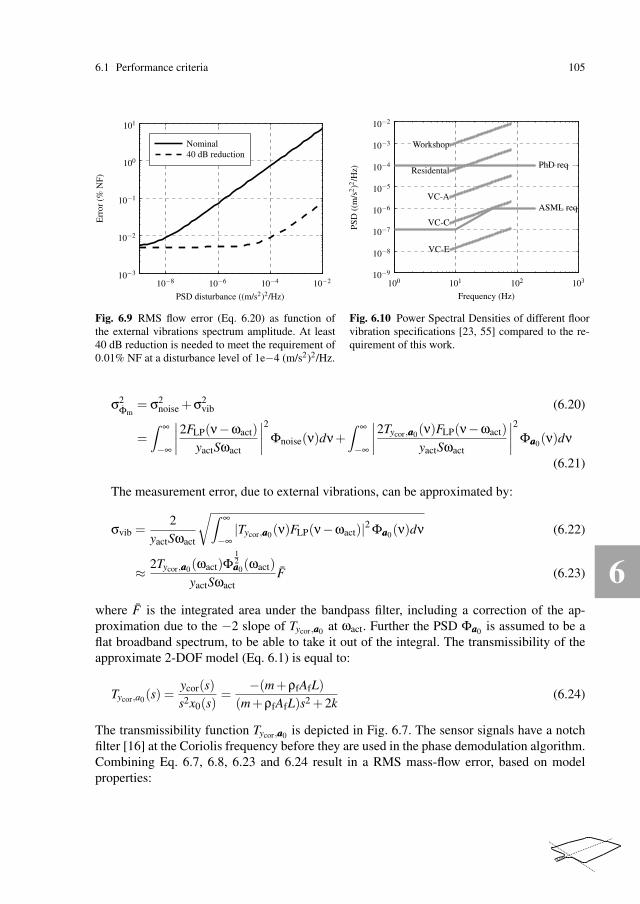
6
6.1 Performance criteria 105
PSD disturbance ((m/s2)2/Hz)
Err
or(%
NF
)
Nominal40 dB reduction
10−8 10−6 10−4 10−210−3
10−2
10−1
100
101
Fig. 6.9 RMS flow error (Eq. 6.20) as function ofthe external vibrations spectrum amplitude. At least40 dB reduction is needed to meet the requirement of0.01% NF at a disturbance level of 1e−4 (m/s2)2/Hz.
Frequency (Hz)
PS
D((
m/s
2)2
/Hz)
Workshop
Residental
VC-A
VC-C
VC-E
PhD req
ASML req
100 101 102 103
10−2
10−9
10−8
10−7
10−6
10−5
10−4
10−3
Fig. 6.10 Power Spectral Densities of different floorvibration specifications [23, 55] compared to the re-quirement of this work.
σ2Φm
= σ2noise +σ2
vib (6.20)
=∫ ∞
−∞
∣∣∣∣
2FLP(ν−ωact)
yactSωact
∣∣∣∣
2
Φnoise(ν)dν+∫ ∞
−∞
∣∣∣∣
2Tycor,aaa0(ν)FLP(ν−ωact)
yactSωact
∣∣∣∣
2
Φaaa0(ν)dν
(6.21)
The measurement error, due to external vibrations, can be approximated by:
σvib =2
yactSωact
√∫ ∞
−∞|Tycor,aaa0(ν)FLP(ν−ωact)|2 Φaaa0(ν)dν (6.22)
≈ 2Tycor,aaa0(ωact)Φ12aaa0(ωact)
yactSωactF (6.23)
where F is the integrated area under the bandpass filter, including a correction of the ap-proximation due to the −2 slope of Tycor,aaa0 at ωact. Further the PSD Φaaa0 is assumed to be aflat broadband spectrum, to be able to take it out of the integral. The transmissibility of theapproximate 2-DOF model (Eq. 6.1) is equal to:
Tycor,a0(s) =ycor(s)
s2x0(s)=
−(m+ρfAfL)
(m+ρfAfL)s2 +2k(6.24)
The transmissibility function Tycor,aaa0 is depicted in Fig. 6.7. The sensor signals have a notchfilter [16] at the Coriolis frequency before they are used in the phase demodulation algorithm.Combining Eq. 6.7, 6.8, 6.23 and 6.24 result in a RMS mass-flow error, based on modelproperties:
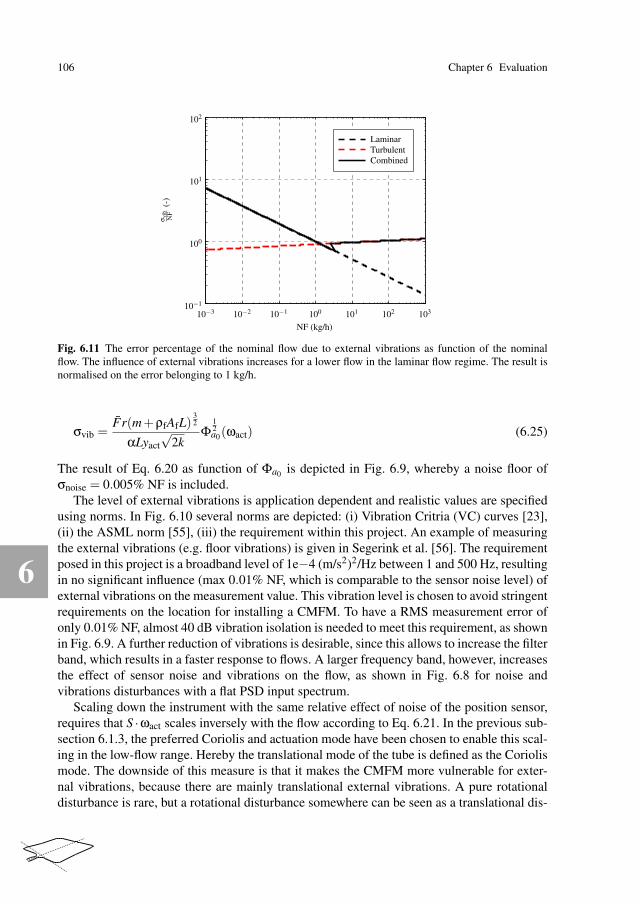
6
106 Chapter 6 Evaluation
NF (kg/h)
σvi
bN
F(-
)
LaminarTurbulentCombined
10−3 10−2 10−1 100 101 102 10310−1
100
101
102
Fig. 6.11 The error percentage of the nominal flow due to external vibrations as function of the nominalflow. The influence of external vibrations increases for a lower flow in the laminar flow regime. The result isnormalised on the error belonging to 1 kg/h.
σvib =Fr(m+ρfAfL)
32
αLyact√
2kΦ
12a0(ωact) (6.25)
The result of Eq. 6.20 as function of Φa0 is depicted in Fig. 6.9, whereby a noise floor ofσnoise = 0.005% NF is included.
The level of external vibrations is application dependent and realistic values are specifiedusing norms. In Fig. 6.10 several norms are depicted: (i) Vibration Critria (VC) curves [23],(ii) the ASML norm [55], (iii) the requirement within this project. An example of measuringthe external vibrations (e.g. floor vibrations) is given in Segerink et al. [56]. The requirementposed in this project is a broadband level of 1e−4 (m/s2)2/Hz between 1 and 500 Hz, resultingin no significant influence (max 0.01% NF, which is comparable to the sensor noise level) ofexternal vibrations on the measurement value. This vibration level is chosen to avoid stringentrequirements on the location for installing a CMFM. To have a RMS measurement error ofonly 0.01% NF, almost 40 dB vibration isolation is needed to meet this requirement, as shownin Fig. 6.9. A further reduction of vibrations is desirable, since this allows to increase the filterband, which results in a faster response to flows. A larger frequency band, however, increasesthe effect of sensor noise and vibrations on the flow, as shown in Fig. 6.8 for noise andvibrations disturbances with a flat PSD input spectrum.
Scaling down the instrument with the same relative effect of noise of the position sensor,requires that S ·ωact scales inversely with the flow according to Eq. 6.21. In the previous sub-section 6.1.3, the preferred Coriolis and actuation mode have been chosen to enable this scal-ing in the low-flow range. Hereby the translational mode of the tube is defined as the Coriolismode. The downside of this measure is that it makes the CMFM more vulnerable for exter-nal vibrations, because there are mainly translational external vibrations. A pure rotationaldisturbance is rare, but a rotational disturbance somewhere can be seen as a translational dis-

6
6.2 CMFM designs 107
turbance in a specific node. It is impossible to increase the sensitivity for flow (Eq. 6.7) anddecrease the sensitivity for external vibrations (Eq. 6.25) at the same time by changing theCoriolis-frequency, the sensor position, the actuation frequency, the actuation amplitude orthe frequency ratio. For a constant sensor position r/L, actuation frequency, actuation ampli-
tude and frequency ratio α, the sensitivity for external vibrations scales with σvib ∼ d52 . The
relative error is depicted in Fig. 6.11, showing an increasing relative sensitivity for vibrationswhen lowering the flow range.
Focussing on the influence of external vibration, it is thus shown, that for scaling downthe instrument’s measurement range and preserving the relative sensitivity for displacementsensor noise, the effects of external vibrations becomes dominant in the measurement error.Eq. 6.23 shows that the RMS measurement error depends on the transmissibility Tycor,aaa0 . Ifthe transmissibility function from external vibrations to the Coriolis displacement can bedecreased at the actuation frequency, without changing the sensitivity for flow, then this willresult in a lower measurement error.
6.1.5 Conclusions
Scaling down a CMFM reduces the effect of flow on the ratio between the amplitudes ofthe actuation and Coriolis motion. Thereby the relative effect of sensor noise on the mea-surement signal increases. This effect can be reduced by increasing the sensitivity for theCoriolis-motion by switching the actuation and Coriolis-mode. However, this also increasesthe sensitivity for external vibrations. The relative effect of vibrations thus increases withdecreasing the flow capacity. Therefore, the focus of this thesis is on the minimisation of theinfluence of external vibrations.
6.2 CMFM designs
Many CMFM tube designs have been published. In Fig. 6.12 several designs are depicted.A classification of the flow sensor design is presented in Wang and Baker [78]. Single tubedesigns have a straight or bended design. Twin, or multiple, tube designs are also feasible instraight or bended tube configurations, whereby the flow path is making a single or multipleloop. A multiple tube, single loop requires a flow splitter.
To measure the Coriolis effect, the measurement system must be sensitive to oscillationamplitudes of only a few nanometre. To protect the system from the influence of externalvibrations, the system has to be balanced [1].
Conventionally the effect of vibrations is reduced by using a twin tube design. Both tubesrespond the same to vibrations but differently to flow, such that the effect of vibrations canbe eliminated. It is important that both loops have identical dynamic properties. The amountvibration suppression scales progressively with the frequency mismatch.

6
108 Chapter 6 Evaluation
Fig. 6.12 Configurations CMFM tube-shape designs: single and twin tube designs with a single or multipleloop. (Courtesy of Anklin et al. [1])
In our investigation of scaling down the performance of the CMFM, the tube design resultsin slender tubes with diameters less than a millimetre. In a twin tube design, both tubes are notthe same. This is making the design sensitive for external vibrations. Furthermore, the flowsensitivity is different for each tube, while the flow split is unknown. A relative measurementbetween both tubes is required to annihilate the effects of external vibrations. It is not possibleto mount the sensors (and actuators) onto small tubes, because this will increase the massenormously. Therefore the absolute motion of both tubes must be measured relative to thecasing. This, combined with a high Q-factor of the tube, requires a high range of the sensors,which increases the noise. A higher noise results in a higher zero stability of the instrument.
Thus, the twin tube design has several disadvantages when used in a CMFM for very-lowflows. Therefore, a single tube design with a high sensitivity for flow is preferred, even thoughthe measurement is also sensitive for external vibrations. This creates the challenge to find aproper balancing mechanism to minimise the influence of external vibrations. In our approacha single tube with a high sensitivity for flow is used and an additional vibration isolationmodule is developed to lower the sensitivity for external vibrations. Different configurationsof such a module are discussed in the next section.
6
6.3 Vibration isolation configurations 109
6.3 Vibration isolation configurations
As motivated above, designing a CMFM for low flows, below 1 kg/h, created new challengesto have an instrument sensitive for flow, but insensitive for external vibrations. To acquiresuch an instrument, the flow measurement and the vibration isolation part are separated. Anoverview of all configurations analysed in this thesis is depicted in Fig. 6.13. The main goalis to reduce the transmissibility for external vibrations a0 to the Coriolis displacement ycor,without changing the sensitivity for flow, which is the transfer function from Fcor to ycor,evaluated at the actuation frequency. The results of those configurations are presented is theChapters 2 - 5 with the objective to reduce the influence of external vibrations by 40 dB. Anevaluation of the configurations is presented in the following subsections, prior to an overviewof the of advantages and disadvantages summarised in Table 6.1.
6.3.1 Reference instrument
In Fig. 6.13(a) the model of a reference instrument is depicted, which is the Coriolis mode ofthe model depicted in Fig. 6.1 and the first Coriolis mode of the model presented in Chapter 2.This model comprises the effect of a mass-flow, by means of a force Fcor, and the influenceof external vibrations a0 on the displacement ycor. Using Eq. 6.23 the influence of externalvibrations is determined as:
σΦm≈ 2F
yactSωactΦ
12ycor(ωact) (6.26)
where yact is the actuation amplitude, ωact the actuation frequency, S the sensitivity for flow,F the low-pass filter in the phase demodulation and Φycor the PSD of the displacement mea-surement. The displacement measurement is influenced by the Coriolis force and external vi-brations, but also contains sensor noise. Therefore there is also a noise floor in the mass-flowmeasurement value, independent of the level of external vibrations. The reference instrumentof this section is used in subsequent section as a reference for determining the attenuationachievable by various vibration reduction strategies. The attenuation is relative and thus in-dependent of the actuation amplitude and frequency, the sensitivity for flow and the filteringconstant. The attenuation is only limited by the sensor noise of the tube displacement sensors.
6.3.2 Passive vibration isolation - Flexible suspension
Vibration isolation can be achieved by adding a flexible suspension between the CMFM andthe floor, as depicted in Fig. 6.13(b). Examples of flexible suspensions are analysed in Chap-ter 3 and 4. The model in Fig. 6.13(b) is 1D, though the examples analysed in Chapter 3 and 4are multi-DOF. The results show MIMO coupling from the external vibrations to the vibra-

6
110 Chapter 6 Evaluation
a0
m2
k2d2
y2
ycor
Fcor
Fdis
(a) Reference Instrument
a0
m2
k2d2
y2
ycor
Fcor
Fdis
m1
k1d1
y1
(b) Passively suspended
a0
m2
k2d2
y2
ycor
Fcor
Fdis
m1
k1d1
y1
a1
FaC(s)
(c) Actively suspended - Feedback
a0
a0
m2
k2d2
y2
ycor
Fcor
Fdis
m1
k1d1
y1
FaC(s)
(d) Actively suspended - Feedforward
a0
m2
k2d2
y2
ycor
Fcor
Fdis
m1
k1d1
y1
a1
Fa
C(s)
(e) Compliantly mounted sensor
a0
a0
m2
k2d2
y2
ycor
Fcor
Fdis
y′cor
F(s)
(f) Estimation by filtering
Fig. 6.13 Analysed CMFM configurations with and without vibration isolation.

6
6.3 Vibration isolation configurations 111
tions of the stage. A reduction of the effect of vibrations by a flexible suspension requiresan exact constraint design, where the centre of mass and the centre of stiffness are carefullyaligned.
Another disadvantage of the flexible suspended stage is the sensitivity for a disturbanceforce Fdis, resulting from the actuation force and acting on the Coriolis direction by asymmet-ric damping of the stage [68]. This force results in an offset of the measurement value, becauseFdis is at the actuation frequency and in phase with the Coriolis Force Fcor. Any variation ofthe damping, e.g., over temperature and time, results in a zero drift of the instrument. Thissensitivity can be reduced by increasing the mass m1 or by significantly increasing the stiff-ness around the actuation axis. Further, the mass-flow measurement value is only sensitive forexternal vibrations in one translational direction and one rotational direction. Rotations onlyaffect the measurement if they result in a translation at a specific point, see section 2.5.1. Soonly the accelerations of the stage in this direction needs attenuation. Therefore, the numberof the DOFs of the stage can be limited to one.
For a relatively undamped system, the attenuation is approximated by (Eq. 3.17):
|attenuation|=ω2
susp
ω2act
(6.27)
A large attenuation is achieved by increasing the separation of the suspension and actuationfrequency. The actuation frequency is limited from above to obtain sufficient sensitivity forflow (Eq. 6.7) On the other hand, the suspension frequency is limited from below by: (i) themaximum allowable sag due to gravity, (ii) the maximum internal stresses in the connectiontubes (iii) the damping of the suspension: a low relative damping and a low suspension fre-quency require a large dynamic range of tube displacement sensors. Therefore, the maximumattenuation by a flexible suspension is limited. Furthermore, in this design there is no balanc-ing for the actuation force, driving the flow-tube in resonance. However, by scaling down theinstrument, also the stiffness of the flow-tube decreases and therefore also the actuation forceapplied to the environment is limited.
In conclusion, adding a flexible suspension to the measurement stage of a CMFM is agood solution to achieve vibration isolation, but the performance is limited.
6.3.3 Active vibration isolation control - Feedback
The performance of flexibly suspended measurement stage is limited, therefore active vibra-tion isolation means are added to the stage. The model is depicted in Fig. 6.13(c), an actuatorapplies a force Fa on the stage m1, based on its accelerations. The feedback strategy, validatedin Chapter 3 and 4, increases the mass and damping of the stage virtually. This decreases thesuspension frequency and thus increases the attenuation of external vibrations, while main-taining the positive effects of the passive support stiffness. The mechanical equivalent of thefeed-back controlled system is depicted in Fig. 6.14, for the controller given in Eq. 4.7. Themass ka lowers the suspension frequency ωsusp and the sky-hook damper kv adds damping to
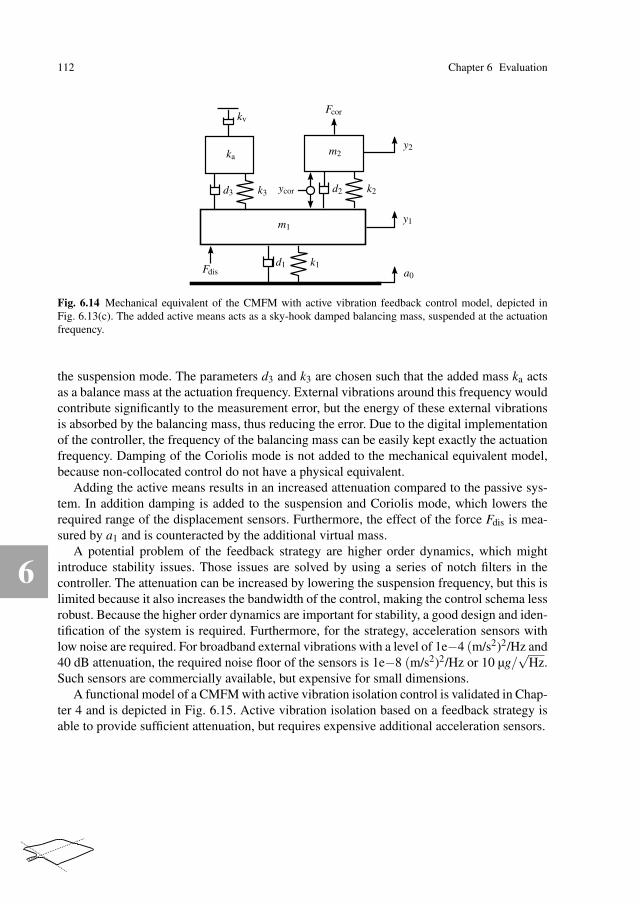
6
112 Chapter 6 Evaluation
a0
m2
k2d2
y2
ycor
Fcor
Fdis
m1
k1d1
y1
ka
kv
d3 k3
Fig. 6.14 Mechanical equivalent of the CMFM with active vibration feedback control model, depicted inFig. 6.13(c). The added active means acts as a sky-hook damped balancing mass, suspended at the actuationfrequency.
the suspension mode. The parameters d3 and k3 are chosen such that the added mass ka actsas a balance mass at the actuation frequency. External vibrations around this frequency wouldcontribute significantly to the measurement error, but the energy of these external vibrationsis absorbed by the balancing mass, thus reducing the error. Due to the digital implementationof the controller, the frequency of the balancing mass can be easily kept exactly the actuationfrequency. Damping of the Coriolis mode is not added to the mechanical equivalent model,because non-collocated control do not have a physical equivalent.
Adding the active means results in an increased attenuation compared to the passive sys-tem. In addition damping is added to the suspension and Coriolis mode, which lowers therequired range of the displacement sensors. Furthermore, the effect of the force Fdis is mea-sured by a1 and is counteracted by the additional virtual mass.
A potential problem of the feedback strategy are higher order dynamics, which mightintroduce stability issues. Those issues are solved by using a series of notch filters in thecontroller. The attenuation can be increased by lowering the suspension frequency, but this islimited because it also increases the bandwidth of the control, making the control schema lessrobust. Because the higher order dynamics are important for stability, a good design and iden-tification of the system is required. Furthermore, for the strategy, acceleration sensors withlow noise are required. For broadband external vibrations with a level of 1e−4 (m/s2)2/Hz and40 dB attenuation, the required noise floor of the sensors is 1e−8 (m/s2)2/Hz or 10 µg/
√Hz.
Such sensors are commercially available, but expensive for small dimensions.A functional model of a CMFM with active vibration isolation control is validated in Chap-
ter 4 and is depicted in Fig. 6.15. Active vibration isolation based on a feedback strategy isable to provide sufficient attenuation, but requires expensive additional acceleration sensors.

6
6.3 Vibration isolation configurations 113
Fig. 6.15 Functional model of of a CMFM with active vibration isolation control. The design is validated inChapter 4 for the feedback and feedforward strategy.
6.3.4 Active vibration isolation control - Feedforward
The limited performance of the flexibly suspended measurement stage can be increased byactive vibration isolation means. Alternatively to the feedback strategy, a feedforward strat-egy can also lower the transmissibility from external vibrations. A model of this strategy isdepicted in Fig. 6.13(d); an actuator applies a force Fa on the stage m1, based on measuredexternal accelerations a0. The feedforward strategy, validated in Chapter 4, can be seen as acancellation of the forces resulting from the damping and stiffness of the stage’s suspensionin response to the stage motions.
This strategy cannot add damping to the suspension and Coriolis mode, thus the reductionof the possibly amplitudes of vibrations at the suspension and Coriolis mode frequencies islimited. Therefore the strategy is combined with a feedback controller to damp the suspensionand Coriolis mode, based on the Coriolis displacement ycor. This is a control loop with arelatively low bandwidth, compared to the feedback strategy of the previous subsection.
The feedforward strategy is made adaptive in its controller parameters to minimise theerror in the presence of changing physical properties. The weights, proportional to the damp-ing, stiffness and actuator induction, are updated using an FxLMS algorithm. This approachis validated using an additional a1 error sensor, but modelling results show that ycor, whichis already available, is also a good error signal. There is a notch needed at the actuation fre-quency, because this error signal is also correlated with the Coriolis force Fcor and thus themass-flow. The notch filter is needed for the adaptation of the weights and also in the feedbackcontroller.
The advantage of the feedforward strategy is that the reference sensors, measuring theexternal accelerations, can be noisier than the acceleration sensors used in the feedback strat-egy. For the functional model, sensors with a noise floor of 1e−5 (m/s2)2/Hz or 300 µg/
√Hz

6
114 Chapter 6 Evaluation
are sufficient (See Fig. 4.10). Further, due to the adaptation of the weights, the attenuation ismaximised, independently of the change in the dynamics of the stage. Due to the adaptationonly the direct influence of external vibrations, measured by a reference sensor, on the dis-placement ycor is compensated for. This makes it possible to use a one-DOF stage with oneactuator only, but there are multiple reference sensors needed, because external vibrationsin multiple directions can have an influence on the stage translation and thus the measure-ment value. Another disadvantage is that a disturbance force Fdis, uncorrelated with a0 is notcorrected for.
A functional model of a CMFM with active vibration isolation control is depicted inFig. 6.15. The same physical experimental setup is used to validate the feedback and adap-tive feedforward strategy, as presented in Chapter 4. Showing that an attenuation of 50 dB isachievable.
6.3.5 Compliantly mounted sensor
Instead of adding a flexible stage between the floor and the measurement stage of a CMFM, arelative measurement of the tube displacements is proposed as well. The model of this secondanalysed configuration is depicted in Fig. 6.13(e). A compliant connection between the casingand the relative motion sensors is added. Tuning the damping and stiffness parameter of thisconnection, such that the resonance frequency and relative damping are equal to those of thefirst Coriolis mode, minimises the influence of a0 on the displacement ycor. By tuning thedynamic properties of the compliant connection, an external vibration has the same effect onm1 and m2, therefore the influence is minimised. This solution can be seen as a twin tubedesign, but with the possibility to connect the sensor to the imaginary tube.
The dynamics of the Coriolis tube are changing, in particular when the density of the fluidis changing. This reduces the achievable attenuation, therefore an active compliantly mountedsensor is proposed. Based on acceleration feedback the resonance frequency is lowered totrace the change of the tube’s eigen frequency exactly.
An advantage of this design is that the tube displacement sensors are not influenced bygravitational sagging, because the resonance frequencies of the tube and the mounted sensorare approximately the same. Therefore, the sensors can always be used in the middle of therange.
The performance is limited by the existence of the second Coriolis mode. This limits theattenuation at the actuation frequency. The analysis in Chapter 5 shows that a miss-match ofthe compliant sensor and the first Coriolis resonance frequency results in an anti-resonancefrequency. This miss-match is used to tune the dynamic properties of the compliant con-nection, such that the anti-resonance frequency occurs at the actuation frequency and thusmaximises the achievable attenuation.
A large range of the displacement sensors is needed, because the tube and the sensorsuspension has a high Q-factor, resulting in a large displacement when external vibrations arepresent. This approach only achieves attenuation in a limited frequency range. Therefore, it is

6
6.3 Vibration isolation configurations 115
Fig. 6.16 Functional model of a CMFM with an active compliantly mounted sensor. The design is validatedin Chapter 5.
only useful for instruments with a small low-pass filter in the phase demodulation algorithmand thus a low response time.
A functional model of a CMFM with an active compliantly mounted sensor is depictedin Fig. 6.16. The strategy is validated in Chapter 5 and shows more than 24 dB reduction ofthe influence of external vibrations on the mass-flow measurement value. The performance islimited by the second Coriolis mode.
6.3.6 Estimation by filtering
Another approach is to use filtering techniques to eliminate the effect of external vibrationsfrom the sensor signals measuring the tube-displacements. Wang and Baker [78] mentionedthis in his discussion. In the area of signal processing and control techniques, the applicationof DSP techniques and powerful hardware allow for on-line correction algorithms and multi-parameter measurement. This will improve and extend the Coriolis technology. The approachis investigated by Stroeken [60].
In this approach the measured tube displacements, influenced by external vibrations, arecompensated by a measurement of the external vibrations (see Fig. 6.13(f)). Therefor, a filter

6
116 Chapter 6 Evaluation
is needed, which is ideally the transmissibily Tycor,a0 . The first attempts is using a reducedmodel, comprising only the first Coriolis mode. The achieved reduction is approximately20 dB, likely limited by the other Coriolis modes.
The parameters are subjected to variations, due to change of the mass (different fluid den-sities) and stiffness (due to temperature fluctuations) of the tube. Therefore, a Kalman filteris used for on-line estimation of the transmissibily Tycor,a0 . However, for this estimation fre-quency domain content at the actuation frequency cannot be used, otherwise there will be acorrelation with the mass-flow. Instead, the influence of external vibrations on the relativelyundamped Coriolis resonance oscillation can be used.
A disadvantage of this approach is that both the model estimation and the correction canbe influenced by the Coriolis force Fcor, resulting in an erroneous mass-flow measurementvalue. Another disadvantage of this approach is the necessity of an acceleration sensor withlow noise.
6.3.7 Combinations
The three analysed configurations, (i) a passive or active flexibly suspended measurementstage, (ii) a relative tube displacement measurement and (iii) estimation by filtering, can becombined to maximise the attenuation. The total achievable attenuation is mainly dependenton the noise levels of all the involved sensors.
6.4 Conclusions
This chapter summarises the insights gained in this project. First, the sensitivity to mass-flow, sensor noise and external vibrations is explained using a simple model of a CMFM.Scaling down the nominal flow range of the instrument results in a smaller diameter and lam-inar flow. Due to this transition the sensitivity does not scale up proportionally with scalingthe flow down. A smaller sensitivity for flow results in a higher sensitivity for sensor noise.Therefore, the actuation and Coriolis mode are switched, making the design more sensitivefor flow, but also more sensitive for external vibrations. Different solutions are investigatedto apply vibration isolation to a CMFM. An overview of the of advantages and disadvantagesis presented in Table 6.1. The solutions consists of passive and active vibration isolation andcorrection using an on-line model estimator. The insights were tested using two functionalmodels, which are presented in detail in Chapter 4 and 5 (see also Fig. 6.15 and 6.16). Theyare used to validate the models and show that a reduction in the sensitivity for external vi-brations of more than 40 dB can be achieved. The configurations can be combined and usedin the next generation CMFM for very and ultra-low flows. The sensitivity of these meterscan be increased to compensate for the reduction of relative sensitivity, while the effect ofexternal vibrations does not grow proportionally by the added vibration isolation.
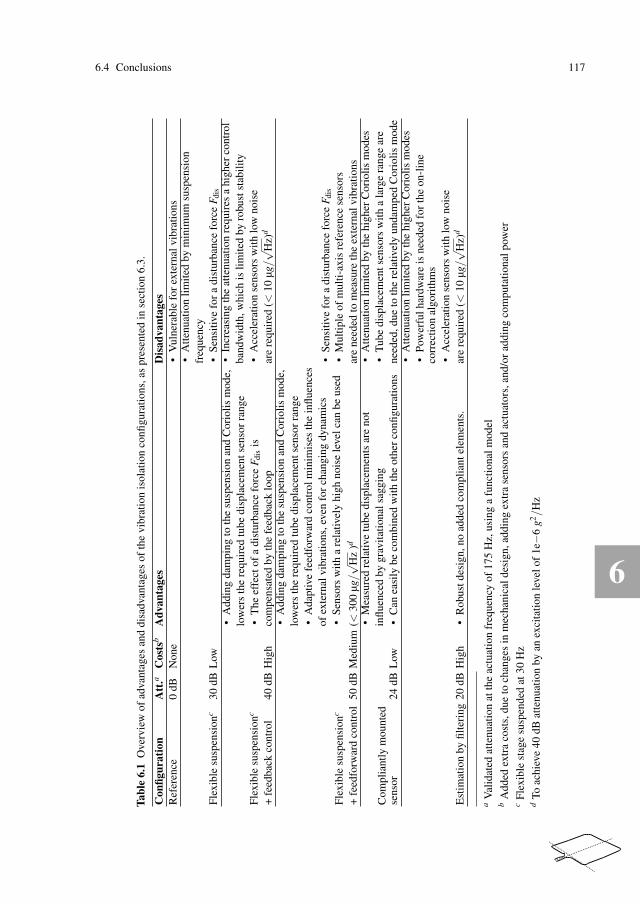
6
6.4 Conclusions 117
Tab
le6.1
Ove
rvie
wof
adva
ntag
esan
ddi
sadv
anta
ges
ofth
evi
brat
ion
isol
atio
nco
nfigu
rati
ons,
aspr
esen
ted
inse
ctio
n6.
3.
Con
figu
rati
on
Att
.aC
ost
sbA
dvan
tages
Dis
ad
van
tages
Ref
eren
ce0
dBN
one
•V
ulne
rabl
efo
rex
tern
alvi
brat
ions
Fle
xibl
esu
spen
sion
c30
dBL
ow
•A
tten
uati
onli
mit
edby
min
imum
susp
ensi
onfr
eque
ncy
•S
ensi
tive
for
adi
stur
banc
efo
rce
Fdi
s
Fle
xibl
esu
spen
sion
c
+fe
edba
ckco
ntro
l40
dBH
igh
•A
ddin
gda
mpi
ngto
the
susp
ensi
onan
dC
orio
lis
mod
e,lo
wer
sth
ere
quir
edtu
bedi
spla
cem
ents
enso
rra
nge
•T
heef
fect
ofa
dist
urba
nce
forc
eF
dis
isco
mpe
nsat
edby
the
feed
back
loop
•In
crea
sing
the
atte
nuat
ion
requ
ires
ahi
gher
cont
rol
band
wid
th,w
hich
isli
mit
edby
robu
stst
abil
ity
•A
ccel
erat
ion
sens
ors
wit
hlo
wno
ise
are
requ
ired
(<10
µg/√
Hz)
d
Fle
xibl
esu
spen
sion
c
+fe
edfo
rwar
dco
ntro
l50
dBM
ediu
m
•A
ddin
gda
mpi
ngto
the
susp
ensi
onan
dC
orio
lis
mod
e,lo
wer
sth
ere
quir
edtu
bedi
spla
cem
ents
enso
rra
nge
•A
dapt
ive
feed
forw
ard
cont
rolm
inim
ises
the
infl
uenc
esof
exte
rnal
vibr
atio
ns,e
ven
for
chan
ging
dyna
mic
s•
Sen
sors
wit
ha
rela
tivel
yhi
ghno
ise
leve
lcan
beus
ed
(<30
0µg/√
Hz
)d
•S
ensi
tive
for
adi
stur
banc
efo
rce
Fdi
s
•M
ulti
ple
ofm
ulti
-axi
sre
fere
nce
sens
ors
are
need
edto
mea
sure
the
exte
rnal
vibr
atio
ns
Com
plia
ntly
mou
nted
sens
or24
dBL
ow
•M
easu
red
rela
tive
tube
disp
lace
men
tsar
eno
tin
flue
nced
bygr
avit
atio
nals
aggi
ng•
Can
easi
lybe
com
bine
dw
ith
the
othe
rco
nfigu
rati
ons
•A
tten
uati
onli
mit
edby
the
high
erC
orio
lis
mod
es•
Tub
edi
spla
cem
ents
enso
rsw
ith
ala
rge
rang
ear
ene
eded
,due
toth
ere
lativ
ely
unda
mpe
dC
orio
lis
mod
e
Est
imat
ion
byfi
lter
ing
20dB
Hig
h•
Rob
ustd
esig
n,no
adde
dco
mpl
iant
elem
ents
.
•A
tten
uati
onli
mit
edby
the
high
erC
orio
lis
mod
es•
Pow
erfu
lhar
dwar
eis
need
edfo
rth
eon
-lin
eco
rrec
tion
algo
rith
ms
•A
ccel
erat
ion
sens
ors
wit
hlo
wno
ise
are
requ
ired
(<10
µg/√
Hz)
d
aV
alid
ated
atte
nuat
ion
atth
eac
tuat
ion
freq
uenc
yof
175
Hz,
usin
ga
func
tion
alm
odel
bA
dded
extr
aco
sts,
due
toch
ange
sin
mec
hani
cald
esig
n,ad
ding
extr
ase
nsor
san
dac
tuat
ors,
and/
orad
ding
com
puta
tion
alpo
wer
cF
lexi
ble
stag
esu
spen
ded
at30
Hz
dTo
achi
eve
40dB
atte
nuat
ion
byan
exci
tati
onle
velo
f1e−
6g
2/H
z

6

7
Chapter 7
Conclusions and Recommendations
7.1 Conclusions
The research objective of this thesis was formulated as:
Investigate the effect of external vibrations on the performance of a Coriolis Mass-Flow
Meter by quantitative modelling of the influence of external vibrations. Based on these
insights, develop methods to reduce the effect of vibrations significantly (factor 100 or
40 dB) without changing the performance and validate these conceptual solutions exper-
imentally.
With respect to the objective, it can be concluded that this objective has been achieved. ACoriolis Mass-Flow Meter (CMFM) with integrated vibration isolation control was designedand validated. More specific conclusions regarding the research can be drawn. They are pre-sented below, combined by subject: modelling, methods of vibration isolation, active vibra-tion isolation control strategies, functional models and achieved performance.
Modelling
A flexible 3D multi-body model of a CMFM was developed to understand and quantify theinfluence of external vibrations on the mass-flow measurement (Chapter 2). The mass-flowis determined using the phase difference measurement and the measurement sensitivity forflow. The phase difference is determined using a phase demodulation algorithm, howeverin the model it is the ratio between the Coriolis and actuation displacement amplitudes. Inan experiment, predefined vibrations has been applied on the casing of the CMFM and theRMS measurement error was determined. The experimental results correspond well on aquantitative level with the modelled results. The result is a significant extension of the workof Cheesewright [13], since it not only shows the frequencies to which the CMFM is sensitivefor external vibrations, but it also provides a quantitative estimation of the expected mass-flow error, based on the modelled transmissibility function. The agreement between modeland measurements implies firstly that the influence of any external vibration spectrum on theflow error, with some limitations due to linearity of the model, can be estimated. Thereby, the
7
120 Chapter 7 Conclusions and Recommendations
suitability of a certain location for the placement of a CMFM can be determined. Secondly,the insight in the relation between vibration spectra and the flow error, the transmissibility,can be used to compare the performance of different CMFM designs and to optimise theperformance by shaping their respective transfer functions.
Besides the sensitivity for vibrations, the model also provides the dominant direction forthe influence of external vibrations (Chapter 2). The model shows that there is a percussionpoint, where only a translational external vibration in one direction results in a significantCoriolis displacement. Therefore, the 3D model can be approximated quite well by a 1Dmodel. This can be done with a mass-spring model, containing the modal mass and stiffnessof the first Coriolis mode.
Scaling down a CMFM reduces the effect of flow on the ratio between the actuation andCoriolis motion amplitudes (Chapter 6.1). This effect can be partly compensated by increas-ing the relative sensitivity for the Coriolis-motion by switching the actuation and Coriolis-mode. However, this also increases the sensitivity for external vibrations. The net result is thatthe relative effect of vibrations increases with decreasing the flow capacity. Thus, to developa CMFM for low nominal flows (< 1 kg/h) with a high accuracy and precision, and thus ahigh sensitivity for flow, extra attention to the influence of external vibrations is required.Therefore, the focus in this thesis was on applying vibration isolation to a CMFM.
Methods of vibration isolation
Vibration isolation is achieved when attenuation, in a small frequency band in the transmissi-bility from external vibrations to the Coriolis displacement, is realised. Different methods areelaborated in this work and compared to each other (Chapter 6.3). The vibration isolation hasbeen designed as a module to add to a CMFM, thereby the Coriolis tube design is unaffected.Therefore, the vibration isolation module and tube design can be optimised separately.
The first investigated method adds a flexible suspension between de CMFM tube and thecasing (Chapter 3 and 4). This is a form of passive vibration isolation [53]. The performanceis insufficient, because the suspension frequency has a lower bound, which limits the at-tenuation. The suspension frequency is limited to 30 Hz due to the maximum stress in theconnection tubes and a maximum allowable sag of the stage due to gravity. Lowering thetransmissibility of external vibrations even more, is achieved by active vibration isolation(Chapter 3 and 4). Therefor extra sensors and actuators are added to the passive system. Afeedback and feedforward control strategy has been developed to lower the transmissibilityfor external vibrations, while maintaining the positive effects of the passive support stiffness.Actively lowering the, relative high, suspension frequency is a form of active hard mountvibration isolation [64, 76], with the distinction that for the application to a CMFM the maingoal is not to lower the suspension frequency, but to achieve attenuation in a small frequencyband.
The second investigated method adds a compliance between the casing and the tube dis-placement sensor (Chapter 5). This enables a true displacement measurement of the tube, notinfluenced by external vibrations. In this novel design, the influence of external vibrations onthe compliant sensor element and the tube are made equal by actively tuning the resonancefrequency and damping of the compliant sensor element and thereby the influence on the rela-tive displacement measurement is minimised. The effect of the varying internal dynamics due

7
7.1 Conclusions 121
to a fluid-density change are addressed in detail and solved by actively tuning the compliantsensor element, using acceleration feedback. Another advantage of the compliantly mountedsensor module is that the influence of the gravitational sagging is minimal. Thereby the dis-placement sensors are always in the same part of the characteristic sensor response curve,independent of the orientation of the instrument.
The methods to integrate active vibration isolation in a CMFM resulted in functional mod-els (Chapter 4 and 5) and are filed for a patent (Appendix C).
Active vibration isolation control strategies
Multiple methods has been developed to apply active vibration isolation. A feedback andfeedforward strategy are compared in this thesis and both result in a large attenuation of theinfluence of external vibrations on the measurement value.
A known feedback control strategy [34, 52, 77] is adapted and tuned for integration witha CMFM (Chapter 3). The transmissibility of external vibrations is reduced actively in theregion of interest by acceleration feedback. A PI-controller is implemented to lower the sus-pension frequency and to add skyhook damping. The control bandwidth is limited using alow pass filter with an undamped frequency equal to the actuation frequency of the Coriolistube, adding extra attenuation around the actuation frequency of the Coriolis tube. The ac-tuation frequency is relatively high, around 170 Hz, resulting in a large control bandwidth.The attenuation, using feedback control, is limited by stability issues induced by higher orderstage dynamics and therefore the attenuation is limited. Further, the poorly damped Coriolismode is damped using positive position feedback of the internal deformation. This feedbackloop needs a notch filter on the actuation frequency, to prevent interference of the feedbackcontroller with the mass-flow measurement. The modelling shows for feedback control anachievable attenuation of 46 dB with a control bandwidth of 300 Hz, whereby the 30 Hzsuspension frequency is actively reduced to 22 Hz.
Secondly, a novel feedforward strategy is developed (Chapter 4). An optimal feedforwardcontroller is derived, which is only dependent on the physical parameters - stiffness, dampingand actuator dynamics - between the casing and the suspended stage, no knowledge of theinternal dynamics is needed. This can be understood conceptually as follows; by compensat-ing the forces due to the stiffness and damping, no forces are transmitted from the casing tothe stage. The controller can be written as a series of Infinite Impulse Response (IIR) filterswith ideal parameters. In practice, only constant, estimated parameters are available, whilethe physical parameters vary. Therefore, a filtered-reference least-mean-square (FxLMS) al-gorithm is used to determine the optimal feedforward controller weights. The weights are afunction of the physical parameters and are online adapted to minimise a squared error signal;the motion of the measurement stage. The IIR filters have fixed poles, this makes the adapta-tion inherently stable. The huge advantage of this strategy is the limited amount of weights,compared to conventional adaptation strategies. The approach can be used more general asfeedfoward control for vibration isolation of precision machines as published elsewhere [4].
The performance of the feedforward controller is limited by the noise levels of the ref-erence and error sensors. The noise level of the reference sensor should be maximal 30 dBhigher than the noise level specification whereby external vibrations are not affecting themass-flow measurement. This value of 30 dB is equal to the attenuation achieved by the pas-

7
122 Chapter 7 Conclusions and Recommendations
sively suspended stage. For a worthwhile weight adaptation, the ratio between the noise levelof the error sensor and the level of external vibrations should be lower than the required at-tenuation. The modelling shows that for feedforward control, attenuation of more than 50 dBis achievable.
Functional models
The methods for vibration isolation were validated experimentally.The first functional model was used to validate the passive and active vibration isolation
methods (Chapter 4). Based on the results obtained from the model a functional model is built.The measurement stage is passively suspended at 30 Hz in the three out-of-plane directionsand active vibration isolation is added to increase the attenuation. The designed stage hadmore than one dominant direction of influence of external vibrations affecting the measure-ment value. This can be resolved in future functional models by placing the centre of mass inthe centre of compliance, or by lowering the number of degrees-of-freedom of the suspendedstage. The active vibration isolation control results in 40 dB reduction of the influence ofexternal vibrations, without affecting the mass-flow measurement.
The second functional model has been developed to validate the compliantly mounted sen-sor (Chapter 5). An existing CMFM is extended with the compliantly mounted sensor. Ideally,the influence of external vibrations is equal on a reference mass, comprising the relative tubedisplacement sensors, and the Coriolis tube. The performance is limited by the second modein the Coriolis direction. The compliantly mounted sensor has only one intentional modeand this second mode thus results in a different response. The parameters of the compliantlymounted sensor are tuned actively, with acceleration feedback, to have a maximum attenua-tion, independent of the fluid density. An attenuation of more than 24 dB is demonstrated fora CMFM with an active compliantly mounted sensor, in case the tube filled with both waterand air.
Achieved performance
The requirement to reduce the effect of vibrations significantly (factor 100 or 40 dB) withoutchanging the sensitivity for flow is achieved using a flexibly suspended stage with activevibration isolation.
The required vibration isolation is not achieved for the CMFM integrated with an activelycompliantly mounted sensor, because the performance is limited by the second Coriolis mode.However, this method can also be integrated with a passively suspended measurement stage,resulting in an attenuation of over 50 dB.
The achieved reduction is so large that the measurement error for realistic vibration levelsis dominated by the noise level of the tube displacement sensors. Further reduction of theperformance requires sensors with a (even) lower noise level than currently used. If the noiselevel of those sensors is reduced by 20 dB, then the performance is limited by the noise of theacceleration sensors used for the vibration isolation strategies.

7
7.2 Recommendations 123
7.2 Recommendations
A number of recommendations for future research are proposed:
• An on-scale proof of principle is built to validate the modelling. Results show that vi-bration isolation is achieved. However, the effects of other disturbances should be testedmore thoroughly. For example: asymmetry in the instrument, due to temperature differ-ence or dimensions uncertainties can result in a drifting measurement value. The firstindicative endurance experiments are showing no significant decrease of the drift per-formance. The first steps are made to develop a commercially available CMFM withintegrated active vibration isolation.
• A validated quantitative model of the influence of external vibrations has been developed(Chapter 2). Some effort is done to use this model to correct the tube displacement mea-surements to achieve floor vibration isolation [60]. Adding extra sensors to the CMFM,can differentiate the effect of flow and external vibrations on the mass-flow measurement.More research is needed to find the limits of the model based correction approach.
• The adaptive feedforward strategy can be used in many other applications: vibration iso-lation for precision machines in general [4] or as adaptive feedforward controller formotion control [63].
• For adaptation of the weights of the feedforward controller, an FxLMS algorithm hasbeen used. There are other algorithms available. More research is needed to find theoptimal adaptation strategy, with a high conversion rate and low computational costs.
• The compliantly mounted sensor module can also be used in combination with the othervibration reduction techniques, e.g. passive suspension between the casing and the sur-roundings [72] or extended with active vibration isolation control [70], to increase thereduction even more.
• Vibration isolation is only achieved in a small frequency band around the actuation fre-quency. Increasing this attenuation band offers the possibility to increase the responsetime of flow measurement for equal influence of external vibrations. Therefore, the ac-tive vibration isolation control strategies need to be improved, to obtain attenuation in alarger frequency band.
• The noise level of the CMFM measurement is dependent on sensor noise levels and theamount of external vibrations (Chapter 6.1.4). Vibration isolation techniques reduce theeffects of external vibrations, thus making the influence of the sensor noise dominant.To lower the noise level of the CMFM measurement even more, the sensitivity for flowhave to be increased, even though this is increasing the effects of external vibrations.A consideration between the measurement noise, the response time and the vibrationsensitivity should be made.

7
124 Chapter 7 Conclusions and Recommendations
• In this thesis, different vibration isolation strategies has been developed. The choice forthe optimal strategy for further developments is dependent on: achievable attenuation,costs, dimensions and other disturbances effects. The modelling methods of this work,can be used to minimise the effects of external vibrations on the mass-flow measurement,while optimising its performance.

R
References
[1] M. Anklin, W. Drahm, and A. Rieder. Coriolis mass flowmeters: Overview of the currentstate of the art and latest research. Flow Measurement and Instrumentation, 17(6):317 –323, 2006. ISSN 0955-5986. URL http://dx.doi.org/10.1016/j.flowmeasinst.
2006.07.004.[2] J. Anthonis and H. Ramon. Linear mechanical systems and dyadic transfer function
matrices. Automatica, 39(8):1353 – 1363, 2003. URL http://dx.doi.org/10.1016/
S0005-1098(03)00107-9.[3] R.C. Baker. Flow Measurement Handbook. Cambridge University Press, 2000. ISBN
9780511471100. URL http://dx.doi.org/10.1017/CBO9780511471100. Cam-bridge Books Online.
[4] M. A. Beijen, J. Van Dijk, W. B. J. Hakvoort, and M. Heertjes. Self-tuning feedforwardcontrol for active vibration isolation of precision machines. In 19th World Congress
of the International Federation of Automatic Control (IFAC), 2014. URL http://dx.
doi.org/10.3182/20140824-6-ZA-1003.01208.[5] G. Bobovnik, J. Kutin, N. Mole, B. Štok, and I. Bajsic. Numerical analysis of installa-
tion effects in coriolis flowmeters: A case study of a short straight tube full-bore design.Flow Measurement and Instrumentation, 34(0):142 – 150, 2013. ISSN 0955-5986. URLhttp://dx.doi.org/10.1016/j.flowmeasinst.2013.10.004.
[6] G. Bobovnik, J. Kutin, N. Mole, B. Štok, and I. Bajsic. Numerical analysis of instal-lation effects in coriolis flowmeters: Single and twin tube configurations. Flow Mea-
surement and Instrumentation, 2014. ISSN 0955-5986. URL http://dx.doi.org/
10.1016/j.flowmeasinst.2014.10.001.[7] M. Bouchard and S. Quednau. Multichannel recursive-least-square algorithms and fast-
transversal-filter algorithms for active noise control and sound reproduction systems.Speech and Audio Processing, IEEE Transactions on, 8(5):606–618, Sep 2000. ISSN1063-6676. URL http://dx.doi.org/10.1109/89.861382.
[8] Bronkhorst CORI-TECH. Mini cori-flow compact coriolis mass flow meters & con-trolers for liquids and gases, 2015. URL http://www.bronkhorst.com/files/br_
coritech/downloads/brochures-en/mini_coriflow.pdf.

R
126 References
[9] Bronkhorst HIGH-TECH. Application notes, 2015. URL http://www.bronkhorst.
com/en/downloads/application_notes/.[10] H. Butler. Acceleration feedback in a lithographic tool. Control Engineering Practice,
20(4):453 – 464, 2012. ISSN 0967-0661. URL http://dx.doi.org/10.1016/j.
conengprac.2011.12.008.[11] R. Cheesewright and S. Shaw. Uncertainties associated with finite element modelling
of coriolis mass flow meters. Flow Measurement and Instrumentation, 17(6):335 –347, 2006. ISSN 0955-5986. URL http://dx.doi.org/10.1016/j.flowmeasinst.
2006.07.003.[12] R. Cheesewright, C. Clark, and D. Bisset. The identification of external factors which
influence the calibration of coriolis massflow meters. Flow Measurement and Instru-
mentation, 11(1):1 – 10, 2000. ISSN 0955-5986. URL http://dx.doi.org/10.1016/
S0955-5986(99)00023-0.[13] R. Cheesewright, A. Belhadj, and C. Clark. Effect of mechanical vibrations on coriolis
mass flow meters. Journal of Dynamic Systems, Measurement, and Control, 125(1):103–113, 2003. URL http://dx.doi.org/10.1115/1.1539098.
[14] C. Clark and R. Cheesewright. The influence upon coriolis mass flow meters of ex-ternal vibrations at selected frequencies. Flow Measurement and Instrumentation,14(1-2):33 – 42, 2003. ISSN 0955-5986. URL http://dx.doi.org/10.1016/
S0955-5986(02)00065-1.[15] G. Coriolis. Sur les équations du mouvement relatif des systèmes de corps. J. de l’Ecole
Royale Polytechnique, 15:144–154, 1835.[16] H. V. Derby, T. Bose, and S. Rajan. Method and apparatus for adaptive line enhancement
in coriolis mass flow meter measurement, US5555190, 10 September 1996.[17] S.J. Elliott, I. Stothers, and P.A. Nelson. A multiple error lms algorithm and its ap-
plication to the active control of sound and vibration. Acoustics, Speech and Signal
Processing, IEEE Transactions on, 35(10):1423–1434, Oct 1987. ISSN 0096-3518.URL http://dx.doi.org/10.1109/TASSP.1987.1165044.
[18] S. Enz, J. J. Thomsen, P. Møller, and L. Davidsen. Factors Affecting Coriolis Flowmeter
Accuracy, Precision, and Robustness. DCAMM Special Report. Technical Universityof Denmark (DTU), 2010. ISBN 9788790416386. URL http://findit.dtu.dk/en/
catalog/112377959.[19] S. Enz, J. J. Thomsen, and S. Neumeyer. Experimental investigation of zero phase
shift effects for coriolis flowmeters due to pipe imperfections. Flow Measurement and
Instrumentation, 22(1):1 – 9, 2011. ISSN 0955-5986. URL http://dx.doi.org/10.
1016/j.flowmeasinst.2010.10.002.[20] Flow Research Inc. The world market for coriolis flowmeters, 4th edition. Techni-
cal report, 2013. URL http://www.researchandmarkets.com/reports/2963653/
the-world-market-for-coriolis-flowmeters-4th.[21] G. Fowles and W. H. Boyes. Chapter 6 - measurement of flow. In Walt Boyes, ed-
itor, Instrumentation Reference Book (Fourth Edition), pages 31 – 68. Butterworth-Heinemann, Boston, fourth edition edition, 2010. ISBN 978-0-7506-8308-1. URLhttp://dx.doi.org/10.1016/B978-0-7506-8308-1.00006-1.

R
References 127
[22] T. Gerkema and L. Gostiaux. A brief history of the coriolis force. Europhysics News,43(2):14–17, 2012. URL http://dx.doi.org/10.1051/epn/2012202.
[23] C. G. Gordon. Generic vibration criteria for vibration-sensitive equipment. In C. G. Gor-don, editor, Society of Photo-Optical Instrumentation Engineers (SPIE) Conference Se-
ries, volume 1619 of Presented at the Society of Photo-Optical Instrumentation Engi-
neers (SPIE) Conference, pages 71–85, February 1992.[24] J. Groenesteijn, L. van de Ridder, J. C. Lötters, and R. J. Wiegerink. Modelling of a
micro coriolis mass flow sensor for sensitivity improvements. In Proceedings of the
Thirteenth IEEE Sensors Conference, IEEE Sensors 2014, Valencia, Spain, pages 954–957, Valencia, Spain, 2-5 November 2014. IEEE Service Center. URL http://doc.
utwente.nl/92825/.[25] W. B. J. Hakvoort, J. P. Meijaard, R. G. K. M. Aarts, J. B. Jonker, and J. M. Zwikker.
Modeling a coriolis mass flow meter for shape optimization. In The 1st Joint Interna-
tional Conference on Multibody System Dynamics, 2010.[26] W. B. J. Hakvoort, J. P. Meijaard, and J. C. Lötters. Scaling down coriolis-based mass
flow rate sensing. In 12th euspen International Conference, pages 495–498, Stockholm,Sweden, June 2012.
[27] J. Haneveld, T. S. J. Lammerink, M. J. de Boer, R. G. P. Sanders, A. Mehendale, J. C.Lötters, M. Dijkstra, and R. J. Wiegerink. Modeling, design, fabrication and characteri-zation of a micro coriolis mass flow sensor. Journal of Micromechanics and Microengi-
neering, 20(12):125001, 2010. URL http://dx.doi.org/10.1088/0960-1317/20/
12/125001.[28] J. Hemp. Calculation of the sensitivity of a straight tube coriolis mass flowmeter with
free ends. Flow Measurement and Instrumentation, 12(5-6):411 – 420, 2002. ISSN0955-5986. URL http://dx.doi.org/10.1016/S0955-5986(01)00031-0.
[29] M. Henry, M. Tombs, M. Zamora, and F. Zhou. Coriolis mass flow metering forthree-phase flow: A case study. Flow Measurement and Instrumentation, 30(0):112 –122, 2013. ISSN 0955-5986. URL http://dx.doi.org/10.1016/j.flowmeasinst.
2013.01.003.[30] J. B. Hopkins and M. L. Culpepper. Synthesis of precision serial flexure systems using
freedom and constraint topologies (fact). Precision Engineering, 35(4):638 – 649, 2011.ISSN 0141-6359. URL http://dx.doi.org/10.1016/j.precisioneng.2011.04.
006.[31] J. B. Jonker. A finite element dynamic analysis of spatial mechanisms with
flexible links. Computer Methods in Applied Mechanics and Engineering, 76:17 – 40, 1989. URL http://www.sciencedirect.com/science/article/pii/
0045782589901394.[32] J. B. Jonker, R. G. K. M. Aarts, and J. van Dijk. A linearized input–output repre-
sentation of flexible multibody systems for control synthesis. Multibody System Dy-
namics, 21:99–122, 2009. ISSN 1384-5640. URL http://dx.doi.org/10.1007/
s11044-008-9130-6.[33] J.B. Jonker and J.P. Meijaard. Spacar - computer program for dynamic analysis of
flexible spatial mechanisms and manipulators. In Werner Schiehlen, editor, Multibody

R
128 References
Systems Handbook, pages 123–143. Springer Berlin Heidelberg, 1990. ISBN 978-3-642-50997-1. URL http://dx.doi.org/10.1007/978-3-642-50995-7_9.
[34] D. Karnopp and A. Trikha. Comparative study of optimization techniques for shock andvibration isolation. Transactions of American Society of Mechanical Engineers, Journal
of Engineering for Industry, 91(4):1128–1132, 1969.[35] M. Kazahaya. A mathematical model and error analysis of coriolis mass flowmeters. In-
strumentation and Measurement, IEEE Transactions on, 60(4):1163–1174, April 2011.ISSN 0018-9456. URL http://dx.doi.org/10.1109/TIM.2010.2086691.
[36] S. M. Kuo and D. Morgan. Active Noise Control Systems: Algorithms and DSP Imple-
mentations. John Wiley & Sons, Inc., New York, NY, USA, 1st edition, 1995. ISBN0471134244.
[37] J. Kutin and I. Bajsic. An analytical estimation of the coriolis meter’s character-istics based on modal superposition. Flow Measurement and Instrumentation, 12(5-6):345 – 351, 2002. ISSN 0955-5986. URL http://dx.doi.org/10.1016/
S0955-5986(02)00006-7.[38] I. D. Landau, M. Alma, and T. Airimitoaie. Adaptive feedforward compensation algo-
rithms for active vibration control with mechanical coupling. Automatica, 47(10):2185 –2196, 2011. ISSN 0005-1098. URL http://dx.doi.org/10.1016/j.automatica.
2011.08.015.[39] J. C. Lötters, L. van de Ridder, W. D. Kruijswijk, W. B. J. Hakvoort, and M. R. Kater-
berg. Coriolis flow meter with active vibration isolation, Patent pending, 25 November2013.
[40] J. C. Lötters, L. van de Ridder, W. D. Kruijswijk, W. B. J. Hakvoort, and M. R. Kater-berg. Coriolis flow meter with passive vibration isolation, Patent pending, 24 March2014.
[41] A.G.J. MacFarlane. Commutative controller: a new technique for the design of multi-variable control systems. Electronics Letters, 6(5):121–123, March 1970. ISSN 0013-5194. URL http://dx.doi.org/10.1049/el:19700083.
[42] F. Matichard, B. Lantz, K. Mason, R. Mittleman, B. Abbott, S. Abbott, E. Allwine,S. Barnum, J. Birch, S. Biscans, D. Clark, D. Coyne, D. DeBra, R. DeRosa, S. Fo-ley, P. Fritschel, J.A. Giaime, C. Gray, G. Grabeel, J. Hanson, M. Hillard, J. Kissel,C. Kucharczyk, A. Le Roux, V. Lhuillier, M. Macinnis, B. O’Reilly, D. Ottaway,H. Paris, M. Puma, H. Radkins, C. Ramet, M. Robinson, L. Ruet, P. Sareen, D. Shoe-maker, A. Stein, J. Thomas, M. Vargas, and J. Warner. Advanced LIGO two-stagetwelve-axis vibration isolation and positioning platform. part 1: Design and productionoverview. Precision Engineering, 40:273 – 286, 2015. ISSN 0141-6359. URL http://
dx.doi.org/10.1016/j.precisioneng.2014.09.010.[43] F. Matichard, B. Lantz, K. Mason, R. Mittleman, B. Abbott, S. Abbott, E. Allwine,
S. Barnum, J. Birch, S. Biscans, D. Clark, D. Coyne, D. DeBra, R. DeRosa, S. Fo-ley, P. Fritschel, J.A. Giaime, C. Gray, G. Grabeel, J. Hanson, M. Hillard, J. Kissel,C. Kucharczyk, A. Le Roux, V. Lhuillier, M. Macinnis, B. O’Reilly, D. Ottaway,H. Paris, M. Puma, H. Radkins, C. Ramet, M. Robinson, L. Ruet, P. Sareen, D. Shoe-maker, A. Stein, J. Thomas, M. Vargas, and J. Warner. Advanced LIGO two-stagetwelve-axis vibration isolation and positioning platform. part 2: Experimental investiga-

R
References 129
tion and tests results. Precision Engineering, 40(0):287 – 297, 2015. ISSN 0141-6359.URL http://dx.doi.org/10.1016/j.precisioneng.2014.11.010.
[44] A. Mehendale. Coriolis mass flow rate meters for low flows. PhD thesis, University ofTwente, Enschede, October 2008. URL http://doc.utwente.nl/60164/.
[45] A. Mehendale, J. C. Lötters, and J. M. Zwikker. Mass flowmeter of the coriolis type,EP1719982, 2 May 2006.
[46] A. Mehendale, J. C. Lötters, and J. M. Zwikker. Coriolis mass flow meter using con-tactless excitation and detection, EP1719983, 2 May 2006.
[47] J. P. Meijaard. Fluid-conveying flexible pipes modeled by large-deflection finite ele-ments in multibody systems. Journal of Computational and Nonlinear Dynamics, 9:011008–1–7, 2013. URL http://dx.doi.org/10.1115/1.4025353.
[48] J. P. Meijaard and W. B. J. Hakvoort. Modelling of fluid-conveying flexible pipes inmultibody systems. In 7th EUROMECH Solid Mechanics Conference, 2009.
[49] D.R. Morgan. An analysis of multiple correlation cancellation loops with a filter inthe auxiliary path. In Acoustics, Speech, and Signal Processing, IEEE International
Conference on ICASSP ’80., volume 5, pages 457–461, Apr 1980. URL http://dx.
doi.org/10.1109/ICASSP.1980.1170986.[50] D. H. Owens. Feedback and Multivariable Systems (IEE control engineering series).
Southgate House, 1978.[51] M. P. Païdoussis. Slender Structures and Axial Flow, volume 1. Academic Press,
New York, 1998. URL http://www.sciencedirect.com/science/bookseries/
18745652/1.[52] A. Preumont. Vibration Control of Active Structures. Springer Netherlands, 2011. URL
http://dx.doi.org/10.1007/978-94-007-2033-6. ISBN 978-94-007-2032-9.[53] E. I. Rivin. Passive Vibration Isolation. ASME Press, New York, 2003. ISBN
079810187X.[54] H. Röck and F. Koschmieder. Model-based phasor control of a coriolis mass flow me-
ter (cmfm) for the detection of drift in sensitivity and zero point. In SubhasChandraMukhopadhyay, GourabSen Gupta, and RayYueh-Min Huang, editors, Recent Advances
in Sensing Technology, volume 49 of Lecture Notes in Electrical Engineering, pages221–240. Springer Berlin Heidelberg, 2009. ISBN 978-3-642-00577-0. URL http://
dx.doi.org/10.1007/978-3-642-00578-7_13.[55] R. M. Schmidt, G. Schitter, and J. van Eijk. The Design of High Performance Mecha-
tronics: High-Tech Functionality by Multidisciplinary System Integration. Delft Univer-sity Press, 2011. ISBN 9781607508267. URL http://ebooks.iospress.nl/book/
the-design-of-high-performance-mechatronics.[56] F. B. Segerink, J. P. Korterik, and H. L. Offerhaus. Vibration transfers to measure the
performance of vibration isolated platforms on site using background noise excitation.Review of Scientific Instruments, 82(6):065111, 2011. URL http://doc.utwente.
nl/85322/.[57] H. M. J. R. Soemers. Design Principles for Precision Mechanisms. T-Pointprint, En-
schede, 2010. ISBN 978903653103.[58] K. Staman. A multi-dof active vibration isolation setup for a coriolis mass flow rate
meter. Master’s thesis, University of Twente, October, 16 2014.

R
130 References
[59] K. Staman, L. van De Ridder, W. B. J. Hakvoort, D. M. Brouwer, and J. van Dijk.A multi-dof active vibration isolation setup for a coriolis mass-flow meter. In 29th An-
nual Meeting of the American Society for Precision Engineering, Boston, MassachusettsUSA, 9-14 November 2014. URL http://doc.utwente.nl/93719/.
[60] K. L. J. Stroeken. Floor vibration isolation of a coriolis mass-flow meter using filteringtechniques. Master’s thesis, University of Twente, November, 21 2014. URL http://
essay.utwente.nl/66292/.[61] G. Sultan and J. Hemp. Modelling of the coriolis mass flowmeter. Journal of Sound
and Vibration, 132(3):473 – 489, 1989. ISSN 0022-460X. URL http://dx.doi.org/
10.1016/0022-460X(89)90640-8.[62] J. J. Thomsen and J. Dahl. Analytical predictions for vibration phase shifts along fluid-
conveying pipes due to coriolis forces and imperfections. Journal of Sound and Vibra-
tion, 329(15):3065 – 3081, 2010. ISSN 0022-460X. URL http://dx.doi.org/10.
1016/j.jsv.2010.02.010.[63] J. Tian. Mimo adaptive feed-forward controller design for motion control systems.
Master’s thesis, University of Twente, 22 August 2014.[64] D. Tjepkema. Active hard mount vibration isolation for precision equipment. PhD the-
sis, University of Twente, Enschede, 2012. URL http://doc.utwente.nl/82175/.[65] D. Tjepkema, J. van Dijk, and H. M. J. R. Soemers. Sensor fusion for active vibration
isolation in precision equipment. Journal of Sound and Vibration, 331(4):735 – 749,2012. ISSN 0022-460X. URL http://dx.doi.org/10.1016/j.jsv.2011.09.022.
[66] D. Vaes, J. Swevers, and P. Sas. Optimal decoupling for mimo-controller design withrobust performance. In Proceedings of the American Control Conference, volume 5,pages 4601–4606, June 2004.
[67] L. van de Ridder. Analysis of a coriolis mass flow meter to reduce influence of externaldisturbances. Master’s thesis, June 22 2011.
[68] L. van de Ridder, W. B. J. Hakvoort, J. van Dijk, and J. C. Lötters. Influence of ex-ternal damping on phase difference measurement of a coriolis mass-flow meter. InEUROMECH Colloquium 524, Enschede, 27-29 February 2012. URL http://doc.
utwente.nl/89167/.[69] L. van de Ridder, W. B. J. Hakvoort, J. van Dijk, J. C. Lötters, and A. de Boer. Quan-
titative estimation of the influence of external vibrations on the measurement error ofa coriolis mass-flow meter. In Z. Dimitrovová, J.R. de Almeida, and R. Gonçalves,editors, 11th International Conference on Vibration Problems (ICOVP-2013), Lisbon,Portugal, 9-12 September 2013. URL http://doc.utwente.nl/89168/.
[70] L. van de Ridder, M. A. Beijen, W. B. J. Hakvoort, J. van Dijk, J. C. Lötters, andA. de Boer. Active vibration isolation feedback control for coriolis mass-flow me-ters. Control Engineering Practice, 33C:76–83, 2014. URL http://dx.doi.org/10.
1016/j.conengprac.2014.09.007.[71] L. van de Ridder, W. B. J. Hakvoort, and J. van Dijk. Vibration isolation by compli-
ant sensor mounting applied to a coriolis mass-flow meter. In ASME 2014 12th bien-
nial conference on engineering systems design and analysis (ESDA2014), Copenhagen,Denmark, 25-27 June 2014. URL http://doc.utwente.nl/91292/.
R
References 131
[72] L. van de Ridder, W. B. J. Hakvoort, J. van Dijk, J. C. Lötters, and A. de Boer. Quan-tification of the influence of external vibrations on the measurement error of a coriolismass-flow meter. Flow Measurement and Instrumentation, 40C:39–49, 2014. URLhttp://dx.doi.org/10.1016/j.flowmeasinst.2014.08.005.
[73] L. van de Ridder, W. B. J. Hakvoort, D. M. Brouwer, J. van Dijk, J. C. Lötters, andA. de Boer. Coriolis mass-flow meter with integrated multi-dof active vibration isola-tion. 2015. Submitted to Mechatronics (Elsevier).
[74] L. van de Ridder, W. B. J. Hakvoort, and J. van Dijk. Active vibration isolation control:comparison of feedback and feedforward control strategies applied to coriolis mass-flowmeters. In ACC 2015 The American Control Conference, Chicago, IL, USA, 1-3 July2015. URL http://doc.utwente.nl/95710/.
[75] L. van de Ridder, W. B. J. Hakvoort, J. van Dijk, J. C. Lötters, and A. de Boer. Vibrationisolation by an actively compliantly mounted sensor applied to a coriolis mass-flowmeter. 2015. Submitted to Dynamic Systems, Measurement and Control (ASME).
[76] G. W. van der Poel. An exploration of active hard mount vibration isolation for precision
equipment. PhD thesis, University of Twente, Enschede, 2010. URL http://doc.
utwente.nl/71347/.[77] J. van Dijk. Mechatronic design of hard-mount concepts for precision equipment. In
Heinz Ulbrich and Lucas Ginzinger, editors, Motion and Vibration Control, pages 315–324. Springer Netherlands, 2009. ISBN 978-1-4020-9437-8. URL http://dx.doi.
org/10.1007/978-1-4020-9438-5_31.[78] T. Wang and R. C Baker. Coriolis flowmeters: a review of developments over the past
20 years, and an assessment of the state of the art and likely future directions. Flow
Measurement and Instrumentation, 40:99 – 123, 2014. ISSN 0955-5986. URL http://
dx.doi.org/10.1016/j.flowmeasinst.2014.08.015.[79] E. Wernholt and S. Gunnarsson. Analysis of methods for multivariable frequency re-
sponse function estimation in closed loop. In Decision and Control, 2007 46th IEEE
Conference on, pages 4881–4888, Dec 2007. URL http://dx.doi.org/10.1109/
CDC.2007.4434780.[80] R. B. White. Coriolis mass flowmeter, US2832218, 29 April 1958.


Part II
Appendices


A
Appendix A
Commercially available CMFMs
In Table A.1 an overview is given of the commercially available CMFMs. Only the low flowrange CMFMs are listed completely. A subset is depicted in Fig. A.1.
Fig. A.1 Set of commercially available CMFMs
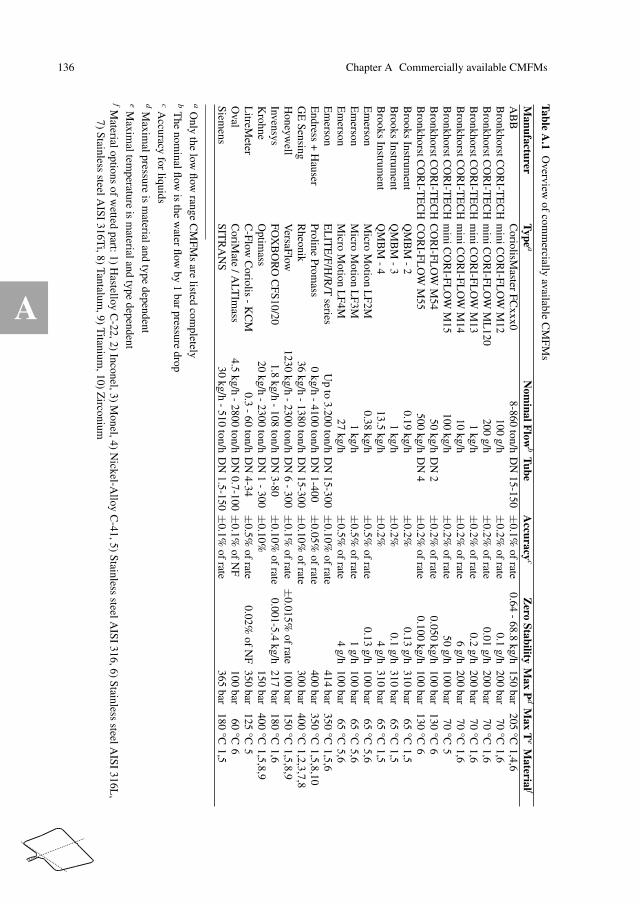
A
136 Chapter A Commercially available CMFMs
Tab
leA
.1O
verviewof
comm
erciallyavailable
CM
FM
s
Man
ufa
cturer
Typ
ea
Nom
inal
Flo
wb
Tu
be
Accu
racy
cZ
eroS
tab
ilityM
ax
Pd
Max
Te
Materia
l f
AB
BC
oriolisMaster
FC
xxx08-860
ton/hD
N15-150
±0.1%
ofrate
0.64-
68.8kg/h
150bar
205°C
1,4,6B
ronkhorstCO
RI-T
EC
Hm
iniCO
RI-F
LO
WM
12100
g/h±
0.2%of
rate0.1
g/h200
bar70
°C1,6
BronkhorstC
OR
I-TE
CH
miniC
OR
I-FL
OW
ML
120200
g/h±
0.2%of
rate0.01
g/h200
bar70
°C1,6
BronkhorstC
OR
I-TE
CH
miniC
OR
I-FL
OW
M13
1kg/h
±0.2%
ofrate
0.2g/h
200bar
70°C
1,6B
ronkhorstCO
RI-T
EC
Hm
iniCO
RI-F
LO
WM
1410
kg/h±
0.2%of
rate6
g/h200
bar70
°C1,6
BronkhorstC
OR
I-TE
CH
miniC
OR
I-FL
OW
M15
100kg/h
±0.2%
ofrate
50g/h
100bar
70°C
5B
ronkhorstCO
RI-T
EC
HC
OR
I-FL
OW
M54
50kg/h
DN
2±
0.2%of
rate0.050
kg/h100
bar130
°C6
BronkhorstC
OR
I-TE
CH
CO
RI-F
LO
WM
55500
kg/hD
N4
±0.2%
ofrate
0.100kg/h
100bar
130°C
6B
rooksInstrum
entQ
MB
M-
20.19
kg/h±
0.2%0.13
g/h310
bar65
°C1,5
Brooks
Instrument
QM
BM
-3
1kg/h
±0.2%
0.1g/h
310bar
65°C
1,5B
rooksInstrum
entQ
MB
M-
413.5
kg/h±
0.2%4
g/h310
bar65
°C1,5
Em
ersonM
icroM
otionL
F2M
0.38kg/h
±0.5%
ofrate
0.13g/h
100bar
65°C
5,6E
merson
Micro
Motion
LF
3M1
kg/h±
0.5%of
rate1
g/h100
bar65
°C5,6
Em
ersonM
icroM
otionL
F4M
27kg/h
±0.5%
ofrate
4g/h
100bar
65°C
5,6E
merson
EL
ITE
/F/H
/R/T
seriesU
pto
3.200ton/h
DN
15-300±
0.10%of
rate414
bar350
°C1,5,6
Endress
+H
auserP
rolineP
romass
0kg/h
-4100
ton/hD
N1-400
±0.05%
ofrate
400bar
350°C
1,5,8,10G
ES
ensingR
heonik36
kg/h-
1380ton/h
DN
15-300±
0.10%of
rate300
bar400
°C1,2,3,7,8
Honeyw
ellV
ersaFlow
1230kg/h
-2300
ton/hD
N6
-300
±0.1%
ofrate
±0.015%
ofrate
100bar
150°C
1,5,8,9Invensys
FO
XB
OR
OC
FS
10/201.8
kg/h-
108ton/h
DN
3-80±
0.10%of
rate0.001-5.4
kg/h217
bar180
°C1,6
Krohne
Optim
ass20
kg/h-
2300ton/h
DN
1-
300±
0.10%150
bar400
°C1,5,8,9
LitreM
eterC
-Flow
Coriolis
-K
CM
0.3-
60ton/h
DN
4-34±
0.5%of
rate0.02%
ofN
F350
bar125
°C5
Oval
CoriM
ate/A
LTIm
ass4.5
kg/h-
2800ton/h
DN
0.7-100±
0.1%of
NF
100bar
60°C
6S
iemens
SIT
RA
NS
30kg/h
-510
ton/hD
N1.5-150
±0.1%
ofrate
365bar
180°C
1,5
aO
nlythe
lowfl
owrange
CM
FM
sare
listedcom
pletelyb
The
nominalfl
owis
thew
aterfl
owby
1bar
pressuredrop
cA
ccuracyfor
liquidsd
Maxim
alpressureis
materialand
typedependent
eM
aximaltem
peratureis
materialand
typedependent
fMaterialoptions
ofw
ettedpart:1)
Hastelloy
C-22,2)
Inconel,3)M
onel,4)N
ickel-Alloy
C-41,5)
Stainless
steelAIS
I316,6)
Stainless
steelAIS
I316L
,7)
Stainless
steelAIS
I316T
i,8)Tantalum
,9)T
itanium,10)
Zirconium

B
Appendix B
2-DOF CMFM model
In this appendix a model of a simple CMFM with two degrees-of-freedom is presented. First,the equations of motion are derived. Using these equations, the sensitivity for flow is calcu-lated. This model is used in Chapter 6 to determine the influence of external vibrations whenscaling the nominal flow range of a CMFM.
B.1 Model
In Chapter 2 a full 3D model of a CMFM is presented. In this appendix a reduced modelof a CMFM is set up, to be able to derive analytical equations [67]. This simple model hastwo degrees-of-freedom, which are representing the Coriolis and actuation mode only. Usinga modal reduction technique, the 3D model can be transformed to the 2-DOF model. Themodel (Fig. B.1) contains a rigid tube filled with a moving fluid. The tube is flexibly mountedto the surroundings and the tube-movements are measured by two sensors. Note that stiffness
uu
L
Lk
kk
r
s2 s1
y1
y0
θ1
θ0
Fig. B.1 2-DOF CMFM model: a rigid fluid-conveying tube of length L, flexibly mounted to the surroundingsby stiffness k. The tube-movements are measured by two sensors, placed on equal distance r of the rotationaxis.

B
138 Chapter B 2-DOF CMFM model
is mainly the effect of the connection tubes. The fluid is modelled as a frictionless plug flow.In this section the equations of motion are derived, first for the fluid and secondly for the tubeincluding the fluid.
rrrmi
s
ds
x1
y1
θ1
Fig. B.2 Location of one fluid element
B.1.1 Fluid
First, the forces and moments on the fluid are derived. The fluid is modelled using a seriesof moving fluid elements with a cross sectional area Af =
14 πd2, density ρf and lenght ds. In
Fig. B.2, a fluid element is depicted. The mass of each element is equal to:
mi = ρfAfds (B.1)
The position of a fluid element is equal to:
rrrmi=
scos(θ1)y1 + ssin(θ1)
0
≈
s
y1 + sθ1
0
(B.2)
where a small angle approximation is used. The velocity of a fluid element is equal to:
rrrmi=
scos(θ1)− sθ1 sin(θ1)y1 + ssin(θ1)+ sθ1 cos(θ1)
0
≈
s− sθ1θ1
y1 + sθ1 + sθ1
0
(B.3)
Total linear momentum of the fluid is equal to:
ppp = Σmi · rrrmi=
∫ 12 L
− 12 L
s− sθ1θ1
y1 + sθ1 + sθ1
0
ρfAfds = ρfAfL
s
y1 + sθ1
0
(B.4)
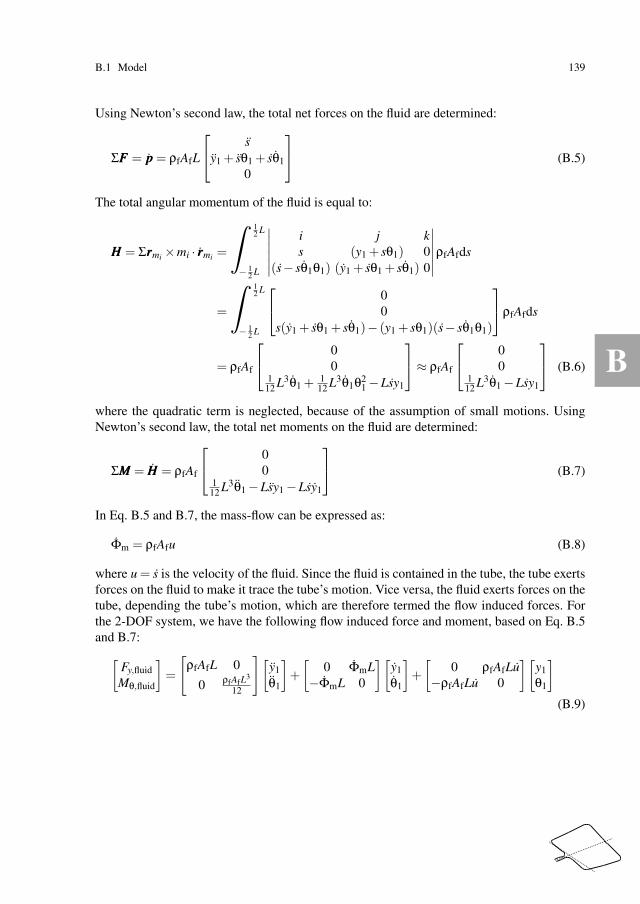
B
B.1 Model 139
Using Newton’s second law, the total net forces on the fluid are determined:
ΣFFF = ppp = ρfAfL
s
y1 + sθ1 + sθ1
0
(B.5)
The total angular momentum of the fluid is equal to:
HHH = Σrrrmi×mi · rrrmi
=
∫ 12 L
− 12 L
∣∣∣∣∣∣
i j k
s (y1 + sθ1) 0(s− sθ1θ1) (y1 + sθ1 + sθ1) 0
∣∣∣∣∣∣
ρfAfds
=
∫ 12 L
− 12 L
00
s(y1 + sθ1 + sθ1)− (y1 + sθ1)(s− sθ1θ1)
ρfAfds
= ρfAf
00
112 L3θ1 +
112 L3θ1θ2
1 −Lsy1
≈ ρfAf
00
112 L3θ1 −Lsy1
(B.6)
where the quadratic term is neglected, because of the assumption of small motions. UsingNewton’s second law, the total net moments on the fluid are determined:
ΣMMM = HHH = ρfAf
00
112 L3θ1 −Lsy1 −Lsy1
(B.7)
In Eq. B.5 and B.7, the mass-flow can be expressed as:
Φm = ρfAfu (B.8)
where u = s is the velocity of the fluid. Since the fluid is contained in the tube, the tube exertsforces on the fluid to make it trace the tube’s motion. Vice versa, the fluid exerts forces on thetube, depending the tube’s motion, which are therefore termed the flow induced forces. Forthe 2-DOF system, we have the following flow induced force and moment, based on Eq. B.5and B.7:
[Fy,fluid
Mθ,fluid
]
=
[
ρfAfL 0
0 ρfAfL3
12
][y1
θ1
]
+
[0 ΦmL
−ΦmL 0
][y1
θ1
]
+
[0 ρfAfLu
−ρfAfLu 0
][y1
θ1
]
(B.9)

B
140 Chapter B 2-DOF CMFM model
L
Lk
m,J
Fy
Fy,fluid
Mθ
Mθ,fluid
k((y1 − 12 θ1L)− (y0 − 1
2 θ0L)) k((y1 +12 θ1L)− (y0 +
12 θ0L))
Fig. B.3 Free body diagram of the tube, where Fy,fluid and Mθ,fluid are the flow induced force and moment.Further, on the tube an external force Fy and moment Mθ are applied.
B.1.2 Tube
Second, the equations of motion of the tube, including the fluid flow, are derived. The freebody diagram of the tube is depicted in Fig. B.3, where m and J = 1
12 mL2 are respectivelythe mass and moment of inertia of the empty, rigid tube. The tube has a length L and issuspended by stiffness k and Lk is the ratio between the translational and rotational stiffness.The structural damping is omitted in this model, because the Coriolis tubes are normallydesigned with high Q-factors [44]. Using Newton’s second law, the equations of motion arederived as:
ΣF = my1 =−k (y1 − y0)− k (y1 − y0)+Fy −Fy,fluid
=−2ky1 +2ky0 +Fy −Fy,fluid (B.10)
ΣM = Jθ1 =12
Lkk
(
−12
θ1Lk +12
θ0Lk
)
− 12
Lkk
(12
θ1Lk −12
θ0Lk
)
+Mθ −Mθ,fluid
=−12
θ1L2kk+
12
θ0L2kk+Mθ −Mθ,fluid (B.11)
where Fy,fluid and Mθ,fluid are the flow induced force and moment, see Eq. B.9. Further, on thetube an external force Fy and moment Mθ can be applied. Using Eq. B.9, B.10 and B.11, theequations of motion of the fluid, the tube and its suspension can be written in matrix vectornotation:[
m+ρfAfL 00 J+ 1
12 ρfAfL3
][y1
θ1
]
+
[0 ΦmL
−ΦmL 0
][y1
θ1
]
+
[2k ρfAfLu
−ρfAfLu 12 kL2
k
][y1
θ1
]
=
[Fy +2ky0
Mθ +12 kL2
kθ0
]
(B.12)
For the no-flow condition (u = 0), the tube has two clear resonance frequencies:
ω1 =
√
2k
m+ρfAfL, ω2 =
√12 kL2
k
J+ 112 ρfAfL3
=
√3Lk
L
√
2k
m+ρfAfL= αω1, (B.13)

B
B.2 Phase difference 141
belonging respectively to the translational and rotational mode of the tube. The resonancefrequencies depend on the geometry, but also on the density ρf of the fluid.
To measure the motion of the tube, two relative-motion sensors are added to the model,located at equal distance r from the rotation axis of actuation:[
s1
s2
]
=
[−1 1 −r r
−1 1 r −r
][y0 y1 θ0 θ1
]T(B.14)
B.2 Phase difference
Before the sensitivity for flow is calculated, it is explained how the measurement value is ob-tained, using the phase of the sensor signals. The fluid conveying tube is actuated to oscillatein resonance with a low amplitude. A fluid flow in the vibrating tube induces Coriolis forces,proportional to the mass-flow, which are affecting the modeshape of the actuation mode. Thiseffect is modelled by the coupling terms in the damping matrix (see Eq. B.12). The motiondue to the Coriolis effect is 90° out-of-phase with the actuation displacement, because theCoriolis-terms are velocity dependent, but both motions are sinusoidal with the same angularfrequency. Thus, without external vibrations, the sensor signal s1 is equal to:
s1 = yact sin(ωactt)+ ycor cos(ωactt) = A1 sin(ωactt +φ1) (B.15)
where yact is the actuation displacement and ycor the flow induced motion. The amplitudeand phase of the sensor signal can be related to the actuation and Coriolis displacement, byextending Eq. B.15:
A1 sin(ωactt +φ1) = A1 (cos(φ1)sin(ωactt)+ sin(φ1)cos(ωactt)) (B.16)
The actuation and Coriolis displacement amplitude are thus equal to:
yact = A1 cos(φ1) (B.17)
ycor = A1 sin(φ1) (B.18)
The phase of the sensor signal, which is independent of the amplitude A1, is calculated asfollows:
A1 sin(φ1)
A1 cos(φ1)=
ycor
yact= tanφ1 ≈ φ1 (B.19)
The same is done for the second sensor, resulting in φ2. The sensors are placed at oppositesides of the rotation axis, therefore the result is the opposite. This results in a phase differencebetween the two sensor signals:
∆φ = φ1 −φ2 ≈ 2ycor
yact(B.20)

B
142 Chapter B 2-DOF CMFM model
In practice, the phase of the sensor signals is measured directly, without determining theamplitudes of the sensor signals. There are different digital signal processing methods that canbe applied. A method is to apply dual quadrature demodulation, for which the implementationto a CMFM is described by Mehendale [44]. A phase-locked loop algorithm is implementedto compute the resonance frequency of the oscillating tube. The low-pass filtered frequencyis used to create two waveforms: a sine and a cosine. The measured sensor signal mixed withboth waveforms, resulting in a signal with an offset and a double frequency component. Thedouble frequency component is then filtered out with a low-pass filter (LPF). This calculationthus results in two DC values, depending on the phase between the sensor signals and thenewly introduced waveform. Besides the removal of the second frequency, the LPF is thekey in the trade-off between speed of the flow measurement and the measurement noise. Thealgorithm is explained in more detail in section 2.3.2.1.
B.3 Sensitivity for flow
In this section, the measurement sensitivity for mass-flow of the model, depicted in Fig. B.1,is determined. The mass-flow measurement sensitivity is calculated for two cases, a transla-tional and a rotational actuation mode. In this section, the external displacements (y0 = θ0 =0), external forces and acceleration of the fluid u = 0 of the model are omitted.
The tube is actuated to resonate in one of its modeshapes. The Coriolis-effect results ina 90° out-of-phase actuation of the other modeshape. The actuation displacement and theinduced Coriolis displacement both occur at the actuation frequency. Two sensors, on bothsides of the rotation axis, measure the translation and rotation of the tube, in this model justone harmonic. In the first case, the translational mode is used as actuation mode. The secondequation of Eq B.12 gives the induced effect. The Laplace transform of this equation is:
(J+1
12ρfAfL
3)s2θ1 − ΦmLsy1 +12
kL2kθ1 = 0 (B.21)
Evaluating the Laplace transform for the argument s = iω1, where ω1 is the resonance fre-quency of the translational mode, results in the induced rotation:
θ1 =ΦmLω1y1i
(−(J+ 112 ρfAfL3)ω2
1 +12 kL2
k)=
ΦmLω1y1i
(J+ 112 ρfAfL3)(ω2
2 −ω21)
(B.22)
The phase difference (see Eq. B.20), using the fact that the Coriolis displacement is 90° out-of-phase with the actuation displacement, is determined as:
∆φ1 ≈ 2ℑ(ycor)
ℜ(yact)= 2
ℑ(s1 − s2)
ℜ(s1 + s2)= 2
ℑ(2rθ1)
ℜ(2y1)=
2rL
(J+ 112 ρfAfL3)
ω1
ω22 −ω2
1
Φm (B.23)
The mass-term can be written alternatively as:

B
B.3 Sensitivity for flow 143
J+1
12ρfAfL
3 =1
12mL2 +
112
ρfAfL3 =
L2
12(m+ρfAfL) (B.24)
Using Eq. B.13, the denominator of Eq. B.23 can be rewritten as:
(m+ρfAfL)(ω22 −ω2
1) = (m+ρfAfL)ω21(α
2 −1) = 2k(α2 −1) (B.25)
Rewriting Eq. B.23 gives:
∆φ1 ≈24r
L(m+ρfAfL)
ω1
ω21(α
2 −1)Φm =
24r
L(α2 −1)1
√
2k(m+ρfAfL)Φm (B.26)
The phase difference depends on the fluid density, in contrast to the following time difference:
∆t1 =∆φ1
ω1≈ 2rL
(J+ 112 ρfAfL3)
1
ω22 −ω2
1
Φm =24r
L
12k(α2 −1)
Φm (B.27)
Alternatively, the rotational mode can be used as actuation mode. The second equation ofEq B.12 gives the induced effect. The Laplace transform of this equation is:
(m+ρfAfL)s2y1 + ΦmLsθ1 +2ky1 = 0 (B.28)
Evaluating the Laplace transform for the argument s = iω2, where ω2 is the resonance fre-quency of the rotational mode, results in the induced translation:
y1 =−ΦmLω2θ1i
(−(m+ρfAfL)ω22 +2k)
=ΦmLω2θ1i
(m+ρfAfL)(ω22 −ω2
1)(B.29)
The phase difference and time difference are determined as:
∆φ2 ≈ 2ℑ(ycor)
ℜ(yact)= 2
ℑ(s1 + s2)
ℜ(s1 − s2)= 2
ℑ(2y1)
ℜ(2rθ1)=
2L
r(m+ρfAfL)
ω2
ω22 −ω2
1
Φm (B.30)
=2Lαω1
r(m+ρfAfL)ω21(α
2 −1)Φm =
2Lα
r(α2 −1)1
√
2k(m+ρfAfL)Φm (B.31)
∆t2 =∆φ2
ω2≈ 2L
r(m+ρfAfL)
1
ω22 −ω2
1
Φm =2L
r
12k(α2 −1)
Φm (B.32)
The the actual measurement is the time-difference, which is a function of the mass-flow Φm.The measurement sensitivity for flow is defined as:
Si =∆ti
Φm(B.33)
The sensitivity depends on the sensor position ratio rL
, the tube stiffness k and the frequencyseparation factor α. Note that the sensitivity for flow is not a constant in real CMFMs, e.g.the stiffness depends on the temperature.

B

C
Appendix C
Patent: CMFM with active vibration isolation control
Abstract The invention relates to a Coriolis flow sensor. The sensor comprises a housingand at least a Coriolis-tube with at least two ends being fixed in a tube fixation means. Theflow sensor comprises excitation means for causing the tube to oscillate, as well as detectionmeans for detecting at least a measure of displacements of parts of the tube during operation.According to the invention, the Coriolis flow sensor comprises a reference mass, as well asfurther excitation means arranged for causing the reference mass to oscillate during operation,as well as further detection means for detecting at least a measure of displacements of thereference mass during operation. Additionally, control means are provided for controllingthe excitation means and/or further excitation means based on vibrations measured by thedetection means and/or further detection means. This way a Coriolis flow sensor with activevibration isolation is obtained.
This chapter is reprinted from: J. C. Lötters, L. van de Ridder, W. D. Kruijswijk, W. B. J.Hakvoort, and M. R. Katerberg. Coriolis flow meter with active vibration isolation, Patentpending, 25 November 2013.
C
146 Chapter C Patent: CMFM with active vibration isolation control
C.1 Description
The invention relates to a Coriolis flow sensor, comprising at least a Coriolis-tube with at leasttwo ends being fixed in a tube fixation means, wherein the flow sensor comprises excitationmeans for causing the tube to oscillate, as well as detection means for detecting at least ameasure of displacements of parts of the tube during operation.
A Coriolis flow sensor having a loop-shaped Coriolis tube is known from EP1719982A1 [45].Various types of loop-shaped Coriolis tubes are described therein, both of the single loop typeand of the (continuous) double loop type. The present invention relates to any of these types,but is not restricted thereto.
A Coriolis flow sensor (also indicated as flow sensor of the Coriolis type) comprises atleast one vibrating tube, often denoted Coriolis tube, flow tube, or sensing tube. This tube orthese tubes is or are fastened at both ends to the housing of the instrument. These tube endsserve at the same time as feed and discharge ducts for the liquid or gas flow to be measured.
Besides the flow tube (or tubes), a Coriolis flow sensor comprises two further subsystems,i.e. one for excitation and one for detection. The excitation system (exciter) is arranged forbringing the tube into vibration. For this purpose, one or several forces or torques are appliedto portions of the tube. The detection system is arranged for detecting at least a measure ofthe displacements of one or several points of the tube as a function of time. Instead of thisdisplacement, the force (or torque) exerted by the tube on its environment may alternativelybe measured. The same holds true for the velocity, acceleration and strain of the tube; whatwill be described below with reference to displacement detection is equally valid for forcedetection, velocity detection, acceleration detection and/or strain detection.
As a fluid flows in the vibrating tube, it induces Coriolis forces, proportional to the mass-flow, which affect the tube motion and change the mode shape. Measuring the tube displace-ment using the detection system, the change of the mode shape may be measured, whichallows for mass-flow measurements.
The vibration of the tube generated by the exciter takes place at a more or less fixedfrequency which varies slightly as a function, amongst others, of the density of the mediumflowing through the tube. The vibration frequency is almost always a natural frequency of thetube so that a maximum amplitude can be achieved with a minimum energy input.
Besides the effect of the mass-flow on the mode shape of the tube, external vibrations canintroduce motions that cannot be distinguished from the Coriolis force induced motion. Theexternal vibrations create additional components in the Coriolis flow sensor signals, and thoseadditional components can introduce a measurement error. For low flows, the Coriolis forceinduced motion is relatively small compared to external vibrations induced motions. Coriolisflow sensors designed to be sensitive to low flows, are normally rather sensitive to externalvibrations.
To minimize the influence of floor vibration on the measurement value, it is known inthe prior art to use so called passive vibration isolation. According to the prior art, passiveisolation consist of several stages of mass-spring damper systems between the floor and thetube fixation means, the parameters are adjusted to achieve high-frequency attenuation, whichis appropriate for many applications. The better the vibration isolation system the better thedecoupling of the internal measurement system from any environmental disturbances.

C
C.1 Description 147
It is an object of the present invention to provide an improved Coriolis flow sensor, inparticular a Coriolis flow sensor designed to be sensitive to low flows, wherein the influenceof external vibrations is reduced.
To this end, the invention provides a Coriolis flow sensor, that is characterized in thatit comprises a reference mass, further excitation means arranged for causing the referencemass to oscillate, as well as further detection means. The further detection means are in anembodiment arranged for detecting at least a measure of displacements of the reference massduring operation. With this, it is meant that the further detection means are at least arrangedfor detecting relative displacements of the reference mass, for instance between the referencemass and the Coriolis tube, or between the reference mass and the housing. In this sense,it is thinkable that the further detection means are arranged for detecting at least a measureof displacements of the housing during operation. A detection of displacements of both thereference mass and the housing is also possible. An absolute displacement detection (of thereference mass and/or the housing) is conceivable as well. Additionally, control means areprovided for controlling the
excitation means and/or further excitation means based on movements and/or vibrationsmeasured by the detection means and/or further detection means.
The reference mass together with the further excitation means and the further detectionmeans provide in effect active vibration isolation means which are arranged for active vibra-tion isolation, in order to minimize the effect external vibrations have on the Coriolis-tube.This may in general be done by means of two principles, or a combination thereof, which twoprinciples will be elucidated below.
Using the first principle, the Coriolis-tube, the reference mass, and the housing may beconnected in series. The reference mass is then connected to the Coriolis-tube, in particularto the tube fixation means. The further excitation means may be used to counter movementsof the housing so as to substantially fix the absolute position of the reference mass, or inother words to create a stable ground for the Coriolis-tube, such that vibrations or otherdisturbances on the housing do not result in vibrations on the Coriolis-tube, and hence do notaffect the Coriolis force induced vibrations on the Coriolis-tube.
Using the second principle, the Coriolis-tube and the reference mass are positioned inparallel to each other, each being connected to the housing. The housing is then connectedto the Coriolis-tube, in particular to the tube fixation means. The further excitation meansand further detection means may be used to match the dynamic properties of the referencemass with the dynamic properties of the Coriolis-tube in response to external vibrations.Thus, disturbances due to external vibrations acting on the housing act on both the referencemass and the Coriolis-tube, in a similar manner. Thereby, the relative displacements of theCoriolis tube are at least substantially insensitive to external vibration, but still sensitive tothe Coriolis force. Alternatively, disturbances on the reference mass, that are (directly orindirectly) measured by the further detection means may be used to correct the measurementsobtained by the detection means for detecting at least a measure for displacements of theCoriolis-tube.
A combination of the first and second principle is thinkable, which uses the set-up of thefirst principle with an additional reference mass connected to the reference mass, positionedin parallel to the Coriolis-tube. The first reference mass is used as a stable ground for the

C
148 Chapter C Patent: CMFM with active vibration isolation control
Coriolis-tube, and the additional reference mass may be used to filter out any further distur-bances that still act on the additional reference mass and the Coriolis tube.
Thus, it is shown that the Coriolis flowsensor according to the present invention is lesssensitive to external vibrations, and hence the object of the current invention is achieved.
Advantageous embodiments of the present invention are subject of the dependent claims,and will be elucidated below.
In an embodiment, the reference mass is connected to the housing. This provides for arelatively compact embodiment of the flow sensor, since it allows the components of theactive vibration isolation to be positioned within a casing of the flow sensor.
The reference mass may be connected to the housing by means of spring elements, inparticular flexures or spring-leafs. This provides for an effective, yet relatively compact andcheap construction.
According to an aspect, active vibration isolation is accomplished by means of a first prin-ciple, which substantially fixes the position of the reference mass. The reference mass maycomprise the tube fixation means, or at least the tube fixation means are substantially rigidlyconnected to the reference mass. The control means are arranged for moving the referencemass in opposite directions to movements of the housing, in particular movements due toexternal vibrations acting on the housing.
The further excitation means are in an embodiment provided between the housing or apart rigidly connected to the housing, on the one hand, and to the reference mass on the otherhand.
The further excitation means may comprise a number of excitation members. For instance,a single excitation member, such as a Piezo element and/or Lorentz actuator, may suffice toeliminate some vibrations acting on the housing. In line with this, a single detection membermay suffice to detect the displacement of the reference mass.
According to an improved embodiment, the excitation means comprise at least three exci-tation members. In addition, it is conceivable that the detection means comprise at least threedetection members.
The further detection means are in an embodiment arranged for detecting at least a measurefor movements of the housing or a part rigidly connected thereto. The control means are inan embodiment arranged for moving the reference mass with respect to the housing basedon feedforward control. In an embodiment, the control means are arranged for oscillatingthe reference mass based on feedforward control. Moving or oscillating preferably countersmovements of the housing, in particular due to external vibrations.
The further detection means are in an embodiment arranged for detecting at least a mea-sure for movements of the reference mass. The control means are arranged for moving, forinstance oscillating, the reference mass with respect to the housing, based on feedback con-trol.
The further detection means are in an embodiment arranged for detecting at least a measurefor movements of the housing, and additional detection means are provided for detecting atleast a measure for movements of the reference mass, and wherein the control means arearranged for moving, for instance oscillating, the reference mass with respect to the housingbased on both feedback control and feedforward control.
The reference mass may comprise the excitation means for the Coriolis tube.

C
C.1 Description 149
The reference mass may comprise the detection means for the Coriolis tube.According to an aspect, active vibration isolation is accomplished by means of a second
principle, which substantially matches the dynamic properties of the reference mass to thedynamic properties of the Coriolis tube in response to external vibrations. The housing maycomprise the tube fixation means, or at least the tube fixation means is rigidly connectedto the housing. The control means are arranged for moving the reference mass substantiallyidentically to the Coriolis tube in response to movements of the housing, in particular move-ments due to external vibrations acting on the housing. Thereby the relative motion of theCoriolis tube and reference mass is not affected by movements of the housing. The relativemotion may be measured directly or reconstructed from the measured motion of the Corio-lis tube and reference mass. A feedback control scheme, a feedforward control scheme, or acombination of these may be used.
According to an aspect, active vibration isolation is accomplished by means of the firstand second principle described above. In this sense, an additional reference mass is used, incombination with the reference mass.
In an embodiment, the flow sensor comprises an additional reference mass which may beconnected to the reference mass, additional excitation means arranged for causing the addi-tional reference mass to oscillate, as well as additional detection means for detecting at leasta measure for displacements of the additional reference mass during operation. Addition-ally, control means are provided for controlling the excitation means and/or further excitationmeans and/or additional excitation means based on vibrations measured by the detectionmeans and/or further detection means and/or additional detection means.
The detection means (or further detection means, or additional detection means) may bearranged for detecting at least a measure for displacements of a body (such as the housing,the reference mass, additional reference mass, and/or the Coriolis tube). In general it can besaid that the detection means are not limited thereto, but that acceleration, velocity, position,strain and/or force of that specific part may be measured as well.
The excitation means (or further excitation means, or additional excitation means) maycomprise a Lorentz actuator, such as a Voicecoil motor element, and/or a Piezo element.
According to an aspect, the invention provides a method for actively isolating vibrationsin a flowsensor of the Coriolis type, such as the flow sensor described above, wherein theflow sensor comprises a Coriolis flow tube and a reference mass that is connected thereto ina flexible manner, wherein the method comprises the step of substantially fixing the positionof the reference mass.
According to an aspect, the invention provides a method for actively isolating vibrations ina flowsensor of the Coriolis type, such as the flow sensor described above, wherein the flowsensor comprises a Coriolis flow tube and a reference mass that is movable independentlythereof, wherein the method comprises the step of substantially matching the dynamical be-havior of the reference mass to the dynamical behavior of the Coriolis tube.
According to an aspect, the active vibration isolation according to the invention may beaccomplished together with so-called passive vibration isolation, which is known per se tothose skilled in the art. The invention is not limited to the use of active vibration isolationalone.

C
150 Chapter C Patent: CMFM with active vibration isolation control
According to an aspect, the passive vibration isolation for a Coriolis flow sensor may beimproved. This is, according to this aspect of the invention, obtained by a Coriolis flow sensor,comprising at least a Coriolis-tube with at least two ends being fixed in a tube fixation means,wherein the flow sensor comprises excitation means for causing the tube to oscillate, as wellas detection means for detecting at least a measure of displacements of parts of the tubeduring operation. The Coriolis flow sensor comprises a compliant connection between thecasing and at least part of the detection means. The compliant connection according to thisembodiment of the invention is constructed and arranged such that a relative displacementmeasurement of the tube, dependent on the tube actuation and mass flow, though independentof casing excitations is obtained. It is noted that this Coriolis flow sensor, having the improvedpassive vibration isolation described herein, already provides improved results. The Coriolisflow sensor according to the invention may be embodied with either one of passive vibrationisolation, or active vibration isolation, and/or both.
The flow sensor according to this aspect of the invention is in an embodiment arrangedfor causing the detection means to oscillate in response to excitations of the housing, insubstantially the same manner as the Coriolis-tube oscillates in response to excitations of thehousing.
This may in an embodiment be obtained by tuning the resonance frequency and/or thedamping of the compliant detection means. Tuning may be dependent on the actuation fre-quency of the Coriolis tube, and the first and second Coriolis mode.
The tuning may comprise that the resonance frequency and/or the damping ratio are sub-stantially equal for the Coriolis-tube (i.e. internal mode of the tube-window) and the compli-ant mounted detection means.
The tuning may in practice comprise that the resonance frequency and/or the dampingratio are lower for the internal mode of the tube-window (Coriolis-tube), compared to theresonance frequency and the damping ratio of the compliant mounted detection means.
The tuning may in an embodiment comprise that the resonance frequency and/or the damp-ing ratio for the internal mode of the tube-window (Coriolis-tube) are approximately 90% ofthe resonance frequency and the damping ratio of the compliant mounted detection means.
It is conceivable in an alternative embodiment that the resonance frequency and the damp-ing ratio are higher for the internal mode of the tube-window (Coriolis-tube), compared tothe resonance frequency and the damping ratio of the compliant mounted detection means.
In addition to the passive vibration isolation described above, active vibration isolationmay be used, in particular as described herein. Thus, the active vibration isolation may beaccomplished together with the passive vibration isolation.
The invention will be described below by means of the accompanying Figures, which showseveral embodiments of the invention.
In the figures, it is shown:Fig. 1a-c a perspective view, a side view and a dynamical overview of a first em-
bodiment of the flowmeter according to the invention;Fig. 2a-c a perspective view, a side view and a dynamical overview of a second
embodiment of the flowmeter according to the invention;Fig. 3 a dynamical overview of a third embodiment of the flowmeter according
to the invention.

C
C.1 Description 151
Fig. 4a-c a perspective view, a side view and a dynamical overview of a third em-bodiment of the flowmeter according to the invention;
Fig. 5 an embodiment of a compliant sensor design for passive vibration isolationaccording to an aspect of the invention.
Fig. C.1(a) shows a perspective view of a flowmeter 1 of the Coriolis type (or CoriolisMass Flow Meter, CMFM), and Fig. C.1(b) shows a side view of said flowmeter 1, accordingto a first embodiment of the invention. The flowmeter 1 of the Coriolis type has a loopedtube 2 that is bent into a rectangular shape so as to follow a substantially circumferential path(substantially one full turn), and that comprises a flexible inlet tube 3 and a flexible outlet tube4 for a fluid medium. Preferably, the loop 2 and the inlet and outlet tubes 3, 4 are portionsof one and the same tube. The tube 2 in its entirety is bent into a rectangular shape, but thecorners are rounded such that it can be bent into this shape. The inlet tube 3 is connected toa supply line 6 and the outlet tube 4 to a discharge line 7 via a supply/discharge block 5a,which forms part of a housing 5 or casing 5. The inlet and outlet tubes 3, 4 of this embodimentextend within the loop 2 and are fastened (i.e. clamped) to a frame 15 by fastening means 12.The fastening is provided in a location such that the free path length of the inlet and the outlettube 3, 4 (i.e. the portion of the inlet/outlet tube 3, 4 between the connection of the secondtransverse tube portions 2a, 2b and the location of the clamping to the fastening means 12)is at least 50%, preferably 60% of the length of each of the lateral tube portions 2c, 2d, oreven longer. The flexible inlet and outlet tubes 3, 4 do not form part of the loop 2 but providea flexible fastening of the loop 2 to the frame 15. The loop 2 may thus be regarded as beingflexibly suspended by means of the inlet and outlet tubes. The loop 2 and the inlet and outlettubes 3, 4 may advantageously be manufactured from one integral piece of tubing. This maybe, for example, a stainless steel tube with an outer diameter of approximately 0.7 mm anda wall thickness of approximately 0.1 mm. Depending on the outer dimensions of the loop 2and the pressure the tube is to be able to withstand (for example 100 bar), the outer diameterof the tube will usually be smaller than 1 mm and the wall thickness 0.2 mm or less. It isnoted that other dimensions may be used as well.
The tube 2 consists of a substantially rectangular framework comprising two parallel lat-eral tubes 2d and 2e, a first transverse tube 2c connected to first (lower) ends of the lateraltubes 2d and 2e, and two second transverse tubes 2a and 2b connected at one side to second(upper) ends of the lateral tubes and at the other side to the centrally returning inlet and outlettubes 3 and 4, respectively. The rectangular loop 2 preferably has rounded corners. The tubes3 and 4, which run closely together on either side of and symmetrically with respect to themain axis of symmetry S of the loop 2, are fastened to the fastening means 12, for exampleby clamping or soldering or welding, said means 12 in their turn being fastened to the frame15, which forms a reference mass 15 as will be explained below. The inlet and outlet tubes 3,4 are flexible and act as it were as a suspension spring for the loop 2. This suspension allowsa motion of the loop 2 both about the main axis of symmetry S and about a second axis S’situated in the plane of the loop 2 and perpendicular to the main axis of symmetry S.
To close the loop 2 mechanically (i.e. to interconnect the beginning and end of the loopmechanically, directly or indirectly), the tubes 3, 4 are preferably connected to one anotheralong the extent of their free path lengths, for example in that they are welded or solderedtogether.

C
152 Chapter C Patent: CMFM with active vibration isolation control
(a) (b)
(c)
Fig. C.1 A perspective view, a side view and a dynamical overview of a first embodiment of the flowmeteraccording to the invention
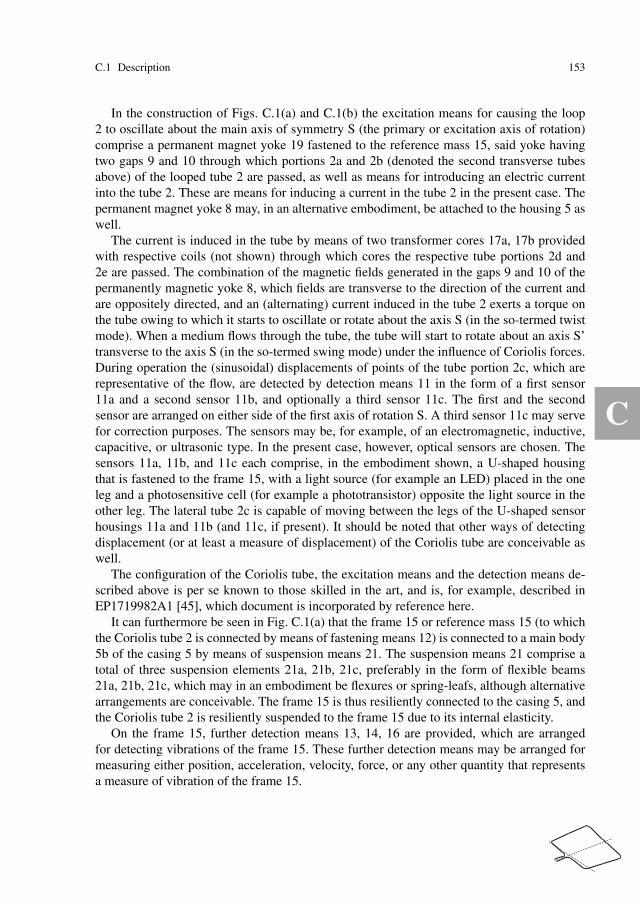
C
C.1 Description 153
In the construction of Figs. C.1(a) and C.1(b) the excitation means for causing the loop2 to oscillate about the main axis of symmetry S (the primary or excitation axis of rotation)comprise a permanent magnet yoke 19 fastened to the reference mass 15, said yoke havingtwo gaps 9 and 10 through which portions 2a and 2b (denoted the second transverse tubesabove) of the looped tube 2 are passed, as well as means for introducing an electric currentinto the tube 2. These are means for inducing a current in the tube 2 in the present case. Thepermanent magnet yoke 8 may, in an alternative embodiment, be attached to the housing 5 aswell.
The current is induced in the tube by means of two transformer cores 17a, 17b providedwith respective coils (not shown) through which cores the respective tube portions 2d and2e are passed. The combination of the magnetic fields generated in the gaps 9 and 10 of thepermanently magnetic yoke 8, which fields are transverse to the direction of the current andare oppositely directed, and an (alternating) current induced in the tube 2 exerts a torque onthe tube owing to which it starts to oscillate or rotate about the axis S (in the so-termed twistmode). When a medium flows through the tube, the tube will start to rotate about an axis S’transverse to the axis S (in the so-termed swing mode) under the influence of Coriolis forces.During operation the (sinusoidal) displacements of points of the tube portion 2c, which arerepresentative of the flow, are detected by detection means 11 in the form of a first sensor11a and a second sensor 11b, and optionally a third sensor 11c. The first and the secondsensor are arranged on either side of the first axis of rotation S. A third sensor 11c may servefor correction purposes. The sensors may be, for example, of an electromagnetic, inductive,capacitive, or ultrasonic type. In the present case, however, optical sensors are chosen. Thesensors 11a, 11b, and 11c each comprise, in the embodiment shown, a U-shaped housingthat is fastened to the frame 15, with a light source (for example an LED) placed in the oneleg and a photosensitive cell (for example a phototransistor) opposite the light source in theother leg. The lateral tube 2c is capable of moving between the legs of the U-shaped sensorhousings 11a and 11b (and 11c, if present). It should be noted that other ways of detectingdisplacement (or at least a measure of displacement) of the Coriolis tube are conceivable aswell.
The configuration of the Coriolis tube, the excitation means and the detection means de-scribed above is per se known to those skilled in the art, and is, for example, described inEP1719982A1 [45], which document is incorporated by reference here.
It can furthermore be seen in Fig. C.1(a) that the frame 15 or reference mass 15 (to whichthe Coriolis tube 2 is connected by means of fastening means 12) is connected to a main body5b of the casing 5 by means of suspension means 21. The suspension means 21 comprise atotal of three suspension elements 21a, 21b, 21c, preferably in the form of flexible beams21a, 21b, 21c, which may in an embodiment be flexures or spring-leafs, although alternativearrangements are conceivable. The frame 15 is thus resiliently connected to the casing 5, andthe Coriolis tube 2 is resiliently suspended to the frame 15 due to its internal elasticity.
On the frame 15, further detection means 13, 14, 16 are provided, which are arrangedfor detecting vibrations of the frame 15. These further detection means may be arranged formeasuring either position, acceleration, velocity, force, or any other quantity that representsa measure of vibration of the frame 15.

C
154 Chapter C Patent: CMFM with active vibration isolation control
As can be seen in Fig. C.1(b), the flowsensor 1 further comprises a number of furtherexcitation means 31, 32, which are connected between a back wall 5c of the casing 5, andthe frame 15. The excitation means 31, 32, may be Piezo actuators, or other actuators. In anembodiment, voice-coil motors are used. In the embodiment shown, a total of three actuators31, 32 are used (one of which is positioned behind the upper actuator 32. The three actuators31, 32 are in the embodiment shown, positioned in a isosceles triangular relationship. It isnoted however, that in principle any other number of actuators may be used, and that theirposition may be chosen as desired.
The flowmeter 1 of the Coriolis type as depicted in Fig. C.1(a) and C.1(b), and describedabove, can be represented by the dynamical scheme of the flowmeter 1 shown in Fig. C.1(c).Corresponding numbers are adhered to. Here it can be seen that the casing 5 represents‘ground’ Mg. The frame 15 represents a reference mass Mr, and is resiliently connected tothe ‘ground’ Mg by means of the suspension means 21. To the reference mass Mr, the Cori-olis flow tube 2 is connected by means of a resilient connection 12’. As described above,the internal elasticity of several tube parts 3, 4, 2a, 2b represents the resilient suspension 12’between the Coriolis mass Mc and the reference mass Mr.
The flowmeter of the Coriolis type as shown in Fig. C.1(a) - Fig. C.1(c), operates accord-ing to a first principle of active vibration isolation, in order to minimize the effect externalvibrations have on the Coriolis-tube. In the embodiment shown, the Coriolis-tube 2 (Mc), thereference mass 15 (Mr), and the housing (5) are connected in series. The further excitationmeans 31 connected to the reference mass 15 are used to counter movements ag of the hous-ing 5 so as to substantially fix the absolute position of the reference mass 15. In other wordsa stable ground is created for the Coriolis-tube 2, yielding that the measurement yc is the truemovement of the Coriolis tube induced by the Coriolis Force Fc (see Fig. C.1(c)). Hence,vibrations or other disturbances on the housing 5 do not result in undesired vibrations on theCoriolis-tube 2. In general, a feedback scheme and/or a feedforward scheme is/are used tosubstantially fix the absolute position of the reference mass 15. At least one actuator element,and at least one sensor element are used for this. In the embodiment shown, a total of threeactuator elements 31, 32 are used.
Referring to Fig. C.1(c), the sensors 11 are arranged, in an embodiment, for measuringa relative displacement yc = xc − xr. The displacement of the Coriolis tube due to a Corio-lis force Fc (which is proportional to fluid flow) and due to external vibrations is equal toxc = G1Fc +G2ar, in which G1 and G2 denote specific transfer functions. The sensors 11thus actually measure yc = xc − xr = G1Fc +G2ar − xr. By means of a feedforward and/or afeedback control scheme, the position of the reference mass 15 (Mr) may be actively set to anabsolute value in which ar = xr = 0. With this, the measurements yc obtained by the sensors11 has become dependent on the flow only: yc = G1Fc.
An alternative embodiment of the flowmeter 101 of the Coriolis type according to theinvention, is shown in Fig. C.2(a)- C.2(c). In general, the same reference signs, increased by100, are used. In general, it is referred to the description of Fig. C.1(a) and C.1(b), whichlargely applies to this embodiment. For completeness sake, a short summary will be givenbelow.
Fig. C.2(a) shows a perspective view of a flowmeter 101 of the Coriolis type, andFig. C.2(b) shows a side view of said flowmeter 101, according to a second embodiment

C
C.1 Description 155
(a) (b)
(c)
Fig. C.2 A perspective view, a side view and a dynamical overview of a second embodiment of the flowmeteraccording to the invention

C
156 Chapter C Patent: CMFM with active vibration isolation control
of the invention. The flowmeter 101 of the Coriolis type has a looped tube 102 that is bentinto a rectangular shape, with a flexible inlet tube 103 and a flexible outlet tube 104 for afluid medium. The inlet tube 103 is connected to a supply line 106 and the outlet tube 104to a discharge line 107 via a supply/discharge block 105a, which forms part of a casing 105.The tube 102 comprises two parallel lateral tubes 102d and 102e, a first transverse tube 102cconnected to first (lower) ends of the lateral tubes 102d and 102e, and two second transversetubes 102a and 102b connected at one side to second (upper) ends of the lateral tubes and atthe other side to the centrally returning inlet and outlet tubes 103 and 104, respectively.
Excitation means 119 are provided, comprising a permanent magnet yoke fastened to themain body 105b of the casing 105, said yoke having two gaps 109 and 110 through whichportions 102a and 102b (denoted the second transverse tubes above) of the looped tube 102are passed. Transformer cores 117a, 117b are provided for inducing a current, to exert atorque on the tube owing to which it starts to oscillate or rotate about the axis S (in the so-termed twist mode). Detection means 111 are provided, in the form of a first sensor 111a anda second sensor 111b, and optionally a third sensor 111c.
In the embodiment shown, the tubes 103 and 104, are fastened to the fastening means 112,for example by clamping or soldering or welding, said means 112 in their turn being fastenedto the main body 105b of the casing 105. Note, in this sense, that the fastening means 112 aredirectly connected to the main body 105b of the casing 105.
Connected to the main body 105b of the casing 105 is further frame 125. The frame 125 isresiliently connected, by means of suspension means 121, which comprise in the embodimentshown a total of three suspension elements 121a, 121b, 121c in the form of flexible beams,preferably flexure elements or spring-leaf like elements. Further detection means 116 areprovided, which are arranged for determining vibrations of the frame 125.
As can be seen in Fig. C.2(c), a further excitation means 131 is provided, which may beused to excite the frame 125.
Fig. C.2(c) shows a dynamical scheme of the embodiment of the flowmeter 101 as shownin Fig. C.2(a) and C.2(b). Here it can be seen that the frame 125 defines a reference mass Mr,which is resiliently connected by means of the suspension means 121 to the ‘ground mass’formed by the casing 105. The Coriolis flow tube 102 defines a Coriolis mass Mc, and isdirectly connected, in a resilient manner, by means of a resilient suspension 112’ (formedby internal elasticity of one or more of the Coriolis tube parts) to the ‘ground mass’ formedby the casing 105. Thus, the reference mass 125 and the Coriolis tube 102 are connected inparallel to each other.
The embodiment of the flowmeter 101 of the Coriolis type as shown in Fig. C.2(a)-C.2(c) works on a second principle of active vibration isolation. In this second principle,the Coriolis-tube 102 (Mc) and the reference mass 125 (Mr) are positioned in parallel to eachother, each being connected to the housing 105. The further excitation means 131 are used tomatch the dynamic properties of the reference mass 125 with the dynamic properties of theCoriolis-tube 102. Disturbances due to external vibrations acting on the housing 105 act onboth the reference mass 125 and the Coriolis-tube 102, in a similar manner. Thus, the relativedisplacements of the Coriolis tube are at least substantially dependent on the Coriolis forceand independent on the external vibrations. It is noted in this regards that the sensors elements111a-111c of the detection means 111 are in this embodiment provided on the reference mass

C
C.1 Description 157
125, such that the sensor elements 111a-111c are able to measure the Coriolis force inducedvibrations xc on the Coriolis-tube.
In the embodiment shown in Fig. C.2(c), the sensors 111 are arranged for measuring a rela-tive displacement yc = xc−xr. Displacement yc of the Coriolis tube, due to a Coriolis force Fc
(which is proportional to fluid flow) and due to external vibrations equals xc = G1Fc +G3ag;with G1 and G3 being specific transfer functions. Now in this embodiment, movement of thereference mass Mr equals xr = G4ag. With this, the sensors 111 are arranged for measuringyc = xc −xr = G1Fc +(G3 −G4)ag. The measurement of the sensors 111 is dependent on thefluid flow only, when G3 equals G4 (in other words, when dynamic properties of the referencemass match those of the Coriolis tube). A feedback and/or feedforward control scheme maybe used to achieve this.
Fig. C.3 A dynamical overview of a third embodiment of the flowmeter according to the invention
Fig. C.3, shows a dynamic representation of a further embodiment of the flowmeter 201according to the invention. This flowmeter 201 makes use of the first and second principledescribed above. The flowmeter 201 comprises, a housing 205 (Mg). Connected thereto, isan additional reference mass 235 (Ms). The additional reference mass 235 is resiliently con-nected to the housing 205, by means of one or more spring elements 231. Connected to theadditional reference mass 235 are a reference mass 225 (Mr) and a Coriolis tube 202 (Mc).The Coriolis tube 202 is resiliently suspended due to internal elasticity, which is denotedby reference sign 212’. The Coriolis tube 202 and the reference mass 225 are connected inparallel to each other. Both the reference mass 225 and the Coriolis tube 202 are resilientlyconnected to the additional reference mass 235. As can be seen, this embodiment is basicallya combination of Fig. C.2(c) and Fig. C.1(c).
The flowmeter 201 makes use of a combined principle of active vibration isolation, in thissense that the additional reference mass uses additional excitation means (not shown) andadditional detection means to detect vibrations and/or movements of the housing 205, and to

C
158 Chapter C Patent: CMFM with active vibration isolation control
substantially fix the absolute position xs of the additional reference mass. This provides a sta-ble base for the Coriolis tube 202. Then the reference mass 225 with further excitation meansand further detection means may be used to match the dynamic properties of the referencemass 225 to the dynamic properties of the Coriolis tube 202, such that any disturbances actingon the housing (and which are not countered by the additional mass) or on the reference mass235 have the same effect on the reference mass 225 and the Coriolis tube, and the Coriolisdisplacement may be more accurately measured.
According to the embodiment shown in Fig. C.3, the sensors 211 are arranged for mea-suring a relative displacement yc = xc − xr. The displacement of the Coriolis tube due toa Coriolis force (which is proportional to fluid flow) and due to external vibrations equalsxc = G1Fc +G5xs. In this case, the displacement of the reference mass equals xr = G6xs.Here, the sensors 211 are thus arranged for measuring yc = G1Fc +(G5 −G6)xs. The dynam-ical properties of the reference mass may be matched to those of the Coriolis tube, such thatG5 = G6. The reference mass may be set to an absolute position, using a feedback and/orfeedforward control scheme, such that as = xs = 0. This leads to the result that the measure-ment depends only on the fluid flow; yc = G1Fc.
Fig. C.4(a) shows a perspective view of a flowmeter 301 of the Coriolis type (or CoriolisMass Flow Meter, CMFM), and Fig. C.4(b) shows a side view of said flowmeter 301, accord-ing to an embodiment of the invention wherein passive vibration isolation is incorporatedinto the Coriolis flow sensor. As already described for Fig. C.1(a) and C.1(b), the flowmeter301 of the Coriolis type has a looped tube 302 that is bent into a rectangular shape so as tofollow a substantially circumferential path (substantially one full turn), and that comprises aflexible inlet tube 303 and a flexible outlet tube 304 for a fluid medium. Preferably, the loop302 and the inlet and outlet tubes 303, 304 are portions of one and the same tube. The tube302 in its entirety is bent into a rectangular shape, but the corners are rounded such that it canbe bent into this shape. The inlet tube 303 is connected to a supply line 306 and the outlettube 304 to a discharge line 307 via a supply/discharge block 305a, which forms part of acasing 305. The inlet and outlet tubes 303, 304 of this embodiment extend within the loop302 and are fastened (i.e. clamped) to the casing 305 by fastening means 312. The fasteningis provided in a location such that the free path length of the inlet and the outlet tube 303,304 (i.e. the portion of the inlet/outlet tube 303, 304 between the connection of the secondtransverse tube portions 302a, 302b and the location of the clamping to the fastening means312) is at least 50%, preferably 60% of the length of each of the lateral tube portions 302c,302d, or even longer. The flexible inlet and outlet tubes 303, 304 do not form part of the loop302 but provide a flexible fastening of the loop 302 to the casing 305. The loop 302 may thusbe regarded as being flexibly suspended by means of the inlet and outlet tubes. The loop 302and the inlet and outlet tubes 303, 304 may advantageously be manufactured from one inte-gral piece of tubing. This may be, for example, a stainless steel tube with an outer diameterof approximately 0.7 mm and a wall thickness of approximately 0.1 mm. Depending on theouter dimensions of the loop 302 and the pressure the tube is to be able to withstand (forexample 100 bar), the outer diameter of the tube will usually be smaller than 1 mm and thewall thickness 0.2 mm or less. It is noted that other dimensions may be used as well.
The tube 302 consists of a substantially rectangular framework comprising two parallellateral tubes 302d and 302e, a first transverse tube 302c connected to first (lower) ends of

C
C.1 Description 159
(a) (b)
(c)
Fig. C.4 A perspective view, a side view and a dynamical overview of a third embodiment of the flowmeteraccording to the invention

C
160 Chapter C Patent: CMFM with active vibration isolation control
the lateral tubes 302d and 302e, and two second transverse tubes 302a and 302b connectedat one side to second (upper) ends of the lateral tubes and at the other side to the centrallyreturning inlet and outlet tubes 303 and 304, respectively. The rectangular loop 302 preferablyhas rounded corners. The tubes 303 and 304, which run closely together on either side of andsymmetrically with respect to the main axis of symmetry S of the loop 302, are fastened tothe fastening means 312, for example by clamping or soldering or welding, said means 312in their turn being fastened to the casing 305. The inlet and outlet tubes 303, 304 are flexibleand act as it were as a suspension spring for the loop 302. This suspension allows a motionof the loop 302 both about the main axis of symmetry S and about a second axis S’ situatedin the plane of the loop 302 and perpendicular to the main axis of symmetry S.
To close the loop 302 mechanically (i.e. to interconnect the beginning and end of theloop mechanically, directly or indirectly), the tubes 303, 304 are preferably connected to oneanother along the extent of their free path lengths, for example in that they are welded orsoldered together.
In the construction of Figs. C.1(a) and C.1(b) the excitation means for causing the loop302 to oscillate about the main axis of symmetry S (the primary or excitation axis of rotation)comprise a permanent magnet yoke 319 fastened to the casing 305, said yoke having twogaps 309 and 310 through which portions 302a and 302b (denoted the second transversetubes above) of the looped tube 302 are passed, as well as means for introducing an electriccurrent into the tube 302. These are means for inducing a current in the tube 302 in the presentcase.
The current is induced in the tube by means of two transformer cores 317a, 317b providedwith respective coils (not shown) through which cores the respective tube portions 302d and302e are passed. The combination of the magnetic fields generated in the gaps 309 and 310 ofthe permanently magnetic yoke 319, which fields are transverse to the direction of the currentand are oppositely directed, and an (alternating) current induced in the tube 302 exerts atorque on the tube owing to which it starts to oscillate or rotate about the axis S (in the so-termed twist mode). When a medium flows through the tube, the tube will start to rotateabout an axis S’ transverse to the axis S (in the so-termed swing mode) under the influence ofCoriolis forces. During operation the (sinusoidal) displacements of points of the tube portion302c, which are representative of the flow, are detected by detection means 311 in the form ofa first sensor 311a and a second sensor 311b, and optionally a third sensor 311c. The first andthe second sensor are arranged on either side of the first axis of rotation S. A third sensor 311cmay serve for correction purposes. The sensors may be, for example, of an electromagnetic,inductive, capacitive, or ultrasonic type. In the present case, however, optical sensors arechosen. The sensors 311a, 311b, and 311c each comprise, in the embodiment shown, a U-shaped housing that is fastened to the frame 315, with a light source (for example an LED)placed in the one leg and a photosensitive cell (for example a phototransistor) opposite thelight source in the other leg. The lateral tube 302c is capable of moving between the legs ofthe Ushaped sensor housings 311a and 311b (and 311c, if present). It should be noted thatother ways of detecting displacement (or at least a measure of displacement) of the Coriolistube are conceivable as well.
In the embodiment shown, the tubes 303 and 304, are fastened to the fastening means 312,for example by clamping or soldering or welding, said means 312 in their turn being fastened

C
C.1 Description 161
to the main body 305b of the casing 305. Note, in this sense, that the fastening means 312 aredirectly connected to the main body 305b of the casing 305.
Connected to the main body 305b of the casing 305 is further frame 325. The furtherframe 325 is resiliently connected, by means of suspension means 321, which comprise inthe embodiment shown a total of three suspension elements 321a, 321b, 321c in the form offlexible beams, preferably flexure elements or spring-leaf like elements. On the further frame325, the detection means 311 are provided.
According to an aspect of the invention, which is in particular related to passive vibrationisolation, a compliant connection 321 between the casing 305 and the detection means 311is present. The compliant connection 321 according to the invention is constructed and ar-ranged such that a relative displacement measurement of the tube 302, dependent on the tube302 actuation and mass-flow, though substantially independent of casing 305 excitations isobtained. In other words, the further frame 325 with the detection means 311 is arranged tooscillate, in response to casing 305 excitations, in substantially the same manner as the Cori-olistube 302 oscillates in response to said same casing 305 excitations. Thus, the influence ofexternal casing excitations does not result in a relative movement between the Coriolis-tube302 and the detection means 311.
Fig. C.4(c) shows a dynamical scheme of the embodiment of the flowmeter 301 as shownin Fig. C.4(a) and C.4(b). Here it can be seen that the frame 325 with the detection means 311is resiliently connected by means of the suspension means 321 to the ‘ground mass’ formedby the casing 305. The Coriolis flow tube 302 defines a Coriolis mass Mc, and is directlyconnected, in a resilient manner, by means of a resilient suspension 312’ (formed by internalelasticity of one or more of the Coriolis tube parts) to the ‘ground mass’ formed by the casing305. Thus, the detection means 325 and the Coriolis tube 302 are connected in parallel toeach other.
The placement and the characteristics of the compliant connection 321, as well as designof the flow sensor (including design for masses Md and Mc of the frame 325 with detectionmeans, and the Coriolis tube, respectively, may be designed in order to obtain the desiredeffect. In particular, the compliant connection 321 is arranged and designed such that theresonance frequency and/or the damping of the compliant detection means 311 are tunedsuch that the dynamic response to external vibrations on the casing is substantially equal tosaid response of the Coriolis tube.
As followed from the above, the Coriolis flow-sensor thus comprises passive vibrationisolation means. In the embodiment shown in Fig. C.4(a) and C.4(b), the Coriolis flow-sensoralso comprises active vibration isolation means, such as described for Figs. C.1- C.3, althoughthese means are entirely optional. In summary, referring to Fig. C.4(a) and C.4(b), a furtherexcitation means 331 is provided, which may be used to actively excite the further frame 325as a reference mass, and further detection means 316 are provided, to measure the oscillationsof the reference mass.
The Coriolis-tube 302 (having mass Mc) and the reference mass Md provided by the frame325 are positioned in parallel to each other, each being connected to the housing 305. The fur-ther excitation means 331 are used to match the dynamic properties of the reference mass 325with the dynamic properties of the Coriolis-tube 302. Disturbances due to external vibrationsacting on the housing 305 act on both the reference mass 325 and the Coriolis-tube 302, in a

C
162 Chapter C Patent: CMFM with active vibration isolation control
similar manner. Thus, the relative displacements of the Coriolis tube are at least substantiallydependent on the Coriolis force and independent on the external vibrations. It is noted in thisregards that the sensors elements 311a-311c of the detection means 311 are in this embodi-ment provided on the reference mass 325, such that the sensor elements 311a-311c are ableto measure the Coriolis force induced vibrations xc on the Coriolis-tube 302.
Fig. C.5 An embodiment of a compliant sensor design for passive vibration isolation according to an aspectof the invention
An embodiment of a device 401 having passive vibration isolation is shown in Fig. C.5.The device 401 comprises a casing part 405a and a frame part 405b. The frame part 405bhas a compliant connection 421 to the casing part 405a. In the embodiment shown, severalwire springs 421a-421e are used, which are arranged in such a manner to provide an exactlyconstraint configuration with only one remaining degree of freedom, which is along the lon-gitudinal length of cylinder 406b. The device 401 may be used in a flow sensor of the Coriolistype, wherein the Coriolis tube is connected to the casing 405a, and detections means are pro-vided on the frame part 405b, such that the detection means are resiliently connected to thecasing. The Coriolis tube is provided in such a way that the only remaining degree of freedomis out of plane of the tube-window. This results in an extra degree of freedom between thecasing 405a and the frame 405b, which preferably comprises a printed circuit board (PCB)with the detection means in the form of optical sensors.
The resilient connection, in the embodiment shown provided by flexures, or leaf springs,provides damping and stiffness. The connection of the Coriolis tube to the casing also en-tails damping and stiffness. Perfect vibration isolation may be achieved when the followingconditions are met:

C
C.1 Description 163
• the damping of the detection means dd is equal to damping of the Coriolis tube dc timesthe ratio between the mass of the detection means md and the mass of the Coriolis tubemc: dd =
mdmc
dc;• the stiffness of the detection means kd is equal to stiffness of the Coriolis tube kc times
the ratio between the mass of the detection means md and the mass of the Coriolis tubemc: kd =
mdmc
kc.
These conditions are in general achieved when the resonance frequency and the dampingratio are equal for the internal mode of the tube window and the compliant mounted detectionmeans.
It is noted that for the design shown in Fig. C.5, a perfect match of the damping ratio andthe resonance frequency no longer results in perfect vibration isolation because of the higherorder dynamics of the tube window. Fortunately, mistuning of those parameters can be usedadvantageously to minimise the transmissibility in the region of interest by the introductionof an anti-resonance. Therefore the concept device 401 shown in Fig. C.5 is mistuned onpurpose.
In the case shown in Fig. C.5, the damping and resonance frequencies for the internalmode of the tube-window (Coriolis-tube) are approximately 90% of those of the compliantmounted detection means (frame 405b). With the design, a 20 dB attenuation of the influenceof external vibrations on the mass-flow measurement value of a CMFM may be obtained.
The device 401 shown in Fig. C.5 -as well as concepts described above in relationshipto Coriolis flow sensors- can in principle be used in every flow sensor of the Coriolis type,and even in other kinds of systems were specific internal deformations need to be measuredindependently of external vibrations.
In particular, the passive vibration isolation described in the embodiments of Figs. C.4and C.5 can be incorporated into the Coriolis flow sensors as described in Figs. C.1 to C.3.
The invention is described above by means of a number of embodiments. These embod-iments and the description thereof are not to be construed limiting on the invention. Theinvention and its desired protection is defined by the appended claims.
The Coriolis flow sensor having passive vibration isolation may be described by means ofthe following clauses:
Clause 1. Coriolis flow sensor, comprising a housing and at least a Coriolis- tube with atleast two ends being fixed in a tube fixation means, wherein the flow sensor comprisesexcitation means for causing the tube to oscillate, as well as detection means for detectingat least a measure of displacements of parts of the tube during operation, characterizedin that it comprises a compliant connection between the casing and at least part of thedetection means.
Clause 2. Coriolis flow sensor according to clause 1, wherein the flow sensor is arranged forcausing the detection means to oscillate in response to casing excitations, in substantiallythe same manner as the Coriolis-tube oscillates in response to casing excitations.
Clause 3. Coriolis flow sensor according to clause 2, wherein the resonance frequencyand/or the damping ratio are substantially equal for the Coriolis-tube and the compliantmounted detection means.

C
164 Chapter C Patent: CMFM with active vibration isolation control
Clause 4. Coriolis flow sensor according to clause 2, wherein the resonance frequencyand/or the damping ratio are lower for the internal mode of the tubewindow, comparedto the resonance frequency and the damping ratio of the compliant mounted detectionmeans.
Clause 5. Coriolis flow sensor according to clause 4, wherein the resonance frequencyand/or the damping ratio for the Coriolis-tube are approximately 90% of the resonancefrequency and the damping ratio of the compliant mounted detection means.
Clause 6. Coriolis flow sensor according to clause 2, wherein the resonance frequencyand/or the damping ratio is/are higher for the internal mode of the Coriolis- 5 tube, com-pared to the resonance frequency and the damping ratio of the compliant mounted detec-tion means.
Clause 7. Coriolis flow sensor according to any of the previous clauses, additionally com-prising the features of the Coriolis flow sensor according to any of the following claims1-20.
C.2 Claims
1. Coriolis flow sensor, comprising a housing and at least a Coriolis- tube with at least twoends being fixed in a tube fixation means, wherein the flow sensor comprises excitationmeans for causing the tube to oscillate, as well as detection means for detecting at leasta measure of displacements of parts of the tube during operation, characterized in that itcomprises:
• a reference mass;• further excitation means arranged for causing the reference mass to oscillate with
respect to the housing;• further detection means arranged for detecting at least a measure of displacements
of the reference mass and/or the housing during operation; as well as• control means for controlling the excitation means and/or the further excitation
means based on movements measured by the detection means and/or further de-tection means.
2. Coriolis flow sensor according to claim 1, wherein the reference mass is connected tothe housing.
3. Coriolis flow sensor according to claim 2, wherein the reference mass is connected tothe housing by means of spring elements, in particular flexures or spring-leafs.
4. Coriolis flow sensor according to one of claims 1-3, wherein the reference mass com-prises the tube fixation means, or at least wherein the tube fixation means are substan-tially rigidly connected to the reference mass.
5. Coriolis flow sensor according to one of claims 1-4, wherein the control means are ar-ranged for moving the reference mass in opposite directions to movements of the hous-ing, in particular movements due to external vibrations acting on the housing.
C
C.2 Claims 165
6. Coriolis flow sensor according to one of claims 1-5, wherein the further excitation meansare provided between the housing or a part rigidly connected to the housing, on the onehand, and to the reference mass on the other hand.
7. Coriolis flow sensor according to one of claims 1-6, wherein the further excitation meanscomprise at least three excitation members, and wherein the detection means compriseat least three detection members.
8. Coriolis flow sensor according to one of claims 1-7, wherein the further detection meansare arranged for detecting at least a measure for movements of the housing or a partrigidly connected thereto.
9. Coriolis flow sensor according to claim 8, wherein the control means are arranged formoving the reference mass with respect to the housing based on feedforward control.
10. Coriolis flow sensor according to one of claims 1-9, wherein the further detection meansare arranged for detecting at least a measure for movements of the reference mass, andwherein the control means are arranged for moving the reference mass based on feed-back control.
11. Coriolis flow sensor according to claim 9 and 10, wherein the further detection meansare arranged for detecting movements of the housing, and wherein additional detectionmeans are provided for detecting movements of the reference mass, and wherein thecontrol means are arranged for moving the reference mass with respect to the housingbased on both feedforward control and feedback control.
12. Coriolis flow sensor according to one of claims 1-11, wherein the reference mass com-prises the excitation means for the Coriolis tube.
13. Coriolis flow sensor according to one of claims 1-12, wherein the reference mass com-prises the detection means for the Coriolis tube.
14. Coriolis flow sensor according to one of claims 1-13, wherein the housing comprises thetube fixation means, or at least wherein the tube fixation means is rigidly connected tothe housing
15. Coriolis flow sensor according to claim 14, wherein the control means are arranged formoving the reference mass substantially identically to the Coriolis tube in response tomovements of the housing.
16. Coriolis flow sensor according to one of claims 14-15, wherein the control means arearranged for moving the reference mass based on feedback control or on feedforwardcontrol, wherein use is made of signals of the further detection means.
17. Coriolis flow sensor according to one of claims 1-13, comprising an additional refer-ence mass connected to the reference mass, additional excitation means arranged forcausing the additional reference mass to oscillate, as well as additional detection meansfor detecting at least a measure for displacements of the additional reference mass duringoperation.
18. Coriolis flow sensor according to claim 17, wherein the control means further are ar-ranged for moving the additional reference mass substantially identically to the Coriolistube in response to movements of the reference mass.
19. Coriolis flow sensor according to one of claims 1-18, wherein the detection means and/orfurther detection means, and/or additional detection means are arranged for measuring

C
166 Chapter C Patent: CMFM with active vibration isolation control
acceleration, velocity, position, strain and/or force of the Coriolis tube, the referencemass and/or the housing.
20. Coriolis flow sensor according to one of claims 1-19, wherein the excitation meansand/or further excitation means, and/or additional excitation means comprise an exci-tation member in the form of a Lorentz actuator, a Voicecoil motorelement, a reluctanceactuator and/or a Piezo element.
21. Coriolis flow sensor according to one of claims 1-20, comprising a compliant connectionbetween the casing and at least part of the detection means.
22. Coriolis flow sensor according to claim 21, wherein the flow sensor is arranged forcausing the detection means to oscillate in response to casing excitations, in substantiallythe same manner as the Coriolis-tube oscillates in response to casing excitations.
23. Coriolis flow sensor according to claim 22, wherein the resonance frequency and/or thedamping ratio are substantially equal for the Coriolis-tube and the compliant mounteddetection means.
24. Coriolis flow sensor according to claim 22, wherein the resonance frequency and/orthe damping ratio are lower for the internal mode of the tubewindow, compared to theresonance frequency and the damping ratio of the compliant mounted detection means.
25. Coriolis flow sensor according to claim 24, wherein the resonance frequency and/or thedamping ratio for the Coriolis-tube are approximately 90% of the resonance frequencyand the damping ratio of the compliant mounted detection means.
26. Coriolis flow sensor according to claim 22, wherein the resonance frequency and/or thedamping ratio is/are higher for the internal mode of the Coriolistube, compared to theresonance frequency and the damping ratio of the compliant mounted detection means.
27. Method for actively isolating vibrations in a flowsensor of the Coriolis type, preferablyin a Coriolis flow sensor according to one of claims 1-26, comprising a Coriolis flowtube and a reference mass that is connected thereto in a flexible manner, wherein themethod comprises the step of substantially fixing the position of the reference mass.
28. Method for actively isolating vibrations in a flowsensor of the Coriolis type, preferablyin a Coriolis flow sensor according to one of claims 1-26, comprising a Coriolis flowtube and a reference mass that is movable independently thereof, wherein the methodcomprises the step of substantially matching the dynamical behavior of the referencemass to the dynamical behavior of the Coriolis tube.

Dankwoord
Het is af! Na vier jaar werken heb ik de belangrijkste resultaten van mijn promotieonderzoekgepresenteerd in dit proefschrift. Dit heb ik echter niet alleen voor elkaar gekregen. Daaromwil ik iedereen bedanken die de afgelopen jaren bewust of onbewust heeft bijgedragen aanhet realiseren van het behaalde resultaat.
In het bijzonder wil ik mijn dagelijkse begeleiders Wouter en Johannes bedanken voor dewaardevolle bijdrage, de kritische opmerkingen, de discussies en jullie kennis die zorgdenvoor de diepgang van mijn onderzoek. Daarnaast wil ik André bedanken voor de tijd enmoeite die je hebt gestoken in het begeleiden van mijn promotie.
Ik wil Michel, Kyrian, Kees en Beralt bedanken voor hun inhoudelijke bijdrage aan hetonderzoek, de vele discussies en leergierigheid die zorgden voor vele nieuwe inzichten. Leo,bedankt voor het realiseren van de experimentele opstellingen die onmisbaar zijn geweest omde ideeën te kunnen valideren.
Een goede motivatie voor het wetenschappelijke onderzoek, was de blijvende interessevanuit de industrie. Bronkhorst High Tech, en met name Marcel, Joost en Wim, bedankt voorjullie betrokkenheid, het delen van actuele problemen en de implementatievraagstukken voornieuwe producten. Daarnaast wil ik ook Demcon bedanken voor de interesse en inhoudelijkekennis van het onderwerp.
Verder wil ik alle collega’s van de vakgroep WA bedanken voor hun hulp, interessante dis-cussies en de gezelligheid bij de koffiemomenten en de uitjes. Dit heeft zeker bijgedragen aanhet eindresultaat. Mijn vrienden en teamgenoten van Harambee bedankt voor alle gezelligeen sportieve momenten naast het werk.
Mijn vader, moeder, broer, zussen en verdere familie wil ik bedanken voor hun vertrouwen,liefde en steun. Zonder deze bron van motivatie was dit resultaat er nooit geweest.
Na 10 jaar aan de universiteit Twente kan ik nu eindelijk zeggen dat ik student-af ben. Hetis een einde van een leerzame periode, maar een mooi begin van een nieuwe uitdaging!
Bert van de Riddermei 2015, Enschede

Abstract: A Coriolis Mass-Flow Meter (CMFM) is an active device based on the Coriolis force principle for direct mass-flow measurements, with high accuracy, range-ability and repeatability. The working principle of a CMFM is as follows: a fluid conveying tube is actuated to oscillate at a low ampli-tude, whereby a resonance frequency is used to minimise the amount of re-quired energy. A fluid-flow in the vibrating tube induces Coriolis forces, which are proportional to the mass-flow, and affect the tube motion resulting in a change of the mode shape. External vibrations create additional components in the CMFM sensor signals and such additional components can introduce a measurement error. This thesis presents a comprehensive analysis on how narrow-band vibration isolation of more than 40 dB can be achieved. The active vibration isolation control is successfully implemented in a design of a CMFM, for the first time.
Bert van de Ridder was born on 22nd of April, 1987 in Putten, The Netherlands. After he finished second-ary school in 2005, he started with Mechanical Engi-neering at the University of Twente. He finished his Bachelor of Science cum laude in 2008. He contin-ued his study in the group of Mechanical Automation to obtain the Master of Science in 2011. In the same group he performed his PhD research and finished it in 2015. The results of the research project are pre-sented in this thesis.
ISBN 978-90-365-3874-9
Vib
ration
Isolatio
n fo
r Co
riolis M
ass-F
low
Me
ters
L. va
n d
e R
idd
er
Vibration Isolation for Coriolis Mass-Flow Meters
Bert van de RidderPhD Thesis
act
act
ss
aaaxy
z
Invitation
to the public defence of my PhD thesis, entitled
Vibration Isolation for Coriolis Mass-Flow
Meters
on Wednesday, June 24th 2015 at 16:30 in the prof.
dr. G. Berkhoff room, building Waaier of the University of Twente.
After the defence, there will be a reception.
Bert van de Ridder+31 (0)6 1654 0863
Paranymphs:
Gerrald GelderblomHenk-Jan van de Ridder