victorian population health survey 2001 - better...
TRANSCRIPT

Victorian PopulationHealth Survey 2001
Selected Findings
Victorian Population HealthSurvey 2001
Selected Findings
The Health Surveillance and Evaluation Section gratefully acknowledges the funding assistance provided by the Commonwealth Department of Health and Ageing for the Victorian Population Health Survey program.
Published by the Rural and Regional Health and Aged Care Services Division Victorian Government Department of Human Services Melbourne Victoria October 2002 © Copyright State of Victoria, Department of Human Services, 2002 This publication is copyright. No part may be reproduced by any process except in accordance with the provisions of the Copyright Act 1968. This document may also be downloaded from the Department of Human Services web site at: www.dhs.vic.gov.au/phd/healthsurveillance/ Contact details: Adrian Serraglio Tel: 03 9637 4308 Health Surveillance and Evaluation Section Email: [email protected]
iii
Contents
Foreword iv
1 The Victorian Population Health Survey 1
1.1 Methods 11.2 Stratification 11.3 Sampling Frame 21.4 Data Collection 31.5 Call Routine 31.6 Interviewing in Languages other than English 41.7 Fieldwork Period 41.8 Interview Length 41.9 Participation 41.10 Weighting 41.11 Profile of Survey Respondents 6
2 Health and Lifestyle 8
2.1 Fruit and Vegetable Intake 82.2 Physical Activity/Inactivity 102.3 Alcohol Consumption 102.4 Smoking 122.5 Health Care Use (Screening) 12References 16
3 Self-reported Health 17
3.1 Introduction 173.2 Survey Results 17References 19
4 Asthma Prevalence 20
4.1 Introduction 204.2 Survey Results 214.3 Past Asthma and Risk Factors 224.4 Current Asthma by Departmental Region 23References 24
5 Diabetes Prevalence 25
5.1 Introduction 255.2 Survey Results 255.3 Factors Influencing Doctor-diagnosed
Diabetes 265.4 Diabetes by Departmental Region 26References 28
6 Psychological Distress 29
6.1 Introduction 296.2 Methods 296.3 Survey Results 306.4 Use of Mental Health Services 30References 32
7 Access to Care and Propensity to Seek Care 33
7.1 Introduction 337.2 Survey Results: Access to Care 337.3 Survey Results: Propensity to Seek Care 347.4 Summary 34
Appendix
Victorian Population Health Survey 2001 Data Items 36
Attachments
I Exploring Mediators of Health Inequalities Using the Victorian Population Health Survey 2001Jeanette Pope, Adrian Serraglio and Loretta Vaughan 38
II Capitals and Indicators—Signposts to the FutureDavid Adams 48
Victorian Population Health Survey 2001
iv
The Department of Human Services’ work in the area of Public Health focuseson improving the health and wellbeing of whole populations. The department iscommitted to addressing social inequalities and the underlying determinants ofhealth, empowering families and communities, and using evidence-basedapproaches that ensure value for money.
The Health Surveillance and Evaluation Section of the department’s Rural andRegional Health and Aged Care Services Division aims to provide relevant andaccessible information on population health to a targeted audience of publichealth policy-makers and planners. This role involves implementing healthsurveillance strategies that facilitate the collection of data on health status andoutcomes, risk factors and intervention outcomes. The Victorian PopulationHealth Survey is one of several health surveillance strategies that the HealthSurveillance and Evaluation Section uses to collect information about the healthof the Victorian population.
The Victorian Population Health Survey program was established in 1998 toprovide State and regional information about the health of Victorians anddeterminants of that health. The survey followed an established method tocollect relevant, timely and valid health information to be applied to policydevelopment and strategic planning. Interviews were conducted in the majornon-English languages in Victoria to ensure people of culturally andlinguistically diverse backgrounds were represented.
Attachments I and II contain papers that discuss the use of the survey to exploremediators of health inequalities—namely, social capital and social networks.Information on social ties and social networks was collected for the first time aspart of the 2001 survey. The advantages of social ties and networks have beenreceiving increasing attention from health researchers in Australia, particularlyfrom those interested in examining remedies for the health inequalities reportedamong population groups.
Attachment I examines the survey results on social networks by socioeconomicstatus, rural/urban areas, health status and social attitudes. These resultsrepresent the start of a process for exploring appropriate survey questions onsocial capital and social networks. Attachment II presents a governmentperspective—that is, how governments can improve prosperity and wellbeingoutcomes for the population by improving levels of social capital and gaining abetter understanding of the new discourse about trust, identity, belonging,reciprocity and mutuality.
DR C W BROOKExecutive DirectorRural and Regional Health and Aged Care Services
Foreword
1
1.1 MethodsThe Victorian Population Health Survey 2001 followed a method developedover several years to collect relevant, timely and valid health information forpolicy-making, planning and decision-making. The survey team administeredcomputer-assisted telephone interviewing (CATI) of a representative sample ofpersons aged 18 years and over who resided in private dwellings in Victoria.The Department of Human Services Ethics Committee approved the surveymethod and questionnaire content.
The department outsourced the fieldwork data collection to a market researchorganisation, which department staff supervised. All data were self-reportedand stored directly in the CATI system.
Survey Design
Random digit dialling was used to generate a sample of telephone numbers thatformed the household sample for CATI. All residential households with land-line telephone connections were considered to be in-scope for the survey. Atelephonic mode of survey delivery excludes various population groups, suchas the homeless or itinerant, those persons in hospitals or institutions, the frailand aged, and those person having disabilities who are unable to participate inan interview.
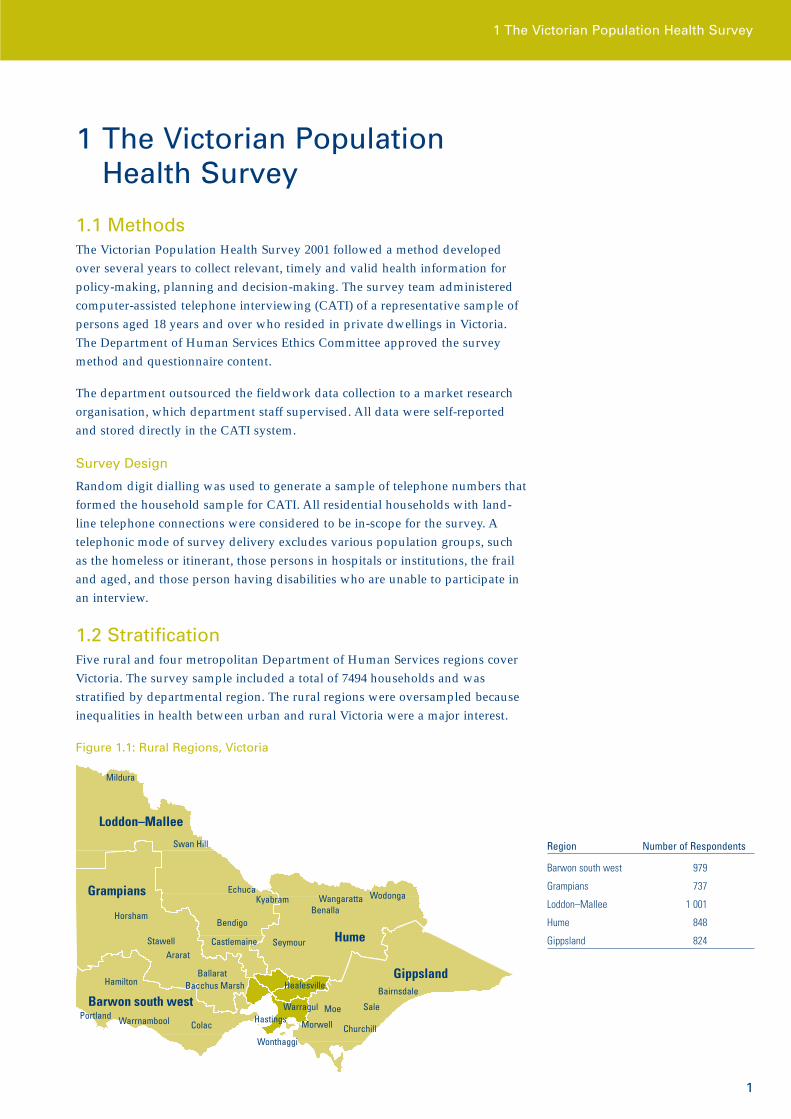
1.2 StratificationFive rural and four metropolitan Department of Human Services regions coverVictoria. The survey sample included a total of 7494 households and wasstratified by departmental region. The rural regions were oversampled becauseinequalities in health between urban and rural Victoria were a major interest.
Figure 1.1: Rural Regions, Victoria
1 The Victorian PopulationHealth Survey
Region Number of Respondents
Barwon south west 979
Grampians 737
Loddon–Mallee 1 001
Hume 848
Gippsland 824
Loddon–Mallee
Mildura
Swan Hill
Grampians
Horsham
StawellArarat
Hamilton
Barwon south westPortland Warrnambool Colac
BallaratBacchus Marsh
Wonthaggi
Morwell Churchill
Moe Sale
Bairnsdale
Gippsland
HastingsWarragul
Healesville
Seymour Hume
BenallaWangaratta WodongaKyabram
Echuca
Bendigo
Castlemaine
1 The Victorian Population Health Survey
Victorian Population Health Survey 2001
2
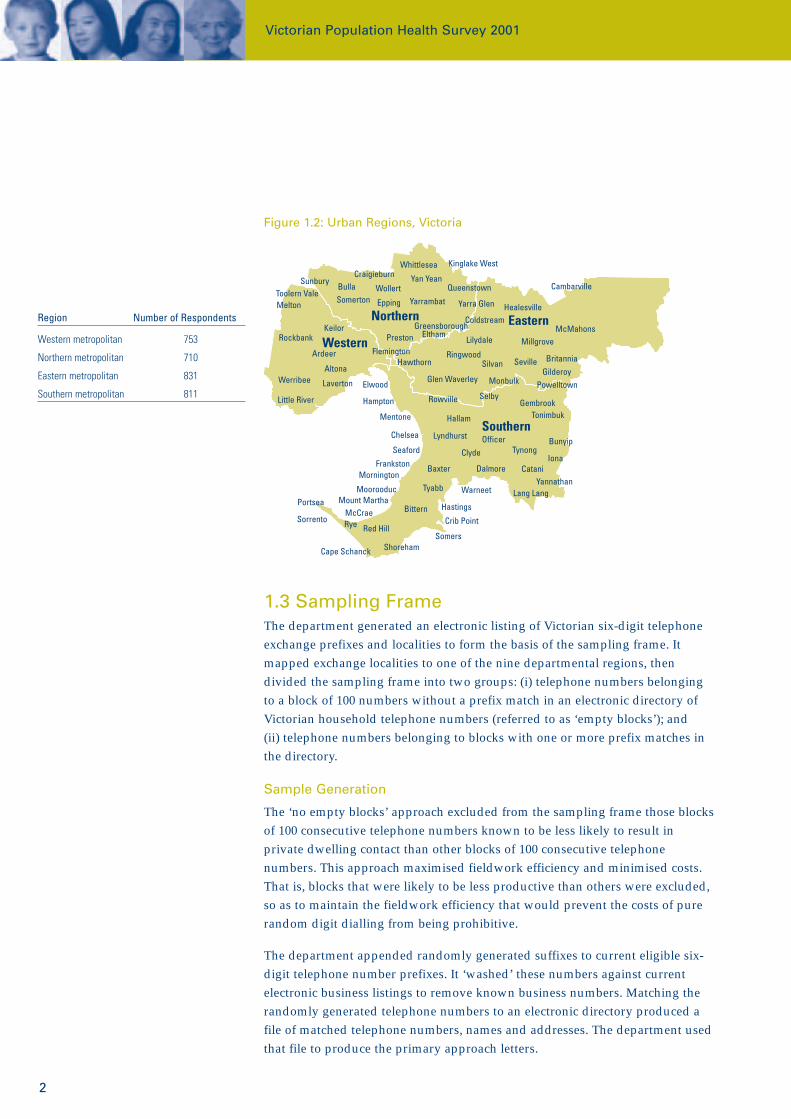
Figure 1.2: Urban Regions, Victoria
1.3 Sampling Frame The department generated an electronic listing of Victorian six-digit telephoneexchange prefixes and localities to form the basis of the sampling frame. Itmapped exchange localities to one of the nine departmental regions, thendivided the sampling frame into two groups: (i) telephone numbers belongingto a block of 100 numbers without a prefix match in an electronic directory ofVictorian household telephone numbers (referred to as ‘empty blocks’); and (ii) telephone numbers belonging to blocks with one or more prefix matches inthe directory.
Sample Generation
The ‘no empty blocks’ approach excluded from the sampling frame those blocksof 100 consecutive telephone numbers known to be less likely to result inprivate dwelling contact than other blocks of 100 consecutive telephonenumbers. This approach maximised fieldwork efficiency and minimised costs.That is, blocks that were likely to be less productive than others were excluded,so as to maintain the fieldwork efficiency that would prevent the costs of purerandom digit dialling from being prohibitive.
The department appended randomly generated suffixes to current eligible six-digit telephone number prefixes. It ‘washed’ these numbers against currentelectronic business listings to remove known business numbers. Matching therandomly generated telephone numbers to an electronic directory produced afile of matched telephone numbers, names and addresses. The department usedthat file to produce the primary approach letters.
Region Number of Respondents
Western metropolitan 753
Northern metropolitan 710
Eastern metropolitan 831
Southern metropolitan 811
Northern
Yan Yean
Kinglake WestWhittlesea
Toolern Vale
CraigieburnSunbury
BullaSomerton Epping
WollertYarrambat
Queenstown
Yarra Glen
GreensboroughElthamPreston
Eastern
Cambarville
Healesville
McMahonsMillgrove
BritanniaGilderoy
Seville
Coldstream
Lilydale
RingwoodSilvan
Glen Waverley
Hawthorn
Gembrook
Monbulk
Tonimbuk
Selby
Bunyip
Southern
IonaTynong
CataniYannathan
Lang Lang
Officer
Hallam
Rowville
Lyndhurst
Clyde
Dalmore
Warneet
Hastings
Crib Point
SomersShorehamCape Schanck
RyeSorrento
Portsea
Red Hill
McCraeMount Martha
Moorooduc
Mornington
Bittern
Tyabb
BaxterFrankston
Seaford
Chelsea
Mentone
Hampton
Elwood
Little River
Werribee Laverton
Altona
ArdeerWesternKeilor
Rockbank
Melton
Powelltown
Flemington
3
Primary Approach Letter
Primary approach letters were mailed to all households where the randomlyselected telephone number matched a listing in an electronic directory ofVictorian household telephone numbers. A total of 13,262 primary approachletters were mailed. The letter informed the households that the departmentwas conducting the Victorian Population Health Survey to collect informationabout health, lifestyles and wellbeing in the community, and outlined theimportance of the survey. It also introduced market research company NCS Pearson Pty Ltd as the agency appointed to conduct the survey.
After contacting a household, an interviewer would select for interview theperson (usually a resident) aged 18 years and over with the most recentbirthday. Seventy-five per cent of the 7494 interviews conducted were from thematched sample. The proportion of interviews from the unmatched sample washigher in the metropolitan areas (33 per cent) than in the rural areas (19 percent).
Call outcomes from the unmatched sample were characterised by:• A lower proportion of interviews as eligible telephone numbers.• A higher proportion of noncontacts from eligible telephone numbers.• A higher refusal rate as a proportion of in-scope contacts.• A higher proportion of numbers reaching the end of the call cycle without
result.
Throughout the survey period, the department operated a 1800 number, whichwas identified in the primary approach letter. Individuals contacted about thesurvey could call this number for further information. The majority of callsreceived were to arrange an interview time or to verify the nature of the survey.
1.4 Data CollectionThe interviewers achieved over two-thirds of completed interviews within thefirst three calls. This proportion is consistent with national experience on similarprojects. A group of more experienced interviewers were chosen for refusalconversions to increase the participation of selected respondents in the survey.This effort ensured respondents were a more representative sample of thepopulation.
1.5 Call RoutineThe interviewers made up to six call attempts to establish contact with ahousehold and up to a another nine call attempts to complete an interviewwhere required. Further attempts were made only when there was a clearopportunity for interview at the end of the fifteenth call. Over two-thirds ofinterviews were achieved within the first three calls.
1 The Victorian Population Health Survey

Victorian Population Health Survey 2001
4
Call attempts were spread over different times of the day and different days ofthe week, and were controlled by a customised call algorithm in the surveymanagement system. Except for engaged numbers at the first call attempt, anoncontact in any specific time block was automatically scheduled for call backin a different time block as per the call back routine. A scripted message was leftat the first call and second call to an answering machine, encouragingrespondents to contact the 1800 number. After establishing contact, interviewerscould make calls, by appointment, outside the time block hours.
1.6 Interviewing in Languages other than EnglishThe interviewing used six community languages. An external agency translatedquestionnaires into Mandarin, Cantonese, Vietnamese, Italian, Greek andMacedonian. CATI interviewers were recruited to undertake the interviews inthese other languages as required. Respondents who received a primaryapproach letter, which was also translated into these languages, could nominateto be interviewed in their preferred language.
1.7 Fieldwork PeriodThe main survey interviewing was during August–November 2001 over11 weeks. This followed two pilot tests of the questionnaire during June–July2001, a debriefing of interviewers and the modification of the questionnaire asrequired.
1.8 Interview LengthThe average interview length was 20.1 minutes. This is considered close to themaximum length for a telephone survey of this nature before response rates arejeopardised.
1.9 ParticipationThe participation rate, defined as the proportion of households where contactwas made and an interview was then completed, was 69.3 per cent.
1.10 WeightingThe department’s project team weighted the survey data to reflect (i) theprobability of selection of the respondent within the household and (ii) theage/sex/geographic distribution of the population. Although a singlerespondent was randomly selected from within a household, the size of anyhousehold can vary upwards from one person. To account for this variation, theproject team treated each respondent as representing the whole household, sohis or her weight factor includes a multiplier of the number of persons in thehousehold.
Figure 1.3: Completed Interviews,by Number of Calls
1 2 3 4 5 6 7 8 9 10 11 12plus
0
5
10
15
20
25
30%
Call number
5
Further, a household may have more than one telephone line (that is, land linesused primarily for contact with the household), which would increase thathousehold’s probability of selection over those households with only onetelephone line. To ensure the probability of contacting any household is thesame, the project team divided the weight factor by the number of telephonelines connected to the household. The formula for this component is: nah/npl, where:
nah = the number of adults aged 18 years and over in the household.
npl = the number of telephone lines in the household.
Population Benchmark Components
Further to the selection weight component, the project team applied apopulation benchmark component to ensure the adjusted sample distributionmatches the population distribution for the combined cross-cells of age groupand gender by region (for example, males aged 18–24 years in Barwon southwest). The categories used for each of the variables were:
• Age groups: 18–24 years, 25–34 years, 35–44 years, 45–54 years, 55–64 yearsand 65 years and over
• Sex: Male and Female
• Regions: Barwon south west, Grampians, Loddon–Mallee, Hume, Gippsland,eastern metropolitan, northern metropolitan, western metropolitan andsouthern metropolitan.
The department’s project team calculated the population benchmark componentby dividing the population of each cross-cell by the sum of the selection weightcomponents for all the respondents in the sample within that cross-cell. For eachcross-cell, the formula for this component is:
pbmarki = Ni/∑swij
where:
i = the ith cross-cell
j = the jth person in the cross-cell
Ni = the population of the ith cross-cell
∑swij = the sum of selection weights for all respondents (1 through to j) in the ith cross-cell.
1 The Victorian Population Health Survey

Victorian Population Health Survey 2001
6
Calculating the Person Weight to Be Applied
The project team assigned respondent records a weight factor (pwt) bymultiplying the selection weight value (sw) by the population benchmark value(pbmark):
pwtij = swij * pbmark
where:
i = the ith cross-cell
j = the jth person in the cross-cell.
1.11 Profile of Survey RespondentsKnown population benchmarks for selected data items may be used to assessthe representativeness of the sample. Table 1.1 shows the benchmark data andweighted and unweighted estimates obtained form the survey.
A comparison of benchmark and survey data indicates that:
• Females were more likely than males to participate in the survey.
• Persons younger than 65 years were less likely to participate than personsaged 65 years and over.
• Persons born in Australia were more likely to participate than those bornoverseas, perhaps as a result of those who do not speak English or any of thesix languages offered for the interview.
• The survey included a higher proportion of persons not in the labour forceand those having private health insurance.

7
Table 1.1: Profile of Respondents in the 2001 Victorian Population Health Survey
Survey EstimateUsing Probability
Benchmark Survey of Selection 95% ConfidenceSelected Characteristics Data (%) Outcome (%) Weights (%) Interval (%)
Sex i
Male 48.8 39.9 48.8 (47.2–50.3)
Female 51.2 60.1 51.2 (49.7–52.8)
Age group i
18–24 years 12.9 9.4 12.9 (11.7–14.0)
25–34 years 20.1 17.9 20.1 (18.8–21.4)
35–44 years 19.9 22.9 19.9 (18.8–21.0)
45–54 years 17.8 18.3 17.8 (16.6–19.1)
55–64 years 12.3 13.5 12.3 (11.4–13.3)
65 years and over 16.9 18.1 16.9 (15.8–18.0)
Marital status ii
Married 56.9 53.8 57.6 (56.1–59.1)
Widowed 7.0 8.6 5.5* (5.0–6.1)
Divorced 6.1 7.8 5.3* (4.7–5.9)
Separated 3.3 4.3 2.5* (2.1–2.9)
Never married 26.7 17.9 21.2 (19.9–22.6)
Living with a partner n.a. 7.3 7.6 (6.8–8.4)
Country of birth iii
Australia 68.2 79.8 73.4** (72.7–74.1)
Labour force status iv
Employed 59.6 (58.8–60.4) 55.6 57.5 (56.8–59.0)
Unemployed 3.8 (3.6–4.0) 3.4 3.4 (2.8–4.0)
Not in the labour force 36.6 (36.0–37.1) 41.0 39.1** (37.6–40.6)
Private health insurance v
Yes 44.8 48.2 50.6** (49.1– 52.2)
i Persons aged 18 years and over. Victorian Department of Infrastructure. Population Projections 2001. Melbourne: 2001.ii Australian Bureau of Statistics 1996 Census. (‘Never married’ category is not directly comparable between the Census and the
Victorian Population Health Survey 2001 because the latter collected the extra category of ‘living with a partner’.iii Australian Bureau of Statistics 2001 Census.n.a. Not available.iv Australian Bureau of Statistics. Labour Force, Victoria, August 2001. cat. no. 6202.2. Canberra: AusInfo, 2001.
Persons aged 15 years and over.v Private Health Insurance Administration Council. www.phiac.gov.au. Melbourne: June 2001.* Survey estimate was significantly lower than benchmark estimate (p < 0.05).** Survey estimate was significantly higher than benchmark estimate (p < 0.05).Notes: 95 per cent confidence intervals are provided for benchmark data where available. The survey sample was allocated a 60 per cent/40 per cent rural/urban split respectively and selected benchmark characteristics are for the whole of Victoria.
1 The Victorian Population Health Survey

Victorian Population Health Survey 2001
8
This section provides descriptive output from the Victorian Population HealthSurvey 2001 for: 1. Fruit and vegetable intake 2. Physical activity 3. Smoking4. Health care use (screening).
2.1 Fruit and Vegetable IntakeThe consumption of fruit and vegetables has been identified as a risk factor inthe development of a range of chronic diseases, including coronary heartdisease, stroke and many forms of cancer. The Victorian Burden of DiseaseStudy1 estimates that 2.8 per cent of total disability-adjusted life years (DALYs)may be attributed to inadequate fruit and vegetable intake. This contributionexceeds that made by alcohol (2.1 per cent), illicit drugs (1.9 per cent), unsafesex (0.8 per cent) and occupational hazards and exposures (1.7 per cent).
The Victorian Population Health Survey 2001 found that relatively fewVictorians consume the seven daily serves of fruit and vegetables considerednecessary to obtain optimal health benefits. Only 23.2 per cent of personsusually consumed four or more serves of vegetables daily, with females(29.0 per cent) more likely than males (17.2 per cent) to do so (Table 2.1).
Table 2.1: Daily Vegetable Consumption
Serves of Vegetables Males Females PersonsEaten Each Day* % SE % SE % SE
One serve or less 34.1 0.011 20.6 0.008 27.2 0.007
Two to three serves 47.7 0.012 49.7 0.010 48.7 0.008
Four to five serves 13.4 0.008 24.2 0.008 18.9 0.006
Six or more serves 3.8 0.005 4.8 0.004 4.3 0.003
Don’t eat vegetables 1.0 0.003 0.7 0.002 0.9 0.002
* A ‘serve’ is a half cup of cooked vegetables or a cup of salad vegetables.SE = standard error.
Older persons were found to be the largest consumers of vegetables, with25.8 per cent of males aged 65 years and over and 38.3 per cent of females in thesame age group consuming four or more serves daily (Figure 2.1). Males aged18–34 years, and females aged 18–24 years were the most likely to report a verylow vegetable intake, with 41.3 per cent and 33.6 per cent respectivelyconsuming one serve or less daily.
Fifty-six per cent of persons reported consuming two or more serves of fruit ona usual day, with females again more likely (63.0 per cent) than males (49.4 percent) to consume this amount (Table 2.2).
2 Health and Lifestyle
Figure 2.1: Daily VegetableConsumption, by Age and Sex
0–1 serves 2–3 serves4–5 serves 6+ serves
0
20
40
60
80
100%
Don’t eat vegetables
Male
s 18–
24Fe
males 1
8–24
Male
s 25–
34Fe
males
25–3
4M
ales 3
5–44
Female
s 35-
44M
ales 4
5–54
Fema
les 45
–54
Male
s 55–
64Fe
males 5
5–64
Male
s 65+
Female
s 65+
9
Table 2.2: Daily Fruit Consumption
Serves of Fruit Males Females PersonsEaten Each Day* % SE % SE % SE
One serve or less 44.7 0.012 33.5 0.009 38.9 0.008
Two to three serves 40.0 0.012 51.5 0.010 45.9 0.008
Four to five serves 7.1 0.006 9.3 0.006 8.2 0.004
Six or more serves 2.3 0.004 2.2 0.003 2.3 0.003
Don’t eat fruit 5.9 0.005 3.5 0.004 4.7 0.003
* A ‘serve’ is one medium piece or two small pieces of fruit, or one cup of diced pieces.SE = standard error.
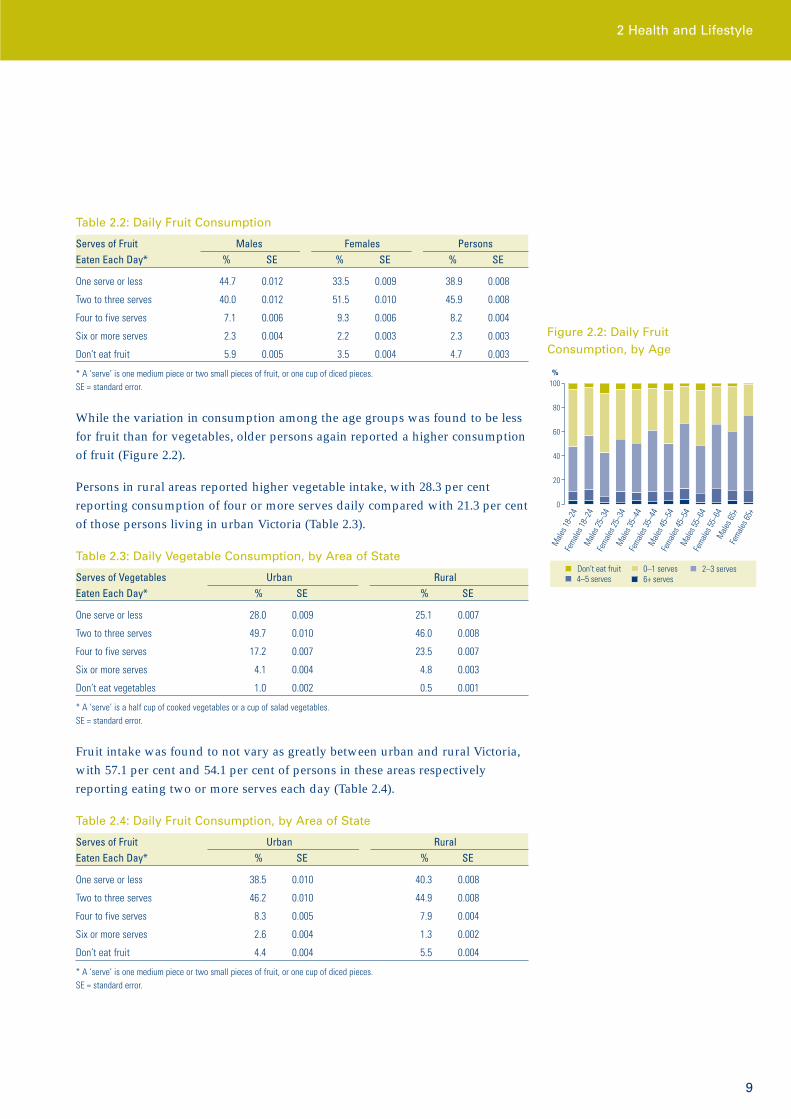
While the variation in consumption among the age groups was found to be lessfor fruit than for vegetables, older persons again reported a higher consumptionof fruit (Figure 2.2).
Persons in rural areas reported higher vegetable intake, with 28.3 per centreporting consumption of four or more serves daily compared with 21.3 per centof those persons living in urban Victoria (Table 2.3).
Table 2.3: Daily Vegetable Consumption, by Area of State
Serves of Vegetables Urban RuralEaten Each Day* % SE % SE
One serve or less 28.0 0.009 25.1 0.007
Two to three serves 49.7 0.010 46.0 0.008
Four to five serves 17.2 0.007 23.5 0.007
Six or more serves 4.1 0.004 4.8 0.003
Don’t eat vegetables 1.0 0.002 0.5 0.001
* A ‘serve’ is a half cup of cooked vegetables or a cup of salad vegetables.SE = standard error.
Fruit intake was found to not vary as greatly between urban and rural Victoria,with 57.1 per cent and 54.1 per cent of persons in these areas respectivelyreporting eating two or more serves each day (Table 2.4).
Table 2.4: Daily Fruit Consumption, by Area of State
Serves of Fruit Urban RuralEaten Each Day* % SE % SE
One serve or less 38.5 0.010 40.3 0.008
Two to three serves 46.2 0.010 44.9 0.008
Four to five serves 8.3 0.005 7.9 0.004
Six or more serves 2.6 0.004 1.3 0.002
Don’t eat fruit 4.4 0.004 5.5 0.004
* A ‘serve’ is one medium piece or two small pieces of fruit, or one cup of diced pieces.SE = standard error.
Figure 2.2: Daily FruitConsumption, by Age
%
Don’t eat fruit 0–1 serves 2–3 serves4–5 serves 6+ serves
0
20
40
60
80
100
Male
s 18–
24Fe
males 1
8–24
Male
s 25–
34Fe
males 2
5–34
Male
s 35–
44Fe
males 3
5–44
Male
s 45–
54Fe
males 4
5–54
Male
s 55–
64Fe
males 5
5–64
Male
s 65+
Female
s 65+
2 Health and Lifestyle
Victorian Population Health Survey 2001
10
2.2 Physical Activity/InactivityPhysical inactivity acts as a determinant of ill health, together with othersignificant risk factors such as obesity, high blood pressure and high bloodcholesterol levels. The Victorian Burden of Disease Study1 estimated that 6.6 percent of total DALYs are attributable to physical inactivity, with two-thirds of thisburden due to the increased risk of cardiovascular disease in inactive persons.Older persons are particularly subject to the risk posed by physical inactivity.
The National Physical Activity Guidelines2 define 30 minutes of moderateexercise taken on most days as a sufficient level of activity to generate a range ofhealth benefits. With ‘most’ generally interpreted to be five days each week, anactivity needs to be at least 10 minutes at a time to be included in the daily total.The benefits of this level of activity include the reduced risk of developingcardiovascular disease, diabetes mellitus and colon cancer, as well asimprovements in musculoskeletal and mental or psycho-social health.3
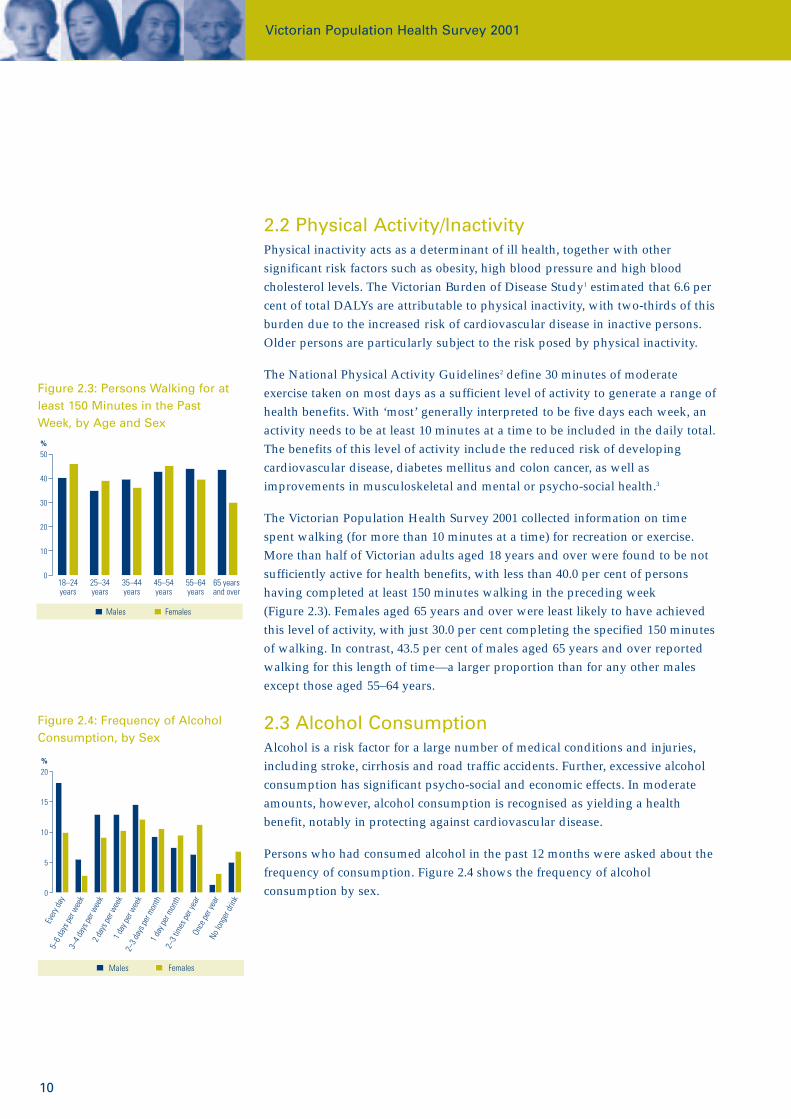
The Victorian Population Health Survey 2001 collected information on timespent walking (for more than 10 minutes at a time) for recreation or exercise.More than half of Victorian adults aged 18 years and over were found to be notsufficiently active for health benefits, with less than 40.0 per cent of personshaving completed at least 150 minutes walking in the preceding week(Figure 2.3). Females aged 65 years and over were least likely to have achievedthis level of activity, with just 30.0 per cent completing the specified 150 minutesof walking. In contrast, 43.5 per cent of males aged 65 years and over reportedwalking for this length of time—a larger proportion than for any other malesexcept those aged 55–64 years.
2.3 Alcohol ConsumptionAlcohol is a risk factor for a large number of medical conditions and injuries,including stroke, cirrhosis and road traffic accidents. Further, excessive alcoholconsumption has significant psycho-social and economic effects. In moderateamounts, however, alcohol consumption is recognised as yielding a healthbenefit, notably in protecting against cardiovascular disease.
Persons who had consumed alcohol in the past 12 months were asked about thefrequency of consumption. Figure 2.4 shows the frequency of alcoholconsumption by sex.
Figure 2.3: Persons Walking for atleast 150 Minutes in the PastWeek, by Age and Sex
%
FemalesMales
18–24years
25–34years
35–44years
45–54years
55–64years
65 yearsand over
0
10
20
30
40
50
Figure 2.4: Frequency of AlcoholConsumption, by Sex
%
FemalesMales
0
5
10
15
20
Ever
y day
5–6 d
ays p
er w
eek
3–4 d
ays p
er w
eek
2 day
s per
wee
k1 d
ay pe
r wee
k2–
3 day
s per
mon
th1 d
ay pe
r mon
th2–
3 tim
es pe
r yea
rOn
ce pe
r yea
rNo
long
er dr
ink
11
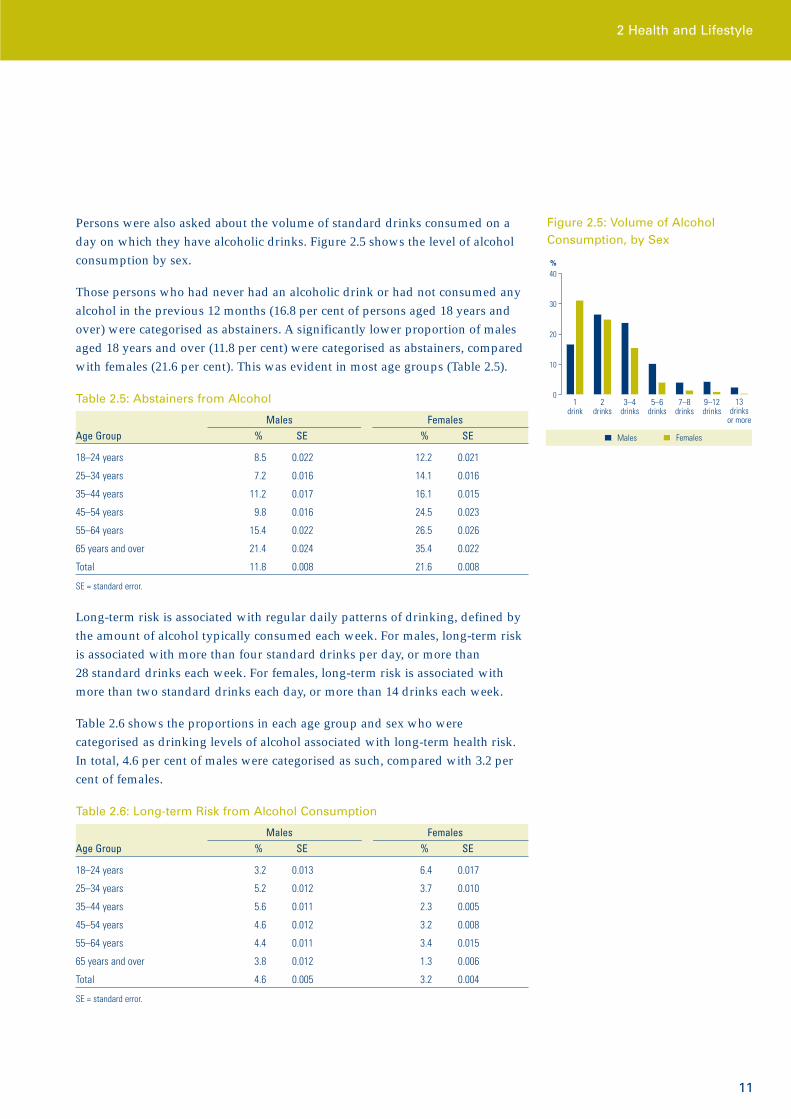
Persons were also asked about the volume of standard drinks consumed on aday on which they have alcoholic drinks. Figure 2.5 shows the level of alcoholconsumption by sex.
Those persons who had never had an alcoholic drink or had not consumed anyalcohol in the previous 12 months (16.8 per cent of persons aged 18 years andover) were categorised as abstainers. A significantly lower proportion of malesaged 18 years and over (11.8 per cent) were categorised as abstainers, comparedwith females (21.6 per cent). This was evident in most age groups (Table 2.5).
Table 2.5: Abstainers from Alcohol
Males FemalesAge Group % SE % SE
18–24 years 8.5 0.022 12.2 0.021
25–34 years 7.2 0.016 14.1 0.016
35–44 years 11.2 0.017 16.1 0.015
45–54 years 9.8 0.016 24.5 0.023
55–64 years 15.4 0.022 26.5 0.026
65 years and over 21.4 0.024 35.4 0.022
Total 11.8 0.008 21.6 0.008
SE = standard error.
Long-term risk is associated with regular daily patterns of drinking, defined bythe amount of alcohol typically consumed each week. For males, long-term riskis associated with more than four standard drinks per day, or more than28 standard drinks each week. For females, long-term risk is associated withmore than two standard drinks each day, or more than 14 drinks each week.
Table 2.6 shows the proportions in each age group and sex who werecategorised as drinking levels of alcohol associated with long-term health risk.In total, 4.6 per cent of males were categorised as such, compared with 3.2 percent of females.
Table 2.6: Long-term Risk from Alcohol Consumption
Males FemalesAge Group % SE % SE
18–24 years 3.2 0.013 6.4 0.017
25–34 years 5.2 0.012 3.7 0.010
35–44 years 5.6 0.011 2.3 0.005
45–54 years 4.6 0.012 3.2 0.008
55–64 years 4.4 0.011 3.4 0.015
65 years and over 3.8 0.012 1.3 0.006
Total 4.6 0.005 3.2 0.004
SE = standard error.
Figure 2.5: Volume of AlcoholConsumption, by Sex
%
FemalesMales
1drink
2drinks
3–4drinks
5–6drinks
7–8drinks
9–12drinks
13drinks
or more
0
10
20
30
40
2 Health and Lifestyle

Victorian Population Health Survey 2001
12
2.4 SmokingAmong recognised risk factors for disease, tobacco imposes the greatest burdenon the health of Victorians, accounting for 9.8 per cent of total DALYs.1 Overhalf of all persons aged 18 years and over (51.3 per cent) were found to havesmoked tobacco products at some point in their lives, while approximately24.5 per cent (or one in four persons) identified themselves as current smokers(Table 2.7).
Across all age groups, females were less likely to report having smoked at sometime, with this divergence widening for the older age groups. Males were morelikely to identify themselves as current smokers for every age group exceptthose aged 55–64 years; males aged 18–24 years were found to be most likely tobe current smokers (Figure 2.7). Among females, those aged 18–34 years werefound to be most likely to be current smokers (Figure 2.6). For all persons, theproportion identifying themselves as current smokers was found to decline withincreasing age.
Table 2.7: Smoking Status
Males FemalesCurrent Smoker Ex-smoker* Nonsmoker Current smoker Ex-smoker* Nonsmoker
Age Group % SE % SE % SE % SE % SE % SE
18–24 years 44.2 0.036 6.6 0.016 49.2 0.036 27.6 0.027 10.2 0.018 62.2 0.030
25–34 years 37.0 0.028 17.4 0.023 45.6 0.029 27.6 0.020 24.0 0.019 48.3 0.022
35–44 years 33.4 0.023 27.2 0.021 39.4 0.024 25.8 0.018 26.9 0.017 47.4 0.020
45–54 years 24.8 0.024 35.5 0.028 39.8 0.028 18.6 0.018 23.8 0.021 57.6 0.024
55–64 years 17.2 0.022 47.1 0.031 35.7 0.030 18.3 0.024 25.6 0.026 56.1 0.030
65 years and over 8.7 0.016 53.3 0.029 37.9 0.029 8.2 0.013 25.6 0.021 66.2 0.022
Total 28.3 0.011 30.4 0.011 41.4 0.012 20.9 0.008 23.3 0.008 55.8 0.010
* Ex-smokers are those persons who have smoked 100 cigarettes or the equivalent amount of tobacco in their lifetime.SE = standard error.
2.5 Health Care Use (Screening)The Victorian Population Health Survey 2001 collected information on variouscheck-ups or tests undertaken (screening) within the previous two-yearperiod—specifically, (i) a blood pressure test, (ii) a cholesterol test, (iii) a bloodglucose test, (iv) a bowel examination, (v) a skin examination, (vi) amammogram, (vii) a pap smear test, (viii) a prostate check and (ix) a dentalcheck-up. Such procedures are vital to the early detection of a range of healthconditions, facilitating more effective treatment and ultimately more acceptableoutcomes.
Figure 2.6: Smoking Status—Females, by Age
%
Former Current
18–24years
25–34years
35–44years
45–54years
55–64years
65 yearsand over
0
10
20
30
40
50
60
Figure 2.7: Smoking Status—Males, by Age
%
Former Current
18–24years
25–34years
35–44years
45–54years
55–64years
65 yearsand over
0
10
20
30
40
50
60
70

13
Blood Pressure Checks
It is recommended that all adults have their blood pressure checked regularly,primarily to identify high blood pressure or hypertension. Over one in fourpersons (26.4 per cent) reported being told by a doctor at some time that theyhad high blood pressure.
In total, 78.8 per cent of persons were found to have had their blood pressurechecked in the past two years. Those aged 50 years and over were found to bemore likely than others to have had the test recently, with 93.0 per cent of malesand 93.7 per cent of females in this age group having done so (Figure 2.8). Inthose persons aged 18 years to less than 50 years, females were found to bemore likely than males to have had their blood pressure checked.
Cholesterol Screening
Given that elevated blood cholesterol is an important risk factor for coronaryartery disease, all adults are advised to have their blood cholesterol levelschecked occasionally (every two to five years).4
In total, 45.8 per cent of persons reported having had a cholesterol check in thepast two years. Screening was again found to be higher for those aged 50 yearsand over than for others, with 77.3 per cent of males and 68.1 per cent offemales in this age group having undergone a recent cholesterol check(Figure 2.9). Among those aged under 50 years, males were more likely thanfemales to have had a cholesterol check.
Blood Sugar Test
Blood glucose tests are primarily used to detect the development of, or apredisposition to the development of, diabetes mellitus. While populationscreening is generally not considered justified, it is recommended that at-riskindividuals have their blood glucose levels periodically checked.5 These at-riskgroups include those persons aged over 55 years, overweight persons, thosewith a first-degree relative with diabetes, and women with previous gestationaldiabetes.
In total, 44.8 per cent of persons reported having had a test for diabetes or highblood sugar levels in the past two years. The proportion to have undergone theprocedure was highest for males aged 50 years and over, followed by females ofthe same age group (Figure 2.10). Males aged 18 years to less than 50 years wereleast likely to have had the blood glucose test.
Figure 2.8: Blood Pressure Checksin Past Two Years, by Age and Sex
%
Males<50 years
Females<50 years
Males50+ years
Females 50+ years
0
20
40
60
80
100
Figure 2.9: Cholesterol Checks inPast Two Years, by Age and Sex
%
Males<50 years
Females<50 years
Males50+ years
Females 50+ years
0
20
40
60
80
100
Figure 2.10: Glucose Checks in PastTwo Years, by Age and Sex
%
Males<50 years
Females<50 years
Males50+ years
Females50+ years
0
10
20
30
40
50
60
70
80
2 Health and Lifestyle
Victorian Population Health Survey 2001
14
Bowel Examination
Bowel examinations are used to detect bowel or colorectal cancer, and may takethe form of an x-ray of the bowel (barium enema), an examination of the lowerbowel via a rigid or flexible tube (sigmoidoscopy or colonoscopy) or anexamination of faecal samples (faecal occult blood test). CommonwealthGovernment guidelines recommend a faecal occult blood test every two yearsfor asymptomatic individuals aged 50 years and over, as well as a flexiblesigmoidoscopy every five years.6
In total, 14.5 per cent of persons aged 18 years and over reported having had abowel examination in the past two years (Table 2.8). There was no significantdifference between the proportions of males and females having had a bowelexamination.
Table 2.8: Bowel Examinations in Past Two Years
Age Group18–49 Years 50 Years and over Total% SE % SE % SE
Males 9.1 0.009 28.3 0.017 16.0 0.009
Females 8.0 0.007 20.7 0.013 13.0 0.007
Persons 8.5 0.006 24.2 0.011 14.5 0.006
SE = standard error.
Skin Examination
Each Australian should be regularly checking his or her skin surface with thehelp of a mirror or family member. To check every new season is an easy way ofremembering.7 Such checks are particularly important for those aged 50 yearsand over.
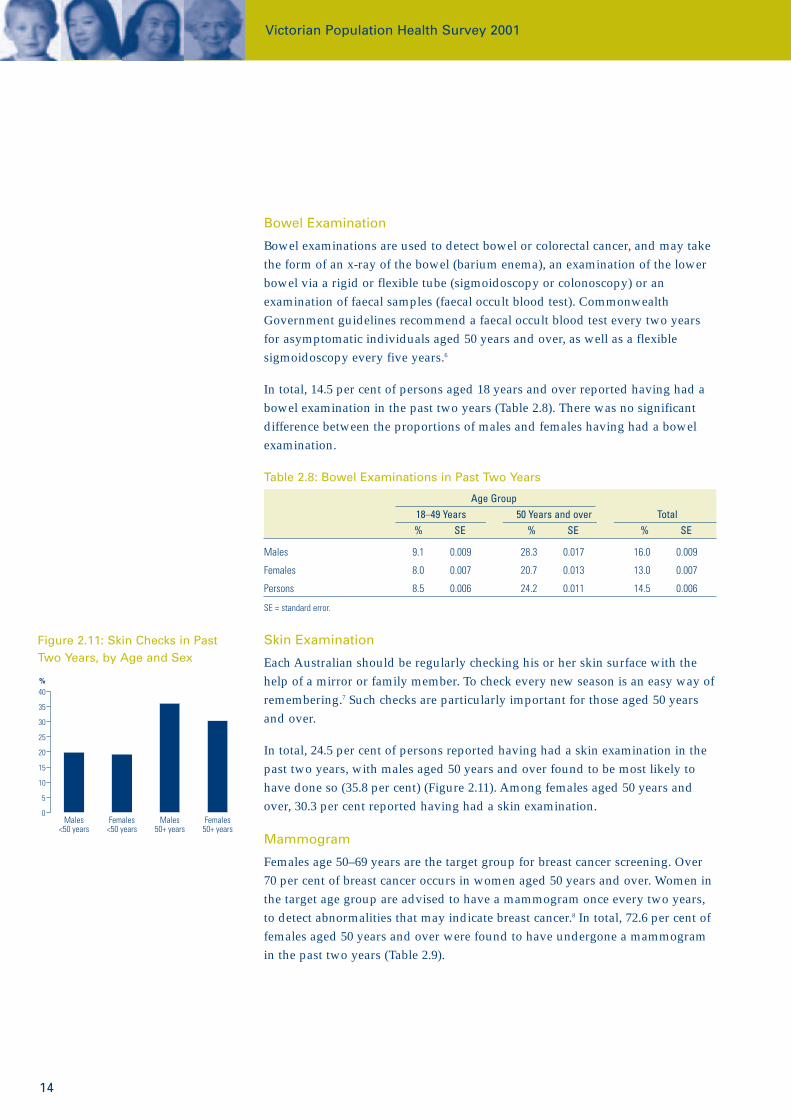
In total, 24.5 per cent of persons reported having had a skin examination in thepast two years, with males aged 50 years and over found to be most likely tohave done so (35.8 per cent) (Figure 2.11). Among females aged 50 years andover, 30.3 per cent reported having had a skin examination.
Mammogram
Females age 50–69 years are the target group for breast cancer screening. Over70 per cent of breast cancer occurs in women aged 50 years and over. Women inthe target age group are advised to have a mammogram once every two years,to detect abnormalities that may indicate breast cancer.8 In total, 72.6 per cent offemales aged 50 years and over were found to have undergone a mammogramin the past two years (Table 2.9).
Figure 2.11: Skin Checks in PastTwo Years, by Age and Sex
%
Males<50 years
Females<50 years
Males50+ years
Females50+ years
0
5
10
15
20
25
30
35
40

15
Pap Smear Test
All women who have ever been sexually active are advised to have pap smearsevery two years until they are at least 70 years old.9 In total, 61.5 per cent offemales reported having had a pap smear test in the past two years. Femalesaged 18 years to less than 50 years were more likely than older females to havedone so (Table 2.9).
Table 2.9: Pap Smear and Mammogram Test in Past Two Years
Females18–49 Years 50 Years and over 18 Years and over
Test % SE % SE % SE
Mammogram 17.0 0.010 72.6 0.014 38.0 0.010
Pap smear test 68.4 0.012 51.1 0.016 61.5 0.010
SE = standard error.
Prostate Check
While mass prostate cancer screening of asymptomatic males is not currentlyrecommended in Australia, procedures including the digital rectal examinationand the prostate specific antigen blood test may be suggested to indicateproblems with the prostate gland in males aged 50 years and over. In total,52.8 per cent of males aged 50 years and over reported having had a prostatecheck (including blood tests) in the past two years (Table 2.10).
Table 2.10: Prostate Check in Past Two Years
Males18–49 Years 50 Years and over 18 Years and over% SE % SE % SE
Prostate check 10.2 0.009 52.8 0.019 25.5 0.010
SE = standard error.
Dental Check
All age groups are recommended to have regular dental checks (at least everytwo years) to maintain healthy teeth and gums.10 In total, 63.4 per cent ofpersons reported having had a dental check in the past two years, with femalesmore likely than males to have accessed the service. Fewer persons aged50 years and over than younger persons reported having had a dental check(Figure 2.12).
Figure 2.12: Dental Checks in PastTwo Years, by Age and Sex
%
Males<50 years
Females<50 years
Males50+ years
Females50+ years
0
10
20
30
40
50
60
70
80
2 Health and Lifestyle

Victorian Population Health Survey 2001
16
References1. Vos ET, Begg SJ. The Victorian burden of disease study. Melbourne:
Department of Human Services Victoria, 1999.
2. Commonwealth Department of Health and Aged Care. National physicalactivity guidelines for Australians. Canberra: AusInfo, 1999.
3. US Department of Health and Human Services. Physical activity and health:a report of the Surgeon General. Atlanta, Georgia: US Department of Healthand Human Services, Centres for Disease Control and Prevention, andNational Centre for Chronic Disease Prevention and Health Promotion, 1996.
4. Pattison AD. Common consultations. Melbourne: Harper Collins, 1995.
5. National Health and Medical Research Council. National evidence basedguidelines for the measurement of type 2 diabetes mellitus. Canberra:AusInfo, 2002.
6. National Health and Medical Research Council. Guidelines for prevention,early detection and management of colorectal cancer. Canberra: AusInfo,1999.
7. Australasian College of Dermatologists. www.dermcoll.asn.au. Sydney.Accessed 31 July 2002.
8. Breast Screen Australia. www.breastscreen.info.au. Canberra. Accessed24 July 2002.
9. Commonwealth Department of Health and Aged Care. National cervicalscreening program. www.cervicalscreen.health.gov.au/ncsp. Canberra.Accessed 31 July 2002.
10. Better Health Channel. Teeth need care if they are to last a lifetime.www.betterhealth.vic.gov.au. Melbourne: Department of Human ServicesVictoria. Accessed 31 July 2002.
17
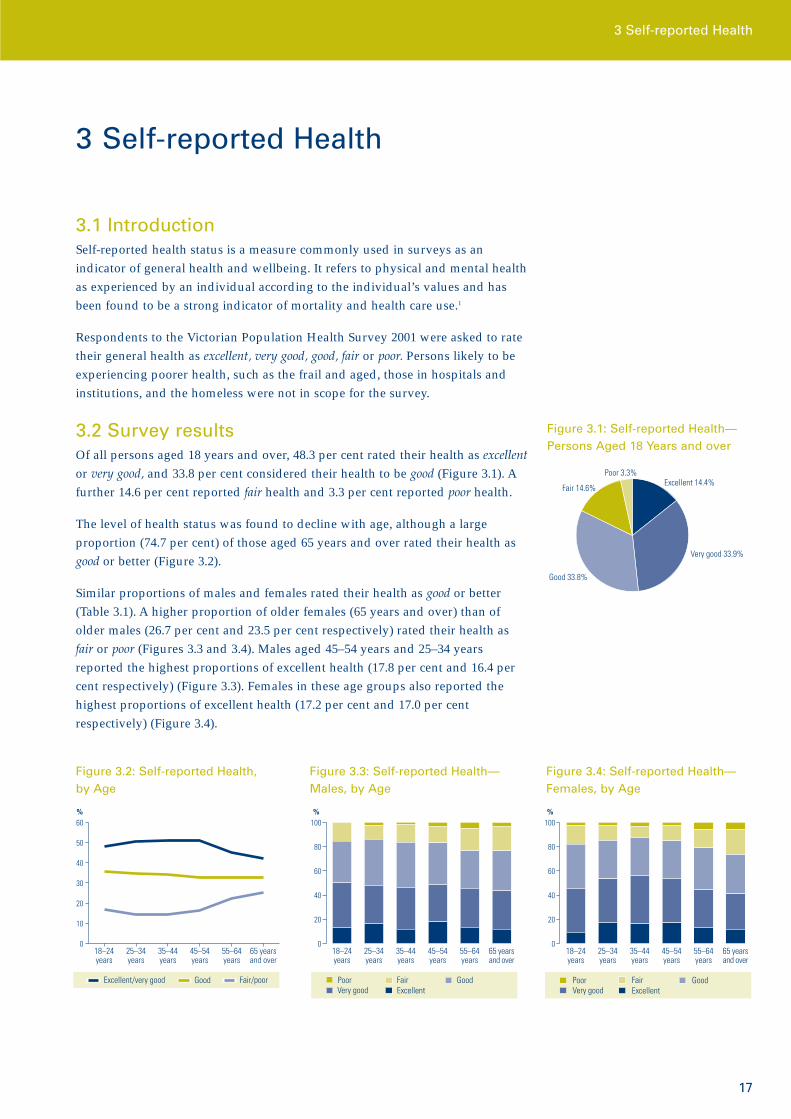
3.1 IntroductionSelf-reported health status is a measure commonly used in surveys as anindicator of general health and wellbeing. It refers to physical and mental healthas experienced by an individual according to the individual’s values and hasbeen found to be a strong indicator of mortality and health care use.1
Respondents to the Victorian Population Health Survey 2001 were asked to ratetheir general health as excellent, very good, good, fair or poor. Persons likely to beexperiencing poorer health, such as the frail and aged, those in hospitals andinstitutions, and the homeless were not in scope for the survey.
3.2 Survey resultsOf all persons aged 18 years and over, 48.3 per cent rated their health as excellentor very good, and 33.8 per cent considered their health to be good (Figure 3.1). Afurther 14.6 per cent reported fair health and 3.3 per cent reported poor health.
The level of health status was found to decline with age, although a largeproportion (74.7 per cent) of those aged 65 years and over rated their health asgood or better (Figure 3.2).
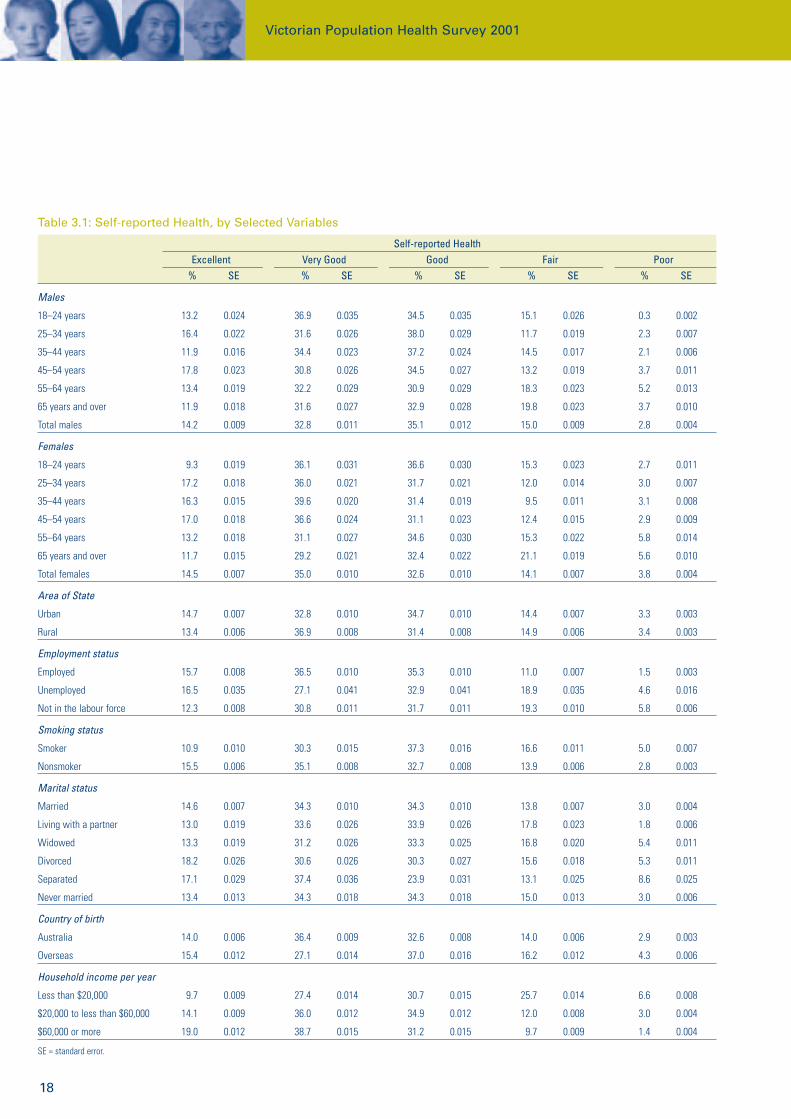
Similar proportions of males and females rated their health as good or better(Table 3.1). A higher proportion of older females (65 years and over) than ofolder males (26.7 per cent and 23.5 per cent respectively) rated their health asfair or poor (Figures 3.3 and 3.4). Males aged 45–54 years and 25–34 yearsreported the highest proportions of excellent health (17.8 per cent and 16.4 percent respectively) (Figure 3.3). Females in these age groups also reported thehighest proportions of excellent health (17.2 per cent and 17.0 per centrespectively) (Figure 3.4).
3 Self-reported Health
Figure 3.1: Self-reported Health—Persons Aged 18 Years and over
Excellent 14.4%
Very good 33.9%
Good 33.8%
Fair 14.6%
Poor 3.3%
Figure 3.2: Self-reported Health,by Age
%
Excellent/very good Good Fair/poor
18–24years
25–34years
35–44years
45–54years
55–64years
65 yearsand over
0
10
20
30
40
50
60
Figure 3.3: Self-reported Health—Males, by Age
%
Poor Fair GoodVery good Excellent
18–24years
25–34years
35–44years
45–54years
55–64years
65 yearsand over
0
20
40
60
80
100
3 Self-reported Health
Figure 3.4: Self-reported Health—Females, by Age
%
Poor Fair GoodVery good Excellent
18–24years
25–34years
35–44years
45–54years
55–64years
65 yearsand over
0
20
40
60
80
100
Victorian Population Health Survey 2001
18
Table 3.1: Self-reported Health, by Selected Variables
Self-reported HealthExcellent Very Good Good Fair Poor
% SE % SE % SE % SE % SE
Males
18–24 years 13.2 0.024 36.9 0.035 34.5 0.035 15.1 0.026 0.3 0.002
25–34 years 16.4 0.022 31.6 0.026 38.0 0.029 11.7 0.019 2.3 0.007
35–44 years 11.9 0.016 34.4 0.023 37.2 0.024 14.5 0.017 2.1 0.006
45–54 years 17.8 0.023 30.8 0.026 34.5 0.027 13.2 0.019 3.7 0.011
55–64 years 13.4 0.019 32.2 0.029 30.9 0.029 18.3 0.023 5.2 0.013
65 years and over 11.9 0.018 31.6 0.027 32.9 0.028 19.8 0.023 3.7 0.010
Total males 14.2 0.009 32.8 0.011 35.1 0.012 15.0 0.009 2.8 0.004
Females
18–24 years 9.3 0.019 36.1 0.031 36.6 0.030 15.3 0.023 2.7 0.011
25–34 years 17.2 0.018 36.0 0.021 31.7 0.021 12.0 0.014 3.0 0.007
35–44 years 16.3 0.015 39.6 0.020 31.4 0.019 9.5 0.011 3.1 0.008
45–54 years 17.0 0.018 36.6 0.024 31.1 0.023 12.4 0.015 2.9 0.009
55–64 years 13.2 0.018 31.1 0.027 34.6 0.030 15.3 0.022 5.8 0.014
65 years and over 11.7 0.015 29.2 0.021 32.4 0.022 21.1 0.019 5.6 0.010
Total females 14.5 0.007 35.0 0.010 32.6 0.010 14.1 0.007 3.8 0.004
Area of State
Urban 14.7 0.007 32.8 0.010 34.7 0.010 14.4 0.007 3.3 0.003
Rural 13.4 0.006 36.9 0.008 31.4 0.008 14.9 0.006 3.4 0.003
Employment status
Employed 15.7 0.008 36.5 0.010 35.3 0.010 11.0 0.007 1.5 0.003
Unemployed 16.5 0.035 27.1 0.041 32.9 0.041 18.9 0.035 4.6 0.016
Not in the labour force 12.3 0.008 30.8 0.011 31.7 0.011 19.3 0.010 5.8 0.006
Smoking status
Smoker 10.9 0.010 30.3 0.015 37.3 0.016 16.6 0.011 5.0 0.007
Nonsmoker 15.5 0.006 35.1 0.008 32.7 0.008 13.9 0.006 2.8 0.003
Marital status
Married 14.6 0.007 34.3 0.010 34.3 0.010 13.8 0.007 3.0 0.004
Living with a partner 13.0 0.019 33.6 0.026 33.9 0.026 17.8 0.023 1.8 0.006
Widowed 13.3 0.019 31.2 0.026 33.3 0.025 16.8 0.020 5.4 0.011
Divorced 18.2 0.026 30.6 0.026 30.3 0.027 15.6 0.018 5.3 0.011
Separated 17.1 0.029 37.4 0.036 23.9 0.031 13.1 0.025 8.6 0.025
Never married 13.4 0.013 34.3 0.018 34.3 0.018 15.0 0.013 3.0 0.006
Country of birth
Australia 14.0 0.006 36.4 0.009 32.6 0.008 14.0 0.006 2.9 0.003
Overseas 15.4 0.012 27.1 0.014 37.0 0.016 16.2 0.012 4.3 0.006
Household income per year
Less than $20,000 9.7 0.009 27.4 0.014 30.7 0.015 25.7 0.014 6.6 0.008
$20,000 to less than $60,000 14.1 0.009 36.0 0.012 34.9 0.012 12.0 0.008 3.0 0.004
$60,000 or more 19.0 0.012 38.7 0.015 31.2 0.015 9.7 0.009 1.4 0.004
SE = standard error.

19
Poorer self-reported health (fair or poor) was found to be associated with beingunemployed or not in the labour force, being a current smoker and residing inhouseholds with lower incomes (Table 3.1).
Table 3.2 shows the self-reported health status of persons in each of thedepartmental regions.
Table 3.2: Self-reported Health, by Departmental Region
Self-reported healthExcellent/Very Good Good Fair/Poor
Region % SE % SE % SE
Barwon south west 49.4 0.018 32.8 0.017 17.7 0.013
Grampians 49.7 0.020 30.7 0.019 19.7 0.016
Loddon–Mallee 51.6 0.018 30.8 0.016 17.7 0.013
Hume 51.5 0.019 30.6 0.018 17.9 0.015
Gippsland 49.6 0.019 31.3 0.018 19.1 0.015
Western metropolitan 45.5 0.021 34.3 0.020 20.1 0.017
Northern metropolitan 43.9 0.021 35.4 0.020 20.7 0.017
Eastern metropolitan 50.7 0.019 33.1 0.018 16.2 0.014
Southern metropolitan 48.5 0.019 35.8 0.019 15.7 0.014
SE = standard error.
Reference1. Miilunpalo S, Vuori I, Oja P. Self rated health as a health measure: the
predictive value of self-reported health status on the use of physicianservices and on mortality in the working age population. J Clin Epid1997;50(5):517–28.
3 Self-reported Health

Victorian Population Health Survey 2001
20
4.1 IntroductionAsthma is a common, chronic disorder affecting the airways of the lungs.Narrowing of these air passages (caused by the inflammation and swelling ofthe airway lining and the overproduction of mucus) in response to certaintriggers results in airway constriction and difficulty in breathing. This difficultymay be reversed either spontaneously or with treatment. The disease affects allage groups but particularly young persons, and ranges in severity fromintermittent mild symptoms to a severe, incapacitating and life-threateningdisorder.1
In 1999, asthma was designated as one of six national health priority areas,being recognised as one of Australia’s most serious chronic health problems. In2000, 159 deaths from asthma were reported in Australia.2 In Victoria, thecondition is responsible for an estimated 2.3 per cent and 2.9 per cent of thetotal Victorian disease burden in males and females respectively.3
Asthma prevalence may be measured according to different definitions of thecondition. Self-reported measures, such as that collected by the survey, typicallyreport prevalence in Australia at around 27 per cent in children and 17–29 percent in adults.4 These measures are quite different from objective measures oflung function, which typically observe the prevalence of current or persistentasthma (wheezing episodes with abnormal airway function between episodes)at 9–11 per cent in children and 5–6 per cent in adults.4
4.2 Survey ResultsRespondents were asked whether a doctor had ever told them that they haveasthma and, if so, whether they still get asthma. Those persons who responded‘yes’ to the first question are referred to as the population with asthma ever.Those persons who responded ‘yes’ to the follow-up question about still gettingasthma are referred to as the population with current asthma.
An estimated 22.0 per cent of persons aged 18 years and over reported havinghad asthma ever and 12.3 per cent reported currently having asthma(Figure 4.1).
Asthma Ever
Younger age groups were found to be most likely to have been diagnosed withasthma at some time in their lives, with 35.1 per cent of persons aged 18–24years having been told by a doctor they had the condition (Table 4.1).
Overall, 23.7 per cent of females and 20.2 per cent of males reported havingbeen diagnosed with asthma in the past (Table 4.1). Asthma prevalence wasfound to be higher among females in most age groups, and significantlydifferent in the age groups of 25–34 years and 65 years and over (Figure 4.2).
4 Asthma Prevalence
Figure 4.1: Asthma Prevalence inPersons Aged 18 Years and over
%
Asthma everCurrent asthma
0 5 10 15 20 25
Persons
Females
Males

21
Current asthma
Ten per cent of males and 14.5 per cent of females aged 18 years and overreported currently having asthma (Table 4.2). Females were found to havesignificantly higher current asthma prevalence rates than males in the agegroups of 25–34 years and 65 years and over (Figure 4.3).
Table 4.1: Prevalence of Asthma Ever, by Age and Sex
Males Females PersonsAge Group % SE % SE % SE
18–24 years 36.6 0.035 33.5 0.030 35.1 0.023
25–34 years 21.1 0.023 29.9 0.021 25.5 0.016
35–44 years 20.0 0.020 21.6 0.016 20.8 0.013
45–54 years 15.5 0.021 19.6 0.020 17.6 0.014
55–64 years 17.9 0.025 17.7 0.022 17.8 0.017
65 years and over 12.5 0.019 20.4 0.018 17.0 0.013
Total 20.2 0.010 23.7 0.009 22.0 0.006
SE = standard error.
Table 4.2: Prevalence of Current Asthma, by Age and Sex
Males Females PersonsAge Group % SE % SE % SE
18–24 years 19.7 0.030 18.3 0.025 19.0 0.020
25–34 years 9.6 0.016 18.7 0.017 14.2 0.012
35–44 years 8.7 0.014 13.1 0.013 10.9 0.010
45–54 years 8.4 0.016 12.8 0.017 10.7 0.012
55–64 years 9.2 0.017 8.5 0.014 8.9 0.011
65 years and over 5.9 0.012 14.6 0.017 10.8 0.011
Total 10.0 0.007 14.5 0.007 12.3 0.005
SE = standard error.
Figure 4.3: Prevalence of CurrentAsthma
%
Males Females
18–24years
25–34years
35–44years
45–54years
55–64years
65 yearsand over
0
5
10
15
20
25
30
35
40
Figure 4.2: Prevalence of AsthmaEver
%
Males Females
18–24years
25–34years
35–44years
45–54years
55–64years
65 yearsand over
0
5
10
15
20
25
30
35
40
4 Asthma Prevalence

Victorian Population Health Survey 2001
22
4.3 Past Asthma and Risk FactorsAfter adjusting for age and sex (Table 4.3), those persons more likely to reporthaving been diagnosed with asthma in the past were born in Australia,unemployed, having lower education levels and residing in households withlower incomes.
Table 4.3: Doctor-diagnosed Asthma in the Past and Risk Factors
95% p Value Odds Ratio Confidence Interval
Area of State
Urban 0.928 1.01 0.89–1.14
Rural* .. 1.00 ..
Country of birth
Australia <0.001 1.44 1.18–1.74
Overseas* .. 1.00 ..
Education level
Primary 0.031 1.19 1.02–1.40
Secondary 0.902 1.03 0.68–1.56
Tertiary* .. 1.00 ..
Occupation
Professional* .. 1.00 ..
Nonprofessional 0.063 1.17 0.99–1.38
Other 0.704 0.95 0.73–1.23
Employment status
Employed* .. 1.00 ..
Unemployed 0.004 1.79 1.20–2.66
Not in the labour force 0.260 1.11 0.92–1.34
Smoking status
Smoker 0.288 1.11 0.92–1.33
Ex-smoker 0.061 1.19 0.99–1.43
Nonsmoker* .. 1.00 ..
Private health insurance
Yes* .. 1.00 ..
No 0.800 1.02 0.87–1.19
Household income per year
Less than $20,000 0.001 1.53 1.20–1.94
From $20,000 to less than $60,000 0.419 1.08 0.89–1.32
$60,000 or more* .. 1.00 ..
Dwelling ownership
Owned* .. 1.00 ..
Rented 0.223 1.12 0.93–1.35
* The reference group, where the odds ratio is equal to 1.00 by definition. .. Not applicable.

23
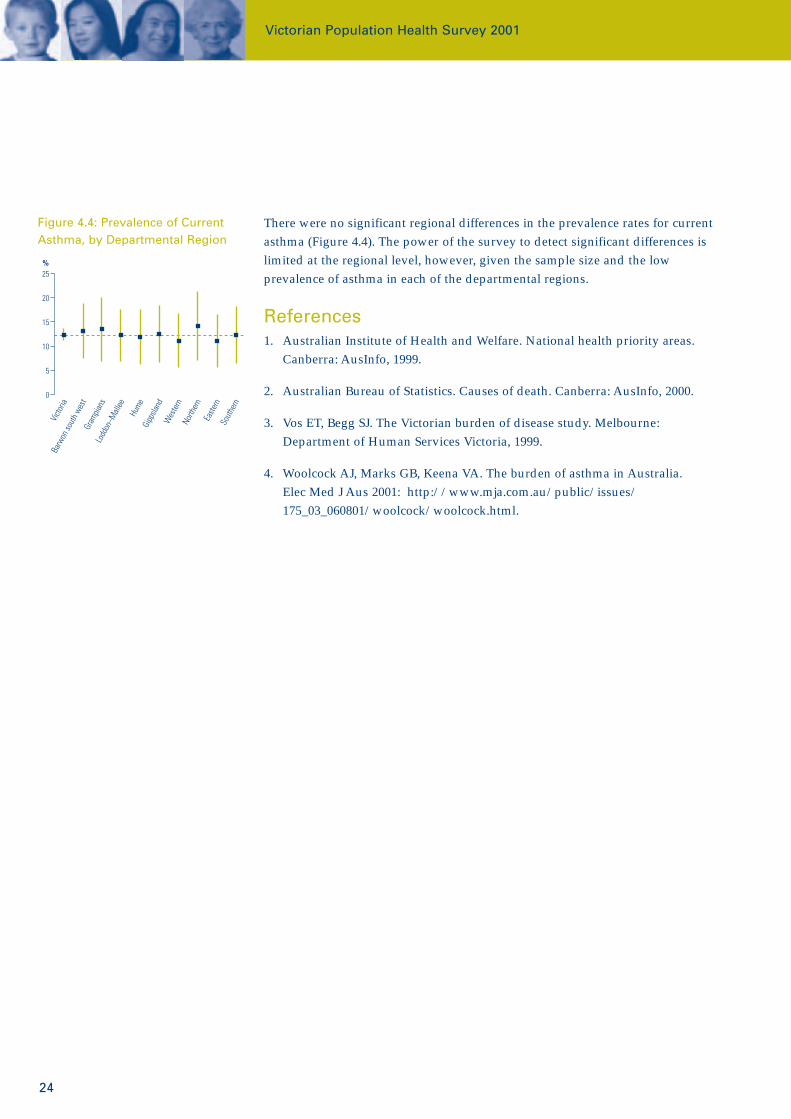
4.4 Current Asthma by Departmental RegionCurrent asthma prevalence varied from a low of 11.1 per cent (95 per centconfidence interval of 5.5–16.8 per cent) in the western metropolitan region to ahigh of 14.1 per cent (95 per cent confidence interval of 7.0–21.2 per cent) in thenorthern metropolitan region (Table 4.4).
Table 4.4: Prevalence of Current Asthma, by Departmental Region
95%Region Sex % Confidence Interval
Victoria Males 10.0 8.6–11.4
Females 14.5 13.1–15.9
Persons 12.3 11.3–13.3
Barwon south west Males 11.1 2.8–19.4
Females 15.0 7.0–22.9
Persons 13.1 7.3–18.8
Grampians Males 12.6 2.7–23.1
Females 14.3 5.7–22.9
Persons 13.5 6.8–20.1
Loddon–Mallee Males 9.1 1.8–16.6
Females 15.3 7.5–23.2
Persons 12.3 6.9–17.7
Hume Males 8.3 0.7–16.3
Females 15.6 7.2–24.0
Persons 12.0 6.3–17.7
Gippsland Males 9.0 2.0–16.7
Females 15.8 6.9–24.7
Persons 12.4 6.5–18.3
Western metropolitan Males 6.9 1.1–13.6
Females 15.1 6.5–23.9
Persons 11.1 5.5–16.7
Northern metropolitan Males 13.2 3.5–23.6
Females 15.0 5.8–24.4
Persons 14.1 7.0–21.2
Eastern metropolitan Males 9.0 0.9–17.0
Females 13.2 5.8–20.8
Persons 11.2 5.7–16.7
Southern metropolitan Males 10.2 1.9–18.4
Females 14.3 6.1–22.6
Persons 12.3 6.5–18.1
4 Asthma Prevalence
Victorian Population Health Survey 2001
24
There were no significant regional differences in the prevalence rates for currentasthma (Figure 4.4). The power of the survey to detect significant differences islimited at the regional level, however, given the sample size and the lowprevalence of asthma in each of the departmental regions.
References1. Australian Institute of Health and Welfare. National health priority areas.
Canberra: AusInfo, 1999.
2. Australian Bureau of Statistics. Causes of death. Canberra: AusInfo, 2000.
3. Vos ET, Begg SJ. The Victorian burden of disease study. Melbourne:Department of Human Services Victoria, 1999.
4. Woolcock AJ, Marks GB, Keena VA. The burden of asthma in Australia. Elec Med J Aus 2001: http://www.mja.com.au/public/issues/175_03_060801/woolcock/woolcock.html.
Figure 4.4: Prevalence of CurrentAsthma, by Departmental Region
%
0
5
10
15
20
25
Victo
riaBa
rwon
sout
h wes
tGr
ampia
nsLo
ddon
–Mall
eeHu
meGi
ppsla
ndW
este
rnNo
rther
nEa
stern
Sout
hern
25
5.1 IntroductionDiabetes mellitus is a common, chronic condition characterised by high bloodglucose (sugar) levels. The two main types of diabetes are type 1 (insulin-dependent) diabetes mellitus and type 2 (non-insulin-dependent) diabetesmellitus. A third form is gestational diabetes, which is a condition that affectswomen during pregnancy.
Type 1 diabetes develops when the pancreas fails to effectively produce thehormone insulin, which stimulates the body’s cells to use glucose as energy.Persons having type 1 diabetes require insulin injections to regulate their bloodsugar levels. This disease occurs most frequently in those aged under 30 yearsand may be referred to as juvenile-onset diabetes.
Type 2 diabetes usually occurs in adults who are overweight or have a familyhistory of the condition, and it accounts for around 85 per cent of all cases ofdiabetes. Caused by the body becoming resistant to high insulin levels in theblood, it may be controlled with appropriate diet and exercise.
Left untreated, diabetes can cause kidney, eye and nerve damage, heart disease,stroke and impotence.
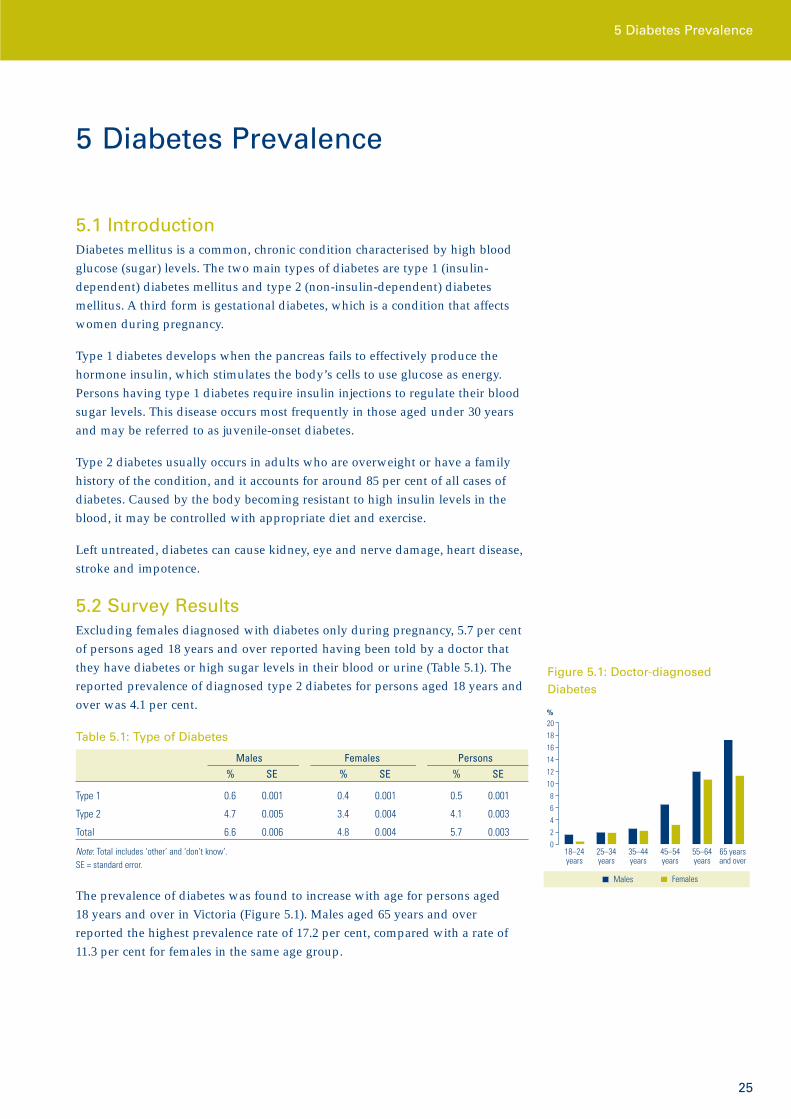
5.2 Survey ResultsExcluding females diagnosed with diabetes only during pregnancy, 5.7 per centof persons aged 18 years and over reported having been told by a doctor thatthey have diabetes or high sugar levels in their blood or urine (Table 5.1). Thereported prevalence of diagnosed type 2 diabetes for persons aged 18 years andover was 4.1 per cent.
Table 5.1: Type of Diabetes
Males Females Persons% SE % SE % SE
Type 1 0.6 0.001 0.4 0.001 0.5 0.001
Type 2 4.7 0.005 3.4 0.004 4.1 0.003
Total 6.6 0.006 4.8 0.004 5.7 0.003
Note: Total includes ‘other’ and ‘don’t know’.SE = standard error.
The prevalence of diabetes was found to increase with age for persons aged18 years and over in Victoria (Figure 5.1). Males aged 65 years and overreported the highest prevalence rate of 17.2 per cent, compared with a rate of11.3 per cent for females in the same age group.
5 Diabetes Prevalence
Figure 5.1: Doctor-diagnosedDiabetes
%
FemalesMales
18–24years
25–34years
35–44years
45–54years
55–64years
65 yearsand over
0
2
4
6
8
10
12
14
16
18
20
5 Diabetes Prevalence

Victorian Population Health Survey 2001
26
Gestational Diabetes
Gestational diabetes occurs during pregnancy in about 3–8 per cent of females(in Australia) not previously diagnosed with diabetes1 and it is a marker of agreater risk of developing type 2 diabetes later in life.2 Of females aged 18 yearsand over in Victoria, 2.8 per cent (95 per cent confidence interval of 2.3–3.1 percent) reported having been diagnosed with diabetes during pregnancy.
Diabetes Screening
Survey respondents were also asked whether they had had a check or test fordiabetes or high blood sugar levels in the past two years. Of all persons aged18 years and over, 44.8 per cent reported having had a test, with a higherproportion of females (47.4 per cent) than males (42.0 per cent) reporting havingundertaken the test in the past two years (Table 5.2).
Table 5.2: Test for Diabetes or High Blood Sugar Levels in Past Two Years
% SE
Males 42.0 0.012
Females 47.4 0.010
Persons 44.8 0.008
SE = standard error.
The proportion of persons reporting having a screening test for diabetes in thepast two years increased with age (Figure 5.2).
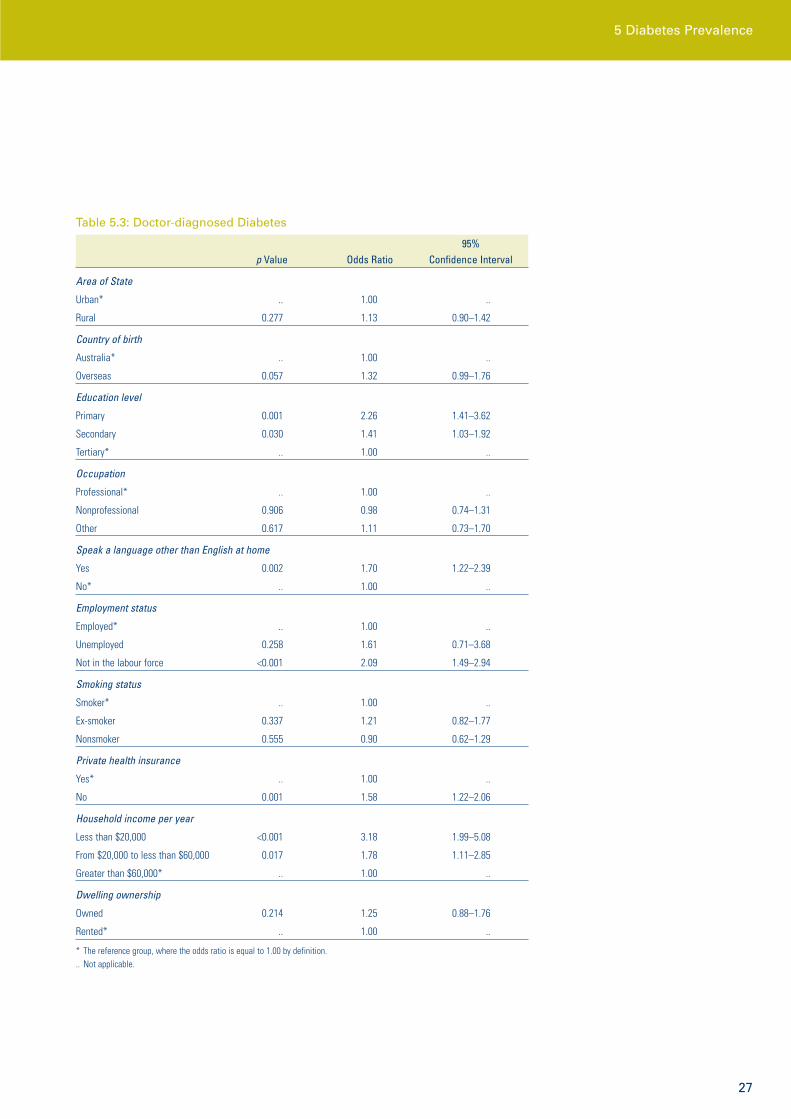
5.3 Factors Influencing Doctor-diagnosed DiabetesAfter adjusting for differences in age and sex (Table 5.3), those persons morelikely to report having been diagnosed with diabetes or high sugar levels intheir blood/urine were those residing in households with lower incomes,speaking a language other than English at home, not in the labour force, havinglower education levels and without private health insurance.
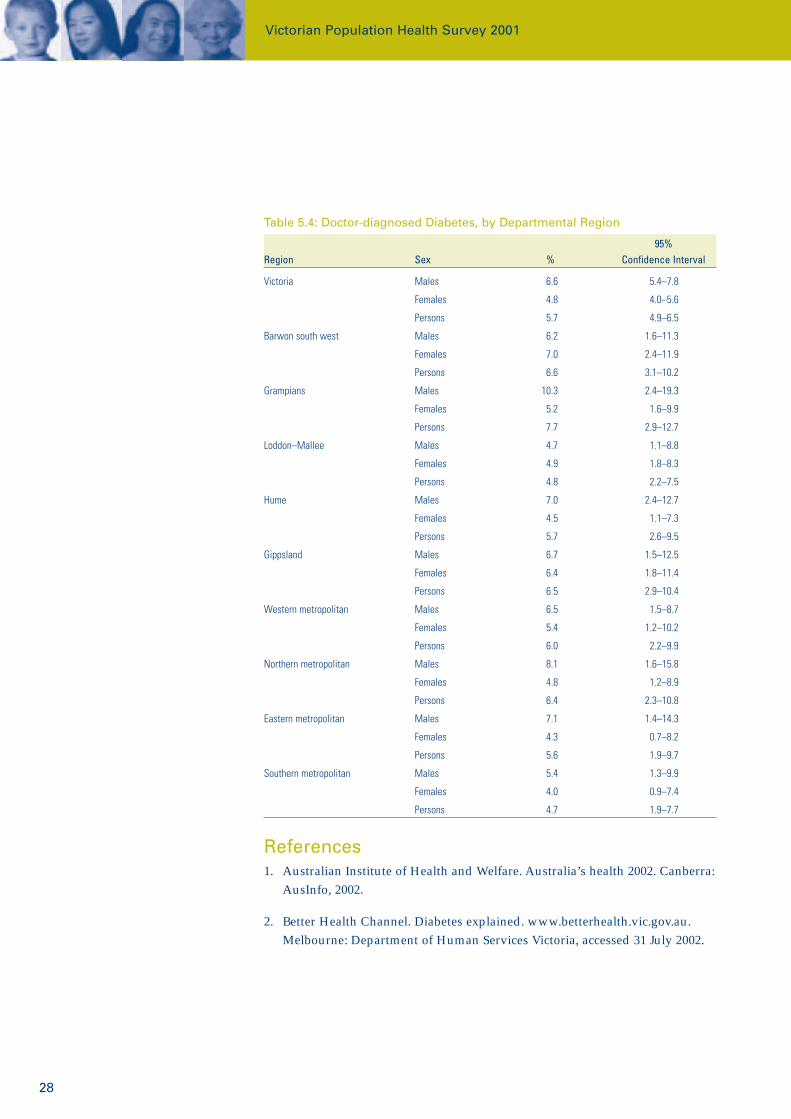
5.4 Diabetes by Departmental RegionTable 5.4 (page 28) shows the age–sex standardised prevalence rates for diabetesfor each of the departmental regions in Victoria. The rate varied from 4.7 percent (95 per cent confidence interval of 1.9–7.7 per cent) in the southernmetropolitan region to 7.7 per cent (95 per cent confidence interval of 2.9–12.7 per cent) in the Grampians region.
There were no significant regional differences in the diabetes prevalence rates(Figure 5.3). The power of the survey to detect significant differences is limitedat the regional level, however, given the sample size and the low prevalence ofdiabetes in each of the departmental regions.
Figure 5.2: Diabetes Check in PastTwo Years
%
FemalesMales
18–24years
25–34years
35–44years
45–54years
55–64years
65 yearsand over
Allpersons
0
10
20
30
40
50
60
70
80
Figure 5.3: Doctor-diagnosedDiabetes, by DepartmentalRegion—All Persons Aged18 Years and over
%
0
2
4
6
8
10
12
14
Victo
riaBa
rwon
sout
h wes
tGr
ampia
nsLo
ddon
–Mall
eeHu
meGi
ppsla
ndW
este
rnNo
rther
nEa
stern
Sout
hern
27
Table 5.3: Doctor-diagnosed Diabetes
95%p Value Odds Ratio Confidence Interval
Area of State
Urban* .. 1.00 ..
Rural 0.277 1.13 0.90–1.42
Country of birth
Australia* .. 1.00 ..
Overseas 0.057 1.32 0.99–1.76
Education level
Primary 0.001 2.26 1.41–3.62
Secondary 0.030 1.41 1.03–1.92
Tertiary* .. 1.00 ..
Occupation
Professional* .. 1.00 ..
Nonprofessional 0.906 0.98 0.74–1.31
Other 0.617 1.11 0.73–1.70
Speak a language other than English at home
Yes 0.002 1.70 1.22–2.39
No* .. 1.00 ..
Employment status
Employed* .. 1.00 ..
Unemployed 0.258 1.61 0.71–3.68
Not in the labour force <0.001 2.09 1.49–2.94
Smoking status
Smoker* .. 1.00 ..
Ex-smoker 0.337 1.21 0.82–1.77
Nonsmoker 0.555 0.90 0.62–1.29
Private health insurance
Yes* .. 1.00 ..
No 0.001 1.58 1.22–2.06
Household income per year
Less than $20,000 <0.001 3.18 1.99–5.08
From $20,000 to less than $60,000 0.017 1.78 1.11–2.85
Greater than $60,000* .. 1.00 ..
Dwelling ownership
Owned 0.214 1.25 0.88–1.76
Rented* .. 1.00 ..
* The reference group, where the odds ratio is equal to 1.00 by definition... Not applicable.
5 Diabetes Prevalence
Victorian Population Health Survey 2001
28
Table 5.4: Doctor-diagnosed Diabetes, by Departmental Region
95%Region Sex % Confidence Interval
Victoria Males 6.6 5.4–7.8
Females 4.8 4.0–5.6
Persons 5.7 4.9–6.5
Barwon south west Males 6.2 1.6–11.3
Females 7.0 2.4–11.9
Persons 6.6 3.1–10.2
Grampians Males 10.3 2.4–19.3
Females 5.2 1.6–9.9
Persons 7.7 2.9–12.7
Loddon–Mallee Males 4.7 1.1–8.8
Females 4.9 1.8–8.3
Persons 4.8 2.2–7.5
Hume Males 7.0 2.4–12.7
Females 4.5 1.1–7.3
Persons 5.7 2.6–9.5
Gippsland Males 6.7 1.5–12.5
Females 6.4 1.8–11.4
Persons 6.5 2.9–10.4
Western metropolitan Males 6.5 1.5–8.7
Females 5.4 1.2–10.2
Persons 6.0 2.2–9.9
Northern metropolitan Males 8.1 1.6–15.8
Females 4.8 1.2–8.9
Persons 6.4 2.3–10.8
Eastern metropolitan Males 7.1 1.4–14.3
Females 4.3 0.7–8.2
Persons 5.6 1.9–9.7
Southern metropolitan Males 5.4 1.3–9.9
Females 4.0 0.9–7.4
Persons 4.7 1.9–7.7
References1. Australian Institute of Health and Welfare. Australia’s health 2002. Canberra:
AusInfo, 2002.
2. Better Health Channel. Diabetes explained. www.betterhealth.vic.gov.au.Melbourne: Department of Human Services Victoria, accessed 31 July 2002.
29
6.1 IntroductionMental health problems and mental illness are a major cause of poor health inAustralia. Almost one in five adults (18 per cent) experience a mental disorderat some time in their lives.1 Depression is the number one cause of the burden ofdisease in Victoria and the fourth cause Australia-wide.2, 3 The World HealthOrganisation and the World Bank estimate that the burden of disease associatedwith depression is increasing globally and will become the major cause of thedisease burden in the next 20 years.3 In recognition of the importance of theseissues, mental health has been designated a national health priority area forAustralia and is the subject of a National Strategy and Action Plan.4
Given the significance of mental health issues in Victoria, the VictorianPopulation Health Survey 2001 included a measure of psychological distress.The Kessler 10 (K10) psychological distress measure is a set of 10 questionsdesigned to measure a respondent’s psychological distress over the previousfour-week period. The K10 cannot be used to determine major mental illnesses(such as psychoses) but has been validated as a simple measure of anxiety,depression and worry (psychological distress).5
6.2 Methods The K10 questions cover the major domains of anxiety, depression and worry(such as nervousness, hopelessness, restlessness, depression, sadness andworthlessness). Each question has a scale of five responses which have beenassigned the following values: all of the time (5), most of the time (4), some of thetime (3), a little of the time (2), none of the time (1). The K10 score is the sum of thevalues of responses and ranges from 10 (indicating no distress) to 50 (indicatingsevere distress).
The scores obtained when practitioners use the K10 questions as a screeningtool are qualified here in the following manner: (i) persons who score in therange 10–19 are likely to be well; (ii) persons who score in the range 20–24 arelikely to have a mild mental disorder; (iii) persons who score in the range 25–29are likely to have a moderate mental disorder; and (iv) persons who score in therange 30–50 are likely to have a severe mental disorder (personalcommunication, Professor Gavin Andrews, Clinical Research Unit for Anxietyand Depression, University of New South Wales at St Vincents Hospital,7 August 2002).
When used as a screening tool, the K10 needs to be followed by a diagnosticinterview to confirm the presence or absence of a mental disorder. Practitionersshould make a clinical judgement as to whether a person needs treatment. Thehigher the K10 score, the higher is the likelihood that the person suffers from amental disorder. Scores usually decline with effective treatment. For patientswhose scores remain above 24 after treatment, they should be reviewed and aspecialist referral should be considered.
6 Psychological Distress
6 Psychological Distress

Victorian Population Health Survey 2001
30
6.3 Survey ResultsFour per cent of persons aged 18 years and over scored highly on the K10 scaleand were categorised as likely to have a severe mental disorder (Figure 6.1).Over three-quarters of respondents (78.6 per cent) had low K10 scores and werecategorised as likely to be well. A further 11.8 per cent were categorised as likelyto have a mild mental disorder and 5.6 per cent as likely to have a moderatemental disorder.
For both males and females, persons in the older age groups were found to beless likely to be categorised in the higher groupings of the K10 psychologicaldistress scale (Figures 6.2 and 6.3).
Higher levels of psychological distress were associated with living in urbanareas, being unemployed, being separated, having been born overseas andresiding in households with lower incomes (Table 6.1). An association was alsofound between self-rated health status and level of psychological distress, withhigher proportions of persons who reported their health as good or bettercategorised as having lower levels of psychological distress (as measured by theK10) (Figure 6.4). The survey also collected information on past diagnosis ofdepression or anxiety. Of persons aged 18 years and over, 16.7 per cent (95 percent confidence interval of 15.6–17.9 per cent) had been told by a doctor thatthey had experienced depression or anxiety (Table 6.1). Persons who had beendoctor-diagnosed as having depression or anxiety in the past were found to bemore likely to have higher levels of psychological distress (Table 1).
6.4 Use of Mental Health ServicesThe survey also included a question on the use of mental health services,specifically: ‘In the past 12 months, have you used a mental health serviceprovided by a counsellor, community centre, psychologist or psychiatrist?’. Anestimated 4.7 per cent (95 per cent confidence interval of 4.1–5.3 per cent) ofpersons aged 18 years and over reported having used a service delivered by amental health service provider (on behalf of themselves or someone else, suchas a family member) in the past 12 months. This figure incorporates all levels ofservice use, from only one visit to a private psychologist to time spent in amental health inpatient service. It is therefore a measure of service contactrather than service use.
Figure 6.1: K10 Scores—PersonsAged 18 Years and over
10–1978.6%
20–2411.8%
25–295.6%
30–504.0%
Figure 6.2: K10 Score—Males,by Age
%
30–50 25–2920–24 10–19
18–24years
25–34years
35–44years
45–54years
55–64years
65 yearsand over
0
20
40
60
80
100
K10 score
Figure 6.3: K10 Score— Females,by Age
%
K10 score 30–50 25–2920–24 10–19
18–24years
25–34years
35–44years
45–54years
55–64years
65 yearsand over
0
20
40
60
80
100

31
Table 6.1: K10 Score for Selected Variables
K10 Score10–19 20–24 25–29 30–50
% SE % SE % SE % SE
Males
18–24 years 71.6 0.033 19.0 0.029 5.8 0.018 3.7 0.016
25–34 years 75.6 0.025 15.2 0.021 5.9 0.014 3.2 0.010
35–44 years 81.8 0.019 10.9 0.016 3.8 0.009 3.4 0.008
45–54 years 82.5 0.022 9.4 0.016 4.3 0.013 3.7 0.011
55–64 years 81.6 0.025 11.8 0.021 3.3 0.011 3.3 0.010
65 years and over 89.0 0.018 8.2 0.016 1.8 0.008 1.0 0.004
All males 80.4 0.010 12.3 0.008 4.2 0.005 3.1 0.004
Females
18–24 years 68.1 0.029 17.0 0.023 10.7 0.020 4.2 0.012
25–34 years 75.4 0.019 12.1 0.015 7.7 0.012 4.8 0.009
35–44 years 78.3 0.016 11.2 0.012 6.4 0.010 4.1 0.008
45–54 years 76.9 0.021 11.2 0.015 6.3 0.013 5.7 0.012
55–64 years 78.2 0.027 8.2 0.016 7.7 0.017 5.9 0.018
65 years and over 82.4 0.018 8.4 0.012 4.5 0.010 4.7 0.011
All females 77.0 0.009 11.2 0.006 6.9 0.005 4.9 0.005
Area of State
Urban 77.6 0.009 12.1 0.007 6.1 0.005 4.2 0.004
Rural 81.4 0.006 10.8 0.005 4.3 0.003 3.5 0.003
Employment status
Employed 80.7 0.008 11.6 0.007 4.9 0.005 2.8 0.004
Unemployed 62.1 0.043 19.7 0.035 8.8 0.027 9.4 0.025
Not in the labour force 77.1 0.010 11.3 0.008 6.4 0.006 5.2 0.005
Marital status
Married 82.6 0.008 9.4 0.006 4.7 0.005 3.3 0.004
Living with a partner 77.4 0.023 14.1 0.019 4.6 0.011 4.0 0.011
Widowed 83.5 0.019 9.1 0.015 3.8 0.010 3.6 0.010
Divorced 71.4 0.027 11.2 0.017 8.1 0.014 9.3 0.021
Separated 59.8 0.037 17.7 0.028 13.9 0.030 8.5 0.019
Never married 70.9 0.017 17.5 0.014 7.3 0.010 4.3 0.008
Country of birth
Australia 79.6 0.007 11.5 0.006 5.1 0.004 3.8 0.004
Overseas 75.9 0.014 12.5 0.011 6.9 0.008 4.6 0.007
Persons told by a doctor that they have depression or anxiety
Yes 51.7 0.018 18.9 0.014 14.0 0.013 15.4 0.014
No 84.0 0.007 10.3 0.005 3.9 0.004 1.7 0.002
Household income per year
Less than $20,000 72.9 0.014 12.4 0.010 7.9 0.009 6.9 0.008
$20,000 to less than $60,000 79.5 0.010 11.9 0.008 5.2 0.006 3.3 0.005
$60,000 or more 84.6 0.012 10.0 0.010 4.2 0.007 1.2 0.003
SE = standard error.
Figure 6.4: Self-rated Health andK10 Scores
Self-rated health
%
K10 score 30–50 25–2920–24 10–19
Excellent Very good Good Fair Poor0
20
40
60
80
100
6 Psychological Distress
Victorian Population Health Survey 2001
32
References1. Australian Bureau of Statistics. National survey of mental health and
wellbeing of adults, 1997. Canberra: AusInfo, 1999.
2. Vos ET, Begg SJ. The Victorian burden of disease study. Melbourne:Department of Human Services Victoria, 1999.
3. Mathers C, Vos T, Stevenson C. The burden of injury and disease inAustralia. Canberra: Australian Institute of Health and Welfare, 1999.
4. Australian Institute of Health and Welfare. First report on national healthpriority areas. Canberra: AusInfo, 1996.
5. Andrews G, Slade T. Interpreting scores on the Kessler psychological distressscale (K10). Aus NZ J Public Health 2001;25(6):494–7.
33
7.1 IntroductionThe concept of access to primary health care can be viewed in a variety of ways,but can be broadly defined as the timely use of personal health services to achieve thebest possible health outcomes. This definition accounts for barriers to receivingcare, as well as for the quality of care provided. Using this definition, we canask whether access problems can explain the relatively poorer health outcomesof some specific population groups.
The Victorian Population Health Survey 2001 included questions on perceivedaccess to health care and propensity to seek care.1 Respondents were asked torate their experience of accessing medical care when required as extremelydifficult, very difficult, somewhat difficult, not too difficult or not at all difficult. Thesurvey also collected information on the propensity of persons to consult adoctor in response to a range of health conditions, specifically (i) weight loss, (ii) shortness of breath, (iii) chest pain when exercising, (iv) loss ofconsciousness, fainting or passing out, and (v) bleeding other than nosebleeds.
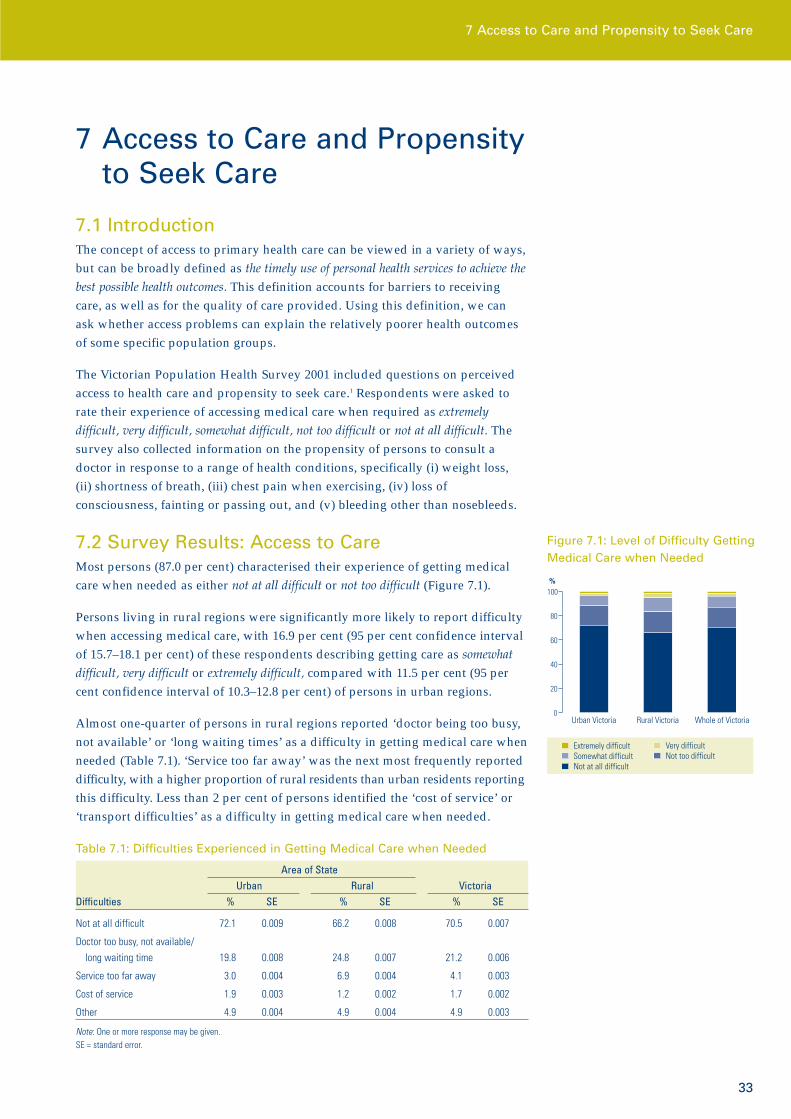
7.2 Survey Results: Access to CareMost persons (87.0 per cent) characterised their experience of getting medicalcare when needed as either not at all difficult or not too difficult (Figure 7.1).
Persons living in rural regions were significantly more likely to report difficultywhen accessing medical care, with 16.9 per cent (95 per cent confidence intervalof 15.7–18.1 per cent) of these respondents describing getting care as somewhatdifficult, very difficult or extremely difficult, compared with 11.5 per cent (95 percent confidence interval of 10.3–12.8 per cent) of persons in urban regions.
Almost one-quarter of persons in rural regions reported ‘doctor being too busy,not available’ or ‘long waiting times’ as a difficulty in getting medical care whenneeded (Table 7.1). ‘Service too far away’ was the next most frequently reporteddifficulty, with a higher proportion of rural residents than urban residents reportingthis difficulty. Less than 2 per cent of persons identified the ‘cost of service’ or‘transport difficulties’ as a difficulty in getting medical care when needed.
Table 7.1: Difficulties Experienced in Getting Medical Care when Needed
Area of StateUrban Rural Victoria
Difficulties % SE % SE % SE
Not at all difficult 72.1 0.009 66.2 0.008 70.5 0.007
Doctor too busy, not available/long waiting time 19.8 0.008 24.8 0.007 21.2 0.006
Service too far away 3.0 0.004 6.9 0.004 4.1 0.003
Cost of service 1.9 0.003 1.2 0.002 1.7 0.002
Other 4.9 0.004 4.9 0.004 4.9 0.003
Note: One or more response may be given.SE = standard error.
7 Access to Care and Propensityto Seek Care
Figure 7.1: Level of Difficulty GettingMedical Care when Needed
%
Extremely difficult Very difficultSomewhat difficult Not too difficultNot at all difficult
Urban Victoria Rural Victoria Whole of Victoria0
20
40
60
80
100
7 Access to Care and Propensity to Seek Care

Victorian Population Health Survey 2001
34
7.3 Survey Results: Propensity to Seek CareSixty-three per cent of persons answered extremely important or somewhatimportant to all of the scenarios related to propensity to seek care. A further22.0 per cent answered extremely important or somewhat important to any four outof five of the scenarios (Figure 7.2).
Of the five conditions presented, respondents were most likely to identify lossof consciousness, fainting or passing out, and bleeding other than nosebleedsand not caused by accident or injury as a somewhat or extremely important reasonto see a doctor. Less than 5 per cent of persons rated it only a little or not at allimportant to consult a doctor in these cases. Considered less urgent was weightloss of more than 5–6 kilograms in a month when not dieting and shortness ofbreath with light exercise or light work, for which more than 20 per cent ofpersons rated seeing a doctor as being a little important or not at all important.
Propensity to Seek Care by Gender
For most conditions, females were found to be more likely than males toconsider seeing a doctor to be somewhat or extremely important (Table 7.2). For themore serious conditions of loss of consciousness, fainting or passing out, andbleeding other than nosebleeds and not caused by accident or injury, both malesand females rated similar levels of importance for seeing a doctor.
7.4 SummaryPeople may decline to seek primary health care for various reasons, such asgeographic location and transport difficulties. Those who seek medical care laterin the course of their disease might have missed the opportunity for their illnessto be managed in the primary care setting, leading to unnecessaryhospitalisation.
Survey data will be assessed against the Victorian Admitted Episodes Databasein detail to identify the relationships between access to primary health care,propensity to seek care and the hospitalisation rates for ambulatory care-sensitive conditions in Victoria.
Figure 7.2: Propensity to SeekCare for Selected Conditions
%
Not at all important A little importantSomewhat important Extremely important
Weight lossof more than
5–6 kilograms in a monthwhen not
dieting
Shortnessof breathwith light
exercise orlight work
Chest painwhen
exercising
Loss ofconsciousness,
fainting orpassing out
Bleedingother thannosebleeds
and not causedby accident or
injury
0
20
40
60
80
100

35
Table 7.2: Propensity to Seek Care for Selected Conditions, by Sex and Level of Importance
Level of Importance of Seeing a DoctorExtremely Somewhat A Little Not at AllImportant Important Important Important
Selected Conditions % SE % SE % SE % SE
Weight loss of more than 5–6 kilograms in a month when not dieting
Males 53.0 0.012 22.3 0.010 11.5 0.008 13.2 0.008
Females 59.8 0.010 22.5 0.008 9.5 0.006 8.3 0.006
Shortness of breath with light exercise or light work
Males 46.1 0.012 30.4 0.011 13.8 0.008 9.6 0.007
Females 50.2 0.010 28.8 0.009 14.1 0.007 7.0 0.005
Chest pain when exercising
Males 67.2 0.011 21.9 0.010 7.1 0.006 3.9 0.005
Females 74.7 0.009 16.9 0.008 6.3 0.005 2.1 0.003
Loss of consciousness, fainting or passing out
Males 87.8 0.008 8.3 0.007 2.3 0.004 1.5 0.003
Females 88.8 0.006 8.4 0.006 2.1 0.003 0.7 0.002
Bleeding other than nosebleeds and not caused by accident or injury
Males 78.2 0.010 16.5 0.009 3.4 0.004 1.9 0.003
Females 85.0 0.007 11.8 0.006 2.3 0.003 0.9 0.002
SE = standard error.
Reference1. Bindman AB. Preventable hospitalizations and access to health care. JAMA
1995;274(4):305–311.
7 Access to Care and Propensity to Seek Care
Victorian Population Health Survey 2001
36
DemographicsAge
Sex
Marital status
Country of birth
Main language spoken at home
Country of birth of mother
Country of birth of father
Highest level of education
Employment status
Main field of occupation
Household income
Housing tenure
Whether has private health insurance
Indigenous status
Area of State (departmental region)
Silent telephone number status
Health Care UseWhether had blood pressure check inpast two years
Whether had cholesterol check in pasttwo years
Whether had a test for diabetes orhigh blood sugar levels in past twoyears
Whether had a bowel examination inpast two years
Whether had a skin examination inpast two years
Whether had a mammogram test inpast two years
Whether had a pap smear test in pasttwo years
Whether had a prostate check in pasttwo years
Whether had a dental check in pasttwo years
Use of, and level of satisfaction with:• Public hospital• Community health centre• Meals on Wheels • Home nursing• Kindergarten• Maternal and child health centre• Mental health service
Health Service IssuesAccess to care
Difficulty getting medical care whenneeded
Types of difficulty experienced gettingaccess to medical care
Propensity to seek care
Level of importance in seeing a doctor if had weight loss of more than5–6 kilograms when not dieting
Level of importance in seeing a doctorif had shortness of breath with lightexercise or work
Level of importance in seeing a doctorif had chest pain when exercising
Level of importance in seeing a doctorif had loss of consciousness, faintingor passing out
Level of importance in seeing a doctorif had bleeding other than nosebleedsand not caused by accident or injury
Appendix
Victorian Population Health Survey 2001 Data Items

37
NutritionNumber of serves of vegetables eateneach day
Number of serves of fruit eaten eachday
AlcoholWhether had an alcoholic drink of anykind in past 12 months
Frequency of having an alcoholicdrink of any kind
Amount of standard drinks consumedwhen drinking
SmokingSmoking status
Frequency of smoking
Attitudes to smokingView on smoking in gaming areas
View on smoking in public bars
View on smoking in nightclubs
AsthmaAsthma status
Blood PressureHigh blood pressure status
Management of high blood pressure
DiabetesDiabetes status
Type of diabetes
Social Capital MeasuresSocial networks and supportstructures
Social and community participation
Civic involvement and empowerment
Trust in people and social institutions
Tolerance of diversity
Physical ActivityWhether walked continuously for atleast 10 minutes in past week
Amount of time spent walkingcontinuously in past week
Whether did any vigorous physicalactivity in past week
Amount of time spent doing vigorousactivity
Self-reported HealthStatus
Kessler 10 Measure ofPsychological Distress
Health ConditionsArthritis
Heart disease
Stroke
Cancer
Osteoporosis
Depression or anxiety
Gastroenteritis
Appendix

Victorian Population Health Survey 2001
38
Exploring Mediators of Health Inequalities Usingthe Victorian Population Health Survey 2001Jeanette Pope, Adrian Serraglio and Loretta Vaughan
AbstractThis paper describes data on social networks. The data were collected for thefirst time in 2001 as part of the Victorian Population Health Survey, which is anannual survey that collects information about the health of the Victorianpopulation. The social networks are examined by socioeconomic status,rural/urban areas, health status and social attitudes. These results represent thebeginnings of a process exploring appropriate survey questions on social capitaland networks, and they are a work in progress. The 2002 survey will collectsimilar information.
This paper also describes difficulties that have been encountered in measuringnetwork effects at the population level.
IntroductionThe advantages of social ties and networks have been receiving increasingattention by health researchers in Australia, particularly by those interested inexamining remedies for the reported health inequalities among populationgroups.1, 2 Little is known about the relative contribution of various factors tohealth inequalities, but aspects of social structure, such as those related to socialties and social exchange, are likely to make some contribution.
Background to the Survey’s Measurement ofSocial Networks Social networks are thought to have an influence on health through at leastthree mechanisms (Figure 1): the provision of resources and advantages (socialcapital); the wellbeing effects of social support; and the influence on behaviours(such as peer effects on smoking).3 All three factors are likely to be importantmediators of health inequalities.3 The Victorian Population Health Survey 2001focused on social capital effects because the others are difficult to measure usinga relatively short health survey.
Social capital is defined as the resources, advantages and benefits thatindividuals accrue through the groups to which they belong.4, 5 Individuals canobtain advantages and resources through formal economic market processes orthrough informal social networks and ties. The combination of these two typesof resource determines a person’s standard of living (or socioeconomic status),which has been strongly associated with health status. It has been argued thatproductive networks benefit not only individuals but also the groups,communities and societies in which the ties occur.6 It has also been argued that
Attachment I
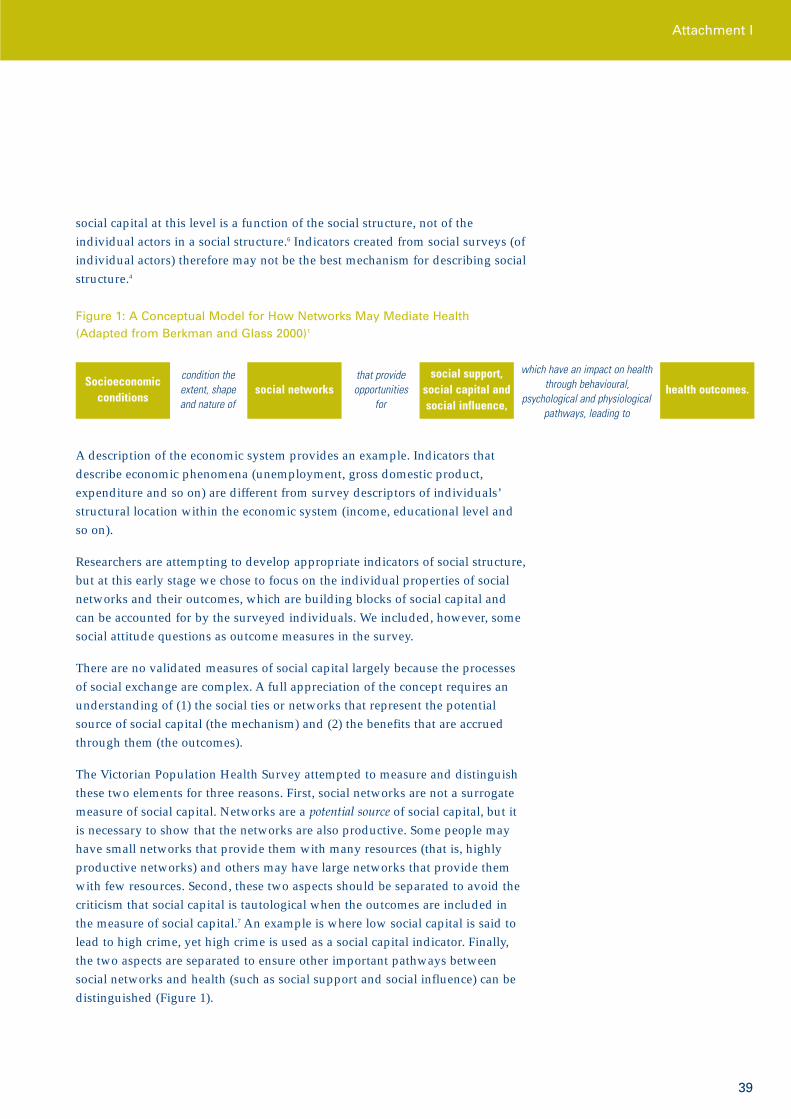
39
Figure 1: A Conceptual Model for How Networks May Mediate Health (Adapted from Berkman and Glass 2000)1
A description of the economic system provides an example. Indicators thatdescribe economic phenomena (unemployment, gross domestic product,expenditure and so on) are different from survey descriptors of individuals’structural location within the economic system (income, educational level andso on).
Researchers are attempting to develop appropriate indicators of social structure,but at this early stage we chose to focus on the individual properties of socialnetworks and their outcomes, which are building blocks of social capital andcan be accounted for by the surveyed individuals. We included, however, somesocial attitude questions as outcome measures in the survey.
There are no validated measures of social capital largely because the processesof social exchange are complex. A full appreciation of the concept requires anunderstanding of (1) the social ties or networks that represent the potentialsource of social capital (the mechanism) and (2) the benefits that are accruedthrough them (the outcomes).
The Victorian Population Health Survey attempted to measure and distinguishthese two elements for three reasons. First, social networks are not a surrogatemeasure of social capital. Networks are a potential source of social capital, but itis necessary to show that the networks are also productive. Some people mayhave small networks that provide them with many resources (that is, highlyproductive networks) and others may have large networks that provide themwith few resources. Second, these two aspects should be separated to avoid thecriticism that social capital is tautological when the outcomes are included inthe measure of social capital.7 An example is where low social capital is said tolead to high crime, yet high crime is used as a social capital indicator. Finally,the two aspects are separated to ensure other important pathways betweensocial networks and health (such as social support and social influence) can bedistinguished (Figure 1).
Socioeconomicconditions
social networkscondition theextent, shape and nature of
that provideopportunities
for
social support,social capital andsocial influence,
health outcomes.
which have an impact on healththrough behavioural,
psychological and physiologicalpathways, leading to
Attachment I
social capital at this level is a function of the social structure, not of theindividual actors in a social structure.6 Indicators created from social surveys (ofindividual actors) therefore may not be the best mechanism for describing socialstructure.4
Victorian Population Health Survey 2001
40
Survey MethodThe 2001 survey followed an established method developed over several yearsto collect relevant, timely and valid health information to apply to policydevelopment and strategic planning. Computer-assisted telephone interviewing(CATI) was used for a representative sample of persons aged 18 years and overwho resided in private dwellings in Victoria.
The survey team used random digit dialling to generate a sample of telephonenumbers that formed the household CATI sample. All residential households inVictoria with landline telephone connections were considered to be in scope forthe survey. The survey sample included 7494 households, which were stratifiedby Department of Human Services region. (Victoria has five rural and foururban regions.) The data were weighted to adjust for the probability of selectionand known age/sex/area population benchmarks.
Measuring Networks
Nineteen questions relating to social capital were adapted for the survey fromBullen and Onyx’s study of five communities in New South Wales.8 The surveymeasured social networks using questions about informal social contacts(friends, family, neighbours) and membership or involvement with localorganisations (sporting clubs, associations, community groups, working bees)(Table 1). Three questions examined the productive nature of networks byexamining the capacity of individuals to draw resources from their networks(such as childcare) in an emergency. The main focus of the social networksquestions, however, was on the size and type of networks.
Measuring Outcomes
Two health outcome measures were used in the survey: a measure of self-ratedhealth and the Kessler 10 (K10) measure of psychological distress. The self-ratedmeasure asked people to rate their health as poor, fair, good or very good and wasused as a surrogate measure of physical health. This measure has been found ina large number of settings to be a good predictor of mortality and the onset ofdisability.9 The K10 measure, derived from a set of 10 questions, is a suitableoutcome measure for people with anxiety and depressive disorders.10 Each ofthe 10 questions has a scale of five responses (all of the time, most of the time, someof the time, a little of the time, none of the time) and the K10 score is the sum of the10 responses. The scores obtained when practitioners use the K10 questions as ascreening tool are qualified here in the following manner: (i) persons who scorein the range 10–19 are likely to be well; (ii) persons who score in the range 20–24are likely to have a mild mental disorder; (iii) persons who score in the range25–29 are likely to have a moderate mental disorder; and (iv) persons who scorein the range 30–50 are likely to have a severe mental disorder (personalcommunication, Professor Gavin Andrews, Clinical Research Unit for Anxietyand Depression, University of New South Wales at St Vincents Hospital,7 August 2002).
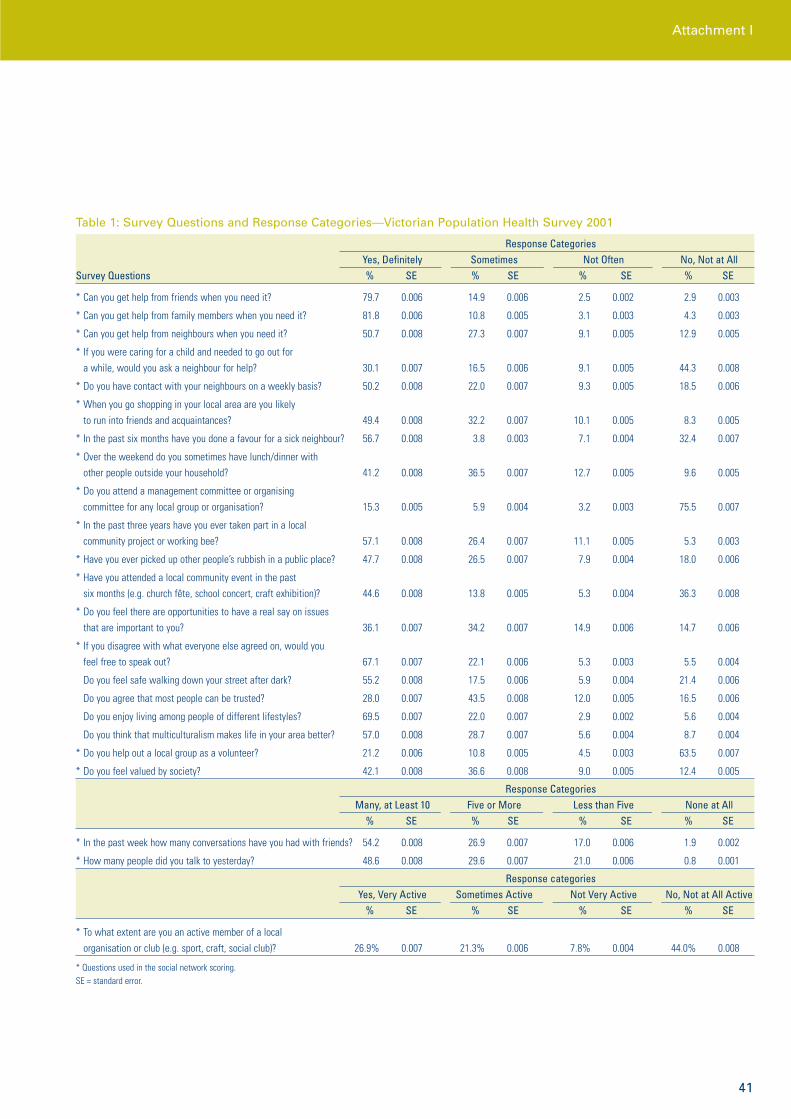
41
Table 1: Survey Questions and Response Categories—Victorian Population Health Survey 2001
Response CategoriesYes, Definitely Sometimes Not Often No, Not at All
Survey Questions % SE % SE % SE % SE
* Can you get help from friends when you need it? 79.7 0.006 14.9 0.006 2.5 0.002 2.9 0.003
* Can you get help from family members when you need it? 81.8 0.006 10.8 0.005 3.1 0.003 4.3 0.003
* Can you get help from neighbours when you need it? 50.7 0.008 27.3 0.007 9.1 0.005 12.9 0.005
* If you were caring for a child and needed to go out for a while, would you ask a neighbour for help? 30.1 0.007 16.5 0.006 9.1 0.005 44.3 0.008
* Do you have contact with your neighbours on a weekly basis? 50.2 0.008 22.0 0.007 9.3 0.005 18.5 0.006
* When you go shopping in your local area are you likely to run into friends and acquaintances? 49.4 0.008 32.2 0.007 10.1 0.005 8.3 0.005
* In the past six months have you done a favour for a sick neighbour? 56.7 0.008 3.8 0.003 7.1 0.004 32.4 0.007
* Over the weekend do you sometimes have lunch/dinner with other people outside your household? 41.2 0.008 36.5 0.007 12.7 0.005 9.6 0.005
* Do you attend a management committee or organising committee for any local group or organisation? 15.3 0.005 5.9 0.004 3.2 0.003 75.5 0.007
* In the past three years have you ever taken part in a local community project or working bee? 57.1 0.008 26.4 0.007 11.1 0.005 5.3 0.003
* Have you ever picked up other people’s rubbish in a public place? 47.7 0.008 26.5 0.007 7.9 0.004 18.0 0.006
* Have you attended a local community event in the past six months (e.g. church fête, school concert, craft exhibition)? 44.6 0.008 13.8 0.005 5.3 0.004 36.3 0.008
* Do you feel there are opportunities to have a real say on issues that are important to you? 36.1 0.007 34.2 0.007 14.9 0.006 14.7 0.006
* If you disagree with what everyone else agreed on, would you feel free to speak out? 67.1 0.007 22.1 0.006 5.3 0.003 5.5 0.004
Do you feel safe walking down your street after dark? 55.2 0.008 17.5 0.006 5.9 0.004 21.4 0.006
Do you agree that most people can be trusted? 28.0 0.007 43.5 0.008 12.0 0.005 16.5 0.006
Do you enjoy living among people of different lifestyles? 69.5 0.007 22.0 0.007 2.9 0.002 5.6 0.004
Do you think that multiculturalism makes life in your area better? 57.0 0.008 28.7 0.007 5.6 0.004 8.7 0.004
* Do you help out a local group as a volunteer? 21.2 0.006 10.8 0.005 4.5 0.003 63.5 0.007
* Do you feel valued by society? 42.1 0.008 36.6 0.008 9.0 0.005 12.4 0.005
Response CategoriesMany, at Least 10 Five or More Less than Five None at All
% SE % SE % SE % SE
* In the past week how many conversations have you had with friends? 54.2 0.008 26.9 0.007 17.0 0.006 1.9 0.002
* How many people did you talk to yesterday? 48.6 0.008 29.6 0.007 21.0 0.006 0.8 0.001
Response categoriesYes, Very Active Sometimes Active Not Very Active No, Not at All Active
% SE % SE % SE % SE
* To what extent are you an active member of a local organisation or club (e.g. sport, craft, social club)? 26.9% 0.007 21.3% 0.006 7.8% 0.004 44.0% 0.008
* Questions used in the social network scoring.SE = standard error.
Attachment I
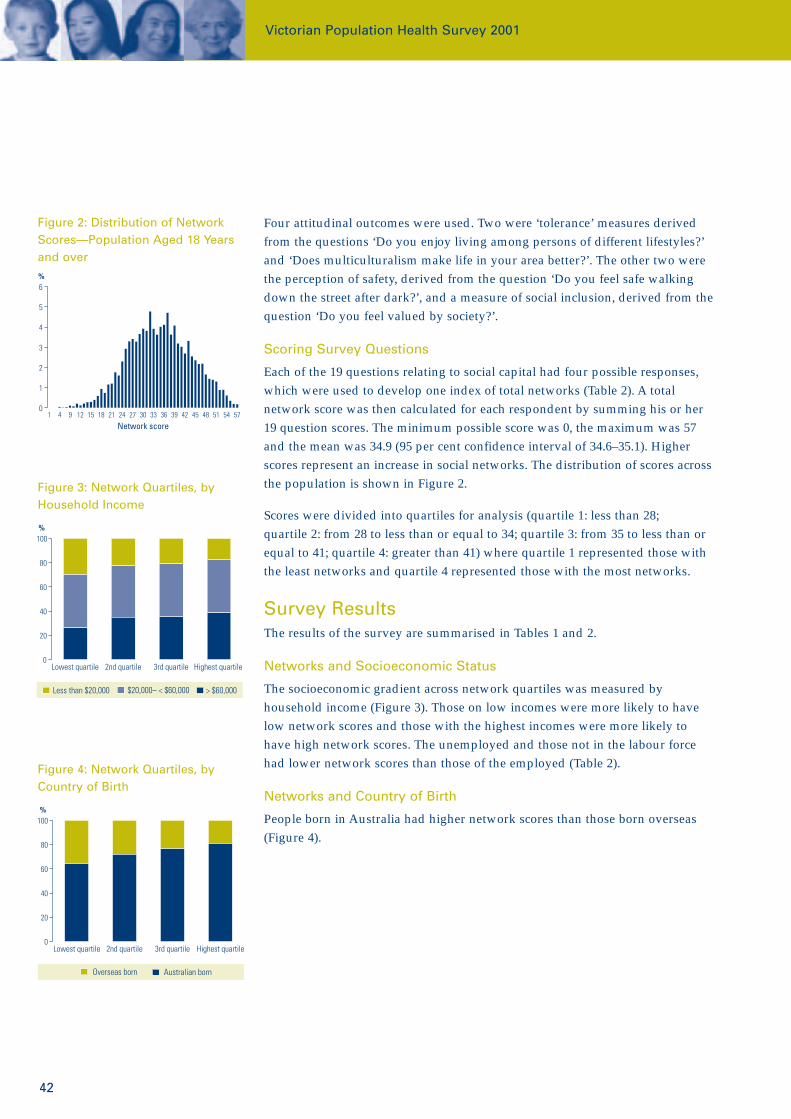
Victorian Population Health Survey 2001
42
Four attitudinal outcomes were used. Two were ‘tolerance’ measures derivedfrom the questions ‘Do you enjoy living among persons of different lifestyles?’and ‘Does multiculturalism make life in your area better?’. The other two werethe perception of safety, derived from the question ‘Do you feel safe walkingdown the street after dark?’, and a measure of social inclusion, derived from thequestion ‘Do you feel valued by society?’.
Scoring Survey Questions
Each of the 19 questions relating to social capital had four possible responses,which were used to develop one index of total networks (Table 2). A totalnetwork score was then calculated for each respondent by summing his or her19 question scores. The minimum possible score was 0, the maximum was 57and the mean was 34.9 (95 per cent confidence interval of 34.6–35.1). Higherscores represent an increase in social networks. The distribution of scores acrossthe population is shown in Figure 2.
Scores were divided into quartiles for analysis (quartile 1: less than 28;quartile 2: from 28 to less than or equal to 34; quartile 3: from 35 to less than orequal to 41; quartile 4: greater than 41) where quartile 1 represented those withthe least networks and quartile 4 represented those with the most networks.
Survey ResultsThe results of the survey are summarised in Tables 1 and 2.
Networks and Socioeconomic Status
The socioeconomic gradient across network quartiles was measured byhousehold income (Figure 3). Those on low incomes were more likely to havelow network scores and those with the highest incomes were more likely tohave high network scores. The unemployed and those not in the labour forcehad lower network scores than those of the employed (Table 2).
Networks and Country of Birth
People born in Australia had higher network scores than those born overseas(Figure 4).
Figure 2: Distribution of NetworkScores—Population Aged 18 Yearsand over%
1 4 9 12 15 18 21 24 27 30 33 36 39 42 45 48 51 54 570
1
2
3
4
5
6
Network score
Figure 3: Network Quartiles, byHousehold Income
%
Less than $20,000 $20,000– < $60,000 > $60,000
Lowest quartile 2nd quartile 3rd quartile Highest quartile0
20
40
60
80
100
Figure 4: Network Quartiles, byCountry of Birth
%
Overseas born Australian born
Lowest quartile 2nd quartile 3rd quartile Highest quartile0
20
40
60
80
100
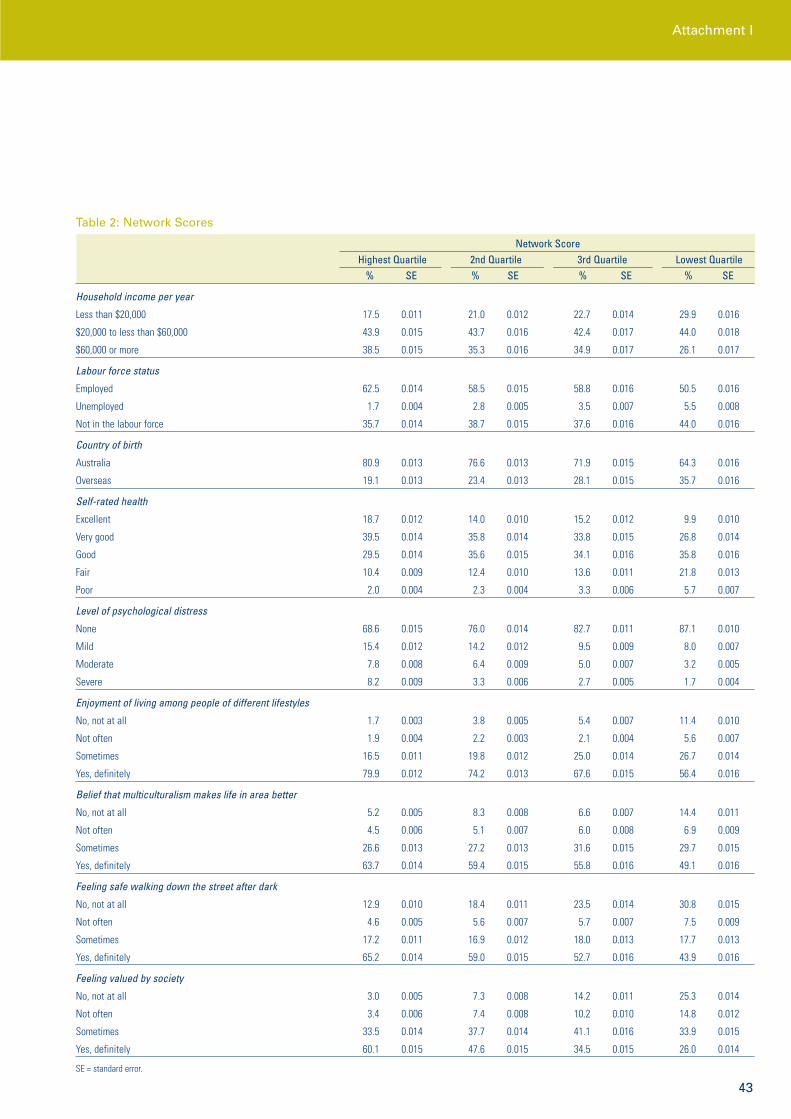
43
Table 2: Network Scores
Network ScoreHighest Quartile 2nd Quartile 3rd Quartile Lowest Quartile
% SE % SE % SE % SE
Household income per year
Less than $20,000 17.5 0.011 21.0 0.012 22.7 0.014 29.9 0.016
$20,000 to less than $60,000 43.9 0.015 43.7 0.016 42.4 0.017 44.0 0.018
$60,000 or more 38.5 0.015 35.3 0.016 34.9 0.017 26.1 0.017
Labour force status
Employed 62.5 0.014 58.5 0.015 58.8 0.016 50.5 0.016
Unemployed 1.7 0.004 2.8 0.005 3.5 0.007 5.5 0.008
Not in the labour force 35.7 0.014 38.7 0.015 37.6 0.016 44.0 0.016
Country of birth
Australia 80.9 0.013 76.6 0.013 71.9 0.015 64.3 0.016
Overseas 19.1 0.013 23.4 0.013 28.1 0.015 35.7 0.016
Self-rated health
Excellent 18.7 0.012 14.0 0.010 15.2 0.012 9.9 0.010
Very good 39.5 0.014 35.8 0.014 33.8 0.015 26.8 0.014
Good 29.5 0.014 35.6 0.015 34.1 0.016 35.8 0.016
Fair 10.4 0.009 12.4 0.010 13.6 0.011 21.8 0.013
Poor 2.0 0.004 2.3 0.004 3.3 0.006 5.7 0.007
Level of psychological distress
None 68.6 0.015 76.0 0.014 82.7 0.011 87.1 0.010
Mild 15.4 0.012 14.2 0.012 9.5 0.009 8.0 0.007
Moderate 7.8 0.008 6.4 0.009 5.0 0.007 3.2 0.005
Severe 8.2 0.009 3.3 0.006 2.7 0.005 1.7 0.004
Enjoyment of living among people of different lifestyles
No, not at all 1.7 0.003 3.8 0.005 5.4 0.007 11.4 0.010
Not often 1.9 0.004 2.2 0.003 2.1 0.004 5.6 0.007
Sometimes 16.5 0.011 19.8 0.012 25.0 0.014 26.7 0.014
Yes, definitely 79.9 0.012 74.2 0.013 67.6 0.015 56.4 0.016
Belief that multiculturalism makes life in area better
No, not at all 5.2 0.005 8.3 0.008 6.6 0.007 14.4 0.011
Not often 4.5 0.006 5.1 0.007 6.0 0.008 6.9 0.009
Sometimes 26.6 0.013 27.2 0.013 31.6 0.015 29.7 0.015
Yes, definitely 63.7 0.014 59.4 0.015 55.8 0.016 49.1 0.016
Feeling safe walking down the street after dark
No, not at all 12.9 0.010 18.4 0.011 23.5 0.014 30.8 0.015
Not often 4.6 0.005 5.6 0.007 5.7 0.007 7.5 0.009
Sometimes 17.2 0.011 16.9 0.012 18.0 0.013 17.7 0.013
Yes, definitely 65.2 0.014 59.0 0.015 52.7 0.016 43.9 0.016
Feeling valued by society
No, not at all 3.0 0.005 7.3 0.008 14.2 0.011 25.3 0.014
Not often 3.4 0.006 7.4 0.008 10.2 0.010 14.8 0.012
Sometimes 33.5 0.014 37.7 0.014 41.1 0.016 33.9 0.015
Yes, definitely 60.1 0.015 47.6 0.015 34.5 0.015 26.0 0.014
SE = standard error.
Attachment I
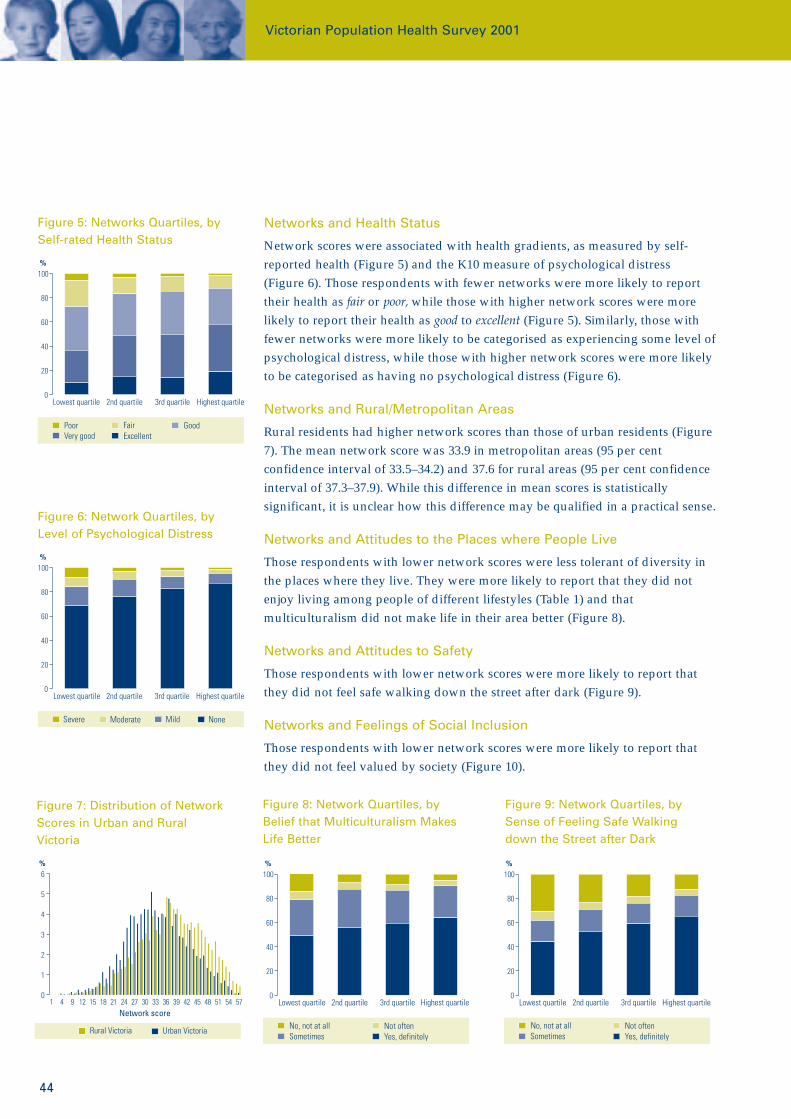
Networks and Health Status
Network scores were associated with health gradients, as measured by self-reported health (Figure 5) and the K10 measure of psychological distress(Figure 6). Those respondents with fewer networks were more likely to reporttheir health as fair or poor, while those with higher network scores were morelikely to report their health as good to excellent (Figure 5). Similarly, those withfewer networks were more likely to be categorised as experiencing some level ofpsychological distress, while those with higher network scores were more likelyto be categorised as having no psychological distress (Figure 6).
Networks and Rural/Metropolitan Areas
Rural residents had higher network scores than those of urban residents (Figure7). The mean network score was 33.9 in metropolitan areas (95 per centconfidence interval of 33.5–34.2) and 37.6 for rural areas (95 per cent confidenceinterval of 37.3–37.9). While this difference in mean scores is statisticallysignificant, it is unclear how this difference may be qualified in a practical sense.
Networks and Attitudes to the Places where People Live
Those respondents with lower network scores were less tolerant of diversity inthe places where they live. They were more likely to report that they did notenjoy living among people of different lifestyles (Table 1) and thatmulticulturalism did not make life in their area better (Figure 8).
Networks and Attitudes to Safety
Those respondents with lower network scores were more likely to report thatthey did not feel safe walking down the street after dark (Figure 9).
Networks and Feelings of Social Inclusion
Those respondents with lower network scores were more likely to report thatthey did not feel valued by society (Figure 10).
Victorian Population Health Survey 2001
44
Figure 6: Network Quartiles, byLevel of Psychological Distress
%
Severe Moderate Mild None
Lowest quartile 2nd quartile 3rd quartile Highest quartile0
20
40
60
80
100
Figure 7: Distribution of NetworkScores in Urban and RuralVictoria
%
Network score
Rural Victoria Urban Victoria
1 4 9 12 15 18 21 24 27 30 33 36 39 42 45 48 51 54 570
1
2
3
4
5
6
Figure 8: Network Quartiles, byBelief that Multiculturalism MakesLife Better
%
No, not at all Not oftenSometimes Yes, definitely
Lowest quartile 2nd quartile 3rd quartile Highest quartile0
20
40
60
80
100
Figure 5: Networks Quartiles, bySelf-rated Health Status
%
Poor Fair GoodVery good Excellent
Lowest quartile 2nd quartile 3rd quartile Highest quartile0
20
40
60
80
100
Figure 9: Network Quartiles, bySense of Feeling Safe Walkingdown the Street after Dark
%
No, not at all Not oftenSometimes Yes, definitely
Lowest quartile 2nd quartile 3rd quartile Highest quartile0
20
40
60
80
100

45
DiscussionSocial networks in the Victorian Population Health Survey 2001 were defined ascontact with family, friends, neighbours, local organisations, clubs andcommunity projects. Social networks relate to health because they are potentialsources of social support (psychological wellbeing), material resources andadvantages (social capital), and social influence (health behaviours).
The survey results showed that lower social network scores were associated with:• Having lower socioeconomic status.• Being born overseas.• Living in urban areas.• Self-reporting worse health status (both physical and psychological) .• Having more negative attitudes about the area in which the person lives.• Feeling less safe walking in the streets after dark.• Feeling less valued by society.
These findings support Berkman and Glass’s model (adapted in Figure 1),which suggests a relationship between socioeconomic factors, networks andhealth.3 Socioeconomic factors may affect the extent and nature of networks,which in turn affect opportunities to increase material and psychologicalwellbeing and therefore health. Further modelling will be required to determinethe importance of networks in the relationship between socioeconomic statusand health, and to elucidate the pathways that may be operating (social capital,social support, social influence and so on).
Several limitations have become apparent in the process of examining thesedata, leading to improvements in the questions for the 2002 survey. The firstlimitation was that the 2001 survey largely measured potential sources of socialcapital (the networks) but did not adequately examine the benefits that thosenetworks bestow on individuals (the outcomes). Some communities may behighly bound or networked (for example, Indigenous communities have strongkinship ties), but their networks may have a limited capacity to improve anindividual’s standard of living or life chances. Questions measuring networkcapacities have been developed for the 2002 survey. These will help todifferentiate the types of network that may be important in social capital andtherefore in community-building initiatives.
Further consideration also needs to be given to the process of network scoring,particularly to determine what network scores equate to in the real world. Thedevelopment of meaningful indicators of social structure from social surveyswill also need to be given more thought, particularly in ascertaining howattitudinal outcomes relate to real social structures. It will be necessary to drawon this type of research in other fields (such as the fear of crime as researched incriminology and sociology) to understand the results from these questions.
Attachment I
Figure 10: Network Quartiles, bySense of Feeling Valued by Society
%
No, not at all Not oftenSometimes Yes, definitely
Lowest quartile 2nd quartile 3rd quartile Highest quartile0
20
40
60
80
100
Victorian Population Health Survey 2001
46
The purpose of population health surveillance is to provide time seriesinformation on health status and the determinants of population health to thosewho plan or implement prevention and control measures.11 The critical role ofsurveillance output is that it provides information for action. This role requiresclear and well-defined concepts that have been carefully explored for technicalvalidity and reliability, as well as from a practical perspective. Social capitalconcepts are in their infancy; the theory and measurement of social capital arenot advanced enough for current population surveillance systems to generatesimple, clear indicators.
This description of our experiences with the collection of population-based dataon social networks is intended to stimulate discussion about the design of socialcapital questions in health surveys and about the utility of informationgenerated from those questions. The aim is an improved understanding of thedeterminants of inequalities in health, so they may become the focus of targetedpublic health interventions.
References1. Glover J, Harris K, Tennant S. A social health atlas of Australia, second
edition. Volume 3: Victoria. Adelaide: Public Health InformationDevelopment Unit, Adelaide University, 1999.
2. Vos ET, Begg SJ. The Victorian burden of disease study. Melbourne:Department of Human Services Victoria, 1999.
3. Berkman LF, Glass T. Social integration, social networks, social support andhealth. In: Berkman LF, Kawachi I, eds. Social epidemiology. New York:Oxford University Press, 2000.
4. Bourdieu P. The forms of capital. In: Richardson JG, ed. Handbook of theoryand research for the sociology of education. Connecticut: Greenwood Press,1985:chapter 9.
5. Coleman J. Social capital in the creation of human capital. Am J Sociol1988;94(suppl):s95–s120.
6. Harpham T, Grant E, Thomas E. Measuring social capital within healthsurveys: key issues. Health Policy Plan 2002;17(1):106–11.
7. Portes A. Social capital: its origins and applications in modern sociology.Annu Rev Sociol 1998;24:1–24.
8. Bullen P, Onyx J. Measuring social capital in five communities in NSW: apractitioner’s guide. Sydney: Management Alternatives, 1998.
47
9. Miilunpalo S, Vuori I, Oja P, et al. Self-rated health as a health measure: thepredictive value of self-reported health status on the use of physicianservices and on mortality in the working-age population. J Clin Epidemiol1997;50(5):517–28.
10. Andrews G, Slade T. Interpreting scores on the Kessler psychological distressscale (K10). Aus NZ J Public Health 2001;25(6):494–7.
11. Choi BCK. Perspectives on epidemiologic surveillance in the 21st century.Chronic Dis Can 1998;19(4):145–51.
Jeanette Pope AssocDipAppSci (OHS) BHlthSci (Hons) is a Public HealthTrainee at the Department of Human Services. Adrian Serraglio BSc is a SeniorProject Officer with the Victorian Population Health Surveys, HealthSurveillance and Evaluation Section, Department of Human Services. LorettaVaughan BAppSc MPH is Manager of the Victorian Population Health Surveys.
Contact: Loretta VaughanTel. 03 9637 4286, Fax 03 9637 4763Email [email protected]
Attachment I

Victorian Population Health Survey 2001
48
Capitals and Indicators—Signposts to the FutureDavid Adams
IntroductionWhile the words are a little dense and still need translating, the idea ofinterdependent capitals was one of the more important international policydevelopments over the past decade. This view of policy claims that the keydrivers of societal prosperity and wellbeing (the types of outcome that peopleseek in life and therefore that interest governments) are increasingly linked tohow the four capitals interact. The four capitals are:• Economic capital (about how wealth is created).• Human capital (about how learning and skills are acquired through life).• Social capital (about the quality of our relations with others).• Natural capital (about the sustainability of our environment).
The challenge for all governments is to simultaneously promote all four capitalsand leverage the links between them. While the days of acting on thesupremacy of economic policy and compensating the losers (externalities) areover, the new policy mix is still emerging and being expressed in ideas such aspublic–private partnerships, the triple bottom line, corporate citizenship,sustainability and community building. This is the modern policy turf of bothgovernments and business.
Making sense of these interdependencies is going to take some time. The causalchains are not obvious and often missing, but there are correlations andassociations that can no longer be ignored. We are still relying on new researchto help us understand the nature of relationships among the capitals. Somerelationships are known—for example, the link between investments ineducation and the productivity of nations. Similarly, the links between creativityin the arts and innovation in industry have helped spawn many new industryclusters. The basics of life are usually linked to all four capitals. Good waterquality, for example, is good for industry, good for the environment and goodfor people.
But there are many other relationships to be sorted. These include the basic risksof viewing social capital through a normative lens when much of the power ofsocial capital historically has been mobilised for the purposes of exclusion andoppression. Social capital has grabbed most attention recently, with theOrganisation for Economic Cooperation and Development (OECD) probably stillout in front with thinking about the interdependence issue. Putman, of the well-known ‘Bowling alone’ story,1 was quite impressed with the Victorian PopulationHealth Survey design. He noted that few other governments are seriously dealingwith the social capital issues in the manner of Victoria (personal communication,Professor Putnam, Kennedy School of Government, October 2001).
Attachment II

49
Victoria is grappling with the issues because there is increasing evidence thatgovernments can improve prosperity and wellbeing outcomes by betterleveraging social capital; similarly, governments can make a mess of socialcapital if they do not understand how fragile it can be. But we still do notproperly understand the new discourse: a discourse about trust, identity,belonging, reciprocity and mutuality. From the language of markets we havemoved to the language of communities and families. Yet many of the cultures,structures and processes are still embedded in the culture of markets andhierarchies.
Three major indicator developments have accelerated the importance of socialcapital thinking. First, we are observing a steady flow of social capital data. Wecan now measure social capital; more accurately, we can measure the siteswhere social capital is created and expressed (such as the many forms ofnetworks) and the effects of social capital (for example, levels of trust). Theevidence base is building, helping us understand the nature and forms of socialcapital, and the conditions under which particular forms seem to grow andchange.
Second, the availability of international benchmarks has generated interest inunderstanding why social capital may vary so much between nations andregions, and whether and how such variations can be explained. Nations ingeneral and governments in particular have a tendency to want to performbetter than competitors, including in generating levels of trust in publicinstitutions, for example.
Third, the interdependence of the four capitals has led to a rush to developcomposite measures of wellbeing. These compete with the more traditionaleconomic measures such as gross domestic product. In Australia, we have thework of the Australia Institute (the Genuine Progress Indicator) and theAustralian Bureau of Statistics (Measuring Australia’s Progress), for example.Composite measures ostensibly are better indicators of overall progress andmay provide a simpler method of measuring the pulse of a nation or a State(although State-level composite indicators are relatively underdeveloped).
Governments are also searching for new planning tools to guide a morebalanced approach to thinking about the future. In Victoria, the themes ofcaring, innovation and sustainability are germane to the Growing VictoriaTogether strategy, with lifelong learning shaping society’s future wellbeing. Wehave the four capitals—caring (social capital), innovation (economic capital),sustainability (natural capital) and lifelong learning (human capital)—as thefocus of our thinking about the future. The Growing Victoria Together strategy’s32 measures of progress try to capture the essence of the four capitals and theirinterdependencies. Many are social capital measures—for example, the numberof people to whom Victorians can turn in a crisis.
Attachment II
Victorian Population Health Survey 2001
50
In Victoria, the community building pilots are examples of how the Governmentis tentatively heading towards a possible new paradigm of balancing thecapitals, much as the Australian Assistance Plan (AAP) was a ‘new’ paradigm inthe 1970s. The AAP turned out to be a candle in the wind, but now we havesocial capital knowledge that we did not have then. We know, for example, thatcommunity building is not primarily about social policy; it is about all policyand it is about the ways in which local communities can choose to shape thedrivers of their futures.
Governments are most interested in questions such as the following: what doesthe ‘new’ knowledge about social capital tell us about the drivers of wellbeing?To what extent are these drivers amenable to influence from the levers ofgovernment (for example, regulatory and fiscal levers)? What are costs andbenefits of resetting the levers?
Much of the social capital research misses these crucial questions. The literatureeither operates at the level of broad social commentary or at the micro researchend of the scale. The community building projects and research such as theVictorian Population Health Survey are thus important, because they examinethose areas of social capital that are linked to the responsibilities andinfluencing capacities of a State Government. They build the evidence base.
Social capital issues are all around us but often we do not identify them as such.The high level of fare evasion on public transport in Victoria and the ongoingpublic liability insurance issue are examples of social capital policy issues. Theyare both about the conditions under which people choose to comply with rulesand the conditions under which rules (insurance rules) can threaten sites ofsocial capital (such as recreational activities).
The interdependence of the four capitals has profound implications forgovernance. The Western artefacts called ‘departments’ and ‘programs’, forexample, were constructed in an era when we believed that instrumentalitieswere the best way in which to organise and deliver government services such ashealth, education and tourism.
Some other forms of organising may be more appropriate to a policy world ofinterdependence. Some of our best thinkers are turning their minds to thismatter. Edgar has come up with the ‘patchwork nation’,2 while Botsman andLatham3 speak of the ‘enabling state’. ‘Place management’ is another expressionof this search for new organising principles that are better suited to people’s lifecourses, given that those life courses increasingly look like perpetually twistedtrajectories (in and out of work and caring, for example) rather than followinglinear and chronological stages.
51
Measuring the twists and turns of social capital and the links with health status,for example, will help generate the new knowledge base for better ways oforganising and delivering services. Indicators of social capital may turn out tobe as important to public policy in the next decade as measures of productivitywere in the past 20 years. Many of us await the day when our evening newsshows the human, social and natural capital indexes of our nation, not just theshare market indexes.
References1. Putman RD. Bowling alone: the collapse and revival of American
community. New York: Simon & Schuster, 2001.
2. Edgar D. The patchwork nation: re-thinking government, re-buildingcommunity. Sydney: HarperCollins, 2001.
3. Botsman P, Latham M, eds. The enabling state: people before bureaucracy.Annadale, New South Wales: Pluto Press, 2001.
Dr David Adams BA(Hons) BSW MA MPubPol PhD is Director of PolicyDevelopment and Research in the Department of the Premier and Cabinet(Victoria) and Visiting Fellow at the National Centre for Development Studies,Australian National University.
Contact: Tel. 03 9651 5264, Fax 03 9651 5115, Email [email protected]
Attachment II
