victorian training market quarterly report full year … training market quarterly report full year...
TRANSCRIPT

Victorian Training Market Quarterly Report Full Year 2012

Prepared by Department of Education and
Early Childhood Development
Melbourne
March 2013
©State of Victoria (Department of Education
and Early Childhood Development) 2013
The copyright in this document is owned by the State of Victoria
(Department of Education and Early Childhood Development), or in
the case of some materials, by third parties (third party materials).
No part may be reproduced by any process except in accordance
with the provisions of the Copyright Act 1968, the National
Education Access Licence for Schools (NEALS) (see below) or
with permission.
An educational institution situated in Australia which is not
conducted for profit, or a body responsible for administering such
an institution may copy and communicate the materials, other than
third party materials, for the educational purposes of the institution.
Authorised by the Department of Education
and Early Childhood Development,
2 Treasury Place, East Melbourne, Victoria, 3002

Contents
EXECUTIVE SUMMARY 6
PURPOSE AND BACKGROUND 11
Notes about the data and time periods 11
Reporting scope 11
VICTORIAN VOCATIONAL TRAINING SUMMARY 12
Introduction 12
The Policy Context of Vocational Training 9
The Economic Context of Vocational Training 13
The Performance of Vocational Training 15
Vocational Training Funding 17
Qualification Levels 21
Vocational Training Completions 26
Age Profile 29
Gender Profile 32
Apprentices and Trainees 34
Vocational Training Delivery by Provider Type 40
Adult, Community and Further Education (ACFE) Performance 43
HIGHER NEEDS LEARNERS AND FOUNDATION SKILLS 46
Vocational Training Delivery for Higher Needs Learners 46
Indigenous Students 47
Students with a Disability 50
Students with a Culturally and Linguistically Diverse (CALD) Background 53
Unemployed Students 56
Young People (Aged 15 to 19) without Year 12 and Not at School 59

Contents continued
Older Students with Low Prior Qualifications 59
Foundation Level Training 60
VOCATIONAL TRAINING AND VOCATIONAL BENEFIT 64
RESPONSIVENESS TO SKILLS NEEDS 65
Child Carers 70
Aged and Disabled Carers 71
Truck Drivers 72
Welfare Support Workers 73
Café and Restaurant Managers 74
Carpenters and Joiners 75
Electricians 76
Enrolled and Mothercraft Nurses 77
Plumbers 78
Motor Mechanics 79
INDUSTRY TRAINING PROFILES 80
Accommodation and Food Services 84
Administration and Support Services 88
Agriculture, Forestry and Fishing 91
Arts and Recreation Services 94
Construction 97
Education And Training 101
Electricity, Gas, Water and Waste Services 104
Financial and Insurance Services 107
Health Care and Social Assistance 110
Information Media and Telecommunications 113

Manufacturing 117
Mining 121
Other Services 124
Professional, Scientific and Technical Services 127
Public Administration and Safety 131
Rental, Hiring and Real Estate Services 134
Retail Trade 137
Transport, Postal and Warehousing 140
Wholesale Trade 144
REGIONAL TRAINING PROFILES 147
Loddon Mallee North 154
Loddon Mallee South 159
Wimmera Southern Mallee 164
Central Highlands 169
Great South Coast 174
Geelong And Surrounds 179
Hume 184
Gippsland 189
Northern Metropolitan 195
Southern Metropolitan 200
Eastern Metropolitan 206
Western Metropolitan 211
Inner Metropolitan 217
APPENDIX – KEY TERMS 222
APPENDIX – REFERENCES 223

6 Victorian Training Market Quarterly Report Full Year 2012
Executive Summary
This Victorian Training Market Report is the latest in an on-going series of reports produced by the Department of Education and Early Childhood Development (DEECD). The aim of the report is to provide a summary of Victorian training market performance and responsiveness to industry.
Context
With expenditure of $2.4 billion in 2011-12, the DEECD has specific responsibility for the government-subsidised Vocational Training market in Victoria to support industry in the provision of a highly skilled and capable workforce.
The Victorian system does this through the Victorian Training Guarantee, which provides an unlimited number of government subsidised training places available to people who meet the eligibility criteria. In July 2012, further reforms to the system refocused training subsidies away from over-supplied courses or those with little connection to job prospects towards courses of greatest public benefit and future jobs growth.
Vocational Training Performance in Victoria
In 2012 the Victorian training system reported steady growth, continuing the trend of recent years, with over 670,000 government subsidised enrolments, up 22 per cent from 2011 and 76 per cent since 2008. TAFE domestic fee for service activity also experienced growth, rising by 22 per cent between 2011 and 2012. With around 125,000 enrolments, fee for service now represents around 31 per cent of TAFE training activity. In line with the overall growth in vocational training enrolments over recent years, the numbers of reported completions have also increased, reaching 239,000 completions in 2012.
The number of government subsidised students enrolled in vocational training was 509,800 in 2012, representing an 18 per cent growth since 2011. Student contact hours also showed a 28 per cent increase during the same period.
Training Delivery Trends and Achievement
The growth in government subsidised enrolments has occurred across all Australian Qualification Framework (AQF) levels, with Certificate I–II up 30 per cent, Certificate III-IV up 27 per cent and Diploma and above witnessing lower growth but still up 9 per cent. The growth in Certificate I–II predominately related to training in foundation skills. Certificate III–IV remains the largest qualification group representing 60 per cent of all AQF course enrolments. Foundation courses grew well above the average across all courses, up 120 per cent.
381,300 376,800 426,900
548,700
670,400
89,400 100,800 103,700
102,200
124,900
2008 2009 2010 2011 2012
VET delivery by funding type, enrolments
Government subsidised TAFE domestic fee for service
Victoria Training Dashboard
The dashboard provides an overview of vocational education and training in Victoria between the 2011 and 2012.

Market Responsiveness and Productivity
Growth in vocational training activity has been particularly strong in sectors of critical importance to the Victorian economy, addressing skills shortages and occupations with specialised skill requirements. Enrolments in training are aligned with the changing occupational structure of the Victorian economy. 2012 enrolments are 18 per cent higher in in shortage qualifications and 11 per cent higher in specialised qualifications, compared with 2011 figures, equating to 152,300 and 80,200 enrolments respectively.
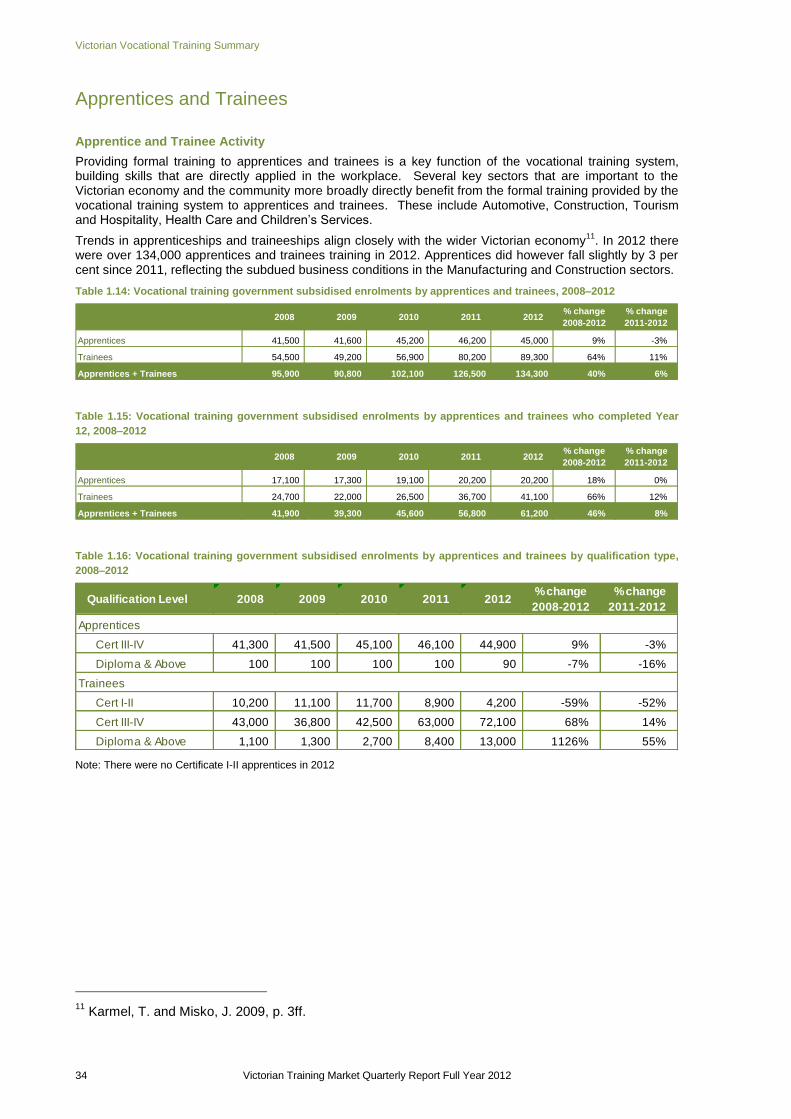
Trends in apprenticeships and traineeships align closely with the wider Victorian economy1. There were
over 134,000 apprentices and trainees training in 2012. Apprentices did however fall slightly by 3 per cent since 2011, reflecting the subdued business conditions in the Manufacturing and Construction sectors.
The strong enrolment growth has been repeated across the majority of Victoria‟s regions. Seven of nine regions, for example had growth of 10 per cent or higher, between 2011 and 2012. Enrolment growth has been strongest in most metropolitan regions, especially in Western Metro (up 37 per cent). In regional Victoria, growth has been highest in Hume (up 26 per cent). While Gippsland experienced a decline of 4 per cent, this does present an early indicator of a stabilising of enrolment numbers, following declines of 9 per cent between 2010 and 2011 and a 16 per cent decline between 2008 to 2009.
Government Subsidised Enrolments by Region, 2011 to 2012
Student Engagement and Wellbeing
Higher needs learners are actively engaged in vocational education and training with growth trends across critical groups such as Indigenous students, students with a disability and Culturally and Linguistically Diverse (CALD) students. There are now approximately 6,200 Indigenous students, over 40,000 students with a disability and 126,000 Culturally and Linguistically Diverse (CALD) students in the vocational training sector.
The vocational training sector continues to be an important pathway to employment, with 120,000 unemployed students engaged in government subsidised training, growth of 33 per cent between 2011 and 2012. Higher needs learners are not necessarily mutually exclusive
1 Karmel, T. and Misko, J. 2009, p. 3ff.
Higher Needs Learners (Government Subsidised Students), 2008 to 2012

Profile of Vocational Education and Training Government Subsidy
As part of the refocusing vocational reform, the government is retaining and strengthening the individual entitlement to a subsidised training place to ensure that businesses and students continue to have choice over what and where they study and ensuring the cost of such access remains sustainable and in areas of greatest public value. The public value of courses has been assessed on the basis of its value to the economy (in terms of jobs or productivity and essential services) and the extent to which government investment is required to stimulate delivery of, and participation in, this training to meet industry needs.
Under the new arrangements, higher hourly subsidy rates have been attributed to foundation and apprenticeship qualifications, and lower rates to diplomas and above (where there is higher private benefit and income contingent student loans available) and to lower-level certificates where direct vocational benefit is lower.
The subsidy for each course reflects an assessment of its current „public value‟- with courses of greatest public value receiving the highest level of subsidy (Band A), and courses of lowest public value the least (Band E). For example, the highest subsidy bands (Bands A and B) include all apprenticeships, all foundation courses and many courses relating to skills shortage and specialised occupations such as builders, electricians, plumbers, aged care, nursing and renewable energy.
There has been a marked shift in commencement patterns since the reforms were introduced in July 2012. Following the reforms, 65 per cent of government subsidised commencing enrolments in 2012 were within Bands A and B, whereas in the pre July 2012 period, 49 per cent of commencements were within these bands. Correspondingly courses with less need for higher levels of government investment (Bands D and E) represented approximately 13 per cent of government subsidised commencements post July 2012, down from 31 per cent pre July 2012. Similar patterns can be seen when comparing funding bands to full year 2011. Overall trends show training activity moving towards courses of higher public value and labour market need.
2012 Commencing enrolments by Funding Bands
11%
8%
9%
54%
41%
35%
22%
20%
24%
4%
10%
11%
9%
21%
21%
0% 10% 20% 30% 40% 50% 60% 70% 80% 90% 100%
Post July 2012
Pre July 2012
2011
Proportion of commencing enrolments by subsidy band 2011 and 2012 preliminary data pre vs. post July commencements
Band A
Band B
Band C
Band D
Band E

The Policy Context of Vocational Training
The National Agreement for Skills and Workforce Development (NASWD) came into effect on 1 January 2009, and sets out the commitment between the Australian Government and State and Territory Governments to work towards increasing the skill levels of all Australians, and enhancing the accountability to the public for the outcomes achieved.
The NASWD has one overarching objective and two key performance targets. These performance targets are subsequently supported by seven performance indicators. A summary of Victoria‟s performance against these targets and indicators is detailed in the Performance of Vocational Training section below.
Vocational training is an area of shared responsibility. Commonwealth, state and territory governments provide funding, develop national and jurisdictional policies for the training system and share responsibility for the regulation, governance and quality assurance of the vocational training sector. State and territory governments manage the delivery of vocational training within their jurisdictions and have traditionally provided approximately two thirds of the funding in the vocational training system. Industry plays a role in identifying training needs and working directly with the training market and with Industry Skills Councils to develop appropriate training packages and qualifications to meet these needs.
Victoria has a strong focus on lifelong learning as a means of building human capital. As the Victorian economy shifts away from the reliance on the traditional agricultural and manufacturing sectors and moves to service industries having a greater share of economic activity and employment, we need a more highly skilled and more productive workforce.
The Victorian vocational training system has been on a reform trajectory for over twenty years. This trajectory has run in parallel with broader public management reform trends through the 1990s and 2000s and Victoria‟s vocational training system had often been a public sector reform leader.
In the early 1990s the system involved a TAFE-centred, Government managed model. This evolved first to a Government planned purchaser-provider model which allowed a range of providers to deliver training services on behalf of Government. Despite the efficiency benefits realised, by the late 2000s it was clear a centrally planned and purchased system was not well suited to deliver the increasingly complex types of training Victoria needed and that delivery activity was misaligned with industry needs.
In 2008, the Victorian Training Guarantee (VTG) was introduced, placing the purchasing power for training in the hands of students. The VTG allowed individual students to access government subsidised training places in the course of their choice and at a range of providers. To facilitate this entitlement, the overall number of training places was uncapped and places were no longer allocated to particular providers. The introduction of the VTG released pent up, latent demand for skills training. Between 2008 and 2012 there was an increase in government funded VET enrolments from 381,300 to 670,400 people – representing 75 per cent growth in enrolments in the system.
While the VTG resulted in significant growth in government funded activity and in areas of industry and economic need, it also revealed opportunities for improvement as some elements of the new market-based training system design were sub-optimal. In response, the Victorian Government released the Refocusing Vocational Training in Victoria reform package in May 2012. The government is retaining and strengthening the individual entitlement to a subsidised training place to ensure that businesses and students continue to have choice over what and where they study and ensuring the cost of such access remains sustainable and in areas of greatest public value. The public value of courses has been assessed on the basis of its value to the economy (in terms of jobs or productivity) and the extent to which government investment is required to stimulate delivery of, and participation in, this training to meet industry needs.
National Agreement for Skills and Workforce Development
Objective: A vocational education and training (VET) system that delivers a productive and highly skilled workforce, and which enables all working age Australians to develop the skills and qualifications needed to participate effectively in the labour market and contribute to Australia‟s economic future; and supports the achievement of increased rates of workforce participation.
Performance Targets:
1. Halve the proportion of Australians nationally aged 20–64 without qualifications at Certificate III level and above between 2009 and 2020.
2. Double the number of higher level qualification completions (Diploma and Advanced Diploma) nationally between 2009 and 2020.

All caps on the fees providers can charge have also been removed. Providers are now free to set prices they believe reflect the quality of their training. However, protections for low income students via retention of a concessions fee regime for certificate I-certificate IV level qualifications have been maintained. While VET FEE-HELP is available for students undertaking Diplomas and Advanced Diplomas.
The Government has continued and expanded access to subsidised training for low SES young people, Indigenous Victorians and students in regional and rural Victoria. The Government provides additional assistance through subsidy loadings for students most in need. Subsidised pathway programs through pre-accredited training have also been maintained to ensure pathways to vocational training for those most in need. These investments are making sure people facing barriers into employment and/or with low incomes are able to access quality vocational training.
As Victoria‟s economy continues to experience significant change, a new industry architecture has also been developed that engages directly with industry to ensure the training market stays aligned with changes in industry need. The model features a series of mechanisms to facilitate direct industry engagement, such as the Industry Skills Consultative Committee, Industry Roundtables and one to one consultations with industry groups across all regions. These mechanisms enable government to monitor the responsiveness of the training market to industry skills needs and to identify priorities for market facilitation to improve responsiveness.
The new training system also recognises the need for stronger contract management, performance monitoring and quality assurance. There have been concerns about the quality of training which have come about because of the way the system used to operate. In some cases students and the Government were not getting what they paid for and employers were not finding vocational training graduates with the skills they need for their workplaces.
That said, the vast majority of providers do offer high quality training, focussed on the needs of students and industry. However a small number did not – and we needed to act on this.
Providers seeking to offer government-subsidised training now have to meet tougher contract standards than was the case previously. The Victorian Registration and Qualifications Authority has been given stronger regulatory powers of inspection and enforcement.
We also needed to do better with the level and quality of information we made accessible for people to decide about their training options. Employers and students can now access a new one-stop shop training website – the Victorian Skills Gateway - and providers will be required to disclose price and quality information upfront to prospective students. Industry is also being supported to engage much more directly with training providers to ensure their skills needs are met, rather than more passively accepting market outcomes or seeking additional government assistance to address skills gaps. This means that industry and business will better be able to attract people.
Victoria needs to ensure strong oversight of the new training market. A Market Monitoring Unit (MMU) has been established. The role of the MMU is to monitor how the training market is functioning including, quality, price and competition. The unit will track market activity and advise the Government on these issues to inform future subsidy levels.
In addition to a focus on improving outcomes for students and industry, the Refocusing Vocational Training in Victoria initiative recognised that a modern vocational training system requires a network of well-functioning and modern TAFE institutes delivering in their areas of strength alongside other providers.
Following the release of Refocusing Vocational Training in Victoria, the Government requested that TAFE institutes develop Business Transition Plans to demonstrate how they would transition to a competitively neutral training market.
To support the process, the Government appointed an independent expert four-member TAFE Reform Panel to provide advice on the Business Transition Plans and system-wide opportunities for efficiencies and structural reform. The TAFE Reform Panel met with all TAFE institutes and other key stakeholders during this process, and submitted its final report to the Government in December 2012.

Purpose and Background
This report has been prepared for the Minister for Higher Education and Skills, the Senior Executive of DEECD and other key stakeholders in the vocational training system. Its purpose is to summarise emerging trends in the Victorian training market in 2012 and provide a comparative overview of market changes relative to 2012 and 2008 – the year before a series of reforms started to take place.
Key metrics include training delivery by funding source, qualification level, completions, employment status, higher needs learners and region. An analysis of the responsiveness of training delivery to specific occupational needs, industry and regional profiles are also provided.
Notes about the data and time periods The main source of vocational training statistics in this publication is the training activity database referred
to as SVTS. All government subsidised providers are required to submit their data using SVTS at least once a month in accordance with the Australian Vocational Education & Training Management Information Statistical Standard (AVETMISS). For TAFE Institutes, there is an additional regulatory requirement that they also submit their fee for service data.
Figures may differ to those in previous publications as the DEECD is currently re-casting data to improve consistency across years.
The 2012 data is based on preliminary data extracted from SVTS as at 6 Feb 2013. Figures may be revised slightly prior to submission to National Centre for Vocational Education and Research (NCVER).
Reporting scope This report includes government subsidised activities in all sectors at all qualification levels, and domestic
fee for service activities in the TAFE sector at Australian Qualification Framework (Certificate I and above).
Fee for service activities below Certificate I in the domestic TAFE sector are not included, such as short courses. Fee for service activities that took place in the private RTO and Adult Community Education sectors are also outside the scope.
Data on completions is the only exception – in completions, the reported completions contain all government subsidised and fee for service enrolments at any course level by all providers (TAFE and non-TAFE). However, it is important to note that course completions are not a „required‟
2 field for the
vocational training data collection, so completions data is indicative only of completions patterns between 2008 and 2012.
In 2012, the scope of reporting of government subsidised training changed. ZC - Corrections delivery contracted directly with TAFE Institutes and ZP - Corrections funding through private prisons are now allocated to fee for service funding. Prior to 2012, these funded enrolments were allocated to government subsidised training.

Victorian Training Market Quarterly Report Full Year 2012 12
Victorian Vocational Training Summary
Introduction The Victorian Government‟s Department of Education and Early Childhood Development has an ambitious goal:
It will to do this by focusing on significant and measurable improvements in four key outcomes: achievement, engagement, wellbeing and productivity.
With expenditure of over $2.4 billion in 2011-12, the DEECD has specific responsibility for the government-funded Vocational training market in Victoria in support of this goal.
In particular, as outlined in the Victorian Budget for 2012-13, the Group is responsible for delivering two key objectives:
1. Responsiveness to labour market demand: to supply the skills needed for a changing labour market to improve labour market outcomes
2. Effective educational, labour market and social participation: to equip Victorians of all ages with the skills and capabilities to enable educational, labour market and social participation.
This report summarises the performance of the government subsidised vocational education and training (vocational training) market in the context of the Department‟s strategic goal, outcomes and objectives. It examines the training market‟s key features, trends and changes between 2008 and 2012 in terms of performance, participation and productivity in response to the two objectives outlined above.
In particular, the report considers the performance of the vocational training sector in meeting current and emerging industry and labour market needs through addressing known and emerging skills shortages at the industry and regional level, targeting areas of greatest public benefit, supporting the participation of higher needs learners and fuelling economic growth, within the budget allocated.
to lift Victoria’s education, learning and development outcomes into the global top tier, over the next ten years

Victorian Vocational Training Summary
Victorian Training Market Quarterly Report Full Year 2012 13
The Economic Context of Vocational Training
Securing Victoria’s Economy is the Victorian Government‟s strategy to strengthen Victoria‟s economic future. Released in December 2012, this strategy lays out a vision for Victoria‟s economic future, and sets out key actions the Government will take to secure Victoria‟s position, not just as a leading state, but also as a regional economic centre, benefiting from and contributing to the Asian century. The strategy states that:
Recent Economic Trends
Although there have been mixed results and a degree of fluctuation across a number of leading economic indicators in what has been a challenging year throughout 2012, Victoria‟s current economic outlook is sound.
Victorian real Gross State Product (GSP) grew by 2.3 per cent in 2011-12 to $323 billion; and although below the national level of 3.4 per cent, it was comparable with New South Wales (2.4 per cent) and ahead of the other non-mining states. Forecasts for 2012-13 and 2013-14 suggest Victorian GSP growth of 2.0 per cent and 2.7 per cent, respectively…..Gross State Product.
Figure 1.1: Participation rates across selected states, and Australia, 2012
Employment levels have showed some volatility across the year, and Victoria‟s overall growth in employment of 1.3 per cent during 2012 was mainly driven by growth in part-time employment, which increased by 3.7 per cent over the year. By the end of 2012 (December), the state unemployment rate stood at 5.6 per cent (national average was 5.4 per cent) and the labour market participation rate at 65.2 per cent. However, although unemployment levels in Victoria have tracked slightly above the national average for the year, participation rates have remained in line with national averages, and Victoria‟s labour participation rate is the highest among the non-mining states.…..employment levels.
Source: Australian Bureau of Statistics, Labour Force Survey, seasonally adjusted participation rates.
At the industry level, the high Australian dollar continues to challenge Australian and Victorian exports. That said, rural exports are currently just below a record high, bolstered by a high winter crop yield, and services exports were at their highest since January 2009. Exports of manufactures have fluctuated in recent months…..exports.
Victoria‟s Performance of Manufacturing Index (PMI) remains well below the 50 point mark, which defines contraction from expansion and highlights the decline in business conditions and confidence over the same period. This continued contraction in the PMI is consistent with the national picture, and not specific to Victoria. The Services sector has also shown ongoing contraction in the indices since February, although this now appears to be easing…..business sentiment.
Household consumption is currently growing around trend, despite survey measures of consumer sentiment remaining largely pessimistic over the past year. More recently, Victorian consumer sentiment has
“A strong and vibrant economy is fundamental for Victoria‟s future. It will generate the confidence, investment and employment vital for Victoria‟s ongoing prosperity and will enable future generations to benefit from higher living standards.”
62
63
64
65
66
67
68
Jan
-20
12
Feb
-20
12
Mar
-20
12
Ap
r-2
01
2
May
-20
12
Jun
-20
12
Jul-
20
12
Au
g-2
01
2
Sep
-20
12
Oct
-20
12
No
v-2
01
2
De
c-2
01
2
Qld
Vic
Aus
NSW

Victorian Vocational Training Summary
14 Victorian Training Market Quarterly Report Full Year 2012
improved, which has been positive news for the Retail sector, and reflected in total Retail turnover growth of 1.3 per cent during 2012…..upturn in Retail.
Sentiment in the Construction industry remains subdued, and activity on a month-by-month basis has fluctuated. However, there are now signs that the residential sector is picking up, and Victoria also had the highest level of non-residential building approvals of all states over the year to December, with a 1.3 per cent increase in approvals……Construction outlook.
The Productivity Challenge
Over the last decade Victoria‟s productivity growth has been easing. In the five-year productivity growth cycle ending 2003-04, Victoria‟s average annual labour productivity growth increased by tow per cent, above the national average. In the latest cycle (ending 2011-12), early estimates suggest that it grew by an average of only 0.5 per cent, well below the national average of 1.1 per cent
3.
According to the Victorian Competition and Efficiency Commission‟s (VCEC) report into Securing Victoria’s Future Prosperity
4, this decline in productivity growth matters because it is ultimately the major determinant
of Victoria‟s material standard of living, as is labour market participation. And while businesses need to lift their competitiveness to meet the high Australian dollar, slow productivity growth makes structural adjustment more difficult to manage, and for some businesses, rapidly lifting their productivity is imperative for their ability to survive.
The Role of the Education and Training System
Increased educational attainment and training build human capital, which is strongly linked to improvements in labour force participation, productivity and economic growth. Analysis by VCEC suggests that labour quality improvements were responsible for about 40 per cent of Victoria‟s average productivity growth from 1990 to 2010. Indeed, the White Paper Australia in the Asian Century specifies skills and education as one of the five pillars of productivity on which Australia will need to continue to build upon in order to extend its comparative advantage. It also identifies Australia‟s greatest responsibility as being to invest in its people through skills and education to drive productivity performance and ensure that all Australians can participate and contribute. Job-specific skills are identified as particularly important in this respect.
As well as increasing productivity by improving the skills of the existing and future workforce, the education and training system also plays a key role in raising participation, thereby building a more cohesive society and improving the life chances of the disadvantaged and those at risk of disengagement. The Victorian Training Guarantee specifically encourages and supports the participation of higher needs learners in vocational training, showing success in substantially improving participation rates across a range of student groups. For example, between 2008 and 2012, there has been a:
184 per cent increase by unemployed students
42 per cent increase by Indigenous students
68 per cent increase by students reporting a disability
117 per cent increase by Culturally and Linguistically Diverse students
However, simply improving participation is not enough. Recent reforms to the Victorian vocational training system have been designed to continue to improve performance, and alignment with industry needs, proactively supporting both current and future skills and training requirements and employment outcomes.
Over recent years, positive steps have been made in this direction, with a 41 per cent increase in enrolments between 2008 and 2012 in courses aligning with occupations that are identified as specialised,
3 Securing Victoria‟s Economy – Planning, Building, Delivering, December 2012. A copy of this report can be found on the
following website: http://www.premier.vic.gov.au/media-centre/media-releases/5740-victoria-a-leading-state.html
4 Copies of all VCEC‟s reports can be found on their website: www.vcec.vic.gov.au, listed under „Publications‟.
Australia in the Asian Century can be found on the Department of the Prime Minister and Cabinet‟s website: http://asiancentury.dpmc.gov.au/white-paper

Victorian Vocational Training Summary
Victorian Training Market Quarterly Report Full Year 2012 15
an 81 per cent increase in „in shortage‟ occupational areas and a 40 per cent increase in apprenticeships and traineeships.
The next section summarises the latest position for Victoria in terms of performance against the National Agreement for Skills and Workforce Development performance targets and indicators.
The Performance of Vocational Training
Consistent with the Council of Australian Governments (COAG) National Agreement for Skills and Workforce Development, the Victorian training system is delivering access to training for a wide range of cohorts, is responding to labour market need, and giving individuals the opportunity to develop the skills and qualifications needed to enable their effective participation in the labour market.
To date, Victoria‟s progress against the two performance targets of the National Agreement is as follows:
Note: National comparative data included in this section is based on the latest reported information for the year 2011 drawn from the report on Government Services 2013 by the Steering Committee for the Review of Government Service Provision.
The National Agreement for Skills and Workforce Development (NASWD) also outlines seven performance indicators, including one that is shared with the National Indigenous Reform Agreement. Victoria‟s progress against these is summarised below:
Indicator 1 - Proportion of working age population (aged 20-64) with higher level qualifications
(Certificate III and above):
In 2011, the NASWD reported that 56.9 per cent of Victorians and 55.3 per cent of Australians on average had achieved this level of attainment. In 2012, the government subsidised Victorian vocational training system had 457,000 people aged 20-64 enrolled in qualifications at Certificate III or above, an increase of 109 per cent since 2008.
Indicator 2 - Proportion of employers satisfied that training meets their needs:
In 2011, employer engagement and satisfaction levels with vocational training across Victoria were in line with the national averages:
28.8 per cent of Victorian employers reported that they engaged with apprenticeships/traineeships in the last twelve months; with an 83 per cent satisfaction rate;
22.7 per cent were engaged with nationally recognised training, of which 88 per cent were satisfied;
Halve the proportion of Australians nationally aged 20-64 without qualifications at Certificate III level and above between 2009 and 2020: In 2011 43.1 per cent of Victorians aged 20-64 were
without qualifications at Certificate III and above. This represents an improvement since 2009 when the figure stood at 47.5 per cent. In comparison, the Australian average figure for 2011 was 44.7 per cent. By the end of 2012, the government subsidised Victorian Vocational Training system is reporting 457,000 enrolments by students aged 20 to 24 years in qualifications at Certificate III level or above, an increase of 109 per cent since 2008.
Double the number of higher level qualification completions (Diploma and Advanced Diploma) nationally between 2009 and 2020: In 2010 there were 23,300 people across Victoria who had
achieved a Diploma or above level qualification through the publicly funded Vocational Training system. This represented 34.5 per cent of the total number of qualifications at this level across Australia, demonstrating that Victoria is punching above its weight for higher level attainment. By the end of 2012, there were 94,400 enrolments by students of all ages in Diploma and above level government subsidised qualifications across the state, an increase of 70 per cent since 2008.

Victorian Vocational Training Summary
16 Victorian Training Market Quarterly Report Full Year 2012
32.5 per cent had employed people with a formal vocational qualification as a job requirement in the past twelve months, with an 84.1 per cent satisfaction rate.
Indicator 3 - Proportion of working age population with adequate foundation skills (literacy level 3 or above):
The latest figures presented in the NASWD for this indicator relate to 2006 and estimate that 54 per cent of Victorians aged 15-64 and 56.5 per cent of Australians had a literacy level of 3 or above. In 2012, enrolments in government subsidised foundation courses across Victoria stood at 118,500, a 283 per cent increase since 2008
Indicator 4 - Proportion of working age population (aged 20-64) with or working towards a non-
school Australian Qualifications Framework (AQF) qualification:
The NASWD reports that in 2011, 68.4 per cent of Victorians aged 20-64, and 66.9 per cent of Australians on average already have, or are working towards a non-school AQF qualification. In 2012, the Victorian government subsidised vocational training system reported 607,200 enrolments by people aged 20-64 against this measure.
Indicator 5 - Proportion of vocational training graduates aged 20–64 years with improved
employment status after training:
In 2011, 63.4 per cent of Victorian vocational training graduates reported improved employment status after training, compared to the national average of 62.2 per cent. In 2012, 24 per cent of Victorian government subsidised enrolments were by students aged 20-64 that specified they were unemployed, an increase of 36.8 per cent over the past year, highlighting the importance of vocational training to students seeking employment outcomes.
Indicator 6 - Proportions of vocational training graduates aged 20-64 with improved education/training status after training:
This indicator seeks to identify the proportion of vocational training graduates that have achieved a higher education level than their previous highest qualification level. As a proportion of enrolments, 15.4 per cent of Victorian vocational training graduates completed qualifications at levels higher than their previous levels of attainment in 2010 (Australian average was 15 per cent). In 2011, Victoria continued to maintain its lead, along with the Australian Capital Territory for the highest proportion of vocational training qualifications completed being at Diploma level or above (19.8 per cent of all completed qualifications in 2010, compared to 15.3 per cent nationally).
Indicator 7 - Proportion of Indigenous 20–64 year olds with or working towards post-school qualifications:
The latest figures presented in the NASWD for this indicator relate to 2006 and estimated that 33.2 per cent of Indigenous Victorians, aged 20-64 had or were working toward post-school qualifications in Certificates III, IV, Diploma or Advanced Diploma, compared to the national average of 25.6 per cent. In 2012, there were 7,000 enrolments by Indigenous students aged 20-64 in the government subsidised Victorian vocational training system, of these, 4,200 were at Certificate III or above, an increase of 18.5 per cent since 2008
More detail about the performance targets and indicators of the National Agreement, can be found on the Productivity Commission‟s website: http://www.pc.gov.au/gsp/national-agreements/workforce

Victorian Vocational Training Summary
Victorian Training Market Quarterly Report Full Year 2012 17
Vocational Training by Funding Type
As part of the Refocusing Vocational Training reform from July 2012 five funding bands for government subsidised training were introduced. Under these arrangements, higher rates have been attributed to foundation and apprenticeship qualifications, and lower rates to Diplomas and above (where income contingent student loans are available) and to lower-level Certificates where direct vocational benefit is lower.
With regard to the second factor, weightings were previously applied to broad industry categories. The applicable „industry weighting‟ was informed by historical estimates of the cost of delivery.
Under the new arrangements, weightings have been refined to apply at the course level according to an assessment of public value. Public value has been determined on the basis of the value of the course to the economy (in terms of jobs or productivity or essential services) and the extent to which government investment is required to stimulate delivery of, and participation in, this training to meet industry needs.
Overall, the highest subsidy levels have been provided to courses where contribution to the economy is assessed as high, and where government subsidy is seen as essential in enabling delivery and participation in training.
Vocational Training Delivery by Funding Type
This section of the report provides an overview of training activity measured in terms of enrolments, student contact hours and student numbers.
The Victorian training market has seen continued growth over the last five years. In 2012 the Victorian training system had over 670,000 government subsidised enrolments, up 22 per cent from 2011 and 76 per cent since 2008. TAFE domestic fee for service provision has experienced growth of 22 per cent between 2011 and 2012, with around 125,000 enrolments and now represents around 31 per cent of TAFE training activity. Full data on all providers fee for service training will be available from 2014.
Table 1.1: Vocational training delivery by funding type, enrolments, 2008–2012
Figure 1.2: Vocational training delivery by funding type, enrolments, 2008–2012
2008 2009 2010 2011 2012% change
2008-2012
% change
2011-2012
Government subsidised 381,300 376,800 426,900 548,700 670,400 76% 22%
TAFE domestic fee for service 89,400 100,800 103,700 102,200 124,900 40% 22%
Total 470,700 477,600 530,600 650,900 795,300 69% 22%
381,300 376,800 426,900
548,700
670,400
89,400 100,800 103,700
102,200
124,900
2008 2009 2010 2011 2012
VET delivery by funding type, enrolments
Government subsidised TAFE domestic fee for service

Victorian Vocational Training Summary
18 Victorian Training Market Quarterly Report Full Year 2012
Table 1.2: Vocational training delivery by funding type, student contact hours (millions), 2008–20125
Figure 1.3: Vocational training delivery by funding type, student contact hours (millions), 2008–2012
5 Note that a course enrolment indicates an enrolment by a student in specified course at a registered training organisation.
Training hours on the other hand measures the hours taken to deliver training. Total student hours is not an indicator of training
provider revenue.
2008 2009 2010 2011 2012% change
2008-2012
% change
2011-2012
Government sudsidised 87.4 95.6 112.4 146.9 188.8 116% 28%
TAFE domestic fee for service 17.1 20.4 19.4 18.5 21.9 28% 18%
Total 104.5 116.0 131.8 165.5 210.7 102% 27%
87.4 95.6 112.4
146.9
188.8 17.1 20.4
19.4
18.5
21.9
2008 2009 2010 2011 2012
VET delivery by funding type, hours (millions)
Government funded TAFE domestic fee for service

Victorian Vocational Training Summary
Victorian Training Market Quarterly Report Full Year 2012 19
Table 1.3: Vocational training delivery by funding type, students, 2008–2012
*TAFE students whose enrolments are made up of a combination of government subsidies and self-funding have been counted
in both funding categories. The total, however, has eliminated the duplicates.
Figure 1.4: Vocational training delivery by funding type, students, 2008–2012
Key Points
Vocational training has continued to grow for both the TAFE fee for service and government subsidised training segments. In 2012, there were 795,300 enrolments (up 22 per cent), 210.7 million student contact hours (up 27 per cent) and 603,200 students (up18 per cent).
Government subsidised vocational training has grown to 670,400 enrolments (up 22 per cent), 188.8 million student contact hours (up 28 per cent) and 509,800 student (up 18 per cent).
TAFE domestic fee for service activity showed growth with 124,900 enrolments (up 22 per cent), 21.9 million student contact hours (up 18 per cent) and 105,200 students (up 12 per cent).
For both government subsidised and TAFE fee for service enrolments the growth in student contact hours exceeded the overall growth in enrolments. This indicates that there is a trend towards more time intensive courses in 2012.
2008 2009 2010 2011 2012% change
2008-2012
% change
2011-2012
Government subsidised 294,700 299,600 339,200 430,300 509,800 73% 18%
TAFE domestic fee for service 80,400 93,100 96,000 94,200 105,200 31% 12%
Total* 366,700 381,300 422,500 512,900 603,200 64% 18%
294,700 299,600 339,200
430,300 509,800
80,400 93,100 96,000
94,200
105,200
2008 2009 2010 2011 2012
VET student numbers by funding type
Government subsidised TAFE domestic fee for service

Victorian Vocational Training Summary
20 Victorian Training Market Quarterly Report Full Year 2012
Vocational Training Funding Bands Pre and Post July 2012
Figure 1.5: Vocational training government subsidised commencing enrolments by funding bands, 2011 and pre and
post July 2012
Subsidy bands were introduced in 2012 and apply specifically to qualifications current in 2012. In order to allow comparison with
previous years, superseded courses have been assigned a subsidy band for analysis purposes only based on the bands of the
current course to which they most closely align.
Key Points
There has been a marked shift in commencement patterns from pre and post July 2012.
In the pre July 2012 period, 49 per cent of all government subsidised commencing enrolments were within funding bands A and B. Courses such as the Certificate III in Electrotechnology Electrician, Certificate III in Carpentry, Certificate III in Aged Care and the course in Initial General Education for Adults are represented in these funding bands.
Post July 2012 saw 65 per cent of commencing enrolments fall within bands A and B. Correspondingly, courses with less vocational outcome or in labour market oversupply (Band D and E) represented approximately 13 per cent of government subsidised commencements post July 2012, down from 31 per cent in pre July 2012.
Similar patterns can be seen when comparing funding bands to full year 2011. Overall trends show training activity moving towards courses of higher public value and labour market need.
A (11%)
A (8%)
A (9%)
B (54%)
B (41%)
B (35%)
C (22%)
C (20%)
C (24%)
D(4%)
D (10%)
D (11%)
E (9%)
E (21%)
E (21%)
0% 10% 20% 30% 40% 50% 60% 70% 80% 90% 100%
Post July 2012
Pre July 2012
2011
Proportion of commencing enrolments by subsidy band - 2011 and 2012 pre vs. post July commencements

Victorian Vocational Training Summary
Victorian Training Market Quarterly Report Full Year 2012 21
Qualification Levels
Vocational Training Delivery by Qualification Level
Attainment of qualifications, rather than short courses (i.e. through module only delivery), has become an increasingly important focus of State and Commonwealth governments. Lower level qualifications (Certificate I-II) provide those without post-school qualifications the foundation level skills (literacy, numeracy, work preparation) necessary to undertake further study or to find employment. A review of Victorian foundation skills training is planned for 2013. The objective of the review is to compare the effectiveness of different approaches and models of foundation skills training delivery to best support young people and low skilled adults to develop the core skills they need to participate in the workplace and modern life.
Mid-level skills are essential to the Victorian economy and help drive economic activity across the State. A significant proportion of apprenticeships and traineeships entail attainment of a mid-level qualification and are crucial to many key industries. Apprenticeships and traineeships are undertaken as a contract between the apprentice/trainee and an employer. While undertaking on-the-job learning, the apprentice/trainee receives complementary training through a vocational training provider.
Higher level qualifications have grown in demand by industry and the labour market, with the demand for high level skills growing at 2.5 times the rate of unskilled jobs
6. To meet this demand, State and
Commonwealth governments have focused on raising the qualification profile of Australians over the last decade. Higher level vocational training qualifications (Diploma and above) provide entry to higher skilled jobs and to further study – generally at university level where vocational training graduates obtain credits towards their undergraduate studies.
Vocational Training Delivery by Qualification Level, Government Subsidised Enrolments
Table 1.4: Vocational training government subsidised enrolments by qualification level, 2008–2012
6 Skills for Australians http://www.dpmc.gov.au/publications/skills_for_all_australians/chapter1_overview.html
Qualification level 2008 2009 2010 2011 2012% change
2008-2012
% change
2011-2012
Cert I-II 87,200 83,600 93,800 119,400 154,800 78% 30%
Cert III-IV 165,400 165,900 201,700 287,900 365,900 121% 27%
Diploma & Above 55,700 63,700 71,200 86,400 94,400 70% 9%
Module Only 50,200 40,700 37,300 30,300 30,600 -39% 1%
Secondary, SoA and other 22,900 22,900 22,900 24,700 24,700 8% 0%
Total 381,300 376,800 426,900 548,700 670,400 76% 22%

Victorian Vocational Training Summary
22 Victorian Training Market Quarterly Report Full Year 2012
Note: SoA – Statement of Attainment
Figure 1.6: Vocational training government subsidised enrolments by qualification level (AQF1+ only), 2011 and 2012
Key Points
Of the 670,400 government subsidised enrolments reported in 2012, 60 per cent were at the Certificate III-IV level and 25 per cent at the Certificate I-II levels. There was a lower proportion of enrolments at Diploma level and above (15 per cent).
The growth in government subsidised enrolments in 2012 has occurred across all Australian Qualifications Framework (AQF) levels; Certificate I-II (up 30 per cent to 154,800 enrolments), Certificate III-IV (up 27 per cent to 365,900) and Diploma and above (up 9 per cent to 94,400 enrolments). The growth in Certificate I to II predominately related to training in foundation skills.
A majority of courses at Certificate I-II level (58 per cent or 90,500 enrolments) were in Foundation Skills – work preparation, general education, language literacy and numeracy.
Module only training was up 1 per cent, with 30,600 enrolments, following a declining trend between 2008 to 2012, down 39 per cent over this period.
Students undertaking secondary school subjects in a vocational training environment, those undertaking a statement of attainment (SOA) and other related training had no change in 2012 compared to 2011.
Cert I-II24%
Cert III-IV58%
Diploma & Above18%
Percentage share of AQF enrolments, 2011
Cert I-II25%
Cert III-IV60%
Diploma & Above15%
Percentage share of AQF enrolments, 2012

Victorian Vocational Training Summary
Victorian Training Market Quarterly Report Full Year 2012 23
Vocational Training Delivery by Qualification Level, TAFE Domestic Fee for Service Enrolments
Table 1.5: TAFE domestic fee for service enrolments by qualification level (AQF1+ only), 2008–2012
Note: SoA – Statement of Attainment
Figure 1.7: TAFE domestic fee for service enrolments by qualification level (AQF1+ only), 2011 and 2012
Key Points
The total number of TAFE domestic fee for service enrolments in 2012 was 124,900, reporting a 22 per cent increase from 2011 and a 40 per cent increase since 2008.
TAFE domestic fee for service enrolments in 2012 have increased at Certificate III-IV level to 55,300 (up 29 per cent) and at Diploma level and above to 10,200 (up 20 per cent) since 2011. Enrolments for Certificate I-II have also increased to 57,700 (up 17 per cent).
Higher Education enrolments delivered by TAFE have grown to nearly 1,600 or by 15 per cent.
2012 figures reveal a larger proportion of enrolments at Certificate III-IV (45 per cent share) and a smaller proportion at Certificate I-II (46 per cent share) compared with 2011, while there was no change in the share of Diploma and above enrolments.
Module only enrolments and Secondary school enrolments in a vocational training environment, Statement of Attainment (SOA) and other related training enrolments are not reported against this funding source.
There was a significantly higher proportion of Certificate I–II enrolments in the TAFE fee for service market compared to government subsidised training, with 46 per cent and 25 per cent of all vocational training respectively.
Qualification level 2008 2009 2010 2011 2012% change
2008-2012
% change
2011-2012
Cert I-II 41,300 48,400 51,500 49,500 57,700 40% 17%
Cert III-IV 40,000 43,400 42,600 42,800 55,300 38% 29%
Diploma & Above 7,300 8,000 8,300 8,500 10,200 39% 20%
Higher Education 750 1,000 1,300 1,400 1,600 118% 15%
Total 89,400 100,800 103,700 102,200 124,900 40% 22%
Cert I-II49%
Cert III-IV42%
Diploma & Above
8%
Higher Education
1%
Percentage share of AQF1+ enrolments, 2011
Cert I-II46%
Cert III-IV45%
Diploma & Above
8%
Higher Education
1%
Percentage share of AQF1+ enrolments, 2012

Victorian Vocational Training Summary
24 Victorian Training Market Quarterly Report Full Year 2012
Vocational Training Delivery by Qualification Level, Government Subsidised Student Contact Hours
Table 1.6: Vocational training government subsidised student contact hours (millions) by qualification level, 2008–2012
Note: SoA – Statement of Attainment
Figure 1.8: Vocational training government subsidised student contact hours by qualification level (AQF1+ only), 2011
and 2012
Key Points
The growth in government subsidised student contact hours in 2012 continued across all AQF levels; Certificate I-II (up 23 per cent), Certificate III-IV (up 38 per cent) and Diploma and above (up 15 per cent). Module only student contact hours have also increased over this period – up 9 per cent following a decline between 2010 and 2011.
The proportion of government subsidised student contact hours by qualification level shows an increase in share at Certificate III-IV level (from 58 to 62 per cent), little change in share at the Certificate I-II level (from 16 per cent to 15 per cent), and a small decrease at Diploma level and above (from 26 to 23 per cent) compared with 2011.
While enrolments at Certificate I-II level have increased by 30 per cent, student contact hours have increased by a lower rate of 23 per cent – indicating that although enrolments have been increasing, average course duration at the Certificate I-II has shortened.
As enrolments and student contact hours at each qualification level have changed at different rates, average course duration varies at each level between 2011 and 2012:
- Certificate I-II level courses have shortened on average from 189 student contact hours to 180 student contact hours
- Certificate III-IV level courses have lengthened on average from 284 student contact hours to 308 student contact hours
- Diploma and above level courses have also lengthened on average from 415 student contact hours to 436 student contact hours.
Qualification level 2008 2009 2010 2011 2012% change
2008-2012
% change
2011-2012
Cert I-II 14.2 15.2 17.5 22.6 27.9 97% 23%
Cert III-IV 44.9 48.8 59.1 81.7 112.8 151% 38%
Diploma & Above 22.9 26.0 30.9 35.9 41.2 79% 15%
Module Only 1.4 1.6 1.6 1.3 1.4 0% 9%
Secondary, SoA and other 3.9 4.0 3.3 5.5 5.5 41% 0%
Total 87.4 95.6 112.4 146.9 188.8 116% 28%
Cert I-II16%
Cert III-IV58%
Diploma & Above26%
Percentage share by qualification level, 2011
Cert I-II15%
Cert III-IV62%
Diploma & Above23%
Percentage share by qualification level, 2012

Victorian Vocational Training Summary
Victorian Training Market Quarterly Report Full Year 2012 25
Table 1.7: Vocational training TAFE domestic fee for service student contact hours (millions) by qualification level
(AQF1+ only), 2008–2012
Note: Fee for service figures are TAFE domestic AQF1+ activity only. SoA – Statement of Attainment
Figure 1.9: TAFE domestic fee for service student contact hours by qualification level (AQF1+ only), 2011 and 2012
Key Points
The number of TAFE domestic fee for service student contact hours was over 21 million student contact hours in 2012, representing an 18 per cent growth from 2011 and reversing the downward trend witnessed since 2010.
The growth in fee for service student contact hours in 2012 was spread across all AQF levels; Certificate I-II up 20 per cent to 8.4 million, Certificate III-IV up 15 per cent to 9.5 million and Diploma and above up 27 per cent to 3.4 million.
The proportion of government subsidised student contact hours by qualification level showed a small decrease in share between 2011 and 2012 at Certificate III-IV level (from 45 to 43 per cent). This decline was off-set by a similar increase at Diploma level and above (from 14 to 16 per cent).
While enrolments at Certificate III-IV level have increased by 29 per cent, student contact hours have increased by 15 per cent – indicating that although enrolments have been increasing, course duration is on average shorter than in 2011.
Module only enrolments and Secondary school enrolments in a vocational training environment, Statement of Attainment (SOA) and other related training enrolments are not reported against this funding source.
As enrolments and student contact hours at each qualification level have changed at different rates, average course duration varies at each level between 2011 and 2012:
- Certificate I-II level courses have become slightly longer on average from 143 student contact hours to 146 student contact hours
- Certificate III-IV level courses have shorter student contact hours on average from 194 to 172
- Diploma and above have on average longer student contact hours from 317 student contact hours to 336 student contact hours.
Qualification level 2008 2009 2010 2011 2012% change
2008-2012
% change
2011-2012
Cert I-II 6.4 7.8 7.5 7.1 8.4 32% 20%
Cert III-IV 8.2 9.8 8.8 8.3 9.5 16% 15%
Diploma & Above 2.3 2.4 2.6 2.7 3.4 51% 27%
Higher Education 0.3 0.4 0.5 0.5 0.5 69% -1%
Total 17.1 20.4 19.4 18.5 21.9 28% 18%
Cert I-II38%
Cert III-IV45%
Diploma & Above14%
Higher Education
3%
Percentage share by qualification level, 2011
Cert I-II39%
Cert III-IV43%
Diploma & Above16%
Higher Education
2%
Percentage share by qualification level, 2012

Victorian Vocational Training Summary
26 Victorian Training Market Quarterly Report Full Year 2012
Vocational Training Completions
Vocational Training Completions
Apart from community and social benefits associated with higher levels of educational attainment, there is strong evidence
7 that people who complete vocational training qualifications are at an advantage in the
labour market in terms of employment and wage outcomes compared with those who do not complete their courses and those who do not enrol in any post-school education and training. The benefits associated with completion do not detract from the value of outcomes students may achieve from participating in vocational training courses, without necessarily completing their award (such as better skills associated with lifelong learning), but they do suggest that employment and earnings outcomes are improved for students who gain qualifications.
Following is a summary of vocational training completions between 2008 and 2012. Vocational training completions refer to course qualifications or a Certificate of Statement of Attainment that have been reported as being complete in the reporting year 2012. It is important to note that the reporting scope for completions in this report includes all government subsidised and fee for service enrolments at any course level by all providers (TAFE and non-TAFE). Completions data is indicative only of completions patterns between 2008 and 2012 and are known to under-report completions due to:
wide variations in administrative practices for Victorian training organisations in identifying, recording and reporting qualification completion, and
variations in student intent and behaviour in completing qualifications.
The DEECD (2012) Strategic Review of Completion Rates in Vocational Training found that one of the difficulties in providing accurate vocational training completion numbers is the quality of data that is collected, recorded and reported in the vocational training data system as course completions to date has not been a „required‟
8 field for the Vocational Training data collection. This includes different approaches to
reporting of awards and the monitoring of student progress at the training organisation level as well as variations in the types of software used for student information data management. Case studies also indicate that, if qualifications were issued to all students who are eligible for them, rates of qualification completion would be substantially higher.
It is also important to note that while the majority of students who enrol in a vocational training course intend to complete all of the modules or the whole course
9, some instead seek a skill or set of skills.
In Victoria, the Department has taken active steps to optimise completions data by:
1) Strengthening Service Agreements to explicitly require all RTOs to:
record the qualification completion as soon as possible after the student has completed the requirements of the award, and
issue the qualification to students who have completed it, and by auditing performance against this requirement;
2) Continuing to support public providers to:
improve their administrative practices, and
support their students to complete their vocational training qualifications.
7 University of Melbourne. Centre for Research on Education Systems. (2012). Strategic Review of Completion Rates in VET;
Karmel, Tom. (2012). VET Completions 2012. “Examining the Evidence.” Presentation. NCVER.
8 Training providers are not required to report against this measure in their Vocational Training data collections
9 Sampling data in Victoria of the NCVER‟s Student Intention Survey in 2011 showed that the overwhelming majority of students
commencing a vocational training qualification in Victoria – including 90 per cent of commencing students in Victorian TAFE
Institutes - intend to complete their qualification, with very little variation across the Victorian system.

Victorian Vocational Training Summary
Victorian Training Market Quarterly Report Full Year 2012 27
Table 1.8: Vocational training government subsidised and fee for service completions, 2008–2012
Figure 1.10: Vocational training government subsidised and fee for service completions, 2008–2012
Key Points
In line with the overall growth in vocational training enrolments over recent years, the numbers of reported completions have also increased, reaching 238,500 completions in 2012.
2012 figures reveal that total reported completions (government subsidised and fee for service) have grown by 27 per cent compared with 2011, and 79 per cent compared with 2008. Enrolments (government subsidised and fee for service) over the same periods have grown 22 per cent and 69 per cent respectively.
2008 2009 2010 2011 2012% change
2008-2012
% change
2011-2012
VET completions 133,300 133,400 152,600 187,500 238,500 79% 27%
133,300 133,400 152,600
187,500
238,500
2008 2009 2010 2011 2012
VET completions

Victorian Vocational Training Summary
28 Victorian Training Market Quarterly Report Full Year 2012
Table 1.9: Vocational training completions by qualification level, 2008–2012
Figure 1.11: Vocational training completions by qualification level, 2008 and 2012
Note: Government Subsidised and fee for service figures
Key Points
In 2012, there were 146,800 completions at Certificate III-IV levels, continuing to be the largest share (63 per cent) of all completed AQF qualifications. This represents a 37 per cent growth from 2011 and a 144 per cent growth since 2008.
Completions at Certificate I-II levels were 44,600, making up 19 per cent of the total AQF qualification completions. This category has experienced a growth of 18 per cent from 2011.
There were 43,000 completions at the Diploma level and above in 2012, representing 18 per cent of all AQF completions. This category has increased 23 per cent from 2011.
Higher Education in the vocational training sector, which shares 0.2 per cent of all completions, grew by 41 per cent over last year to just below 500 completions.
Secondary, Statement of Attainment (SoA) and other non-award completions have declined by 84 per cent between 2008 and 2012. Seventy-four per cent of completions in this category relate to Statements of Attainment. This has fallen over this period from approximately 10,800 in 2008 to 2,700 completions in 2012 and in part reflects a change in reporting practice within TAFE Institutes. Secondary Education, which reflects approximately 10 per cent of this group, has increased over this period from under 100 completions to close to 400.
2008 2009 2010 2011 2012% change
2008-2012
% change
2011-2012
Cert I-II 25,200 26,300 29,100 37,900 44,600 77% 18%
Cert III-IV 60,200 64,600 75,100 107,100 146,800 144% 37%
Diploma & Above 24,900 24,100 30,800 35,000 43,000 73% 23%
Secondary, SoA and other 22,900 18,100 17,500 7,200 3,700 -84% -49%
Higher Education 90 170 180 340 480 461% 41%
Total 133,300 133,400 152,600 187,500 238,500 79% 27%
Cert I-II23%
Cert III-IV54%
Diploma & Above23%
Higher Education
0.08%
VET completions by qualification level, 2008
Cert I-II19%
Cert III-IV63%
Diploma & Above18%
Higher Education
0.2%
VET completions by qualification level, 2012

Victorian Vocational Training Summary
Victorian Training Market Quarterly Report Full Year 2012 29
Age Profile
Vocational Training Delivery by Age Group
To enable the increased workforce participation levels required by the Victorian economy over the next decade, improved engagement with education and training by all age groups is required.
10
Students by Age Group in Government Subsidised Training
Table 1.10: Vocational training students by age group - government subsidised, 2008–2012
Figure 1.12: Vocational training students by age group - government subsidised, 2011 and 2012
10
Victorian Competition and Efficiency Commission (2011) Victoria‟s productivity, competitiveness and participation
Age group 2008 2009 2010 2011 2012% change
2008-2012
% change
2011-2012
15 to 19 74,400 76,000 88,300 108,700 120,500 62% 11%
20 to 24 58,800 59,200 71,400 87,800 100,900 72% 15%
25 to 44 99,700 102,400 112,600 148,500 180,200 81% 21%
45 to 64 51,100 52,900 60,200 77,100 96,400 89% 25%
Under 15, over 64, not stated 10,700 9,200 6,700 8,100 11,800 10% 45%
Total 294,700 299,600 339,200 430,300 509,800 73% 18%
108,700
87,800
148,500
77,100
8,100
120,500
100,900
180,200
96,400
11,800
15 to 19 20 to 24 25 to 44 45 to 64 Under 15, over 64,not stated
Age Group (Reporting Year)
Government subsidised Students by Age Group, 2011 and 2012
2011
2012
15 to 1924%
20 to 2420%
25 to 4435%
45 to 6419%
Under 15, over 64, not
stated2%
Age Distribution in 2012
“Increasing participation in the labour force is an important source of economic growth and well-being, as the larger the proportion of the population contributing to producing output, the more output there will be to share amongst the population. Increasing participation also provides the means to support important social welfare and equity goals.”

Victorian Vocational Training Summary
30 Victorian Training Market Quarterly Report Full Year 2012
Key Points
Government subsidised student numbers across all broad age groups have grown in 2012, continuing recent trends.
The largest cohort – 25 to 44 year olds – account for 35 per cent of students currently, and has seen growth of 21 per cent between 2011 and 2012.
Students aged 15 to 19 years are the second largest age group and represents 24 per cent of the government subsidised student population. This cohort has grown 11 per cent in 2012.
The 20 to 24 age group represents a 20 per cent share in 2012 and has a 15 per cent growth from the previous year.
The largest growth has occurred among 45 to 64 year olds, where enrolments increased by 25 per cent compared with 2011. This cohort represents 19 per cent of all government subsidised vocational training students.
The significant growth among the 45–64 and 25–44 age groups suggest that they are taking advantage of the student entitlement system to up-skill and broaden their job opportunities. This is further evidenced by the up-skilling enrolment growth by students aged 20–64 who do not hold a Certificate III or above. See “Older students with low prior qualifications” in the Higher Needs Learners and Foundation Skills Chapter for more detail.

Victorian Vocational Training Summary
Victorian Training Market Quarterly Report Full Year 2012 31
TAFE Domestic Fee for Service Students by Age Group
Table 1.11: Vocational training students by age group – TAFE domestic fee for service, 2008–2012
Figure 1.13: Vocational training students by age group – TAFE domestic fee for service, 2011 and 2012
Note: Fee for service figures are TAFE domestic AQF1+ activity only
Key Points
TAFE domestic fee for service students across all broad age groups have grown in 2012, reflecting the longer term trend since 2008.
Participation in training increased by the largest percentage among 25 to 44 year olds, increasing by 19 per cent. The next largest growth rates were within the 45–64 and the 20–24 year age cohorts, each increasing by 13 per cent.
There are distinct enrolment patterns by age when comparing TAFE domestic fee for service students and government subsidised students, In particular:
- Fee paying younger age groups (15–19 and 20–24 year olds) collectively represent a smaller proportion of all students when compared to students enrolled with government subsidies, 38 per cent compared with 44 per cent. The younger age group cohort are studying in a diverse range of courses, with a concentration of enrolments in the Certificate II in Building and Construction; the Foundation Course for Accounting and International Business Management Programs; the Certificate II in Hospitality; the Certificate II in Automotive Studies (Pre-vocational) and the Certificate III In ESL (Further Study). Younger students choice to engage in TAFE fee for service, against government subsidised training requires further investigation by DEECD.
- At the same time, fee paying older age groups (25–44 and 45–64 year olds) collectively have a larger distribution share than government subsidised students in the same age range, 60 per cent compared with 54 per cent.
Age group 2008 2009 2010 2011 2012% change
2008-2012
% change
2011-2012
15 to 19 22,900 26,400 28,800 28,300 28,900 26% 2%
20 to 24 9,300 11,100 11,400 10,300 11,600 25% 13%
25 to 44 29,700 34,800 34,500 34,100 40,600 37% 19%
45 to 64 16,500 18,400 19,300 19,500 22,100 34% 13%
Under 15, over 64, not stated 2,000 2,400 2,100 2,100 2,000 -3% -7%
Total 80,400 93,100 96,000 94,200 105,200 31% 12%
28,300
10,300
34,100
19,500
2,100
28,900
11,600
40,600
22,100
2,000
15 to 19 20 to 24 25 to 44 45 to 64 Under 15, over64, not stated
Age Group (Reporting Year)
TAFE Domestic FFS Students by Age Group, 2011 and 2012
2011
2012
15 to 1927%
20 to 2411%
25 to 4439%
45 to 6421%
Under 15, over 64, not
stated2%
Age Distribution in 2012

Victorian Vocational Training Summary
32 Victorian Training Market Quarterly Report Full Year 2012
Gender Profile
Vocational Training Delivery by Gender
The Victorian Vocational Training system is focused on accessibility and gender equality, ensuring all Victorians have the same opportunity to succeed in their lives and maintain well-being through education and training.
Government Subsidised Students by Gender
Table 1.12: Vocational training students by gender (government subsidised), 2008–2012
Note: Totals include unspecified gender in reporting.
Figure 1.14: Vocational training students by gender (government subsidised), 2008–2012
Unspecified gender has been excluded from chart.
Key Points
2012 figures show that 49 per cent of government subsidised students are females. This is a continuation of a trend over the last five years when the proportion of female students has grown to near parity. This reflects the strength of recent reforms in the vocational training sector to enhance the participation of women.
Gender 2008 2009 2010 2011 2012% change
2008-2012
% change
2011-2012
Female 139,800 140,900 161,600 208,500 251,900 80% 21%
Male 154,700 157,300 176,400 220,700 257,200 66% 17%
Total 294,700 299,600 339,200 430,300 509,800 73% 18%
47% 47% 48% 49% 49%
53% 53% 52% 51% 51%
2008 2009 2010 2011 2012
Proportion of VET Students by Gender
Male
Female

Victorian Vocational Training Summary
Victorian Training Market Quarterly Report Full Year 2012 33
TAFE Fee for Service Students by Gender
Table 1.13: Vocational training students by gender – TAFE fee for service, 2008–2012
Note: Totals include unspecified gender in reporting.
Figure 1.15: Vocational training students by gender – TAFE fee for service
Note: Fee for service figures are TAFE domestic AQF1+ activity only. Unspecified gender has been excluded from chart.
Key Points
In contrast to the gender profile of government subsidised students, the ratio of male to female participation in TAFE domestic fee for service training delivery is 60:40.
There has been a general pattern of declining female participation in fee for service vocational training, declining from 45 per cent in 2008 to 40 per cent in 2012. This can be explained in part by a general decline in some courses related to occupational groups with a high concentration of female TAFE fee for service enrolments such as Sales Assistants and Salespersons, Education Aides, Checkout Operators and Office Cashiers, Personal Assistants and Secretaries and Hospitality Workers.
Gender 2008 2009 2010 2011 2012% change
2008-2012
% change
2011-2012
Female 36,300 41,100 41,000 39,600 41,900 15% 6%
Male 44,100 51,900 55,000 54,600 63,300 43% 16%
Total 80,400 93,100 96,000 94,200 105,200 31% 12%
45% 44% 43% 42% 40%
55% 56% 57% 58% 60%
2008 2009 2010 2011 2012
Proportion of VET Students by Gender
Male
Female
Victorian Vocational Training Summary
34 Victorian Training Market Quarterly Report Full Year 2012
Apprentices and Trainees
Apprentice and Trainee Activity
Providing formal training to apprentices and trainees is a key function of the vocational training system, building skills that are directly applied in the workplace. Several key sectors that are important to the Victorian economy and the community more broadly directly benefit from the formal training provided by the vocational training system to apprentices and trainees. These include Automotive, Construction, Tourism and Hospitality, Health Care and Children‟s Services.
Trends in apprenticeships and traineeships align closely with the wider Victorian economy11
. In 2012 there were over 134,000 apprentices and trainees training in 2012. Apprentices did however fall slightly by 3 per cent since 2011, reflecting the subdued business conditions in the Manufacturing and Construction sectors.
Table 1.14: Vocational training government subsidised enrolments by apprentices and trainees, 2008–2012
Table 1.15: Vocational training government subsidised enrolments by apprentices and trainees who completed Year
12, 2008–2012
Table 1.16: Vocational training government subsidised enrolments by apprentices and trainees by qualification type,
2008–2012
Note: There were no Certificate I-II apprentices in 2012
11
Karmel, T. and Misko, J. 2009, p. 3ff.
2008 2009 2010 2011 2012% change
2008-2012
% change
2011-2012
Apprentices 41,500 41,600 45,200 46,200 45,000 9% -3%
Trainees 54,500 49,200 56,900 80,200 89,300 64% 11%
Apprentices + Trainees 95,900 90,800 102,100 126,500 134,300 40% 6%
2008 2009 2010 2011 2012% change
2008-2012
% change
2011-2012
Apprentices 17,100 17,300 19,100 20,200 20,200 18% 0%
Trainees 24,700 22,000 26,500 36,700 41,100 66% 12%
Apprentices + Trainees 41,900 39,300 45,600 56,800 61,200 46% 8%
Qualification Level 2008 2009 2010 2011 2012% change
2008-2012
% change
2011-2012
Apprentices 41,457 41,633 45,197 46,224 45,017 9% -3%
Cert III-IV 41,300 41,500 45,100 46,100 44,900 9% -3%
Diploma & Above 100 100 100 100 90 -7% -16%
Trainees 54,457 49,185 56,946 80,237 89,297 64% 11%
Cert I-II 10,200 11,100 11,700 8,900 4,200 -59% -52%
Cert III-IV 43,000 36,800 42,500 63,000 72,100 68% 14%
Diploma & Above 1,100 1,300 2,700 8,400 13,000 1126% 55%

Victorian Vocational Training Summary
Victorian Training Market Quarterly Report Full Year 2012 35
Key Points
In 2012 there has been a reported 6 per cent increase in apprenticeship and traineeship enrolments compared to 2011, continuing the rising trend seen over the period 2008-2011.
While enrolments by apprentices have fallen by 3 per cent, trainee numbers are up 11 per cent in 2012.
The marked rise in trainees at the Certificate III and above level since 2008 has been driven by major growth in traineeships within the Certificate III in Retail; the Certificate III in Hospitality; the Diploma of Management; the Certificate III in Process Manufacturing; and the Certificate IV in Customer Contact.
The number of apprentices and trainees who have completed Year 12 continues to be positive with nearly half having completed secondary school.
Apprentice uptake of both Certificate III-IV and Diploma and above courses has declined in 2012 compared with 2011.
Trainee uptake of Certificate I-II courses has fallen in the same period. However, trainee uptake has increased at Certificate III-IV and Diploma and above levels.

Victorian Vocational Training Summary
36 Victorian Training Market Quarterly Report Full Year 2012
Apprentices
Table 1.17: Vocational training government subsidised enrolments by apprentices by age, 2008–2012
Figure 1.16: Vocational training government subsidised enrolments by apprentices, 2008 and 2012
Key Points
In 2012, there were approximately 45,000 apprentices in training.
Growth in apprenticeships were concentrated in the older age cohorts (25 years and over).
The largest apprenticeship age cohort has traditionally been 15 to19 year olds. This age group has experienced a 10 per cent decrease between 2011 and 2012 (17,300 apprentices), reversing a growth trend in the period of 2008–2011. For the first time since 2008, 20 to 24 year olds represent the largest age group for apprentices.
In 2012, the 45–64 age group has continued to grow, with over 800 apprentices, representing a 26 per cent growth.
2008 2009 2010 2011 2012% change
2008-2012
% change
2011-2012
15 to 19 18,800 18,400 19,400 19,300 17,300 -8% -10%
20 to 24 16,200 16,400 18,100 18,500 18,800 16% 1%
25 to 44 5,900 6,300 7,100 7,800 8,100 38% 4%
45 to 64 500 500 600 650 850 73% 26%
Under 15, over 64, not stated 50 30 20 20 10 -80% -33%
Apprentices 41,500 41,600 45,200 46,200 45,000 9% -3%
41,500 41,600
45,200 46,200 45,000
2008 2009 2010 2011 2012
Government subsidised enrolments by apprentices

Victorian Vocational Training Summary
Victorian Training Market Quarterly Report Full Year 2012 37
Table 1.18: Vocational training government subsidised enrolments by apprentices by industry, 2008–2012
Key Points
Industries that traditionally represent a large proportion of apprentice uptake have remained fairly stable between 2011 and 2012. The Manufacturing sector remained static, while the Other Services sector (with sub-sectors including Repair and Maintenance and Personal and Other Services) grew by 1 per cent. Retail Trade and Accommodation and Food Services also grew 6 per cent and 3 per cent respectively. Construction dropped by 5 per cent over this period.
Industries with a small number of apprentice enrolments reported more significant changes in 2012, as these were off a smaller 2011 baseline. For example, Professional, Scientific and Technical Services grew 35 per cent since 2011, which was largely attributable to growth in courses related to Sign-writer, up 64 per cent from 50 to 80 apprentices. Likewise Health Care and Social Assistance went down by 19 per cent as a result of declining Dental Technician apprenticeships, falling from 100 in 2011 to 80 in 2012.
The three largest industries for apprentice uptake are Construction (55 per cent), Manufacturing (15 per cent) and Other Services (15 per cent). Manufacturing and Construction are the third and fourth largest employing industries in Victoria, accounting for 11 per cent and 9 per cent of total employment in 2011-12 respectively, indicating some level of alignment between apprenticeship provision and labour market demand.
At the same time, 78 per cent of apprentice enrolments were undertaken in qualifications related to in shortage occupations or specialised occupations.
2008 2009 2010 2011 2012% change
2008-2012
% change
2011-2012
% share in
2012
A: Agriculture, Forestry and Fishing 40 40 30 30 50 11% 44% 0%
B: Mining - - - - - n/a n/a 0%
C: Manufacturing 7,200 6,800 6,900 6,800 6,800 -6% 0% 15%
D: Electricity, Gas, Water and Waste Services 150 200 200 250 250 59% -2% 1%
E: Construction 20,700 21,900 24,900 26,200 24,700 20% -5% 55%
F: Wholesale Trade 100 90 100 100 90 -20% -25% 0%
G: Retail Trade 1,900 1,900 1,900 2,000 2,100 10% 6% 5%
H: Accommodation and Food Services 3,000 2,800 2,800 2,600 2,700 -11% 3% 6%
I: Transport, Postal and Warehousing 20 10 20 10 10 -13% 18% 0%
J: Information Media and Telecommunications 30 30 10 - - -97% -67% 0%
K: Financial and Insurance Services - - - - - n/a n/a 0%
L: Rental, Hiring and Real Estate Services - - - - - n/a n/a 0%
M: Professional, Scientific and Technical Services 10 20 20 80 100 605% 35% 0%
N: Administrative and Support Services 400 450 550 550 450 12% -16% 1%
O: Public Administration and Safety 70 90 100 100 100 71% 13% 0%
P: Education and Training - - - - - n/a n/a 0%
Q: Health Care and Social Assistance 100 100 100 100 80 -13% -19% 0%
R: Arts and Recreation Services 550 550 600 650 650 16% 1% 1%
S: Other Services 7,000 6,700 6,900 6,700 6,800 -4% 1% 15%
T: Cross-industry - - - - - 0% n/a 0%
U: Foundation Skills and LOTE - - - - - n/a n/a 0%
Not applicable / Unknown - - - - - -100% n/a 0%
Apprentices 41,500 41,600 45,200 46,200 45,000 9% -3% 100%

Victorian Vocational Training Summary
38 Victorian Training Market Quarterly Report Full Year 2012
Trainees
Table 1.19: Vocational training government subsidised enrolments by trainees, by age
Figure 1.17: Vocational training government subsidised enrolments by trainees, 2008-2012
Key Points
In 2012, there were approximately 89,300 government subsidised trainees.
The traditional largest age cohort (15–19 year olds) in traineeship has dropped slightly by 2 per cent from last year to 25,500, the first decrease since 2009.
As for apprenticeships, the strongest growth is seen in the older age groups, particularly 45 years and over. The 25–44 and 45–64 age groups grew by 20 per cent and 32 per cent respectively between 2011 and 2012.
2008 2009 2010 2011 2012% change
2008-2012
% change
2011-2012
15 to 19 21,500 20,800 22,800 26,100 25,500 19% -2%
20 to 24 13,000 11,000 12,500 15,300 15,500 19% 1%
25 to 44 14,600 12,400 14,900 24,600 29,600 103% 20%
45 to 64 4,800 4,600 6,500 13,600 18,000 276% 32%
Under 15, over 64, not stated 600 450 300 600 700 10% 17%
Trainees 54,500 49,200 56,900 80,200 89,300 64% 11%
54,500 49,200
56,900
80,200
89,300
2008 2009 2010 2011 2012
Government subsidised enrolments by trainees

Victorian Vocational Training Summary
Victorian Training Market Quarterly Report Full Year 2012 39
Table 1.20: Vocational training government subsidised enrolments by trainees by industry
Key Points
Growth among trainees in 2012 has occurred in most industries with the exception of Other Services, Education and Training, Administrative and Support Services.
The three largest industries for traineeship enrolments are Retail Trade (20 per cent share), Cross-industry
12 (18 per cent share) and Manufacturing (16 per cent share).
Cross-Industry is the second largest sector for traineeship enrolments, accounting for 18 per cent of the total. This area of training can be considered a core skill base for many industries including critical business management, administration and information technology skill sets.
At the same time, 11 per cent of traineeships were undertaken in qualifications related to in shortage occupations or specialised occupations.
12 The cross-industry category includes courses which cannot be clearly aligned to a single industry, e.g. the Diploma of
Management; Certificate III - IV in Business Administration; Certificate IV in Frontline Management; Certificate III in Information
Technology
2008 2009 2010 2011 2012% change
2008-2012
% change
2011-2012
% share in
2012
A: Agriculture, Forestry and Fishing 1,000 1,100 1,100 1,700 2,100 116% 28% 2%
B: Mining 40 50 20 20 30 -17% 113% 0%
C: Manufacturing 3,600 3,100 4,900 10,900 14,400 301% 32% 16%
D: Electricity, Gas, Water and Waste Services 200 150 100 200 300 47% 29% 0%
E: Construction 700 350 450 750 950 33% 28% 1%
F: Wholesale Trade 100 100 200 450 550 366% 18% 1%
G: Retail Trade 14,900 13,300 15,000 18,300 18,300 23% 0% 20%
H: Accommodation and Food Services 8,000 7,900 8,500 10,100 10,700 33% 6% 12%
I: Transport, Postal and Warehousing 3,400 2,600 3,100 5,200 6,500 89% 25% 7%
J: Information Media and Telecommunications 150 150 150 150 150 8% 3% 0%
K: Financial and Insurance Services 200 350 400 550 550 159% 1% 1%
L: Rental, Hiring and Real Estate Services 250 250 250 350 400 62% 3% 0%
M: Professional, Scientific and Technical Services 350 250 250 300 350 3% 9% 0%
N: Administrative and Support Services 6,700 4,600 5,700 7,200 6,600 -1% -8% 7%
O: Public Administration and Safety 200 80 60 50 100 -54% 94% 0%
P: Education and Training 450 400 350 500 450 1% -11% 0%
Q: Health Care and Social Assistance 6,100 6,400 6,700 7,500 7,800 27% 3% 9%
R: Arts and Recreation Services 1,800 2,300 2,200 2,700 2,600 40% -5% 3%
S: Other Services 750 650 600 600 500 -36% -17% 1%
T: Cross-industry 5,400 5,100 6,800 12,800 16,200 200% 27% 18%
U: Foundation Skills and LOTE - - - - 20 n/a n/a 0%
Not applicable / Unknown 150 30 - - - -100% n/a 0%
Trainees 54,500 49,200 56,900 80,200 89,300 64% 11% 100%

Victorian Vocational Training Summary
40 Victorian Training Market Quarterly Report Full Year 2012
Vocational Training Delivery by Provider Type
Figure 1.18: Government subsidised vocational training delivery by provider type, number of providers, 2012
Note: ACE providers consist of approximately 138 registered training organisations (RTO) and 160 training organisations (TO).
Table 1.21: Vocational training delivery by provider type and funding type, enrolments, 2008–2012
Key Points
In 2012, there were 298 ACE providers delivering training. Approximately 138 are Registered Training Organisations (RTOs) and the remaining 160 are Training Organisations (TOs). RTOs are those who can deliver accredited level courses, they also register under VRQA or ASQA under the new registration regime. TOs are those who can only deliver pre-accredited courses; they do not register under VRQA/ASQA.
Enrolments grew across all provider groups between 2011 and 2012. Private RTOs grew 40 per cent to approximately 308,800. TAFEs grew 7 per cent up to 281,400 and ACE providers grew 24 per cent to 80,200 enrolments in 2012.
TAFE, 18
ACE - TO, 160
ACE - RTO*, 138
PRIVATE RTO, 445
Number of providers by provider type, 2012
2008 2009 2010 2011 2012% change
2008-2012
% change
2011-2012
ACE 73,800 68,300 63,800 64,600 80,200 9% 24%
PRIV 54,000 57,400 99,800 220,700 308,800 472% 40%
TAFE 253,500 251,100 263,300 263,500 281,400 11% 7%
Domestic FFS TAFE 89,400 100,800 103,700 102,200 124,900 40% 22%
Total 470,700 477,600 1,478,900 650,900 795,300 69% 22%
Government
subsidised
= 761 providers

Victorian Vocational Training Summary
Victorian Training Market Quarterly Report Full Year 2012 41
Table 1.22: Summary of provider type characteristics – government subsidised enrolments, 2012
Note: Industry classification is only applicable to Certificate I and above. Cross-industry includes courses such as project
management.
TAFE Private RTOs ACE
Distribution share of selected industry delivery across the system:
● Examples for high proportion areas
include:
- 97% of Mining
- 94% of Professional, Scientific and
Technical Services
- 86% of Information Media and
Telecommunications
- 79% of Electricity, Gas, Water and Waste
Services
- 68% of Construction
- 66% of Agriculture, Forestry and Fishing
- 31% of Cross-industry
- 67% of Foundation Skills and LOTE
● Examples for high proportion areas include:
- 92% of Financial and Insurance Services
- 83% of Wholesale Trade
- 78% of Public Admin. and Safety
- 75% of Retail Trade
- 72% of Administrative and Support Services
- 71% of Transport, Postal and Warehousing
- 65% of Cross-industry
- 19% of Foundation Skills and LOTE
● Examples for high proportion areas include:
- 17% of Accommodation and Food Services
- 14% of Education and Training
- 12% of Health Care and Social Assistance
- 4% of Retail Trade
- 4% Arts and Recreation Services
- 4% of Cross-industry
- 14% of Foundation Skills and LOTE
Distribution share of selected industry delivery within a provider type:
● Study areas spread across all industries,
with highest enrolment shares in:
- Construction (13%)
Health Care and Social Assistance (10%)
- Manufacturing (7%)
- Cross-industry (10%)
- Foundation Skills and LOTE (27%)
● Study areas spread across many industries,
with most enrolments in:
- Health Care and Social Assistance (14%)
- Retail Trade (9%)
- Transport, Postal and Warehousing (9%)
- Manufacturing (8%)
- Accomodation and Food Services (8%)
- Cross-industry (20%)
- Foundation Skills and LOTE 5%)
● Study areas concentrate on certain
industries, with
- Health Care and Social Assistance (22%),
and
- Accommodation and Food Services (18%)
- Education and Training (3%)
- Cross-industry (9%)
- Foundation Skills and LOTE (36%)
● 49% of total TAFE enrolments in
Certificate III-IV, followed by
● Certificate I-II (34%), and
● Diploma and above (17%),
available at all 18 TAFEs
● 69% of total private RTO enrolments in
Certificate III-IV - available at 420 RTOs,
followed by
● Diploma and above (14%) - available at 279
RTOs, and
● Certificate I-II (16%) - available at 217 RTOs
● 25% of total ACE provider enrolments in
Certificate III-IV - available at 106 providers,
followed by
● Module Only enrolments (36%) - available at
257 providers
● Certificate I-II (25%) - available at 298
providers and
● Diploma and above (3%) - available at 39
providers
● 15-19 - largest age cohort (30% share)
● 20-24 - largest age cohort (23% share)
● 25-44 - mature learners (31% share)
● 45-64 - (14% share)
● Under 15, Over 64, Not stated (1% share)
● 15-19 - largest age cohort (21% share)
● 20-24 - largest age cohort (19% share)
● 25-44 - mature learners (39% share)
● 45-64 - (20% share)
● Under 15, Over 64, Not stated (2% share)
● 15-19 - largest age cohort (20% share)
● 20-24 - largest age cohort (9% share)
● 25-44 - mature learners (31% share)
● 45-64 (31% share)
● Under 15, Over 64, Not stated (9% share)
● 60% males ● 52% females ● 67% females
● 67% in employment ● 67% in employment ● 38% in employment
● 14% not in labour force ● 4% not in labour force ● 23% not in labour force
● 8% with disability ● 6% with disability ● 19% with disability
● 63% completed Year 12 or above prior
VET study
● 62% completed Year 12 or above prior VET
study
● 48% completed Year 12 or above prior VET
study
Delivery profile (in enrolments) - for Certificate I and above only
Learner profile (in students) within a provider type - for all course levels

Victorian Vocational Training Summary
42 Victorian Training Market Quarterly Report Full Year 2012
Key Points
As a proportion of delivery across the system, each provider has a quite different industry focus showing the various strengths and specialisation of each provider type. For example, TAFE has a large share of government subsidised enrolments in Mining (97 per cent), Professional, Scientific and Technical Services (94 per cent) and Information Media and Telecommunications (86 per cent). Private providers have a prominent share in Financial and Insurance Services (92 per cent), Wholesale Trade (83 per cent) and Public Administration and Safety (78 per cent). In comparison, ACE provider areas of specialisation are in Accommodation and Food Services (17 per cent), Education and Training (14 per cent) and Health Care and Social Assistance (12 per cent).
As a proportion of delivery within each provider type, Foundation Skills and LOTE enrolments make up the largest area of training for both TAFE (27 per cent) and ACE (36 per cent). Within private providers, Health Care and Social Assistance has the largest share of enrolments (14 per cent).
Enrolments at Certificate III-IV level make up the largest proportion of course enrolments with TAFE and private providers – 49 per cent and 69 per cent respectively. Certificate III-IV level enrolments accounted for 25 per cent of total ACE enrolments, slightly lower than module-only enrolments (36 per cent).
15-24 year old students are the largest age cohort in each provider, with 53 per cent in TAFE, 40 per cent in private providers and 29 per cent in ACE.
TAFE has more male participants (60 per cent), while more females were enrolled with private (52 per cent) and ACE providers (67 per cent).
Approximately two thirds of students enrolling with both TAFE and private providers are in employment at the time of enrolment. In comparison, just over one third of ACE students are employed.
Twenty-three per cent of ACE students are not in the labour force, compared with 14 per cent of TAFE students and just 4 per cent of students at private RTOs.
ACE has the highest proportion of students with a disability – 19 per cent of the total. Eight per cent of students at TAFE and 6 per cent of students at private RTOs report that they have a disability.
Nearly two thirds of students at both TAFE and private providers had already completed Year 12 prior to enrolling in vocational education compared to just under half of ACE students.

Victorian Vocational Training Summary
Victorian Training Market Quarterly Report Full Year 2012 43
Adult, Community and Further Education (ACFE) Performance
Figure 1.19: Government subsidised ACFE enrolments, accredited and pre-accredited
Figure 1.20: Government subsidised ACFE student contact hours, accredited and pre-accredited
Key Points
In 2012 Adult, Community and Further Education (ACFE) Learn Local providers delivered growth in both accredited and pre-accredited course enrolments and student contact hours compared with the same period in 2011.
Enrolments are up 37 per cent (over 12,400 enrolments) in accredited training and 10 per cent (3,200 enrolments) in pre-accredited training. Student contact hours are up almost 40 per cent in accredited training (3.4 million student contact hours) and 17 per cent in pre-accredited training (254,800 student contact hours)
Accredited training student contact hours have grown since 2008 and accelerated in 2011 and 2012 reflecting the full engagement of ACE providers in the Victorian Training Guarantee.
Pre-accredited enrolments fell from 2008 to 2011 in line with a set allocation of student contact hours for providers and new minimum student contact hours for each enrolment. Enrolments have grown in 2012 reflecting an increase in allocated student contact hours and a stabilisation of minimum student contact hours for each enrolment.
-
10,000
20,000
30,000
40,000
50,000
2008 2009 2010 2011 2012
ACE accredited and pre-accredited enrolments
Accredited Pre-Accredited
-
2
4
6
8
10
12
14
2008 2009 2010 2011 2012
(Mill
ion
s)
ACE pre-accredited and accredited student contact hours
Accredited Pre-Accredited

Victorian Vocational Training Summary
44 Victorian Training Market Quarterly Report Full Year 2012
Figure 1.21: Government subsidised ACE students by ACFE region, accredited and pre-accredited
BSW Barwon South West HUM Hume NWMR North Western Metropolitan
GRA Grampians GIP Gippsland SMR Southern Metropolitan
LMR Loddon Mallee EMR Eastern Metropolitan AEIs Adult Education Institutes
Key Points
Across Victoria there was 23 per cent growth in government subsidised students training at ACFE Learn Local providers. Six of eight regions recorded an increase in students with Barwon South West, Loddon Mallee and North Western Metropolitan Regions reporting at least 25 per cent% growth in students. Student numbers fell slightly in Gippsland (150 students) and Grampians (100).
The strongest growth is in courses related to Tourism and Hospitality, Adult Community Education, and Community Services and Health.
0
1,000
2,000
3,000
4,000
5,000
6,000
7,000
8,000
9,000
10,000
11,000
12,000
13,000
14,000
BSW EMR GIP GRA HUM LMR NWMR SMR AEIs
StudentsACE students by ACFE region
2008 2009 2010 2011 2012

Victorian Vocational Training Summary
Victorian Training Market Quarterly Report Full Year 2012 45
Figure 1.22: Hard to reach students in the ACE sector, accredited and pre-accredited (government subsidised)
Note: Hard to reach categories are not mutually exclusive.
Key Points
Student numbers have increased in 2012 in each of the eight key priority learner groups. Growth has been strongest for Disengaged Youth (students 16-19, no year 12, currently unemployed) up 40 per cent (1,200 students), the unemployed up 35 per cent (almost 4,900 students), and students from a Culturally and Linguistically Diverse (CALD) background up 27 per cent (over 3,000 students).
Unemployed students make up the largest number of priority group students at ACE providers, followed by students from a CALD background and Early School Leavers (highest qualification is year 10 or 11). Note that some students may fall within more than one hard to reach categories.
0
2,000
4,000
6,000
8,000
10,000
12,000
14,000
16,000
18,000
20,000
CALD (LOTE) Disability DisengagedYouth
Early schoolleavers
Indigenous Males 45 to 64 Unemployed Vulnerableworkers
Students
Hard to reach students in the ACE sector
2008 2009 2010 2011 2012

Victorian Training Market Quarterly Report Full Year 2012 46
Higher Needs Learners and Foundation Skills
Vocational Training Delivery for Higher Needs Learners Higher needs youth and adult learners are often members of more than one equity group, can have complex and multiple learning needs, and have contact with a suite of public services and programs. There is a significant evidence base that demonstrates the value and importance of education and training to these population cohorts. However, higher needs learners may face a combination of barriers to effective engagement in education and training including low levels of previous educational achievement, low aspirations, and poor access to training and broader barriers such as poverty, homelessness and poor health.
The role of vocational training has continued to be a critical enabler in opening up pathways for higher needs and disadvantaged learners through the provision of tailored, individualised services, often in partnership with other service providers.
Victoria is a signatory to a number of national skills agreements that support participation, educational completions and transitions into employment and further education for higher needs learners. These national agreements include the National Partnership on Youth Attainment and Transitions (NPYAT) and the National Indigenous Reform Agreement (NIRA).
Higher needs learners have grown in the 2012 compared to 2011 for all categories of higher need learners. Between 2011 and 2012 the number of:
Indigenous students grew by 11 per cent, an increase of 600 to 6,200 in 2012.
Students with a disability grew by 18 per cent, an increase of 6,200 to 40,300 in 2012.
Culturally and Linguistically Diverse (CALD) students grew by 30 per cent, an increase of 29,100 to 126,400 in 2012.
Unemployed students grew by 33 per cent, an increase of 29,200 to 118,500 in 2012.
Students aged 15-19 not in school and without a Year 12 or equivalent undertaking a Certificate II or higher grew by 2 per cent, an increase of 600 to 29,500 in 2012.
Older students aged 20-64 years without a Certificate II or higher grew by 24 per cent, an increase of 52,200 to 266,200 in 2012.
Table 2.1: Number of government subsidised students by higher needs group
* Numbers in above table rounded to the nearest 100 and above cohorts of students are not mutually exclusive
2008 2009 2010 2011 2012% change
2008-2012
% change
2011-2012
Indigenous 4,400 4,300 4,800 5,600 6,200 42% 11%
Students with a disability 23,900 23,600 27,200 34,100 40,300 68% 18%
CALD 58,100 62,100 70,600 97,300 126,400 117% 30%
Unemployed 41,800 50,200 62,500 89,300 118,500 184% 33%
Young people without Year 12 or equivalent, not at school and enrolled in Cert II or above
Aged 15-19 years 23,100 22,600 26,300 28,900 29,500 28% 2%
Older students not holding a Cert III or above
Aged 20-64 years 125,700 131,800 149,600 214,000 266,200 112% 24%

Higher Needs Learners and Foundation Skills
Victorian Training Market Quarterly Report Full Year 2012 47
Indigenous Students Data from the Australian Bureau of Statistics (ABS) Census of Population and Housing shows that the Indigenous population in Victoria as at 2011 was approximately 38,000.The challenges that Indigenous people face are well documented, according to the 2011 Census some 14 per cent of Indigenous persons in the labour force were unemployed compared to just 5 per cent of the non-Indigenous population.
There were 8,200 enrolments of Indigenous students in government subsidised studies, this was up by 8 per cent over the previous year. Of those enrolments in industry-specific qualifications which exclude foundation training
13 (5,400), 32 per cent or 1,700 of these were in courses related to specialised or in
shortage occupations.
Proportionally, half of all completions in 2012 by Indigenous students were in Certificate III or IV courses of study; this was the same level as in 2008. While the proportional share was the same between 2008 and 2012, the actual number of completions increased from 450 in 2008 to 1,100 in 2012, an increase of 140 per cent.
Table 2.2: Number of government subsidised enrolments by Indigenous students
Figure 2.1: Completions by Indigenous students
Table 2.3: Number of completions by qualification level in government subsidised training of Indigenous students
13
See the chapter on Responsiveness to skills Needs later in this report.
2008 2009 2010 2011 2012% change
2008-2012
% change
2011-2012
Course enrolments 7,000 6,200 6,600 7,600 8,200 16% 8%
Cert I-II40%
Cert III-IV51%
Diploma & Above
9%
Completions by qualification level, 2008 - for Indigenous students
Cert I-II40%
Cert III-IV51%
Diploma & Above
9%
Completions by qualification level, 2012 - for Indigenous students
Qualification level 2008 2009 2010 2011 2012% change
2008-2012
% change
2011-2012
Cert I-II 350 400 450 700 850 140% 20%
Cert III-IV 450 450 500 800 1,100 140% 41%
Diploma & Above 80 60 80 150 200 129% 44%
Secondary, SoA and other 90 90 70 50 20 -78% -62%
Total 1,000 1,000 1,100 1,700 2,100 119% 29%

Higher Needs Learners and Foundation Skills
48 Victorian Training Market Quarterly Report Full Year 2012
Figure 2.2: Indigenous student profile, 2012 (government subsidised)
Figure 2.3: Highest prior qualification of Indigenous students, 2012 (government subsidised)
14%
36%
8%
23%
Disabilty
Unemployed
Indigenous Student Profile, 2012
Students All Indigenous
2%
3%
17%
39%
1%
35%
1%
2%
15%
25%
2%
53%
Bachelors Degree or higher
Diploma, Advanced Diploma or AssociateDegree
Certificate III-IV
Year 12 or Certificate II
Certificate I
Year 11 or below
Highest Prior Qualification of Indigenous Students, 2012
Indigenous Students All

Higher Needs Learners and Foundation Skills
Victorian Training Market Quarterly Report Full Year 2012 49
Figure 2.4: Reason for study, Indigenous students, 2012 (government subsidised)
Key Points
Indigenous students studying in 2012 have a higher proportion of students that also have a disability (14 per cent), when compared to the total student population (8 per cent). In addition, Indigenous students also have a higher proportion of students that are unemployed, when comparing against the wider vocational training student population, at 36 per cent compared with 23 per cent for all students.
Just over half (53 per cent) of all Indigenous students currently studying vocational training have a highest prior qualification at the Year 11 or below level. Eighteen per cent of Indigenous students have a Certificate III or above as their highest prior qualification. This compares with 22 per cent across all vocational training students.
The main reasons Indigenous students were studying vocational training was to get work (35 per cent), for person interest (22 per cent) or as a requirement of their current job (16 per cent).
35%
22%
16%
16%
3%3%
2% 2%1%
Reason for Study, Indigenous Students 2012
Get work
Interest
Job requirement
Job skills
Get better job or promotion
Change careers
Enable further study
Start own business
Develop my business

Higher Needs Learners and Foundation Skills
50 Victorian Training Market Quarterly Report Full Year 2012
Students with a Disability According to the ABS Survey of Disability, Ageing and Carers conducted in 2009, there were 527,300 people in Victoria aged 15 to 64 years who had some form of disability. This represented about 14 per cent of the total population of 15 to 64 year olds.
Like the other higher needs learner types of students, there has been an increase in the number of government subsidised enrolments of students with a disability. Between 2011 to 2012, the number of enrolments has increased by 20 per cent, an additional 9,600 enrolments to 57,600 in 2012. In 2012 just over half (54 per cent) of total enrolments were in the category of industry-specific qualifications which excludes foundation training. Of those enrolments in industry-specific qualifications (31,300), 30 per cent (9,400) were in courses related to specialised or in shortage occupations.
Proportionally the share of higher qualifications being completed by students with a disability has also increased. In 2012 nearly two thirds (65 per cent) of completions by these students were in Certificate III or above course of study. Proportionally, completions in Certificate III-IV courses of study increased by 4 percentage points. While there was some proportional shift in the qualification levels completed, all qualification levels experienced an increase in actual numbers, except secondary and statement of attainment qualifications.
Table 2.4: Number of government subsidised enrolments by students with a disability
Figure 2.5: Completions by students with a disability
Table 2.5: Number of completions by qualification level in government subsidised training of students with a disability
2008 2009 2010 2011 2012% change
2008-2012
% change
2011-2012
Course enrolments 36,300 34,700 38,400 48,000 57,600 59% 20%
Cert I-II39%
Cert III-IV48%
Diploma & Above13%
Completions by qualification level, 2008 - for students with a disability
Cert I-II35%
Cert III-IV54%
Diploma & Above11%
Completions by qualification level, 2012 - for students with a disability
Qualification level 2008 2009 2010 2011 2012% change
2008-2012
% change
2011-2012
Cert I-II 1,900 2,000 2,300 3,300 4,700 145% 40%
Cert III-IV 2,300 2,600 3,200 4,800 7,100 210% 50%
Diploma & Above 600 550 750 1,000 1,400 132% 41%
Higher Education - 10 10 10 10 367% 17%
Secondary, SoA and other 350 300 400 400 250 -35% -38%
Total 5,200 5,400 6,700 9,500 13,500 160% 42%

Higher Needs Learners and Foundation Skills
Victorian Training Market Quarterly Report Full Year 2012 51
Figure 2.6: Students with a disability profile, 2012 (government subsidised)
Figure 2.7: Highest prior qualification of students with a disability, 2012 (government subsidised)
2%
18%
36%
1%
25%
23%
Indigenous
CALD
Unemployed
Disabled Students Profile, 2012
Students All Disability
2%
3%
17%
39%
1%
35%
2%
3%
15%
30%
3%
45%
Bachelors Degree or higher
Diploma, Advanced Diploma or AssociateDegree
Certificate III-IV
Year 12 or Certificate II
Certificate I
Year 11 or below
Highest Prior Qualification of Disabled Students, 2012
Disability Students All

Higher Needs Learners and Foundation Skills
52 Victorian Training Market Quarterly Report Full Year 2012
Figure 2.8: Reason for study, students with a disability, 2012 (government subsidised)
Key Points
Students with a disability studying in 2012 have a higher proportion of students that are Indigenous (2 per cent), when compared to the total student population (1 per cent). In addition, students with a disability also have a higher proportion of students that are unemployed, when comparing against the wider vocational training student population, at 36 per cent compared with 23 per cent for all students. Students with a disability however have a lower proportion of students from CALD backgrounds (18 per cent) when compared to the broader student population (25 per cent).
Forty-five per cent of all students with a disability currently studying vocational training have a highest prior qualification at the Year 11 or below level. Twenty per cent of students with a disability have a Certificate III or above as their highest prior qualification. This compares with 22 per cent across all vocational training students.
The main reasons students with a disability were studying vocational training was to get work (36 per cent), for personal interest (26 per cent) or develop job skills (13 per cent).
36%
26%
13%
10%
4%
4%4%
2% 1%
Reason for Study, Disabled Students 2012
Get work
Interest
Job skills
Job requirement
Enable further study
Change careers
Get better job or promotion
Start own business
Develop my business

Higher Needs Learners and Foundation Skills
Victorian Training Market Quarterly Report Full Year 2012 53
Students with a Culturally and Linguistically Diverse (CALD) Background Between 2008 and 2012, the number of course enrolments in government subsidised training by students from a Culturally and Linguistically Diverse background (CALD) more than doubled to 172,800 in 2012. Over the last year government subsidised enrolments increased by about a third (32 per cent). Of those enrolments in industry-specific qualifications (115,300) in 2012, 36 per cent (41,100) were in courses related to specialised or in shortage occupations.
Proportionally the share of higher qualifications, i.e. Certificate III or above, being completed by CALD students has marginally increased. In 2012, 83 per cent of completions by these students were in Certificate III and above courses of study. While the proportional share of Certificate I-II completions remained about the same between 2008 and 2012 (decreasing by only 1 percentage point), there was a decrease in the proportional share of Diploma and above courses of study and an increase in Certificate III-IV. While there was some change in proportional share in the completions of different qualification levels, there was an increase in actual numbers across all qualification levels, except for secondary and statements of attainment qualifications.
Table 2.6: Number of government subsidised enrolments by students from a CALD background
Figure 2.9: Completions by students from a CALD background
Table 2.7: Number of completions by qualification level in government subsidised training of students from a CALD
background
2008 2009 2010 2011 2012% change
2008-2012
% change
2011-2012
Course enrolments 81,100 83,500 93,800 130,700 172,800 113% 32%
Cert I-II18%
Cert III-IV45%
Diploma & Above37%
Completions by qualification level, 2008 - for CALD students
Cert I-II17%
Cert III-IV57%
Diploma & Above26%
Completions by qualification level, 2012 - for CALD students
Qualification level 2008 2009 2010 2011 2012% change
2008-2012
% change
2011-2012
Cert I-II 5,700 6,400 7,100 8,800 10,600 85% 20%
Cert III-IV 14,200 16,000 17,400 27,000 36,100 154% 34%
Diploma & Above 11,800 11,800 12,400 15,600 16,200 38% 4%
Higher Education 40 70 90 200 250 606% 27%
Secondary, SoA and other 3,800 2,900 2,800 1,200 950 -75% -24%
Total 35,600 37,100 39,800 52,800 64,100 80% 21%

Higher Needs Learners and Foundation Skills
54 Victorian Training Market Quarterly Report Full Year 2012
Figure 2.10: CALD student profile, 2012 (government subsidised)
Figure 2.11: Highest prior qualification of CALD students, 2012 (government subsidised)
6%
30%
8%
23%
Disabilty
Unemployed
CALD Student Profile, 2012
Students All CALD
2%
3%
17%
39%
1%
35%
4%
3%
15%
46%
1%
29%
Bachelors Degree or higher
Diploma, Advanced Diploma or AssociateDegree
Certificate III-IV
Year 12 or Certificate II
Certificate I
Year 11 or below
Highest Prior Qualification of CALD Students, 2012
CALD Students All

Higher Needs Learners and Foundation Skills
Victorian Training Market Quarterly Report Full Year 2012 55
Figure 2.12: Reason for study, CALD students, 2012 (government subsidised)
Key Points
CALD students have a higher proportion of students that are unemployed, when comparing against the wider vocational training student population, at 30 per cent compared with 23 per cent for all students.
Thirty-five per cent of all CALD students currently studying vocational training have a highest prior qualification at the Year 11 or below level. Twenty-two per cent of CALD students have a Certificate III or above as their highest prior qualification. This is in line with the broader student population.
The main reasons CALD students were studying vocational training was to get work (35 per cent), for job skills (19 per cent) and for personal interest (18 per cent).
35%
19%
18%
10%
6%
4%
3%
3% 2%
Reason for Study, CALD Students 2012
Get work
Job skills
Interest
Job requirement
Get better job or promotion
Enable further study
Change careers
Start own business
Develop my business

Higher Needs Learners and Foundation Skills
56 Victorian Training Market Quarterly Report Full Year 2012
Unemployed Students Enrolments of unemployed students in government subsidised training increased by 156 per cent between 2008 and 2012, and also increased between 2011 and 2012 by nearly a third (32 per cent) or 39,900 enrolments. In 2012, just over two-thirds (67 per cent) of total enrolments were in the category of industry-specific qualifications which excludes foundation training. Of these enrolments in industry-specific qualifications (109,500), 30 per cent or 32,700 were in courses related to specialised or in shortage occupations.
Proportionally the share of higher qualifications, i.e. Certificate III or above, being completed by unemployed students has increased. In 2012 about two thirds (68 per cent) of completions of these students were in Certificate III and above courses of study. Between 2008 and 2012 the proportional share of completions by unemployed students decreased for both Certificate I-II and Diploma and above courses of study, with the increases being in Certificate III-IV courses from 45 per cent in 2008 to 57 per cent in 2012. The actual number of completions increased for all qualification levels except secondary and statement of attainment qualifications.
Table 2.8: Number of government subsidised enrolments by unemployed students
Figure 2.13: Completions by unemployed students
Table 2.9: Number of completions by qualification level in government subsidised training of unemployed students
2008 2009 2010 2011 2012% change
2008-2012
% change
2011-2012
Course enrolments 63,600 71,200 86,000 123,000 162,900 156% 32%
Cert I-II40%
Cert III-IV45%
Diploma & Above15%
Completions by qualification level, 2008 - for unemployed students
Cert I-II32%
Cert III-IV57%
Diploma & Above11%
Completions by qualification level, 2012 - for unemployed students
Qualification level 2008 2009 2010 2011 2012% change
2008-2012
% change
2011-2012
Cert I-II 5,700 6,400 8,000 11,300 16,500 189% 46%
Cert III-IV 6,500 10,300 12,400 20,100 29,800 361% 50%
Diploma & Above 2,100 3,400 4,000 4,700 5,500 156% 41%
Higher Education 10 40 40 60 150 1327% 17%
Secondary, SoA and other 1,700 2,000 1,900 1,400 700 -57% -38%
Total 16,000 22,000 26,400 37,500 52,600 229% 45%

Higher Needs Learners and Foundation Skills
Victorian Training Market Quarterly Report Full Year 2012 57
Figure 2.14: Unemployed student profile, 2012 (government subsidised)
Figure 2.15: Highest prior qualification of unemployed students, 2012 (government subsidised)
2%
32%
12%
1%
25%
8%
Indigenous
CALD
Disabilty
Unemployed Student Profile, 2012
Students All Unemployed
2%
3%
17%
39%
1%
35%
2%
2%
13%
41%
2%
39%
Bachelors Degree or higher
Diploma, Advanced Diploma or AssociateDegree
Certificate III-IV
Year 12 or Certificate II
Certificate I
Year 11 or below
Highest Prior Qualification of Unemployed Students, 2012
Unemployed Students All

Higher Needs Learners and Foundation Skills
58 Victorian Training Market Quarterly Report Full Year 2012
Figure 2.16: Reason for study, unemployed students, 2012 (government subsidised)
Key Points
Unemployed students studying in 2012 have a higher proportion of students that also have a disability (12 per cent), when compared to the total student population (8 per cent). In addition, unemployed students also have a higher proportion of students that are from a CALD background, when comparing against the wider vocational training student population, at 32 per cent compared with 25 per cent for all students.
Forty per cent of all unemployed students currently studying vocational training have a highest prior qualification at the Year 11 or below level. Seventeen per cent of unemployed students have a Certificate III or above as their highest prior qualification. This compares with 22 per cent across all vocational training students.
The main reasons unemployed students were studying vocational training was to get work (55 per cent), for personal interest (17 per cent) and to develop job skills (10 per cent).
55%
17%
10%
4%
4%
4%4%
2%0%
Reason for Study, Unemployed Students 2012
Get work
Interest
Job skills
Change careers
Get better job or promotion
Job requirement
Enable further study
Start own business
Develop my business

Higher Needs Learners and Foundation Skills
Victorian Training Market Quarterly Report Full Year 2012 59
Young People (Aged 15 to 19) without Year 12 or equivalent and Not at School Victoria‟s Vocational Training system supports young people undertaking training options and pathways to further education and employment. It is a particularly important avenue for young people who have left school early without a Year 12 or equivalent and supports them by providing training pathways to employment and further education.
The enrolments of young people without a Year 12 or equivalent and not in school in government subsidised training increased by 37 per cent between 2008 and 2012, and also increased between 2011 and 2012 by 3 per cent or 900 enrolments. In 2012, 31 per cent or 10,800 of these enrolments were in courses related to specialised or in shortage occupations.
Table 2.10: Youth transition: vocational training government subsidised enrolments Cert II and above by students aged
15 to 19 who did not complete Year 12 or equivalent and not at school
Older Students with Low Prior Qualifications It is now commonly accepted that the age profile and structure of the Victorian population and workforce are changing. The supply of younger workers is resulting in a reduction in the availability of workers at younger ages, refocusing employers in their recruitment and retention practices, and contributing to a growing awareness that older workers are available to meet their labour needs.
Students aged 20 to 64 years engaging with training for the first time or up-skilling through vocational education have been important in building the skills capacity of the Victorian population and responding to the needs of industry.
The enrolments of people with low prior qualifications in government subsidised training increased by 111 per cent between 2008 and 2012, and also increased between 2011 and 2012 by 27 per cent or 73,900 enrolments. Of these enrolments, 251,400 in 2012, involved up-skilling (studying at a higher level than their current qualification). Up-skilling enrolments increased by 172 per cent between 2008 and 2012 and also increased by one third (33 per cent) over 2011.
Of enrolments in industry-specific qualifications (270,200 enrolments) which exclude foundation training, 32 per cent or 86,900 were in courses related to specialised or in shortage occupations.
Table 2.11: Vocational training government subsidised enrolments by students aged 20-64 not holding a Cert III or
above
Up-skilling refers to studying at a higher level than their current qualification.
2008 2009 2010 2011 2012% change
2008-2012
% change
2011-2012
Course Enrolments 25,500 25,200 30,100 34,100 35,000 37% 3%
2008 2009 2010 2011 2012% change
2008-2012
% change
2011-2012
Course Enrolments 164,100 166,200 185,400 271,800 345,700 111% 27%
Up-Skilling 92,500 100,200 118,600 189,300 251,400 172% 33%

Higher Needs Learners and Foundation Skills
60 Victorian Training Market Quarterly Report Full Year 2012
Foundation Level Training An efficient and effective training market plays a vital role in providing better outcomes for individuals and employers, as well as the wider Victorian community. Of particular importance is ensuring school leavers and adults without solid foundation skills in literacy and numeracy are given the opportunity to acquire them and thus greatly improve their chances of employment, further education opportunities and broader social participation.
Foundation Course Enrolments
Figure 2.16: Foundation courses, 2008 - 2012 (government subsidised)
Table 2.12: Top 10 foundation course enrolments, 2008 - 2012 (government subsidised)
Key Points
Enrolments in government subsidised foundation courses of study increased by 283 per cent between 2008 and 2012, and more than doubled (120 per cent) over the last year.
The highest number of course enrolments were within the Certificate I in Vocational Preparation, the Certificate II in General Education for Adults and the Certificate I in General Education for Adults. Each of these courses has increased markedly, reflecting the overall growth trend in training in foundation course areas.
30900 27900 30700
53900
118500
2008 2009 2010 2011 2012
Government Subsidised Foundation Course Enrolments, 2008 - 2012
Top 10 Foundation Courses 2008 2009 2010 2011 2012% change
2008-2012
% change
2011-2012
Certificate I in Vocational Preparation 2,400 1,600 2,300 6,100 26,500 999% 332%
Certificate II in General Education for Adults 3,400 3,300 4,700 10,000 23,500 586% 135%
Certificate I in General Education For Adults 5,300 3,200 3,600 9,700 16,000 204% 65%
Certificate I in General Education for Adults (Introductory) 2,200 1,800 1,900 2,500 10,500 373% 320%
Certificate III in General Education for Adults 1,200 1,100 1,300 2,800 9,500 695% 244%
Course In Initial General Education For Adults 900 750 1,000 1,300 4,400 405% 246%
Certificate I in ESL (Access) 900 1,100 1,000 1,500 2,500 182% 66%
Certificate II in Spoken and Written English 1,300 1,300 1,300 1,600 2,300 78% 42%
Certificate II in ESL (Access) 1,200 1,400 1,100 1,800 2,200 84% 27%
Certificate I in Transition Education 950 850 800 1,200 2,200 132% 88%

Higher Needs Learners and Foundation Skills
Victorian Training Market Quarterly Report Full Year 2012 61
Foundation Course by Delivery Mode
Table 2.13: Foundation courses, delivery model by student contact hours (thousands) 2008 - 2012 (government
subsidised)
Figure 2.17: Foundation courses, delivery model by student contact hours, 2012 (government subsidised)
Key Points
There were 19.1 million student contact hours of foundation training delivered in 2012.
The vast majority of foundation courses delivery included classroom based training (89 per cent).
Between 2011 and 2012, the largest growth by delivery mode was workplace based, increasing from 66,000 student contact hours in 2011 to 533,000 student contact hours in 2012.
Delivery mode by Student Contact Hours
('000s)2008 2009 2010 2011 2012
% change
2008-2012
% change
2011-2012
Administrative e.g. RPL 17.7 8.9 9.7 123.5 421.6 2277% 241%
Classroom 6,344.3 7,075.4 6,784.5 10,257.1 17,079.3 169% 67%
Online 168.0 200.5 184.1 253.8 352.7 110% 39%
Other 294.1 239.5 82.4 315.4 769.6 162% 144%
Workplace 21.3 27.8 40.4 65.7 533.0 2397% 712%
2%
89%
2%
4%3%
Foundation Courses by Delivery Mode, 2012
Administrative e.g. RPL
Classroom
Online
Other
Workplace

Higher Needs Learners and Foundation Skills
62 Victorian Training Market Quarterly Report Full Year 2012
Foundation Courses by Student Characteristics
Figure 2.18: Vocational training Students in foundation courses by higher needs learner groups (government
subsidised)
Figure 2.19: Vocational training students by student groups (government subsidised)
*Higher needs learners can sit within more than one group including CALD, Disability, Indigenous, Unemployed. This figure
counts students in the higher needs learner group as those students with “at least one needs area.”
19%
26%
31%
26%28%
Students All CALD Disability Indigenous Unemployed
Higher Needs Learner Students, Foundation Courses Participation Rates, 2012
40%
60%
Training in Foundation Courses by Student Group, 2012
Other Students
Higher Needs LearnerStudents (with at least oneneeds area)*

Higher Needs Learners and Foundation Skills
Victorian Training Market Quarterly Report Full Year 2012 63
Table 2.14: Vocational training Students in foundation courses by age group (government subsidised)
Key Points
Higher needs learners have higher participation rates than the broader student population. The overall student population participation rate in foundation training is 19 per cent. For higher needs learner groups they are:
o Students with a CALD background – 26 per cent
o Students with a disability – 31 per cent
o Indigenous students – 26 per cent
o Unemployed students – 28 per cent
Of the 98,050 students studying foundation courses, 60 per cent are within a higher needs learner group (CALD, Disability, Indigenous, Unemployed). This equates to approximately 59,000 students.
Close to half of foundation course delivery was to students aged 15 to 24 years (48 per cent). Students aged 45 years and over represented 17 per cent of all students studying foundation courses.
Age Band 2008 2009 2010 2011 2012% change
2008-2012
% change
2011-2012
15 to 19 5,100 5,200 6,600 11,200 27,900 451% 149%
20 to 24 2,700 2,500 3,100 6,000 18,800 602% 212%
25 to 34 5,800 4,900 5,300 8,500 17,100 195% 102%
35 to 44 5,400 4,800 5,000 7,900 14,300 162% 81%
45 to 54 3,600 3,300 3,400 5,900 10,900 199% 85%
55 to 64 1,700 1,500 1,700 2,900 5,800 249% 101%
Other 900 900 700 1,200 3,400 269% 187%
Total 25,200 23,200 25,700 43,500 98,100 289% 125%

Higher Needs Learners and Foundation Skills
64 Victorian Training Market Quarterly Report Full Year 2012
Vocational Training and Vocational Benefit
Overview Like all formal education, participation in vocational training has a range of benefits for both the student and the wider community. A significant portion of training in the vocational sector expressly teaches foundation skills or courses which lead to educational advancement. At base, however, a vocational training system must be assessed on how well it equips its graduates for work. This is relevant both for employers and the local economy, which rely on training to provide skilled workers, and for the students themselves, who have a reasonable expectation to perform strongly in the local employment market.
Four pillars of vocational benefit are considered in this second part of the report:
1. Responsiveness to areas of shortage and strategic need: has training delivery grown in areas of
identified skill shortages, and 'specialised' occupations which reflect areas of strategic need for
skills? This is addressed in the following chapter Responsiveness to Skills Needs
2. Alignment with Industry trends: has training delivery been broadly aligned at the state-wide level
with employment and economic trends and forecasts across Victorian industries? This is
addressed in the chapter Industry Training Profiles
3. Alignment with Regional variation: has training delivery responded to regional economic variations?
This is addressed in the chapter Regional Training Profiles
4. Student outcomes and employer satisfaction: based on comprehensive NCVER surveys, has
training contained the right content and been of a sufficient quality to enable students to find work,
and are employers satisfied with the level of training?
With regard to pillar 4. Student outcomes and employer satisfaction, DEECD is currently undertaking further research in this area and more substantive reporting is expected later in 2013.
Results from the Student Outcomes Survey for 2012 for Victoria show that near half (45.7 per cent) of graduates who were unemployed when they started their training were employed after graduation. Graduates already in employment also found substantial benefits
14 with nearly a third (31 per cent)
identifying that they had obtained “a promotion or increased status at work”, other employment benefits included an increase in earnings which about a quarter (25 per cent) of graduates reported and about a quarter (25 per cent) finding another job
15.
The following chapters report against the first three of these pillars of vocational benefit.
14 Students were able to identify one or more job related benefits after training, the figures should not be added together
15 Data sources: Student Outcomes Survey, NCVER 2012; Online datacube; Student Outcomes, Australian vocational
education and training statistics. NCVER 2012

65 Victorian Training Market Quarterly Report Full Year 2012
Responsiveness to Skills Needs
Introduction The Victorian training system is demand driven, responding to individuals seeking training and industry and employers needing skilled people. Businesses and industry bodies are best placed to understand their training needs and work closely with training providers to form solutions.
The DEECD has recently launched the Industry Participation Model to help ensure employers' and industries' training needs are better met. The model is based on a new partnership approach between government, industry and training providers.
The DEECD are increasingly undertaking direct consultation with industry to develop detailed and disaggregated industry profiles which also focus on identifying training and workforce barriers and the extent to which industry training needs are being met. For more details please visit: http://www.education.vic.gov.au/Documents/about/department/industryparticipationmodel.pdf
This section reports on vocational training delivery in 2012 and how it corresponds to the occupational skills requirements of the Victorian economy. „Responsiveness‟ considers the extent to which training undertaken by individuals exercising their training entitlement aligns or responds to the Victorian economy‟s need for specialist skills or occupations with reported skills shortages.
The three responsiveness categories relate to government subsidised training to onshore domestic students only. The category 'Industry-specific qualifications' allows like-with-like comparison of training performance by excluding non-accredited training and training in generic skills such as literacy and numeracy. While this foundational training is crucial, it is not by itself sufficient to meet demand for training in a particular occupation.
'Industry-specific qualifications'
'Specialised' occupations
'In Shortage' occupations
• Includes all accredited vocational qualifications at Certificate I and above, but excludes generic training such as foundation skills, education pathways and low-level LOTE courses
• Uses the Australian Workforce and Productivity Agency (formerly Skills Australia) list of specialised occupations, which is used to inform the skilled migration program
• These occupations have a long lead-time for training, high economic value and a significant match between training and employment
• Uses the 2012 DEECD Skills
Shortage list • List compiled with reference to
reports from Victorian industry training bodies and direct consultation with industry groups and workforce planning agencies
• National advice included where it had relevance to Victoria
• Allows like-with-like comparison of specialised and in shortage categories against broader training delivery trends
The first part of this chapter examines top-level trends in training delivery against these categories. As only a small number of specialised occupations are not also on the skills shortages list the subsequent detailed analysis considers a combined set. The second and third parts of this chapter provide summary breakdowns per industry and occupation of training in the combined specialised or in shortage categories, and the final part examines in detail each of the top 10 (by volume of training) specialised or in shortage occupations. Note that regional variation is considered in a later chapter Regional Profiles.

Responsiveness to Skills Needs
66 Victorian Training Market Quarterly Report Full Year 2012
Overall Responsiveness of the Training Market Enrolments in training are aligned with the changing occupational structure of the Victorian economy. 2012 enrolments are 18 per cent higher for in shortage qualifications and 11 per cent higher in specialised qualifications, compared with 2011 figures, equating to 152,300 and 80,200 enrolments respectively.
Figure 3.1: Enrolments by Responsiveness Category
Note: Table 3.1 details in full enrolments by responsiveness category for 2008 to 2012.
Key Points
There is continued evidence of rising trends in student enrolments and contact student contact hours in courses related to specialised and in shortage occupations in 2012.
Training delivery of courses related to specialised and in shortage occupations has been primarily driven by TAFEs (accounts for 53 per cent of enrolments), followed closely by private RTOs (41 per cent). Over the 2008 to 2012 period, enrolments in private RTOs for these courses have risen significantly from 12 per cent to 41 per cent of specialised or in shortage related courses.
276,100 285,100
336,800
442,800
505,400
91,200 102,300 116,200137,100
162,800
2008 2009 2010 2011 2012
Enrolments by Responsiveness Category, 2008 to 2012
Industry-specific qualifications Specialised OR In shortage

Responsiveness to Skills Needs
Victorian Training Market Quarterly Report Full Year 2012 67
The following tables show the number and percentage change against the four categories of training market responsiveness, as well as the comparison category 'Industry-specific qualifications‟, for reported enrolments and student contact hours.
Table 3.1: Change in reported government subsidised enrolments by responsiveness category
Industry-specific qualifications
2008 2009 2010 2011 2012 % 2008 - 2012 % 2011 - 2012
Enrolments 276,100 285,100 336,800 442,800 505,400 83% 14%
Student contact hours (millions)
75.3 82.7 100.4 130.2 164.3 118% 26%
Specialised
2008 2009 2010 2011 2012 % 2008 - 2012 % 2011 - 2012
Enrolments 56,800 59,000 64,700 72,200 80,200 41% 11%
Student contact hours (millions)
16.6 19.6 21.1 21.8 25.9 56% 19%
In Shortage
2008 2009 2010 2011 2012 % 2008 - 2012 % 2011 - 2012
Enrolments 84,000 95,600 108,700 129,100 152,100 81% 18%
Student contact hours (millions)
26.7 31.7 36.9 42.1 50.9 90% 21%
Both Specialised and In Shortage
2008 2009 2010 2011 2012 % 2008 - 2012 % 2011 - 2012
Enrolments 49,600 52,300 57,200 64,300 69,500 40% 8%
Student contact hours (millions)
14.9 17.7 19.1 19.6 21.9 47% 11%
Either Specialised or In shortage
2008 2009 2010 2011 2012 % 2008 - 2012 % 2011 - 2012
Enrolments 91,200 102,300 116,200 137,100 162,800 79% 19%
Student contact hours (millions)
28.4 33.6 38.9 44.3 54.9 93% 24%

Responsiveness to Skills Needs
68 Victorian Training Market Quarterly Report Full Year 2012
Detailed Analysis of Specialised and In Shortage Related Courses by Industry Sector
The following table outlines the top five industries with the largest number of enrolments related to specialised or in shortage occupations. These industries include Health Care and Social Assistance; Construction; Accommodation and Food Services; Transport, Postal and Warehousing; and Manufacturing. Detailed analysis of enrolment trends in each industry sector is available in Industry Profiles Chapter of this report.
Table 3.2: Top five industries with enrolments in either specialised or in shortage occupations
Key Industries 2011 2012 % 2011 - 2012
Health Care and Social Assistance accounted for 43% of enrolments in specialised/in shortage occupations in 2012. Primary occupations include Child Carers, Aged and Disabled Carers, Enrolled and Mothercraft Nurses.
54,300 69,500 28%
Construction accounted for 23% of enrolments in specialised/in shortage occupations in 2012. Primary occupations include Electricians, Plumbers, Carpenters and Joiners.
34,600 37,800 9%
Manufacturing accounted for 7% of enrolments in specialised/in shortage occupations in 2012. Primary occupations include Sheetmetal Trades Workers, Mechanical Engineering Draftspersons and Technicians.
11,300 11,900 5%
Accommodation and Food Services accounted for 7% of enrolments in specialised/in shortage occupations in 2012. Primary occupations include Café and Restaurant Managers, Bakers and Pastrycooks.
8,000 11,800 48%
Transport, Postal and Warehousing accounted for 7% of enrolments in specialised/in shortage occupations in 2012. Primary occupations include Truck Drivers, Train and Tram Drivers.
8,200 11,100 35%

Responsiveness to Skills Needs
Victorian Training Market Quarterly Report Full Year 2012 69
Detailed Analysis of Specialised and In Shortage Related Courses by Occupations
In order to study the responsiveness of the training market in more detail, this section includes a selected analysis on the top ten specialised and in shortage occupational groupings.
Figure 3.2: Enrolments by Responsiveness Category
Key Points
In 2012, the top ten highest enrolments in courses related to specialised or in shortage occupations, accounted for 69 per cent of all enrolments in courses related to either specialised or in shortage occupations.
Sixteen per cent of enrolments (25,700 enrolments) in either specialised or in shortage occupations were in courses related to Child Carers. This was followed by 11 per cent (16,900 enrolments) in Aged and Disabled Carers and 7 per cent (nearly 10,700 enrolments) in Truck Drivers.
Other top ten courses related to the specialised / in shortage occupations were for Welfare Support Workers, Café and Restaurant Managers, Carpenters and Joiners, Electricians, Enrolled and Mothercraft Nurses, Plumbers and Motor Mechanics.

Responsiveness to Skills Needs
70 Victorian Training Market Quarterly Report Full Year 2012
Focus on the Top Ten Specialised / In Shortage Occupations The following tables focus on the top ten enrolled specialised / in shortage occupations. The analysis seeks to examine how the training market is responding to Victorian labour market changes.
Child Carers
As a proportion of all Health Care and Social Assistance enrolments in 2012, courses related to Child Carers accounted for 33 per cent of enrolments.
Two per cent of enrolments in 2012 were traineeships related to the occupation of Child Carers.
Employment Prospects
Child Carers generally sit within Health Care and Social Assistance industry group.
While employment growth is expected to be fairly stable over the next five years, the number of people leaving the occupation is relatively high.
Detailed analysis of enrolment trends in the Health Care and Social Assistance sector is available in Chapter 4, Industry Profiles.
Key training trends in Child Carers
Enrolments in courses related to Child Carers have been on the rise at both Certificate III-IV and Diploma levels.
Enrolments in courses related to Child Carers account for around 10 per cent of all specialised / in shortage enrolments at Certificate III-IV levels and nearly 6 per cent at Diploma+ levels
Training delivery for Child Carer courses has historically been by private RTOs. The trend continues in 2012, with a 50 per cent rise in training provided by private RTOs since 2011, whereas there has been a slight drop in TAFE provision of relevant courses.

Responsiveness to Skills Needs
Victorian Training Market Quarterly Report Full Year 2012 71
Aged and Disabled Carers
As a proportion of all Health Care and Social Assistance enrolments in 2012, courses related to Aged and Disabled Carers accounted for 22 per cent of enrolments.
One per cent of enrolments in 2012 were traineeships related to the occupation Aged and Disabled Carers.
Employment Prospects
Aged and Disabled Carers generally sit within Health Care and Social Assistance industry.
Employment prospects in this occupation are quite strong as a 11 per cent growth in employment is forecast over the next five years.
Detailed analysis of enrolment trends in the Health Care and Social Assistance sector is available in Chapter 4, Industry Profiles.
Key training trends in Aged and Disabled Carers
Enrolments in courses related to Aged and Disabled Carers have been on the rise at both Certificate I-II and Certificate III-IV levels. However, the rise in enrolments at Certificate III-IV level has been more pronounced (risen by 33 per cent over 2011 - 2012).
Enrolments in courses related to Aged and Disabled Carers account for around 1 per cent of all specialised / in shortage enrolments at Certificate I-II levels and nearly 10 per cent at Certificate III-IV levels.
Training delivery for Aged and Disabled Carer courses has historically been by TAFE and ACE providers. However, private RTOs have been providing increasingly more training in recent years. Between 2011-2012, there has been a 51 per cent rise in enrolments with private RTOs, 22 per cent at ACE providers while TAFE enrolments have seen a 1 per cent fall.

Responsiveness to Skills Needs
72 Victorian Training Market Quarterly Report Full Year 2012
Truck Drivers
As a proportion of all Transport, Postal and Warehousing enrolments in 2012, courses related to Truck Drivers accounted for 28 per cent of enrolments.
One per cent of enrolments in 2012 were traineeships related to the occupation Truck Drivers.
Employment Prospects
Truck Drivers generally sit within the Transport, Postal and Warehousing sector.
Employment prospects in this occupation are quite strong as a 10 per cent growth in employment is forecast over the next five years.
Detailed analysis of enrolment trends in the Transport, Postal and Warehousing sector is available in Chapter 4 of this report.
Key training trends in Truck Drivers
Enrolments in this specialised / in shortage occupation has been at Certificate III and IV levels only.
The bulk of the training in relevant courses has traditionally been provided by TAFEs.
However, private RTOs and ACE providers have been providing increasingly more training in recent years.
Between 2011-2012, there has been a 37 per cent rise in enrolments with private RTOs, 59 per cent at ACE and 47 per cent at TAFEs.

Responsiveness to Skills Needs
Victorian Training Market Quarterly Report Full Year 2012 73
Welfare Support Workers
As a proportion of all Health Care and Social Assistance enrolments in 2012, courses related to Welfare Support Workers accounted for 12 per cent of enrolments.
One per cent of enrolments in 2012 were traineeships related to the occupation Welfare Support Workers.
Employment Prospects
Welfare Support Workers generally sit within Health Care and Social Assistance.
Employment prospects in this occupation are good as a 6 per cent growth in employment is forecast over the next five years.
Detailed analysis of enrolment trends in the Health Care and Social Assistance sector is available in Chapter 4 of this report.
Key training trends in Welfare Support Workers
Enrolments in courses related to Welfare Support Workers have been on the rise at both Certificate III-IV and Diploma levels.
Enrolments in courses related to Welfare Support Workers account for around 5 per cent of all specialised / in shortage enrolments at Certificate III-IV levels and 1 per cent at Diploma+ levels
Training delivery for Welfare Support Worker courses has historically been by TAFEs. However, private RTOs have been providing increasingly more training in recent years. Between 2011-2012, there has been a 530 per cent rise in enrolments with private RTOs, growing from 600 to 3,900 enrolments. Over the same period TAFEs rose 19 per cent to 3,900 enrolments.

Responsiveness to Skills Needs
74 Victorian Training Market Quarterly Report Full Year 2012
Café and Restaurant Managers
As a proportion of all Accomodation and Food Services enrolments in 2012, courses related to Café and Restaurant Managers accounted for 21 per cent of enrolments.
One per cent of enrolments in 2012 were traineeships related to the occupation Café and Restaurant Managers.
Employment Prospects
Café and Restaurant Managers generally sit within Accommodation and Food Services sector.
Employment prospects in this occupation are fairly good as a moderate employment growth of 5 per cent is forecast over the next five years.
Detailed analysis of enrolment trends in the Accommodation and Food Services sector is available in Chapter 4 of this report.
Key training trends in Café and
Restaurant Managers
Enrolments in courses related to Café and Restaurant Managers have been on the rise at both Certificate III-IV and Diploma levels. However, the rise in enrolments at Certificate III-IV level has been more pronounced (risen by 132 per cent over 2011-2012).
Enrolments in courses related to Café and Restaurant Managers account for around 4 per cent of all specialised / in shortage enrolments at Certificate III-IV levels and 2 per cent at Diploma+ levels.
Training delivery for Café and Restaurant Manager courses has historically been by TAFEs. Private RTOs have also been providing significantly more training in recent years. Training provision by ACE providers has picked up the most recently. In 2011-2012, enrolments grew by 203 per cent at with ACE providers, 18 per cent with private RTOs and 72 per cent with TAFEs.

Responsiveness to Skills Needs
Victorian Training Market Quarterly Report Full Year 2012 75
Carpenters and Joiners
As a proportion of all Construction enrolments in 2012, courses related to Carpenters and Joiners accounted for 15 per cent of enrolments.
Four per cent of enrolments in 2012 were apprenticeships related to the occupation Carpenters and Joiners.
Employment Prospects
Carpenters and Joiners generally sit within the Construction Industry.
Employment prospects in this occupation are quite strong as 8 per cent growth in employment is forecast over the next five years.
Detailed analysis of enrolment trends in the Construction sector is available in Chapter 4 of this report.
Key training trends in Carpenters and
Joiners
Enrolments in courses related to Carpenters and Joiners have fallen since 2011 at both Certificates I-II and Certificate III-IV levels. However, the fall in enrolments at Certificate I-II level has been more pronounced (falling by 48 per cent over 2011 - 2012).
Enrolments in courses related to Carpenters and Joiners account for a minor 0.03 per cent of all specialised / in shortage enrolments at Certificate I-II levels and 5 per cent at Certificate III-IV levels.
Training delivery for Carpenters and Joiners courses has historically been by TAFE providers. However, private RTOs have been providing increasingly more training in recent years. Between 2011-2012 there has been a 117 per cent rise in enrolments with private RTOs, while TAFE enrolments have seen a 14 per cent fall. Training is not provided by ACE providers.

Responsiveness to Skills Needs
76 Victorian Training Market Quarterly Report Full Year 2012
Electricians
As a proportion of all Construction enrolments in 2012, courses related to Electricians accounted for 14 per cent of enrolments.
Four per cent of enrolments in 2012 were apprenticeships related to the occupation Electricians.
Employment Prospects
Electricians generally sit within the Construction industry.
Employment prospects in this occupation are strong as a 15 per cent growth in employment is forecast over the next five years.
Detailed analysis of enrolment trends in the Construction sector is available in Chapter 4 of this report.
Key training trends in Electricians
Enrolments in this specialised / in shortage occupation has been at Certificate III and IV levels only.
The bulk of the training in relevant courses have been provided by TAFEs.
Between 2011 and 2012 there has been a 5 per cent rise in enrolments with private RTOs, 1 per cent rise at TAFEs.

Responsiveness to Skills Needs
Victorian Training Market Quarterly Report Full Year 2012 77
Enrolled and Mothercraft Nurses
As a proportion of all Health Care and Social Assistance enrolments in 2012, courses related to Enrolled Mothercraft Nurses accounted for 9 per cent of enrolments.
Less than 1 per cent (0.4) of enrolments in 2012 were traineeships related to the occupation Enrolled and Mothercraft Nurses.
Employment Prospects
Enrolled and Mothercraft Nurses generally sit within Health Care and Social Assistance industry sector.
Despite fairly stable employment historically, employment forecasts over the next five years show a slight fall. However, employment prospects for this occupation are good as the occupation has relatively high replacement rates.
More on the Health Care and Social Assistance sector is available in Chapter 4 of this report.
Key training trends in Enrolled and
Mothercraft Nurses
Enrolments in courses related to Enrolled and Mothercraft Nurses have been falling at Certificate III-IV levels but rising significantly at Diploma levels.
Enrolments in courses related to Enrolled and Mothercraft Nurses account for around 1 per cent of all specialised/ 'in shortage' enrolments at Certificate III-IV levels and around 4 per cent at Diploma + levels.
The bulk of delivery has historically been provided by TAFE. However, private RTOs and ACE providers have been providing increasingly more training in recent years. Between 2011-2012, there has been a 19 per cent rise in enrolments with private RTOs, 110 per cent with ACE providers and 8 per cent with TAFEs.

Responsiveness to Skills Needs
78 Victorian Training Market Quarterly Report Full Year 2012
Plumbers
As a proportion of all Construction enrolments in 2012, courses related to Plumbers accounted for 13 per cent of enrolments.
Three per cent of enrolments in 2012 were apprenticeships related to the occupation Plumbers.
Employment
Prospects
Plumbers generally sit within the Construction industry.
Employment prospects in this occupation are quite strong as 18 per cent growth in employment is forecast over the next five years.
Detailed analysis of enrolment trends in the Construction sector is available in Chapter 4 of this report.
Key training trends in Plumbing
Enrolments in this specialised / in shortage occupation has been at Certificate III and IV levels only.
The bulk of the training in relevant courses has generally been provided by TAFEs and the trend continues in 2012.
Training provided by private RTOs has been falling. No ACE providers offer training for this occupation.
2011-2012 reported a 3 per cent rise in enrolments at TAFEs and a 29 per cent fall in enrolments at private RTOs.
Private 2%
TAFE 98%
Plumbers: Training Delivery by Provider Type 2012
Note: Arrows indicate percentage point increase/ decrease in enrolments.
3%
-29%

Responsiveness to Skills Needs
Victorian Training Market Quarterly Report Full Year 2012 79
Motor Mechanics
As a proportion of all Other Services industry enrolments in 2012, enrolments in courses related to Motor Mechanics accounted for 15 per cent of all industry enrolments.
Four per cent of enrolments in 2012 were apprenticeships related to the occupation Motor Mechanics.
Employment Prospects
Motor Mechanics generally sit within the Other Services category.
Although employment growth for this occupation is forecast to fall slightly (by 2 per cent), employment prospects are fairly good as there is a relatively high replacement demand for this motor mechanics.
Detailed analysis of enrolment trends in the Other Services sector is available in Chapter 4 of this report.
Key training trends in Motor Mechanics
Between 2011 and 2012, enrolments in related courses have been on the rise only at Certificate III-IV levels (31 per cent). Enrolments at Certificate I-II and Diploma+ levels have fallen by 90 per cent and 53 per cent respectively.
Enrolments in courses related to Motor Mechanics account for around 4 per cent of all specialised / in shortage enrolments at Certificate III-IV levels and only a minute proportion at Certificate I-II and Diploma+ levels .
Training delivery for Motor Mechanic courses has historically been by TAFE providers. However, private RTOs have been providing increasingly more training in recent years. Between 2011-2012, there has been a 134 per cent rise in enrolments with private RTOs and a 10 per cent rise with TAFEs. ACE providers do not offer any relevant training.

Victorian Training Market Quarterly Report Full Year 2012 80
Industry Training Profiles
Introduction Presented in this section are 19 industry training profiles. They combine industry intelligence and economic analysis with training data to build a more complete picture of the relationship between industry skills needs, employment opportunities and skills training.
Each of the 19 industry training profiles16
examines the following areas:
Economic context including employment, economic output and business base; and current workforce breakdown by age group and qualification level
Summary of training challenges gleaned from industry intelligence including structural changes and areas of skills shortage
Overview of training performance 2012 compared to 2011, including a 'dashboard' of key measures
Training breakdown of significant trends in specific occupations, qualifications or the demographic profile of students
Provider analysis including shifts in market share.
The table below shows training in government subsidised qualifications, sorted highest to lowest by 2012 enrolments (excludes foundation training). Rank by industry share of Victorian employment and equivalent 2008 ranks are also displayed.
Analysis of 2012 data shows a high correlation between share of employment and share of training delivery in Victoria's largest industries:
Fifty-three per cent of training was delivered in the five highest employing Victorian industry sectors, which account for 50 per cent of all Victorian jobs – Health Care and Social Assistance, Retail Trade, Manufacturing, Construction and Professional, Scientific and Technical Services.
Health Care and Social Assistance, forecast to remain Victoria‟s largest industry employer through to 2017
17, saw the highest enrolment growth for industry-specific training in 2012 (16,200 additional
enrolments in 2012 when compared with 2011).
In addition to the 414,000 enrolments in industry-specific training, there were 91,000 enrolments in Cross-industry training, which encompasses a broad range of skills applicable to all Victorian industries.
16
The industry profiles are aligned to the Australian and New Zealand Standard Industrial Classification 2006 (ABS cat no. 1292.0). Classification of qualifications against industry and occupational outcomes have been developed in consultation with Victorian industry and training market stakeholders. Where a specific qualification is relevant across several industries, enrolments have been proportionally allocated across industries using employment data as a guide. Qualifications which are considered to be cross-industry (i.e. potentially relevant across all industries) have been excluded from these industry profiles. 17
DEECD subscribes to the Monash CoPS Economic Forecasts Model which provides employment and output forecasts down to the 3-digit ANZSIC level, occupational forecasts down to the 4-digit ANZSCO as well as high level aggregation forecasts of hours worked, and ASCED qualifications attained. This report utilises the COPS five year forecast to 2017 for analysis in the VET Industry Profiles.

Industry Training Profiles
Victorian Training Market Quarterly Report Full Year 2012 81
Table 4.1: Industry-specific training and employment: 2012 vs. 2008
* Cross-industry training (e.g. business administration, recordkeeping, computing) has been removed from the industry-specific
analysis as this training develops business skills which are transferable across many industry sectors.
Number Share 2012 2008 2012 2008
Health Care and Social
Assistance 77,600 18.7% 1 2 1 3
Construction 52,000 12.5% 2 1 4 4
Accommodation and Food
Services 44,600 10.8% 3 4 7 7
Manufacturing 41,800 10.1% 4 3 3 1
Transport, Postal and
Warehousing 38,000 9.2% 5 10 9 9
Retail Trade 36,000 8.7% 6 5 2 2
Arts and Recreation Services 26,700 6.4% 7 7 16 16
Administrative and Support
Services 21,600 5.2% 8 6 13 13
Other Services 21,000 5.1% 9 9 12 11
Professional, Scientific and
Technical Services 12,000 2.9% 10 8 5 5
Education and Training 10,100 2.4% 11 12 6 6
Agriculture, Forestry and Fishing 9,800 2.4% 12 11 14 14
Public Administration and Safety 8,400 2.0% 13 13 8 10
Financial and Insurance Services 6,300 1.5% 14 15 11 12
Information Media and
Telecommunications 3,900 0.9% 15 14 15 15
Rental, Hiring and Real Estate
Services 2,300 0.6% 16 17 17 17
Electricity, Gas, Water and Waste
Services 950 0.2% 17 16 18 18
Wholesale Trade 900 0.2% 18 18 10 8
Mining 550 0.1% 19 19 19 19
Industry-specific training 414,400 100.0% - - - -
Cross-industry training * 91,000 - - - - -
Total industry training 505,300 - - - - -
ANZSIC Industry2012 Enrolments Training Rank Employment rank

Industry Training Profiles
82 Victorian Training Market Quarterly Report Full Year 2012
Table 4.2: Industry share of Victorian employment and vocational training 2012
Significant trends in industry sectors include:
Health Care and Social Assistance is Victoria's largest employing industry with 12 per cent of all jobs. In 2012 19 per cent of training was delivered to this industry, up from 17 per cent in 2011. While some of the recent demand for training in this industry is driven by regulatory compliance, strong enrolment growth should prepare Victoria to respond to forecast jobs growth (employment in Health Care and Social Assistance is anticipated to grow by 16,200 jobs by 2016-17), as well as help combat industry skills shortages.
Victoria‟s Professional, Scientific and Technical Services and Education and Training industries are the 5th and 6th largest industry employers respectively. In both industries, however, over 50 per cent of employees hold higher education qualifications. This compares with a Victorian average of 29 per cent of the workforce, and explains the relatively low representation of these industries in vocational training. In 2012, enrolments in courses aligned to the Professional, Scientific and Technical Services industry made up 3 per cent of vocational training compared with 8 per cent of employment; enrolments in Education and Training qualifications accounted for 2 per cent of vocational training while this industry accounted for 8 per cent of Victorian jobs.
Transport, Postal and Warehousing training continues to experience strong enrolment growth and is now the 5
th largest vocational training segment (up from 10
th largest in 2008). Given the strategic
importance of this industry to Victoria, with supply chain activities spanning Victoria‟s industries, this should help position the industry to meet its growing skill needs.
Cross-industry training, of relevance to all Victorian industries, represents a significant proportion of vocational training activity. These courses cover a range of skills which are used by all industries, such as Business Administration and Management, Human Resources, Accounting Services and Information Technology. Course enrolments have seen growth of 9,500 in 2012, or 12 per cent when compared with 2011.

Industry Training Profiles
Victorian Training Market Quarterly Report Full Year 2012 83
Table 4.3: Industry training delivery, government subsidised enrolments 2008–2012 (sorted by highest enrolments 2012)
Please refer to individual industry profiles for a full description of these trends in enrolments.
ANZSIC Industry (Code) 2008 2009 2010 2011 2012% change
2008-2012
% change
2011-2012
Health Care and Social Assistance 29,900 36,100 45,800 61,400 77,600 160% 26%
Construction 31,900 33,000 42,500 47,800 52,000 63% 9%
Accommodation and Food Services 25,200 29,900 29,000 35,500 44,600 77% 26%
Manufacturing 27,000 23,500 27,200 33,800 41,800 54% 24%
Transport, Postal and Warehousing 11,300 15,000 17,100 28,000 38,000 236% 36%
Retail Trade 19,900 18,600 23,400 33,200 36,000 81% 8%
Arts and Recreation Services 13,500 14,700 19,000 27,500 26,700 97% -3%
Administrative and Support Services 15,100 11,400 14,400 20,600 21,600 43% 5%
Other Services 12,600 13,200 17,600 19,400 21,000 67% 8%
Professional, Scientific and Technical Services 13,100 12,900 12,700 12,400 12,000 -8% -3%
Education and Training 6,700 8,400 9,100 10,200 10,100 50% -1%
Agriculture, Forestry and Fishing 7,800 7,600 7,900 9,500 9,800 25% 3%
Public Administration and Safety 4,000 3,200 5,500 7,900 8,400 110% 6%
Financial and Insurance Services 1,000 1,400 1,700 6,700 6,300 504% -7%
Information Media and Telecommunications 2,100 3,000 3,500 3,800 3,900 82% 3%
Rental, Hiring and Real Estate Services 600 650 1,000 1,600 2,300 272% 48%
Electricity, Gas, Water and Waste Services 800 700 850 1,000 950 22% -8%
Wholesale Trade 550 350 550 850 900 64% 6%
Mining 400 350 300 300 550 38% 92%
Industry-specific training 223,500 234,000 279,300 361,400 414,400 85% 15%
Cross-industry 52,600 51,100 57,400 81,500 91,000 73% 12%
Total industry training 276,100 285,100 336,800 442,800 505,300 83% 14%
83
Vic
toria
n T
rain
ing M
ark
et Q
uarte
rly R
eport F
ull Y
ear 2
012
Industry
Tra
inin
g P
rofile
s

Industry Training Profiles
84 Victorian Training Market Quarterly Report Full Year 2012
Accommodation and Food Services
Industry Overview Figure 4.1: Industry share, 2011-12
With output of $9.3 billion in 2011-12, Accommodation and Food Services makes up approximately 3 per cent of the Victorian economy while accounting for 6 per cent of the total workforce.
There are close to 22,000 Accommodation and Food Services operations in Victoria, of which approximately 70 per cent are in Melbourne. The majority of businesses in this sector are small, accounting for 91 per cent of all operators across Victoria.
Forecasts for the industry anticipate jobs growth of approximately 1,300 over the next five years, increasing to 176,900 in 2016-17.
Growth will be concentrated in the Food and Beverage Services sector, by far the largest employing sector. Food and Beverage accounts for just under 90 per cent of all jobs in this industry, with the remainder in Accommodation.
Accommodation and Food Services has the youngest age profile across all Victorian industries, with 38 per cent of employees aged 24 or younger (compared with an average of 16 per cent across all industries). This reflects the high proportion of students working in this industry. The industry also has the highest proportion of employees with no post-school qualifications.
Tourism businesses, closely aligned to this industry sector, are operating in a challenging environment. Victoria‟s second largest international export, tourism in particular is weighed down by the continuing strength of the Australian dollar.
18 Domestic tourism, however, has been more resilient, with domestic
overnight visitors to and within Victoria increasing by 7 per cent in 2011-12, and Melbourne now attracting more interstate overnight visitors than Sydney.
19
Growth opportunities do exist in the tourism industry, however, linked in part to ongoing growth in Asia. Victoria’s China Tourism Strategy, released in 2012, outlines the importance of the Chinese visitor market to Victoria and outlines a strategy to increase visitation across the state – including regional Victoria.
Figure 4.2: Forecasts to 2016-17 and 2011-12 current workforce age and qualifications
18
Government of Victoria 2012a, p. 8 19
Government of Victoria 2012b, p. 22
6%
4%3%
9%
Employment Businesses EconomicOutput
VETenrolments
Source: Monash CoPS, ABS, SVTS

Industry Training Profiles
Victorian Training Market Quarterly Report Full Year 2012 85
Training Delivery Overview20 Figure 4.3: Industry training comparisons
Government subsidised enrolments in Accommodation and Food Services courses reached 44,600 in 2012, an increase of 26 per cent when compared with 2011. This is higher than the average seen across all industries.
TAFE fee for service delivery accounted for 22 per cent of industry enrolments, down slightly from 23 per cent in 2011 – although overall the number of fee for service enrolments increased by 16 per cent.
The occupation with the largest increase in enrolments was Waiters, with enrolments up by more than 6,000 between 2011 and 2012, to 18,500 (an increase of 49 per cent). Courses aligned to the occupation Waiter accounted for one third of all Accommodation and Food Services training in 2012.
All three skill shortage occupations in the Accommodation and Food industry saw enrolment growth in 2012. There were an additional 2,900 enrolments in courses aligned to Café and Restaurant Managers, an increase of 46 per cent to 9,200. Pastrycook enrolments grew by 500 to 1,300, while enrolments in Chef related courses increased by 400 to 1,300.
Occupations seeing a decline in enrolments in 2012 included Kitchenhands, with enrolments decreasing by 1,400 to 9,000.
Apprentice and trainee enrolments showed a slight increase in 2012, up by 700 enrolments.
20
Scope of data is nationally accredited and recognised training at AQF level 1 and above. Comparisons with all-industry
training exclude foundation training but include vocational courses which do not align to a single ANZSIC industry (e.g. business
and administration). Commentary refers to government subsidised activity unless otherwise stated.
2008 2009 2010 2011 2012
Accommodation and
Food Services 25,200 29,900 29,000 35,500 44,600
Year-on-year %
change - 19% -3% 22% 26%
% change across all
industries - 3% 18% 32% 14%
Key training challenges for the industry
Skill shortages have been identified in the occupations Café and Restaurant Managers, Chefs and Pastrycooks.
Balancing work placements with classroom learning is important in the Accommodation and Food Services industry in order to develop work ready graduates in a sector which is characterised by casual workers and itinerant workforce.
Employment forecasts indicate a demand for higher level skills in an industry which has below average levels of educational attainment. In particular, an additional 2,000 jobs are forecast for employees with vocational qualifications at Diploma level and above.
Available career opportunities and pathways need to be promoted to workers within Hospitality and Tourism as a way of building retention in industries with traditionally high levels of employee churn.

Industry Training Profiles
86 Victorian Training Market Quarterly Report Full Year 2012
Training Breakdown Women are more likely than men to enrol in Accommodation and Food Services qualifications,
accounting for 57 per cent of industry enrolments (up from 53 per cent in 2010).
Women comprise the majority of enrolments linked to the occupations of Pastrycook (85 per cent of the total), Waiter and Kitchenhand (61 per cent of enrolments respectively). Men, on the other hand, make up a higher proportion of Chef enrolments, 59 per cent of the total.
Figure 4.4: Government subsidised enrolments
The age profile of those enrolling in Accommodation and Food Services courses is younger than average, with approximately two-thirds of enrolments by those aged 15 to 24 years. This is in line with the industry‟s younger than average employment profile.
Enrolments at Certificate III–IV level continued to show strong growth in 2012, while Certificate I–II and Diploma+ level enrolments declined. Certificate III–IV level enrolments now account for 72 per cent of the total, up from 60 per cent in 2011.
Certificate III in Hospitality had the highest number of enrolments in the sector, with enrolments increasing by more than 6,000, to 18,500 between 2011 and 2012. This course accounted for 41 per cent of all Accommodation and Food Services enrolments in 2012, up from 35 per cent in 2011.
The proportion of employed students in this industry increased slightly in 2012, representing 70 per cent of enrolments compared with 67 per cent in 2011.
For Accommodation and Food Services related training, the main reasons students were completing a vocational training qualification were to get extra skills for their current job or to get a job. Around 62 per cent of students undertaking a course related to Accommodation and Food Services held at least a Year 12 or equivalent qualification.
Top qualifications 2012
Certificate III in Hospitality 18,500
Certificate II in Hospitality 6,400
Certificate IV in Hospitality 5,900
Certificate III in Hospitality
(Commercial Cookery)4,500
Certificate II in Hospitality (Kitchen
Operations)2,300
These 5 courses accounted for 84% of all
government funded training in the industry
9,000
32,300
3,300
Cert I-II Cert III-IV Diploma & Above
Qualification level 2012(% change since 2011)
52%
-14%
-12%
45%
19%
24%
11%
15 to 19
20 to 24
25 to 44
45 to 64
Age group 2012(% total)

Industry Training Profiles
Victorian Training Market Quarterly Report Full Year 2012 87
Training Provision Private providers deliver the majority of
Accommodation and Food Services training, 53 per cent of the total – a proportion which has remained relatively stable in 2012.
ACE providers have significantly increased their share of delivery in this industry over the last 12 months. Enrolments more than doubled in 2012, up by 4,500 enrolments to 7,600, and ACE providers now account for 17 per cent of delivery (up from 9 per cent in 2011). ACE providers are more likely to deliver training related to Waiters and Kitchenhands than any other occupation.
Figure 4.5: Training provider share of enrolments
There were 167 training providers delivering government subsidised vocational training in Accommodation and Food Services in 2012, 8 more than in 2011. Of these, a majority (99 providers) delivered less than 100 enrolments in 2012.
Fifty-five per cent of Accommodation and Food Services enrolments involved some classroom based delivery. Thirty-nine per cent included employment based training and a further 15 per cent involved recognition of prior learning, recognition of current competency, or credit transfer.
In the Accommodation and Food Services industry 23 per cent of enrolments were funded at subsidy levels A and B, equating to 9,800 enrolments. There has been a 5 percentage point decline in bands A and B between 2011 and 2012. In 2012, bands D and E represented 63 per cent of all government subsidised enrolments or 28,400 enrolments. The share of bands D and E declined by 2 percentage points over this same period.
29%
53%
17%
TAFE Private ACE
Provider share 2012(change in percentage points since 2011)
-9% 1% 8%
12%
12%
15%
11%
8%
13%
11%
7%
54%
56%
Y2011
Y2012
Enrolments by Funding Band 2011 - 2012
A B C D E

Industry Training Profiles
88 Victorian Training Market Quarterly Report Full Year 2012
Administration and Support Services
Industry Overview Figure 4.6: Industry share, 2011-12
The Administration and Support Services industry is made up of Packaging Services, Travel Agency and Tour Arrangement Services, Employment Services, Building Cleaning, Pest Control and Gardening Services and Other Administrative Services.
With output of $8.4 billion in 2011-12, Administration and Support Services made up approximately 3 per cent of the Victorian economy while accounting for 4 per cent of the total workforce.
Employment is forecast to increase by approximately 5,100 persons over the next five years, to 111,000 by 2016-17.
Building Cleaning, Pest Control and Gardening Services is the largest sub-sector by employment size, accounting for approximately 41 per cent of all jobs in this industry, followed by Employment Services (29 per cent share).
Administration and Support Services has the fifth highest proportion of employees with no post-school qualifications, and the highest proportion of employees with Certificate I-II qualifications of all Victorian industries.
Figure 4.7: Forecasts to 2016-17 and 2011-12 current workforce age and qualifications
4% 4%
3%
4%
Employment Businesses EconomicOutput
VETenrolments
Source: Monash CoPS, ABS, SVTS
Key training challenges for the industry
The key challenges are ensuring enrolments are aligned to industry demand. This includes:
o Call and Contact Centre enrolments that have grown significantly, yet this sector is highly exposed to overseas competition via outsourcing
o Tourism, where job prospects are dampened by the high Australian dollar,
without subsequent changes in enrolment demand

Industry Training Profiles
Victorian Training Market Quarterly Report Full Year 2012 89
Training Delivery Overview21 Figure 4.8: Industry training comparisons
Growth in government subsidised enrolments in Administration and Support Services courses has slowed. Enrolments reached 21,600 in 2012, an increase of 5 per cent from 2011. This is considerably lower than the average for all industries, and growth over the previous two years.
The number of TAFE fee for service enrolments increased by 21 per cent in 2012. TAFE fee for service delivery now accounts for 16 per cent of industry enrolments.
The occupation with the largest increase in enrolments was Call or Contact Centre Team Leader. Enrolments jumped by approximately 2,000 (65 per cent) between 2011 and 2012. Enrolments related to Call or Contact Centres now account for 55 per cent of all Administration and Support Services training. In percentage terms, enrolments in courses related to the Tourist Information Officer occupation showed strong growth in 2012, up by over 700 per cent to almost 500 enrolments.
Enrolments in courses related to the Garden Labourer occupation saw the largest decline in 2012, down by about 600 (50 per cent).
Trainee enrolments decreased by about 700 (9 per cent) in 2012. This was largely due to a decline in trainee enrolments relating to Tourism Services, Call or Contact Centres and Commercial Cleaning.
Training Breakdown Women are slightly more likely than men to enrol in Administration and Support Services qualifications,
accounting for 54 per cent of industry enrolments (up from 51 per cent in 2010).
Figure 4.9: Government subsidised enrolments
21
Scope of data is nationally accredited and recognised training at AQF level 1 and above. Comparisons with all-industry
training exclude foundation level training but includes vocational courses which do not align to a single ANZSIC industry (e.g.
business and administration). Commentary refers to government subsidised activity unless otherwise stated.
2008 2009 2010 2011 2012
Administrative and
Support Services 15,100 11,400 14,400 20,600 21,600
Year-on-year %
change - -24% 26% 43% 5%
% change across all
industries - 3% 18% 32% 14%
Top qualifications 2012
Certificate IV in Customer Contact 5,200
Certificate III in Customer Contact 4,800
Certificate III in Asset Maintenance
(Cleaning Operations)2,000
Certificate II in Customer Contact 1,800
Diploma of Events 1,200
These 5 courses accounted for 70% of all
government funded training in the industry
2,800
16,400
2,400
Cert I-II Cert III-IV Diploma & Above
Qualification level 2012(% change since 2011)
14%
17%
23%
41%
18%
15 to 19
20 to 24
25 to 44
45 to 64
Age group 2012(% total)
-21% -6%

Industry Training Profiles
90 Victorian Training Market Quarterly Report Full Year 2012
The age profile of those enrolling in Administration and Support Services courses is fairly consistent with the Victorian average.
Enrolments at Certificate III–IV level continued to show strong growth in 2012, while Certificate I–II and Diploma+ level enrolments declined. Certificate III–IV level enrolments now account for 76 per cent of the total, up from 70 per cent in 2011.
Certificate IV in Customer Contact had the largest increase in enrolments in 2012 (up 2,000), followed by Certificate III in Asset Maintenance (Cleaning Operations) (up 600). Certificate III in Tourism (Visitor Information Services) grew to almost 300 enrolments.
Certificate III and IV in Customer Contact now account for 46 per cent of all Administration and Support Services enrolments, up from 43 per cent in 2011.
For Administrative and Support Services related training, the top three reasons students were completing a vocational training qualification was because it was a requirement of their job; to get a job or to get extra skills for their current job. Around 69 per cent of students undertaking an Administrative and Support Services related course held at least a Year 12 or equivalent qualification.
Training Provision The enrolment share of private providers rose by
about 10 percentage points and now delivers three quarters of Administration and Support Services training – a proportion which has been increasing since 2009.
There were 135 training providers delivering government subsidised vocational training in Administration and Support Services in 2012, 3 more than in 2011. Of these, 95 delivered less than 100 enrolments in 2012.
Fifty-seven per cent of Administrative and Support Services enrolments involved some classroom based delivery. Thirty per cent included employment based training and a further 15 per cent involved recognition of prior learning, recognition of current competency, or credit transfer.
In the Administrative and Support Services industry 7 per cent of enrolments were funded at subsidy levels A and B, equating to 2,200 enrolments. There has been a 3 percentage points decline in bands A and B between 2011 and 2012. In 2012, bands D and E represented 69 per cent of all government subsidised enrolments or 15,100 enrolments. The share of bands D and E declined by 1 percentage point over this same period.
Figure 4.10: Training provider share of enrolments
25%
74%
2%
TAFE Private ACE
Provider share 2012(change in percentage points since 2011)
-9% 10%
-1%
3%
2%
8%
5%
19%
23%
30%
35%
40%
34%
Y2011
Y2012
Enrolments by Funding Band 2011 - 2012
A B C D E

Industry Training Profiles
Victorian Training Market Quarterly Report Full Year 2012 91
Agriculture, Forestry and Fishing
Industry Overview Figure 4.11: Industry share, 2011-12
Currently accounting for 3 per cent of Victoria‟s industry output in 2011-12, the Agriculture, Forestry and Fishing (Agricultural) sector contributed nearly $8.6 billion to the Victorian economy.
Forecasts to 2017 expect output in the Agricultural sector to remain fairly static.
At present the industry employs around 79,400 people (3 per cent of Victoria's workforce).
Forecasts also suggest that over 16,000 jobs could be created by 2017, primarily driven by opportunities in the Fishing sub-sector.
In 2011- 2012, the largest employing Agricultural sub-sectors were Sheep/Beef/Grain (employs one third of the workforce) and Dairy Cattle (employs one quarter of the workforce).
There are over 46,000 businesses in operation within the sector, primarily based around Wimmera, Mallee and the Western District. The sector forms 8 per cent of Victoria‟s total number of businesses, but this has declined by around 1,860 since 2009 when it represented 9 per cent of Victoria‟s business base.
With over half of the workforce with no post-school qualifications and heavy reliance on an older workforce, the industry faces several training challenges.
Figure 4.12: Forecasts to 2016-17 and 2011-12 current workforce age and qualifications
Key training challenges for the industry
Address identified skills shortages in the following occupations: Agricultural Consultant, Agricultural Scientist, Arborist, Agricultural and Horticultural Mobile Plant Operator.
The industry is subject to numerous structural changes including those attributed to climate change and the introduction of carbon tax, technological advancements and the high Australian dollar. The industry has relatively low levels of attainment of accredited qualifications compared to other industries, and also struggles to attract new entrants. It is also dependent on a predominantly ageing workforce and thus requires rapid cross-skilling and up-skilling to maintain competitiveness.
Continuing rationalisation of farms into larger corporate structures and competition is changing the pattern of demand for on-farm skills including the need for professionally trained farm managers with a range of production and operational skills.
Certain regional areas lack local training providers and the challenge remains in delivering training via alternative means like online and practical learning.

Industry Training Profiles
92 Victorian Training Market Quarterly Report Full Year 2012
Training Delivery Overview22 Figure 4.13: Industry training comparisons
Enrolments in Agriculture, Forestry and Fishing related courses accounted for 9,800 government subsidised enrolments in 2012, up by 3 per cent since 2011.
TAFE fee for service enrolments made up 26 per cent of all enrolments within the Agricultural industry and has remained static over 2011 – 2012.
Enrolments at TAFE providers declined in 2012 following historically high enrolments in 2011.
Twenty-two per cent of enrolments in this industry were for apprenticeships/ traineeships, equating to 2,200.
In 2012, nearly 700 of all government subsidised enrolments (7 per cent) were in occupations identified as in skills shortage. Over 500 of these enrolments were related to occupations in Arboriculture, with the rest in Agricultural Consultancy and Science. The share of enrolments in occupations in shortage decreased by 6 per cent following historically high enrolments in 2011.
The largest volume of enrolments in Agriculture is in skill sets related to safety and compliance.
Two per cent of enrolments were in occupations categorised as specialised.
Training Breakdown Training interest in this industry has been
primarily male dominated. Seventy-nine per cent of all Agricultural related enrolments are from males
The 7,700 enrolments by men in 2012 are up by 4 per cent since 2011. In 2012, enrolments by females fell marginally by 1 per cent to 2,100.
Seventy-six per cent of enrolments (7,300) in courses related to the Agricultural industry are at Certificates III–IV levels, up by 22 per cent since 2011.
22 Scope of data is nationally accredited and recognised training at AQF level 1 and above. Comparisons with all-industry
training exclude foundation level training but includes vocational courses which do not align to a single ANZSIC industry (e.g.
business and administration). Commentary refers to government subsidised activity unless otherwise stated.
2008 2009 2010 2011 2012
Agriculture, Forestry
and Fishing 7,800 7,600 7,900 9,500 9,800
Year-on-year %
change - -3% 4% 20% 3%
% change across all
industries - 3% 18% 32% 14%

Industry Training Profiles
Victorian Training Market Quarterly Report Full Year 2012 93
Figure 4.14: Government subsidised enrolments
There has been a significant uptake of Certificate IV in Agriculture (up by 63 per cent) and Certificate III in Production Horticulture (up by 84 per cent) over 2011–2012 which may explain the rise in enrolments at Certificates III–IV levels.
Enrolments at Certificates I–II level and Diploma+ levels have fallen over the same period (by 34 per cent and 15 per cent respectively). This may be attributed to the fall in enrolments in the Certificate II in Agriculture (down by 25 per cent) and Diploma of Agriculture (down by 13 per cent).
38 per cent of enrolments in 2012 were from the 25–44 age group, followed by the 45–64 age group who accounted for 29 per cent of enrolments. Both age groups reported a rise in enrolments over 2011–2012 (25–44 age group up by 2 per cent; 45–64 age group up by 13 per cent).
For Agriculture, Forestry and Fishing related training, the top three reasons students were completing a vocational training qualification was because it was a requirement of their job; to get extra skills for their current job or for personal interest or self-development. Around 48 per cent of students undertaking a Agriculture, Forestry and Fishing related courses held at least a Year 12 or equivalent qualification.
Training Provision There were 43 training providers delivering
government subsidised vocational training related to the Agriculture, Forestry and Fishing industry in 2012.
In 2012, Private Registered Training Organisations (RTOs) made up nearly half of the providers (49 per cent) delivering training in courses related to this industry.
The number of ACE providers has risen over 2011–2012 by 20 per cent, whereas private RTOs have fallen by 9 per cent.
TAFE provider share of government subsidised training has fallen from 82 per cent of enrolments in 2008 to 65 per cent in 2012, whereas the share of private RTOs has increased from 16 per cent of enrolments in 2008 to 34 per cent in 2012.
Forty-one per cent of Agriculture, Forestry and Fishing enrolments involved some classroom based delivery. Twenty per cent included employment based training and a further 41 per cent involved recognition of prior learning, recognition of current competency, or credit transfer.
Figure 4.15: Training provider share of enrolments
In the Agriculture, Forestry and Fishing industry 89 per cent of enrolments were funded at subsidy levels A and B, equating to 8,700 enrolments. There has been a 3 percentage point growth in bands A and B between 2011 and 2012.
Top qualifications 2012
Certificate III in Agriculture 2,900
Certificate IV in Agriculture 1,300
Certificate III in Production
Horticulture900
Certificate II in Agriculture 600
Diploma of Agriculture 500
These 5 courses accounted for 64% of all
government funded training in the industry
1,400
7,300
1,100
Cert I-II Cert III-IV Diploma & Above
Qualification level 2012(% change since 2011)
22%-34% -18%
16%
14%
38%
29%
15 to 19
20 to 24
25 to 44
45 to 64
Age group 2012(% total)
4%
5%
82%
83%
14%
11%
Y2011
Y2012
Enrolments by Funding Band 2011 - 2012
A B C

Industry Training Profiles
94 Victorian Training Market Quarterly Report Full Year 2012
Arts and Recreation Services
Industry Overview Figure 4.16: Industry share, 2011-12
Employment in the Arts and Recreation Services industry represented 58,300 workers in 2011-12. Almost half the workers in the industry are employed in the Sports and Recreation Activities sector with the remainder shared across Heritage, Creative and Performing Arts and Gambling Activities.
Employment growth of 1,100 is anticipated over the next five years, with the majority in the Creative and Performing Arts sector.
Forecasts indicate the industry‟s share of Victorian output will rise slightly over the next few years, to 3 per cent of the total by 2016-17.
Arts and Recreation Services has approximately 7,400 enterprises in Victoria.
A number of sectors in this industry, particularly the Sports and Recreation Activities sector, are highly reliant on a volunteer workforce, which poses challenges for worker retention and skill acquisition.
The industry‟s workforce is also characterised by a younger than average employee profile.
The Arts and Recreation industries play important role culturally, socially and economically in Victoria, both in Melbourne and in Victoria‟s regions. Businesses operating in this sector require workers with a diverse range of skills, from technical ability through to business acumen, in order to success in a commercial environment.
The Recreation sector is focusing on increasing participation in sport and physical activities in line with a greater focus on preventative health in Australia.
Figure 4.17: Forecasts to 2016-17 and 2011-12 current workforce age and qualifications
2%1% 2%
5%
Employment Businesses EconomicOutput
VETenrolments
Source: Monash CoPS, ABS, SVTS
Key training challenges for the industry
There are no identified skill shortage occupations specific to this industry, although identified shortages in the occupation Community Worker affect the Arts and Recreation industry. Emerging shortages have also been flagged in aquatics skills, particularly in regional locations.
Business, management and customer service skills are increasingly required by employees in arts and entertainment sectors, in addition to their technical skills and artistic skills.
Providing information about job prospects and career outcomes is important in this industry, via services such as the Victorian Skills Gateway, to ensure prospective students are making well-informed choices about their future career.

Industry Training Profiles
Victorian Training Market Quarterly Report Full Year 2012 95
Training Delivery Overview23 Figure 4.18: Industry training comparisons
Enrolments in Arts and Recreation courses were 26,700 in 2012, representing a slight decline of 3 per cent when compared with 2011 enrolments.
While enrolments in Arts and Recreation courses have declined, student contact hours in this industry have increased by 12 per cent, representing a trend towards more time intensive training.
Courses in Community Recreation and Activity (aligned to the shortage occupation Community Worker) have shown a high rate of growth in 2012, up by over 80 per cent since 2011 – although this is off a very small base.
Training Breakdown There are a diverse range of qualifications in the
Arts and Recreation services industry, covering Sports and Recreation, Music and Performing Arts, Arts Administration and some elements of Horticulture (Parks and Gardens and Sports Ground Maintenance).
Courses aligned to the Sports and Recreation sector comprise a majority of Arts and Recreation enrolments, 70 per cent in 2012. Creative and Performing Arts is the next most popular sector in terms of course enrolments, 22 per cent of the total. Enrolments in Performing Arts declined in 2012, down by 10 per cent, while Sports and Recreation enrolments remained relatively flat, increasing by 3 per cent.
Fitness Instructor courses continue to attract the most enrolments in this industry, with enrolments relating to this occupation increasing by 18 per cent in 2012 (an additional 1,700 enrolments). This represents a significant slowdown in growth when compared to the 2010 to 2011 period that saw an increase of 128 per cent.
Enrolments linked to the occupation Sportspersons showed the largest decline in 2012, down by 1,500 enrolments (or 79 per cent), driven largely by lower enrolments in Certificate II in Sport (Career Oriented Participation).
Figure 4.19: Government subsidised enrolments
23
Scope of data is nationally accredited and recognised training at AQF level 1 and above. Comparisons with all-industry
training exclude foundation level training but includes vocational courses which do not align to a single ANZSIC industry (e.g.
business and administration). Commentary refers to government subsidised activity unless otherwise stated.
2008 2009 2010 2011 2012
Arts and Recreation
Services 13,500 14,700 19,000 27,500 26,700
Year-on-year %
change - 9% 29% 45% -3%
% change across all
industries - 3% 18% 32% 14%
Top qualifications 2012
Certificate III in Fitness 5,600
Certificate IV in Fitness 4,700
Certificate III in Sport and
Recreation1,300
Diploma of Music 950
Diploma of Visual Art 850
These 5 courses accounted for 51% of all
government funded training in the industry
3,500
17,800
5,400
Cert I-II Cert III-IV Diploma & Above
Qualification level 2012(% change since 2011)
8%
41%
23%
25%
9%
15 to 19
20 to 24
25 to 44
45 to 64
Age group 2012(% total)
-7%
-34%

Industry Training Profiles
96 Victorian Training Market Quarterly Report Full Year 2012
The proportion of enrolments in Certificate III-IV level qualifications has increased over the last 12 months, with 67 per cent of enrolments at this level compared with 60 per cent in 2011. The proportion of those choosing to study at Certificate I-II level has fallen by 6 percentage points over the same period, with the proportion of Diploma+ enrolments remaining relatively stable.
Apprentice and trainee enrolments comprise 12 per cent of total enrolments in Arts and Recreation courses. Gardener and Greenkeeper (working in the Sports and Recreation sector) qualifications are the most popular apprenticeship enrolments.
Women account for 43 per cent of enrolments in this industry, up from 40 per cent in 2011. Women are more likely than men to enrol in courses aligned to Visual Arts and Crafts Professionals and Copywriters (women accounted for 73 per cent and 68 per cent of enrolments in these courses in 2012), while men account for a majority of enrolments in courses aligned to Music Professionals, Sports Development Officers and Outdoor Education Guides. Women account for just 1 per cent of enrolments in Greenkeeper courses and no enrolments aligned to Sportspersons.
For Arts and Recreation Services related training, the main reasons students were completing a vocational training qualification was for personal interest or self-development or to get a job. Around 62 per cent of students undertaking Arts and Recreation Services related courses held at least a Year 12 or equivalent qualification.
Training Provision Private training providers deliver just over half of all
training in Arts and Recreation Services (54 per cent), with TAFE Institutes accounting for 42 per cent. ACE providers make up the remaining 4 per cent of enrolments, a proportion which has remained constant from 2011.
Of the top ten Arts and Recreation services occupations in terms of 2012 enrolments, TAFE providers delivered a majority of training aligned to the occupations Visual Arts and Crafts Professionals, Copywriters, Forestry Workers, Horse Trainers and Gardeners.
Figure 4.20: Training provider share of enrolments
Private providers delivered a majority of training linked to Fitness Instructors, Music Professionals, Sports Development Officers and Outdoor Adventure Guides.
78 providers delivered government subsidised training in Arts and Recreation qualifications in 2012, down from 80 in 2011. Of these, just under half (36 providers) delivered less than 100 enrolments in 2012.
Sixty-seven per cent of Arts and Recreation Services enrolments involved some classroom based delivery. Ten per cent included employment based training and a further 14 per cent involved recognition of prior learning, recognition of current competency, or credit transfer.
In the Arts and Recreation Services industry 16 per cent of enrolments were funded at subsidy levels A and B, equating to 6,300 enrolments. There has been a 1 per cent decline in bands A and B between 2011 and 2012. In 2012, bands D and E represented 74 per cent of all enrolments or 19,700 enrolments. The percentage share of bands D and E increased by 7 percentage points over this same period.
42%
54%
4%
TAFE Private ACE
Provider share 2012(change in percentage points since 2011)
-3% 3%

Industry Training Profiles
Victorian Training Market Quarterly Report Full Year 2012 97
Construction
Industry Overview Figure 4.21: Industry share, 2011-12
Construction contributed $21.6 billion to Victoria‟s output in 2011-12, representing 7 per cent of the total and forecast to grow to 8 per cent in output terms through the next five years to 2016-17.
Construction employs approximately 251,000 people, the industry is expected to grow in employment by approximately 13 per cent or 33,000 jobs in Victoria over the next five years.
Most of this growth is anticipated in the Construction Services sector, representing 75 per cent of all growth to 2016-17.
It is estimated that there are currently around 89,000 Construction businesses operating across Victoria, of which 60 per cent are sole traders. Approximately 5 per cent of firms have turnover greater than $2 million per annum.
Overall, the sector fared reasonably well during the recent Global Financial Crisis, mainly as a result of large-scale public infrastructure investment as part of the government‟s stimulus and infrastructure program, and construction activity related to the mining boom.
However, house building in particular, and commercial construction to a lesser extent has suffered due to lower consumer confidence levels suppressing demand.
The workforce is predominantly younger in age with 67 per cent aged 44 or below (all-industry average is 62 per cent).
The industry is almost exclusively staffed by males, who represent 92 per cent of the workforce. Females are more prevalent in the older age categories, with 52 per cent in the 45+ age group.
The industry is also predominantly one with a full-time workforce – 84 per cent of employees in the sector are full-time, compared to 69 per cent on average across all industries.
Currently, 64 per cent of the Construction industry holds a qualification at a Certificate I or above level.
For the sector there remains concern that the language, literacy and numeracy (LLN) skills of existing workers and new entrants are limited in segments of the industry.
Figure 4.22: Forecasts to 2016-17 and 2011-12 current workforce age and qualifications

Industry Training Profiles
98 Victorian Training Market Quarterly Report Full Year 2012
Training Delivery Overview Figure 4.23: Industry training comparisons
Construction related courses accounted for 52,000 enrolments in 2012, growing 9 per cent since 2011.
Over 65 per cent of these enrolments were in occupations identified as in skills shortage, and included related occupations such as Electricians,
Plumbers, Carpenters and Joiners.
TAFE fee for service training represented around
16,200 enrolments in 2012, with growth of 7 per cent
since 2011.
Student contact hours have grown markedly in the
sector increasing 31 per cent between 2011 and
2012 to 19.2 million student contact hours,
representing a shift towards more time intensive
courses.
Apprenticeships and traineeships in the sector declined in 2012, falling 5 per cent to approximately 25,700 apprentices and trainees. Sixty-five per cent of this decline related to apprenticeships in Carpentry, Bricklaying and Electrical. This reflects a slowdown in the industry, with growth in Construction output negative in 2011-12 (about -3 per cent) and the third lowest of all Victorian industries.
2008 2009 2010 2011 2012
Construction 31,900 33,000 42,500 47,800 52,000
Year-on-year %
change - 3% 29% 12% 9%
% change across all
industries - 3% 18% 32% 14%
Key training challenges for the industry
There are a prevalence of skills shortages in this sector including: Air-conditioning and Mechanical Services Plumber; Air-conditioning and Refrigeration Mechanic; Bricklayer; Building Associate; Building Inspector; Carpenter; Civil Engineering Draftsperson; Civil Engineering Technician; Construction Estimator; Electrical Engineering Technician; Electrician (General); Electronic Instrument Trades Worker (General) and (Special Class); Fibrous Plasterer; Floor Finisher; Gasfitter; Glazier; Joiner; Mechanical Engineering Technician; Plumber (General); Roof Tiler; Solid Plasterer; Wall and Floor Tiler.
Population growth and recent interest rate reductions are expected to kick-start the housing market, again putting pressure on the labour market for experienced workers in the sector.
There is a need to support industry to utilise alternative assessment processes and recognition of prior learning to manage registration requirements.
Providing training opportunities around new regulatory changes, and up-skilling of existing workforce is required in the sector.
To ensure training packages reflect new technologies and materials on the market, the training market needs to provide continued opportunity for workers to be trained using the latest technologies.
Shifting demand in the Construction industry requires a broad range of transferrable skills, creating demand for increasingly multi-skilled workers.
Attraction of more females into the industry, especially into some of the in shortage occupation areas can support the industry to meet future skills demand.

Industry Training Profiles
Victorian Training Market Quarterly Report Full Year 2012 99
Training Breakdown Vocational training in the Construction sector is
predominately at the Certificate III and IV level, with around four out of five construction courses or approximately 42,500 enrolments at these qualification levels.
Figure 4.24: Government subsidised enrolments
There has been a decrease in the proportion of qualifications studied at Certificate I-II level since 2011, with a subsequent rise in Certificate III-IV and Diploma and above.
The gender profile of students studying Construction related courses is in the main male (97 per cent). By age group nearly two-thirds of students are aged between 15 and 24 years, a younger student profile than the all-industry average.
Enrolments in four of the top five Construction related qualifications grew between 2011 and 2012, with the largest growth seen for the Certificate III in Painting and Decorating. This course grew from around 700 to 2900 enrolments over this time period.
There was a marked increase in the Certificate II in Plumbing (Pre-apprenticeship) growing by around 700 enrolments between 2011 and 2012.
The Certificate III in Plumbing declined slightly over this period, falling by 80 enrolments.
For Construction related training, the top three reasons students were completing a vocational training qualification was because it was a requirement of their job; to get a job or to get extra skills for their current job. Around 60 per cent of students undertaking a Construction related course held at least a Year 12 or equivalent qualification.
Top qualifications 2012
Certificate III in Carpentry 6,500
Certificate III in Electrotechnology
Electrician6,400
Certificate III in Plumbing 5,500
Certificate III in Civil Construction
Plant Operations4,900
Certificate III in Painting and
Decorating2,900
These 5 courses accounted for 51% of all
government funded training in the industry
7,300
42,500
2,200
Cert I-II Cert III-IV Diploma & Above
Qualification level 2012(% change since 2011)
14% 28%
31%
32%
29%
7%
15 to 19
20 to 24
25 to 44
45 to 64
Age group 2012(% total)
-19%

Industry Training Profiles
100 Victorian Training Market Quarterly Report Full Year 2012
Training Provision Private Registered Training Organisations' (RTOs)
share of government subsidised vocational training has increased from 12 per cent of enrolments in 2008 to 32 per cent in 2012.
There were 78 training providers delivering government subsidised training related to the Construction sector in 2012, of which 16 had over 1,000 enrolments in the year.
Seventy-eight per cent of Construction enrolments involved some classroom based delivery. Ten per cent including employment based training and a further 13 per cent involved recognition of prior learning, recognition of current competency, or credit transfer.
In the Construction industry 96 per cent of enrolments were funded at subsidy levels A and B, equating to 46,000 enrolments. There has been a marginal decline in bands A and B between 2011 and 2012, with a corresponding increase in band C.
Figure 4.25: Training provider share of enrolments
67%
32%
1%
TAFE Private ACE
Provider share 2012(change in percentage points since 2011)
-10% 10%

Industry Training Profiles
Victorian Training Market Quarterly Report Full Year 2012 101
Education and Training
Industry Overview Figure 4.26: Industry share, 2011-12
There are nearly 6,600 businesses currently operating in this sector.
At present, the Education and Training industry accounts for 5.7 per cent of Victoria‟s industry output.
Forecasts to 2017 suggest output in the sector will remain relatively stable.
There are approximately 6,600 Education and Training organisations in Victoria. Approximately 30 per cent of businesses in this sector are medium or large, contrasting with most other industries where businesses are predominately small.
Currently employing around 224,400 people (nearly 8 per cent of Victoria‟s workforce), employment in the industry is forecast to grow by 8 per cent by 2017, creating as many as 18,600 jobs.
Presently, the majority (over 58 per cent) of those employed in this sector fall under the Preschool/ School Education sub-sector, followed by about 28 per cent under Tertiary Education.
The majority of the workforce has higher education qualifications (58 per cent). The workforce also generally tends to be spread evenly across all age bands.
Figure 4.27: Forecasts to 2016-17 and 2011-12 current workforce age and qualifications
Key training challenges for the industry
Population and social factors have led to an increase in demand for educators. Furthermore, Victoria has invested well in its tertiary education sector, thereby attracting large numbers of foreign students. Advancements in technology and changes in workforce structure have led to rising demand for educators in the vocational training sector.
Address identified skills shortages in Early Childhood (Pre-primary School) Teacher and Vocational Education Teacher. There is specific demand for skilled educators in areas of Nursing, Electrotechnology, Automotive and Construction.

Industry Training Profiles
102 Victorian Training Market Quarterly Report Full Year 2012
Training Delivery Overview24 Figure 4.28: Industry training comparisons
Education and Training related courses accounted for 10,100 enrolments in 2012.
Between 2011 and 2012, government subsidised enrolments in courses related to this industry experienced a marginal fall (down by one per cent), whereas, enrolments in TAFE domestic fee for service reported a 13 per cent rise.
Over 5,600 of these overall enrolments (56 per cent) were in occupations identified as in skills shortage.
Enrolments in Education courses related to skills shortage occupations have gone up by 20 per cent since 2011.
Training Breakdown 55 per cent of all Education related
enrolments are from females; the 5,600 enrolments in 2012 are up by 7 per cent since 2011. In 2012, enrolments by males were 4,500, down by 9 per cent since 2011.
85 per cent of enrolments (8,600) in courses related to the Education industry are at Certificate III–IV level. However, enrolments in Certificate III–IV level courses have fallen by 5 per cent over 2011 – 2012. Enrolments in Diploma+ courses have fallen as well.
Figure 4.29: Government subsidised enrolments
There has been a significant rise in enrolments (445 per cent) at Certificate I–II level over the same period, primarily driven by enrolments in Certificate II in Outdoor Recreation (up by 2116 per cent since 2011).
Nearly half the enrolments (43 per cent) in 2012 were from the 25–44 age group, followed by the 45–64 age group who accounted for 30 per cent of enrolments. However, there were fewer enrolments from both age groups compared to numbers in 2011 (down by 1 per cent and 9 per cent respectively).
The 20–24 age group has seen the highest rise in enrolments since 2011 (10 per cent) and currently account for 11 per cent of enrolments in courses related to the Education and Training industry.
For Education and Training related courses, the top three reasons students were completing a vocational
24 Scope of data is nationally accredited and recognised training at AQF level 1 and above. Comparisons with all-industry
training exclude foundation level training but includes vocational courses which do not align to a single ANZSIC industry (e.g.
business and administration). Commentary refers to government subsidised activity unless otherwise stated.
Top qualifications 2012
Certificate IV in Training and
Assessment5,300
Certificate III in Education Support 1,400
Certificate IV in Education Support 450
Certificate II in Outdoor Recreation 300
Certificate III in Business
Administration (Education)250
These 5 courses accounted for 76% of all
government funded training in the industry
550
8,600
950
Cert I-II Cert III-IV Diploma & Above
Qualification level 2012(% change since 2011)
445%
15%
11%
43%
30%
15 to 19
20 to 24
25 to 44
45 to 64
Age group 2012(% total)
-5% -10%

Industry Training Profiles
Victorian Training Market Quarterly Report Full Year 2012 103
training qualification was to get a job, for personal interest or self-development or to get extra skills for their current job. Around 74 per cent of students undertaking an Education and Training related course held at least a Year 12 or equivalent qualification.
Training Provision There were 166 training providers delivering
government subsidised vocational training related to the Education and Training industry in 2012.
In 2012, private Registered Training Organisations (RTOs) made up over half of the providers (63 per cent) delivering training in courses related to this industry.
Both the number of private RTOs and ACE providers have risen over 2011–2012 (up by 16 per cent and 7 per cent respectively). TAFE providers have remained the same.
Private RTOs share of government subsidised training has increased from 12 per cent of enrolments in 2008 to 52 per cent in 2012.
In the Education and Training sector 90 per cent of enrolments were funded at subsidy levels B and C, equating to 8,800 enrolments. There has been a 3 percentage point growth in bands B and C between 2011 and 2012.
Seventy-seven per cent of Education and Training enrolments involved some classroom based delivery. Seven per cent included employment based training and a further 12 per cent involved recognition of prior learning, recognition of current competency, or credit transfer.
Figure 4.30: Training provider share of enrolments

Industry Training Profiles
104 Victorian Training Market Quarterly Report Full Year 2012
Electricity, Gas, Water and Waste Services
Industry Overview
Figure 4.31: Industry share, 2011-12
Electricity, Gas, Water and Waste Services (Utilities) provided $6.1 billion to Victoria‟s output in 2011-12, representing 2 per cent of the total. Over the next five years this is forecast to grow by almost $1 billion or 16 per cent, representing 3 per cent of Victorian output by 2016-17.
Currently employing approximately 37,400 people, industry employment is expected to grow marginally (1 per cent) over the five years to 2016-17, with the largest growth in Waste disposal services. A small decline in the electricity sector is expected over this period (-2 per cent).
There are approximately 1436 business establishments across Victoria. Fifty-seven per cent of Utilities establishments are in metropolian Melbourne, with the greatest concentration in the Dandenong, Kingston and Casey-Cardinia regions in south-east Melbourne. Regional Victoria has Electricity, Gas, Water and Waste businesses located mostly in major regional centres, including Shepparton, Ballarat, Morwell, Bacchus Marsh, Warrnambool, Horsham, Kyneton and Traralgon. Over the last decade there has been a small movement of business establishments from regional to metropolitan Victoria.
Across the sector, 76 per cent of the state‟s total was small business, 21 per cent are medium enterprises and 3 per cent are large.
Around one third of the current Electricity, Gas, Water and Waste industry workforce hold no post-school qualifications. Twenty-six per cent have a Certificate I to Certificate IV, while a further 39 per cent hold a Diploma level qualification or above, on par with Victorian averages.
The Utilities sector has on older age profile, with 39 per cent of their workforce aged between 45 and 64 years, when compared with the State average (34 per cent).
Figure 4.32: Forecasts to 2016-17 and 2011-12 current workforce age and qualifications

Industry Training Profiles
Victorian Training Market Quarterly Report Full Year 2012 105
Training Delivery Overview Figure 4.33: Industry training comparisons
Electricity, Gas, Water and Waste related courses accounted for around 950 enrolments in 2012, representing a fall of 8 per cent since 2011. However, student contact hours grew 10 per cent over the same period, representing a move towards more time intensive training in the sector.
At the same time there was a marked rise (46 per cent) in TAFE fee for service provision in the sector with over 4,000 enrolments. This was largely due to a 69 per cent growth the Certificate II in Water Operations, increasing from 1,850 enrolments in 2011 to 3,100 enrolments in 2012.
Apprenticeships and traineeships grew by 13 per cent to approximately 500 enrolments between 2011 and 2012.
Enrolments in both in shortage and specialised related courses fell in 2012, by 9 per cent and 19 per cent respectively, representing a skills challenge for the industry. Through the new Industry Participation Model, the Market Facilitation and Information Division of DEECD will be working with the industry to resolve these issues.
2008 2009 2010 2011 2012
Electricity, Gas, Water
and Waste Services 800 700 850 1,050 950
Year-on-year %
change - -10% 23% 20% -8%
% change across all
industries - 3% 18% 32% 14%
Key training challenges for the industry
Specific occupations in shortage in the Electricity, Gas, Waste, and Water Services industry include Electrical Engineering Technician, Electrical Lines-worker, Gasfitter, and Recycling or Rubbish Collector.
The Clean Energy Future Plan, is focused on the closure of up to 2000 MW of coal fire generation plants, driving significant investment in alternative generation sources and associated demand for training and growth in credentialing against qualifications. Small businesses in particular are enrolling workers in qualifications that enhance the installation and maintenance of renewable energy systems such as solar cells, hot water units, lighting efficiency and energy auditing.
The new National Licensing System has included the identification of the Electrical Fitter classification for electrical trades that will have training and workforce impacts
Training providers are facing some difficulties in finding teachers suitably qualified to teach the material, and training providers are only able to offer limited simulation capabilities.
Training providers are challenged to keep pace with the advancements in technology and new infrastructure requirements, as well as integrating these changes into training courses - particularly in the power generation sector.
There are some challenges with thin markets in the sector where there is a lack of critical mass in certain sectors to deliver training in the market. For example, employers report difficulties engaging RTOs to deliver Gas Training Package qualifications.

Industry Training Profiles
106 Victorian Training Market Quarterly Report Full Year 2012
Training Breakdown Sixty-three per cent of government subsidised enrolments in the Utilities sector are at the Certificate III–IV
level (600 enrolments). Between 2011 and 2012 qualifications at the Certificate III–IV level were the only courses to grow across the sector.
Certificate I–II enrolments fell 56 per cent, while the Diploma and above fell 22 per cent. Falling enrolments present a challenge for the sector given prevailing skills shortages and forecast replacement demand growth for workers that leave the sector.
The Certificate III in ESI – Distribution and the Certificate III in Asset Management (Waste Management) had the highest number of enrolments in the sector in 2012, with around 200 and 150 enrolments respectively. Both of these courses grew in enrolments between 2011 and 2012, up 1 per cent and 31 per cent respectively.
Sixty-one per cent of students enrolled in Electricity, Gas, Water and Waste related courses were aged over 25 years.
For Utilities related training, the main reasons students were completing a vocational training qualification was because it was a requirement of their job or to get extra skills for their current job. Around 73 per cent of students undertaking Utilities related courses held at least a Year 12 or equivalent qualification.
Figure 4.34: Government subsidised enrolments
Training Provision TAFEs provide 79 per cent of government subsidised
enrolments in 2012.
Private Registered Training Organisations' (RTOs) share of government subsidised vocational training has increased 6 per cent to 21 per cent of enrolments all enrolments between 2011 and 2012.
There were 11 training providers delivering government subsidised training related to the Utilities sector in 2012.
In the Electricity, Gas, Water and Waste Services industry 44 per cent of enrolments were funded at subsidy levels A and B, equating to 400 enrolments. There has been a 7 per cent growth in bands A and B between 2011 and 2012.
Seventy-eight per cent of Electricity, Gas, Water and Waste Services industry enrolments involved some classroom based delivery. Twelve per cent included employment based training and a further 16 per cent involved recognition of prior learning, recognition of current competency, or credit transfer.
Figure 4.35: Training provider share of enrolments
Top qualifications 2012
Certificate III in ESI - Distribution 200
Certificate III in Asset Maintenance
(Waste Management)150
Advanced Diploma of Engineering
Technology - Electrical150
Certificate IV in Asset Maintenance
(Waste Management)50
Advanced Diploma of ESI - Power
Systems50
These 5 courses accounted for 62% of all
government funded training in the industry
60
600
300
Cert I-II Cert III-IV Diploma & Above
Qualification level 2012(% change since 2011)
16%
12%
26%
37%
24%
15 to 19
20 to 24
25 to 44
45 to 64
Age group 2012(% total)
-56% -22%

Industry Training Profiles
Victorian Training Market Quarterly Report Full Year 2012 107
Financial and Insurance Services
Industry Overview Figure 4.36: Industry share, 2011-12
Australia has one of the largest and most highly developed markets for financial services in the Asia Pacific region and Victoria is a key financial and business centre in this market – accounting for around one third of the Australian Finance and Insurance industry.
Financial and Insurance Services contributed $37 billion to Victoria‟s output in 2011-12, representing 13 per cent of the total – a proportion which is forecast to remain consistent over time.
There are approximately 43,300 Finance and Insurance businesses in Victoria. Over 80 per cent of the industry is based in metropolitan Melbourne, particularly in the CBD and surrounding inner suburbs.
Currently employing approximately 114,200 people, the industry is expected to grow by over 6,000 jobs in Victoria over the five years to 2016-17. Growth is anticipated in all industry sub-sectors with growth of 6 per cent in Finance, 6 per cent in Insurance and Superannuation Funds and 5 per cent in Finance and Insurance Services.
The sector has a relatively low proportion of the workforce without a post-school qualification at 31 per cent compared to an all-industry comparision of 37 per cent.
The age profile of the sector reflects the average age profile across all industries in Victoria. Just over a third of the sector is aged 45 years and older, while 9 per cent of the sector‟s workforce is aged between 15 and 24 years.
Figure 4.37: Forecasts to 2016-17 and 2011-12 current workforce age and qualifications
Key training challenges for the industry
There are no identified skill shortage occupations for this industry.
Continuing and expanding regulation of occupations in the sector, requiring training in managing and monitoring compliance to mitigate risk and deliver services and products.
Growing skills demand for specialisation and expertise in information technology to develop innovative products for clients.
An increase in skills utilisation and innovation across the sector.

Industry Training Profiles
108 Victorian Training Market Quarterly Report Full Year 2012
Training Delivery Overview25 Figure 4.38: Industry training comparisons
Financial and Insurance Services related courses accounted for 6,300 enrolments in 2012.
Between 2008 and 2012 there has been significant growth in training within this industry sector, increasing from 1,000 enrolments in 2008 to approximately 6,300 in 2012. Most of this growth is attributed to the increased demand for the Certificate III in Financial Services and the Diplomas of Financial Planning and Financial Services. This growth levelled off between 2011 and 2012 with enrolments declining by 400.
Student contact hours however continued to grow significantly between 2011 and 2012, increasing 74 per cent to 2.2 million student contact hours. This indicates a move towards more time intensive training courses, most notable within the Diploma of Financial Planning and Advanced Diploma of Financial Services (Financial Planning).
Approximately 800 enrolments related to specialised occupations in 2012, a decline of around 22 per cent since 2011.
There were 500 traineeships in the Financial and Insurance Services sector in 2012, a small increase of 1 per cent from 2011.
Training breakdown The largest government subsidised enrolments in this industry were for the Certificate IV and the
Certificate III in Financial Services, with approximately 2,600 and 750 enrolments respectively. The Diploma of Financial Planning had the third largest number of enrolments in the sector for 2012, at 600 enrolments.
Figure 4.39: Government subsidised enrolments
25 Scope of data is nationally accredited and recognised training at AQF level 1 and above. Comparisons with all-industry
training exclude foundation level training but includes vocational courses which do not align to a single ANZSIC industry (e.g.
business and administration). Commentary refers to government subsidised activity unless otherwise stated.
2008 2009 2010 2011 2012
Financial and
Insurance Services 1,000 1,400 1,700 6,700 6,300
Year-on-year %
change - 30% 28% 288% -7%
% change across all
industries - 3% 18% 32% 14%
Top qualifications 2012
Certificate IV in Financial Services 2,600
Certificate III in Financial Services 750
Diploma of Financial Planning 600
Diploma of Financial Services
(Financial Planning)350
Diploma of Financial Services 350
These 5 courses accounted for 74% of all
government funded training in the industry
10
3,800
2,500
Cert I-II Cert III-IV Diploma & Above
Qualification level 2012(% change since 2011)
400%22%
12%
31%
40%
16%
15 to 19
20 to 24
25 to 44
45 to 64
Age group 2012(% total)
-19%

Industry Training Profiles
Victorian Training Market Quarterly Report Full Year 2012 109
By qualification level, there was a 19 per cent decline in enrolments at the Certificate III–IV level, with 3,800 enrolments in 2012. Diploma and above qualifications grew 22 per cent to 2,500 enrolments.
Over half (56 per cent) of students studying courses related to Financial and Insurance Services are aged over 25 years. Twelve per cent are aged 15 to 19 years and a further 16 per cent are aged over 45 years of age.
For Finance related training, the main reasons students were completing a Vocational Training qualification was for personal interest or self-development and because it was a requirement of their job. Around 69 per cent of students undertaking Financial and Insurance Services related courses held at least a Year 12 or equivalent qualification.
Training Provision Private Registered Training Organisations (RTOs)
have the largest share of government subsidised training, representing 92 per cent of all enrolments, an increase of 2 per cent between 2011 and 2012.
There were 37 training providers delivering government subsidised vocational training related to the Financial and Insurance Services industry in 2012.
In the Financial and Insurance Services industry 64 per cent of enrolments were funded at subsidy level C, equating to 4,000 enrolments and 2,300 enrolments were in band D (or 36 per cent). There has been a 6 percentage point decline in band C between 2011 and 2012.
Twenty-two per cent of Finance enrolments involved some classroom based delivery, while 18 per cent of enrolments were electronic based. Thirty-four per cent included employment based training and a further 7 per cent involved recognition of prior learning, recognition of current competency, or credit transfer.
Figure 4.40: Training provider share of enrolments
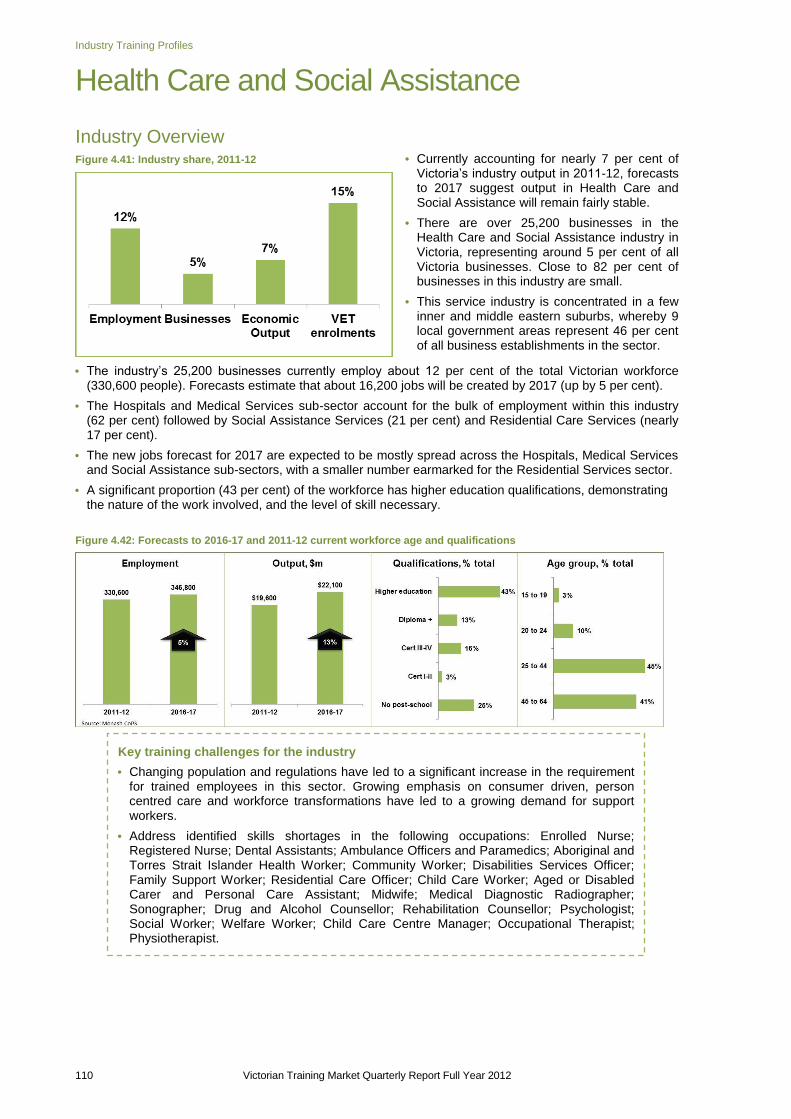
Industry Training Profiles
110 Victorian Training Market Quarterly Report Full Year 2012
Health Care and Social Assistance
Industry Overview Figure 4.41: Industry share, 2011-12
Currently accounting for nearly 7 per cent of Victoria‟s industry output in 2011-12, forecasts to 2017 suggest output in Health Care and Social Assistance will remain fairly stable.
There are over 25,200 businesses in the Health Care and Social Assistance industry in Victoria, representing around 5 per cent of all Victoria businesses. Close to 82 per cent of businesses in this industry are small.
This service industry is concentrated in a few inner and middle eastern suburbs, whereby 9 local government areas represent 46 per cent of all business establishments in the sector.
The industry‟s 25,200 businesses currently employ about 12 per cent of the total Victorian workforce (330,600 people). Forecasts estimate that about 16,200 jobs will be created by 2017 (up by 5 per cent).
The Hospitals and Medical Services sub-sector account for the bulk of employment within this industry (62 per cent) followed by Social Assistance Services (21 per cent) and Residential Care Services (nearly 17 per cent).
The new jobs forecast for 2017 are expected to be mostly spread across the Hospitals, Medical Services and Social Assistance sub-sectors, with a smaller number earmarked for the Residential Services sector.
A significant proportion (43 per cent) of the workforce has higher education qualifications, demonstrating the nature of the work involved, and the level of skill necessary.
Figure 4.42: Forecasts to 2016-17 and 2011-12 current workforce age and qualifications
Key training challenges for the industry
Changing population and regulations have led to a significant increase in the requirement for trained employees in this sector. Growing emphasis on consumer driven, person centred care and workforce transformations have led to a growing demand for support workers.
Address identified skills shortages in the following occupations: Enrolled Nurse; Registered Nurse; Dental Assistants; Ambulance Officers and Paramedics; Aboriginal and Torres Strait Islander Health Worker; Community Worker; Disabilities Services Officer; Family Support Worker; Residential Care Officer; Child Care Worker; Aged or Disabled Carer and Personal Care Assistant; Midwife; Medical Diagnostic Radiographer; Sonographer; Drug and Alcohol Counsellor; Rehabilitation Counsellor; Psychologist; Social Worker; Welfare Worker; Child Care Centre Manager; Occupational Therapist; Physiotherapist.

Industry Training Profiles
Victorian Training Market Quarterly Report Full Year 2012 111
Training Delivery Overview26 Figure 4.43: Industry training comparisons
There were a total of 77,600 government subsidised enrolments in the Health Care and Social Assistance industry in 2012, representing growth of 26 per cent since 2011.
TAFE fee for service enrolments were 19,100, approximately 20 per cent of the total. Enrolments in TAFE domestic fee for service reported a 42 per cent rise.
Nearly 66,400 of these overall enrolments (69 per cent) were in occupations identified as in shortage, up by 27 per cent since 2011. These included, for example, Dental Assistants, Welfare Centre Managers and Drug and Alcohol Counsellors.
8 per cent of all enrolments were Apprenticeships / Traineeships.
31 per cent of enrolments were in occupations categorised as specialised.
Training Breakdown The Health Care and Social Assistance
training sector is female-dominated with 86 per cent of enrolments from females; the 66,500 enrolments in 2012 are up by 26 per cent since 2011.
In 2012, enrolments by males were 11,000, up by 32 per cent since 2011.
Figure 4.44: Government subsidised enrolments
65 per cent of enrolments (50,400) in courses related to the Health sector are at Certificate III–IV level. Enrolments in Certificate III–IV level courses have risen by 30 per cent over 2011–2012. Some of the largest increases in enrolments were in Certificate IV in Health Science Foundations associated with the Nursing Support Worker occupation (up by 794 per cent), and Certificate IV in Social Housing (up by 318 per cent).
Enrolments in Diploma+ courses have risen as well (by 25 per cent). It accounts for 32 per cent of enrolments in the industry. The rise may be attributed to the 446 per cent increase in enrolments in Advanced Diploma of Nursing (Enrolled/Division 2 nursing), which is also one of the more popular qualifications.
26 Scope of data is nationally accredited and recognised training at AQF level 1 and above. Comparisons with all-industry
training exclude foundation level training but includes vocational courses which do not align to a single ANZSIC industry (e.g.
business and administration). Commentary refers to government subsidised activity unless otherwise stated.
2008 2009 2010 2011 2012
Health Care and
Social Assistance 29,900 36,100 45,800 61,400 77,600
Year-on-year %
change - 21% 27% 34% 26%
% change across all
industries - 3% 18% 32% 14%
Top qualifications 2012
Certificate III in Children's Services 15,800
Diploma of Children's Services (Early
childhood education and care)9,100
Certificate III in Aged Care 8,700
Diploma of Nursing (Enrolled/ Division
2 Nursing) 6,000
Certificate III in Home and Community
Care4,400
These 5 courses accounted for 57% of all
government funded training in the industry
2,100
50,400
25,100
Cert I-II Cert III-IV Diploma & Above
Qualification level 2012(% change since 2011)
30% 25%
-15%
13%
17%
45%
25%
15 to 19
20 to 24
25 to 44
45 to 64
Age group 2012(% total)

Industry Training Profiles
112 Victorian Training Market Quarterly Report Full Year 2012
Enrolments in Certificate I–II level courses have fallen by 15 per cent over 2011–2012.
Nearly half the enrolments (45 per cent) in 2012 were from the 25–44 age group, followed by the 45–64 age group who accounted for 25 per cent of enrolments. Compared to numbers in 2011, enrolments in both age groups have risen (by 29 per cent and 26 per cent respectively).
Enrolments in the 20–24 age group have also risen by 26 per cent. This age group account for 17 per cent of enrolments in courses related to the industry.
For Health Care and Social Assistance related training, the top three reasons students were completing a vocational training qualification were to get a job; to get extra skills for their current job or for personal interest or self-development. Around 72 per cent of students undertaking a Health Care and Social Assistance related courses held at least a Year 12 or equivalent qualification.
Training Provision There were 230 training providers delivering government
subsidised vocational training related to Health Care and Social Assistance industry in 2012.
In 2012, Private Registered Training Organisations (RTOs) made up over half of the providers (58 per cent) delivering training in courses related to this industry. However, over 2011–2012, private RTOs have been on the decline (down by 4 per cent) in this sector.
TAFE providers have risen by 6 per cent over the same period.
Private RTOs‟ share of government subsidised training has increased from 17 per cent of enrolments in 2008 to 53 per cent in 2012.
Meanwhile, TAFE provision has fallen from 68 per cent in 2008 to 35 per cent in 2012.
In the Health Care and Social Assistance industry 44 per cent of enrolments were funded at subsidy levels A and B, equating to 34,400 enrolments and 2,300 enrolments were in band D (or 3 per cent).
Seventy-four per cent of Health Care and Social Assistance enrolments involved some classroom based delivery. Thirteen per cent included employment based training and a further 18 per cent involved recognition of prior learning, recognition of current competency, or credit transfer.
Figure 4.45: Provider share of enrolments

Industry Training Profiles
Victorian Training Market Quarterly Report Full Year 2012 113
Information Media and Telecommunications
Industry Overview Figure 4.46: Industry share, 2011-12
The Information Media and Telecommunications industry is made up of Library and Other Information Services, Internet Service Providers, Web Search Portals and Data Processing Services, Telecommunications Services, Internet Publishing and Broadcasting, Broadcasting (except Internet), Motion Picture and Sound Recording Activities, and Publishing (except Internet and Music Publishing).
There are approximately 5,000 Information, Media and Telecommunications enterprises in Victoria and the industry is dominated by small businesses (87 per cent). Approximately 40 per cent of the industry is located in Melbourne‟s CBD and inner local government areas including Boroondara, Glen Eira and Port Philip.
In 2011-12, the Information Media and Telecommunications industry accounted for about 2 per cent of Victoria‟s output and employment. It is Victoria‟s third smallest industry in terms of output, and fifth smallest employer.
Over the last five years, the Information Media and Telecommunications industry has had the fifth lowest output growth of all industries (about 3.5 per cent average annual growth) and the third lowest employment growth of all industries (0.2 per cent average annual growth). Employment growth has been weakest in the Publishing sub-sector over the last five years.
It is one of only two industries expected to experience a fall in employment over the next five years. Employment is forecast to decline by approximately 2,500 persons, the worst result of all industries. This growth is expected to be driven largely by declines in Telecommunications Services jobs.
On the upside, an improvement in consumer and business confidence should see a commensurate upswing in demand. On top of that, the NBN would add to employment requirements.
However, the industry faces increasing competition from digitisation and outsourcing. Publishing has been moving to lower cost digital format and increasingly to overseas providers. The growth of telecommunications outsourcing in countries such as India, combined with advances in communications technologies, is increasingly exposing the industry to global competition. Employment growth due to the broadband rollout is expected to be offset to some extent by continuing technological change and productivity gains in the industry.
Figure 4.47: Forecasts to 2016-17 and 2011-12 current workforce age and qualifications
2%
1%
2%
1%
Employment Businesses EconomicOutput
VETenrolments
Source: Monash CoPS, ABS, SVTS

Industry Training Profiles
114 Victorian Training Market Quarterly Report Full Year 2012
Training Delivery Overview27 Figure 4.48: Industry training comparisons
Growth in government subsidised enrolments in Information Media and Telecommunications courses has slowed. Enrolments reached 3,900 in 2012, an increase of only 3 per cent from 2011. This is considerably lower than the average for all industries, and growth over the previous two years.
The number of TAFE fee for service enrolments decreased by 11 per cent in 2012. TAFE fee for service delivery now accounts for 35 per cent of industry enrolments.
The occupation with the largest increase in enrolments was Performing Arts Technicians. Enrolments increased by approximately 150 (35 per cent) between 2011 and 2012. Enrolments related to Performing Arts Technicians account for 16 per cent of all Information Media and Telecommunications training.
Enrolments in Library Assistant courses saw the largest decline in 2012, down by about 100 (22 per cent).
There are very few apprentices and trainees in the Information Media and Telecommunications industry, and enrolments remained fairly constant between 2011 and 2012.
Growth in enrolments for occupations that are in shortage (7 per cent) exceeded growth in total enrolments (-3 per cent). In particular, enrolments for Cablers grew strongly. However, enrolments for Telecommunications Technical Officers or Technologists declined, despite it being in shortage and specialised. This will be less of an issue should forecasts of declining employment of Telecommunications Technical Specialists prove to be correct.
27
Scope of data is nationally accredited and recognised training at AQF level 1 and above. Comparisons with all-industry
training exclude foundation level training but includes vocational courses which do not align to a single ANZSIC industry (e.g.
business and administration). Commentary refers to government subsidised activity unless otherwise stated.
2008 2009 2010 2011 2012
Information Media and
Telecommunications 2,100 3,000 3,500 3,800 3,900
Year-on-year % change - 42% 16% 8% 3%
% change across all
industries - 3% 18% 32% 14%
Key training challenges for the industry
Meeting skills shortages in specialised occupations like Electrical Engineering Technician and Telecommunications Technical Officer, and in non-specialised occupations like Cabler (Data and Telecommunications).
Ensuring enrolments are targeted to sub-sectors that are expected to increase over the next five years, and not dwindling occupations within the publishing and telecommunications sub-sectors.
Facilitating participation of females in training.

Industry Training Profiles
Victorian Training Market Quarterly Report Full Year 2012 115
Training Breakdown The number of female enrolments in courses related to the Information Media and Telecommunications
industry declined slightly in 2012 (-30), whereas the number enrolments by men increased (+150).
Males now account for 59 per cent of enrolments, up from only 45 per cent in 2008. This is largely due to male enrolments in the Certificate II and III in Telecommunications, the Diploma of Sound Production and Certificate III in Broadband and Wireless Networks Technology. On the other hand, females comprise the majority of enrolments linked in the Advanced Diploma and Diploma of Library-Information Services.
The Information Media and Telecommunications industry has the second highest proportion of enrolments from the 35 to 44 age group of all industries. Otherwise, the age profile of those enrolling in Information Media and Telecommunications courses is fairly consistent with the Victorian average.
The Information Media and Telecommunications industry is highly educated compared to most industries. It has the fourth-lowest proportion of employees with no post-school qualifications and the fifth-highest proportion of employees with diploma and above qualifications of all Victorian industries.
However, in 2012, enrolment growth was strongest in lower qualifications in the Information Media and Telecommunications industry. Certificate I–II enrolments grew by 13 per cent, whereas enrolments in Certificate III–IV and Diploma+ increased only marginally.
Figure 4.49: Government subsidised enrolments
The Diploma of Screen and Media had the largest increase in enrolments in 2012 (up about 100), followed by a new qualification, Certificate I in Creative Industries (up about 90).
The proportion of employed students in this industry remained fairly stable in 2012 (up 1 per cent), representing 53 per cent of enrolments. The proportion of enrolments by unemployed people declined slightly, down by 1 percentage point.
For Information Media and Telecommunications related training, the top three reasons students were completing a vocational training qualification were to get a job; for personal interest or self-development or to try for a different career. Around 75 per cent of students undertaking Information Media and Telecommunications related courses held at least a Year 12 or equivalent qualification.
Top qualifications 2012
Diploma of Library-Information
Services400
Diploma of Specialist Make-up
Services350
Certificate III in Media 300
Certificate IV in Sound Production 300
Diploma of Screen and Media 300
These 5 courses accounted for 42% of all
government funded training in the industry
400
1,600
1,800
Cert I-II Cert III-IV Diploma & Above
Qualification level 2012(% change since 2011)
13% 2% 1%
37%
27%
25%
10%
15 to 19
20 to 24
25 to 44
45 to 64
Age group 2012(% total)

Industry Training Profiles
116 Victorian Training Market Quarterly Report Full Year 2012
Training Provision TAFEs continue to offer the vast majority of
enrolments for the Information Media and Telecommunications industry (86 per cent), however this share has been falling since 2010 (97 per cent).
Enrolments continued to shift away from TAFEs to private providers, and to a lesser extent ACE providers, in 2012. The enrolment share of TAFEs fell by about 7 percentage points.
Private providers deliver 11 per cent of Information Media and Telecommunications training – which is relatively low compared to other Victorian industries.
There were 33 training providers delivering government subsidised vocational training in Information Media and Telecommunications in 2012, 8 more than in 2011. This reflected an increase in all provider types. Of these, 25 delivered less than 100 enrolments in 2012.
In the Information Media and Telecommunications industry 22 per cent of enrolments were funded at subsidy levels B, equating to 850 enrolments. There has been a 1 percentage point decline in bands B between 2011 and 2012. In 2012, band D represented 40 per cent of all enrolments or 1,600 enrolments. The percentage share of bands D has remained consistent between 2011 and 2012.
Eighty-seven per cent of Information Media and Telecommunications enrolments involved some classroom based delivery. A further 12 per cent involved recognition of prior learning, recognition of current competency, or credit transfer.
Figure 4.50: Training provider share of enrolments
86%
11%
3%
TAFE Private ACE
Provider share 2012(change in percentage points since 2011)
-7% 6% 2%

Industry Training Profiles
Victorian Training Market Quarterly Report Full Year 2012 117
Manufacturing
Industry Overview Figure 4.51: Industry share, 2011-12
Currently accounting for 10 per cent of Victoria‟s industry output in 2011-12, forecasts to 2017 suggest output in the Manufacturing sector could rise slightly.
The industry currently contributes about $30.1 billion to the State economy, making it the second largest sector in Victoria.
There are close to 25,000 Manufacturing businesses in Victoria. Approximately four in five businesses in the industry are small and are heavily concentrated in the south-east, east and north-west industrial areas across Victoria.
Forecasts also suggest that about 9,800 jobs could be created over the same period, the effects of which will particularly be felt in the Melbourne region.
The industry currently employs around 304,000 people (11 per cent of Victoria's workforce). The largest employing Manufacturing sub-sectors are Food Product Manufacturing, Transport Equipment Manufacturing and Machinery and Equipment Manufacturing, accounting for 21 per cent, 12 per cent and 11 per cent of total Manufacturing employment respectively.
The sector is forecasting the most significant job losses from Metal Product Manufacturing (-1,300 jobs), followed by Textile, Clothing and Footwear Product Manufacturing (-300 jobs). Transport Equipment Manufacturing may increase employment to 2017 by an additional 5,600 jobs.
With nearly 42 per cent of the workforce with no post-school qualifications, and an ageing workforce, these structural changes to the sector will not come without challenges.
Figure 4.52: Forecasts to 2016-17 and 2011-12 current workforce age and qualifications
Key training challenges for the industry
Address identified skills shortages in the following occupations: Aircraft Maintenance Engineer (Avionics); Aircraft Maintenance Engineer (Mechanical); Aircraft Maintenance Engineer (Structures); Baker; Pastrycooks; Locksmith; Cabinetmaker; Electrician (General); Metal Fabricator and Sheet-Metal Trades Worker.
Significant industry structural adjustment including technological advancements and an ageing workforce requires rapid cross-skilling and up-skilling in new Manufacturing techniques and equipment.
High cost of equipment and facilities required for training in Manufacturing can act as a deterrent to training provision.
The high Australian dollar is posing challenges to competitiveness within the Victorian Manufacturing industry. This creates the need for more innovative and adventurous skills development.
Improve quality of training and apprenticeship programs available to the industry.
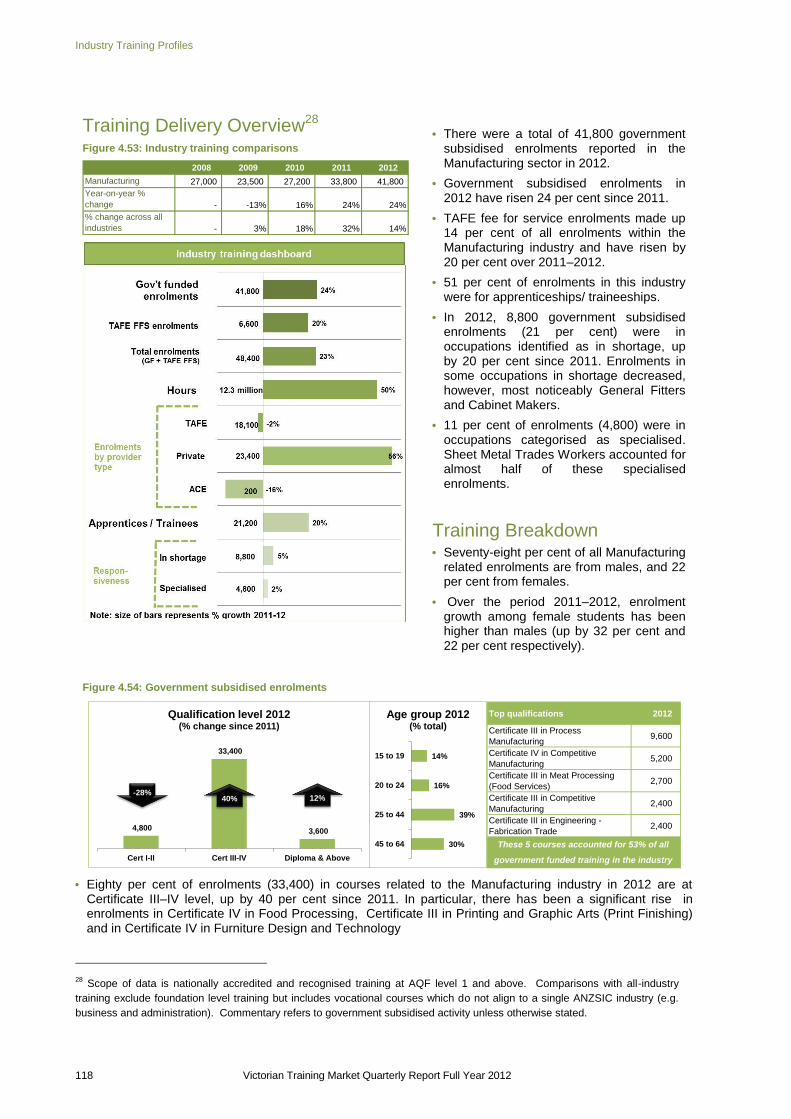
Industry Training Profiles
118 Victorian Training Market Quarterly Report Full Year 2012
Training Delivery Overview28 Figure 4.53: Industry training comparisons
There were a total of 41,800 government subsidised enrolments reported in the Manufacturing sector in 2012.
Government subsidised enrolments in 2012 have risen 24 per cent since 2011.
TAFE fee for service enrolments made up 14 per cent of all enrolments within the Manufacturing industry and have risen by 20 per cent over 2011–2012.
51 per cent of enrolments in this industry were for apprenticeships/ traineeships.
In 2012, 8,800 government subsidised enrolments (21 per cent) were in occupations identified as in shortage, up by 20 per cent since 2011. Enrolments in some occupations in shortage decreased, however, most noticeably General Fitters and Cabinet Makers.
11 per cent of enrolments (4,800) were in occupations categorised as specialised. Sheet Metal Trades Workers accounted for almost half of these specialised enrolments.
Training Breakdown Seventy-eight per cent of all Manufacturing
related enrolments are from males, and 22 per cent from females.
Over the period 2011–2012, enrolment growth among female students has been higher than males (up by 32 per cent and 22 per cent respectively).
Figure 4.54: Government subsidised enrolments
Eighty per cent of enrolments (33,400) in courses related to the Manufacturing industry in 2012 are at Certificate III–IV level, up by 40 per cent since 2011. In particular, there has been a significant rise in enrolments in Certificate IV in Food Processing, Certificate III in Printing and Graphic Arts (Print Finishing) and in Certificate IV in Furniture Design and Technology
28 Scope of data is nationally accredited and recognised training at AQF level 1 and above. Comparisons with all-industry
training exclude foundation level training but includes vocational courses which do not align to a single ANZSIC industry (e.g.
business and administration). Commentary refers to government subsidised activity unless otherwise stated.
2008 2009 2010 2011 2012
Manufacturing 27,000 23,500 27,200 33,800 41,800
Year-on-year %
change - -13% 16% 24% 24%
% change across all
industries - 3% 18% 32% 14%
Top qualifications 2012
Certificate III in Process
Manufacturing9,600
Certificate IV in Competitive
Manufacturing5,200
Certificate III in Meat Processing
(Food Services)2,700
Certificate III in Competitive
Manufacturing2,400
Certificate III in Engineering -
Fabrication Trade2,400
These 5 courses accounted for 53% of all
government funded training in the industry
4,800
33,400
3,600
Cert I-II Cert III-IV Diploma & Above
Qualification level 2012(% change since 2011)
40% 12%
14%
16%
39%
30%
15 to 19
20 to 24
25 to 44
45 to 64
Age group 2012(% total)
-28%

Industry Training Profiles
Victorian Training Market Quarterly Report Full Year 2012 119
Enrolments in Diploma+ courses have risen as well (by 12 per cent), driven primarily by increases in enrolments in Diploma of Aeroskills (Mechanical), Diploma of Process Plant Technology, Diploma of Aeroskills (Avionics) and Advanced Diploma of Competitive Manufacturing.
Eleven per cent of enrolments (4,800) are at Certificate I–II level, down by 28 per cent since 2011.
Sixty-nine per cent of enrolments in 2012 were from the 25–44 age group. All age groups reported a rise in enrolments over 2011–2012, with the exception of 15–19 year olds, with enrolments in this age cohort down by 10 per cent.
For Manufacturing related training, the main reasons students were completing a vocational training qualification were because it was a requirement of their job or to get extra skills for their current job. Around 57 per cent of students undertaking a Manufacturing related courses held at least a Year 12 or equivalent qualification.
Training Provision There was a total of a 105 training providers delivering
government subsidised vocational training related to the Manufacturing industry in 2012.
In 2012, private Registered Training Organisations (RTOs) made up a of the providers (77 per cent) delivering training in courses related to this industry.
TAFE ACE providers currently account for 17 per cent and 6 per cent respectively of training providers in the Manufacturing industry.
The number of ACE providers has dropped over 2011–2012 by 33 per cent, whereas private RTOs have risen by 25 per cent.
TAFE provider share of government subsidised training has fallen from 89 per cent of enrolments in 2008 to 43 per cent in 2012, whereas private RTOs share has increased from 10 per cent of enrolments in 2008 to 56 per cent in 2012.
In the Manufacturing industry 68 per cent of enrolments were funded at subsidy levels A and B, equating to 23,500 enrolments. There has been a 2 percentage point decline in bands A and B between 2011 and 2012. In 2012, bands D and E represented 23 per cent of all enrolments or 9,900 enrolments. The percentage share of bands D and E has grown by 2 percentage points over this same period.
Thirty-three per cent of Manufacturing enrolments involved some classroom based delivery. Fifty-eight per cent included employment based training and a further 14 per cent involved recognition of prior learning, recognition of current competency, or credit transfer.
Figure 4.55: Training provider share of enrolments
43%
56%
0%
TAFE Private ACE
Provider share 2012(change in percentage points since 2011)
-11% 12%

Industry Training Profiles
120 Victorian Training Market Quarterly Report Full Year 2012
Mining
Industry Overview Figure 4.56: Industry share, 2011-12
Victoria‟s Mining sector is relatively small, comprising around 840 businesses. Regional Victoria has 67 per cent of establishments, with concentrations around major mineral deposits or quarries where Mining activities occur including Greater Bendigo, Greater Geelong, Wellington, Latrobe, Corangamite and Ballarat.
Currently accounting for 2.6 per cent of Victoria‟s industry output in 2011-12, forecasts to 2017 suggest output in the Mining sector could rise to around 3.1 per cent, injecting around $2.5 billion into the economy.
Employment within the sector is estimated to rise by 26 per cent by 2017, creating about 3,300 new jobs.
The Mining industry currently employs around 12,900 people (0.4 per cent of Victoria's workforce). The majority of employment falls within the Metal Ore Mining sub-sector (34 per cent) followed by the Non- Metallic Mineral Mining and Quarrying sub-sector (22 per cent). It is expected that the Metal Ore Mining sector will have the most number of jobs created by 2017 (up by 1,100).
31 per cent of the workforce have no post-school qualifications.
Figure 4.57: Forecasts to 2016-17 and 2011-12 current workforce age and qualifications
Key training challenges for the industry
The Mining sector is closely linked to the global markets. However, given the small size of the Mining industry in Victoria, there are currently no occupations identified as being in shortage in the industry.
The resource sector expects to be significantly affected by the carbon tax, driving the need for up-skilling in order to adapt to emissions reduction technology.
Many training providers do not have the capacity to duplicate the work environment, especially in areas of technical competence and so there are a limited number of providers who offer specialised training in technical roles.
The cost to industry of training existing workers can be quite high.
Attracting and retaining trainers and assessors with current industry experience has been reported as a key challenge to training provision.

Industry Training Profiles
Victorian Training Market Quarterly Report Full Year 2012 121
Training Delivery Overview29 Figure 4.58: Industry training comparisons
In 2012, there were approximately 750 government subsidised and TAFE fee for service enrolments in courses related to the Mining sector, 73 per cent (550 enrolments) of which were government subsidised. Over 2011–2012, government subsidised enrolments have increased by 92 per cent.
TAFE fee for service enrolments made up 27 per cent of all enrolments within the Mining industry and have risen 161 per cent over 2011–2012, though from a small baseline of 200 enrolments.
Five per cent of enrolments in this industry were for apprenticeships / traineeships.
There are no specialised or in shortage occupations listed under this industry.
Uptake of training is primarily driven by the need to maximise safety, productivity, efficiency and ensure compliance.
Training Breakdown Training interest in this industry has been
primarily male dominated. Ninety-one per cent of all Mining related enrolments are from males.
Sixty-three per cent of enrolments (350) in courses related to the Mining industry are at Certificate III–IV level, up by 283 per cent since 2011.
Figure 4.59: Government subsidised enrolments
29 Scope of data is nationally accredited and recognised training at AQF level 1 and above. Comparisons with all-industry
training exclude foundation level training but includes vocational courses which do not align to a single ANZSIC industry (e.g.
business and administration). Commentary refers to government subsidised activity unless otherwise stated.
2008 2009 2010 2011 2012
Mining 390 370 320 280 530
Year-on-year %
change - -5% -14% -13% 92%
% change across all
industries - 3% 18% 32% 14%
Top qualifications 2012
Certificate IV in Surface Extraction
Operations250
Certificate II in Surface Extraction
Operations50
Certificate II in Resource
Processing50
Certificate II in Mining
Field/Exploration Operations50
Certificate III in Surface Extraction Operations50
These 5 courses accounted for 87% of all
government funded training in the industry
200
350
10
Cert I-II Cert III-IV Diploma & Above
Qualification level 2012(% change since 2011)
5% 283%-30%
16%
21%
48%
14%
15 to 19
20 to 24
25 to 44
45 to 64
Age group 2012(% total)

Industry Training Profiles
122 Victorian Training Market Quarterly Report Full Year 2012
There has been a significant uptake of Certificates III and IV in Surface Extraction Operations (up by 119 per cent and 765 per cent respectively.
35 per cent of enrolments (200 enrolments) in 2012 were at Certificate I–II level, rising 5 per cent over 2011–2012. In contrast, enrolments in Diploma+ courses have fallen 30 per cent over the same period.
Nearly half the enrolments (48 per cent) in 2012 were from the 25–44 age group, followed by the 20–24 age group who accounted for 21 per cent of enrolments.
The 20–44 age group also reported the largest increase in enrolments (up by 210 per cent) over 2011–2012, followed by the 45–64 age group (85 per cent rise).
For Mining related training, the main reasons students were completing a vocational training qualification were because it was a requirement of their job or to get a job. Around 54 per cent of students undertaking a Mining related courses held at least a Year 12 or equivalent qualification.
Training Provision There were six training providers delivering
government subsidised vocational training related to the Mining industry in 2012.
In 2012, there were two Private Registered Training Organisations (RTOs) delivering training in courses related to this industry.
There were 4 TAFE providers offering related training programs in 2012, down from 5 in 2011.
TAFE provider share of government subsidised training has risen from 92 per cent of enrolments in 2008 to 96 per cent in 2012, whereas private RTOs share has decreased from 8 per cent of enrolments in 2008 to 4 per cent in 2012.
In the Mining industry the majority of enrolments (99 per cent) were funded at subsidy levels A and B, equating to 500 enrolments.
Sixty-eight per cent of Mining enrolments involved some classroom based delivery. Eleven per cent included employment based training and a further 27 per cent involved recognition of prior learning, recognition of current competency, or credit transfer.
Figure 4.60: Training provider share of
enrolments

Industry Training Profiles
Victorian Training Market Quarterly Report Full Year 2012 123
Other Services
Industry Overview Figure 4.61: Industry share, 2011-12
„Other Services‟ employs approximately 113,000 people across Victoria, or 4 per cent of the State‟s workforce. Approximately 45 per cent of people employed in this sector work in the Repair and Maintenance sector, with the remainder are employed in Personal and Related Services.
Employment in the industry is forecast to grow by 5,000 jobs over the next five years, with a majority of growth (60 per cent) foreseen in the Personal and Related sector.
Output growth is forecast to be in line with growth in the overall economy, gaining 14 per cent over the five years to 2016-17.
There are approximately 22,000 businesses that fall into the Other Services sector in Victoria.
Covering a diverse range of skills and services, the ongoing economic uncertainty has affected the various sectors in this industry in different ways. Consumers have decreased their discretionary spend, with negative implications for businesses in the Personal Services segment. Repair and Maintenance businesses, on the other hand, have benefited in some instances – consumers have tended to delay purchasing new vehicles, for example, boosting demand for car maintenance.
Vocational training is key to this industry, where 51 per cent of the workforce is vocational training qualified compared to an average across all industries of 34 per cent.
Figure 4.62: Forecasts to 2016-17 and 2011-12 current workforce age and qualifications
4% 4%
3%
4%
Employment Businesses EconomicOutput
VETenrolments
Source: Monash CoPS, ABS, SVTS

Industry Training Profiles
124 Victorian Training Market Quarterly Report Full Year 2012
Training Delivery Overview30 Figure 4.63: Industry training comparisons
There were 21,000 enrolments in the Other Services industry in 2012, an increase of 8 per cent on 2011. This is slightly lower than the enrolment growth for all industries.
Enrolment numbers in apprenticeships and traineeships remained flat in 2012, accounting for just over one third of Other Services training.
Enrolments in skill shortage occupations grew by 28 per cent, higher than overall industry enrolment growth of 8 per cent in Other Services.
This was driven largely by increased enrolments in training aligned to the shortage occupation of Motor Mechanic (up by 29 per cent to 5,300 enrolments), although enrolments aligned to the shortage occupations of Automotive Electrician also showed growth in 2012 (increasing 35 per cent to 300).
Training Breakdown Courses in this industry cover a broad range of
skills, including Hairdressing and Beauty, Automotive, Dry Cleaning, Celebrancy and Funeral Services.
A majority of industry enrolments, 62 per cent, are aligned to the Personal and Related sector, with the remaining 38 per cent linked to Repair and Maintenance. Repair and Maintenance courses have shown the most growth over the last 12 months, increasing by 15 per cent (compared with 4 per cent in Personal and Other Services).
30
Scope of data is nationally accredited and recognised training at AQF level 1 and above. Comparisons with all-industry
training exclude foundation level training but includes vocational courses which do not align to a single ANZSIC industry (e.g.
business and administration). Commentary refers to government subsidised activity unless otherwise stated.
2008 2009 2010 2011 2012
Other Services 12,600 13,200 17,600 19,400 21,000
Year-on-year %
change - 5% 34% 10% 8%
% change across all
industries - 3% 18% 32% 14%
Key training challenges for the industry
Address skill shortages across a range of automotive repair and maintenance and occupations (Automotive Electricians, Mechanics, Panelbeaters, Vehicle Painters).
Reflect as quickly as possible the changing technological demands of the Automotive Service and Repair sector in available training and course content to ensure ongoing relevance. The speed of technological advances in this sector poses a challenge for vocational training in keeping pace with changing skill needs.
Support student decision-making, via services such as the Victorian Skills Gateway, to promote alignment between choices in vocational training and subsequent job outcomes. In hairdressing, for example, industry has advised that there are limited job outcomes aligned with Certificate II level in hairdressing and while enrolments have declined over the last two years there were still over 800 enrolments in this qualification in 2012. Similarly in automotive, linkages have been made between high apprenticeship attrition rates and potentially unrealistic expectations about what a career in the sector would entail.
Facilitate opportunities for training in sectors of the Other Services industry which suffer from thin markets. Funeral Services has been highlighted as one sector in which there are limited options for training, while bicycle industry associations are working with Government to develop training options available to businesses in this segment.

Industry Training Profiles
Victorian Training Market Quarterly Report Full Year 2012 125
Figure 4.64: Government subsidised enrolments
74 per cent of enrolments in Other Services courses were in Certificate III-IV level qualifications, up from 65 per cent in 2011. The number of enrolments in Certificate I-II and Diploma+ level courses has declined over the last 12 months.
Young people aged 15-24 account for a majority of enrolments in the other services industry, 66 per cent of the total. This proportion has declined since 2011, when 72 per cent of enrolments were by people in this age cohort.
Women account for 60 per cent of enrolments in Other Services courses. There is a distinct gender division in this training market segment, with women tending to enrol in courses relating to Hair and Beauty (over 90 per cent of female enrolments in other services) and men choosing qualifications in Automotive skills (over 80 per cent of course enrolments in this industry).
For Other Services related training, the top three reasons students were completing a vocational training qualification were because it was a requirement of their job; to get a job or for personal interest or self-development. Around 56 per cent of students undertaking Other Services related courses held at least a Year 12 or equivalent qualification.
Training Provision TAFE Institutes provide a majority of training in the
Other Services industry, accounting for 53 per cent of enrolments. Private providers account for 43 per cent of delivery, while ACE provision in this industry makes up the remaining 4 per cent of enrolments.
93 providers delivered government subsidised training in this space in 2012, 5 more than in 2011.
A majority of training delivery by TAFE Institutes, 53 per cent, aligns to Automotive qualifications. This compares to 20 per cent of delivery at private RTOs and 6 per cent of ACE provider enrolments in this industry.
Private and ACE provider delivery, on the other hand, is focused on Hair and Beauty qualifications, with enrolments in these courses accounting for 78 per cent and 90 per cent respectively of total delivery.
44 per cent of enrolments in Other Services fall within subsidy band A, attracting the highest levels of government subsidies. An additional 26 per cent are in subsidy band B.
Eighty-one per cent of Other Services enrolments involved some classroom based delivery. Five per cent included employment based training and a further 22 per cent involved recognition of prior learning, recognition of current competency, or credit transfer.
Figure 4.65: Training provider share of enrolments
Top qualifications 2012
Certificate III in Hairdressing 5,500
Certificate III in Automotive
Mechanical Technology4,400
Diploma of Beauty Therapy 2,200
Certificate IV in Beauty Therapy 1,300
Certificate III in Beauty Services 1,300
These 5 courses accounted for 70% of all
government funded training in the industry
3,100
15,500
2,500
Cert I-II Cert III-IV Diploma & Above
Qualification level 2012(% change since 2011)
22%
39%
27%
26%
7%
15 to 19
20 to 24
25 to 44
45 to 64
Age group 2012(% total)
-15%-21%
53%
43%
4%
TAFE Private ACE
Provider share 2012(change in percentage points since 2011)
-4% 4%

Industry Training Profiles
126 Victorian Training Market Quarterly Report Full Year 2012
Professional, Scientific and Technical Services
Industry Overview Figure 4.66: Industry share, 2011-12
The Professional, Scientific and Technical Services industry is made up of Scientific Research Services; Architectural, Engineering and Technical Services; Legal and Accounting Services; Advertising Services; Market Research and Statistical Services; Management and Related Consulting Services; Veterinary Services; Other Professional, Scientific and Technical Services; and Computer System Design and Related Services.
In 2011-12, the Professional, Scientific and Technical Services industry accounted for over 8 per cent of Victoria‟s output and employment. It is Victoria‟s fourth largest industry in terms of output, and fifth largest employer.
Over the last five years, the Professional, Scientific and Technical Services industry has had the highest growth in output of all Victorian industries (7 per cent, compared to average of 2 per cent). It has also experienced the second largest increase in employees of all Victorian industries (39,000 persons).
Employment growth has been strongest in the Architectural, Engineering and Technical Services and Computer Systems Design and Statistical Services subsectors over the last decade.
Business establishments and employment in Professional Services has centralised in and around the Melbourne CBD in the last decade.
Employment in the Professional, Scientific and Technical Services industry is expected to grow by about 12,000 persons over the next five years, which will make it one of Victoria‟s strongest growing industries. This growth is expected to be driven largely by Legal and Accounting Services and Architectural, Engineering and Technical Services.
The industry has benefited from the Mining boom in terms of feeding in a range of services to meet the needs of growing mining companies.
However, the industry faces increasing competition from outsourcing. The growth of knowledge process outsourcing in countries such as India, combined with advances in communications technologies, mean that Professional Services in Australia are starting to face strong competition from the global market.
The Professional, Scientific and Technical Services industry is the most highly skilled of all industries, as seen in the high share of enrolments in higher education (52 per cent) and Diploma and above qualifications (12 per cent).
Figure 4.67: Forecasts to 2016-17 and 2011-12 current workforce age and qualifications
8%
12%
8%
2%
Employment Businesses EconomicOutput
VETenrolments
Source: Monash CoPS, ABS, SVTS

Industry Training Profiles
Victorian Training Market Quarterly Report Full Year 2012 127
Training Delivery Overview31 Figure 4.68: Industry training comparisons
Government subsidised enrolments in Professional, Scientific and Technical Services courses continue to decline. Enrolments reached 12,000 in 2012, a decrease of about 400 from 2011. This is considerably lower than the average for all industries.
However, the drop in government subsidised enrolments was largely offset by an increase in the number of TAFE fee for service enrolments (up by 300 in 2012). TAFE fee for service delivery now accounts for 10 per cent of industry enrolments.
The occupation with the largest increase in enrolments was Graphic Designer, up by approximately 80 (5 per cent) between 2011 and 2012. Enrolments related to Mechanical Engineering Technician and Graphic Designer account for 17 and 12 per cent of all Professional, Scientific and Technical Services training respectively.
Enrolments in Science Technicians courses saw the largest decline in 2012, down by about 100.
There are 400 apprentices and trainees in the Professional, Scientific and Technical Services industry. This represents a 14 per cent increase between 2011 and 2012.
Enrolments in areas of known skills shortages or specialisation did not perform as badly as overall enrolments. Growth in enrolments in specialised occupations was positive at 6 per cent. However, enrolments in occupations that are in shortage declined slightly in 2012.
31
Scope of data is nationally accredited and recognised training at AQF level 1 and above. Comparisons with all-industry
training exclude foundation level training but includes vocational courses which do not align to a single ANZSIC industry (e.g.
business and administration). Commentary refers to government subsidised activity unless otherwise stated.
2008 2009 2010 2011 2012
Professional, Scientific
and Technical Services 13,100 12,900 12,700 12,400 12,000
Year-on-year % change - -1% -1% -3% -3%
% change across all
industries - 3% 18% 32% 14%
Key training challenges for the industry
Meeting skills shortages in specialised occupations like Civil Engineering Draftsperson, Electronic Instrument Trades Worker (General) and Electronic Instrument Trades Worker (Special Class), and in non-specialised occupations like Building Associate, Building Inspector and Mechanical Engineering Technician.
Providing graduates to meet the high forecast employment growth, particularly as enrolments have been falling.
Providing graduates skilled enough to help the industry compete in an increasingly globalised market.

Industry Training Profiles
128 Victorian Training Market Quarterly Report Full Year 2012
Training Breakdown Males account for 56 per cent of enrolments, up from 54 per cent in 2010. This is largely due to male
enrolments in engineering related occupations. On the other hand, females comprise the majority of enrolments linked to the Veterinary Nursing and Legal Services occupations.
The Professional, Scientific and Technical Services industry has the highest proportion of enrolments from the 25-34 age group, and the second highest proportion of enrolments from the 35-44 age group, of all industries.
The Professional, Scientific and Technical Services industry is highly educated compared to most industries. It has the second lowest proportion of employees with no post-school qualifications and the second highest proportion of employees with higher education qualifications of all Victorian industries.
The decline in enrolments in 2012 was due to a decline in Certificate I–II and Diploma+. Certificate III–IV enrolments grew slightly.
For Professional, Scientific and Technical Services related training, the top three reasons students were completing a vocational training qualification were to get a job; for personal interest or self-development or to get extra skills for their current job. Around 87 per cent of students undertaking a Professional, Scientific and Technical Services related courses held at least a Year 12 or equivalent qualification.
Figure 4.69: Government subsidised enrolments
The Advanced Diploma of Legal Practice had the largest increase in enrolments in 2012 (up about 200),
followed by a new qualification, Diploma of Conveyancing (up about 150). The proportion of employed students in this industry increase slightly by 1 per cent in 2012, representing
66 per cent of enrolments. The proportion of enrolments by unemployed people was 23 per cent, with the remaining not in the labour force.
Top qualifications 2012
Advanced Diploma of Building
Design (Architectural)1,800
Diploma of Graphic Design 900
Certificate IV in Engineering 900
Advanced Diploma of Legal Practice 650
Advanced Diploma of Engineering Technology650
These 5 courses accounted for 40% of all
government funded training in the industry
200
3,600
8,300
Cert I-II Cert III-IV Diploma & Above
Qualification level 2012(% change since 2011)
1%
-43%-3%
27%
32%
32%
9%
15 to 19
20 to 24
25 to 44
45 to 64
Age group 2012(% total)

Industry Training Profiles
Victorian Training Market Quarterly Report Full Year 2012 129
Training Provision TAFEs continue to offer the vast majority of enrolments
for the Professional, Scientific and Technical Services industry (94 per cent), however this share has fallen since 2009 (99 per cent).
Enrolment shares were largely unchanged between 2011 and 2012.
There were 35 training providers delivering government subsidised vocational training in Professional, Scientific and Technical Services in 2012, 1 more than in 2011. Of these, 19 delivered less than 100 enrolments in 2012.
In the Professional, Scientific and Technical Services industry 26 per cent of enrolments were funded at subsidy levels A and B, equating to 3,100 enrolments. There has been a 1 percentage point growth in bands A and B between 2011 and 2012. In 2012, band D represented 26 per cent of all enrolments or 3,200 enrolments.
Seventy-six per cent of Professional, Scientific and Technical Services enrolments involved some classroom based delivery. Four per cent included employment based training and a further 13 per cent involved recognition of prior learning, recognition of current competency, or credit transfer.
Figure 4.70: Training provider share of enrolments
94%
6%0%
TAFE Private ACE
Provider share 2012(change in percentage points since 2011)

Industry Training Profiles
130 Victorian Training Market Quarterly Report Full Year 2012
Public Administration and Safety
Industry Overview Figure 4.71: Industry share, 2011-12
At present, the industry accounts for 5 per cent of Victoria's industry output in 2011-12. Forecasts to 2017 suggest output in this sector will remain fairly stable.
There are just over 1,850 Public Administration and Safety enterprises in Victoria. Approximately 59 per cent of businesses are located in metropolitan Melbourne and 41 per cent in regional Victoria.
There are 140,700 people (5 per cent of Victoria's workforce), currently employed in the Public Administration and Safety industry.
While the Public Order, Safety and Regulatory Services sub sector are forecast to experience a 6 per cent rise in jobs by 2017 (introducing nearly 2,500 new jobs), the Public Administration sub-sector is expected to experience a 2 per cent fall in employment (removing about 1,700 jobs).
With 31 per cent of the workforce with no post-school qualifications, and an ageing workforce, these structural changes to the sector will not come without challenges.
Figure 4.72: Forecasts to 2016-17 and 2011-12 current workforce age and qualifications
5%
0%
5%
2%
Employment Businesses EconomicOutput
VETenrolments
Source: Monash CoPS, ABS, SVTS
Key training challenges for the industry
There are no identified skills shortage occupations in this industry, but the occupations Emergency Service Worker, Fire Fighter and Police Officer are all included on the Skills Australia list of specialised occupations.
The frequency of natural disasters afflicting Victoria has meant increased demand for a capable and flexible workforce.
Technological advancements and an ageing population places additional pressure on the sector to up-skill and train its workers.

Industry Training Profiles
Victorian Training Market Quarterly Report Full Year 2012 131
Training Delivery Overview32 Figure 4.73: Industry training comparisons
Public Administration and Safety related courses accounted for a total of 9,000 enrolments in 2012, of which 93 per cent were government subsidised (8,400 enrolments) and 7 per cent were TAFE fee for service.
Between 2011 and 2012, government subsidised enrolments in courses related to this industry rose by 6 per cent, whereas, enrolments in TAFE domestic fee for service reported a 26 per cent fall.
Two per cent of enrolments in this industry were for apprenticeships / traineeships.
Five per cent of enrolments were in occupations categorised as specialised.
Training Breakdown Training interest in this industry has been
primarily male dominated. Seventy-six per cent of all Public Administration related enrolments are from males
The 6,400 enrolments by men in 2012 are up by 2 per cent since 2011. However, increasingly more females have been engaging in training. In 2012, enrolments by females rose by 25 per cent to over 2,000.
Enrolments in related courses are spread evenly across Certificate I–II (41 per cent) and Certificate III–IV levels (48 per cent), with only 12 per cent of enrolments in Diploma+ courses.
Figure 4.74: Government subsidised enrolments
Over 2011–2012, there has been a 15 per cent rise in the uptake of Certificate I–II level courses and a 4 per cent rise in enrolments at Diploma+ levels, while enrolments in Certificate III–IV levels have remained fairly static.
Some of the most popular courses in 2012 included Certificate II and III in Security Operations and the Advanced Diploma of Justice. However, when compared to 2011, enrolments in some of these courses have fallen (Certificate II in Security Operations -4 per cent; Certificate III in Security Operations -7 per cent and Advanced Diploma of Justice by -5 per cent).
32 Scope of data is nationally accredited and recognised training at AQF level 1 and above. Comparisons with all-industry
training exclude foundation level training but includes vocational courses which do not align to a single ANZSIC industry (e.g.
business and administration). Commentary refers to government subsidised activity unless otherwise stated.
Top qualifications 2012
Certificate II in Security Operations 2,600
Certificate III in Security Operations 2,600
Advanced Diploma of Justice 750
Certificate II in Public Safety
(Aquatic Rescue)700
Certificate IV in Justice 300
These 5 courses accounted for 83% of all
government funded training in the industry
3,400
4,000
1,000
Cert I-II Cert III-IV Diploma & Above
Qualification level 2012(% change since 2011)
15% 4%
24%
22%
36%
13%
15 to 19
20 to 24
25 to 44
45 to 64
Age group 2012(% total)

Industry Training Profiles
132 Victorian Training Market Quarterly Report Full Year 2012
A new course, Certificate II in Public Safety (Aquatic Rescue) recorded nearly 700 enrolments while Certificate IV in Justice saw a significant rise in enrolments (by 133 per cent).
The students enrolled in Public Administration and Safety related courses tend to have a younger profile. In 2012, 36 per cent of enrolments in 2012 were from the 25–44 age group, followed by the15–19 age group and the 20–24 age group who accounted for 24 per cent and 22 per cent of enrolments respectively.
The 15–19 age group reported the highest rise (up by 20 per cent), whereas enrolments in the 45–64 age bracket fell by 19 per cent.
For Public Administration and Safety related training, the main reasons students were completing a vocational training qualification were because it was a to get a job or for personal interest or self-development. Around 59 per cent of students undertaking a Public Administration and Safety related courses held at least a Year 12 or equivalent qualification.
Training Provision There were 23 training providers delivering government
subsidised vocational training related to Public Administration and Safety industry in 2012.
In 2012, training delivery has primarily been with private Registered Training Organisations (RTOs) and TAFE providers who accounted for 52 per cent and 48 per cent respectively.
Both the numbers of TAFE providers and private RTOs have fallen over 2011–2012.
TAFE provider share of government subsidised training has fallen significantly from 99 per cent of enrolments in 2008 to 22 per cent in 2012.
Private RTOs share of government subsidised training has increased from nil in 2008 to cover 78 per cent of enrolments in 2012.
Ninety-two per cent of Public Administration and Safety enrolments involved some classroom based delivery. Five per cent included employment based training and a further 8 per cent involved recognition of prior learning, recognition of current competency, or credit transfer.
In the Public Administration and Safety industry 13 per cent of enrolments were funded at subsidy levels A and B, equating to 1,100 enrolments. There has been a 3 percentage point growth in bands A and B between 2011 and 2012. In 2012, band C represented 45 per cent of all enrolments or 3,750 enrolments.
Figure 4.75: Training provider share of enrolments

Industry Training Profiles
Victorian Training Market Quarterly Report Full Year 2012 133
Rental, Hiring and Real Estate Services
Industry Overview Figure 4.76: Industry share, 2011-12
The Rental, Hiring and Real Estate Services industry is made up of Motor Vehicle and Transport Equipment Rental and Hiring; Farm Animal and Bloodstock Leasing; Other Goods and Equipment Rental and Hiring; Non-Financial Intangible Assets (except Copyrights) Leasing; Property Operators; and Real Estate Services.
In 2011-12, the industry accounted for over 8 per cent of Victoria‟s output but only about 2 per cent of employment. It is Victoria‟s third largest industry in terms of output, but its third smallest employer.
Over the last five years, the industry has had the second highest growth in output of all Victorian industries (9 per cent average annual growth, compared to 2 per cent for Victoria). It experienced the sixth lowest increase in employees of all Victorian industries (8,500 persons). Employment growth has been strongest in the Property Operators sub-sector over the last five years.
There are currently over 56,000 Rental, Hiring and Real Estate businesses across Victoria. Three subsectors – Real Estate Services, Residential Property Operators and Non-Residential Property Operators – comprise 75 per cent of all the Rental, Hiring and Real Estate Services business establishments. They account for almost all of the growth in employment and business establishments over the 10 years to 2010-11, reflecting the importance to the Victorian economy of the property industry and increasing property values.
Forecasts to 2017 suggest that the industry is set to experience a 2 per cent fall in employment over 2012-2017. This is not expected to affect output, which is forecast to rise 12 per cent over the same period and contribute over $2.9 billion to the State economy.
The Rental industry is largely non-trade exposed, which has shielded it somewhat from global competition. However, residential property markets remain subdued in all states and territories. The impact of weaker demand from China for Australian resources has resulted in reduced activity, and projects being shelved in the resources sector, leading to lower demand for Rental and Hiring Services from the resources sector.
With 37 per cent of the workforce with no post-school qualifications, and the beginnings of an older workforce profile, the sector could face some training challenges.
Figure 4.77: Forecasts to 2016-17 and 2011-12 current workforce age and qualifications
Key training challenges for the industry
There are no identified skills shortage occupations in this industry.

Industry Training Profiles
134 Victorian Training Market Quarterly Report Full Year 2012
Training Delivery Overview33 Figure 4.78: Industry training comparisons
There were 2,300 government subsidised enrolments in the Rental, Hiring and Real Estate Services industry in 2012.
Government subsidised enrolments have increased by 48 per cent over the 2011 – 2012 period.
TAFE fee for service enrolments made up 24 per cent of all enrolments within the industry and have fallen by 54 per cent over 2011–2012.
13 per cent of enrolments in this industry were for apprenticeships / traineeships.
Training Breakdown Females account for 59 per cent (1,400) of
enrolments. Enrolments have increased by 51 per cent over 2011 – 2012.
There are around 950 males enrolled in related courses, up by 42 per cent since 2011.
Almost all the enrolments (99 per cent) in courses related to the Rental, Hiring and Real Estate industry are at Certificate III–IV level. Enrolments in Certificate III–IV have risen by 49 per cent over 2011–2012.
A small proportion (1 per cent) of courses is available at Diploma+ levels. There are no course enrolments at Certificate I–II level.
Figure 4.79: Government subsidised enrolments
There has been a significant increase in the uptake of The Certificate IV in Property Services (Real Estate), up by 56 per cent.
In contrast, enrolments have fallen in Certificate III in Property Services (Agency), Certificate IV in Property Services (Operations) and Diploma of Property Services (Asset and Facility Management) since 2011.
Forty-four per cent of enrolments in 2012 were from the 25–44 age group, followed by the 20–24 age group who accounted for 25 per cent of enrolments.
The 45–64 age group reported the most rise in enrolments (up by 58 per cent) over 2011–2012, followed by the 15–19 age group (56 per cent rise), the 20–24 age group (45 per cent rise) and the 25–44 age group (44 per cent rise).
33 Scope of data is nationally accredited and recognised training at AQF level 1 and above. Comparisons with all-industry
training exclude foundation level training but includes vocational courses which do not align to a single ANZSIC industry (e.g.
business and administration). Commentary refers to government subsidised activity unless otherwise stated.
2008 2009 2010 2011 2012
Rental, Hiring and
Real Estate Services 600 650 1,000 1,600 2,300
Year-on-year %
change - 7% 51% 56% 48%
% change across all
industries - 3% 18% 32% 14%
Top qualifications 2012
Certificate IV in Property Services
(Real Estate)2,200
Certificate III in Property Services
(Agency)40
Certificate IV in Property Services
(Operations)20
Diploma of Property Services (Asset
and Facility Management)20
Diploma of Property Services
(Agency Management)10
These 5 courses accounted for 100% of all
government funded training in the industry
-
2,300
30
Cert I-II Cert III-IV Diploma & Above
Qualification level 2012(% change since 2011)
49% 3%
12%
25%
44%
19%
15 to 19
20 to 24
25 to 44
45 to 64
Age group 2012(% total)

Industry Training Profiles
Victorian Training Market Quarterly Report Full Year 2012 135
For Rental, Hiring and Real Estate Services related training, the top three reasons students were completing a vocational training qualification were to get a job; to get extra skills for their current job or to try for a different career. Around 75 per cent of students undertaking a Rental, Hiring and Real Estate Services related courses held at least a Year 12 or equivalent qualification.
Training Provision There were a total of 14 training providers delivering
government subsidised vocational training related to this industry in 2012.
TAFE providers have historically been the primary supplier of training in this industry and with 79 per cent of suppliers as TAFEs, it continues to be so in 2012. However, the number of TAFEs have fallen by 15 per cent over 2011 – 2012.
In contrast, the number of private RTOs offering training in this industry has risen by 50 per cent.
TAFE provider share of government subsidised training has fallen from 85 per cent of enrolments in 2008 to 52 per cent in 2012, whereas private RTOs share of government subsidised training has increased from 15 per cent of enrolments in 2008 to 48 per cent in 2012.
Fifty-six per cent of Rental, Hiring and Real Estate Services enrolments involved some classroom based delivery. A further 29 per cent involved recognition of prior learning, recognition of current competency, or credit transfer.
Within the Rental, Hiring and Real Estate Services industry the majority of enrolments were funded in Band C (99 per cent). This was consistent across 2011 and 2012.
Figure 4.80: Training provider share of enrolments

Industry Training Profiles
136 Victorian Training Market Quarterly Report Full Year 2012
Retail Trade
Industry Overview Figure 4.81: Industry share, 2011-12
Retail Trade is the second largest industry employer in Victoria. The industry is of particular importance in Victoria‟s regions, a significant employer in both regional hubs and more rural locations.
There are over 37,000 Retail Trade businesses in Victoria, which represents 7 per cent of all businesses in Victoria.
Over the last decade there has been a marked growth in establishments in the Melbourne CBD and suburbs with major shopping centres.
In contrast, the number of retailers in Melbourne‟s established suburbs throughout the east, south-east and north-east and west have declined.
The industry is forecast to add 18,500 jobs in the period to 2016-17, making it the third largest in terms of anticipated job creation.
Store-based Retailing is the largest sector in this industry, followed by Food Retailing. These two sectors are also expected to account for the majority of Retail employment growth.
Retail Trade employs an above average proportion of women and young people. The high levels of part-time and casual work on offer mean that employees are able to juggle study or family commitments alongside their job. This flexibility does not suit everyone, however, with the Retail industry experiencing high levels of employee turnover.
The structure of the Retail environment is changing, with the arrival of new international players and the growth of online retailing leading to increased competition in the industry. Online shopping expenditure reached an estimated $16 billion in 2012, growth of 18 per cent from the prior year and this strong growth is expected to continue.
Recent moves towards international price harmonisation are adding to the pressures facing the industry. Retail businesses are focusing on improving their levels of productivity, competitiveness and service levels as a means of response.
Figure 4.82: Forecasts to 2016-17 and 2011-12 current workforce age and qualifications
11%
7%
5%
7%
Employment Businesses EconomicOutput
VETenrolments
Source: Monash CoPS, ABS, SVTS

Industry Training Profiles
Victorian Training Market Quarterly Report Full Year 2012 137
Training Delivery Overview34 Figure 4.83: Industry training comparisons
Enrolment growth of 8 per cent in Retail Trade is slightly lower than the average across all Victorian industries of 14 per cent.
The rate of fee for service growth was stronger, up by 43 per cent (or 2,800 enrolments). The proportion of TAFE fee for service delivery in this industry remains low, however, accounting for 7 per cent of Retail Trade enrolments (up from 6 per cent in 2011).
Enrolments in skill shortage occupations accounted for 5 per cent of Retail Trade enrolments in 2012. Enrolments aligned to the shortage occupations of Motor Mechanic, Baker and Retail Manager all increased when compared to 2011; in the case of Retail Manager, however, this is off a very low base.
Training Breakdown The age profile of those enrolling in courses
aligned to Retail Trade is younger than the average across industries, with over 70 per cent of enrolments by those aged 15-24 years. This enrolment profile is in line with the age demographic of Retail industry employees.
The fastest growing age cohort in terms of Retail Trade enrolments, however, is the 45-64 years cohort. Enrolments among this age group have increased by 32 per cent over the last 12 months, to 3,100.
A majority of Retail course enrolments are by women, comprising 63 per cent of enrolments in 2012. Again, this reflects this industry‟s employment profile.
34 Scope of data is nationally accredited and recognised training at AQF level 1 and above. Comparisons with all-industry
training exclude foundation level training but includes vocational courses which do not align to a single ANZSIC industry (e.g.
business and administration). Commentary refers to government subsidised activity unless otherwise stated.
2008 2009 2010 2011 2012
Retail Trade 19,900 18,600 23,400 33,200 36,000
Year-on-year %
change - -6% 26% 42% 8%
% change across all
industries - 3% 18% 32% 14%
Key training challenges for the industry
Skill shortages exist in the occupation Retail Managers. Emerging skill needs have been flagged for Retail Supervisors.
Skill shortage in the Automotive (Motor Mechanics) and Food Processing (Bakers) industries are also relevant to Retail Trade.
Skills deepening in customer service skills is required to enable Retail businesses to offer consumers a richer and more sophisticated sales experience in an increasingly competitive Retail environment.
Higher level qualifications will also play a role in developing the ability of Retail businesses to compete with new international entrants and the growth of online Retail, by developing the industry‟s management skills and capacity to innovate.
Technological developments relevant to the Retail industry include online shopping, retail self-service and m-commerce; Retail businesses will need to develop the computer literacy skills needed to take advantage of these developments.

Industry Training Profiles
138 Victorian Training Market Quarterly Report Full Year 2012
Figure 4.84: Government subsidised enrolments
Men account for a majority of enrolments aligned to occupations in Motor Vehicle Retailing sector, as well as enrolments aligned to Butchers and Bakers. Women, on the other hand, comprise the majority of enrolments aligned to the occupations Pharmacy Sales Assistants, Florists and Visual Merchandisers.
Enrolments in courses aligned to the occupation Sales Assistant demonstrated most growth in 2012, up by 1,500 enrolments to 25,600. This occupation is the largest in terms of training delivery, attracting just over 70 per cent of enrolments aligned to Retail Trade.
Occupations seeing a slight decline in enrolments included Florists, Mechanic‟s Assistants, Butchers and Checkout Operators.
Enrolments at Certificate III-IV level have seen growth above the average for this industry, increasing by 26 per cent compared with overall Retail Trade enrolment growth of 8 per cent in 2012. This increase has been more than offset by declining enrolments in both Certificate I-II and Diploma+ level enrolments.
Certificate III-IV level enrolments now make up 68 per cent of industry enrolments, an increase of 10 percentage points from 2011.
For Retail Trade related training, the top three reasons students were completing a vocational training qualification were because it was a requirement of their job; to get a job or to get extra skills for their current job. Around 50 per cent of students undertaking Retail Trade related courses held at least a Year 12 or equivalent qualification.
Training Provision Training provider share of enrolments has remained
relatively constant since 2011. Private providers continue to deliver the majority of training in this sector, accounting for 75 per cent of enrolments.
188 providers delivered government subsidised vocational training related to Retail Trade in 2012, 10 more than in 2011. A majority of these providers are private RTOs – 135 compared with 35 ACE providers and 18 TAFE Institutes.
Twenty-three per cent of Retail Trade enrolments involved some classroom based delivery. Sixty-one per cent included employment based training and a further 11 per cent involved recognition of prior learning, recognition of current competency, or credit transfer.
In the Retail Trade industry 10 per cent of enrolments were funded at subsidy levels A and B, equating to 3,100 enrolments. There has been a minor increase (0.4 per cent) in bands A and B between 2011 and 2012. In 2012, bands D and E represented 89 per cent of all enrolments or 32,000 enrolments. The percentage share of bands D and E declined by 1 percentage point over this same period.
Figure 4.85: Training provider share of enrolments
Top qualifications 2012
Certificate III in Retail 15,700
Certificate II in Retail 9,500
Certificate IV in Retail Management 2,700
Certificate III in Community
Pharmacy2,300
Certificate III in Automotive
Mechanical Technology1,000
These 5 courses accounted for 87% of all
government funded training in the industry
10,400
24,400
1,100
Cert I-II Cert III-IV Diploma & Above
Qualification level 2012(% change since 2011)
26%
53%
19%
19%
9%
15 to 19
20 to 24
25 to 44
45 to 64
Age group 2012(% total)
-18%
-12%
21%
75%
4%
TAFE Private ACE
Provider share 2012(change in percentage points since 2011)
-2%
3%-1%

Industry Training Profiles
Victorian Training Market Quarterly Report Full Year 2012 139
Transport, Postal and Warehousing
Industry Overview Figure 4.86: Industry share, 2011-12
The Transport, Postal and Warehousing industry accounts for approximately 5 per cent of Victorian employment, a proportion which is forecast to remain relatively stable over the next few years.
The industry contributed $15.2 billion to State output in 2011-12, with forecast growth of 14 per cent through to 2016-17 in line with growth in the economy as a whole.
When factoring in associated Wholesaling and Supply Chain activities, the Transport industry‟s economic contribution is greater than these figures suggest – estimated to be at least 12 per cent of total State output.
The Transport, Postal and Warehousing industry has approximately 34,000 operating businesses in Victoria, and is concentrated in regional centres and semi-urban areas surrounding metropolitan Melbourne.
The industry has forecast jobs growth of 1,900 in the five years to 2016-17. Employment growth is driven by the Road Transport sector (an additional 5,500 jobs forecast), masking anticipated job losses in most other sectors.
One of the most heavily regulated industries, the introduction of three national regulatory bodies in 2013 (covering the Road, Rail and Maritime sectors) will move towards harmonisation across states and territories. It is expected that this will reduce the reporting burden for national operators.
With the freight task in Victoria expected to double by 2035, increasing efficiency and productivity will be critical to the success of Transport businesses looking forwards, particularly in sectors which are experiencing shortages of skilled labour.
Increased industry productivity will therefore need to be underpinned in part by improving the skills of the Transport, Postal and Warehousing workforce.
Figure 4.87: Forecasts to 2016-17 and 2011-12 current workforce age and qualifications
5%
6%
5%
8%
Employment Businesses EconomicOutput
VETenrolments
Source: Monash CoPS, ABS, SVTS

Industry Training Profiles
140 Victorian Training Market Quarterly Report Full Year 2012
Training Delivery Overview35 Figure 4.88: Industry training comparisons
Enrolments aligned to the Transport, Postal and Warehousing industry have seen strong growth over the last few years, with enrolments reaching 38,000 in 2012.
Twenty-nine per cent of industry enrolments were in areas of identified skill shortage, a proportion consistent with 2011.
Enrolments in the shortage occupations of Truck Driver and Railway Track Worker increased in 2012, with Truck Driver enrolments in particular showing strong growth (up by 42 per cent, or 3,100 enrolments).
The shortage occupation of Train Driver, on the other hand, saw a decline of enrolments of 46 per cent, or 300 enrolments.
Apprentices and trainees account for 17 per cent of Transport industry enrolments, with the majority of enrolments (approximately two-thirds) traineeships linked to the occupations Warehouse Administrator and Store-person.
Training Breakdown A majority of enrolments in 2012 were in the
Warehousing and Storage Services sector, which accounted for 57 per cent of training delivery in the Transport, Postal and Warehousing industry. Road Transport is also a key training market segment in this industry, accounting for 30 per cent of total enrolments.
The age profile of those enrolling in Transport, Postal and Warehousing courses is older than average, with 70 per cent of industry enrolments by those aged 25 year or older. This is in line with the above
35
Scope of data is nationally accredited and recognised training at AQF level 1 and above. Comparisons with all-industry
training exclude foundation level training but includes vocational courses which do not align to a single ANZSIC industry (e.g.
business and administration). Commentary refers to government subsidised activity unless otherwise stated.
2008 2009 2010 2011 2012
Transport, Postal and
Warehousing 11,300 15,000 17,100 28,000 38,000
Year-on-year %
change - 33% 14% 64% 36%
% change across all
industries - 3% 18% 32% 14%
Key training challenges for the industry
Skill shortages have been identified in the Rail Transport (including Signal Maintenance Technicians, Railway Signal Operators, Train Controllers, Train Drivers, Railway Track Workers) and Road Transport (Truck Drivers) sectors. Emerging shortages have also been flagged in the Ports sector (Forklift Drivers, Crane, Hoist or Lift Operators) and in the occupations Transport Company Managers, Warehouse Administrators and Deck Hands.
The Transport, Postal and Warehousing industry is facing a need for increasingly sophisticated skill levels, particularly around higher level logistics and management skills. This represents a challenge in an industry which traditionally has a lower than average educational profile and where much of the training is driven by regulation and compliance.
Young people wishing to embark on a career in the industry continue to face barriers in certain sectors – particularly Road Transport, driven in part by issues relating to vehicle insurance for younger drivers – leading to a disconnect between training and available employment.
Facilitating training delivery in small transport businesses, particularly in regional areas where small numbers of people require training, continues to be a challenge in this industry.
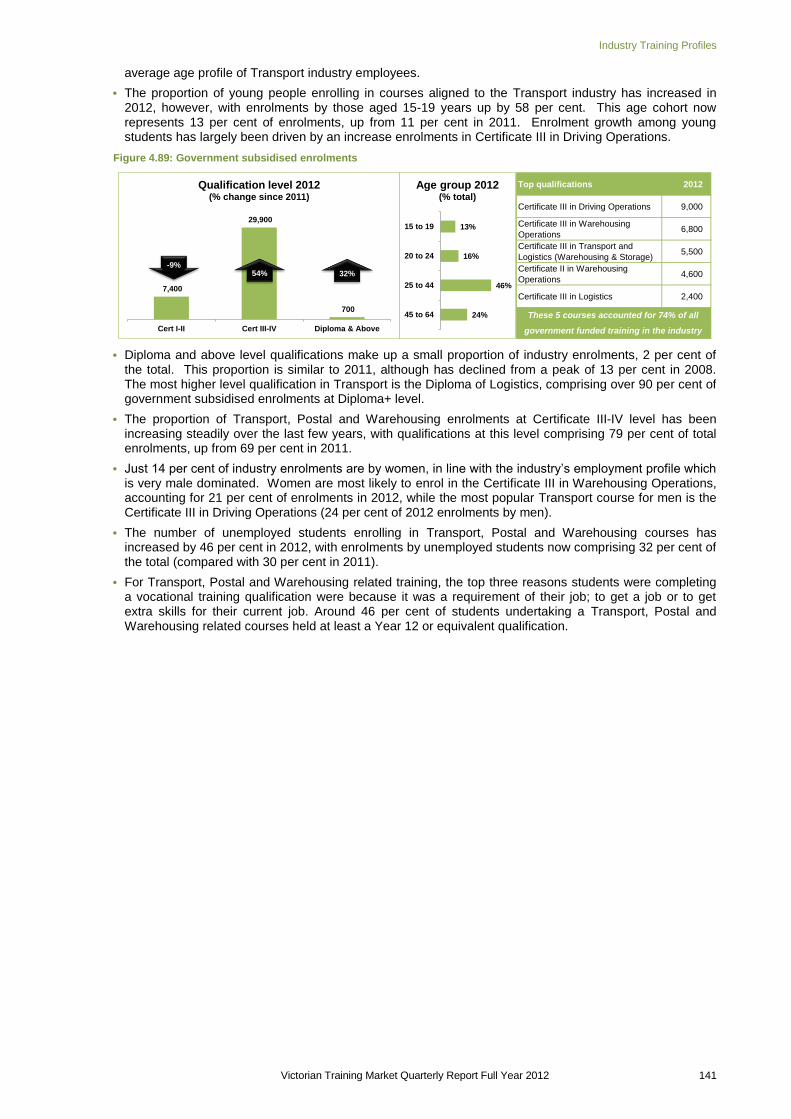
Industry Training Profiles
Victorian Training Market Quarterly Report Full Year 2012 141
average age profile of Transport industry employees.
The proportion of young people enrolling in courses aligned to the Transport industry has increased in 2012, however, with enrolments by those aged 15-19 years up by 58 per cent. This age cohort now represents 13 per cent of enrolments, up from 11 per cent in 2011. Enrolment growth among young students has largely been driven by an increase enrolments in Certificate III in Driving Operations.
Figure 4.89: Government subsidised enrolments
Diploma and above level qualifications make up a small proportion of industry enrolments, 2 per cent of the total. This proportion is similar to 2011, although has declined from a peak of 13 per cent in 2008. The most higher level qualification in Transport is the Diploma of Logistics, comprising over 90 per cent of government subsidised enrolments at Diploma+ level.
The proportion of Transport, Postal and Warehousing enrolments at Certificate III-IV level has been increasing steadily over the last few years, with qualifications at this level comprising 79 per cent of total enrolments, up from 69 per cent in 2011.
Just 14 per cent of industry enrolments are by women, in line with the industry‟s employment profile which is very male dominated. Women are most likely to enrol in the Certificate III in Warehousing Operations, accounting for 21 per cent of enrolments in 2012, while the most popular Transport course for men is the Certificate III in Driving Operations (24 per cent of 2012 enrolments by men).
The number of unemployed students enrolling in Transport, Postal and Warehousing courses has increased by 46 per cent in 2012, with enrolments by unemployed students now comprising 32 per cent of the total (compared with 30 per cent in 2011).
For Transport, Postal and Warehousing related training, the top three reasons students were completing a vocational training qualification were because it was a requirement of their job; to get a job or to get extra skills for their current job. Around 46 per cent of students undertaking a Transport, Postal and Warehousing related courses held at least a Year 12 or equivalent qualification.
Top qualifications 2012
Certificate III in Driving Operations 9,000
Certificate III in Warehousing
Operations6,800
Certificate III in Transport and
Logistics (Warehousing & Storage)5,500
Certificate II in Warehousing
Operations4,600
Certificate III in Logistics 2,400
These 5 courses accounted for 74% of all
government funded training in the industry
7,400
29,900
700
Cert I-II Cert III-IV Diploma & Above
Qualification level 2012(% change since 2011)
54% 32%
13%
16%
46%
24%
15 to 19
20 to 24
25 to 44
45 to 64
Age group 2012(% total)
-9%

Industry Training Profiles
142 Victorian Training Market Quarterly Report Full Year 2012
Training Provision Private training providers deliver a majority of
training in the Transport, Postal and Warehousing industry. Their share of enrolments has increased to 72 per cent, up from 59 per cent in 2011.
ACE provision represents a small proportion of industry enrolments, accounting for just 1 per cent of delivery (or 400 enrolments).
There were 108 training providers delivering government subsidised vocational training related to Transport, Postal and Warehousing in 2012, consistent with 2011 when 109 providers delivered training in this space.
Although large numbers of providers deliver training in sectors such as Road Transport and Warehousing and Storage services, the Transport industry suffers from thin training markets in sectors such as Rail, where limited number of providers are able to deliver training in specialist and niche skills – exacerbating existing skill shortages in the industry.
TAFE fee for service delivery currently accounts for 9 per cent of total enrolments in qualifications associated with the Transport, Postal and Warehousing industry.
Sixty-one per cent of Transport, Postal and Warehousing enrolments involved some classroom based delivery. Twenty-seven per cent included employment based training and a further 18 per cent involved recognition of prior learning, recognition of current competency, or credit transfer.
Figure 4.90: Training provider share of enrolments
In the Transport, Postal and Warehousing industry 79 per cent of enrolments were funded at subsidy levels A and B, equating to 30,100 enrolments. There has been a 9.5 percentage point growth in bands A and B between 2011 and 2012. In 2012, band D represented 2 per cent of all enrolments or 700 enrolments.
27%
72%
1%
TAFE Private ACE
Provider share 2012(change in percentage points since 2011)
-13% 14%

Industry Training Profiles
Victorian Training Market Quarterly Report Full Year 2012 143
Wholesale Trade
Industry Overview Figure 4.91: Industry share, 2011-12
Wholesale Trade contributed $13.5 billion to Victoria‟s output in 2011-12, representing 5 per cent of the total – a proportion which is forecast to remain consistent over time.
Currently employing approximately 125,000 people, the industry is expected to grow by 15,000 jobs in Victoria over the five years to 2016-17.
Most of this growth is anticipated in the Machinery and Automotive Wholesaling and Other Goods Wholesaling sectors, the two largest employing segments of the industry.
The industry has close linkages to Retail Trade and Transport Postal and Warehousing. It has been experiencing competition from the Retail industry as some retailers have opted to deal directly with manufacturers, bypassing wholesalers as a way of cutting costs.
The industry consists predominantly of small and medium sized businesses and is largely metropolitan-based in metropolitan Melbourne – 83 per cent of Wholesale Trade businesses are based in Melbourne compared to an average of 74 per cent across all industries.
The Wholesale Trade workforce has a below average proportion of young employees, with 12 per cent of worker aged 15-24 compared with 16 per cent across all industries. The industry has an above average proportion of male workers, with employment largely on a full-time basis.
There are a small number of vocational training courses specific to Wholesale Trade. Courses in the Transport and Retail industries are of relevance, however, as are many of the general Business Services qualifications.
Figure 4.92: Forecasts to 2016-17 and 2011-12 current workforce age and qualifications
4%4%
5%
0%
Employment Businesses EconomicOutput
VETenrolments
Source: Monash CoPS, ABS, SVTS
Key training challenges for the industry
There are no identified skill shortage occupations for this industry.
Vertical integration in the Retail Trade industry mean that wholesalers are increasingly competing with Retail businesses who have established direct supplier relationships. Wholesale businesses will need to adapt to this changing supply chain.
Innovation in ICT systems, specifically e-commerce, has been suggested as one means by which wholesalers can maintain their presence, with businesses potentially needing to develop new skills in this area.

Industry Training Profiles
144 Victorian Training Market Quarterly Report Full Year 2012
Training Delivery Overview36 Figure 4.93: Industry training comparisons
Wholesale Trade is a small industry in terms of vocational training, with just 900 government subsidised enrolments in 2012.
This represents an increase of 6 per cent when compared to 2011, below the growth rate for all industry-specific training in Victoria.
Over two-thirds of Wholesale Trade enrolments were by apprentices and trainees in 2012, with enrolment growth of 10 per cent higher than the average of 6 per cent for the industry as a whole.
Training Breakdown A majority of enrolments in this industry are at
Certificate III-IV level, 87 per cent of the total.
Certificate I-II level enrolments have seen strong growth in 2012, up by 87 per cent, although this is off a low base. Enrolments at this level now account for 10 per cent of training delivery, up from 6 per cent in 2011. Enrolments at Diploma level and above represent a small proportion of training in this industry, just 4 per cent of total enrolments.
The age profile of students enrolling in Wholesale Trade training is older than average, with just 14 per cent of enrolments by those aged 15-19 years and a similar proportion aged 20-24. This is in line with the industry‟s older than average employment profile.
Enrolments by young people aged 15-19 showed the highest growth over the last 12 months, however, with enrolments up by 78 per cent. This age cohort now accounts for 14 per cent of Wholesale Trade training compared with just 8 per cent in 2011.
Figure 4.94: Government subsidised enrolments
Men account for a majority of enrolments in this industry, 58 per cent of the total. This proportion has decreased since 2011, when 64 per cent of enrolments were by men.
90 per cent of Wholesale Trade training was delivered in the metropolitan Melbourne regions, in line with the location of the majority of Wholesale Trade business.
36
Scope of data is nationally accredited and recognised training at AQF level 1 and above. Comparisons with all-industry
training exclude foundation level training but includes vocational courses which do not align to a single ANZSIC industry (e.g.
business and administration). Commentary refers to government subsidised activity unless otherwise stated.
2008 2009 2010 2011 2012
Wholesale Trade 550 350 550 850 900
Year-on-year %
change - -37% 57% 57% 6%
% change across all
industries - 3% 18% 32% 14%
Top qualifications 2012
Certificate III in Wholesale 600
Certificate III in Horticulture
(Wholesale Nursery)90
Certificate II in Wholesale 90
Certificate IV in Fashion and
Textiles Merchandising40
Diploma of Fashion and Textiles
Merchandising20
These 5 courses accounted for 97% of all
government funded training in the industry
90
800
30
Cert I-II Cert III-IV Diploma & Above
Qualification level 2012(% change since 2011)
87% 3%
14%
14%
44%
27%
15 to 19
20 to 24
25 to 44
45 to 64
Age group 2012(% total)
-33%

Industry Training Profiles
Victorian Training Market Quarterly Report Full Year 2012 145
For Wholesale Trade related training, the top three reasons students were completing a vocational training qualification were because it was a requirement of their job; for personal interest or self-development or to get extra skills for their current job. Around 60 per cent of students undertaking Wholesale Trade related courses held at least a Year 12 or equivalent qualification.
Training Provision Private training providers deliver the majority of
Wholesale Trade training, accounting for 83 per cent of enrolments. This share has increased from 70 per cent in 2011. TAFE provision has fallen accordingly. ACE providers deliver very little training in Wholesale Trade, accounting for just 1 per cent of total enrolments in 2012.
Forty providers delivered government subsidised training into the Wholesale Trade industry in 2012, 4 fewer than in 2011.
TAFE fee for service provision represents a small proportion of reported training in this industry, just 2 per cent of enrolments in 2012.
Forty-two per cent of Wholesale Trade enrolments involved some classroom based delivery. Forty-nine per cent included employment based training and a further 10 per cent involved recognition of prior learning, recognition of current competency, or credit transfer.
In the Wholesale Trade industry 83 per cent of enrolments were funded at subsidy levels A and B, equating to 750 enrolments. There has been a 6.5 per cent decline in bands A and B between 2011 and 2012. In 2012, band D represented 4 per cent of all enrolments or 30 enrolments.
Figure 4.95: Training provider share of enrolments
16%
83%
1%
TAFE Private ACE
Provider share 2012(change in percentage points since 2011)
-13% 13%

146 Victorian Training Market Quarterly Report Full Year 2012
Regional Training Profiles
Introduction This section of the report examines training delivery in each of Victoria‟s regions in the context of the local population, economy and workforce.
Many of Victoria‟s regions are undergoing structural change as the local economies adjust to international competition, a strong Australian dollar and ongoing uncertainty in the global economic outlook. As a result, training delivery and uptake differs across regions as the training system responds to the skills and training needs of local employers and industry.
Enrolments in the majority of Victoria‟s regions are growing, particularly in higher level qualifications, as people make use of the opportunities provided by the Victorian Training Guarantee (VTG) to upgrade their skills in response to changing labour market needs.
All regions have experienced an increase in the number of providers delivering government subsidised training into the region since the introduction of the VTG. This increase has been driven by additional private RTOs entering the government subsidised system, improving access for students as well as providing more choice in where they study.
The tables below provide an overview of regional training activity measured in enrolments, student contact hours and provider numbers. This is followed by a training market profile for eight regional and rural areas and for five metropolitan Melbourne regions. These profiles combine economic analysis with training data to build a picture of the relationship between the local training system and regional skills needs.
Regional Profile by Funding Type The strong enrolment growth highlighted earlier in this report has been repeated across the majority of Victoria‟s regions. Seven of nine regions, for example had growth of 10 per cent or higher, between 2011 and 2012. Enrolment growth has been strongest in most metropolitan regions, especially in Western Metro (up 37 per cent). In regional Victoria, growth has been highest in Hume (up 26 per cent). While Gippsland experienced a decline of 4 per cent, this does present an early indicator of a stabilising of enrolment numbers, following declines of 9 per cent between 2010 and 2011 and a 16 per cent decline between 2008 to 2009.
Government Subsidised
Table 5.1: Vocational training enrolments by region, government subsidised
*Note: Training locations in the Melbourne LGA have been included in the Western Metropolitan region. Other – interstate, on-
line and workplace delivery. Enrolments falling within more than one region have been counted in each relevant location; any
duplication has been removed from the total.
Delivery Location - Region 2008 2009 2010 2011 2012% change
2008-2012
% change
2011-2012
Barwon South West 28,800 31,800 35,800 50,100 62,500 117% 25%
Grampians 14,600 16,200 15,000 17,200 18,900 29% 10%
Loddon Mallee 23,600 27,900 28,300 32,800 37,100 57% 13%
Hume 29,100 26,000 24,700 27,300 34,400 18% 26%
Gippsland 26,700 22,400 22,500 20,500 19,700 -26% -4%
Eastern Metropolitan 55,500 52,200 60,100 73,600 76,000 37% 3%
Western Metropolitan 76,300 67,900 88,600 135,800 186,400 144% 37%
Southern Metropolitan 63,600 67,700 81,800 107,600 137,400 116% 28%
Northern Metropolitan 46,900 52,400 56,400 68,700 87,300 86% 27%
All Regions Total 364,400 363,900 412,600 532,200 656,800 80% 23%
Other 17,400 13,400 15,100 17,600 15,000 -13% -14%
Total VET 381,300 376,800 426,900 548,700 670,400 76% 22%

Regional Training Profiles
Victorian Training Market Quarterly Report Full Year 2012 147
Student growth trend is very similar to the enrolment trend. Seven of the nine regions recorded a growth in students of 10 per cent or more.
Table 5.2: Vocational training students by region, government subsidised
Note: Training locations in the Melbourne LGA have been included in the Western Metropolitan region. Other – interstate, on-
line and workplace delivery. Students falling within more than one location have been counted in each relevant region; any
duplication has been removed from the total.
Fee for Service
TAFE domestic fee for service enrolments have also increased over the same period – a trend consistent across all of Victoria‟s regions. The Western Metro (+80 per cent), Loddon Mallee (+60 per cent) and Barwon South West (+49 per cent) regions have experienced the strongest fee for service enrolment growth in 2011. Grampians (+5 per cent) and Northern Metropolitan (+5 per cent) have experienced modest growth instead.
Table 5.3: TAFE domestic fee for service enrolments by region
Note: fee for service figures are TAFE domestic AQF1+ activity only. Training locations in the Melbourne LGA have been
included in the Western Metropolitan region. Other – interstate, on-line and workplace delivery. Enrolments falling within more
than one region have been counted in each relevant location; any duplication has been removed from the total.
Growth in student numbers across the region experience a similar pattern to enrolment growth but the growth rates are quite varied to that of enrolment growth. In Western Metropolitan and Loddon Mallee, student numbers grew in 2012 by 46 per cent and 33 per cent respectively, while their enrolments grew by 80 per cent and 60 per cent respectively. In Gippsland, student numbers grew by 2 per cent whereas enrolments grew by 10 per cent. In the Eastern Metropolitan region, students grew by 10 per cent from 2011 to 2012, and enrolments grew by a comparable 9 per cent.
Delivery Location - Region 2008 2009 2010 2011 2012% change
2008-2012
% change
2011-2012
Barwon South West 23,200 25,600 28,700 38,100 45,200 95% 19%
Grampians 11,500 12,300 12,100 13,900 15,300 33% 10%
Loddon Mallee 18,800 21,100 22,600 26,600 29,900 59% 12%
Hume 22,100 21,100 19,700 21,800 27,100 22% 24%
Gippsland 19,200 16,900 17,200 16,000 15,700 -18% -2%
Eastern Metropolitan 41,200 40,900 45,100 54,800 54,200 31% -1%
Western Metropolitan 60,000 54,600 71,800 107,700 149,700 149% 39%
Southern Metropolitan 49,500 55,100 65,000 86,100 104,900 112% 22%
Northern Metropolitan 35,900 42,400 46,800 54,600 63,000 75% 15%
All Regions Total 279,900 288,400 327,100 416,300 497,700 78% 20%
Other 15,900 12,400 13,800 15,900 13,900 -13% -13%
Total 294,700 299,600 339,200 430,300 509,800 73% 18%
Delivery Location - Region 2008 2009 2010 2011 2012% change
2008-2012
% change
2011-2012
Barwon South West 4,900 6,100 6,100 7,300 10,800 119% 49%
Grampians 2,600 3,100 3,100 3,000 3,100 20% 5%
Loddon Mallee 4,800 4,600 4,100 4,000 6,300 31% 60%
Hume 9,200 9,300 12,200 11,400 13,600 48% 19%
Gippsland 6,700 6,900 7,300 8,600 9,500 40% 10%
Eastern Metropolitan 7,800 8,900 8,000 8,700 9,400 20% 9%
Western Metropolitan 10,500 14,600 14,000 12,500 22,400 114% 80%
Southern Metropolitan 10,900 13,800 14,300 14,100 15,200 39% 8%
Northern Metropolitan 9,500 14,800 13,800 12,300 12,900 37% 5%
All Regions Total 66,900 81,700 82,400 81,600 103,200 54% 26%
Other 22,700 19,300 21,300 20,700 22,000 -3% 6%
Total VET 89,400 100,800 103,700 102,200 124,900 40% 22%

Regional Training Profiles
148 Victorian Training Market Quarterly Report Full Year 2012
Table 5.4: TAFE domestic fee for service students by region
Note: Training locations in the Melbourne LGAhave been included in the Western Metropolitan LGA. Other – interstate, on-line
and workplace delivery. Students falling within more than one region have been counted in each relevant location; any
duplication has been removed from the total.
Regional Profile by Provider Type The regional growth in government subsidised course enrolments highlighted above continues to be driven primarily by an increase in private provider delivery. Training delivery by private RTOs has increased in each of the nine training market regions in 2012 compared to 2011.
TAFE government subsidised delivery accounted for a majority of enrolment growth in Hume and Northern Metro. Only three regions – Grampians, Gippsland and Eastern Metro – experienced a decline in government subsidised TAFE enrolments over the last year.
Government subsidised enrolments with ACE providers increased in all regions except Gippsland. ACE providers in Barwon South West (+75 per cent) experienced the strongest enrolment growth, accounting for a majority of growth in that region.
Delivery Location - Region 2008 2009 2010 2011 2012% change
2008-2012
% change
2011-2012
Barwon South West 4,400 5,700 5,700 6,900 9,200 109% 33%
Grampians 2,200 2,800 2,600 2,700 2,700 22% 2%
Loddon Mallee 4,500 4,300 3,800 3,700 4,800 7% 30%
Hume 8,600 8,600 11,100 10,300 11,800 38% 15%
Gippsland 6,400 6,500 6,800 8,100 8,300 30% 2%
Eastern Metropolitan 7,000 8,000 7,400 8,000 8,700 25% 10%
Western Metropolitan 9,700 13,600 12,900 11,700 17,000 76% 46%
Southern Metropolitan 10,500 12,900 13,600 12,800 13,800 32% 7%
Northern Metropolitan 7,900 13,100 12,200 10,900 11,200 43% 3%
All Regions Total 60,800 75,000 75,800 74,600 87,100 43% 17%
Other 20,000 18,400 20,800 20,000 18,700 -6% -7%
Total 80,400 93,100 96,000 94,200 105,200 31% 12%

Regional Training Profiles
Victorian Training Market Quarterly Report Full Year 2012 149
Table 5.5: Vocational training enrolments by region and provider type, government subsidised
Note: Training locations in the Melbourne LGA have been included in the Western Metropolitan region. Other – interstate, on-
line and workplace delivery.
Greater choice of training provider is evident in each of Victoria‟s regions, as the number of providers offering government subsidised training has increased since the implementation of training market reforms in 2008. The number of private providers in particular has grown strongly throughout Victoria. However, these overall trends hide some variation across the regions.
Delivery Location - RegionProvider
type2008 2009 2010 2011 2012
% change
2008-2012
% change
2011-2012
Barwon South West ACE 6,100 6,500 6,400 8,700 15,200 151% 75%
PRIV 2,500 4,300 6,600 14,800 18,200 626% 23%
TAFE 20,200 21,000 22,800 26,600 29,100 44% 10%
Barwon South West Sub-total 28,800 31,800 35,800 50,100 62,500 117% 25%
Grampians ACE 4,400 5,200 3,400 3,700 3,900 -12% 5%
PRIV 2,400 2,800 3,900 6,400 8,000 237% 25%
TAFE 7,800 8,100 7,700 7,100 6,900 -11% -2%
Grampians Sub-total 14,600 16,200 15,000 17,200 18,900 29% 10%
Loddon Mallee ACE 5,700 5,500 5,800 5,400 6,800 21% 26%
PRIV 4,700 5,600 7,900 13,000 14,900 217% 14%
TAFE 13,200 16,800 14,700 14,300 15,400 16% 8%
Loddon Mallee Sub-total 23,600 27,900 28,300 32,800 37,100 57% 13%
Hume ACE 8,000 6,300 4,800 4,100 4,900 -39% 20%
PRIV 3,300 2,200 2,100 5,000 7,200 120% 45%
TAFE 17,800 17,600 17,700 18,200 22,300 25% 22%
Hume Sub-total 29,100 26,000 24,700 27,300 34,400 18% 26%
Gippsland ACE 9,500 6,900 5,500 4,100 3,900 -59% -4%
PRIV 2,700 2,100 2,200 2,500 4,000 51% 59%
TAFE 14,600 13,300 14,800 13,900 11,800 -19% -15%
Gippsland Sub-total 26,700 22,400 22,500 20,500 19,700 -26% -4%
Eastern Metropolitan ACE 9,800 8,900 8,800 8,100 9,200 -6% 13%
PRIV 7,700 9,200 11,500 24,300 27,300 256% 12%
TAFE 38,100 34,100 39,800 41,200 39,500 4% -4%
Eastern Metropolitan Sub-total 55,500 52,200 60,100 73,600 76,000 37% 3%
Western Metropolitan ACE 9,300 9,800 9,800 10,100 13,200 43% 31%
PRIV 17,200 14,400 32,500 80,100 124,700 623% 56%
TAFE 49,800 43,700 46,400 45,600 48,600 -3% 7%
Western Metropolitan Sub-total 76,300 67,900 88,600 135,800 186,400 144% 37%
Southern Metropolitan ACE 10,900 10,400 11,300 11,400 13,900 28% 23%
PRIV 9,800 12,500 23,000 53,500 76,500 682% 43%
TAFE 42,900 44,700 47,500 42,700 47,000 10% 10%
Southern Metropolitan Sub-total 63,600 67,700 81,800 107,600 137,400 116% 28%
Northern Metropolitan ACE 10,300 8,800 8,100 9,000 9,200 -11% 2%
PRIV 3,900 4,500 10,400 21,700 29,300 652% 35%
TAFE 32,700 39,100 38,000 38,000 48,800 49% 28%
Northern Metropolitan Sub-total 46,900 52,400 56,400 68,700 87,300 86% 27%
All regions ACE 73,800 68,300 63,800 64,600 80,200 9% 24%
PRIV 54,000 57,400 99,700 220,600 308,700 471% 40%
TAFE 236,600 238,100 249,000 247,000 267,900 13% 8%
All Regions Total 364,400 363,900 412,600 532,200 656,800 80% 23%
Other ACE - - - - - n/a n/a
PRIV 11 2 19 87 146 1227% 68%
TAFE 17,400 13,400 15,100 17,500 14,900 -14% -15%
Other Sub-total 17,400 13,400 15,100 17,600 15,000 -13% -14%
ACE 73,800 68,300 63,800 64,600 80,200 9% 24%
PRIV 54,000 57,400 99,800 220,700 308,800 472% 40%
TAFE 253,500 251,100 263,300 263,500 281,400 11% 7%
All Government Subsidised VET Total 381,300 376,800 426,900 548,700 670,400 76% 22%
All Government
Subsidised VET

Regional Training Profiles
150 Victorian Training Market Quarterly Report Full Year 2012
Table 5.6: Vocational training providers by region and provider type, government subsidised
Note: Training providers in the Melbourne LGA have been included in the Western Metropolitan region. Other – interstate, on-
line and workplace delivery.
Government subsidised student contact hours have grown in all regions except Eastern Metro in 2012 compared to 2011, with a majority of growth being driven by private provider delivery. Exceptions are Hume (where 64 per cent of additional student contact hours were delivered by TAFE Institutes) and Eastern Metro (where ACE student contact hours grew by 14 per cent despite an overall decrease in student contact hours across the region).
Delivery Location - RegionProvider
type2008 2009 2010 2011 2012
% change
2008-2012
% change
2011-2012
Barwon South West ACE 29 26 26 27 30 3% 11%
PRIV 29 50 56 73 103 255% 41%
TAFE 4 4 4 4 3 -25% -25%
Barwon South West Sub-total 62 80 86 104 136 119% 31%
Grampians ACE 32 27 28 29 30 -6% 3%
PRIV 23 29 32 52 80 248% 54%
TAFE 2 2 1 1 1 -50% 0%
Grampians Sub-total 57 58 61 82 111 95% 35%
Loddon Mallee ACE 37 33 37 37 40 8% 8%
PRIV 40 54 64 78 106 165% 36%
TAFE 2 2 2 2 2 0% 0%
Loddon Mallee Sub-total 79 89 103 117 148 87% 26%
Hume ACE 41 38 38 33 32 -22% -3%
PRIV 31 30 45 61 86 177% 41%
TAFE 2 2 2 2 2 0% 0%
Hume Sub-total 74 70 85 96 120 62% 25%
Gippsland ACE 41 35 32 32 32 -22% 0%
PRIV 27 28 38 45 65 141% 44%
TAFE 4 4 4 4 4 0% 0%
Gippsland Sub-total 72 67 74 81 101 40% 25%
Eastern Metropolitan ACE 45 45 44 45 44 -2% -2%
PRIV 50 66 87 110 125 150% 14%
TAFE 4 3 3 3 3 -25% 0%
Eastern Metropolitan Sub-total 99 114 134 158 172 74% 9%
Western Metropolitan ACE 33 38 39 36 43 30% 19%
PRIV 72 103 176 237 262 264% 11%
TAFE 7 7 5 8 9 29% 13%
Western Metropolitan Sub-total 112 148 220 281 314 180% 12%
Southern Metropolitan ACE 64 66 66 65 65 2% 0%
PRIV 62 86 118 141 170 174% 21%
TAFE 4 4 4 5 5 25% 0%
Southern Metropolitan Sub-total 130 156 188 211 240 85% 14%
Northern Metropolitan ACE 46 44 43 43 42 -9% -2%
PRIV 53 68 89 133 159 200% 20%
TAFE 5 5 5 4 4 -20% 0%
Northern Metropolitan Sub-total 104 117 137 180 205 97% 14%
All regions ACE 342 320 316 309 298 -13% -4%
PRIV 201 246 342 422 445 121% 5%
TAFE 18 18 18 18 18 0% 0%
All Regions Total 561 584 676 749 761 36% 2%
Other ACE - - - - - n/a n/a
PRIV 3 1 3 4 5 67% 25%
TAFE 7 6 6 6 5 -29% -17%
Other Sub-total 10 7 9 10 10 0% 0%
ACE 342 320 316 309 298 -13% -4%
PRIV 201 246 344 422 445 121% 5%
TAFE 18 18 18 18 18 0% 0%
All Government Subsidised VET Total 561 584 678 749 761 36% 2%
All Government
Subsidised VET

Regional Training Profiles
Victorian Training Market Quarterly Report Full Year 2012 151
Table 5.7: Vocational training student contact hours by region and provider type, government subsidised (millions)
Note: Training providers in the Melbourne LGA have been included in the Western Metropolitan region. Other – interstate, on-
line and workplace delivery.
Delivery Location - RegionProvider
type2008 2009 2010 2011 2012
% change
2008-2012
% change
2011-2012
Barwon South West ACE 0.8 0.9 1.0 1.7 3.5 309% 102%
PRIV 0.6 0.8 1.8 4.3 6.2 1004% 44%
TAFE 5.0 5.9 6.6 8.9 9.6 93% 8%
Barwon South West Sub-total 6.4 7.6 9.4 14.9 19.3 201% 29%
Grampians ACE 0.4 0.5 0.4 0.5 0.6 58% 35%
PRIV 0.6 0.6 0.9 1.7 2.3 269% 33%
TAFE 2.2 2.5 2.7 2.4 2.1 -3% -10%
Grampians Sub-total 3.2 3.5 4.1 4.5 5.0 58% 11%
Loddon Mallee ACE 0.6 0.6 0.8 0.9 1.0 59% 8%
PRIV 1.1 1.0 1.8 3.1 4.5 323% 45%
TAFE 3.4 4.0 4.0 3.8 4.8 43% 28%
Loddon Mallee Sub-total 5.1 5.6 6.6 7.8 10.3 104% 33%
Hume ACE 0.5 0.6 0.5 0.5 0.8 41% 58%
PRIV 0.4 0.4 0.4 0.9 1.6 323% 76%
TAFE 3.7 4.7 4.7 4.5 6.2 69% 39%
Hume Sub-total 4.6 5.6 5.7 5.9 8.7 87% 46%
Gippsland ACE 0.6 0.7 0.8 0.8 0.7 15% -15%
PRIV 0.5 0.5 0.4 0.5 1.0 81% 73%
TAFE 3.0 3.2 3.5 3.4 3.5 17% 3%
Gippsland Sub-total 4.1 4.4 4.7 4.8 5.2 25% 8%
Eastern Metropolitan ACE 1.0 1.1 1.2 1.3 1.4 39% 14%
PRIV 2.1 1.9 2.9 7.4 7.1 239% -4%
TAFE 10.0 10.3 11.7 11.7 11.5 15% -2%
Eastern Metropolitan Sub-total 13.1 13.3 15.7 20.3 20.1 53% -1%
Western Metropolitan ACE 1.5 1.6 1.5 1.6 2.4 62% 45%
PRIV 4.1 2.7 8.0 19.6 35.8 768% 83%
TAFE 13.3 14.6 15.8 15.1 17.1 29% 14%
Western Metropolitan Sub-total 18.8 18.9 25.2 36.3 55.3 194% 53%
Southern Metropolitan ACE 0.9 1.4 1.6 1.7 2.1 130% 23%
PRIV 2.3 2.5 5.1 13.4 21.4 849% 59%
TAFE 13.1 14.7 13.9 13.6 14.5 10% 6%
Southern Metropolitan Sub-total 16.3 18.5 20.6 28.7 37.9 133% 32%
Northern Metropolitan ACE 0.7 0.8 1.0 1.0 1.2 68% 18%
PRIV 1.2 1.2 2.8 6.9 9.6 692% 40%
TAFE 10.5 12.9 12.6 11.6 12.6 20% 8%
Northern Metropolitan Sub-total 12.4 14.9 16.3 19.5 23.4 89% 20%
All regions ACE 7.1 8.2 8.6 10.0 13.6 91% 36%
PRIV 12.9 11.4 24.3 57.8 89.5 596% 55%
TAFE 64.1 72.6 75.4 75.0 82.0 28% 9%
All Regions Total 84.1 92.3 108.3 142.8 185.1 120% 30%
Other ACE - - - - - n/a n/a
PRIV 0.0 0.0 0.0 0.0 0.1 2855% 187%
TAFE 3.3 3.3 4.1 4.1 3.6 9% -13%
Total other 3.3 3.3 4.1 4.2 3.7 11% -12%
ACE 7.1 8.2 8.6 10.0 13.6 91% 36%
PRIV 12.9 11.4 24.3 57.9 89.6 597% 55%
TAFE 67.4 75.9 79.5 79.1 85.6 27% 8%
All Government Subsidised VET Total 87.4 95.6 112.4 146.9 188.8 116% 28%
All Government
Subsidised VET

Regional Training Profiles
152 Victorian Training Market Quarterly Report Full Year 2012
Individual Regional Profiles
Overview
Each of the following regional training market profiles examines the following areas:
Economic context including regional employment trends and key industries
Summary of training challenges relevant to the region gleaned
Overview of training performance 2012 compared to 2011, including a 'dashboard' of key measures
Training breakdown, including occupations, qualifications and student profile
Provider analysis including shifts in market share
Regional coverage
To allow for increased granularity of analysis, individual regional profiles have been extended to cover 13 Victorian regions, to better reflect regional diversity
37.
Data Scope
The scope of data in these profiles is limited to enrolments in nationally recognised and accredited qualifications at Certificate I level and above (i.e. excludes module only delivery).
Training data provided in the individual regional profiles will therefore not correspond exactly with the summary tables above. The summary tables above include all training inclusive of module only and short courses and align with the scope of the Victorian Vocational Training Summary chapter at the beginning of this report.
Data in the individual regional profiles therefore should not be compared with the tables at the commencement of this chapter.
37
Barwon South West, Grampians and Loddon Mallee have each been divided into two, while Inner Metropolitan, covering the
four central Melbourne local government areas, has been added to metropolitan regions.

Regional Training Profiles
Victorian Training Market Quarterly Report Full Year 2012 153
Loddon Mallee North
Regional overview Loddon Mallee North is located in the north of Victoria and represents about 17 per cent of Victoria‟s total area. The population is mainly centred in and around regional centres and towns along the Murray River, from the South Australian border in the west, to Echuca in the east. There are also smaller service centres with dispersed populations in the dryland farming areas.
The region includes the local government areas of Buloke, Campaspe, Gannawarra, Mildura, and Swan Hill.
Economy and outlook Loddon Mallee North‟s economy is concentrated around two industries – Agriculture and Manufacturing,
with these two industries comprising approximately one third of gross regional product.
Manufacturing in Loddon Mallee North is particularly dependent on inputs from Agriculture. The region is a major food producer for Victoria, Australia and for export markets. In 2011, Food, Beverage and
Tobacco Product Manufacturing made up 65 per cent of the Manufacturing sector.
Economic growth in Loddon Mallee North has been below the average for regional Victoria and the rest of the state over the last decade, linked in part to variable climatic conditions the growth of the Agricultural industry. Employment and population growth have also been below state averages, although these average growth figures mask variations across the region.
The regional centre of Mildura has been the main driver of the area‟s economic growth. With the exception of mining, most of the industry sectors that have experienced high growth are in the Services sector, driven by population growth in Mildura and growth in tourism.
Loddon Mallee North‟s size and remote location means that equitable access to high quality education, health and other services can be difficult to achieve, particularly for those in isolated small towns with declining populations.
Young people are seeking education and employment in other regional and metropolitan centres, compounding the regional population‟s older than average age profile. Combined with a low population growth forecast, this means that regional employment is likely to grow at a relatively slow pace.
Key training challenges for the region
The region‟s size means that access to tertiary education and other services can be a challenge for those in more remote areas.
While online and distance learning is one way of addressing access to training, the Agricultural industry – key to this region – demand hands on training, situated on the farm.
Loddon Mallee North has a relatively low labour force participation rate in regional Victoria. Supporting people to develop the skills needed to enter the labour force remains a challenge in this region.
Skill shortages have been identified across the regional economy in professional, trades and skilled labouring roles in the Construction, Health and Agriculture industries.
The higher level skills needed by the region‟s labour force may pose a challenge for the region‟s training market, given declining enrolments at Diploma level and above.
Figure 1: Key indicators
Key indicators
2011
Loddon
Mallee North
Regional
VictoriaVictoria
GRP growth
2001-11 0.3% 2.2% 3.5%
Employment growth
2001-11 -0.7% 0.6% 1.0%
Population growth
2001-11 -0.03% 0.7% 1.4%
Unemployment rate 5.3% 5.1% 5.4%
Labour force
participation rate 56.8% 58.5% 61.4%
Growth figures represent annual average growth rate 2001-2011
Source: RDV, ABS Census 2011

Regional Training Profiles
154 Victorian Training Market Quarterly Report Full Year 2012
Regional training delivery38 Loddon Mallee North is the third smallest training
market in Victoria, with 17,300 enrolments in government subsidised vocational training in 2012 combined with 2,000 fee for service enrolments with TAFE providers.
Government subsidised training delivery grew by 27 per cent from 2011, the second highest enrolment growth in regional Victoria.
TAFE providers accounted for the majority of this enrolment growth, with this region showing the strongest TAFE growth rate in Victoria.
Enrolment growth with ACE providers has also been strong, increasing 53 per cent over the last 12 months. ACE training delivery in Loddon Mallee North is the second largest in regional Victoria.
Private RTOs remain the largest provider type in the region, accounting for 43 per cent of enrolments. TAFE Institutes delivered 38 per cent of enrolments in 2012, while ACE providers accounted for 19 per cent.
Figure 3: Regional training comparison
Figure 4: Vocational training provider trends
Figure 5: Training delivery by LGA
The region‟s training activity is concentrated in the Mildura and Swan Hill local government areas,
accounting for 88 per cent of regional enrolments. Strong enrolment growth in Mildura will help support the economic growth being driven by this area.
Loddon Mallee North has the highest vocational training student participation rate in Victoria, 18 per cent compared to a regional Victorian average of 15 per cent.
38
Scope of data is nationally accredited and recognised training at AQF level 1 and above. Commentary refers to government
subsidised activity unless otherwise stated.
2008 2009 2010 2011 2012
Loddon Mallee
North 8,500 11,000 10,300 13,600 17,300
Year-on-year %
change - 29% -7% 32% 27%
% change across
Victoria - 2% 17% 35% 25%
38%
43%
19%
TAFE Private ACE
Provider share 2012(change in percentage points since 2011)
2% 3%-5%
2
56
19
TAFE Private ACE
Number of providers 2012(% change since 2011)
65% 19%
Local Government Area Enrolments 2012 % change 2011-2012Number of providers
2012% change 2011-2012
Student participation
rate %
Buloke (S) 40 105% 6 50% 16%
Campaspe (S) 1,900 25% 32 88% 14%
Gannawarra (S) 200 47% 7 40% 14%
Mildura (RC) 9,800 41% 33 43% 20%
Swan Hill (RC) 5,400 9% 21 62% 21%
27%
-2%
24%
20%
27%
35%
13%
53%
-2%
Note: size of bars represents % growth 2011-12
17,300
2,000
19,300
14,300
4.5 million
6,500
7,400
3,300
5,000
Figure 2: Regional training dashboard 2012 vs. 2011
Gov't funded enrolments
Total enrolments (GF + TAFE FFS)
Hours
TAFE
Private
ACE
Apprentices / Trainees
TAFE FFS enrolments
Enrolments by provider
type
Students

Regional Training Profiles
Victorian Training Market Quarterly Report Full Year 2012 155
Figure 6: Enrolments by funding band39
In 2012, 19 per cent of government subsidised enrolments in the Loddon Mallee North region were aligned to funding band A, and 46 per cent aligned against band B.
Data for enrolments in 2011 are shown aligned against funding bands for the 2011 calendar year for comparison purposes only.
In 2012, there were fewer enrolments in courses aligned to bands C, D and E than in 2011, but more at band B.
Industry profile Agriculture is the major employing industry in the region, accounting for 15 per cent of employment,
reflecting its importance in the regional economy. This is followed by Retail Trade and Health Care and Social Assistance.
Structural change in the region has meant a declining employment share for the Agriculture and Manufacturing industries, while employment in Construction, Retail and Health Care and Social Assistance has been increasing. Construction remains a relatively small regional employer, however, accounting for 5 per cent of Loddon Mallee South‟s labour market.
Four of the top five employing industries – Agriculture, Retail, Health Care and Manufacturing – are also top five industries in terms of the training.
Retail Trade is the largest training market sector, accounting for 19 per cent of regional enrolments, a proportion which is well above the Victorian average of 9 per cent.
Figure 7: Industry share of employment and vocational training
Given its importance in the regional labour market, Health Care and Social Assistance appears to be slightly under-represented in Loddon Mallee North‟s training market, accounting for 12 per cent of enrolments compared to an average across Victoria of 19 per cent of delivery. Enrolments have increased over the last 12 months, however, up by 13 per cent when compared with 2011.
39
These bands were introduced in 2012 and apply specifically to qualifications current in 2012 and later. In order to allow
comparison with previous years, superseded courses have been assigned a subsidy band for analysis purposes based on the
band of the current course to which they most closely align.
15%
14%
13%
10%
9%
6%
5%
5%
4%
4%
3%
3%
2%
2%
1%
1%
1%
1%
0%
2%
11%
12%
11%
8%
6%
8%
6%
5%
4%
5%
8%
3%
4%
1%
1%
2%
2%
0%
Agriculture, Forestry and Fishing
Retail Trade
Health Care and Social Assistance
Manufacturing
Education and Training
Accommodation and Food Services
Construction
Public Administration and Safety
Transport, Postal and Warehousing
Other Services
Wholesale Trade
Professional, Scientific and Technical
Administrative and Support Services
Financial and Insurance Services
Electricity, Gas, Water and Waste
Rental, Hiring and Real Estate
Information Media and Telecoms
Arts and Recreation Services
Mining
Employment 2011 (% total)
Loddon Mallee North Victoria
Source: ABS Census 2011
11%
19%
12%
12%
2%
7%
13%
1%
11%
7%
0%
1%
3%
0%
0%
0%
0%
2%
0%
2%
9%
19%
10%
2%
11%
13%
2%
9%
5%
0%
3%
5%
2%
0%
1%
1%
6%
0%
Agriculture, Forestry and Fishing
Retail Trade
Health Care and Social Assistance
Manufacturing
Education and Training
Accommodation and Food Services
Construction
Public Administration and Safety
Transport, Postal and Warehousing
Other Services
Wholesale Trade
Professional, Scientific and Technical
Administrative and Support Services
Financial and Insurance Services
Electricity, Gas, Water and Waste
Rental, Hiring and Real Estate
Information Media and Telecoms
Arts and Recreation Services
Mining
Enrolments 2012 (% total)
Loddon Mallee North Victoria
19%
19%
32%
46%
18%
13%
6%
5%
25%
17%
2011
2012
Enrolments by Funding Band 2011-2012
A B C D E

Regional Training Profiles
156 Victorian Training Market Quarterly Report Full Year 2012
2012 enrolment growth has been highest in the Agriculture, Forestry and Fishing industry. Enrolments have increased by nearly 600, or 79 per cent, to 1,300. Production horticulture courses attracted a majority of enrolments in this industry, over 90 per cent of the total.
Figure 8: Occupation share of vocational training (top 10)
The popularity of Retail courses in this region is again highlighted in Figure 8. There were over 1,700 enrolments in courses aligned with the occuaption Sales Assistant in 2012, with an additional 450 enrolments in Retail Supervisor qualifications. This occupation represents a much higher proportion of Loddon Mallee North‟s training market than in other Victorian regions.
Occupations aligned to the Agriculture, Food Processing, Construction, Automotive and Transport industries are also represented in the top ten training market occupations in 2012.
Qualification profile Loddon Mallee North has lower levels of educational attainment when compared to the Victorian average.
48 per cent of the workforce has no post-school qualifications compared to an average of 38 per cent across Victoria and 43 per cent across regional Victoria.
37 per cent of Loddon Mallee North‟s workforce has vocational training -level qualifications. Of these, a majority (70 per cent) are at Certificate III-IV level.
While overall enrolment growth has been strong in Loddon Mallee North, enrolments in higher level courses (Diploma level and above) have declined by 15 per cent over the last 12 months and now represent 5 per cent of enrolments. This compares to 9 per cent of the region‟s vocational training -qualified workforce qualified to Diploma level of above, suggesting the training market may not be responding to a labour market need for higher level skills.
High enrolments in retail and horticulture courses however suggest alignment with the region‟s two main employing industries. Strong enrolments in foundation level courses (three of Loddon Mallee North‟s top five courses are foundation training) reflects the strong adult and community education provision in this region and indicates that vocational training is supporting people in the region to develop skills to enable workforce participation.
Figure 9: Qualification trends – workforce and vocational training
Top qualifications 2012
Certificate II in Retail 1,000
Certificate III in General Education
for Adults900
Certificate II in General Education
for Adults850
Certificate III In Production
Horticulture800
Certificate I In Vocational
Preparation750
These 5 courses accounted for 25% of all
government funded training in the region
5,400
10,900
900
Cert I-II Cert III-IV Diploma & Above
Qualification level 2012(% change since 2011)
27% 33%
48%
2%
26%
9%
16%
38%
1%
20%
11%
30%
No non-schoolqualifications
Cert I-II
Cert III-IV
Diploma +
Higher education
Workforce qualifications
Loddon Mallee North Victoria
Source: ABS Census 2011
-15%
13%
6%
4%
4%
4%
4%
3%
3%
3%
3%
5%
0%
1%
2%
2%
1%
0%
1%
5%
4%
Sales Assistant
Crop Farm Workers
Meat Boner and Slicer
Carpenter
Kitchenhand
Motor Mechanic
Retail Supervisor
Truck Driver
Child Care Worker
General Clerk
Enrolments 2012 (% total)
Loddon Mallee North Victoria

Regional Training Profiles
Victorian Training Market Quarterly Report Full Year 2012 157
Student profile Figure 10: Working age participation
40
Figure 10 highlights vocational training participation among different cohorts, comparing working age vocational training students resident in Loddon Mallee North with the region‟s working age resident population. Figures referred to in earlier charts and tables in this section relate to enrolments in the region by students that may or may not be resident in the region.
Loddon Mallee North has a strong Indigenous heritage, which is reflected in high levels of Indigenous student participation in the region – the highest in Victoria.
Enrolments by students from a Culturally and Linguistically Diverse (CALD) background appear to be in line with this cohort‟s representation in the regional working age population.
Women appear to be under-represented in the regional training market, with Loddon Mallee North having second lowest proportion of female students in Victoria.
The region has a high proportion of mature-age students (aged 45 and above), the second highest in Victoria, combined with a relatively low proportion of young students compared to other regions – reflecting the
region‟s older than average age profile.
Region: Loddon Mallee North
The problem
Harvesting time in the wine, fruit and olive industries in the Mildura region attracts itinerant workers who find short term, seasonal employment opportunities picking grapes, citrus fruits and pruning olive vines. However, despite shared skills requirements and commonalities across food sectors, employers were frustrated by the need to re-induct and train workers in relevant foundation skills as they rotated through employers during harvesting season.
The response
The Food and Beverage Skills Passport initiative aimed to understand skills requirements each food sector needed and develop a core set of skills and training required by employers that would meet their base OH&S and Hazard Analysis & Critical Control Points (HACCP) needs.
The project was developed by the Mildura Development Corporation in close collaboration with the Mildura Murray Darling Wine Association (Mildura Wines) with input and advice from the local Regional Market Facilitation Manager from the DEECD.
The Regional Market Facilitation Manager helped drive the Memorandum of Understanding between local industry representatives and registered training organisations to provide a consistent and mutual training framework required and recognised by all three food industry sectors. With industry and training providers around the table, agreement on the core units of competency covered by the Passport was easily reached. Three units from the foundation vocational course Certificate I in Preparation were customised to meet the needs of industry. They were Occupational Health and Safety, Provide and Apply Workplace Information and Communication in the Workplace.
The outcome
Launched in 2012, the Food and Beverage Skills Passport is helping provide a pool of people who have transferrable skills for working in and between the wine, beverage and olive industries in the Mildura region. The connections created between industry and training providers through the work of the Passport, have created a pool of job ready people with the right base of skills and knowledge which has increased the local labour pool, and addresses seasonal workforce and labour issues encountered by employers.
40
Note: disabled students appear disproportionally high due to different definitions of disability in use by the Australian Bureau
of Statistics and the Victorian VET Student Statistical Collection. Data for unemployed residents is restricted to the working age
population and factors in those not in the labour force and therefore does not match the regional unemployment rate in Figure 1.
6%
7%
5%
41%
18%
25%
24%
7%
4%
3%
50%
4%
11%
44%
CALD
Disabled(see footnote)
Indigenous
Female
Unemployed(see footnote)
Youth (15-19)
Mature age (45+)
Working age students and population, % total
Students Population
Source (popn data): ABS Census 2011

Regional Training Profiles
158 Victorian Training Market Quarterly Report Full Year 2012
Loddon Mallee South
Regional overview Loddon Mallee South occupies the geographic centre of Victoria. It extends from Boort and Pyramid Hill in the north to the Macedon Ranges in the south-east. At its closest point, the region is 50km from metropolitan Melbourne.
The region includes the local government areas of Central Goldfields, Greater Bendigo, Loddon, Macedon Ranges and Mount Alexander.
Economy and outlook Loddon Mallee South has a diverse economy, reflected in the region‟s comparatively strong growth over
the last ten years. The region‟s economy grew faster than the State average between 2001 and 2011 and its population growth was the third highest in regional Victoria. The region also has a higher participation rate and lower unemployment rate than the regional Victorian average.
Growth has not been distributed evenly in the region, with Bendigo and surrounds accounting for the majority of economic and employment growth – trends which are anticipated to continue into the future.
Mining, Financial and Insurance Services and Manufacturing are key industries to the region, contributing over one third of gross regional product.
The regional economy has seen a shift towards Service sectors, a trend
which is expected to continue over the next decade. Looking forward, the highest growth is anticipated in the Health Care, Education and Finance sectors. While Manufacturing is projected to decline, it will remain important to the regional economy.
The Manufacturing industry in the region has strong links to the Agriculture sector, with approximately one third of the region‟s Manufacturing output from Food Product Manufacturing. Metals and Engineering, Building Products and Transport Equipment are also important Manufacturing sectors in Loddon Mallee South.
While the region‟s main economic activity is focused around Bendigo and its surrounding areas, the Macedon Ranges local government area also has a strong labour market. This local government area benefits from its proximity to Metropolitan Melbourne, giving its residents a wider variety of options for employment.
Central Goldfields is the smallest economy in Loddon Mallee South and has a higher reliance on the Agriculture and Manufacturing industries than other areas in the region.
Key training challenges for the region
Workforce skills gaps have been identified in key regional economic growth industries including Construction, Education, Transport and Logistics and Health.
The ongoing transition from Manufacturing towards Service industries in the region has implications for the skills needed by local employing businesses. The training market can support Loddon Mallee South residents in developing and deepening their skills, to enable them to participate in any emerging industry opportunities.
Despite the shift towards Service industries in Loddon Mallee South, Manufacturing remains a key industry – the third largest employer in the region. The industry appears under-represented in the regional training market; increased alignment could support the industry to build workforce skills and foster innovation.
Figure 1: Key indicators
Key indicators
2011
Loddon
Mallee South
Regional
VictoriaVictoria
GRP growth
2001-11 3.7% 2.2% 3.5%
Employment growth
2001-11 1.0% 0.6% 1.0%
Population growth
2001-11 0.9% 0.7% 1.4%
Unemployment rate 4.9% 5.1% 5.4%
Labour force
participation rate 58.8% 58.5% 61.4%
Growth figures represent annual average growth rate 2001-2011
Source: RDV, ABS Census 2011

Regional Training Profiles
Victorian Training Market Quarterly Report Full Year 2012 159
Regional training delivery41 There were 16,400 government subsidised
vocational training enrolments in 2012. In addition, the region‟s TAFE providers saw an additional 4,300 fee for service enrolments.
Government subsidised training delivery growth of 7 per cent was the second lowest across regional Victoria in 2012. In contrast, the growth rate for TAFE fee for service enrolments was the highest in regional Victoria, at 127 per cent.
TAFE Institutes accounted for a majority of the region‟s enrolment growth between 2011 and 2012, approximately 70 per cent of the total. They remain the largest provider type in Loddon Mallee South, accounting for just over 50 per cent of regional enrolments.
The number of providers delivering training in the region continues to grow, with 109 providers in 2012 compared to 83 in 2011 – an additional 26 providers.
Despite overall enrolment growth, apprentice and trainee enrolments declined in 2012, the second lowest growth in regional Victoria.
Figure 3: Regional training comparison
Figure 4: Vocational training provider trends
Figure 5: Training delivery by LGA
Training delivery is concentrated in the Greater Bendigo local government area, accounting for 89 per
cent of the region‟s enrolments. Regional enrolment growth is also concentrated in Greater Bendigo, with only one other LGA showing growth in 2012, while Macedon Ranges and Mount Alexander have shown significant declines in enrolments between 2011 and 2012.
The region‟s student participation rate of 13 per cent is slightly lower than the regional Victorian average of 15 per cent.
41
Scope of data is nationally accredited and recognised training at AQF level 1 and above. Commentary refers to government
subsidised activity unless otherwise stated.
2008 2009 2010 2011 2012
Loddon Mallee
South 11,000 12,400 13,000 15,300 16,400
Year-on-year %
change - 12% 5% 17% 7%
% change across
Victoria - 2% 17% 35% 25%
51%
42%
7%
TAFE Private ACE
Provider share 2012(change in percentage points since 2011)
1%
1
85
23
TAFE Private ACE
Number of providers 2012(% change since 2011)
39% 10%
-1%
Local Government Area Enrolments 2012 % change 2011-2012Number of providers
2012% change 2011-2012
Student participation
rate %
Central Goldfields (S) 650 11% 21 62% 15%
Greater Bendigo (C) 14,700 25% 69 44% 14%
Loddon (S) 40 0% 5 -29% 12%
Macedon Ranges (S) 400 -64% 25 79% 11%
Mount Alexander (S) 700 -63% 20 67% 11%
7%
127%
20%
3%
44%
10%
7%
-9%
-3%
Note: size of bars represents % growth 2011-12
16,400
4,300
20,700
13,400
5.3 million
8,300
6,900
1,200
5,100
Figure 2: Regional training dashboard 2012 vs. 2011
Gov't funded enrolments
Total enrolments (GF + TAFE FFS)
Hours
TAFE
Private
ACE
Apprentices / Trainees
TAFE FFS enrolments
Enrolments by provider
type
Students

Regional Training Profiles
160 Victorian Training Market Quarterly Report Full Year 2012
Figure 6: Enrolments by funding band42
In 2012, 26 per cent of government subsidised enrolments in the Loddon Mallee South region were aligned to funding band A, and 36 per cent aligned against band B.
Data for enrolments in 2011 are shown aligned against funding bands for the 2011 calendar year for comparison purposes only.
In 2012, there were slightly fewer enrolments in courses aligned to bands A, C and D than in 2011, but more at band B, and slightly more at band E.
Industry profile Service oriented and population driven sectors such as Health Care and Social Assistance, Retail,
Education and Construction are among the region‟s top employers. Manufacturing remains key to Loddon Mallee South, the third largest employer in the region.
Health Care and Social Assistance, Education and Training and Construction are also key industries in terms of training delivery, positioning the region well to respond to the region‟s identified skill gaps in these industries. Arts and Recreation Services is another key training market segment, with these four industries accounting for over two-thirds of industry-specific enrolments in the region.
Courses aligned to the Construction industry attract the most enrolments in Loddon Mallee South, with approximately 3,400 enrolments in 2012. This number has declined since 2011, down by 12 per cent. At 28 per cent of total industry enrolments, the proportion of Construction enrolments in Loddon Mallee South is significantly above the Victorian average of 13 per cent.
Figure 7: Industry share of employment and vocational training
The high proportion of enrolments in Health Care and Social Assistance courses reflects its importance in the local labour market. Enrolments have increased by 14 per cent since 2011, by almost 300 enrolments,
42
42
These bands were introduced in 2012 and apply specifically to qualifications current in 2012 and later. In order to allow
comparison with previous years, superseded courses have been assigned a subsidy band for analysis purposes based on the
band of the current course to which they most closely align.
16%
13%
11%
10%
7%
7%
6%
5%
4%
4%
4%
3%
3%
2%
2%
1%
1%
1%
1%
12%
11%
11%
8%
8%
6%
6%
2%
8%
4%
4%
5%
5%
3%
2%
2%
1%
1%
0%
Health Care and Social Assistance
Retail Trade
Manufacturing
Education and Training
Construction
Accommodation and Food Services
Public Administration and Safety
Agriculture, Forestry and Fishing
Professional, Scientific and Technical
Other Services
Financial and Insurance Services
Transport, Postal and Warehousing
Wholesale Trade
Administrative and Support Services
Arts and Recreation Services
Information Media and Telecoms
Electricity, Gas, Water and Waste
Rental, Hiring and Real Estate
Mining
Employment 2011 (% total)
Loddon Mallee South Victoria
Source: ABS Census 2011
19%
3%
4%
7%
28%
5%
1%
6%
2%
3%
0%
4%
0%
2%
15%
0%
0%
0%
2%
19%
9%
10%
2%
13%
11%
2%
2%
3%
5%
2%
9%
0%
5%
6%
1%
0%
1%
0%
Health Care and Social Assistance
Retail Trade
Manufacturing
Education and Training
Construction
Accommodation and Food Services
Public Administration and Safety
Agriculture, Forestry and Fishing
Professional, Scientific and Technical
Other Services
Financial and Insurance Services
Transport, Postal and Warehousing
Wholesale Trade
Administrative and Support Services
Arts and Recreation Services
Information Media and Telecoms
Electricity, Gas, Water and Waste
Rental, Hiring and Real Estate
Mining
Enrolments 2012 (% total)
Loddon Mallee South Victoria
31%
26%
30%
36%
18%
15%
4%
3%
16%
19%
2011
2012
Enrolments by Funding Band 2011-2012
A B C D E

Regional Training Profiles
Victorian Training Market Quarterly Report Full Year 2012 161
with the most popular courses relating to children‟s services and aged care (making up 30 per cent and 17 per cent of enrolments in health-related courses respectively).
Agriculture, Forestry and Fishing, the region‟s fifth largest industry in terms of training, showed the largest enrolment growth in 2012. Enrolments more than doubled, to just under 700, with the highest number of enrolments in the Certificate III in Agriculture.
Figure 8: Occupation share of vocational training (top 10)
The top ten courses in terms of 2012 enrolments accounted for approximately 50 per cent of all occupation-specific training (excludes foundation training and languages other than English).
Courses linked to the occupation Carpenter are the most popular in Loddon Mallee South, in line with wider popularity of construction courses in this region.
Sports Development and Coaching courses, aligned to the occupation Sports Development Officer, also attract an above average share of enrolments in Loddon Mallee South when compared with total Victorian enrolments.
Qualification profile Loddon Mallee South has lower levels of educational attainment when compared to the Victorian average.
41 per cent of the workforce has no post-school qualifications compared to an average of 38 per cent across Victoria. The region‟s qualification profile is above average for regional Victoria, however, where 43 per cent of the workforce has no post-school qualifications.
Thirty-seven per cent of Loddon Mallee South‟s workforce has vocational training qualifications compared with 32 per cent across Victoria. Of these, a majority of workers (approximately two thirds) are qualified to Certificate III-IV level.
The majority of vocational training enrolments are at Certificate III-IV level, in line with the regional vocational training-qualified workforce. However, in previous years, Diploma and above level enrolments have been lower than average, although there are now signs that the regional training market is responding to labour market requirements, with enrolments at qualifications at this level seeing above average enrolment growth over the last 12 months (an increase of 12 per cent).
Figure 9: Qualification trends – workforce and vocational training
9%
8%
5%
5%
5%
4%
4%
3%
3%
3%
2%
0%
5%
3%
8%
1%
1%
2%
4%
2%
Carpenter
Sports Development Officer
Child Care Worker
Aged or Disabled Carer
Office Manager
Mixed Crop and Livestock Farm Worker
Plumber
Fitness Instructor
General Clerk
Electrician
Enrolments 2012 (% total)
Loddon Mallee South Victoria
Top qualifications 2012
Certificate II in General Education
for Adults1,500
Certificate III in Carpentry 900
Certificate I in Vocational
Preparation700
Certificate III in Agriculture 450
Certificate III in Children's Services 350
These 5 courses accounted for 24% of all
government funded training in the region
4,800
9,800
1,700
Cert I-II Cert III-IV Diploma & Above
Qualification level 2012(% change since 2011)
5% 7%
12%
41%
2%
25%
10%
22%
38%
1%
20%
11%
30%
No non-schoolqualifications
Cert I-II
Cert III-IV
Diploma +
Higher education
Workforce qualifications 2011 (%
total)Loddon Mallee South Victoria
Source: ABS Census 2011

Regional Training Profiles
162 Victorian Training Market Quarterly Report Full Year 2012
Student profile Figure 10: Working age participation
43
Figure 10 highlights vocational training participation among different cohorts, comparing working age vocational training students resident in Loddon Mallee South with the region‟s working age resident population. Figures referred to in earlier charts and tables in this section relate to enrolments in the region by students that may or may not be resident in the region.
The low proportion of Culturally and Linguistically Diverse and Indigenous students in Loddon Mallee South are in line with the overall population profile for these cohorts.
The proportion of unemployed students in Loddon Mallee South is joint highest in regional Victoria, highlighting the role played by the regional training market in supporting labour market participation.
While slightly under-represented in the vocational training system, the number of female students has grown faster than the overall resident student growth rate in 2012, now accounting for 48 per cent of students compared with 45 per cent in 2011.
43
Note: disabled students appear disproportionally high due to different definitions of disability in use by the Australian Bureau
of Statistics and the Victorian VET Student Statistical Collection. Data for unemployed residents is restricted to the working age
population and factors in those not in the labour force and therefore does not match the regional unemployment rate in Figure 1.
4%
9%
2%
48%
22%
28%
19%
3%
3%
1%
51%
4%
11%
44%
CALD
Disabled(see footnote)
Indigenous
Female
Unemployed(see footnote)
Youth (15-19)
Mature age (45+)
Working age students and population, % total
Students Population
Source (popn data): ABS Census 2011

Regional Training Profiles
Victorian Training Market Quarterly Report Full Year 2012 163
Wimmera Southern Mallee
Regional overview Wimmera Southern Mallee is located in the west of Victoria and has the smallest population of all the Victorian regions. The population is mainly centred in and around Horsham, with smaller service centres with dispersed populations in Stawell, Warracknabeal, Edenhope and Nhill.
The region includes the local government areas of Hindmarsh, Horsham Rural City, Northern Grampians, West Wimmera and Yarriambiack.
Economy and outlook The economy of Wimmera Southern Mallee declined over the past decade, and has lagged behind the
rest of Victoria. Both population and productivity have fallen over this time.
Wimmera Southern Mallee‟s economy is very concentrated around Agriculture, accounting for23 per cent of the Gross Regional Product (GRP). Manufacturing and Health Care and Social Assistance are the next largest contributors to GRP. These three industries contributed around 43 per cent of the GRP in 2011.
The concentration in industry GRP is also reflected in employment numbers in the region. In 2011, the largest contributors to Wimmera Southern Mallee‟s employment were Agriculture, Health Care and Social Assistance, Retail Trade and Manufacturing.
Agriculture‟s share of regional employment has declined over the past decade.
Wimmera Southern Mallee was one of two regions that experienced a decline in
population and number of employed persons from 2001 to 2011. The region also has the third lowest labour force participation rate in regional Victoria.
The region has also experienced a higher rate of structural change than the rest of the state and regional Victoria. Drought had a major impact in the regional economy, due to the region‟s economic concentration around Agriculture. However, the economy has diversified over the past decade, with service sectors such as finance, health and education becoming increasingly important to the regional economy.
The region faces challenges in the medium to long-term around human capital development (improving workforce skills, increasing participation in training and employment), enabling investment and innovation to further strengthen and diversify regional strategic sectors, attracting and retaining people in the region, ensuring the viability of the Agriculture sector amidst resource constraints and improving infrastructure to facilitate access to intra and inter-state markets.
Key training challenges for the region
Increasing participation in vocational training sector, given the high proportion of people with no non-school qualifications and the recent fall in Indigenous student numbers:
Providing skills to boost the productivity and competitiveness of Agriculture - the region‟s main industry and further strengthen and diversify regional strategic sectors.
In light of relatively high growth in lower qualifications and transport related qualifications, ensuring prospective students are appropriately informed about the expected benefits of courses.
Figure 1: Key indicators
Key indicators
2011
Wimmera
Southern
Mallee
Regional
VictoriaVictoria
GRP growth
2001-11 -0.3% 2.2% 3.5%
Employment growth
2001-11 -0.7% 0.6% 1.0%
Population growth
2001-11 -0.5% 0.7% 1.4%
Unemployment rate 3.8% 5.1% 5.4%
Labour force
participation rate 57.2% 58.5% 61.4%
Growth figures represent annual average growth rate 2001-2011
Source: RDV, ABS Census 2011

Regional Training Profiles
164 Victorian Training Market Quarterly Report Full Year 2012
Regional training delivery44 There were 2,800 government subsidised vocational
training enrolments in Wimmera Southern Mallee in 2012, making it Victoria‟s smallest training market in terms of governmetn subsidised enrolments..
Wimmera Southern Mallee experienced slightly above average growth in enrolments over the year, compared to regional Victoria as a whole. Most of this growth came from private providers, but was also seen in TAFE and ACE enrolments.
Wimmera Southern Mallee was one of only two Victorian regions that experienced a decline in TAFE fee for service enrolments in 2012.
Courses in Wimmera Southern Mallee are becoming less time-intensive. Compared to the rest of regional Victoria, Wimmera Southern Mallee had the second highest growth in student numbers, but the lowest growth in student contact hours of study in 2012.
Wimmera Southern Mallee had the highest growth in government subsidised apprentice and trainee enrolments of all Victorian regions in 2012.
Figure 3: Regional training comparison
Forty-two providers delivered government subsidised training in Wimmera Southern Mallee in 2012, up from 34 in 2011. This was driven entirely by an increase in the number of private providers (up almost 50 per cent).
Private RTOs are very important to meeting the training needs of Wimmera Southern Mallee. The enrolment share of private providers rose by about 5 percentage points. Wimmera Southern Mallee had the highest enrolment share of private providers of all the non-metropolitan Victorian regions in 2012 (49 per cent).
Figure 4: Vocational training provider trends
In absolute terms, the Horsham LGA experienced the highest increase in enrolment numbers in 2012, owing mainly to truck driving courses. The West Wimmera LGA experienced the largest percentage increase in enrolments in 2012, owing to increases in shearing and wool handling courses. This will help student participation levels improve in that LGA, which has the lowest participation of the five LGAs.
The region‟s training activity is highly concentrated in the Horsham LGA, accounting for 76 per cent of government subsidised enrolments.
44
Scope of data is nationally accredited and recognised training at AQF level 1 and above. Commentary refers to government
subsidised activity unless otherwise stated.
2008 2009 2010 2011 2012
Wimmera
Southern Mallee 2,400 2,400 2,200 2,300 2,800
Year-on-year %
change - 0% -8% 1% 21%
% change across
Victoria - 2% 17% 35% 25%
42%
49%
9%
TAFE Private ACE
Provider share 2012(change in percentage points since 2011)
-1%5%
-5%
1
28
13
TAFE Private ACE
Number of providers 2012(% change since 2011)
47% -7%
21%
-2%
15%
25%
5%
9%
37%
10%
35%
Note: size of bars represents % growth 2011-12
2,800
900
3,700
2,300
0.8 million
1,200
1,300
250
550
Figure 2: Regional training dashboard 2012 vs. 2011
Gov't funded enrolments
Total enrolments (GF + TAFE FFS)
Hours
TAFE
Private
ACE
Apprentices / Trainees
TAFE FFS enrolments
Enrolments by provider
type
Students

Regional Training Profiles
Victorian Training Market Quarterly Report Full Year 2012 165
Figure 5: Training delivery by LGA
Figure 6: Enrolments by funding band45
In 2012, 13 per cent of government subsidised enrolments in the Wimmera Southern Mallee region were aligned to funding band A, and 63 per cent aligned against band B.
Data for enrolments in 2011 are shown aligned against funding bands for the 2011 calendar year for comparison purposes only.
In 2012, there were slightly fewer enrolments in courses aligned to bands C and E than in 2011, but more at band B, and the same at bands A and D.
Industry profile Figure 7 compares the shares of employment and vocational training enrolments by industry in the
Wimmera Southern Mallee region.
Figure 7: Industry share of employment and vocational training
45
These bands were introduced in 2012 and apply specifically to qualifications current in 2012 and later. In order to allow
comparison with previous years, superseded courses have been assigned a subsidy band for analysis purposes based on the
band of the current course to which they most closely align.
Local Government Area Enrolments 2012 % change 2011-2012Number of providers
2012% change 2011-2012
Student participation
rate %
Hindmarsh (S) 10 20% 3 200% 14%
Horsham (RC) 2,100 25% 23 35% 14%
Northern Grampians (S) 550 5% 15 50% 14%
West Wimmera (S) 50 525% 6 200% 10%
Yarriambiack (S) 50 6% 5 67% 12%
18%
16%
11%
7%
7%
6%
6%
5%
4%
4%
3%
3%
2%
2%
2%
1%
1%
1%
1%
2%
12%
11%
8%
11%
6%
6%
8%
5%
4%
5%
8%
3%
0%
4%
1%
2%
2%
1%
Agriculture, Forestry and Fishing
Health Care and Social Assistance
Retail Trade
Education and Training
Manufacturing
Accommodation and Food Services
Public Administration and Safety
Construction
Transport, Postal and Warehousing
Other Services
Wholesale Trade
Professional, Scientific and Technical
Administrative and Support Services
Mining
Financial and Insurance Services
Electricity, Gas, Water and Waste
Arts and Recreation Services
Information Media and Telecoms
Rental, Hiring and Real Estate
Employment 2011 (% total)
Wimmera Southern Mallee Victoria
Source: ABS Census 2011
18%
27%
6%
1%
7%
1%
0%
13%
17%
4%
0%
1%
0%
0%
0%
0%
4%
1%
0%
2%
19%
9%
2%
10%
11%
2%
13%
9%
5%
0%
3%
5%
0%
2%
0%
6%
1%
1%
Agriculture, Forestry and Fishing
Health Care and Social Assistance
Retail Trade
Education and Training
Manufacturing
Accommodation and Food Services
Public Administration and Safety
Construction
Transport, Postal and Warehousing
Other Services
Wholesale Trade
Professional, Scientific and Technical
Administrative and Support Services
Mining
Financial and Insurance Services
Electricity, Gas, Water and Waste
Arts and Recreation Services
Information Media and Telecoms
Rental, Hiring and Real Estate
Enrolments 2012 (% total)
Wimmera Southern Mallee Victoria
13%
13%
53%
63%
17%
12%
5%
5%
11%
8%
2011
2012
Enrolments by Funding Band 2011-2012
A B C D E

Regional Training Profiles
166 Victorian Training Market Quarterly Report Full Year 2012
The Agriculture, Forestry and Fishing and Health Care and Social Assistance industries had the largest shares of employment and vocational training enrolments in the Wimmera Southern Mallee region. The employment and vocational training enrolments shares in these industries are more consistent in the Wimmera Southern Mallee region than in Victoria as a whole.
The Transport, Postal and Warehousing industry has the third-highest share of vocational training enrolments in the Wimmera Southern Mallee region (17 per cent). This is much larger than the industry‟s share of employment (4 per cent). This gap exists at the Victorian level, but is about one-third of the size. The extent to which this is driven by new course offerings or students‟ expectations of future job opportunities in the industry (locally or elsewhere in Victoria) is unclear.
Figure 8: Occupation share of vocational training (top 10)
By occupation, enrolments aligned to the occupation Truck Driver accounts for the largest share of regional enrolments. This is well above the Victorian average, and largely reflects enrolments in new driving operations courses offered by private providers. This is a positive development given known shortages in Truck Drivers in Victoria.
Enrolments related to health and aged care occupations are above the state average overall, and will help meet the needs of an ageing population.
Qualification profile Wimmera Southern Mallee has lower levels of educational attainment than Victoria as a whole. 48 per
cent of the workforce has no post-school qualifications compared to an average of 38 per cent across Victoria.
In terms of vocational training enrolments, Wimmera Southern Mallee had the second lowest share of Certificate III-IV but the highest share of Diplomas and above, of all the non-metropolitan Victorian regions in 2012.
Over time, however, enrolments in the Diploma and above category have fallen, with the strongest growth seen in lower categories.
Figure 9: Qualification trends – workforce and vocational training
Top qualifications 2012
Certificate II in General Education
For Adults300
Certificate III in Driving Operations 300
Diploma of Nursing (Enrolled /
Division 2 Nursing)150
Certificate III in Civil Construction
Plant Operations100
Certificate IV in Agriculture 100
These 5 courses accounted for 36% of all
government funded training in the region
850
1,500
450
Cert I-II Cert III-IV Diploma & Above
Qualification level 2012(% change since 2011)
21%
35%
48%
2%
25%
10%
15%
38%
1%
20%
11%
30%
No non-schoolqualifications
Cert I-II
Cert III-IV
Diploma +
Higher education
Workforce qualifications 2011 (%
total)
Wimmera Southern Mallee Victoria
Source: ABS Census 2011
-9%
14%
8%
8%
6%
6%
5%
5%
4%
4%
4%
2%
3%
1%
0%
5%
1%
5%
1%
0%
8%
Truck Driver
Aged or Disabled Carer
Enrolled Nurse
Mixed Crop and Livestock Farmer
Child Care Worker
Earthmoving Plant Operator
Sales Assistant
Mixed Crop and Livestock Farm Worker
Earthmoving Labourer
Office Manager
Enrolments 2012 (% total)
Wimmera Southern Mallee Victoria

Regional Training Profiles
Victorian Training Market Quarterly Report Full Year 2012 167
Student profile Figure 10: Working age participation
46
Figure 10 highlights vocational training participation among different cohorts, comparing working age vocational training students resident in Wimmera Southern Mallee with the region‟s working age resident population. Figures referred to in earlier charts and tables in this section relate to enrolments in the region by students that may or may not be resident in the region.
The level of vocational training engagement of higher need learners in Wimmera Southern Mallee is slightly below with the average for regional Victoria, but broadly consistent with the population shares of higher need persons.
On the upside, the share of working-age students who were disabled or unemployed exceeded the share of these groups in the general population. While the unemployment rate in Wimmera Southern Mallee was 3 per cent as at the 2011 census, 13 per cent of students were unemployed.
The level of vocational training engagement of higher need learners rose overall in 2012. Most noticeably, there was growth in the number of students who were disabled
(23 per cent), unemployed (17 per cent) or female (17 per cent). On the other hand, the number of students who were Indigenous fell by about 30 per cent in 2012, representing a challenge for the region.
46
Note: disabled students appear disproportionally high due to different definitions of disability in use by the Australian Bureau
of Statistics and the Victorian VET Student Statistical Collection. Data for unemployed residents is restricted to the working age
population and factors in those not in the labour force and therefore does not match the regional unemployment rate in Figure 1.
3%
9%
1%
40%
13%
23%
24%
3%
4%
1%
50%
3%
11%
47%
CALD
Disabled(see footnote)
Indigenous
Female
Unemployed(see footnote)
Youth (15-19)
Mature age (45+)
Working age students and population, % total
Students Population
Source (popn data): ABS Census 2011

Regional Training Profiles
168 Victorian Training Market Quarterly Report Full Year 2012
Central Highlands
Regional overview Central Highlands is located in the west of Victoria and has the 4th smallest population of all the Victorian regions. The population is mainly centred in and around Ballarat, with dispersed populations in Bacchus Marsh, Ararat and Daylesford.
The region includes the local government areas (LGAs) of Ararat Rural City, City of Ballarat, Golden Plains, Hepburn, Moorabool, and Pyrenees.
Economy and outlook The economy of Central Highlands grew at a much faster pace than regional Victoria as a whole from
2001 to 2011. Population driven service sectors such as finance, health and education have become increasingly important to the regional economy. The Agriculture sector, while still significant in the regional economy, declined over the past decade.
The regional centre of Ballarat has driven much of the economic growth. Ballarat, Hepburn and Pyrenees combined are one of the fastest growing functional economic areas in regional Victoria.
The three largest contributors to Central Highland‟s Gross Regional Product (GRP) are Manufacturing, Health Care and Social Assistance, and Construction. These industries contributed around 35 per cent of
the GRP in 2011.
Service oriented and population driven sectors are among the region‟s top employers. The three largest contributors to Central Highland‟s employment are Retail Trade, Health Care and Social Assistance and Manufacturing. These industries accounted for 42 per cent of employment in 2011. Mining too is becoming increasingly important to the regional economy.
The proportion of the workforce employed in Manufacturing is higher than the Victorian average.
Central Highland‟s population growth was the second fastest in regional Victoria. The region also posted a higher growth in number of employed persons and had a higher labour force participation rate than the rest of regional Victoria.
The region experienced a higher rate of structural change than the rest of the state and regional Victoria. Nevertheless, the relatively diverse regional economy helped the region to adapt to changing economic conditions and expand over the past decade.
Central Highlands faces challenges in the medium to long-term around human capital development (improving workforce skills, increasing participation in training and employment) and enabling investment and innovation to further strengthen and diversify regional strategic sectors. The region‟s physical infrastructure, can be improved further to facilitate access to key inter and intra state markets. The region‟s niche as a cultural, heritage and arts tourism destination can be leveraged for further growth.
Key training challenges for the region
Ensure training output is not just serving population-driven service sectors, but meeting the needs of strategic industries.
In light of relatively low enrolment and student growth, and low participation in the Pyrenees LGA, ensuring prospective students are appropriately informed about the expected benefits of courses.
The development of mineral sand deposits in the region has attributed to an emerging mining sector.
Figure 1: Key indicators
Key indicators
2011
Central
Highlands
Regional
VictoriaVictoria
GRP growth
2001-11 3.1% 2.2% 3.5%
Employment growth
2001-11 1.0% 0.6% 1.0%
Population growth
2001-11 1.0% 0.7% 1.4%
Unemployment rate 5.4% 5.1% 5.4%
Labour force
participation rate 59.0% 58.5% 61.4%
Growth figures represent annual average growth rate 2001-2011
Source: RDV, ABS Census 2011

Regional Training Profiles
Victorian Training Market Quarterly Report Full Year 2012 169
Regional training delivery47 There were 14,000 government subsidised vocational
training enrolments in Central Highlands in 2012. TAFE fee for service enrolments in this period were 2,200.
Growth in government subsidised enrolments in Central Highlands was positive, but lower than regional Victoria as a whole. This was due to a decline in TAFE enrolments (one of three Victorian regions to decline) and lower than average growth in ACE enrolments.
Growth in the number of students and student contact hours of study were similar, but below the average for regional Victoria as a whole.
Government subsidised apprentice and trainee enrolments grew slightly in 2012, with the share of total enrolments (26 per cent) consistent with the average for regional Victoria.
Figure 3: Regional training comparison
94 providers delivered government subsidised training in Central Highlands in 2012, up from 62 in 2011. This was predominately driven by increases in the number of private providers, but also by ACE providers.
The enrolment share of private providers rose, and TAFEs fell, by about 6 percentage points respectively. The enrolment share of private providers in the Central Highlands (now at 47 per cent), is the second highest in regional Victoria.
Figure 4: Vocational training provider trends
Figure 5: Training delivery by LGA
Enrolment growth was disparate amongst the LGAs in the Central Highlands. Ballarat LGA experienced
the largest increase in enrolments in 2012, owing to foundational, truck driving and civil construction
47
Scope of data is nationally accredited and recognised training at AQF level 1 and above. Commentary refers to government
subsidised activity unless otherwise stated.
2008 2009 2010 2011 2012
Central Highlands 8,300 9,400 10,000 12,800 14,000
Year-on-year %
change - 13% 6% 28% 10%
% change across
Victoria - 2% 17% 35% 25%
39%
47%
13%
TAFE Private ACE
Provider share 2012(change in percentage points since 2011)
6%-6%
1
74
19
TAFE Private ACE
Number of providers 2012(% change since 2011)
27%61%
Local Government Area Enrolments 2012 % change 2011-2012Number of providers
2012% change 2011-2012
Student participation
rate %
Ararat (RC) 550 -26% 16 60% 14%
Ballarat (C) 12,400 18% 67 60% 16%
Golden Plains (S) 20 10% 6 100% 15%
Hepburn (S) 300 -44% 8 14% 12%
Moorabool (S) 700 6% 18 38% 12%
Pyrenees (S) 90 -75% 3 -25% 7%
10%
9%
10%
10%
12%
-4%
25%
9%
12%
Note: size of bars represents % growth 2011 to 2012
14,000
2,200
16,200
11,800
4 million
5,500
6,700
1,800
3,600
Figure 2: Regional training dashboard 2012 vs. 2011
Gov't funded enrolments
Total enrolments (GF + TAFE FFS)
Hours
TAFE
Private
ACE
Apprentices / Trainees
TAFE FFS enrolments
Enrolments by provider
type
Students

Regional Training Profiles
170 Victorian Training Market Quarterly Report Full Year 2012
courses. The Pyrenees and Hepburn LGAs experienced significant drops in enrolments, owing to shearing and wool handling courses.
The region‟s training activity is highly concentrated in Ballarat, accounting for 88 per cent of government subsidised enrolments. Training in Central Highlands is very centralised in the regional centre relative to the rest of regional Victoria.
Figure 6: Enrolments by funding band48
In 2012, 15 per cent of government subsidised enrolments in the Central Highlands region were aligned to funding band A, and 49 per cent aligned against band B.
Data for enrolments in 2011 are shown aligned against funding bands for the 2011 calendar year for comparison purposes only.
Between 2011 and 2012, there has been very little shift in enrolment patterns across the different bands, with only a slight reduction in band A enrolments, and a slight increase in band B enrolments.
Industry profile Figure 7 below compares the shares of employment and vocational training enrolments by industry in the
region.
Figure 7: Industry share of employment and vocational training
The Health Care and Social Assistance industry had the largest share of employment and second-largest share of vocational training enrolments in the Central Highlands region. However, the region has more
48
These bands were introduced in 2012 and apply specifically to qualifications current in 2012 and later. In order to allow
comparison with previous years, superseded courses have been assigned a subsidy band for analysis purposes based on the
band of the current course to which they most closely align.
16%
13%
11%
10%
8%
7%
6%
6%
5%
4%
4%
3%
2%
2%
2%
2%
1%
1%
1%
12%
11%
11%
8%
6%
8%
6%
2%
8%
5%
4%
5%
3%
4%
2%
2%
1%
1%
0%
Health Care and Social Assistance
Retail Trade
Manufacturing
Education and Training
Accommodation and Food Services
Construction
Public Administration and Safety
Agriculture, Forestry and Fishing
Professional, Scientific and Technical
Transport, Postal and Warehousing
Other Services
Wholesale Trade
Administrative and Support Services
Financial and Insurance Services
Arts and Recreation Services
Information Media and Telecoms
Rental, Hiring and Real Estate
Electricity, Gas, Water and Waste
Mining
Employment 2011 (% total)
Central Highlands Victoria
Source: ABS Census 2011
20%
5%
9%
4%
5%
23%
2%
3%
2%
14%
6%
0%
1%
0%
4%
1%
0%
0%
0%
19%
9%
10%
2%
11%
13%
2%
2%
3%
9%
5%
0%
5%
2%
6%
1%
1%
0%
0%
Health Care and Social Assistance
Retail Trade
Manufacturing
Education and Training
Accommodation and Food Services
Construction
Public Administration and Safety
Agriculture, Forestry and Fishing
Professional, Scientific and Technical
Transport, Postal and Warehousing
Other Services
Wholesale Trade
Administrative and Support Services
Financial and Insurance Services
Arts and Recreation Services
Information Media and Telecoms
Rental, Hiring and Real Estate
Electricity, Gas, Water and Waste
Mining
Enrolments 2012 (% total)
Central Highlands Victoria
17%
15%
46%
49%
17%
17%
7%
7%
13%
12%
2011
2012
Enrolments by Funding Band 2011-2012
A B C D E

Regional Training Profiles
Victorian Training Market Quarterly Report Full Year 2012 171
noticeable differences between employment and vocational training enrolment shares by industry than many other regions.
The Construction industry has the highest share of vocational training enrolments in the region (23 per cent), but only accounts for 7 per cent of employment. This gap exists at the Victorian level, but is about one-third of the size. The extent to which these enrolments are driven by new course offerings or students‟ expectations of future job opportunities (locally or elsewhere in Victoria) is unclear.
Similar to the Wimmera Southern Mallee region, the Transport, Postal and Warehousing industry has the third-highest share of vocational training enrolments (14 per cent), but only accounts for 4 per cent of employment. This reflects new courses offered by private providers and the development of a new freight hub in the region.
Figure 8: Occupation share of vocational training (top 10)
By occupation, enrolments in Truck Driver qualifications account for the largest share of regional enrolments. This is well above the Victorian average, and largely reflects enrolments in new driving operations courses offered by private providers. This is a positive development given high demand of Truck Drivers in the agricultural parts of the region and known shortages in Truck Drivers in Victoria.
Earthmoving Plant Operators have the second largest share of enrolments. This will likely help the region respond to the construction and development needs brought about by relatively high population growth.
Qualification profile Central Highlands has lower levels of educational attainment than Victoria as a whole. 42 per cent of the
workforce has no post-school qualifications compared to an average of 38 per cent across Victoria.
However, Central Highlands has a higher than average share of vocational training enrolments in Diploma and above (14 per cent) compared to the rest of regional Victoria (11 per cent).
The top five courses in terms of enrolments included two courses focused on improving employment and work readiness skills: Certificate II in General Education for Adults, and Certificate I in Vocational Preparation.
Certificate III in Civil Construction Plant Operations was also a popular course, with 850 enrolments in 2012.
Figure 9: Qualification trends – workforce and vocational training
Top qualifications 2012
Certificate II in General Education
for Adults1,100
Certificate III in Civil Construction
Plant Operations850
Certificate III in Driving Operations 750
Certificate I in Vocational
Preparation650
Diploma of Management 300
These 5 courses accounted for 26% of all
government funded training in the region
3,500
8,500
2,000
Cert I-II Cert III-IV Diploma & Above
Qualification level 2012(% change since 2011)
6%
12% 8%
42%
2%
24%
10%
23%
38%
1%
20%
11%
30%
No non-schoolqualifications
Cert I-II
Cert III-IV
Diploma +
Higher education
Workforce qualifications 2011 (%
total)
Central Highlands Victoria
Source: ABS Census 2011
9%
7%
7%
4%
4%
4%
4%
3%
2%
2%
2%
1%
8%
4%
5%
5%
1%
3%
2%
1%
Truck Driver
Earthmoving Plant Operator
Office Manager
General Clerk
Child Care Worker
Sales Assistant
Disabilities Services Officer
Aged or Disabled Carer
Carpenter
Hairdresser
Enrolments 2012 (% total)
Central Highlands Victoria

Regional Training Profiles
172 Victorian Training Market Quarterly Report Full Year 2012
Student profile Figure 10: Working age participation
49
Figure 10 highlights vocational training participation among different cohorts, comparing working age vocational training students resident in Central Highlands with the region‟s working age resident population. Figures referred to in earlier charts and tables in this section relate to enrolments in the region by students that may or may not be resident in the region.
The level of vocational training engagement of higher need learners in Central Highlands is consistent with the average for regional Victoria, and largely consistent with the population shares of higher need persons.
The share of working-age students who were disabled, Indigenous, unemployed or 15–19 years old, exceeded the share of these groups in the general population. While the unemployment rate in Central Highlands was 4 per cent as at the 2011 census, 22 per cent of students were unemployed.
The number of students from higher need backgrounds grew strongly overall in 2012. Most noticeably, there were increases in the number of students who were Indigenous (28 per cent), female (23 per cent) or unemployed (23 per cent).
Case Study - Pyrenees Virtual Learning Project:
Region: The Grampians – Central Highlands
Regional Market Facilitation Manager: Suzanne Gatz
The problem
A shortage of training providers and the very limited access to public Transportation in Ararat, Northern Grampians and Pyrenees shires are barriers to training and employment opportunities in the region.
The response
Regional Market Facilitation Manager Suzanne Gatz recognised that the Department of Education and Early Childhood Development‟s Polycom system, which enables virtual delivery to schools across the state, could be used to assist adult learners in the area. She alerted the steering committee of the Transport Connections Innovation Fund, and they are now working to incorporate it into the forthcoming Victorian Virtual Learning Project (VVLP).
The outcome
The VVLP will commence in mid-April 2013 with training in Digital Literacy, followed by five units from the Certificate III in Community Services. This will be delivered by an RTO from a central DEECD school to adult learners who will access the training via the Polycom system from a number of other schools in the region. Gatz has also engaged with the Local Employment Coordinator to work with the local Job Service Agencies to refer clients to this training opportunity.
49
Note: disabled students appear disproportionally high due to different definitions of disability in use by the Australian Bureau
of Statistics and the Victorian VET Student Statistical Collection. Data for unemployed residents is restricted to the working age
population and factors in those not in the labour force and therefore does not match the regional unemployment rate in Figure 1.
4%
9%
2%
45%
22%
27%
18%
4%
4%
1%
51%
4%
11%
42%
CALD
Disabled(see footnote)
Indigenous
Female
Unemployed(see footnote)
Youth (15-19)
Mature age (45+)
Working age students and population, % total
Students Population
Source (popn data): ABS Census 2011

Regional Training Profiles
Victorian Training Market Quarterly Report Full Year 2012 173
Great South Coast
Regional overview The Great South Coast region is made up of five local government areas: Corangamite, Glenelg, Moyne, Southern Grampians and Warrnambool.
It extends from Lake Corangamite in the east, beyond Portland to the South Australia border in the west; and from the Southern Grampians, including the towns of Hamilton and Dunkeld in the north through to Warrnambool and Port Fairy in the south.
The region is home to just over 100,000 people, of which nearly 63,000 are of working age, with the main area of both population and economic activity centred around Warrnambool on the coast.
Economy and outlook Twofifths of the Great South Coast‟s economy, in terms of employment and Gross Regional Product
(GRP) come from just three industry sectors: Agriculture, Health and Manufacturing. Food products and metal products are particularly important industries, contributing 59 per cent of the region‟s total
Manufacturing employment and 62 per cent of Manufacturing GRP.
Other service oriented and population driven sectors such as Retail and Education are also among the region‟s top employers (see Figure 7).
Data from the latest Census, suggests that unemployment across the region is lower than the average across the state, while labour market participation is on a par.
The region‟s main functional economic area centres around Warrnambool. This town is the
major centre for value-adding to the agricultural hinterland through Dairy Processing, Meat Processing, Clothing and Textiles, as well as serving the function of a major service centre for the region. Warrnambool is also at the western end of the Great Ocean Road and as a result, has established a thriving Tourism industry.
Hamilton in the Southern Grampians local government area (LGA) developed around the wool trade in the 19
th century, and this heritage is still very evident, with the town being a nationally recognised centre
for innovation and trade in wool. Agriculture remains the second largest employing sector in the Southern Grampians, behind the Health Care and Social Assistance sector.
Portland in the LGA of Glenelg developed its advantage because it is the only deepwater port between Melbourne and Adelaide enabling the export of wool, wheat, timber, and the development of a commercial fishing industry. It also provided the foundation for attracting Alcoa in 1986, a major aluminium smelter. Alcoa produces around 358,000 tonnes of aluminium a year, and nearly all of the aluminium produced at Portland Aluminium is exported to the Asian market.
Energy production has become increasingly important to the region, with a number of gas processing and storage plants, and there are future opportunities around wind and geothermal energy.
Figure 1: Key indicators
Key indicators
2011
Great South
Coast
Regional
VictoriaVictoria
GRP growth
2001-11 1.7% 2.2% 3.5%
Employment growth
2001-11 0.2% 0.6% 1.0%
Population growth
2001-11 0.1% 0.7% 1.4%
Unemployment rate 4.2% 5.1% 5.4%
Labour force
participation rate 61.1% 58.5% 61.4%
Growth figures represent annual average growth rate 2001-2011
Source: RDV, ABS Census 2011

Regional Training Profiles
174 Victorian Training Market Quarterly Report Full Year 2012
Regional training delivery50 There were 15,500 government subsidisedvocational
training enrolments in 2012 in the Great South Coast region.
Between 2011 and 2012, government subsidised enrolments in the region grew by 17 per cent, compared to 25 per cent on average across Victoria. However, the total number of students decreased slightly by -2 per cent over the same period from 10,000 to 9,900, meaning that the number of students enrolling on more than one course had increased substantially between the two years.
TAFE provision accounted for 75 per cent of enrolments in 2012, compared to 68 per cent the previous year, whilst ACE provision remained almost static with 1,000 enrolments.
In 2012, 51 providers were delivering training in the Great South Coast region compared to 39 in 2011 – a 31 per cent increase.
Figure 3: Regional training comparison
Between 2011 and 2012, the number of TAFEs and ACE providers delivering in the region remained the same, but the number of private providers increased by 38 per cent from 29 to 40. However, enrolments with private providers between the two years declined by 11 per cent from 3,200 to 2,900.
In 2012 there were 3,400 enrolments in apprenticeships / traineeships in the region, a 12 per cent decrease on the previous year – the highest decrease of all regions. In comparison, combined apprenticeship/traineeship enrolments across Victoria increased by 6 per cent between 2011 and 2012.
50
Scope of data is nationally accredited and recognised training at AQF level 1 and above. Commentary refers to government
subsidised activity unless otherwise stated.
2008 2009 2010 2011 2012
Great South
Coast 9,800 10,400 10,900 13,200 15,500
Year-on-year %
change - 6% 5% 20% 17%
% change across
Victoria - 2% 17% 35% 25%
Key training challenges for the region
The decline in apprenticeships/traineeships in this region is particularly apparent, and the knock-on impact to industry needs to be understood.
There has also been a decline in the proportion of qualifications at Diploma level.
Broadly, there appears to be a level of industry alignment in terms of occupations, but areas to watch may include the service-focused courses around hospitality and accommodation.
The region includes some fairly remote areas with low populations, and thin markets will be an issue for some training delivery.
There are currently no enrolments in energy production focused courses, although this could potentially be a growth area in the future.
17%
15%
17%
-2%
10%
29%
-11%
2%
-12%
Note: size of bars represents % growth 2011-12
15,500
4,700
20,200
9,900
3.3 million
11,600
2,900
1,000
3,400
Figure 2: Regional training dashboard 2012 vs. 2011
Gov't funded enrolments
Total enrolments (GF + TAFE FFS)
Hours
TAFE
Private
ACE
Apprentices / Trainees
TAFE FFS enrolments
Enrolments by provider
type
Students

Regional Training Profiles
Victorian Training Market Quarterly Report Full Year 2012 175
Figure 4: Vocational training provider trends
Figure 5: Training delivery by LGA
At the LGA level, Warrnambool, as the region‟s main population and economic centre accounted for 10,600 enrolments in 2012 - 69 per cent of enrolments in the region.
In total, 33 training providers were delivering enrolments in Warrnambool in 2012, and 20 in the Southern Grampians.
With a student participation rate of 16 per cent on average across the Great South Coast, the region performs better than the average across the state (13 per cent), and in line with the regional Victorian average (15 per cent).
Figure 6: Enrolments by funding band51
In 2012, 15 per cent of government subsidised enrolments in the Great South Coast region were aligned to funding band A, and 65 per cent aligned against band B.
Data for enrolments in 2011 are shown aligned against funding bands for the 2011 calendar year for comparison purposes only.
Between 2011 and 2012, there has been a reduction in enrolments in courses at bands C, D and E, but a significant increase in enrolments at band B. Enrolments in band A courses have remained similar between the two years.
51
These bands were introduced in 2012 and apply specifically to qualifications current in 2012 and later. In order to allow
comparison with previous years, superseded courses have been assigned a subsidy band for analysis purposes based on the
band of the current course to which they most closely align.
75%
19%
7%
TAFE Private ACE
Provider share 2012(change in percentage points since 2011)
-6%
-1%
2
40
9
TAFE Private ACE
Number of providers 2012(% change since 2011)
38%
7%
13%
Local Government Area Enrolments 2012 % change 2011-2012Number of providers
2012% change 2011-2012
Student participation
rate %
Corangamite (S) 550 18% 9 13% 15%
Glenelg (S) 1,400 0% 9 -31% 16%
Moyne (S) 850 -4% 5 67% 14%
Southern Grampians (S) 2,100 -16% 20 25% 16%
Warrnambool (C) 10,600 34% 33 83% 17%
16%
15%
54%
65%
16%
11%
4%
3%
10%
6%
2011
2012
Enrolments by Funding Band 2011-2012
A B C D E

Regional Training Profiles
176 Victorian Training Market Quarterly Report Full Year 2012
Industry profile Agriculture, Forestry and Fishing represents 17 per cent of employment in the Great South Coast region,
compared to 2 per cent on average across Victoria. Accordingly, 16 per cent of enrolments are aligned to courses supporting this industry. In 2012, this represented 1,400 enrolments.
Figure 7: Industry share of employment and vocational training
The Health Care and Social Assistance sector is the second largest employing industry in the region, accounting for 14 per cent of the workforce, and 14 per cent of enrolments in 2012. In particular, enrolments in occupations aligning to Aged or Disabled Carers made up 500 enrolments, and Child Care Workers – 250 enrolments.
There appears to be reasonable alignment between the proportion of employment and the proportion of enrolments in Manufacturing, but slightly less alignment in Retail, which is an important sector along the Great Ocean Road.
Figure 8: Occupation share of vocational training (top 10)
In 2012, enrolments in Construction focused courses accounted for 18 per cent (1,600) of all enrolments, with an occupational focus around Earthmoving Plant Operators and Electricians. In comparison, the industry employs just 6 per cent of the workforce in the region.
The agriculturally related occupations of Mixed Crop and Livestock Farm Worker and Farmer are in the top ten most popular occupations in terms of share of vocational training enrolments in the region, and the onward supply chain into food processing is seen in a high proportion of enrolments in courses relating to Meat Process Workers and Butcher or Smallgoods Makers.
17%
14%
11%
10%
8%
7%
6%
5%
4%
3%
3%
3%
2%
2%
1%
1%
1%
1%
1%
2%
12%
11%
11%
8%
6%
8%
6%
5%
5%
8%
4%
4%
3%
1%
2%
1%
2%
0%
Agriculture, Forestry and Fishing
Health Care and Social Assistance
Retail Trade
Manufacturing
Education and Training
Accommodation and Food Services
Construction
Public Administration and Safety
Transport, Postal and Warehousing
Wholesale Trade
Professional, Scientific and Technical
Other Services
Financial and Insurance Services
Administrative and Support Services
Electricity, Gas, Water and Waste
Arts and Recreation Services
Rental, Hiring and Real Estate
Information Media and Telecoms
Mining
Employment 2011 (% total)
Great South Coast Victoria
Source: ABS Census 2011
16%
14%
8%
12%
2%
3%
18%
0%
11%
0%
2%
4%
0%
3%
0%
6%
0%
1%
0%
2%
19%
9%
10%
2%
11%
13%
2%
9%
0%
3%
5%
2%
5%
0%
6%
1%
1%
0%
Agriculture, Forestry and Fishing
Health Care and Social Assistance
Retail Trade
Manufacturing
Education and Training
Accommodation and Food Services
Construction
Public Administration and Safety
Transport, Postal and Warehousing
Wholesale Trade
Professional, Scientific and Technical
Other Services
Financial and Insurance Services
Administrative and Support Services
Electricity, Gas, Water and Waste
Arts and Recreation Services
Rental, Hiring and Real Estate
Information Media and Telecoms
Mining
Enrolments 2012 (% total)
Great South Coast Victoria
7%
7%
6%
5%
5%
3%
3%
3%
3%
3%
1%
2%
1%
3%
0%
8%
0%
0%
2%
5%
Earthmoving Plant Operator
Truck Driver
Mixed Crop and Livestock Farm Worker
Aged or Disabled Carer
Mixed Crop and Livestock Farmer
Office Manager
Butcher or Smallgoods Maker
Meat Process Worker
Electrician
Child Care Worker
Enrolments 2012 (% total)
Great South Coast Victoria

Regional Training Profiles
Victorian Training Market Quarterly Report Full Year 2012 177
Qualification profile
The latest Census (2011) reports that the Great South Coast region has a higher proportion of its workforce with lower levels of educational attainment than the Victorian average, with 46 per cent with no non-school qualifications, and 18 per cent with higher education qualifications, compared to the Victorian averages of 38 per cent and 30 per cent respectively.
However, a higher proportion of the workforce are qualified at Certificates III-IV than the state average (26 per cent, compared to 20 per cent), although there has been an 8 per cent decrease in enrolments in qualifications at this level between 2011 and 2012, compared to the average increase of 27 per cent across the state over the same time period.
Across the region, between 2011 and 2012 there has been a significant increase (73 per cent) in enrolments at the Certificate I-II level, which is much higher than the overall average increase across Victoria between the two years of 30 per cent. This is evidenced by two of the top five most popular courses at this level being Certificate II in General Education for Adults, and Certificate I in Vocational Preparation, both focusing on work readiness and employment skills.
The Certificates III in Civil Construction, Driving Operations and Agriculture were also very popular courses, and enrolments in these areas highlight the significance of these industries to the region.
Figure 9: Qualification trends – workforce and vocational training
Student profile Figure 10: Working age participation
52
Figure 10 highlights vocational training participation among different cohorts, comparing working age vocational training students resident in the Great South Coast with the region‟s working age resident population. Figures referred to in earlier charts and tables in this section relate to enrolments in the region by students that may or may not be resident in the region.
In 2012, 20 per cent of government subsidised vocational training students in the Great South Coast region were aged 45 or above, and 32 per cent were aged 15-19.
Overall, females are under-represented, making up 44 per cent of all students; while 9 per cent reported that they had a disability.
Sixteen per cent of students were unemployed, less than the overall average across Victoria of 23 per cent, and reflective of the lower than average unemployment rate in the region.
Students specifying they were Culturally and Linguistically Diverse (CALD) accounted for just 2 per cent, as did Indigenous students.
52
Note: disabled students appear disproportionally high due to different definitions of disability in use by the Australian Bureau
of Statistics and the Victorian VET Student Statistical Collection. Data for unemployed residents is restricted to the working age
population and factors in those not in the labour force and therefore does not match the regional unemployment rate in Figure 1.
Top qualifications 2012
Certificate II in General Education
for Adults3,800
Certificate I in Vocational
Preparation1,300
Certificate III in Civil Construction
Plant Operations700
Certificate III in Driving Operations 550
Certificate III in Agriculture 350
These 5 courses accounted for 44% of all
government funded training in the region
7,200 7,100
1,100
Cert I-II Cert III-IV Diploma & Above
Qualification level 2012(% change since 2011)
-8% -9%73%
46%
2%
26%
9%
18%
38%
1%
20%
11%
30%
No non-schoolqualifications
Cert I-II
Cert III-IV
Diploma +
Higher education
Workforce qualifications 2011
(% total)
Great South Coast Victoria
Source: ABS Census 2011
2%
9%
2%
44%
16%
32%
20%
2%
3%
1%
50%
3%
11%
45%
CALD
Disabled(see footnote)
Indigenous
Female
Unemployed(see footnote)
Youth (15-19)
Mature age (45+)
Working age students and population, % total
Students Population
Source (popn data): ABS Census 2011

Regional Training Profiles
178 Victorian Training Market Quarterly Report Full Year 2012
Geelong and Surrounds
Regional overview Geelong and Surrounds covers the four local government areas of Colac Otway, Greater Geelong, Queenscliffe and Surf Coast.
Home to 260,000 people in 2011, the Geelong and Surrounds area is the fastest growing region in Victoria outside of the Melbourne metropolitan area in terms of its population.
Economic and employment activity is mainly centred on Geelong, the second largest city in Victoria and the principal centre in the region for industry and service organisations.
Economy and outlook The economy of the Geelong and Surrounds region is varied and focused around the Manufacturing,
Agriculture, Horticulture, Aquaculture, Tourism, Education, Research, Health Care and Service sectors.
The traditional major heavy manufacturing base of Geelong is now diversifying. The city‟s bulk-handling port and the nearby Avalon airport, together with the rapidly improving road and rail links, are significant infrastructure assets for the region. These developments have resulted in a 12.8 per cent increase in the city‟s population between the 2001 and 2011 Census. The neighbouring Borough of Queenscliffe is primarily a residential and resort area.
As the major employment centre in the region, Geelong has benefited from a number of recent higher education investments in the area, such as Deakin‟s teaching hospital, a new Centre for Design and Engineering Training (CADET) at Deakin‟s Waurn Ponds Campus and The Gordon‟s Centre for Biotech, Sustainability and Living Well facility. The Northern Bay Secondary College campus is also the site of a new $12 million Geelong Industry Trade Training Centre.
The Golden Plains Shire to the north-west of Geelong has a strong agricultural focus, especially around intensive agriculture including pork and livestock, together with wool, canola, wheat and the vineyards in the Moorabool Valley. Although very rural in nature, the Shire actually has been attracting many new young families due to its proximity to the large employment centers of Geelong and Ballarat.
Employing around 9,500 people, Colac-Otway has an economy that is focused on Agriculture (employing 12 per cent of the workforce) and associated Food Processing, with employment in the Manufacturing sector at 12.7 per cent of the workforce. Population in the Shire has remained static over the last ten years at around 20,300.
The Surf Coast includes the townships of Torquay, Anglesea and Lorne along the Great Ocean Road. With a tourism-driven economy, a large proportion of the area is designated as State Forest and National Park, including beaches and coastline. Much of the rural area is used for farming, including viticulture.
Key training challenges for the region
Small static populations and thin markets, especially in the Colac-Otway local government area (LGA) provide ongoing challenges for training delivery.
Maximising on the region‟s key challenges and growth priorities for the future, outlined in the Regional Workforce Development Strategy.
A still strong Manufacturing sector, especially in Geelong, but with a need to diversify. Future enrolments may need to better align to the forward needs of this industry.
Enrolments in the Geelong and Surrounds region are also driven by the needs of LGAs outside of the Greater Geelong regions, including the Surf Coast and the Great South Coast region, where the focus of industry is concentrated much more on Retail, Tourism and Agriculture.
Environmental challenges for the area in the future may result in emerging industries with niche training needs.
Figure 1: Key indicators
Key indicators
2011G21
Regional
VictoriaVictoria
GRP growth
2001-11 2.9% 2.2% 3.5%
Employment growth
2001-11 2.4% 0.6% 1.0%
Population growth
2001-11 1.4% 0.7% 1.4%
Unemployment rate 5.2% 5.1% 5.4%
Labour force
participation rate 59.2% 58.5% 61.4%
Growth figures represent annual average growth rate 2001-2011
Source: RDV, ABS Census 2011. RDV figures include Golden Plains LGA.

Regional Training Profiles
Victorian Training Market Quarterly Report Full Year 2012 179
Regional training delivery53 There were 42,700 government subidised vocational
training enrolments in 2012 in Geelong and Sourrounds, making it Victoria‟s largest government subsidsed training market outside of metropolitan Melbourne.
Government subsidised training enrolments grew by 31 per cent from 2011, the highest growth of all rural regions, and the number of students also grew by 26 per cent.
113 providers were delivering training in the region in 2012 compared to 80 in 2011 – an additional 31 providers (a 38 per cent increase).
Although TAFE provision accounted for the most enrolments in 2012, there was significant growth in enrolments with ACE providers from 4,900 in 2011 to 11,200 in 2012, resulting in an increased market share to 26 per cent in 2012. This was primarily driven by increases in enrolments in health and community services, hospitality and retail.
Private RTOs have increased enrolments by 32 per cent between 2011 and 2012, from 11,500 to 15,200; although their market share has remained static at 36 per cent of enrolments (see Figure 4).
Figure 3: Regional training comparison
In 2012 there were 8,600 enrolments in apprenticeships/traineeships in the region, a 14 per cent increase on the previous year. The Geelong and Surrounds region currently accounts for 6 per cent of apprentice/trainee enrolments across Victoria.
Figure 4: Vocational training provider trends
Figure 5: Training delivery by LGA
53
Scope of data is nationally accredited and recognised training at AQF level 1 and above. Commentary refers to government
subsidised activity unless otherwise stated.
2008 2009 2010 2011 2012
Geelong and
Surrounds 14,900 16,000 20,300 32,700 42,700
Year-on-year %
change - 7% 27% 61% 31%
% change across
Victoria - 2% 17% 35% 25%
38%36%
26%
TAFE Private ACE
Provider share 2012(change in percentage points since 2011)
11%-12%
1
89
23
TAFE Private ACE
Number of providers 2012(% change since 2011)
51%10%
-50%
Local Government Area Enrolments 2012 % change 2011-2012Number of providers
2012% change 2011-2012
Student participation
rate %
Colac-Otway (S) 900 4% 19 46% 16%
Greater Geelong (C) 41,800 31% 94 49% 17%
Queenscliffe (B) 10 67% 3 0% 11%
Surf Coast (S) 30 175% 11 83% 13%
31%
96%
36%
26%
35%
0%
32%
130%
14%
Note: size of bars represents % growth 2011-12
42,700
6,100
48,800
32,800
15.3 million
16,300
15,200
11,200
8,600
Figure 2: Regional training dashboard 2012 vs. 2011
Gov't funded enrolments
Total enrolments (GF + TAFE FFS)
Hours
TAFE
Private
ACE
Apprentices / Trainees
TAFE FFS enrolments
Enrolments by provider
type
Students
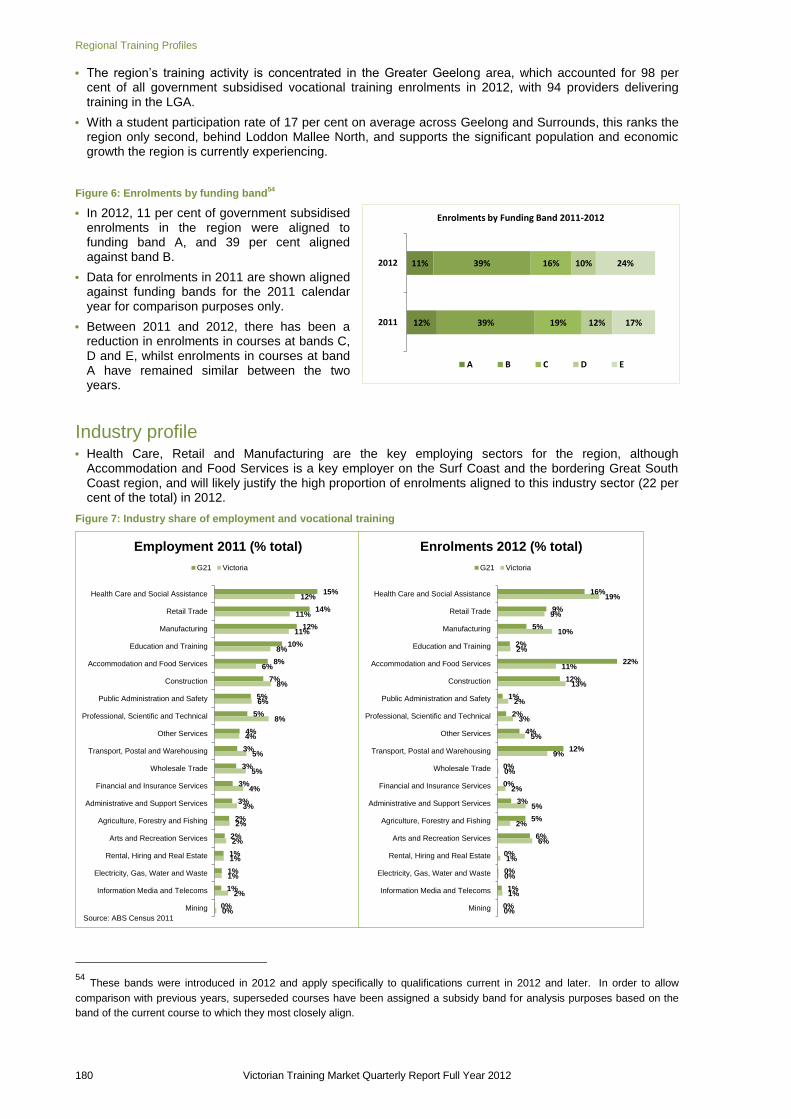
Regional Training Profiles
180 Victorian Training Market Quarterly Report Full Year 2012
The region‟s training activity is concentrated in the Greater Geelong area, which accounted for 98 per cent of all government subsidised vocational training enrolments in 2012, with 94 providers delivering training in the LGA.
With a student participation rate of 17 per cent on average across Geelong and Surrounds, this ranks the region only second, behind Loddon Mallee North, and supports the significant population and economic growth the region is currently experiencing.
Figure 6: Enrolments by funding band54
In 2012, 11 per cent of government subsidised enrolments in the region were aligned to funding band A, and 39 per cent aligned against band B.
Data for enrolments in 2011 are shown aligned against funding bands for the 2011 calendar year for comparison purposes only.
Between 2011 and 2012, there has been a reduction in enrolments in courses at bands C, D and E, whilst enrolments in courses at band A have remained similar between the two years.
Industry profile Health Care, Retail and Manufacturing are the key employing sectors for the region, although
Accommodation and Food Services is a key employer on the Surf Coast and the bordering Great South Coast region, and will likely justify the high proportion of enrolments aligned to this industry sector (22 per cent of the total) in 2012.
Figure 7: Industry share of employment and vocational training
54
These bands were introduced in 2012 and apply specifically to qualifications current in 2012 and later. In order to allow
comparison with previous years, superseded courses have been assigned a subsidy band for analysis purposes based on the
band of the current course to which they most closely align.
15%
14%
12%
10%
8%
7%
5%
5%
4%
3%
3%
3%
3%
2%
2%
1%
1%
1%
0%
12%
11%
11%
8%
6%
8%
6%
8%
4%
5%
5%
4%
3%
2%
2%
1%
1%
2%
0%
Health Care and Social Assistance
Retail Trade
Manufacturing
Education and Training
Accommodation and Food Services
Construction
Public Administration and Safety
Professional, Scientific and Technical
Other Services
Transport, Postal and Warehousing
Wholesale Trade
Financial and Insurance Services
Administrative and Support Services
Agriculture, Forestry and Fishing
Arts and Recreation Services
Rental, Hiring and Real Estate
Electricity, Gas, Water and Waste
Information Media and Telecoms
Mining
Employment 2011 (% total)
G21 Victoria
Source: ABS Census 2011
16%
9%
5%
2%
22%
12%
1%
2%
4%
12%
0%
0%
3%
5%
6%
0%
0%
1%
0%
19%
9%
10%
2%
11%
13%
2%
3%
5%
9%
0%
2%
5%
2%
6%
1%
0%
1%
0%
Health Care and Social Assistance
Retail Trade
Manufacturing
Education and Training
Accommodation and Food Services
Construction
Public Administration and Safety
Professional, Scientific and Technical
Other Services
Transport, Postal and Warehousing
Wholesale Trade
Financial and Insurance Services
Administrative and Support Services
Agriculture, Forestry and Fishing
Arts and Recreation Services
Rental, Hiring and Real Estate
Electricity, Gas, Water and Waste
Information Media and Telecoms
Mining
Enrolments 2012 (% total)
G21 Victoria
12%
11%
39%
39%
19%
16%
12%
10%
17%
24%
2011
2012
Enrolments by Funding Band 2011-2012
A B C D E

Regional Training Profiles
Victorian Training Market Quarterly Report Full Year 2012 181
The Transport, Postal and Warehousing sector attracted 12 per cent of enrolments in 2012, although the industry employs just 3 per cent of workers in the region. In particular, courses aligned to Truck Drivers accounted for 2,800 enrolments in 2012.
Manufacturing however attracted only 5 per cent (1,800) enrolments (although Manufacturing remains the largest contributor to the gross regional product), and there may be a case of under-representation in terms training uptake in this sector for the region.
Figure 8: Occupation share of vocational training (top 10)
There were 5,500 enrolments in Health Care and Social Assistance related courses in the region in 2012. In particular, courses aligning with Child Care Workers, Aged or Disabled Carers and Pharmacy Sales Assistants were popular.
The high proportion of enrolments in 2012 aligned to Waiter and Kitchen-hand occupations will be supportive of the tourism focus of the Surf Coast and neighbouring Great South Coast region.
1,400 enrolments in 2012 were aligned to Mixed Crop and Livestock Farm Worker occupations, highlighting the importance of the agricultural sector to the wider region.
Qualification profile Geelong and Surrounds has slightly lower levels of educational attainment than the Victorian average,
with 39 per cent of the workforce with no non-school qualifications, and 24 per cent with higher education qualifications, compared to the Victorian average of 30 per cent.
However, a higher proportion of the workforce are qualified at Certificates III-IV than the state average (24 per cent, compared to 20 per cent), and there has been a 31 per cent increase in enrolments in qualifications at this level between 2011 and 2012 (overall Victorian average was 27 per cent).
There has also been a significant increase in enrolments at the Certificate I-II level between 2011 and 2012 (a 42 per cent increase), which is higher than the overall average increase across Victoria for the same time period (30 per cent).
In 2012, two of the top five most popular courses were hospitality-related, highlighting the importance of the Tourism sector to this region (see Figure 9). Certificate III in Community Pharmacy was also in the top five most enrolled upon courses, and with 15 per cent of employment in the Health Care and Social Assistance sector (higher than the state average of 12 per cent), this gives some indication of vocational training enrolments in this sector aligning with industry needs.
The large number of enrolments in Certificate I in Vocational Preparation and a similarly high level of enrolments in Certificate II in General Education for Adults (not shown in Figure 9), indicates the demand in the region for the development of work-ready/employment skills.
Figure 9: Qualification trends – workforce and vocational training
Top qualifications 2012
Certificate III in Hospitality 4,000
Certificate III in Driving Operations 2,400
Certificate II in Hospitality 2,300
Certificate III in Community
Pharmacy1,700
Certificate I in Vocational
Preparation1,500
These 5 courses accounted for 28% of all
government funded training in the region
9,300
28,000
5,400
Cert I-II Cert III-IV Diploma & Above
Qualification level 2012(% change since 2011)
42% 31%
13%
39%
1%
24%
11%
24%
38%
1%
20%
11%
30%
No non-schoolqualifications
Cert I-II
Cert III-IV
Diploma +
Higher education
Workforce qualifications 2011 (%
total)
G21 Victoria
Source: ABS Census 2011
11%
7%
7%
5%
4%
4%
4%
4%
4%
3%
4%
2%
2%
0%
5%
8%
3%
1%
1%
2%
Waiter
Kitchenhand
Truck Driver
Pharmacy Sales Assistant
Child Care Worker
Office Manager
Aged or Disabled Carer
Earthmoving Plant Operator
Mixed Crop and Livestock Farm Worker
Fitness Instructor
Enrolments 2012 (% total)
G21 Victoria

Regional Training Profiles
182 Victorian Training Market Quarterly Report Full Year 2012
Student profile Figure 10: Working age participation
55
Figure 10 highlights vocational training participation among different cohorts, comparing working age vocational training students resident in Geelong and Surrounds with the region‟s working age resident population. Figures referred to in earlier charts and tables in this section relate to enrolments in the region by students that may or may not be resident in the region.
In 2012, 21 per cent of government subsidised vocational training students resident in the region were unemployed. This reflects to some degree the slightly higher than average levels of disadvantage in the region, but is broadly in line with the overall Victorian average for 2012 of 23 per cent.
Geelong and Surrounds has the highest proportion of students reporting a disability of all regions, at 10 per cent, compared to an overall average of 7 per cent across Victoria. Indigenous students represented 1 per cent of students, and Culturally and Linguistically Diverse (CALD) students accounted for 7 per cent, in line with what would be expected compared to the working age population overall in the area.
28 per cent of students resident in the region were aged 15-19 years, compared to an average of 25 per cent across Victoria, and 18 per cent of students were aged 45+ (the same as the Victorian average).
Case Study - Skilling the Bay:
Region: Barwon South East
Market Facilitation and Information
The problem
The Geelong region continues to face workforce challenges as a result of the global economic climate and subsequent industry restructuring.
The response
The Victorian Government has responded to these changes by implementing the three-year Skilling the Bay initiative involving both research and demonstration projects. A partnership between DEECD‟s Market Facilitation and Information division, the Gordon Institute of TAFE and Deakin University, Skilling the Bay is designed to grow existing and emerging industries in the Geelong region by linking future job creation to skill development.
A Labour Market Profile has been undertaken, which will map existing and future skills needs and training responses. This will inform discussions at the forthcoming Geelong Job Summit, with the ultimate goal of creating a Geelong Jobs Vision.
The outcome
The first demonstration project identified through the Profile will address unmet workforce demands in the home and community sector in the region, by linking retrenched and displaced workers into training and new employment opportunities in that sector. Skilling the Bay will become a blueprint for other regions in transition in the effective targeting of training to support job growth.
55
Note: disabled students appear disproportionally high due to different definitions of disability in use by the Australian Bureau
of Statistics and the Victorian VET Student Statistical Collection. Data for unemployed residents is restricted to the working age
population and factors in those not in the labour force and therefore does not match the regional unemployment rate in Figure 1.
7%
10%
1%
48%
21%
28%
18%
8%
3%
1%
51%
4%
10%
41%
CALD
Disabled(see footnote)
Indigenous
Female
Unemployed(see footnote)
Youth (15-19)
Mature age (45+)
Working age students and population, % total
Students Population
Source (popn data): ABS Census 2011

Regional Training Profiles
Victorian Training Market Quarterly Report Full Year 2012 183
Hume
Regional overview The Hume region is made up of twelve local government areas (LGAs), but from an economic and labour market perspective, the region is divided into four functional economic areas (FEAs): Goulbourn Valley, Lower Hume, Central Hume and Upper Hume.
According to the latest Census, the region is home to 262,600 people – almost 5 per cent of Victoria‟s total population. It extends from the New South Wales border in the north, covers the northern ranges of the Alpine National Park, down to Kingslake in the south and almost to Lake Eppalock in the east.
Economy and outlook Moira, Strathbogie and Greater Shepparton LGAs form the Goulburn Valley FEA. Industry and services
centre around Shepparton with strengths in food and vegetable processing, Agriculture, grazing, viticulture and forestry. The Goulburn Murray catchment is widely regarded as the food bowl of the Murray-Darling Basin. Shepparton-Mooroopna has a large Indigenous population and is characterised by cultural diversity resulting from past and recent settlement of migrants in the area. Although the FEA constitutes just over 38 per cent of the Hume region‟s gross regional product, productivity per worker is a particular issue, having changed little in the last ten years.
The LGAs of Alpine, Benalla, Mansfield and Wangaratta comprise the Central Hume FEA. Industry and services are mainly located in Wangaratta, which is home to 44 per cent of the FEA‟s population. Industry is concentrated on the Softwood Plantation Timber industry and Agriculture; while Tourism is important in areas such as Falls Creek, Mount Hotham, Mount Buller and Mount Sterling Alpine Resorts. The Health, Manufacturing and Retail sectors are also key contributors to the local economy and
employment.
The Lower Hume FEA is the smallest, and includes the LGAs of Mitchell and Murrindindi; Murrindindi Shire, in particular, was badly affected by the 2009 Black Saturday bushfires. Seymour is the largest settlement in the area, and industry is focused on Viticulture, Aquaculture, Agriculture and Timber. Manufacturing is also a key employer, particularly along the Hume Freeway and into Melbourne‟s northern suburbs. Lake Mountain Alpine Resort is a significant winter and summer tourism destination.
Towong, Indigo and Wodonga LGAs form the Upper Hume FEA. Wodonga has a strong Manufacturing base, defence force presence and strong linkages with Albury in New South Wales. The Hume Freeway and Melbourne-Sydney rail provide the basis for freight Transport and Logistics industries. Most employment growth in the last decade has been in Manufacturing and Construction. Grazing accounts for much of the agricultural land use, particularly in Towong and Indigo. Upper Hume also has a number of townships and other locations such as Rutherglen and Beechworth with food and wine, heritage, recreational and environmental values that are important for tourism.
Future challenges for the region have been identified as investigating the feasibility of developing renewable energy industries and power generation including solar power and bio-fuels; building agricultural research and development capabilities; agricultural production and value-added processing export opportunities; and building innovation capacity of export oriented firms through strengthening links between industry and Research & Development organisations, universities and TAFEs.
Key training challenges for the region
Agricultural training often requires „on-farm, „on-machine‟ delivery, which is a challenge in thin markets and remote rural areas.
Skills shortages remain in forestry-related occupations, especially silviculture workers and Truck Drivers.
There are emerging opportunities around renewable energy development and bio-fuels, as well as an on-going need for the agricultural sector to diversify and value-add.
Freight transport and logistics are important to the region, but Truck Drivers remain in shortage.
There are long lead-in times for certain occupations, such as Construction apprenticeships.
Figure 1: Key indicators
Key indicators
2011Hume
Regional
VictoriaVictoria
GRP growth
2001-11 2.2% 2.2% 3.5%
Employment growth
2001-11 0.4% 0.6% 1.0%
Population growth
2001-11 0.6% 0.7% 1.4%
Unemployment rate 4.9% 5.1% 5.4%
Labour force
participation rate 59.5% 58.5% 61.4%
Growth figures represent annual average growth rate 2001-2011
Source: RDV, ABS Census 2011

Regional Training Profiles
184 Victorian Training Market Quarterly Report Full Year 2012
Regional training delivery56 There were 30,800 government subsidised vocational
training enrolments in 2012 in Hume, of which 21,000 (68 per cent) were delivered through the two TAFE providers in the region.
Enrolments in training have increased by 24 per cent between 2011 and 2012; in line with the average across Victoria of 25 per cent (see Figure 3).
Enrolments with private training providers increased by 53 per cent between 2011 and 2012, and the number of private providers in the region increased from 61 to 86. Enrolments in private training provision now account for 23 per cent of enrolments in the region.
Although the share of enrolments with ACE providers has remained broadly static between 2011 and 2012 (at 9 per cent); the number of enrolments in ACE has increased by 18 per cent from 2,400 to 2,700 in 2012, while the number of providers has decreased from 33 to 32.
Figure 3: Regional training comparison
In 2012, 21 per cent of enrolments in the region were in apprenticeships/traineeships, slightly below the regional Victoria average of 24 per cent, but on a par with the state average of 22 per cent. With an increase of 18 per cent since 2011, Hume ranks 3
rd out of 13 regions for growth in apprentice/trainee
enrolments over the period.
Figure 4: Vocational training provider trends
At the Local Government Area (LGA) level, the majority of enrolments are concentrated around Greater Shepparton and Wodonga, which between them account for 66 per cent of enrolments.
Other than Strathbogie, which is predominantly a rural Shire, all LGAs have shown some increase in the number of providers operating in each area. However, there has been a reduction in enrolments from Indigo and Murrindindi (although from a small base), and no real change from 2011 to 2012 in Mansfield.
Student participation rates are lower than average in Alpine (11 per cent), Murrindindi (9 per cent) and Indigo (8 per cent); these Shires combined represent 14 per cent of Hume‟s total population. In comparison, participation is high in Greater Shepparton (at 18 per cent), compared to the average across the state (13 per cent), and the regional Victorian average (15 per cent).
56
Scope of data is nationally accredited and recognised training at AQF level 1 and above. Commentary refers to government
subsidised activity unless otherwise stated.
2008 2009 2010 2011 2012
Hume 21,500 20,900 21,000 24,800 30,800
Year-on-year %
change - -3% 1% 18% 24%
% change across
Victoria - 2% 17% 35% 25%
68%
23%
9%
TAFE Private ACE
Provider share 2012(change in percentage points since 2011)
-1%
4%
-4%
2
86
32
TAFE Private ACE
Number of providers 2012(% change since 2011)
41%-3%
24%
19%
23%
24%
47%
18%
53%
15%
18%
Note: size of bars represents % growth 2011-12
30,800
13,600
44,400
25,300
8.4 million
21,000
7,100
2,700
6,400
Figure 2: Regional training dashboard 2012 vs. 2011
Gov't funded enrolments
Total enrolments (GF + TAFE FFS)
Hours
TAFE
Private
ACE
Apprentices / Trainees
TAFE FFS enrolments
Enrolments by provider
type
Students

Regional Training Profiles
Victorian Training Market Quarterly Report Full Year 2012 185
Figure 5: Training delivery by LGA
Figure 6: Enrolments by funding band57
In 2012, 15 per cent of government subsidised enrolments in the Hume region were aligned to funding band A, and 48 per cent aligned against band B.
Data for enrolments in 2011 are shown aligned against funding bands for the 2011 calendar year for comparison purposes only.
Between 2011 and 2012, there has been a slight reduction in enrolments in courses at bands B and E, and broadly the same enrolment proportions in bands A, C and D.
Industry profile Figure 7: Industry share of employment and vocational training
57
These bands were introduced in 2012 and apply specifically to qualifications current in 2012 and later. In order to allow
comparison with previous years, superseded courses have been assigned a subsidy band for analysis purposes based on the
band of the current course to which they most closely align.
Local Government Area Enrolments 2012 % change 2011-2012Number of providers
2012% change 2011-2012
Student participation
rate %
Alpine (S) 250 35% 13 63% 11%
Benalla (RC) 2,100 198% 12 9% 15%
Greater Shepparton (C) 10,300 25% 58 41% 18%
Indigo (S) 40 -94% 7 75% 8%
Mansfield (S) 800 2% 6 50% 17%
Mitchell (S) 1,300 97% 25 56% 15%
Moira (S) 350 39% 15 67% 14%
Murrindindi (S) 100 -21% 8 14% 9%
Strathbogie (S) 200 129% 4 0% 13%
Towong (S) 250 63% 5 67% 12%
Wangaratta (RC) 5,000 33% 24 71% 15%
Wodonga (RC) 10,100 11% 28 75% 15%
14%
15%
51%
48%
18%
18%
4%
4%
12%
15%
2011
2012
Enrolments by Funding Band 2011-2012
A B C D E
14%
13%
12%
9%
9%
8%
7%
7%
4%
4%
4%
3%
2%
2%
1%
1%
1%
1%
0%
12%
11%
11%
2%
8%
6%
6%
8%
5%
4%
8%
5%
3%
4%
1%
1%
2%
2%
0%
Health Care and Social Assistance
Manufacturing
Retail Trade
Agriculture, Forestry and Fishing
Education and Training
Public Administration and Safety
Accommodation and Food Services
Construction
Transport, Postal and Warehousing
Other Services
Professional, Scientific and Technical
Wholesale Trade
Administrative and Support Services
Financial and Insurance Services
Electricity, Gas, Water and Waste
Rental, Hiring and Real Estate
Arts and Recreation Services
Information Media and Telecoms
Mining
Employment 2011 (% total)
Hume Victoria
Source: ABS Census 2011
18%
15%
6%
9%
3%
2%
6%
9%
10%
5%
3%
0%
2%
0%
0%
0%
10%
0%
1%
19%
10%
9%
2%
2%
2%
11%
13%
9%
5%
3%
0%
5%
2%
0%
1%
6%
1%
0%
Health Care and Social Assistance
Manufacturing
Retail Trade
Agriculture, Forestry and Fishing
Education and Training
Public Administration and Safety
Accommodation and Food Services
Construction
Transport, Postal and Warehousing
Other Services
Professional, Scientific and Technical
Wholesale Trade
Administrative and Support Services
Financial and Insurance Services
Electricity, Gas, Water and Waste
Rental, Hiring and Real Estate
Arts and Recreation Services
Information Media and Telecoms
Mining
Enrolments 2012 (% total)
Hume Victoria

Regional Training Profiles
186 Victorian Training Market Quarterly Report Full Year 2012
Health Care and Social Assistance, Manufacturing, Retail, Agriculture and Education are responsible for 57 per cent of employment in the region. Agriculture, in particular is of significantly more importance to the region than on average across Victoria.
18 per cent of course enrolments in Hume are aligned to the Health Care sector, 15 per cent to Manufacturing and 9 per cent to Agriculture related courses, meaning there is broad alignment between enrolments and employment at this level.
Other key sectors for vocational training such as Construction and Transport also show good enrolment levels as a proportion of all enrolments.
The top ten occupations attracting enrolments are aligned to those industries with the greatest levels of employment in the region, in particular, the Health sector.
In 2012, there were 1,000 enrolments in courses aligned to Child Care Worker occupations, 1,000 enrolments in Aged or Disabled Carer focused occupations and 950 for Enrolled Nurse occupations.
Figure 8: Occupation share of vocational training (top 10)
Courses aligned to the occupation of Ticket Collector or Usher are focused on Sports and Recreation.
Agricultural, Food Processing and General Truck Driving occupations were also in the top ten in terms of attracting enrolments into courses aligning with these occupations.
Qualification profile The latest Census (2011) reports that the Hume region has a higher proportion of its workforce with lower
levels of educational attainment than the Victorian average, with 44 per cent with no non-school qualifications, and 18 per cent with higher education qualifications, compared to the Victorian averages of 38 per cent and 30 per cent respectively.
However, a higher proportion of the workforce are qualified at Certificates III-IV than the state average (26 per cent, compared to 20 per cent), and there has been a 33 per cent increase in enrolments in qualifications at this level between 2011 and 2012, compared to the average increase of 27 per cent across the state over the same time period. Enrolments in Diploma and above level qualifications are also up 24 per cent, compared to the average increase across the state of 9 per cent.
Figure 9: Qualification trends – workforce and vocational training
At the Certificate I-II level, enrolments have increased by 11 per cent in the Hume region between 2011 and 2012; less than the average increase across Victoria between the two years of 30 per cent. However, the top five courses in terms of enrolments in the region in 2012 were all at Certificates I and II level.
Top qualifications 2012
Certificate I in Vocational
Preparation1,300
Certificate I in General Education
For Adults1,100
Certificate II in General Education
for Adults900
Certificate II in Food Processing 850
Certificate I in Sport and
Recreation800
These 5 courses accounted for 16% of all
government funded training in the region
9,400
17,500
3,900
Cert I-II Cert III-IV Diploma & Above
Qualification level 2012(% change since 2011)
11%
33% 24%
44%
2%
26%
10%
18%
38%
1%
20%
11%
30%
No non-schoolqualifications
Cert I-II
Cert III-IV
Diploma +
Higher education
Workforce qualifications 2011 (%
total)
Hume Victoria
Source: ABS Census 2011
6%
4%
4%
4%
4%
4%
4%
3%
3%
3%
1%
1%
5%
5%
8%
3%
1%
2%
1%
2%
Food and Drink Factory Workers
Ticket Collector or Usher
Sales Assistant
Child Care Worker
Office Manager
Aged or Disabled Carer
Enrolled Nurse
Warehouse Administrator
Mixed Crop and Livestock Farm Worker
Truck Driver
Enrolments 2012 (% total)
Hume Victoria

Regional Training Profiles
Victorian Training Market Quarterly Report Full Year 2012 187
According to the 2011 Census, only Greater Shepparton had an unemployment rate above the state average (5.5 per cent, compared to 5.4 per cent), but the top three courses in terms of enrolments in 2012 are all courses that focus on developing work readiness / employment skills.
Student profile
Figure 10: Working age participation58
Figure 10 highlights vocational training participation among different cohorts, comparing working age vocational training students resident in Hume with the region‟s working age resident population. Figures referred to in earlier charts and tables in this section relate to enrolments in the region by students that may or may not be resident in the region.
In 2012, 21 per cent of government subsidised vocational training students in the Hume region were aged 45 or above, and 28 per cent were aged 15-19. In comparison, these figures are in line with regional Victorian averages, and slightly higher than the averages across the state (18 per cent and 25 per cent respectively).
Overall, females made up 47 per cent of students, and 8 per cent reported that they had a disability.
17 per cent of students in Hume in 2012 were unemployed, less than the overall average across Victoria of 23 per cent, and reflective of the lower than average unemployment rate in the region.
Students specifying they were Culturally and Linguistically Diverse (CALD) accounted for 7 per cent, and Indigenous students accounted for 3 per cent.
58
Note: disabled students appear disproportionally high due to different definitions of disability in use by the Australian Bureau
of Statistics and the Victorian VET Student Statistical Collection. Data for unemployed residents is restricted to the working age
population and factors in those not in the labour force and therefore does not match the regional unemployment rate in Figure 1.
7%
8%
3%
47%
17%
28%
21%
6%
3%
2%
50%
4%
11%
44%
CALD
Disabled(see footnote)
Indigenous
Female
Unemployed(see footnote)
Youth (15-19)
Mature age (45+)
Working age students and population, % total
Students Population
Source (popn data): ABS Census 2011

Regional Training Profiles
188 Victorian Training Market Quarterly Report Full Year 2012
Gippsland
Regional overview Gippsland is located in the south east of Victoria and includes coastline extending from Phillip Island to the New South Wales border. The population is mainly centred in and around the Latrobe Valley and its main towns of Traralgon, Morwell and Moe-Newborough. Other important centres include Sale, Bairnsdale, Warragul, Wonthaggi, and Leongatha.
The region includes the local government areas (LGAs) of Bass Coast Shire, Baw Baw Shire, East Gippsland Shire, Latrobe City, South Gippsland Shire and Wellington Shire.
Economy and outlook The three largest contributors to Gippsland‟s gross regional product (GRP) are Agriculture, Forestry and
Fishing, food-related Manufacturing and utilities. This reflects the region‟s abundance of rich agricultural land and forests, as well as its commercial fishing operations and electricity and gas generation facilities.
Of Gippsland‟s major industries, Construction contributed significantly more to growth between 2001 and 2011 than any other industry. However, Construction is forecast to slow to longer-term trend levels as a
number of gas and oil projects and the desalination plant are completed.
Mining, especially offshore oil and gas extraction in the Shire of Wellington is also a strong contributor to GRP but a relatively small employer due to its capital intensiveness.
The high Australian dollar continues to put pressure on trade-exposed industries like Agriculture and Manufacturing, while the electricity generation sector is adjusting to demands for a low-carbon environment.
Economic growth in Gippsland has been below the average for regional Victoria and the rest of the state over the last decade. However, Gippsland South and Gippsland East have experienced relatively high economic growth rates.
Employment and population growth have been above the average for regional Victoria.
The region has experienced higher rates of structural change than regional Victorian as a whole. In particular, strong population growth and the desalination plant project in South Gippsland have directed resources into the Construction industry.
In order to expand and further diversify its industry base, the region faces challenges in terms of developing and retaining a skilled workforce. Retention of skilled workers within Gippsland is a particular challenge in the face of an increasingly mobile workforce and the skill 'pull' of the Mining industry in other states. The region will also have to address productivity improvements across all sectors and lower levels of workforce participation in some areas.
Key training challenges for the region
Gippsland is experienced a drop in government subsidised training in 2012. The drivers for this decrease need to be understood, as well as its impact on the region‟s employers.
Linked to this is the region‟s low student participation rate in vocational training. Building participation will be a key challenge for the region‟s training market going forwards, by expanding opportunities for young people to engage with tertiary education locally and improving the pathways between TAFEs and universities.
The Gippsland Tertiary Education Council promotes co-ordination between education and training providers, regional employers and local networks to develop an accessible, flexible and responsive tertiary education system and provides opportunities to address vocational training participation levels in the region.
Figure 1: Key indicators
Key indicators
2011Gippsland
Regional
VictoriaVictoria
GRP growth
2001-11 2.0% 2.2% 3.5%
Employment growth
2001-11 0.7% 0.6% 1.0%
Population growth
2001-11 0.8% 0.7% 1.4%
Unemployment rate 5.7% 5.1% 5.4%
Labour force
participation rate 56.0% 58.5% 61.4%
Growth figures represent annual average growth rate 2001-2011
Source: RDV, ABS Census 2011

Regional Training Profiles
Victorian Training Market Quarterly Report Full Year 2012 189
Regional training delivery59 There were 16,700 government subsidised vocational
training enrolments in Gippsland in 2012. There was 9,500 fee for service enrolments at TAFE providers.
Gippsland declined in enrolments over the year by -7 per cent. This was offset, however, by growth in TAFE fee for service enrolments of 10 per cent.
The fall in enrolments was largely driven by declines in Certificate I in Work Education, Certificate I in Vocational Preparation and Certificate II in Building and Construction.
101 providers delivered government subsidised training in the region in 2012, up from 81 in 2011. This was by an increase in the number of private providers, and Gippsland had the largest growth in enrolments with private providers of all the regions (68 per cent).
TAFEs accounted for 64 per cent of all enrolments in the region in 2012.
Figure 3: Regional training comparison
However, while the enrolments share of private providers almost doubled between 2011 and 2012 (up by 11 percentage points to 24 per cent), it is under the average for regional Victoria (33 per cent).
The Bass Coast LGA experienced the largest increase in enrolments in 2012, while the region‟s training activity is concentrated in the Latrobe LGA, accounting for 36 per cent of enrolments.
Figure 4: Vocational training provider trends
59
Scope of data is nationally accredited and recognised training at AQF level 1 and above. Commentary refers to government
subsidised activity unless otherwise stated.
2008 2009 2010 2011 2012
Gippsland 17,400 16,300 18,500 17,900 16,700
Year-on-year % change - -6% 13% -3% -7%
% change across Victoria - 2% 17% 35% 25%
64%
24%
12%
TAFE Private ACE
Provider share 2012(change in percentage points since 2011)
11%-10%
4
65
32
TAFE Private ACE
Number of providers 2012(% change since 2011)
44%
-7%
10%
-1%
-3%
11%
-20%
68%
-7%
3%
Note: size of bars represents % growth 2011-12
16,700
9,500
26,200
13,900
4.9 million
10,700
4,000
2,000
4,300
TAFE
Total enrolments
Hours
Figure 2: Regional training dashboard 2012 vs. 2011
Gov't funded enrolments
Private
ACE
Apprentices / Trainees
TAFE FFS enrolments
Enrolments by provider
type
Students

Regional Training Profiles
190 Victorian Training Market Quarterly Report Full Year 2012
Figure 5: Training delivery by LGA
Figure 6: Enrolments by funding band
60
In 2012, 18 per cent of government subsidised enrolments in the Gippsland region were aligned to funding band A, and 40 per cent aligned against band B.
Data for enrolments in 2011 are shown aligned against funding bands for the 2011 calendar year for comparison purposes only.
Between 2011 and 2012, there has been an increase in enrolments against band C courses, a reduction in band A courses, and a broadly similar picture across band B, D and E courses.
Industry profile The top three employing industries in the region, Health Care and Social Assistance, Retail Trade and
Construction, account for 34 per cent of employment in Gippsland. Vocational training aligned to these industries accounts for 49 per cent of enrolments, indicating alignment between regional training delivery and Gippsland‟s changing labour market.
Health Care and Social Assistance is the largest industry in terms of training delivery. It has also seen the highest enrolment growth in 2012, with enrolments increasing by 24 per cent (600 enrolments).
Strong growth in Construction training seen in recent years has begun to slow, with enrolments down by 9 per cent (or 250 enrolments). This is in line with anticipated slowdown in Construction growth to longer-term trend levels as a number of gas and oil projects and the desalination plant are completed.
Enrolments in Arts and Recreation Services have seen the greatest decline in 2012, down by 30 per cent (approximately 350 enrolments).
60
These bands were introduced in 2012 and apply specifically to qualifications current in 2012 and later. In order to allow
comparison with previous years, superseded courses have been assigned a subsidy band for analysis purposes based on the
band of the current course to which they most closely align.
Local Government Area Enrolments 2012 % change 2011-2012Number of providers
2012% change 2011-2012
Student participation
rate %
Bass Coast (S) 1,600 75% 15 15% 11%
Baw Baw (S) 2,200 10% 18 38% 10%
East Gippsland (S) 2,800 -20% 22 47% 13%
Latrobe (C) 6,000 2% 44 38% 13%
South Gippsland (S) 1,600 24% 16 45% 12%
Wellington (S) 2,600 -40% 17 31% 11%
23%
18%
40%
40%
20%
23%
5%
6%
11%
12%
2011
2012
Enrolments by Funding Band 2011-2012
A B C D E

Regional Training Profiles
Victorian Training Market Quarterly Report Full Year 2012 191
Figure 7: Industry share of employment and vocational training
Figure 8: Occupation share of vocational training (top 10)
Key training occupations in the Gippsland region are well aligned with the main industry employers, with 8 out of the top 10 occupations of enrolment aligned to the region‟s top 5 employing industries.
Enrolments aligned to the occupation Aged or Disabled Carer account for the highest proportion of training in the region, positioning the region well to deliver the services needed by its population into the future.
Enrolments in courses associated with Forestry Workers and Mixed Crop and Livestock Farmers also account for an above average proportion of the training market in Gippsland, highlighting the continuing importance of the Agriculture, Forestry and Fishing industry as a regional employer.
13%
12%
9%
9%
9%
9%
7%
6%
4%
4%
3%
3%
3%
2%
2%
1%
1%
1%
1%
12%
11%
8%
8%
2%
11%
6%
6%
4%
8%
5%
5%
1%
3%
4%
2%
0%
1%
2%
Health Care and Social Assistance
Retail Trade
Construction
Education and Training
Agriculture, Forestry and Fishing
Manufacturing
Accommodation and Food Services
Public Administration and Safety
Other Services
Professional, Scientific and Technical
Transport, Postal and Warehousing
Wholesale Trade
Electricity, Gas, Water and Waste
Administrative and Support Services
Financial and Insurance Services
Arts and Recreation Services
Mining
Rental, Hiring and Real Estate
Information Media and Telecoms
Employment 2011 (% total)
Gippsland Victoria
Source: ABS Census 2011
24%
7%
18%
4%
7%
7%
7%
1%
7%
1%
6%
0%
0%
3%
0%
6%
0%
0%
19%
9%
13%
2%
2%
10%
11%
2%
5%
3%
9%
0%
0%
5%
2%
6%
1%
1%
Health Care and Social Assistance
Retail Trade
Construction
Education and Training
Agriculture, Forestry and Fishing
Manufacturing
Accommodation and Food Services
Public Administration and Safety
Other Services
Professional, Scientific and Technical
Transport, Postal and Warehousing
Wholesale Trade
Electricity, Gas, Water and Waste
Administrative and Support Services
Financial and Insurance Services
Arts and Recreation Services
Rental, Hiring and Real Estate
Information Media and Telecoms
Enrolments 2012 (% total)
Gippsland Victoria
6%
5%
5%
4%
3%
3%
3%
2%
2%
2%
3%
8%
5%
5%
4%
2%
0%
0%
1%
0%
Aged or Disabled Carer
Office Manager
Child Care Worker
Sales Assistant
General Clerk
Carpenter
Teachers' Aide
Forestry Worker
Enrolled Nurse
Mixed Crop and Livestock Farmer
Enrolments 2012 (% total)
Gippsland Victoria

Regional Training Profiles
192 Victorian Training Market Quarterly Report Full Year 2012
Qualification profile Gippsland has lower levels of educational attainment than Victoria as a whole. 43 per cent of the
workforce has no post-school qualifications compared to an average of 38 per cent across Victoria.
However, vocational training enrolments in Gippsland are at relatively high qualification levels. Compared to the rest of regional Victoria, Gippsland has the lowest proportion of enrolments in Certificate I-II (18 per cent), the highest proportion of vocational training enrolments in Certificate III-IV (68 per cent), and an above average proportion of enrolments in Diplomas and above (14 per cent).
Over the last five years, enrolments in Gippsland have become increasingly focused in higher level vocational training qualifications (excluding higher education). By qualification level, the strongest growth in percentage terms was in Diploma level and above enrolments, followed by the Certificate III-IV level. Only enrolments at Certificate I-II level have fallen. This trend will continue to help the workforce to operate successfully in a more competitive and diversified economy.
Figure 9: Qualification trends – workforce and vocational training
Student profile Figure 10: Working age participation
61
Figure 10 highlights vocational training participation among different cohorts, comparing working age vocational training students resident in Gippsland with the region‟s working age resident population. Figures referred to in earlier charts and tables in this section relate to enrolments in the region by students that may or may not be resident in the region.
The level of vocational training engagement of higher need learners in Gippsland is consistent with the average for regional Victoria, and largely consistent with the population shares of higher need persons.
On the upside, the share of working-age resident students who were disabled, Indigenous, unemployed or 15–19 years old, exceeded the share of these groups in the general population.
61
Note: disabled students appear disproportionally high due to different definitions of disability in use by the Australian Bureau
of Statistics and the Victorian VET Student Statistical Collection. Data for unemployed residents is restricted to the working age
population and factors in those not in the labour force and therefore does not match the regional unemployment rate in Figure 1.
4%
9%
2%
49%
19%
28%
18%
4%
4%
1%
51%
4%
11%
45%
CALD
Disabled(see footnote)
Indigenous
Female
Unemployed(see footnote)
Youth (15-19)
Mature age (45+)
Working age students and population, % total
Students Population
Source (popn data): ABS Census 2011
Top qualifications 2012
Certificate III in Children's
Services600
Certificate III in General
Education for Adults550
Certificate III in Aged Care 500
Certificate I in General Education
For Adults400
Diploma of Management 350
These 5 courses accounted for 14% of all
government funded training in the region
3,100
11,300
2,300
Cert I-II Cert III-IV Diploma & Above
Qualification level 2012(% change since 2011)
-52%18% 20%
43%
2%
28%
10%
18%
38%
1%
20%
11%
30%
No non-schoolqualifications
Cert I-II
Cert III-IV
Diploma +
Higher education
Workforce qualifications 2011 (%
total)
Gippsland Victoria
Source: ABS Census 2011

Regional Training Profiles
Victorian Training Market Quarterly Report Full Year 2012 193
Case Study: Developing stronger connections between industry and training
Region: Gippsland
Regional Market Facilitation Manager: Mark Longmuir
The problem
The consultations undertaken during the development of the Gippsland Tertiary Education Plan in 2011 identified a need for Gippsland‟s tertiary education provision to be more responsive to the significant economic and demographic changes in the region.
The response
The Gippsland Tertiary Education Council (the Council) was formed in 2012 to lead the alignment of tertiary education provision to industry needs, and to help influence educational participation and attainment in the region. The Council is comprised of individuals with expertise and knowledge of Gippsland‟s community, industry and education providers. It conducted its first open forum with Gippsland industry in January 2013 and is currently finalising its strategic plan.
The Gippsland Regional Market Facilitation Manager functions as the Secretariat for Council, and also works to ensure that it is well connected to the supports, programs and people in Gippsland that are integral to its success.
The outcome
The Council will support a series of strategic collaborative projects that will see training providers and industry working together to build a strong, flexible and responsive local tertiary sector. These projects will facilitate strong relationships between tertiary education providers and employers to ensure that education and training delivers positive employment and productivity outcomes for Gippsland.

Regional Training Profiles
194 Victorian Training Market Quarterly Report Full Year 2012
Northern Metropolitan
Regional overview Northern Metropolitan is home to approximately 785,000 people, or one fifth of Melbourne‟s total population. Comprising a mixture of urban and rural local government areas, the region has experienced very strong population growth in recent years, particularly in its outer areas. It has a culturally diverse population and varying levels of prosperity and disadvantage across the region.
The region includes the local government areas of Banyule, Darebin, Hume, Moreland, Nillumbik and Whittlesea.
Economy and outlook The Northern Metropolitan economy continues to undergo a period of transition. With traditional strength
in Manufacturing, the region has been developing a knowledge economy, particularly in its inner local government areas, which are home to educational and research precincts. Manufacturing remains the
largest industry employer, however (see Figure 7), while the Transport, Logistics and Warehousing sectors are important in a region which includes Melbourne Airport and is considered the northern gateway to Melbourne.
Manufacturing in Melbourne‟s North is itself experiencing restructure; Automotive, Food Processing and Chemicals are the three largest Manufacturing sub-sectors, each facing a different outlook.
Automotive is undergoing sustained pressure from global competition, while Food Processing will potentially benefit from cluster opportunities presented by infrastructure developments and the relocation of the Melbourne Wholesale Fruit and Vegetable Market to Epping. Chemical Manufacturing, with its links to research and development and higher level skills requirements, is aligned with the region‟s wider transition to a knowledge based economy.
Northern Metropolitan has the second highest unemployment rate across the Melbourne regions. Unemployment and low participation rates are a particular issue for young people in the region‟s disadvantaged areas.
The region has seen rapid population growth, particularly in the outer areas of Hume and Whittlesea, and this is forecast to continue into the future. Ensuring adequate employment, infrastructure and amenities are developed in line with the unprecedented growth is a regional priority. While new jobs are being added to the region, they tend to be higher skilled, while those being lost are more likely to be lower skilled.
Developing lifelong learning opportunities will be key to building the skills of local residents and creating pathways to employment for the region‟s youth, new migrants, low skilled and unemployed residents.
Key training challenges for the region
Continuing to provide opportunities for workers facing retrenchment to retrain and refresh their skills, in order to facilitate successful transition into alternative industry employment in the region.
Supporting skills deepening among the resident population to increase alignment with the higher level skills increasingly needed by local industry. Despite pockets of high unemployment, the region is experiencing skill shortages – particularly in higher level technical skills associated with advanced Manufacturing and engineering.
Ongoing development of linkages between industry, schools and training providers to create pathways to employment, ensuring that the training on offer matches local job opportunities.
Promoting awareness of the training system and what it has to offer among local employers, to enable them to tailor training to ensure it addresses their specific needs.
Figure 1: Key indicators
Key indicators
2011
Northern
Metrpolitan
Metro
MelbourneVictoria
Employment 367,825 1,898,861 2,530,627
Northern Melbourne
% total - 19.4% 14.5%
Population 784,808 3,940,802 5,354,039
Northern Melbourne
% total - 19.9% 14.7%
Unemployment rate 5.6% 5.5% 5.4%
Labour force
participation rate 61.4% 62.5% 61.4%
Source: ABS Census 2011

Regional Training Profiles
Victorian Training Market Quarterly Report Full Year 2012 195
Regional training delivery62 There were 68,400 government subsidised
vocational training enrolments in 2012. This is the second smallest government subsidised training market in Metropolitan Melbourne.
TAFE Institutes deliver the majority of training in this region, accounting for 65 per cent of enrolments in 2012. With 44,500 enrolments, TAFE provision in Northern Metropolitan is the highest in the state.
Enrolments with private and ACE providers, on the other hand, are low relative to other Metropolitan Melbourne regions.
TAFE enrolment growth continues to be strong, increasing 33 per cent over the last 12 months, the highest growth rate in Metropolitan Melbourne. ACE enrolment growth, on the other hand, is the lowest in Melbourne, with growth of 4 per cent in 2012.
Despite overall enrolment growth, apprentice and trainee enrolments in the region have remained flat.
170 providers delivered training into the region, an increase of 22 since 2011.
Figure 3: Regional training comparison
Figure 4: Vocational training provider trends
Figure 5: Training delivery by LGA
While there are high numbers of training providers across each Local Government Area (LGA), the
region‟s main TAFE providers are located in Darebin and Hume. Training activity is concentrated in these two LGAs, accounting for just over two thirds of the region‟s enrolments in 2012.
The region‟s student participation rate of 13 per cent is slightly higher than the Melbourne Metro average of 12 per cent; Hume and Whittlesea in particular have a relatively high participation rate, while Nillumbik is much lower than average (at 9 per cent).
62
Scope of data is nationally accredited and recognised training at AQF level 1 and above. Commentary refers to government
subsidised activity unless otherwise stated.
2008 2009 2010 2011 2012
Northern Metro 32,000 39,200 40,800 50,800 68,400
Year-on-year %
change - 22% 4% 24% 35%
% change across
Victoria - 2% 17% 35% 25%
65%
31%
4%
TAFE Private ACE
Provider share 2012(change in percentage points since 2011)
2%-1%
4
135
31
TAFE Private ACE
Number of providers 2012(% change since 2011)
19%-1%
Local Government Area Enrolments 2012 % change 2011-2012Number of providers
2012% change 2011-2012
Student participation
rate %
Banyule (C) 7,200 9% 49 36% 10%
Darebin (C) 20,500 46% 58 29% 10%
Hume (C) 25,900 43% 81 33% 18%
Moreland (C) 8,300 23% 55 49% 11%
Nillumbik (S) 350 21% 20 11% 9%
Whittlesea (C) 6,500 22% 60 46% 16%
35%
7%
29%
20%
24%
33%
44%
4%
0%
Note: size of bars represents % growth 2011-12
68,400
12,700
81,100
50,800
18.2 million
44,500
21,100
2,800
12,100
Figure 2: Regional training dashboard 2012 vs. 2011
Gov't funded enrolments
Total enrolments (GF + TAFE FFS)
Hours
TAFE
Private
ACE
Apprentices / Trainees
TAFE FFS enrolments
Enrolments by provider
type
Students

Regional Training Profiles
196 Victorian Training Market Quarterly Report Full Year 2012
Figure 6: Enrolments by funding band63
In 2012, 13 per cent of government subsidised enrolments in the Northern Metro region were aligned to funding band A, and 45 per cent aligned against band B.
Data for enrolments in 2011 are shown aligned against funding bands for the 2011 calendar year for comparison purposes only.
Between 2011 and 2012, there has been an increase in enrolments against band B courses and a reduction in enrolments in courses at bands A, C and E.
Industry profile Manufacturing remains the major employing industry in the region, accounting for 16 per cent of
employment. This is followed by Health Care and Social Assistance and Retail Trade.
Figure 7: Industry share of employment and vocational training
Three of the top five employing industries are also in the top five in terms of training delivery – Health Care and Social Assistance, Transport, Postal and Warehousing and Manufacturing – indicating some alignment between the training market and employment demand in these areas. Other key industries in terms of training delivery include Construction and Accommodation and Food Services, also key employers in Northern Metropolitan.
Health Care and Social Assistance is the largest training industry, with over 9,200 enrolments in 2012. Health care has also seen the highest growth in the region, 2,700 additional enrolments in 2012 compared with 2011.
Accommodation and Food Services and Transport, Postal and Warehousing enrolments have also seen strong growth in 2011, up by 2,300 and 1,100 respectively. Higher level hospitality courses have been the driver for growth in courses aligned to the Accommodation and Food Services industry, with enrolments in
63
These bands were introduced in 2012 and apply specifically to qualifications current in 2012 and later. In order to allow
comparison with previous years, superseded courses have been assigned a subsidy band for analysis purposes based on the
band of the current course to which they most closely align.
16%
13%
12%
10%
8%
8%
6%
5%
5%
4%
4%
2%
1%
1%
1%
1%
1%
0%
0%
11%
12%
11%
8%
5%
8%
6%
5%
6%
8%
4%
3%
4%
1%
2%
2%
1%
2%
0%
Manufacturing
Health Care and Social Assistance
Retail Trade
Education and Training
Transport, Postal and Warehousing
Construction
Accommodation and Food Services
Wholesale Trade
Public Administration and Safety
Professional, Scientific and Technical
Other Services
Administrative and Support Services
Financial and Insurance Services
Rental, Hiring and Real Estate
Arts and Recreation Services
Information Media and Telecoms
Electricity, Gas, Water and Waste
Agriculture, Forestry and Fishing
Mining
Employment 2011 (% total)
Northern Metro Victoria
Source: ABS Census 2011
11%
21%
5%
2%
13%
13%
14%
0%
3%
4%
5%
3%
1%
0%
3%
1%
0%
1%
0%
10%
19%
9%
2%
9%
13%
11%
0%
2%
3%
5%
5%
2%
1%
6%
1%
0%
2%
0%
Manufacturing
Health Care and Social Assistance
Retail Trade
Education and Training
Transport, Postal and Warehousing
Construction
Accommodation and Food Services
Wholesale Trade
Public Administration and Safety
Professional, Scientific and Technical
Other Services
Administrative and Support Services
Financial and Insurance Services
Rental, Hiring and Real Estate
Arts and Recreation Services
Information Media and Telecoms
Electricity, Gas, Water and Waste
Agriculture, Forestry and Fishing
Mining
Enrolments 2012 (% total)
Northern Metro Victoria
19%
13%
32%
45%
28%
25%
8%
8%
13%
8%
2011
2012
Enrolments by Funding Band 2011-2012
A B C D E

Regional Training Profiles
Victorian Training Market Quarterly Report Full Year 2012 197
Certificate III to Advanced Diploma levels in Hospitality almost doubling between 2011 and 2012. Courses in driving operations and road Transport are the most popular in the Transport industry, followed by Warehousing (accounting for 47 per cent and 35 per cent of industry enrolments respectively).
Manufacturing enrolments courses continue to grow, up by 10 per cent in 2012 to 5,000. Manufacturing is the fifth largest training industry in Northern Metropolitan, with the most popular areas of study being competitive manufacturing and process manufacturing. Growth has been driven by competitive manufacturing courses, supporting the region‟s Manufacturing businesses to incorporate lean production principles in the workplace.
Figure 8: Occupation share of vocational training (top 10)
Children‟s services courses are the most popular in the region, with enrolments aligned to the occupation Child Care Worker accounting for 10 per cent of all occupations (and approximately half the total enrolments in health care courses).
The proportion of enrolments linked to Child Care Workers, Café or Restaurant Managers and Truck Drivers are significantly above average in Northern Metropolitan when compared to the Victorian average, indicating strong regional demand for skills in these areas.
Qualification profile The Northern Metropolitan regional workforce has lower levels of educational attainment than the
Victorian average, although the levels of vocational education attainment of its workforce are in line with the state averages.
The most popular courses in Northern Metropolitan are foundation level courses in General Education for Adults, indicating the important role Vocational training plays in this region in providing people with the skills they need to participate in the workplace.
The strong growth in Certificate I-II level enrolments also suggests the regional training market is supporting students to develop workforce entry-level skills. While enrolment growth for Certificate III level and above qualifications is below the overall growth rate in Northern Metropolitan (35 per cent in 2012), increasing numbers are enrolling in higher level courses in line with the region‟s need for skills deepening among its resident population.
Figure 9: Qualification trends – workforce and vocational training
Top qualifications 2012
Certificate I in General Education
for Adults (Introductory)7,700
Certificate I in General Education
For Adults4,600
Certificate IV in Hospitality 3,000
Certificate III in Children's Services 2,800
Certificate III in Driving Operations 2,200
These 5 courses accounted for 30% of all
government funded training in the region
22,400
36,400
9,600
Cert I-II Cert III-IV Diploma & Above
Qualification level 2012(% change since 2011)
78% 19% 27%
40%
1%
20%
11%
27%
38%
1%
20%
11%
30%
No non-schoolqualifications
Cert I-II
Cert III-IV
Diploma +
Higher education
Workforce qualifications 2011 (%
total)
Northern Metro Victoria
Source: ABS Census 2011
10%
10%
5%
4%
4%
3%
3%
3%
3%
3%
5%
2%
2%
3%
8%
2%
2%
5%
2%
4%
Child Care Worker
Cafe or Restaurant Manager
Truck Driver
Aged or Disabled Carer
Office Manager
Engineering Production Worker
Electrician
Sales Assistant
Factory Process Workers
General Clerk
Enrolments 2012 (% total)
Northern Metro Victoria

Regional Training Profiles
198 Victorian Training Market Quarterly Report Full Year 2012
Student profile Figure 10: Working age participation
64
Figure 10 highlights vocational training participation among different cohorts, comparing working age vocational training students resident in Northern Metropolitan with the region‟s working age resident population. Figures referred to in earlier charts and tables in this section relate to enrolments in the region by students that may or may not be resident in the region.
The proportion of Culturally and Linguistically Diverse (CALD) residents in Northern Metropolitan is the second highest in Victoria (after Western Metropolitan). This high proportion is reflected in the region‟s student population, with CALD students making up 35 per cent of resident student numbers.
The number of unemployed students has increased by 27 per cent between 2011 and 2012, to over 16,500 (almost one quarter of students resident in the region). This growth rate is higher than total student growth of 13 per cent across the same period, highlighting the role of the Vocational training system in supporting people to enter or return to the workforce.
At 48 per cent of resident working age students, female participation in Northern Metropolitan is the lowest in Metropolitan Melbourne. It has increased since 2011, however, when women made up 46 per cent of students.
Case Study - Meeting demand for third-party skills recognition: Region: Northern Metropolitan
Regional Market Facilitation Manager: Ian McMillan
The problem
A small-to-medium business subcontracting to major civil contractors approached Regional Market Facilitation Manager Ian McMillan when it needed staff with nationally recognised qualifications in order to gain access to a particular worksite.
The response
Discussions revealed that, while the business had recognised the need for - and implemented - quality systems and OHS systems to monitor its operational processes, it had not addressed the increasing demand in their industry sector for third-party recognition of contract workers skills.
The outcome
McMillan is assisting the business to identify an appropriate training qualification that meets their needs, a training provider who can deliver that qualification, and providing advice on traineeships and accessing the Victorian Training Guarantee. From here, he will assist the business to build a comprehensive training and development plan that covers all permanent and casual employees and includes appropriate qualification(s), review cycles and training delivery and assessment methods.
64
Note: disabled students appear disproportionally high due to different definitions of disability in use by the Australian Bureau
of Statistics and the Victorian VET Student Statistical Collection. Data for unemployed residents is restricted to the working age
population and factors in those not in the labour force and therefore does not match the regional unemployment rate in Figure 1.
35%
6%
1%
48%
24%
23%
17%
35%
3%
1%
51%
4%
9%
34%
CALD
Disabled(see footnote)
Indigenous
Female
Unemployed(see footnote)
Youth (15-19)
Mature age (45+)
Working age students and population, % total
Students Population
Source (popn data): ABS Census 2011

Regional Training Profiles
Victorian Training Market Quarterly Report Full Year 2012 199
Southern Metropolitan
Regional overview The Southern Metropolitan region has a population of 1.1 million people and covers eight Local Government Areas (LGA); these include the primarily residential areas of Glen Eira and Bayside to the south/south east of the city, as well as Kingston, Cardinia, Casey, Frankston, Greater Dandenong, and the Mornington Peninsula.
The City of Casey and the Shires of Cardinia and Mornington Peninsula have some of the most productive agricultural land in Victoria, and Western Port is also an UNESCO declared biosphere. The Mornington Peninsula has a strong tourism base, as well as being one of Victoria‟s major wine producing regions.
Economy and outlook The Cities of Dandenong and Frankston have been designated as Central Activities Areas (CAAs). These
are nominated metropolitan and regional centres where housing, employment and commercial development will take place, allowing Melbourne to move away from one centre (the Central Business
District) to a number of centres. Frankston is developing an urban renewal strategy to this end, and Dandenong has received a significant investment of government funds in infrastructure, redevelopment and land acquisition.
Greater Dandenong is home to most of the region‟s large employers with an economy focused around Manufacturing and Wholesaling.
Manufacturing in particular is a key driver of the region's prosperity. The local industry has undergone significant change over the last 20 years, with technological change, global competition and the movement towards high value manufacturing leading to a corresponding decline in low value manufacturing and increased innovation.
Almost half the population was born in non-English speaking countries, and the area is characterised by pockets of high unemployment (8.9 per cent on average across the LGA) and persistent social disadvantage.
The Port of Hastings, located on the Mornington Peninsula, has future potential as Melbourne‟s second port and Blue Scope Steel, located next to the port is a large Manufacturing employer in the area. The Shire is characterised by an ageing population, with 21.5 per cent of residents aged 65 and above.
Casey (includes Cranbourne) and Cardinia (includes Pakenham) are experiencing significant residential expansion, and will face major infrastructure and service provision challenges over the next decade.
Bayside, one of the region‟s most affluent areas is host to the Commonwealth Scientific and Industrial Research Organisation (CSIRO), Australia's national science agency and one of the largest and most diverse research agencies in the world. Glen Eira houses the Caulfield Campus of Monash University and Caulfield Racecourse.
The City of Kingston includes industrial nodes around Moorabbin, Braeside, Moorabbin Airport and Clayton South, as well as significant areas of primary industry, such as high-value Horticulture, Flower Cultivation and Quarrying. There are also substantial areas designated for leisure and environmental value, including golf courses and wetlands.
Major emerging priorities for the region include Transport and infrastructure development, especially the need for radial connections servicing the CAAs and outer parts of the region; development of the Transport corridors and port connections for freight; retaining and expanding Manufacturing in the region; and agricultural growth in Casey, Cardinia and the Mornington Peninsula.
Figure 1: Key indicators
Key indicators
2011
Southern
Metropolitan
Metro
MelbourneVictoria
Employment 514,241 1,898,861 2,530,627
Southern Melbourne
% total 27.1% 20.3%
Population 1,098,477 3,940,802 5,354,039
Southern Melbourne
% total 27.9% 20.5%
Unemployment rate 5.4% 5.5% 5.4%
Labour force
participation rate 61.8% 62.5% 61.4%
Source: ABS Census 2011

Regional Training Profiles
200 Victorian Training Market Quarterly Report Full Year 2012
Regional training delivery65 In 2012, there were 77,300 government subsidised
enrolments in the Southern Metro region – an increase of 38 per cent on the previous year, and the highest increase of all regions. In comparision, enrolments increased by 29 per cent across all Metro regions on average between 2011 and 2012, and 25 per cent across Victoria (see Figure 3).
Throughout 2012, 59,300 students undertook a total of 22.7 million student contact hours of training.
In total, there were 196 training providers delivering training in the Southern Metro region, up from 169 in the previous year.
In 2012, 136 private training providers were responsible for the largest number of enrolments, 42,000 – a 60 per cent increase on the previous year, but all providers types saw an increase in enrolments, with TAFEs increasing enrolments by 17 per cent, and ACE by 34 per cent.
Apprenticeships/traineeships accounted for 19 per cent of all enrolments in Southern Metro in 2012, compared to an overall Metro average of 21 per cent, and a Victorian average of 22 per cent. However, Southern Metro was one of the five regions across Victoria that showed a decline in the number of apprentices/trainees between 2011 and 2012, from 15,700 to 15,000.
Figure 3: Regional training comparison
65
Scope of data is nationally accredited and recognised training at AQF level 1 and above. Commentary refers to government
subsidised activity unless otherwise stated.
2008 2009 2010 2011 2012
Southern Metro 35,100 40,300 45,300 56,000 77,300
Year-on-year %
change - 15% 12% 24% 38%
% change across
Victoria - 2% 17% 35% 25%
Key training challenges for the region
Certain parts of the region face high unemployment and disadvantage. VET provision aligned to higher needs learners as well as current and future industry needs remains a challenge.
Frankton and Greater Dandenong‟s Central Activities Area designation means forward planning of training provision in line with future employment and growth opportunities in these areas is imperative.
Manufacturing is particularly important to the region, especially Greater Dandenong, but is also an industry facing intense global competition. Further alignment of enrolments to industry need in this sector may be required, as well as a focus on greater innovation and areas of competitive advantage.
Companies in the region report skills shortages in trades and production, but increasingly manufacturing is becoming a knowledge based, globally-focussed industry which requires skills, knowledge and capacity at the management level. Good all round managers, who are skilled in the production side of the business are in high demand.
38%
15%
35%
26%
29%
17%
60%
34%
-4%
Note: size of bars represents % growth 2011-12
77,300
9,200
86,500
59,300
22.7 million
30,200
42,000
5,100
15,000
Figure 2: Regional training dashboard 2012 vs. 2011
Gov't funded enrolments
Total enrolments (GF + TAFE FFS)
Hours
TAFE
Private
ACE
Apprentices / Trainees
TAFE FFS enrolments
Enrolments by provider
type
Students

Regional Training Profiles
Victorian Training Market Quarterly Report Full Year 2012 201
Figure 4: Vocational training provider trends
Figure 5: Training delivery by LGA
At the LGA level, Frankston and Greater Dandenong accounted for 60 per cent of enrolments in the Southern Metro region in 2012, and all areas have seen an increase in the number of training providers offering courses.
Across all the five regions that make up the Melbourne Metro area, student participation rates in 2012 were 12 per cent, with a 13 per cent average rate across Victoria; therefore, participation rates in Greater Dandenong (at 19 per cent) and Casey (at 17 per cent) stand out as better than average.
Low participation rates in Bayside (7 per cent) and Glen Eira (8 per cent) will be driven by already higher than average qualification levels in these areas. For example, 36 per cent of Glen Eira residents, and 35 per cent of Bayside residents hold Bachelor or Higher Degrees, compared to the Victorian average of 21 per cent.
Figure 6: Enrolments by funding band66
In 2012, 11 per cent of government subsidised enrolments in the Southern Metro region were aligned to funding band A, and 40 per cent aligned against band B.
Data for enrolments in 2011 are shown aligned against funding bands for the 2011 calendar year for comparison purposes only.
Between 2011 and 2012, there has been an increase in enrolments against band B courses and a reduction in enrolments in courses at bands A, C, D and E.
66
These bands were introduced in 2012 and apply specifically to qualifications current in 2012 and later. In order to allow
comparison with previous years, superseded courses have been assigned a subsidy band for analysis purposes based on the
band of the current course to which they most closely align.
39%
54%
7%
TAFE Private ACE
Provider share 2012(change in percentage points since 2011)
7%-7%
3
136
57
TAFE Private ACE
Number of providers 2012(% change since 2011)
20% 6%50%
Local Government Area Enrolments 2012 % change 2011-2012Number of providers
2012% change 2011-2012
Student participation
rate %
Bayside (C) 550 19% 25 79% 7%
Cardinia (S) 800 44% 27 42% 15%
Casey (C) 12,100 50% 59 26% 17%
Frankston (C) 23,400 42% 63 47% 15%
Glen Eira (C) 3,600 98% 37 54% 8%
Greater Dandenong (C) 23,300 51% 88 29% 19%
Kingston (C) 7,800 18% 48 33% 10%
Mornington Peninsula (S) 6,600 -3% 41 58% 12%
15%
11%
30%
40%
24%
21%
9%
7%
23%
20%
2011
2012
Enrolments by Funding Band 2011-2012
A B C D E

Regional Training Profiles
202 Victorian Training Market Quarterly Report Full Year 2012
Industry profile Figure 7: Industry share of employment and vocational training
In 2011, the Manufacturing sector employed 17 per cent of the workforce in Southern Metro, far higher than the average across Victoria (11 per cent). Retail and Health Care were the other two major employing sectors, at 13 per cent and 12 per cent of employment respectively.
In terms of vocational training market activity, enrolments in Manufacturing related courses accounted for 8 per cent, or 4,400 enrolments in the region in 2012, an increase of 19 per cent on the previous year. However, Health Care and Social Assistance related courses attracted the most – 29 per cent, or 15,200 enrolments in 2012, and an increase of 33 per cent on the previous year.
Although Agriculture accounts for a very small proportion of employment in Southern Metro (1 per cent), it is of greater importance to certain LGAs, and enrolments in 2012 in courses aligned to this industry were minimal (only 20).
Figure 8: Occupation share of vocational training (top 10)
At the occupational level, 28 per cent of course enrolments were aligned to just four occupations, with two of these focused on the Health Care and Social Assistance sector.
12 per cent of enrolments in 2012 were focused around the Construction industry, with plumbers and electricians – two skills shortage areas for the state, attracting almost 1,400 enrolments each.
The large proportion of enrolments aligned to food services occupations (Waiters) highlight the importance of tourism and hospitality to certain areas of the region.
7%
7%
7%
7%
5%
5%
3%
2%
2%
2%
5%
3%
4%
8%
4%
5%
1%
2%
1%
1%
Child Care Worker
Aged or Disabled Carer
Waiter
Office Manager
General Clerk
Sales Assistant
Despatching and Receiving Clerk
Electrician
Plumber
Commercial Cleaner
Enrolments 2012 (% total)
Southern Metro Victoria
17%
13%
12%
9%
8%
7%
6%
5%
4%
4%
4%
3%
2%
2%
2%
1%
1%
1%
0%
11%
11%
12%
8%
8%
5%
6%
8%
4%
5%
6%
3%
4%
1%
2%
2%
2%
1%
0%
Manufacturing
Retail Trade
Health Care and Social Assistance
Education and Training
Construction
Wholesale Trade
Accommodation and Food Services
Professional, Scientific and Technical
Other Services
Transport, Postal and Warehousing
Public Administration and Safety
Administrative and Support Services
Financial and Insurance Services
Rental, Hiring and Real Estate
Arts and Recreation Services
Agriculture, Forestry and Fishing
Information Media and Telecoms
Electricity, Gas, Water and Waste
Mining
Employment 2011 (% total)
Southern Metro Victoria
Source: ABS Census 2011
8%
7%
29%
2%
12%
0%
12%
2%
6%
8%
2%
5%
0%
1%
4%
0%
1%
0%
0%
10%
9%
19%
2%
13%
0%
11%
3%
5%
9%
2%
5%
2%
1%
6%
2%
1%
0%
0%
Manufacturing
Retail Trade
Health Care and Social Assistance
Education and Training
Construction
Wholesale Trade
Accommodation and Food Services
Professional, Scientific and Technical
Other Services
Transport, Postal and Warehousing
Public Administration and Safety
Administrative and Support Services
Financial and Insurance Services
Rental, Hiring and Real Estate
Arts and Recreation Services
Agriculture, Forestry and Fishing
Information Media and Telecoms
Electricity, Gas, Water and Waste
Mining
Enrolments 2012 (% total)
Southern Metro Victoria

Regional Training Profiles
Victorian Training Market Quarterly Report Full Year 2012 203
Qualification profile On average, across the Southern Metro region, there are slightly more people in the workforce that hold
no non-school qualifications than average, and fewer that hold higher education qualifications (24 per cent, compared to the Victorian average of 30 per cent), although there are significant differences across the local government areas.
There have been increases in enrolments across all qualification levels since 2011, with the largest increase (of 40 per cent) being at Certificates III and IV.
Certificates I and II in General Education for Adults, and Certificate I in Vocational Preparation were in the top five courses for enrolments in 2012. These courses focus around improving work readiness and employment skills and are testament to the large proportion of enrolments in 2012 by students stating that they were unemployed (see Figure 10).
Certificate III in Logistics, and Certificate III in Process Manufacturing (not shown in Figure 9) also attracted large numbers of enrolments in 2012, in line with the concentration of Manufacturing and Warehousing in parts of the region.
Figure 9: Qualification trends – workforce and vocational training
Student profile Figure 10: Working age participation
67
Figure 10 highlights vocational training participation among different cohorts, comparing working age vocational training students resident in Southern Metropolitan with the region‟s working age resident population. Figures referred to in earlier charts and tables in this section relate to enrolments in the region by students that may or may not be resident in the region.
24 per cent of students resident in the region in 2012 specified that they were unemployed, in comparison, the average across the Melbourne Metro regions was 25 per cent, and across Victoria it was 23 per cent.
25 per cent of working aged resident students in Southern Metro in 2012 were aged 15-19 – greater than the overall population cohort at this age, which is to be expected; and broadly in line with the average across all Metro regions (23 per cent).
The proportion of working age students specifying that they are of a CALD background is broadly in line with the population make-up of the region. In particular, this will be driven by the large culturally diverse population in Greater Dandenong, which accounted for 30 per cent of enrolments in 2012 (see Figure 5).
67
Note: disabled students appear disproportionally high due to different definitions of disability in use by the Australian Bureau
of Statistics and the Victorian VET Student Statistical Collection. Data for unemployed residents is restricted to the working age
population and factors in those not in the labour force and therefore does not match the regional unemployment rate in Figure 1.
Top qualifications 2012
Certificate III in Hospitality 4,400
Certificate I in General Education
For Adults3,200
Certificate III in Children's Services 3,000
Certificate I in Vocational
Preparation2,500
Certificate II in General Education
for Adults2,300
These 5 courses accounted for 20% of all
government funded training in the region
16,600
51,200
9,500
Cert I-II Cert III-IV Diploma & Above
Qualification level 2012(% change since 2011)
56%
40%8%
41%
1%
22%
12%
24%
38%
1%
20%
11%
30%
No non-schoolqualifications
Cert I-II
Cert III-IV
Diploma +
Higher education
Workforce qualifications 2011 (%
total)
Southern Metro Victoria
Source: ABS Census 2011
29%
6%
1%
50%
24%
25%
18%
26%
2%
0%
51%
4%
10%
38%
CALD
Disabled(see footnote)
Indigenous
Female
Unemployed(see footnote)
Youth (15-19)
Mature age (45+)
Working age students and population, % total
Students Population
Source (popn data): ABS Census 2011

Regional Training Profiles
204 Victorian Training Market Quarterly Report Full Year 2012
Case Study: Assessing needs in Boatbuilding
Regions: Southern and Eastern Metropolitan
Regional Market Facilitation Managers: Brenda Pritchard, Suzanne Wells
The problem
The Victorian boating industry is geographically dispersed with diverse training needs but low-level demand. The only TAFE providing boating industry training ceased delivery from 1 January 2013 and no other Registered Training Organisation (RTO) is currently delivering the Certificate III in Marine Craft Construction. Immediately affecting some 40 apprentices into 2013, this means boat builders across Victoria are currently unable to access an apprenticeship that meets skills needs including wooden, fibreglass, and aluminium and other critical components within the trade.
The response
The Market Facilitation Managers from the Southern and Eastern regions have joined forces to work with the Central Facilitation Team and the Boating Industry Association of Victoria (BIAV), marine industry employers and other stakeholders to research the current and future training needs of the recreational boating industry in Victoria and to develop a strategic training model that overcomes the challenges identified for the industry.
The outcome
Still in an early phase, research and discussions have already identified a possibility that an RTO might deliver a Certificate III Engineering: Composites Trade course in 2013, which, although not specific to the boating industry, could temporarily alleviate some impact on the boating industry.

Regional Training Profiles
Victorian Training Market Quarterly Report Full Year 2012 205
Eastern Metropolitan
Regional overview The Eastern Metropolitan region comprises the eastern part of Greater Melbourne. It covers an area of 2,964 square kilometres and is the 2
nd
largest region in terms of population, with 18.5 per cent of the state‟s inhabitants.
The region includes the local government areas (LGAs) of Manningham, Boroondara, Yarra Ranges, Knox, Monash, Whitehorse and Maroondah. It extends from the Yarra Ranges National Park in the north-east, to the suburbs of Kew and Camberwell in the west, down to Clayton and Rowville in the south.
Economy and outlook Major employers are the Retail Trade, Manufacturing, Health Care and Social Assistance, and Property
and Business Services industries. The region has the lowest unemployment rate of Melbourne, averaging 5.2 per cent compared with the metropolitan Melbourne average of 6.0 per cent.
The Manufacturing sector of the region has grown by 3,000 jobs over the past decade. This is likely due to manufacturers with highly skilled workforces making high value-added products that perform well in national and global markets. However, Manufacturing jobs growth has not kept pace with other industries. The strongest employment growth in the last decade has been in Education and Training, Health Care and Social Assistance, and
Accommodation and Food Services. The Eastern Metropolitan region has lower population growth than other Melbourne regions, but has
grown above expectations in recent years. The region is comparatively strong in education, research, innovation and advanced manufacturing. It
contains a concentration of highly regarded state and private schools, major tertiary institutions and universities, and key national research facilities including the Australian Synchrotron, the CSIRO Clayton site and private sector R&D concentrations. The region has a highly skilled and educated demographic, positioning it to lead innovation and improve productivity.
The predominantly rural Yarra Ranges has some significant residential areas and commercial and industrial land use, but a large part of the LGA is focused around Agriculture, Horticulture and Viticulture. Tourism is also an important industry for the area.
Transport is the most significant challenge faced by Melbourne‟s East, with inadequate public Transport infrastructure flagged as a key structural deficiency in the region. Traffic congestion is significantly impacting on productivity and quality of life.
Key training challenges for the region
Ensuring the skills needs of employers in Advanced Manufacturing are met.
Continuing to focus on the increasing need for skills in the Health Care and Social Assistance industry.
In light of relatively low enrolment growth and an increasing share of enrolments in lower level qualifications (Certificate I-II), supporting student decision-making by providing appropriate information about anticipated vocational benefits of different qualifications will be important.
Figure 1: Key indicators
Key indicators
2011
Eastern
Metropolitan
Metro
MelbourneVictoria
Employment 487,295 1,898,861 2,530,627
Eastern Melbourne
% total 25.7% 19.3%
Population 988,783 3,940,802 5,354,039
Eastern Melbourne
% total 25.1% 18.5%
Unemployment rate 4.8% 5.5% 5.4%
Labour force
participation rate 62.9% 62.5% 61.4%
Source: ABS Census 2011

Regional Training Profiles
206 Victorian Training Market Quarterly Report Full Year 2012
Regional training delivery68 There were 68,400 government subsidised vocational
training enrolments in the Eastern Metropolitan region in 2012.
The region experienced the lowest growth in government subsidised enrolments of the metro regions over the year. This was due to negative growth in TAFE enrolments, and below average growth in ACE and private provider enrolments.
The Eastern Metropolitan region was the only metro region to experience a decline in student numbers in 2012. Both student numbers and student contact hours of study fell by 2 per cent.
The region experienced the second largest decline in government subsidised apprentice/trainee enrolments of all Victorian regions in 2012, behind the Great South Coast.
Figure 3: Regional training comparison
Enrolments slightly shifted away from TAFEs to private providers in 2012. The enrolment share of private providers rose by 2 percentage points, but TAFEs still accounted for 55 per cent if enrolments in 2012.
172 providers delivered government subsidised training in the Eastern Metropolitan region in 2012, up from 158 in 2011. This was driven entirely by an increase in the number of private providers.
Figure 4: Vocational training provider trends
Figure 5: Training delivery by LGA
68
Scope of data is nationally accredited and recognised training at AQF level 1 and above. Commentary refers to government
subsidised activity unless otherwise stated.
2008 2009 2010 2011 2012
Eastern Metro 44,300 44,900 51,800 65,300 68,400
Year-on-year %
change - 1% 15% 26% 5%
% change across
Victoria - 2% 17% 35% 25%
55%
40%
5%
TAFE Private ACE
Provider share 2012(change in percentage points since 2011)
2% 1%-3%
3
125
44
TAFE Private ACE
Number of providers 2012(% change since 2011)
14%-2%
Local Government Area Enrolments 2012 % change 2011-2012Number of providers
2012% change 2011-2012
Student participation
rate %
Boroondara (C) 8,100 -10% 56 19% 7%
Knox (C) 6,600 11% 56 37% 14%
Manningham (C) 2,100 -38% 32 60% 9%
Maroondah (C) 9,500 20% 53 51% 11%
Monash (C) 14,000 34% 68 31% 9%
Whitehorse (C) 24,100 -5% 56 24% 10%
Yarra Ranges (S) 4,100 21% 44 33% 13%
5%
9%
5%
-2%
-2%
-1%
12%
17%
-8%
Note: size of bars represents % growth 2011-12
68,400
8,400
76,800
49,800
19 million
37,800
27,000
3,600
15,200
Figure 2: Regional training dashboard 2012 vs. 2011
Gov't funded enrolments
Total enrolments (GF + TAFE FFS)
Hours
TAFE
Private
ACE
Apprentices / Trainees
TAFE FFS enrolments
Enrolments by provider
type
Students

Regional Training Profiles
Victorian Training Market Quarterly Report Full Year 2012 207
Enrolment growth was disparate amongst the LGAs in the Eastern Metropolitan region. The City of Monash experienced the largest increase in enrolments in 2012 (34 per cent), while Manningham recorded the largest decrease (38 per cent).
The largest proportion of enrolments in the region in 2012 was in the City of Whitehorse, which accounted for 35 per cent of all enrolments across Eastern Metropolitan.
Student participation rates in Boroondara, Manningham and Monash are notable for being significantly lower than the Metropolitan Melbourne average (12 per cent), and the state average of 13 per cent.
Figure 6: Enrolments by funding band69
In 2012, 13 per cent of government subsidised enrolments in the Eastern Metropolitan region were aligned to funding band A, and 40 per cent aligned against band B.
Data for enrolments in 2011 are shown aligned against funding bands for the 2011 calendar year for comparison purposes only.
Between 2011 and 2012, there has been an increase in enrolments against band B courses and a reduction in enrolments in courses at bands A, C, D and E.
Industry profile Figure 7: Industry share of employment and vocational training
69
These bands were introduced in 2012 and apply specifically to qualifications current in 2012 and later. In order to allow
comparison with previous years, superseded courses have been assigned a subsidy band for analysis purposes based on the
band of the current course to which they most closely align.
14%
13%
12%
11%
9%
7%
7%
5%
4%
4%
3%
3%
3%
2%
2%
1%
1%
1%
0%
12%
11%
11%
8%
8%
5%
8%
6%
4%
6%
3%
5%
4%
2%
1%
2%
1%
2%
0%
Health Care and Social Assistance
Retail Trade
Manufacturing
Education and Training
Professional, Scientific and Technical
Wholesale Trade
Construction
Accommodation and Food Services
Other Services
Public Administration and Safety
Administrative and Support Services
Transport, Postal and Warehousing
Financial and Insurance Services
Information Media and Telecoms
Rental, Hiring and Real Estate
Arts and Recreation Services
Electricity, Gas, Water and Waste
Agriculture, Forestry and Fishing
Mining
Employment 2011 (% total)
Eastern Metro Victoria
Source: ABS Census 2011
23%
9%
8%
3%
5%
1%
17%
6%
5%
1%
6%
4%
0%
2%
3%
7%
0%
1%
0%
19%
9%
10%
2%
3%
0%
13%
11%
5%
2%
5%
9%
2%
1%
1%
6%
0%
2%
0%
Health Care and Social Assistance
Retail Trade
Manufacturing
Education and Training
Professional, Scientific and Technical
Wholesale Trade
Construction
Accommodation and Food Services
Other Services
Public Administration and Safety
Administrative and Support Services
Transport, Postal and Warehousing
Financial and Insurance Services
Information Media and Telecoms
Rental, Hiring and Real Estate
Arts and Recreation Services
Electricity, Gas, Water and Waste
Agriculture, Forestry and Fishing
Mining
Enrolments 2012 (% total)
Eastern Metro Victoria
15%
13%
32%
40%
23%
21%
11%
10%
19%
15%
2011
2012
Enrolments by Funding Band 2011-2012
A B C D E

Regional Training Profiles
208 Victorian Training Market Quarterly Report Full Year 2012
The region has a higher proportion of employment than the average in Health Care and Social Assistance, Retail, Manufacturing, Education and Training, Professional, Scientific and Technical Services and the Wholesale Trade.
In 2012, health related courses formed 23 per cent of all enrolments in the Eastern Metro region – a total of 9,400 enrolments, and a growth of nearly 10 per cent since 2011. This is evident in the proportion of enrolments aligned to Child Care Workers and Aged or Disabled Carers (see Figure 8).
Construction-related courses formed 17 per cent of enrolments in 2012, compared to 7 per cent of employment. Key occupations aligned to courses included Electricians, Carpenters and Plumbers – all occupations that are specialised and in-shortage across Victoria (see Figure 8).
Figure 8: Occupation share of vocational training (top 10)
Wholesale Trade currently forms 7 per cent of employment in Eastern Metro, but enrolments in courses aligned to this industry were low in 2012, at 250 (1 per cent of all enrolments), although they have grown by 22 per cent since the previous year.
Enrolments aligned to courses in Manufacturing have increased by 28 per cent since 2011, (3,100 enrolments in 2012), but there may still be some misalignment between enrolment numbers and employment requirements.
Qualification profile The average qualifications of the workforce in the Eastern Metropolitan region are broadly consistent with
the Victorian average, except that the region has a greater proportion qualified at the higher education level.
In terms of vocational training enrolments, in 2012 Eastern Metro had an above average share of enrolments in the „Diploma and above‟ category compared to the other metropolitan regions (19 per cent of all enrolments, compared to an average of 17 per cent across Melbourne Metro and 15 per cent on average across Victoria).
Over time however, vocational training enrolment growth has been stronger in lower level qualifications. In particular, courses aligned to General Education for Adults were well subscribed to in 2012 (see Figure 9), which focus on work readiness and employment skills development.
Figure 9: Qualification trends – workforce and vocational training
Top qualifications 2012
Certificate II in General Education
For Adults5,200
Certificate I in General Education
For Adults3,700
Certificate III in General Education
For Adults2,400
Certificate I in Vocational
Preparation2,000
Diploma of Management 1,900
These 5 courses accounted for 22% of all
government funded training in the region
20,000
35,600
12,800
Cert I-II Cert III-IV Diploma & Above
Qualification level 2012(% change since 2011)
7% 4% 2%
35%
1%
18%
12%
34%
38%
1%
20%
11%
30%
No non-schoolqualifications
Cert I-II
Cert III-IV
Diploma +
Higher education
Workforce qualifications 2011 (%
total)
Eastern Metro Victoria
Source: ABS Census 2011
8%
5%
5%
4%
4%
3%
3%
2%
2%
2%
8%
5%
5%
3%
4%
2%
2%
0%
1%
4%
Office Manager
Sales Assistant
Child Care Worker
Aged or Disabled Carer
General Clerk
Electrician
Carpenter
Real Estate Representative
Plumber
Waiter
Enrolments 2012 (% total)
Eastern Metro Victoria

Regional Training Profiles
Victorian Training Market Quarterly Report Full Year 2012 209
Student profile
Figure 10: Working age participation70
Figure 10 highlights vocational training participation among different cohorts, comparing working age vocational training students resident in Eastern Metropolitan with the region‟s working age resident population. Figures referred to in earlier charts and tables in this section relate to enrolments in the region by students that may or may not be resident in the region.
In 2012, the share of working-age students resident in the region who were disabled, unemployed or between 15 and 19 years of age exceeded the share of these groups in the general population.
While the unemployment rate in the Eastern Metropolitan region was 4 per cent as at the 2011 Census, 22 per cent of students of all ages were unemployed (compared to 25 per cent across all Metro regions, and 23 per cent across Victoria on average), meaning that vocational training is being used as an increasingly popular route into employment, as the labour market tightens.
24 per cent of students in the region were from a Culturally and Linguistically Diverse (CALD) background in 2012 – lower than
the other Metropolitan regions, but in line with the Victorian average. The share of working-age students who were from a CALD background was also below the share of CALD persons in the general population, potentially representing a challenge for the region.
The level of vocational training engagement of higher needs learners rose strongly between 2011 and 2012. Most noticeably, there was growth in the number of students who were unemployed (32 per cent), from a CALD background (27 per cent) or disabled (19 per cent).
Case Study: Setting standards across industry Region: Eastern Metropolitan
Market Facilitation Manager: Suzanne Wells
The problem
As part of an Institute of Instrument Control and Automation Australia (IICA) working party, a furnace and oven manufacturer and exporter contacted Market Facilitation Manager Suzanne Wells with concerns about a lack of compliance and proper understanding of a number of international standards and other regulatory requirements related to equipment testing. The working party was formed to raise awareness in industry about such issues, but after two years felt their efforts had stalled.
These problems are undermining business opportunities for both the domestic and export market but, as the relevant standards apply to a range of industry sectors, including aircraft maintenance, pharmaceuticals and food processing, there has been a lack of cohesive response.
The response
Working with the Department of Business and Innovation, Wells has arranged to host a meeting with stakeholders including the Civil Aviation Safety Authority and the Australian Defence Forces to seek their support in achieving the IICA‟s goals. She also introduced the working group to the relevant Curriculum Maintenance Manager (CMM) to clarify their needs and discuss course development.
The outcome
Having confirmed with the CMM that there is currently no relevant training course in Australia, Wells has
drafted an Industry Transition and Specialist Training Initiative (ITSTI) proposal to support future course development.
70
Note: disabled students appear disproportionally high due to different definitions of disability in use by the Australian Bureau
of Statistics and the Victorian VET Student Statistical Collection. Data for unemployed residents is restricted to the working age
population and factors in those not in the labour force and therefore does not match the regional unemployment rate in Figure 1.
24%
7%
1%
49%
22%
27%
19%
28%
2%
0%
51%
4%
10%
39%
CALD
Disabled(see footnote)
Indigenous
Female
Unemployed(see footnote)
Youth (15-19)
Mature age (45+)
Working age students and population, % total
Students Population
Source (popn data): ABS Census 2011

Regional Training Profiles
210 Victorian Training Market Quarterly Report Full Year 2012
Western Metropolitan
Regional overview The Western Metropolitan region is constituted of six local government areas (LGAs): Brimbank, Hobson‟s Bay, Maribyrnong, Melton, Moonee Valley and Wyndham, and covers 1,331 square kilometres.
The 2011 Census reported that the region is home to 716,500 people – 13.4 per cent of Victoria‟s total population, living in the western suburbs of Melbourne, stretching from Werribee in the far south-west through Williamston and Footscray to Moonee Ponds in the east; up to Essendon and Strathmore Heights and beyond Syndenham in the north, to Melton in the west.
Economy and outlook The region overall is experiencing strong population growth, and is a major destination for overseas
immigrants. However it also evidences greater than average levels of disadvantage, with major challenges identified as improving educational outcomes, increasing resident skill levels and planning for unprecedented population growth in the outer areas of the region, especially around Melton.
Hobsons Bay, situated along Port Phillip Bay, has recognised strengths in Shipbuilding, Logistics, Motor Vehicle Manufacturing, Chemical and Petroleum industries, Railway Maintenance and Transport. It has several competitive locational advantages, including its accessibility and Transport links, and a number of key tourism and cultural industries such as Scienceworks and a maritime heritage.
The Maribyrnong LGA, centred around Footscray, traditionally covers a largely working class area with a strong industrial base, including Steel and Petrochemical companies. While the area is experiencing increasing gentrification, the local economy continues to be affected by structural issues including long-term unemployment, mixed skill levels, language abilities, and challenges from a reliance on the Manufacturing industry. There are also issues relating to land use, ageing industrial areas and contaminations. Opportunities focus around transitioning industrial areas and encouraging new high value export oriented industries.
Moonee Valley, on the other-hand has on average a highly employable and well educated population. Key employment sectors include Property and Business Services, Construction, Retail, and Health. Challenges involve transforming existing industrial activities to a mix of office and high value commercial uses, ongoing development of Essendon Fields, the impacts of high density development and Transport.
Brimbank, which borders Tullamarine airport to the north and includes the suburbs of Sunshine, Deer Park, Syndenham, Keilor and St Albans, has a range of greenfield sites and established industrial estates with existing capacity and room to expand.
To the west, Wyndham City‟s key industries are Transport and Logistics, Manufacturing, Agriculture, Retail, Business and Community Services. There are a number of employment precincts in the area including Werribee, Laverton North, Truganina, Werribee South Intensive Agricultural District and the Werribee Tourism Precinct. The new railway station at Williams Landing, due to open in April will provide a much needed link to the city, and support the challenge Wyndham faces in connecting people to employment opportunities in light of longer-term population projections for the LGA in excess of 450,000.
Melton‟s economy is focused mainly around small businesses in extractive and population serving industries, Manufacturing, and Horse Breeding and Training. Strategic opportunities include the Toolern Employment Node, but challenges exist around managing agricultural land, creating employment to cater for population growth and improving infrastructure, particularly public Transport.
Figure 1: Key indicators
Key indicators
2011
Western
Metropolitan
Metro
MelbourneVictoria
Employment 331,822 1,898,861 2,530,627
Western Melbourne
% total 17.5% 13.1%
Population 716,508 3,940,802 5,354,039
Western Melbourne
% total 18.2% 13.4%
Unemployment rate 6.5% 5.5% 5.4%
Labour force
participation rate 62.1% 62.5% 61.4%
Source: ABS Census 2011

Regional Training Profiles
Victorian Training Market Quarterly Report Full Year 2012 211
Regional training delivery71 Western Metro accounted for 52,900 government
subsidised enrolments in vocational training in 2012. This represented a very positive increase of 34 per cent on the previous year; higher than the overall average increase across Victoria of 25 per cent (see Figure 3).
In total throughout 2012, 40,800 students undertook a total of 16.5 million student contact hours of training.
There were five TAFE providers delivering government subsidised training in Western Metro in 2012 (one more than in 2011). They accounted for 22,300 enrolments – 42 per cent of enrolments in the region, and an increase of 9 per cent on the previous year. In the same year, the TAFE sector also saw a significant increase in fee for service enrolments.
Between 2011 and 2012, both private training provision and ACE provision saw an increase in enrolments, of 65 per cent and 44 per cent respectively; as well as an increase in provider numbers: from 94 to 128 private providers and 27 to 30 ACE providers (see Figure 4).
Figure 3: Regional training comparison
In 2012 there were 7,600 enrolments in apprenticeships/traineeships in the region, and although this represented a 12 per cent increase on the previous year (compared to the overall Victorian average increase across the same period of 8 per cent); the region has the lowest proportion of apprenticeships/traineeships as a percentage of total government subsidised vocational training of all regions (14 per cent, compared to a Metro average of 21 per cent and a Victorian average of 22 per cent).
71
Scope of data is nationally accredited and recognised training at AQF level 1 and above. Commentary refers to government
subsidised activity unless otherwise stated.
2008 2009 2010 2011 2012
Western Metro 26,800 22,600 28,900 39,400 52,900
Year-on-year %
change - -16% 28% 36% 34%
% change across
Victoria - 2% 17% 35% 25%
Key training challenges for the region
Manufacturing remains an important employing sector for Western Metro, and may benefit from closer alignment of enrolment numbers to industry need, and potential future demand and innovation in the sector.
There are a number of areas of the Western Metro region that have higher than average levels of disadvantage, non-English speakers and unemployment, which provide challenges for training providers in work-readiness skills.
A majority of students resident in Western Metro's outer LGAs, the high population growth areas of Melton and Wyndham, are enrolling with training providers outside of their local area. Developing additional opportunities to study locally is a priority, which would have an additional benefit of creating additional employment opportunities for local residents.
34%
141%
48%
27%
43%
9%
65%
44%
12%
Note: size of bars represents % growth 2011-12
52,900
13,700
66,700
40,800
16.5 million
22,300
27,300
3,400
7,600
Figure 2: Regional training dashboard 2012 vs. 2011
Gov't funded enrolments
Total enrolments (GF + TAFE FFS)
Hours
TAFE
Private
ACE
Apprentices / Trainees
TAFE FFS enrolments
Enrolments by provider
type
Students

Regional Training Profiles
212 Victorian Training Market Quarterly Report Full Year 2012
Figure 4: Vocational training provider trends
Figure 5: Training delivery by LGA
At the LGA level, Maribyrnong and Brimbank accounted for 57 per cent of the region‟s enrolments in 2012. In Maribyrnong, this represented an increase of 124 per cent on enrolment numbers in the previous year.
Across all the five regions that make up the Melbourne Metro area, student participation rates in 2012 were 12 per cent, with a 13 per cent average rate across Victoria; therefore, participation rates in Wyndham (at 19 per cent) and Brimbank (at 17 per cent) stand out as better than average, even accounting for a drop in enrolments in Wyndham between 2011 and 2012.
Figure 6: Enrolments by funding band72
In 2012, 12 per cent of government subsidised enrolments in the Western Metropolitan region were aligned to funding band A, and 45 per cent aligned against band B.
Data for enrolments in 2011 are shown aligned against funding bands for the 2011 calendar year for comparison purposes only.
Between 2011 and 2012, there has been an increase in enrolments against band B courses and a reduction in enrolments against all other bands.
72
These bands were introduced in 2012 and apply specifically to qualifications current in 2012 and later. In order to allow
comparison with previous years, superseded courses have been assigned a subsidy band for analysis purposes based on the
band of the current course to which they most closely align.
42%
52%
6%
TAFE Private ACE
Provider share 2012(change in percentage points since 2011)
9%-10%
5
128
30
TAFE Private ACE
Number of providers 2012(% change since 2011)
36%
25%
11%
Local Government Area Enrolments 2012 % change 2011-2012Number of providers
2012% change 2011-2012
Student participation
rate %
Brimbank (C) 14,200 38% 66 40% 17%
Hobsons Bay (C) 6,900 7% 54 54% 13%
Maribyrnong (C) 16,000 124% 56 40% 13%
Melton (S) 1,800 17% 35 59% 15%
Moonee Valley (C) 5,800 31% 61 45% 13%
Wyndham (C) 8,700 -9% 73 40% 19%
13%
12%
38%
45%
22%
20%
8%
7%
18%
16%
2011
2012
Enrolments by Funding Band 2011-2012
A B C D E

Regional Training Profiles
Victorian Training Market Quarterly Report Full Year 2012 213
Industry profile Figure 7: Industry share of employment and vocational training
The Manufacturing industry, Transport, Postal and Warehousing, and Retail to a lesser degree are more important to employment in the Western Metro region than on average across Victoria, industries which are each vulnerable to restructuring in the region..
With regards to the vocational training market, 27 per cent (8,900) enrolments in 2012 were in courses aligned to the Health Care sector. Enrolments in this area increased by 50 per cent on the previous year, meaning Western Metro is potentially well placed to take advantage of forecast employment growth in the industry.
Construction and Transport, Postal and Warehousing courses also accounted for a large proportion of the region‟s enrolments, with 5,900 Construction-related enrolments, and 5,500 Transport, Postal and Warehousing related enrolments. In particular, courses related to Store-person and Warehouse Administrator occupations were particularly popular (see Figure 8).
Figure 8: Occupation share of vocational training (top 10)
As shown in Figure 7, Health Care and Social Assistance enrolments were particularly popular courses in 2012, with 3,800 enrolments in occupations aligned to Child Care Workers and 2,000 enrolments in occupations aligned to Aged or Disabled Carers.
The importance of the Retail sector to the region can be seen in the large number of enrolments in Sales Assistants, making up 2 per cent (900) enrolments.
The 1,000 Factory Process Worker focused enrolments link to the importance of Manufacturing in Western Metro.
16%
13%
11%
10%
9%
7%
6%
6%
5%
4%
4%
3%
2%
1%
1%
1%
1%
0%
0%
11%
11%
12%
8%
5%
8%
5%
6%
6%
4%
8%
3%
4%
1%
2%
2%
1%
2%
0%
Manufacturing
Retail Trade
Health Care and Social Assistance
Education and Training
Transport, Postal and Warehousing
Construction
Wholesale Trade
Public Administration and Safety
Accommodation and Food Services
Other Services
Professional, Scientific and Technical
Administrative and Support Services
Financial and Insurance Services
Rental, Hiring and Real Estate
Arts and Recreation Services
Information Media and Telecoms
Electricity, Gas, Water and Waste
Agriculture, Forestry and Fishing
Mining
Employment 2011 (% total)
Western Metro Victoria
Source: ABS Census 2011
9%
4%
27%
3%
17%
18%
0%
0%
3%
2%
3%
2%
0%
0%
9%
1%
0%
0%
0%
10%
9%
19%
2%
9%
13%
0%
2%
11%
5%
3%
5%
2%
1%
6%
1%
0%
2%
0%
Manufacturing
Retail Trade
Health Care and Social Assistance
Education and Training
Transport, Postal and Warehousing
Construction
Wholesale Trade
Public Administration and Safety
Accommodation and Food Services
Other Services
Professional, Scientific and Technical
Administrative and Support Services
Financial and Insurance Services
Rental, Hiring and Real Estate
Arts and Recreation Services
Information Media and Telecoms
Electricity, Gas, Water and Waste
Agriculture, Forestry and Fishing
Mining
Enrolments 2012 (% total)
Western Metro Victoria
10%
9%
5%
5%
4%
4%
3%
3%
2%
2%
8%
5%
3%
2%
2%
2%
4%
2%
1%
5%
Office Manager
Child Care Worker
Aged or Disabled Carer
Storeperson
Warehouse Administrator
Fitness Instructor
General Clerk
Factory Process Workers
Painting Trades Worker
Sales Assistant
Enrolments 2012 (% total)
Western Metro Victoria

Regional Training Profiles
214 Victorian Training Market Quarterly Report Full Year 2012
Qualification profile At Certificate I-II, III-IV and Diploma+ level, the workforce of the Western Metro region aligns almost
exactly with the overall averages for the state, with 20 per cent of the workforce qualified to Certificate III-IV and 10 per cent qualified to Diploma or above.
However, while 25 per cent of the region‟s workforce is qualified at the higher education level, this is lower than the state average of 30 per cent.
Between 2011 and 2012, Western Metro saw a significant increase in enrolments in qualifications at the Cert III-IV level – an increase of 46 per cent; and enrolments at this qualification level account for 55 per cent of all enrolments at Certificate I or above in the region.
Certificate I in Vocational Preparation attracted the largest number of enrolments in 2012 in the region. This qualification is focused around improving work readiness and employment skills and highlights the large proportion of enrolments in 2012 by students stating that they were unemployed (see Figure 10).
Certificate III in Aged Care, Certificate III in Transport and Logistics (Warehousing and Storage) and Certificate III in Process Manufacturing (not shown in Figure 9) also attracted more than 1,000 enrolments in Western Metro in 2012.
Figure 9: Qualification trends – workforce and vocational training
Student profile Figure 10: Working age participation
73
Figure 10 highlights vocational training participation among different cohorts, comparing working age vocational training students resident in Western Metropolitan with the region‟s working age resident population. Figures referred to in earlier charts and tables in this section relate to enrolments in the region by students that may or may not be resident in the region.
Given the population composition of the region, a large proportion of working age students resident in the region are Culturally and Linguistically Diverse (CALD) – 41 per cent in 2012.
A similarly large proportion of students specified that they were unemployed (28 per cent). In comparison, the average among students across the Melbourne Metro regions was 25 per cent, and across Victoria it was 23 per cent.
Students aged 15-19 constituted 21 per cent of working aged resident students in Western Metro in 2012 – greater than the overall population cohort at this age (9 per cent), which is to be expected. This proportion is broadly in line with the average across all Metro regions (23 per cent).
73
Note: disabled students appear disproportionally high due to different definitions of disability in use by the Australian Bureau
of Statistics and the Victorian VET Student Statistical Collection. Data for unemployed residents is restricted to the working age
population and factors in those not in the labour force and therefore does not match the regional unemployment rate in Figure 1.
Top qualifications 2012
Certificate I in Vocational
Preparation5,500
Certificate III in Children's Services 2,500
Diploma of Management 1,800
Certificate III in Warehousing
Operations1,300
Diploma of Children's Services
(Early childhood education and
care)
1,300
These 5 courses accounted for 23% of all
government funded training in the region
15,100
28,900
8,900
Cert I-II Cert III-IV Diploma & Above
Qualification level 2012(% change since 2011)
23%
46%
21%
43%
1%
20%
10%
25%
38%
1%
20%
11%
30%
No non-schoolqualifications
Cert I-II
Cert III-IV
Diploma +
Higher education
Workforce qualifications 2011 (%
total)
Western Metro Victoria
Source: ABS Census 2011
41%
6%
1%
50%
28%
21%
17%
39%
3%
0%
50%
5%
9%
33%
CALD
Disabled(see footnote)
Indigenous
Female
Unemployed(see footnote)
Youth (15-19)
Mature age (45+)
Working age students and population, % total
Students Population
Source (popn data): ABS Census 2011

Regional Training Profiles
Victorian Training Market Quarterly Report Full Year 2012 215
Case Study - Insulating business from skills shortages: Region: Western Metropolitan
Regional Market Facilitation Manager: John Stapleton
The problem
A small-to medium engineering business specialising in the construction, modification and installation of cool room/insulated panel facilities was referred to Market Facilitation Manager, John Stapleton. As there is currently no accredited training available for workers in this field, the business draws its existing workforce from people with a carpentry or plumbing background, but finds they need substantial on-the-job training to work at the quality level required by the industry.
The company would like to see a qualification established addressing the skills needs of this occupation, and for this to be available for new entrants to the industry. However, there is no industry organisation and no coherent view articulated on workforce development.
The response
Stapleton facilitated a meeting between the business and the Construction and Property Services Industry Skills Council (CPSISC) to discuss availability of suitable accredited training for cool room/insulation panel construction and installation.
The outcome
CPSISC advised the best option would be to modify the content of an existing qualification to address the needs of the sector. It has undertaken to link the company up to an imminent review of existing units/competencies relating to insulation work to see if that could be extended to cover panel installation skills.

Regional Training Profiles
216 Victorian Training Market Quarterly Report Full Year 2012
Inner Metropolitan
Regional overview The Inner Melbourne area hosts the capital city of Victoria, incorporating the major financial, business, administrative and cultural functions of the state. It is a diverse region, both in terms of its demographic profile and in mix of land use and dwelling types.
The region includes the local government areas (LGAs) of Melbourne, Port Phillip, Stonnington and Yarra.
Economy and outlook Inner Melbourne is the largest region in the state in terms of employment, accounting for approximately
one fifth of all jobs in Victoria (537,100 workers). The number of workers residing in the region is much smaller, however (see Figure 1), highlighting the high proportion of people employed in this region who commute in on a daily basis – both from other Melbourne regions and from further afield.
Inner Melbourne is in fact the smallest metropolitan region in terms of resident workers and population.
The regional population is dominated by the 20 to 34 years age cohort, which accounts for 39 per cent of the resident population, compared with an average of 23 per cent across the Melbourne regions.
Inner Metropolitan has the lowest unemployment rate among the Melbourne regions combined with the highest labour
force participation rate in the state, positioning the region well in terms of potential economic growth.
Professional, Scientific and Technical Services is the largest industry sector, with Financial Services also playing a major role (see Figure 7). In addition, more than 50 per cent of all Information, Media and Telecommunications workers are employed in Inner Melbourne, highlighting the importance of technology and innovation in the region.
The City of Melbourne is a mixed use area, with residential, commercial, industrial, institutional, cultural and tourist land uses, and substantial parklands. Significant employment sectors include Business, Health, Retail, Manufacturing, Hospitality, Tourism and Education. Home to the Port of Melbourne, Australia‟s largest container and general cargo port, it is a major freight hub and benefits from strong road and rail links.
Port Phillip is a residential and commercial area, with substantial industrial and office land use. It is a key centre for business, with other major employment sectors including Manufacturing, Retail and Tourism.
Stonnington is a residential and commercial area with some industrial, office and institutional land use. The City includes some of Melbourne's most prestigious residential localities.
Yarra‟s main industries include Beer and Clothing Manufacturing and Machinery and Equipment Wholesaling. Similar to Inner Metropolitan‟s other areas; Yarra combines a mixture of residential, industrial and commercial areas. It is known for its extensive community services infrastructure and it contains a highly multi-cultural population.
Key training challenges for the region
Employers in the region have flagged difficulties in sourcing employees with the required mix and level of skills – particularly in the ICT industries and Professional Services such as Finance and Accounting, Engineering and Legal Services. General management and leadership skills have also been identified as needing further development.
The region serves a high proportion of non-resident students, creating a challenge for the training providers in meeting the diverse needs of its student base, both resident and non-resident.
Low levels of student participation in vocational training among the resident population are linked to the region‟s demographic profile. The relatively high proportion of unemployed students in the Inner Metropolitan area, highlights a role for vocational training in supporting labour force participation.
Figure 1: Key indicators
Key indicators
2011
Inner
Metropolitan
Metro
MelbourneVictoria
Employment 197,678 1,898,861 2,530,627
Inner Melbourne %
total - 10.4% 7.8%
Population 352,226 3,940,802 5,354,039
Inner Melbourne %
total - 8.9% 6.6%
Unemployment rate 5.4% 5.5% 5.4%
Labour force
participation rate 66.4% 62.5% 61.4%
Source: ABS Census 2011

Regional Training Profiles
Victorian Training Market Quarterly Report Full Year 2012 217
Regional training delivery74 Inner Metropolitan is the largest training market in
Victoria for both government subsidised and TAFE domestic fee for service enrolments.
The region saw 181,400 government subsidised vocational training enrolments in 2012, an increase of 35 per cent on 2011.
Private training providers deliver the majority of training in this region, accounting for just over three quarters of total enrolments.
In contrast, TAFE and ACE providers have the lowest share of enrolments when compared with other Victorian regions (22 per cent and 2 per cent respectively).
Private providers continue to drive growth in the region, making up 90 per cent of the enrolment growth seen in 2012.
Inner Metropolitan apprentice and trainee enrolments are the highest in Victoria, accounting for 34 per cent of the state total.
Figure 3: Regional training comparison
Figure 4: Vocational training provider trends
Figure 5: Training delivery by LGA
The Melbourne local government area is the largest within the region in terms of training delivery,
accounting for 68 per cent of enrolments in 2012.
Vocational training participation rates are the lowest in the state, at 8 per cent compared to an average of 12 per cent across Metropolitan Melbourne and 15 per cent across regional Victoria. This is linked to the below average youth age cohort resident in this region.
The low participation rate when compared with high enrolment numbers also highlights the role this region‟s training market plays in servicing the wider Melbourne area – as does the region‟s employment market.
74
Scope of data is nationally accredited and recognised training at AQF level 1 and above. Commentary refers to government
subsidised activity unless otherwise stated.
2008 2009 2010 2011 2012
Inner Metro 60,200 55,200 80,100 134,800 181,400
Year-on-year %
change - -8% 45% 68% 35%
% change across
Victoria - 2% 17% 35% 25%
22%
76%
2%
TAFE Private ACE
Provider share 2012(change in percentage points since 2011)
5%-5%9
255
37
TAFE Private ACE
Number of providers 2012(% change since 2011)
9% 6%
Local Government Area Enrolments 2012 % change 2011-2012Number of providers
2012% change 2011-2012
Student participation
rate %
Melbourne (C) 123,500 45% 220 8% 7%
Port Phillip (C) 28,200 19% 65 27% 7%
Stonnington (C) 19,200 21% 51 42% 8%
Yarra (C) 10,900 6% 72 41% 9%
35%
13%
33%
34%
50%
9%
44%
40%
24%
Note: size of bars represents % growth 2011-12
181,400
14,100
195,500
151,900
55.3 million
40,300
137,000
4,100
46,300
Figure 2: Regional training dashboard 2012 vs. 2011
Gov't funded enrolments
Total enrolments (GF + TAFE FFS)
Hours
TAFE
Private
ACE
Apprentices / Trainees
TAFE FFS enrolments
Enrolments by provider
type
Students

Regional Training Profiles
218 Victorian Training Market Quarterly Report Full Year 2012
Figure 6: Enrolments by funding band75
In 2012, 10 per cent of government subsidised enrolments in the Inner Metropolitan region were aligned to funding band A, 23 per cent aligned against band B and 22 per cent at band C.
Data for enrolments in 2011 are shown aligned against funding bands for the 2011 calendar year for comparison purposes only.
Between 2011 and 2012, there has been an increase in enrolments against band B courses and a reduction in enrolments against all other bands.
Industry profile Figure 7: Industry share of employment and vocational training
Service industries are the key employers in Inner Metropolitan, with the top five employers – Professional, Scientific and Technical Services, Financial and Insurance Services, Health Care, Public Administration and Retail Trade – accounting for 55 per cent of jobs in the region.
Two of these industries, Health Care and Retail Trade, are also in the top five in terms of training delivery. Occupations within the Professional, Scientific and Technical Services, Financial and Insurance Services and Public Administration industries tend to be more aligned to higher education rather than Vocational training qualifications.
Accommodation and Food Services is the largest training market industry in Inner Metropolitan, reflecting the importance of hospitality and tourism in this region. Industry enrolments have increased by 16 per cent in 2012, to 15,400.
Manufacturing enrolments have grown by 66 per cent between 2011 and 2012, with this industry now the second largest in terms of training delivery. The proportion of training in the industry is higher than that in
75
These bands were introduced in 2012 and apply specifically to qualifications current in 2012 and later. In order to allow
comparison with previous years, superseded courses have been assigned a subsidy band for analysis purposes based on the
band of the current course to which they most closely align.
18%
12%
10%
8%
7%
6%
6%
5%
4%
4%
3%
3%
3%
3%
3%
2%
1%
0%
0%
8%
4%
12%
6%
11%
6%
8%
2%
3%
11%
8%
5%
5%
2%
4%
1%
1%
0%
2%
Professional, Scientific and Technical
Financial and Insurance Services
Health Care and Social Assistance
Public Administration and Safety
Retail Trade
Accommodation and Food Services
Education and Training
Information Media and Telecoms
Administrative and Support Services
Manufacturing
Construction
Transport, Postal and Warehousing
Wholesale Trade
Arts and Recreation Services
Other Services
Rental, Hiring and Real Estate
Electricity, Gas, Water and Waste
Mining
Agriculture, Forestry and Fishing
Employment 2011 (% total)
Inner Metro Victoria
Source: ABS Census 2011
3%
5%
10%
4%
12%
13%
2%
1%
10%
12%
8%
6%
0%
7%
7%
0%
0%
0%
0%
3%
2%
19%
2%
9%
11%
2%
1%
5%
10%
13%
9%
0%
6%
5%
1%
0%
0%
2%
Professional, Scientific and Technical
Financial and Insurance Services
Health Care and Social Assistance
Public Administration and Safety
Retail Trade
Accommodation and Food Services
Education and Training
Information Media and Telecoms
Administrative and Support Services
Manufacturing
Construction
Transport, Postal and Warehousing
Wholesale Trade
Arts and Recreation Services
Other Services
Rental, Hiring and Real Estate
Electricity, Gas, Water and Waste
Mining
Agriculture, Forestry and Fishing
Enrolments 2012 (% total)
Inner Metro Victoria
9%
10%
15%
23%
23%
22%
21%
17%
32%
29%
2011
2012
Enrolments by Funding Band 2011-2012
A B C D E

Regional Training Profiles
Victorian Training Market Quarterly Report Full Year 2012 219
the regional labour market, however Inner Melbourne plays a major role in serving the wider Melbourne area and Manufacturing remains a key employing industry across the state.
Key segments for Manufacturing training delivery include Process Manufacturing (34 per cent of enrolments), Competitive Manufacturing (28 per cent) and Meat and Food Processing (18 per cent of enrolments), with the majority of enrolment growth seen in Certificate III–IV level courses.
Figure 8: Occupation share of vocational training (top 10)
Qualifications aligned to Business Services occupations; Office Manager in particular, attract an above average proportion of enrolments in Inner Metropolitan.
The importance of the Retail Trade and Accommodation and Food Services in the regional training market is reflected in the popularity of enrolments in Sales Assistant and Waiter qualifications.
Qualification profile The Inner Metropolitan workforce has a much higher than average education profile. Just over half the
workforce is educated to degree level, compared to a Victorian average of 30 per cent. The proportion of the workforce qualified to vocational training level, however, is below the Victorian average – linking back to the region‟s low vocational training student participation rate (Figure 5).
A relatively high proportion of enrolments in this region are at Diploma level and above (19 per cent of the total, the highest proportion across all Victorian regions), suggesting training providers are well placed to respond to the labour market requirement for higher level qualifications in this region.
Two of the most popular courses are the Certificate IV in Business Administration and the Diploma of Management, suggesting a demand for general business and management skills in this region.
Certificate I in Vocational Preparation, a foundation skills course, also attracted high enrolment numbers in Inner Metropolitan.
Figure 9: Qualification trends – workforce and vocational training
14%
7%
5%
4%
3%
3%
3%
3%
2%
2%
8%
5%
4%
4%
1%
2%
5%
2%
1%
2%
Office Manager
Sales Assistant
General Clerk
Waiter
Call or Contact Centre Operator
Factory Process Workers
Child Care Worker
Fitness Instructor
Call or Contact Centre Team Leader
Warehouse Administrator
Enrolments 2012 (% total)
Inner Melbourne Victoria
Top qualifications 2012
Certificate IV in Business
Administration8,100
Certificate I in Vocational
Preparation8,100
Certificate III in Retail 7,800
Diploma of Management 7,800
Certificate III in Hospitality 6,200
These 5 courses accounted for 21% of all
government funded training in the region
32,300
114,400
34,700
Cert I-II Cert III-IV Diploma & Above
Qualification level 2012(% change since 2011)
54% 39% 10%
25%
1%
11%
12%
51%
38%
1%
20%
11%
30%
No non-schoolqualifications
Cert I-II
Cert III-IV
Diploma +
Higher education
Workforce qualifications 2011 (%
total)
Inner Metro Victoria
Source: ABS Census 2011

Regional Training Profiles
220 Victorian Training Market Quarterly Report Full Year 2012
Student profile Figure 10: Working age participation
76
Figure 10 highlights vocational training participation among different cohorts, comparing working age vocational training students resident in Inner Metropolitan with the region‟s working age resident population. Figures referred to in earlier charts and tables in this section relate to enrolments in the region by students that may or may not be resident in the region.
Just 21,300 vocational training students are resident in Inner Metropolitan compared with 151,900 enrolled in Vocational training in the region in 2012, clearly demonstrating the role training providers in this region play in serving the wider Melbourne population.
Inner Metropolitan has the second highest proportion of unemployed vocational training students in the state (Western Metrpolitan has the highest, with 28 per cent of students). The proportion of unemployed students in this region has increased from 22 per cent to 25 per cent over the last 12 months, compared with a Victorian average of 23 per cent.
Inner Metropolitan has the lowest proportion of youth (15-19 years old) and mature age (45 years and over) students in Victoria. In contrast, the proportion of students aged 20 to 44 is the highest in the state – in line with the region‟s demographic profile.
76
Note: disabled students appear disproportionally high due to different definitions of disability in use by the Australian Bureau
of Statistics and the Victorian VET Student Statistical Collection. Data for unemployed residents is restricted to the working age
population and factors in those not in the labour force and therefore does not match the regional unemployment rate in Figure 1.
30%
6%
1%
50%
25%
16%
14%
26%
1%
0%
51%
4%
6%
25%
CALD
Disabled(see footnote)
Indigenous
Female
Unemployed(see footnote)
Youth (15-19)
Mature age (45+)
Working age students and population, % total
Students Population
Source (popn data): ABS Census 2011

221 Victorian Training Market Quarterly Report Full Year 2012
Appendix – Key Terms
Accredited short course
An accredited short course is a program of learning that comprises one or more components (e.g. units of competency, modules or subjects) that has been accredited by an accrediting authority
Australian Qualification Framework (AQF)
An AQF qualification is the result of an accredited complete program of learning that leads to formal certification that a graduate has achieved learning outcomes as described in the AQF
Completions When a Learner has completed the full qualification or skill set and a Certificate or Statement of Attainment has been issued.
Enrolments A course enrolment indicates a funding-based enrolment by a student in at least one module within a specified course at a registered training provider
Foundational knowledge and skills
Foundational knowledge and skills are initial or introductory knowledge and skills upon which further development can be built
GRP Gross Regional Product (GRP) is the market value of all final goods and services produced by all firms in an economy (as distinguished from goods still in the process of production that are purchased by one firm from another for further processing and resale, which are included in total turnover).
Labour market outcomes
Labour market outcomes encompasses outcomes that lead to successful employment; employment at successively higher skill levels; the opening of pathways to further education leading to employment and improved workplace productivity through skills utilisation.
Skills shortage
Skill shortages exist when employers are unable to fill or have considerable difficulty filling vacancies for an occupation, or significant specialised skill needs within that occupation, at current levels of remuneration and conditions of employment, and in reasonably accessible locations. (DEEWR)
Skills gap A skills gap is the difference between the workforce required to perform a current or prospective operation and the workforce available. Skills gaps may include the number of qualified workers available to perform particular job roles, or the specific skills that workers need to perform a job role. (DEEWR)
Recruitment difficulty
Recruitment difficulties occur when some employers have difficulty filling vacancies for an occupation. There may be an adequate supply of skilled workers but some employers are unable to attract and recruit sufficient, suitable workers for reasons which include: specific experience or specialist skill requirements of the vacancy; differences in student contact hours of work required by the employer and those sought by applicants; or particular location or transport issues. (DEEWR)
Registered training organisation (RTO)
A registered training organisation is a vocational education and training organisation registered by a state or territory registering body in accordance with the Australian Quality Training Framework (AQTF) Essential Standards for Registration within a defined scope of registration
Student participation rate
The number of working age (15 to 64 years) vocational education and training students as a proportion of the population aged 15 to 64 years.
Source: DEEWR (2011) Critical Skills Investment Fund Developing Workforce Capability; Australian Qualification Framework
(2012) Glossary of Terms

Victorian Training Market Quarterly Report Full Year 2012 222
Appendix – References
Apprentices and trainees Karmel, T. and Misko, J. 2009 Apprenticeships and traineeships in the downturn, Occassional Paper, NCVER.
Industry Profile Sources Agrifood Skills Australia, Environmental Scan 2012
Australian Bureau of Statistics, Counts of Australian Businesses, including entries and exits Jun 2009 to Jun 2011, January 2012
Australian Bureau of Statistics, Labour Mobility Survey, February 2012
Australian Logistics Council, Contribution of Transport & Logistics to the Economy, 2007
Auto Skills Australia, Automotive Environmental Scan 2012
Community Services and Health Industry Skills Council, Environmental Scan 2012
Deloitte Access Economics, 2012 ITAB Market Effectiveness Report, March 2013
Deloitte Access Economics, Victorian Skill Needs in 2011, March 2011
Department of Education, Employment and Workplace Relations, Industry Employment Outlook Reports, 2010 and 2012
Department of Innovation, Industry and Regional Development, The 2007 Victorian Transport and Logistics Industry Report, September 2007
Government Skills Australia, Environmental Scan 2012
Government of Victoria 2012-13 Victorian Budget Update, December 2012a
Government of Victoria Securing Victoria’s Economy: Planning Building Delivering, December 2012b
IBSA, Environmental Scan 2012, Cultural & Creative Industries
Manufacturing Skills Australia, Environmental Scan 2012
Monash Centre of Policy, Employment Forecasts, June 2012
Productivity Commission, Economic Structure and Performance of the Australian Retail Industry, 2011
PwC and Frost & Sullivan, Australian Online Shopping Market and Digital Insights: An Executive Overview, July 2012
Service Skills Australia, Environmental Scan 2012, Sport, Fitness & Recreation
Service Skills Australia, 2012 Tourism, Hospitality and Events Environmental Scan
Service Skills Australia, 2012 Wholesale, Retail and Floristry Environmental Scan
Service Skills Australia, 2013 Retail and Wholesale Environmental Scan: Discussion Paper
Service Skills Australia, 2013 Sport, Fitness and Recreation Environmental Scan: Discussion Paper
Service Skills Australia, 2013 Tourism, Travel and Hospitality Environmental Scan: Discussion Paper
SkillsDMC, Environmental Scan 2012
State Services Authority, Workforce planning risks and challenges in the Victorian public sector, 2011
Transport and Logistics Industry Skills Council, Transport and Logistics Environmental Scan 2012Regional Profile Sources

Appendix
Victorian Training Market Quarterly Report Full Year 2012 223
Regional Profile Sources Loddon Mallee North
Allen Consulting Group, Skills and Training Needs of the Agricultural Sector in Hume, Loddon Mallee and South East Metro, August 2012
Department of Planning and Community Development, Loddon Mallee North Regional Growth Plan
RDA Loddon Mallee Committee, Loddon Mallee Regional Strategic Plan – Annual Report 2011-12
RDA Loddon Mallee Committee, Loddon Mallee North Regional Strategic Plan Overview, September 2010
RDA Loddon Mallee Committee, Loddon Mallee North Economic Snapshot, September 2012
Regional Development Victoria, Regional Economic Profile: Loddon Mallee North, December 2012
Regional Development Victoria, Economic Profiles by Functional Economic Areas: Loddon Mallee North, December 2012
Loddon Mallee South
Department of Planning and Community Development, Loddon Mallee South Regional Growth Plan
RDA Loddon Mallee Committee, Loddon Mallee South Economic Snapshot, September 2012
RDA Loddon Mallee Committee, Southern Loddon Mallee Regional Strategic Plan, September 2010
Regional Development Victoria, Regional Economic Profile: Loddon Mallee South, December 2012
Regional Development Victoria, Economic Profiles by Functional Economic Areas: Loddon Mallee South, December 2012
Wimmera Southern Mallee
Regional Development Victoria, Regional Economic Profile: Wimmera Southern Mallee, December 2012
Regional Development Victoria, Economic Profiles by Functional Economic Areas: Wimmera Southern Mallee, December 2012
Regional Development Victoria, Victorian Regions - Wimmera Southern Mallee, http://www.rdv.vic.gov.au/victorian-regions/grampians/wimmera-southern-mallee
Department of Planning and Community Development, Draft Regional Growth Plan, Regional Growth Plans, A Vision for Victoria: Wimmera Southern Mallee, December 2012
Central Highlands
Department of Planning and Community Development, Draft Regional Growth Plan, Regional Growth Plans, A Vision for Victoria: Central Highlands, 2012
Regional Development Victoria, Regional Economic Profile: Central Highlands, December 2012
Regional Development Victoria, Economic Profiles by Functional Economic Areas: Central Highlands, December 2012
Trevor Budge Research & Planning, Parsons Brinckerhoff and SGS Economics & Planning, Central Highlands Regional Strategic Plan, 2010
Great South Coast
Regional Development Victoria, Economic Profiles by Functional Economic Areas: Great South Coast, December 2012.
Regional Development Victoria, Regional Economic Profile: Great South Coast, December 2012.
Geelong and Surroundds
G21 - The Geelong Regional Alliance, The Geelong Regional Plan: a sustainable growth strategy
Hume
Regional Development Victoria, Economic Profiles by Functional Economic Areas: Hume, December 2012
Regional Development Victoria, Regional Economic Profile: Hume, December 2012
Regional Development Victoria, The Hume Strategy for sustainable communities, 2010-2020

Appendix
224 Victorian Training Market Quarterly Report Full Year 2012
Gippsland
Regional Development Victoria, Regional Economic Profile: Gippsland, December 2012
Regional Development Victoria, Economic Profiles by Functional Economic Areas: Gippsland, December 2012
Northern Melbourne
Northern Melbourne RDA Committee, Strategic Regional Plan 2012-13, August 2012
Northern Melbourne RDA Committee, Melbourne’s North: Socio-economic overview, November 2011
Northern Melbourne RDA Committee, Manufacturing in Melbourne’s North: Now and into the future, 2012
Southern Melbourne
Regional Development Australia and Regional Development Victoria, A Framework for Supporting Growth and Sustainability in Melbourne’s South: A Regional Plan for the Southern Melbourne Region
Eastern Metropolitan
Regional Development Victoria, Regional Economic Profile: The Eastern Metropolitan region, December 2012
Regional Development Victoria, Economic Profiles by Functional Economic Areas: The Eastern Metropolitan region, December 2012
Western Melbourne
Regional Development Australia and Regional Development Victoria, Western Melbourne Regional Plan, August 2012.
Inner Melbourne
Inner Melbourne Action Plan: ‘Making Melbourne More Liveable’
All regions
Australian Bureau of Statistics, Census 2011
Australian Bureau of Statistics, National Regional Profiles, 2006-2010
.id, Community Profiles
National Institute of Economic and Industry Research