view article online chemical science
TRANSCRIPT

rsc.li/chemical-science
Chemical Science
rsc.li/chemical-science
ISSN 2041-6539
EDGE ARTICLEXinjing Tang et al. Caged circular siRNAs for photomodulation of gene expression in cells and mice
Volume 9Number 17 January 2018Pages 1-268 Chemical
Science
This is an Accepted Manuscript, which has been through the Royal Society of Chemistry peer review process and has been accepted for publication.
Accepted Manuscripts are published online shortly after acceptance, before technical editing, formatting and proof reading. Using this free service, authors can make their results available to the community, in citable form, before we publish the edited article. We will replace this Accepted Manuscript with the edited and formatted Advance Article as soon as it is available.
You can find more information about Accepted Manuscripts in the Information for Authors.
Please note that technical editing may introduce minor changes to the text and/or graphics, which may alter content. The journal’s standard Terms & Conditions and the Ethical guidelines still apply. In no event shall the Royal Society of Chemistry be held responsible for any errors or omissions in this Accepted Manuscript or any consequences arising from the use of any information it contains.
Accepted Manuscript
View Article OnlineView Journal
This article can be cited before page numbers have been issued, to do this please use: D. O’Nolan, H.
Zhao, Z. Chen, A. Grenier, M. L. Beauvais, M. Newton, T. Nenoff, P. J. Chupas and K. Chapman, Chem.
Sci., 2021, DOI: 10.1039/D1SC04232G.

ARTICLE
Please do not adjust margins
Please do not adjust margins
Received 00th January 20xx,Accepted 00th January 20xx
DOI: 10.1039/x0xx00000x
A multimodal analytical toolkit to resolve correlated reaction pathways: The case of nanoparticle formation in zeolitesDaniel O’Nolan,†a Haiyan Zhao,†b Zhihengyu Chen,a Antonin Grenier,a Michelle L. Beauvais,a Mark A. Newton,c Tina M. Nenoff,*d Peter J. Chupas,*a,b,e and Karena W. Chapman*a,b
Unravelling the complex, competing pathways that can govern reactions in multicomponent systems is an experimental and technical challenge. We outline and apply a novel analytical toolkit that fully leverages the synchronicity of multimodal experiments to deconvolute causal from correlative relationships and resolve structural and chemical changes in complex materials. Here, simultaneous multimodal measurements combined diffuse reflectance infrared Fourier transform spectroscopy (DRIFTS) and angular dispersive X-ray scattering suitable for pair distribution function (PDF), X-ray diffraction (XRD) and small angle X-ray scattering (SAXS) analyses. The multimodal experimental data was interpreted via multi-level analysis; conventional analyses of each data series were integrated through meta-analysis involving non-negative matrix factorization (NMF) as a dimensional reduction algorithm and correlation analysis. We apply this toolkit to build a cohesive mechanistic picture of the pathways governing silver nanoparticle formation in zeolite A (LTA), which is key to designing catalytic and separations-based applications. For this Ag-LTA system, the mechanisms of zeolite dehydration, framework flexing, ion reduction, and cluster and nanoparticle formation and transport through the zeolite are elucidated. We note that the advanced analytical approach outline here can be applied generally to multimodal experiments, to take full advantage of the efficiencies and self-consistencies in understanding complex materials and go beyond what can be achieved by conventional approaches to data analysis.
IntroductionConfining metal species within the robust, uniform pores of a zeolite host is a widespread strategy to control their structure, dispersion, and consequently their applications in heterogeneous catalysis and beyond.1, 2 As is common for many complex functional materials systems,3-7 the synthesis and performance of these materials is underpinned by fundamental processes wherein structure and chemistry are coupled across multiple length scales. Reactions on the local atomic scale both control and are themselves controlled by chemical transport and crystallographic transformations that occur on the scale of the whole particle.
The different reaction pathways that are known to drive metal nanoparticle formation within zeolites exemplify the complexity of the underlying processes.8 In the case of metal ion-exchanged zeolites, both chemical reduction and thermal dehydration of
adsorbed water can induce nanoparticle formation.8 The interdependent components of the system include: the structure of the zeolite host framework; the geometry of the pore network; the functionality of the pore surface; and the identity and distribution of the species within the pore (e.g. water, cations).9, 10 Together, they impact metal mobility, transport, and diffusion within or through the pores. Importantly, these are also key to controlling the aggregation or confinement of species within the zeolite pores. Understanding and controlling nanoparticle formation inside zeolites is fundamental to many industrially relevant systems,1, 11-14 and, therefore, the elucidation of these mechanisms of high importance and relevance. Clusters confined by the zeolite pores may offer enhanced catalytic activity, sintering resistance, or a favorable distribution for waste capture,15 with access to the Ag being controlled by the zeolite pores. Larger nanoparticles on the zeolite surface may be more easily accessed by reagents, but with increased potential for sintering.
The challenge in unravelling complex and correlated phenomena requires comprehensive characterization, beyond the scope and sensitivity of any individual experimental tool16. To resolve the critical interplay between such correlated phenomena, we outline a generally applicable analytical toolkit that integrates multimodal experimental characterization through a multi-level analysis of the resulting data that combines traditional, tool-specific analyses (e.g. structural modeling and parametric analysis of X-ray scattering data) with tool-independent meta-analysis involving dimensional reduction algorithms and correlation analyses. The result is a unified mechanistic picture, spanning diverse chemistries and length scales, that identifies key causal relationships and chemical drivers that
a.Department of Chemistry, Stony Brook University, 100 Nicolls Rd, Stony Brook, New York, 11790, United States. Email: [email protected]
b.X-ray Science Division, Advanced Photon Source, Argonne National Laboratory, Lemont, Illinois, 60439, United States.
c. Department of Chemistry and Applied Biosciences, ETH Zürich, Zürich, Switzerland.
d.Sandia National Laboratories, Materials Chemicals and Physics Center, Albuquerque, New Mexico 87185, United States. Email: [email protected]
e. Associated Universities Inc, 16th Street NW, Suite 730, Washington, DC, 20036. Email: [email protected]
† These authors contributed equally. Electronic Supplementary Information (ESI) available: Details of multimodal measurements and conventional analyses. See DOI: 10.1039/x0xx00000x
Page 1 of 12 Chemical Science
Che
mic
alS
cien
ceA
ccep
ted
Man
uscr
ipt
Ope
n A
cces
s A
rtic
le. P
ublis
hed
on 1
3 Se
ptem
ber
2021
. Dow
nloa
ded
on 1
0/2/
2021
7:4
7:12
PM
. T
his
artic
le is
lice
nsed
und
er a
Cre
ativ
e C
omm
ons
Attr
ibut
ion-
Non
Com
mer
cial
3.0
Unp
orte
d L
icen
ce.
View Article OnlineDOI: 10.1039/D1SC04232G

ARTICLE Journal Name
2 | J. Name., 2012, 00, 1-3 This journal is © The Royal Society of Chemistry 20xx
Please do not adjust margins
Please do not adjust margins
control the reaction progress and outcome. Without being able to disentangle the causal from the correlative relationships within these complex systems, deliberate control of the structure and function is impaired. In multimodal characterization, several individual experimental tools, which are typically applied separately, are combined to probe the same volume of sample at the same time; each of the tools being sensitive to different components or aspects of the system. In correlative microscopies, images from different tools can be overlapped to spatially correlate information coming from the same coordinates within the sample. For dynamic, reactive systems, the outstanding challenge derives from integrating and interpreting the time-dependence of the different data and fitting models against the multiple types of heterogeneous data. While multimodal experiments combining various different probes have been enabled,16-18 our ability to analyse and interpret the data to take advantage of the simultaneity of the method and go beyond that which can be achieved by conventional (probe-by-probe) approaches to data analysis, have lagged behind.19
Here, focusing on the example of the synthesis of Ag particles within the nanoporous zeolite LTA, we combine simultaneous infrared spectroscopy and X-ray scattering to identify the chemical reactions and structural changes that govern the reduction, mobility and final distribution of the Ag. Diffuse reflectance infrared spectroscopy and angular dispersive X-ray scattering (DRIAD-X)20-22 measurements are geometrically compatible such that both X-ray and infrared beams can probe a coincidental volume of sample simultaneously. X-ray scattering directly probes structure, most notably the structure of the strongly X-ray scattering components (e.g. Ag). While the analysis of the pair distribution function (PDF) reveals local scale structure (e.g. bond distances, particle size),15, 23 analysis of the diffraction intensities reveals longer range ordered structure,24 and analysis of small-angle scattering data reveals nanoscale structure.25, 26 Infrared spectroscopy reveals molecular vibrations that are characteristic of distinct chemical species that may be largely invisible to X-rays; this allows the different chemical species and environments, including the pore water and surface hydroxyl functionalities, to be identified.
Beyond conventional analyses of the individual types of complementary data, we employ non-negative matrix factorization (NMF) and correlation analyses to address the challenge of integrating and comparing the large volume of heterogeneous data from the multi-modal measurements. We use these data science tools to analyze different but complementary types of data as a whole, to provide a coherent picture of the system. Specifically, this provides the signature of the chemical and structural characteristics of the different reaction stages of the material system. The interdependency and cooperativity between different parts of the system are unraveled and made evident, resulting in a meaningful unified picture of the nanoparticle growth within a zeolite.
Figure 1. A representation of the LTA framework highlighting the pore connectivity with 8-member ring apertures (blue) that connect α-cages and the 6-member ring apertures (cyan) that connect α- and β-cages.
The aluminosilicate zeolite A (Linde Type A or LTA) explored here has a three-dimensional pore network that contains charge-compensating Na cations and water molecules.27-29 The native Na+ cations can be exchanged by Ag+ to give Ag-exchanged LTA. Upon heating at moderate temperature in reducing atmosphere, or at higher temperature in inert atmosphere, leads to the formation of zeolite supported, catalytically active, Ag nanoparticles.8 The dynamic chemistry of the supported Ag species is mediated by the nanoporosity of the LTA zeolite framework (Figure 1). It is a cubic three-dimensional structure formed by sodalite (β) cages that are connected at double 4 rings to define the larger super (α) cage. These super-cages are linked to each other via 8-member ring apertures (4.2 Å diameter) and to the β-cages via 6-member ring apertures (2.2 Å diameter).29
Experimental MethodsMultimodal experiments were undertaken using the DRIAD-X set up at beamline 11-ID-B of the Advanced Photon Source at Argonne National Laboratory to probe Ag0 nanoparticle formation in Ag-exchanged LTA under either chemically reducing or auto-reduction conditions.20 X-ray scattering and diffuse reflectance infrared Fourier transform spectroscopy (DRIFTS) data were collected during temperature ramping to 320 °C under reducing (4% H2 in He) and inert (He) gas atmospheres, respectively, to induce Ag nanoparticle formation. The parallel acquisition of X-ray and infrared data was synchronized at 1 min intervals, to enable simultaneous event monitoring. The X-ray beam was aligned to probe a sample volume just below the surface of the sample, coincident with the region probed by the IR beam (see Supporting Information, SI).20
X-ray scattering images were reduced to one-dimensional intensity data as a function of scattering angle.30 The scattering intensity data were analyzed in TOPAS31 with lattice parameters, diffraction peak intensities, and the small angle feature intensity quantified using Le Bail method ( space group) and pseudo-Voigt functions. 𝑷𝒎𝟑𝒎More details are available in supporting information. Structure envelopes were calculated at selected temperatures, based on the measured peak diffraction intensities, as described previously.32 X-
Page 2 of 12Chemical Science
Che
mic
alS
cien
ceA
ccep
ted
Man
uscr
ipt
Ope
n A
cces
s A
rtic
le. P
ublis
hed
on 1
3 Se
ptem
ber
2021
. Dow
nloa
ded
on 1
0/2/
2021
7:4
7:12
PM
. T
his
artic
le is
lice
nsed
und
er a
Cre
ativ
e C
omm
ons
Attr
ibut
ion-
Non
Com
mer
cial
3.0
Unp
orte
d L
icen
ce.
View Article OnlineDOI: 10.1039/D1SC04232G

Journal Name ARTICLE
This journal is © The Royal Society of Chemistry 20xx J. Name., 2013, 00, 1-3 | 3
Please do not adjust margins
Please do not adjust margins
ray PDFs were derived from the scattering intensity data subtracting the contribution from the sample environment.33 Structural models were refined against the PDF data34 at selected temperatures and a linear combination analysis,35 applied to evaluate the changing abundance of different phases observed in the PDF data. The intensity and position of features in the DRIFTS data were quantified.36
The one-dimensional X-ray scattering, PDF and DRIFTS data and the features quantified through the conventional analyses of these data (as described above) were stored as data frames using the Pandas Python package for data science and analysis.37 NMF, implemented in sci-kit learn,38 was applied to the temperature-dependent features quantified for the X-ray scattering, PDF and DRIFTS data, to extract underlying components, weightings and correlations (e.g., reaction trends and intermediates). Pearson correlation analysis of the one-dimensional XRD, PDF and DRIFTS data, implemented in Pandas37 was undertaken to evaluate the degree of similarity between individual series of data. The onsets of changes in the individual data series were assessed based on the absolute value of the derivative with respect to temperature of the Pearson correlation coefficient, |p′|, for each data point compared to the initial, room temperature data.
ResultsHeating Ag-exchanged LTA in either atmosphere leads to the formation of Ag metal clusters and nanoparticles. Rapid changes in the X-ray scattering, PDF, and DRIFTS data, reflect transitions between different states of the system. They are observed in two temperature regimes in both the reducing and inert atmospheres, with a more gradual evolution between those transitions which is readily visualized in both the raw data (Figure 2) and the
Figure 2. The temperature-dependent a) PDF, b) XRD, and c) DRIFTS data obtained from multimodal DRIAD-X measurements during heating in reducing (left) and inert (right) atmospheres. The first (blue) and second (red) transition regions, and significant features in the data are highlighted. For clarity, DRIFTS data is shown with baseline subtracted.
corresponding Pearson correlation arrays (Figure S2). The different states of the system can be described by considering the features in the data between transitions. Key changes in the Ag-zeolite system reflect pore water and hydroxyl-group loss, distortions of the zeolite lattice, relocation of the Ag+ ion, Ag0 cluster formation, Ag0 nanoparticle formation, and diffusion of species from within the zeolite pores. As detailed below, we use the term cluster distinguish sub-nanometer sized particles and from larger nanoparticles.
Though the temperature regimes are different, the features of the initial, intermediate, and final state of the system, and the changes that occur during the transitions, are similar for reducing and inert atmospheres, with a few key differences noted later.
Taken as a whole, several key observations are immediately apparent. There are two main transitions seen in both atmospheres
Page 3 of 12 Chemical Science
Che
mic
alS
cien
ceA
ccep
ted
Man
uscr
ipt
Ope
n A
cces
s A
rtic
le. P
ublis
hed
on 1
3 Se
ptem
ber
2021
. Dow
nloa
ded
on 1
0/2/
2021
7:4
7:12
PM
. T
his
artic
le is
lice
nsed
und
er a
Cre
ativ
e C
omm
ons
Attr
ibut
ion-
Non
Com
mer
cial
3.0
Unp
orte
d L
icen
ce.
View Article OnlineDOI: 10.1039/D1SC04232G

ARTICLE Journal Name
4 | J. Name., 2012, 00, 1-3 This journal is © The Royal Society of Chemistry 20xx
Please do not adjust margins
Please do not adjust margins
studied (see Figure 2). The first transition is observed within a similar temperature range (~55-95°C). By contrast, the second transition occurs at lower temperature in reducing (140−175 °C) compared to inert (>250-275°C) atmosphere. Under the inert atmosphere, the second transition is not completed over the temperature range evaluated here; only the initial stages of the second transition are observed. We expect that if heated to higher temperatures, the complete second transition would mirror the behavior seen in reducing atmosphere.
Detailed below are the findings associated with a conventional analysis of the individual types of characterization data.
Pair distribution function data. The PDFs contain contributions from all atom-atom pairs within the sample, including those from the zeolite lattice and the supported Ag material. The temperature-dependent PDF data, in both reducing and inert atmospheres, can be described by the change in population of distinct species: the initial LTA phase, an intermediate LTA phase, a final LTA phase, small Ag clusters and 4-nm-diameter Ag0 nanoparticles with a face-centered
cubic (fcc) structure (Figure 3a). Both the initial and intermediate LTA phases contain cationic Ag+. The small Ag clusters are sub-nanometer sized, based on only contributing peaks to the PDF at short distance (<6 Å); these are small enough to be enclosed within the LTA pores. The 4-nm-diameter Ag0 nanoparticles are much larger than the dimensions of the LTA pores and likely form on the outer surface of the LTA particles.
Refinement of structural models against the PDF data (see Figure S7) show that the first transition, a transformation between the initial and intermediate LTA phase, involves an expansion of the LTA lattice parameter and a contraction of Ag···O distances as Ag+ cations that are centered over the 6-ring (protruding by 0.55 Å from the plane of the O atoms) shift into the plane of the 6-ring (see Figure 4). The second transition involves yet another transformation between the intermediate and final LTA phases, as the Ag+ are removed from the 6-ring, evident as the elimination of the Ag…Si peak at ~3.2 Å, and the framework relaxes back to the original dimensions.
Figure 3. Summary of key results from conventional analysis of the a) PDF, b) X-ray scattering and c) DRIFTS data for heating in reducing (left) and inert (right) atmosphere. Commensurate data in both atmospheres are shown on the same scale. The first (blue) and second (red) transition regions are highlighted.
Page 4 of 12Chemical Science
Che
mic
alS
cien
ceA
ccep
ted
Man
uscr
ipt
Ope
n A
cces
s A
rtic
le. P
ublis
hed
on 1
3 Se
ptem
ber
2021
. Dow
nloa
ded
on 1
0/2/
2021
7:4
7:12
PM
. T
his
artic
le is
lice
nsed
und
er a
Cre
ativ
e C
omm
ons
Attr
ibut
ion-
Non
Com
mer
cial
3.0
Unp
orte
d L
icen
ce.
View Article OnlineDOI: 10.1039/D1SC04232G

Journal Name ARTICLE
This journal is © The Royal Society of Chemistry 20xx J. Name., 2013, 00, 1-3 | 5
Please do not adjust margins
Please do not adjust margins
Figure 4. The 6-ring in the LTA framework, showing the shift of the Ag+ cation into the plane of the 6-ring and the extraction of the Ag+ from the 6-ring to form Ag clusters that accompanies the transformations between the initial and intermediate LTA and the intermediate and final LTA, respectively.
During the first transition, while in a reducing atmosphere, the small Ag clusters appear. The population of these small Ag clusters initially grows at the onset of the second transition, then decreases with heating beyond the transition. The large Ag nanoparticle population emerges during the second transition and continues to increase in population. With heating beyond the transition, the Ag cluster population decreases.
The transformations of the LTA lattice in the inert atmosphere are the same as those seen under reducing atmosphere. However, in inert atmosphere the second transition is shifted to higher temperature and remains incomplete within the temperature range evaluated. Unlike the observations made under reducing atmosphere, the first transition, and the formation of the intermediate LTA state, are not accompanied by the formation of Ag0 clusters. Instead, small Ag0 clusters are only apparent at the onset of the second transition, preceding the formation of the fcc Ag0 nanoparticles.
X-ray scattering data. The X-ray diffraction data show peaks associated with cubic LTA framework throughout the reaction. Upon heating in both reducing and inert atmospheres, the LTA lattice initially contracts a little (<0.1 %), but then expands sharply by ~0.6% during the first transition (Figure 3b). With further heating, the lattice continues to contract slightly (<0.1%), before contracting sharply during the second transition where it approached the original dimensions. Peaks from crystalline Ag0 with an fcc structure (e.g., at 2.7 Å−1) appear during the second transition (Figure 3b).
For heating in the reducing atmosphere, a small angle scattering feature appears at low Q (<0.4 Å−1) during the first transition (Figure 3b). Small-angle scattering reflects nanoscale structures (density fluctuations) and is a signature for the formation of small Ag particles. The intensity of the small angle scattering feature initially increases during the second transition, then decreases with further heating, as diffraction peaks from Ag0 metal appear and grow.
In contrast to observations made under reducing atmosphere, in the inert atmosphere the small angle scattering (i.e., nanoscale structure) is not observed during the first transition and appears only
later during the second transition. The small angle scattering feature grows in at a slightly lower temperature (by ~50 °C) than the diffraction peaks from Ag0 metal.
Difference envelope density (DED) analysis. While direct refinement of structural models against the powder diffraction data are limited by the low angular resolution, the distribution of electron density (i.e. species) within the pores can be mapped using a difference envelope density (DED) analysis.39, 40 The DED is derived from the structure envelopes—a low-resolution surface that divides regions of high electron density (i.e., occupied by the framework and Ag guests) and regions of low electron density (i.e., unoccupied pore space)—calculated based on the peak intensities measured at low angles.39 By subtracting the structure envelopes measured in a different state, the change in the distribution of species within the pore can be evaluated. The DED reflects the electron density distribution; this is dominated by the strongly scattering Ag species with a smaller contribution from water molecules in the pores.
DEDs, showing the changes in distribution of pore species associated with the first transition, were obtained by comparing the initial and intermediate LTA states (i.e., before and after the first transition in inert atmosphere). These show that during the first transition, electron density (i.e., Ag+ cations) relocates from above the plane of the 6- and 8-rings, to in the plane of both rings (Figure 5).
DEDs showing the changes associated with the initial Ag cluster formation were obtained by comparison of the structure envelope for the intermediate states under reducing atmosphere (where Ag clusters have formed), with that derived under the inert atmosphere (where no Ag clusters form). During the formation of the Ag clusters, electron density (i.e., Ag+ cations) is removed from the planes of the 6- and 8-rings. New electron density is distributed around a shell in the super-cage, indicating disorder of the Ag cluster within the cage.
Figure 5. DEDs reflecting the change in the Ag distribution within the α-cage that accompanies (a) the first LTA transformation (LTAinitial-LTAintermediate) and (b) Ag cluster formation from LTAintermediate. Symmetry-related surfaces are colored the same shade.
DRIFTS data. The temperature-dependent DRIFTS spectra are dominated by H2O and -OH vibrational modes above 1600 cm–1 and T-O framework modes below 1600 cm–1. During heating in both reducing and inert atmospheres, the intensity of bands associated with the original H2O/-OH modes progressively disappear (Figure 3c).41 New bands associated with surface -OH stretching modes (i.e. Brønsted acid sites) form following protonation of the framework.41-
45 The changes in peak intensities effectively track either, the change in concentration of H2O within the pores, or surface -OH groups that form during Ag reduction. An increase in the spectral “baseline”
Page 5 of 12 Chemical Science
Che
mic
alS
cien
ceA
ccep
ted
Man
uscr
ipt
Ope
n A
cces
s A
rtic
le. P
ublis
hed
on 1
3 Se
ptem
ber
2021
. Dow
nloa
ded
on 1
0/2/
2021
7:4
7:12
PM
. T
his
artic
le is
lice
nsed
und
er a
Cre
ativ
e C
omm
ons
Attr
ibut
ion-
Non
Com
mer
cial
3.0
Unp
orte
d L
icen
ce.
View Article OnlineDOI: 10.1039/D1SC04232G

ARTICLE Journal Name
6 | J. Name., 2012, 00, 1-3 This journal is © The Royal Society of Chemistry 20xx
Please do not adjust margins
Please do not adjust margins
correlates to lower sample reflectivity (i.e., a darkening or color change) owing to the formation of surface Ag aggregates (nanoparticles and clusters).
Upon heating in the reducing atmosphere, -OH stretching and H2O bending modes lose intensity, dropping rapidly during the first transition.41 These bands are associated with confined and weakly-bound H2O. Immediately following this transition, the H2O-bending and OH-stretching modes are ~20% and ~40% of their original intensity, respectively, with a weak band assigned to -OH stretching from a surface acid site emerging at 3680 cm−1.41-45 Both H2O and surface -OH bands lose intensity with continued heating and are eliminated during the second transition. At this point, sharp peaks, at 3640 cm−1 and 3600 cm−1, associated with acidic -OH groups (Si-OH-Al), appear and the spectral baseline increases.41-45
In comparison, when heating in an inert atmosphere, the -OH stretching and H2O bending modes in the initial spectra follow the same trends observed in reducing atmosphere. However, the onset of the second transition is shifted to a higher temperature. As in reducing atmosphere, the H2O bending and -OH stretching modes immediately after the transition are ~20% and ~40% of their original intensity, respectively. Unlike the observations made under the reducing atmosphere, the first transition is not accompanied by the emergence of acidic -OH species. The H2O bending and -OH stretching bands continue to lose intensity with continued heating and are eliminated during the second transition. Only after this point do sharp peaks associated with acidic -OH groups (Si-OH-Al) appear and the spectral baseline increases.
NMF analysis. NMF is a multivariate analysis that simplifies that data by representing a large complex series of data by a smaller number of variables – the component matrix and the weighting matrix, which show how the contribution of these components, vary with temperature. The complete series of data is reproduced by the product of the component and weighting matrices. This type of analysis has been applied to raw PDF to resolve the PDF of different structural phases or species in the system.46-48
The NMF analysis resolves the distinct, discrete states of the system during the reaction (i.e., reagent or product species/phases and combinations thereof) that are defined by a unique “signature” combination of XRD, PDF, and DRIFTS parameters as NMF components. This is the case even where multiple components are present and where an individual component may not be observed in isolation at any point in the reaction. The NMF identifies the characteristic values of the quantities of interest that define these distinct components. In other words, the NMF identifies where the parameters quantified for the XRD, PDF, and DRIFTS change proportionately, along with how the weighting or relative abundance of that component evolves during the reaction.
Here, the NMF analysis included the DRIFTS intensities at 1640 cm−1 (H2O bending), 3200+3400 cm−1 (OH stretching in H2O), ca. 3600 cm−1 (surface -OH stretching), and the baseline PDF component weightings for LTAinitial, LTAintermediate, LTAfinal, Agclusters, Agnanoparticle, and from the XRD data, the LTA lattice parameter, small-angle scattering intensity, and the fcc Ag0 metal peak intensity. The analysis was undertaken in two stages. Initially, analysis of the reactions in reducing and inert atmospheres was made separately. The data from
the two experiments were then combined and then analyzed together to resolve a common set of components. The weighting of the parameters that define the individual components and the evolution of their relative abundance in reducing and inert atmospheres are shown in Figure 6.
Figure 6. NMF analysis of the parameters of interest quantified for the DRIFTS, PDF, and XRD data. The characteristic contributions of distinct components of the reaction (top) and how the relative abundance of these components evolve through the reaction (bottom)
The results demonstrates that the formation of Ag clusters in both reducing and inert atmosphere can be described in terms of the evolution of only 5 discrete NMF components:
● Component 1 comprises the original starting material consisting of the initial Ag-LTA structure and pore water occupancy.
● Component 2 comprises the expanded, partially dehydrated LTA phase, the “intermediate LTA” state in which the pore water is reduced to ~40% of the initial value, and wherein the Ag+ cations are shifted into the plane of the 6- and 8-rings.
● Component 3 comprises the sub-nanometer-sized Ag cluster (seen in the PDF and SAXS) without contribution from the zeolite (i.e., that exists independent of the crystallographic state of the zeolite).
● Component 4 includes both sub-nanometer-sized Ag cluster and the final LTA structure.
● Component 5 includes both the ~4 nm Ag0 nanoparticles and the final LTA structure.
The evolution in the component weightings necessarily reflect the two transitions described earlier. Here, the first transition is associated with loss of water and LTA transformation. In the reducing atmosphere this is additionally accompanied with the formation of
Page 6 of 12Chemical Science
Che
mic
alS
cien
ceA
ccep
ted
Man
uscr
ipt
Ope
n A
cces
s A
rtic
le. P
ublis
hed
on 1
3 Se
ptem
ber
2021
. Dow
nloa
ded
on 1
0/2/
2021
7:4
7:12
PM
. T
his
artic
le is
lice
nsed
und
er a
Cre
ativ
e C
omm
ons
Attr
ibut
ion-
Non
Com
mer
cial
3.0
Unp
orte
d L
icen
ce.
View Article OnlineDOI: 10.1039/D1SC04232G
Journal Name ARTICLE
This journal is © The Royal Society of Chemistry 20xx J. Name., 2013, 00, 1-3 | 7
Please do not adjust margins
Please do not adjust margins
some reduced Ag clusters (i.e., Component 4). These Ag clusters do not form in the inert atmosphere. Then, the NMF analysis clearly resolves the multiple events that occur during second transition. These are characterized by a transient increase in the population of the Ag clusters (Component 4) at the onset of the transition, but before they decrease in abundance as larger Ag0 nanoparticles form (Component 5) at ~20 K higher temperature. Both these Ag species are supported by the final LTA structure which is present in both Components 4 and 5. That is, this evolution involves a rearrangement of the supported Ag species.
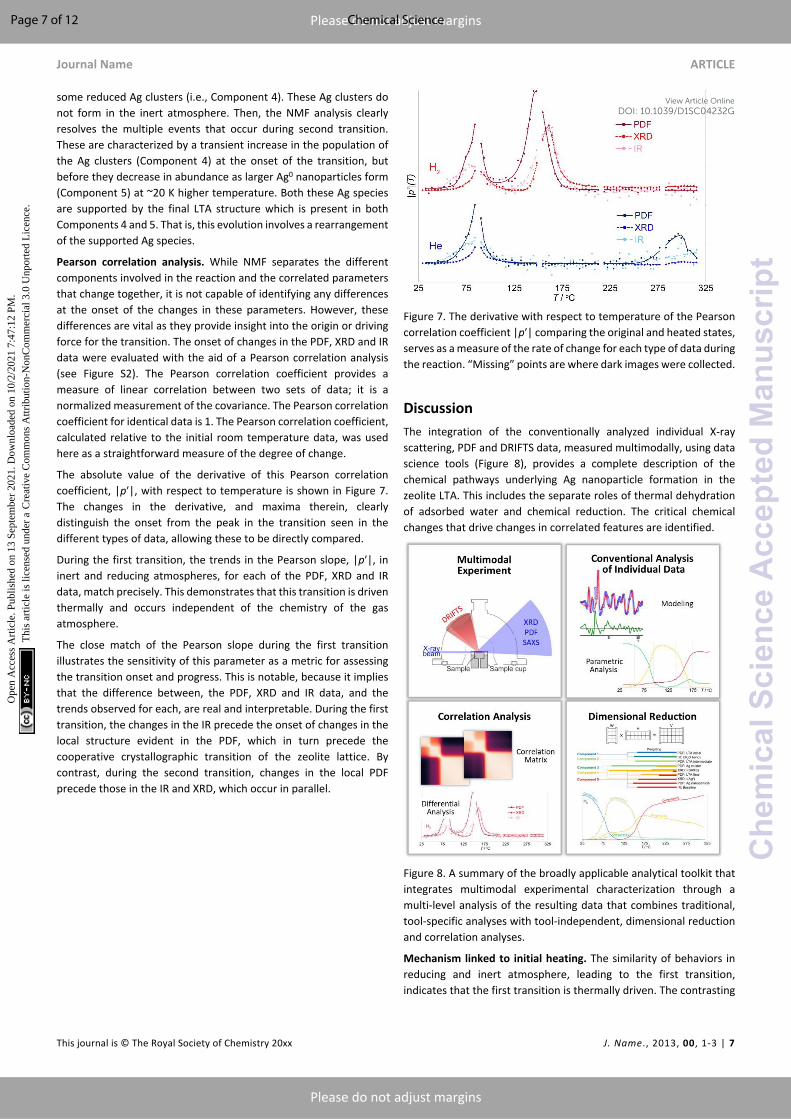
Pearson correlation analysis. While NMF separates the different components involved in the reaction and the correlated parameters that change together, it is not capable of identifying any differences at the onset of the changes in these parameters. However, these differences are vital as they provide insight into the origin or driving force for the transition. The onset of changes in the PDF, XRD and IR data were evaluated with the aid of a Pearson correlation analysis (see Figure S2). The Pearson correlation coefficient provides a measure of linear correlation between two sets of data; it is a normalized measurement of the covariance. The Pearson correlation coefficient for identical data is 1. The Pearson correlation coefficient, calculated relative to the initial room temperature data, was used here as a straightforward measure of the degree of change.
The absolute value of the derivative of this Pearson correlation coefficient, |p′|, with respect to temperature is shown in Figure 7. The changes in the derivative, and maxima therein, clearly distinguish the onset from the peak in the transition seen in the different types of data, allowing these to be directly compared.
During the first transition, the trends in the Pearson slope, |p′|, in inert and reducing atmospheres, for each of the PDF, XRD and IR data, match precisely. This demonstrates that this transition is driven thermally and occurs independent of the chemistry of the gas atmosphere.
The close match of the Pearson slope during the first transition illustrates the sensitivity of this parameter as a metric for assessing the transition onset and progress. This is notable, because it implies that the difference between, the PDF, XRD and IR data, and the trends observed for each, are real and interpretable. During the first transition, the changes in the IR precede the onset of changes in the local structure evident in the PDF, which in turn precede the cooperative crystallographic transition of the zeolite lattice. By contrast, during the second transition, changes in the local PDF precede those in the IR and XRD, which occur in parallel.
Figure 7. The derivative with respect to temperature of the Pearson correlation coefficient |p′| comparing the original and heated states, serves as a measure of the rate of change for each type of data during the reaction. “Missing” points are where dark images were collected.
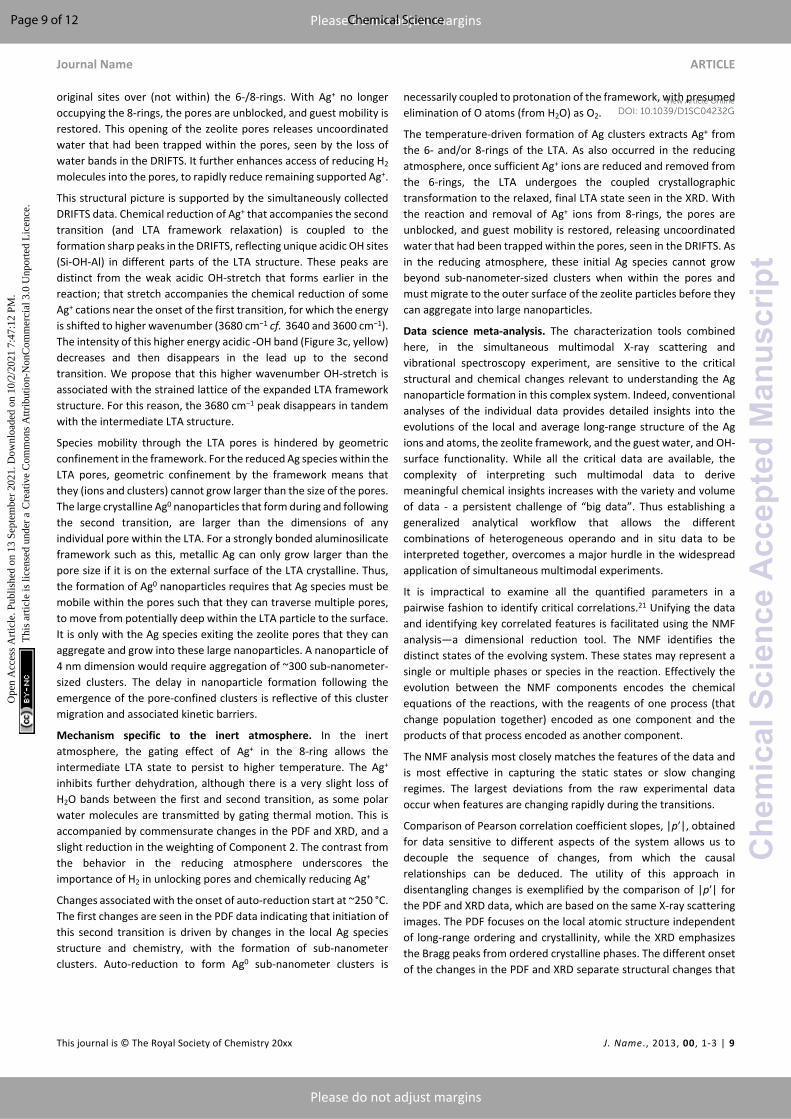
DiscussionThe integration of the conventionally analyzed individual X-ray scattering, PDF and DRIFTS data, measured multimodally, using data science tools (Figure 8), provides a complete description of the chemical pathways underlying Ag nanoparticle formation in the zeolite LTA. This includes the separate roles of thermal dehydration of adsorbed water and chemical reduction. The critical chemical changes that drive changes in correlated features are identified.
Figure 8. A summary of the broadly applicable analytical toolkit that integrates multimodal experimental characterization through a multi-level analysis of the resulting data that combines traditional, tool-specific analyses with tool-independent, dimensional reduction and correlation analyses.
Mechanism linked to initial heating. The similarity of behaviors in reducing and inert atmosphere, leading to the first transition, indicates that the first transition is thermally driven. The contrasting
Page 7 of 12 Chemical Science
Che
mic
alS
cien
ceA
ccep
ted
Man
uscr
ipt
Ope
n A
cces
s A
rtic
le. P
ublis
hed
on 1
3 Se
ptem
ber
2021
. Dow
nloa
ded
on 1
0/2/
2021
7:4
7:12
PM
. T
his
artic
le is
lice
nsed
und
er a
Cre
ativ
e C
omm
ons
Attr
ibut
ion-
Non
Com
mer
cial
3.0
Unp
orte
d L
icen
ce.
View Article OnlineDOI: 10.1039/D1SC04232G

ARTICLE Journal Name
8 | J. Name., 2012, 00, 1-3 This journal is © The Royal Society of Chemistry 20xx
Please do not adjust margins
Please do not adjust margins
ensuing behaviors in reducing and inert atmosphere indicate subsequent changes (including the second transition) depend on the chemistry of the atmosphere. This is because the pores of the initial Ag-exchanged LTA are filled with water molecules; these water molecules physically block the gas molecules surrounding the LTA particles from entering the pores. Molecules in the reducing or inert gas atmospheres cannot interact with Ag species within the LTA pores to impact the reaction progress, until sufficient water has been removed; it is only at this point that the He/H2 molecules are able to enter the pores. Then once pore waters have been removed, the behaviors in the reducing and inert gas atmospheres diverge.
In the lead up to the first transition, the earliest changes are observed in the highly water sensitive DRIFTS data, indicating that this transition is initiated by the removal of water from the zeolite pores. This loss of water leads to a redistribution of other species in the pores which is seen, next in the PDF data, as changes to the local coordination of the Ag cations. Once the local environment of enough Ag cations has changed because of water dehydration, a coupled cooperative structural transition of the zeolite lattice occurs, as is seen by XRD. This transition is characterized by an expansion of the LTA framework, as is needed to accommodate the Ag+ cation, with an ionic radius of 115 pm (diameter 2.30 Å), within the plane of the 6-ring aperture (2.20 Å diameter), instead of being above the plane of the 6-ring aperture (toward the α-cage) as in the initial LTA.
Based on the NMF analysis for components 1 and 2, the intensity of H2O-bending mode at 1640 cm−1 in the DRIFTS is lower by 40% in the intermediate state compared to the initial state of the zeolite. The intensity of this peak is used as a proxy for the pore water content, suggesting that ~16 H2O are removed, and 11 H2O remain per nominal formula unit, Ag12(AlO2)12(SiO2)12O48.27H2O. This corresponds to ca. 0.9 H2O per Ag+ cation. Water molecules coordinated at the Ag cations are more strongly bound and difficult to remove than other hydrogen-bonded water. So, the first transition is driven by the removal of the weakly bound hydrogen-bonded, pore-confined waters only.
The LTA 8-ring is the main window through which species within the pores (H2O, Ag+, Ag clusters) and from the surrounding atmosphere (H2, He) must travel to move through the zeolite pore network. The displacement of Ag+ from the pore (α-cage) and into the 8-ring during the first transition narrows or blocks this window connecting neighboring pores; this is observed in the DED analysis. Extra-framework cations within 8-rings, such as Ag+ here, are known to act as gates, limiting mobility and impeding the mobility of species within the LTA.49
While the Ag+ cation located in the 8-ring reduces movement of species between pores, several transport mechanisms remain. Firstly, large amplitude thermal motion of the cation can allow small molecules to pass. Typically this favors polar molecules (e.g. water)49 and increases with increasing temperature. Secondly, Ag+ cation transport may still proceed through this 8-ring cation site via a conventional hopping mechanism. In this, the 8-ring Ag+ hops to a vacant site in an adjacent pore and is replaced in its original position by an Ag+ from the other pore. Removal of the Ag+ from the 8-ring (e.g., due to reduction or during hopping) reopens the aperture.
The gating of species between pores following the LTA crystallographic transformation impacts the subsequent chemical and structural evolution. This includes slowing further removal of water, gating H2 infiltration into pores, and delaying the accompanying chemical reduction of Ag+. This gating underlies the slower structural and chemical changes immediately beyond the first transition. Such gating and the interplay between local and crystallographic transformation may contribute to the mechanism for compositional zoning reported in other zeolites.50, 51
Mechanism specific to the reducing atmosphere. The emerging access of H2 molecules to the pore network approaching and during the first transition leads to a partial chemical reduction of Ag+ cations in the reducing gas atmosphere. Analyzing PDF and small angle scattering, and DRIFTS data, respectively, it is possible to observe both the formation of small Ag clusters from reduced Ag+ ions, and the formation of acidic-OH sites through the protonation of the framework. Importantly, these clusters are not seen in the inert atmosphere studies and can only be attributed to the chemical reduction of the Ag+ by H2. During the reduction of the Ag+ cations, the originally Ag+-coordinated water molecules are no longer strongly bound and can be easily removed. As a result, this Ag+ reduction is coupled to H2O loss, as witnessed by the lower residual water molecule numbers observed following the first transition in the reducing atmosphere. The NMF weighting of Component 2 under reducing atmosphere is ~90% of that in inert atmosphere, suggesting that an estimated ~10% of the Ag has been reduced at this point.
The reduction of Ag+ ions to form Ag clusters is substantially slowed following the first LTA structural transformation, but not stopped. This is attributed to the blocking (or gating) of transport of reducing H2 molecules into the pore network by the Ag+ cations in the 8-ring. Reaction of H2 with 8-ring-Ag+ cations, at or near the external surface of the zeolite particles, chemically reduces these species and allows for the re-opening of these windows. This is a progressive process that presumably proceeds inward from the external zeolite particle surface. The reduction and removal of Ag+ from the gating 8-ring sites opens passage to a larger proportion of the pore network. This allows access to the super-cage by H2, subsequently chemically reducing surrounding 6-ring Ag+ cations and 8-ring Ag+ leading to other pores. Reduced Ag+ cations aggregate as clusters in the pore. This explains the continued, but slower increase in the Ag cluster population in reducing atmosphere following the first transition.
It is the reduction and removal of Ag+ from within the 6-ring sites that triggers the second transition. During this second transition, earliest changes are seen in the PDF data, at ~15 K lower temperature than changes in the XRD and DRIFTS. This shows that local changes in Ag coordination resulting in Ag cluster formation are driven by the chemistry and bonding preference of the Ag atoms.
The reduction and removal of Ag+ from within the 6-ring sites also removes the cation-induced strain that drove the expansion of the LTA framework structure. Once a threshold level of Ag+ cations are removed from the 6-ring, the LTA framework undergoes a cooperative crystallographic transition, relaxing back to the original framework geometry and lattice parameter. This cooperative crystallographic transition is seen in the XRD. It is presumed that with this crystallographic transition, any Ag+ cations return to their
Page 8 of 12Chemical Science
Che
mic
alS
cien
ceA
ccep
ted
Man
uscr
ipt
Ope
n A
cces
s A
rtic
le. P
ublis
hed
on 1
3 Se
ptem
ber
2021
. Dow
nloa
ded
on 1
0/2/
2021
7:4
7:12
PM
. T
his
artic
le is
lice
nsed
und
er a
Cre
ativ
e C
omm
ons
Attr
ibut
ion-
Non
Com
mer
cial
3.0
Unp
orte
d L
icen
ce.
View Article OnlineDOI: 10.1039/D1SC04232G
Journal Name ARTICLE
This journal is © The Royal Society of Chemistry 20xx J. Name., 2013, 00, 1-3 | 9
Please do not adjust margins
Please do not adjust margins
original sites over (not within) the 6-/8-rings. With Ag+ no longer occupying the 8-rings, the pores are unblocked, and guest mobility is restored. This opening of the zeolite pores releases uncoordinated water that had been trapped within the pores, seen by the loss of water bands in the DRIFTS. It further enhances access of reducing H2 molecules into the pores, to rapidly reduce remaining supported Ag+.
This structural picture is supported by the simultaneously collected DRIFTS data. Chemical reduction of Ag+ that accompanies the second transition (and LTA framework relaxation) is coupled to the formation sharp peaks in the DRIFTS, reflecting unique acidic OH sites (Si-OH-Al) in different parts of the LTA structure. These peaks are distinct from the weak acidic OH-stretch that forms earlier in the reaction; that stretch accompanies the chemical reduction of some Ag+ cations near the onset of the first transition, for which the energy is shifted to higher wavenumber (3680 cm−1 cf. 3640 and 3600 cm−1). The intensity of this higher energy acidic -OH band (Figure 3c, yellow) decreases and then disappears in the lead up to the second transition. We propose that this higher wavenumber OH-stretch is associated with the strained lattice of the expanded LTA framework structure. For this reason, the 3680 cm−1 peak disappears in tandem with the intermediate LTA structure.
Species mobility through the LTA pores is hindered by geometric confinement in the framework. For the reduced Ag species within the LTA pores, geometric confinement by the framework means that they (ions and clusters) cannot grow larger than the size of the pores. The large crystalline Ag0 nanoparticles that form during and following the second transition, are larger than the dimensions of any individual pore within the LTA. For a strongly bonded aluminosilicate framework such as this, metallic Ag can only grow larger than the pore size if it is on the external surface of the LTA crystalline. Thus, the formation of Ag0 nanoparticles requires that Ag species must be mobile within the pores such that they can traverse multiple pores, to move from potentially deep within the LTA particle to the surface. It is only with the Ag species exiting the zeolite pores that they can aggregate and grow into these large nanoparticles. A nanoparticle of 4 nm dimension would require aggregation of ~300 sub-nanometer-sized clusters. The delay in nanoparticle formation following the emergence of the pore-confined clusters is reflective of this cluster migration and associated kinetic barriers.
Mechanism specific to the inert atmosphere. In the inert atmosphere, the gating effect of Ag+ in the 8-ring allows the intermediate LTA state to persist to higher temperature. The Ag+ inhibits further dehydration, although there is a very slight loss of H2O bands between the first and second transition, as some polar water molecules are transmitted by gating thermal motion. This is accompanied by commensurate changes in the PDF and XRD, and a slight reduction in the weighting of Component 2. The contrast from the behavior in the reducing atmosphere underscores the importance of H2 in unlocking pores and chemically reducing Ag+
Changes associated with the onset of auto-reduction start at ~250 °C. The first changes are seen in the PDF data indicating that initiation of this second transition is driven by changes in the local Ag species structure and chemistry, with the formation of sub-nanometer clusters. Auto-reduction to form Ag0 sub-nanometer clusters is
necessarily coupled to protonation of the framework, with presumed elimination of O atoms (from H2O) as O2.
The temperature-driven formation of Ag clusters extracts Ag+ from the 6- and/or 8-rings of the LTA. As also occurred in the reducing atmosphere, once sufficient Ag+ ions are reduced and removed from the 6-rings, the LTA undergoes the coupled crystallographic transformation to the relaxed, final LTA state seen in the XRD. With the reaction and removal of Ag+ ions from 8-rings, the pores are unblocked, and guest mobility is restored, releasing uncoordinated water that had been trapped within the pores, seen in the DRIFTS. As in the reducing atmosphere, these initial Ag species cannot grow beyond sub-nanometer-sized clusters when within the pores and must migrate to the outer surface of the zeolite particles before they can aggregate into large nanoparticles.
Data science meta-analysis. The characterization tools combined here, in the simultaneous multimodal X-ray scattering and vibrational spectroscopy experiment, are sensitive to the critical structural and chemical changes relevant to understanding the Ag nanoparticle formation in this complex system. Indeed, conventional analyses of the individual data provides detailed insights into the evolutions of the local and average long-range structure of the Ag ions and atoms, the zeolite framework, and the guest water, and OH-surface functionality. While all the critical data are available, the complexity of interpreting such multimodal data to derive meaningful chemical insights increases with the variety and volume of data - a persistent challenge of “big data”. Thus establishing a generalized analytical workflow that allows the different combinations of heterogeneous operando and in situ data to be interpreted together, overcomes a major hurdle in the widespread application of simultaneous multimodal experiments.
It is impractical to examine all the quantified parameters in a pairwise fashion to identify critical correlations.21 Unifying the data and identifying key correlated features is facilitated using the NMF analysis—a dimensional reduction tool. The NMF identifies the distinct states of the evolving system. These states may represent a single or multiple phases or species in the reaction. Effectively the evolution between the NMF components encodes the chemical equations of the reactions, with the reagents of one process (that change population together) encoded as one component and the products of that process encoded as another component.
The NMF analysis most closely matches the features of the data and is most effective in capturing the static states or slow changing regimes. The largest deviations from the raw experimental data occur when features are changing rapidly during the transitions.
Comparison of Pearson correlation coefficient slopes, |p′|, obtained for data sensitive to different aspects of the system allows us to decouple the sequence of changes, from which the causal relationships can be deduced. The utility of this approach in disentangling changes is exemplified by the comparison of |p′| for the PDF and XRD data, which are based on the same X-ray scattering images. The PDF focuses on the local atomic structure independent of long-range ordering and crystallinity, while the XRD emphasizes the Bragg peaks from ordered crystalline phases. The different onset of the changes in the PDF and XRD separate structural changes that
Page 9 of 12 Chemical Science
Che
mic
alS
cien
ceA
ccep
ted
Man
uscr
ipt
Ope
n A
cces
s A
rtic
le. P
ublis
hed
on 1
3 Se
ptem
ber
2021
. Dow
nloa
ded
on 1
0/2/
2021
7:4
7:12
PM
. T
his
artic
le is
lice
nsed
und
er a
Cre
ativ
e C
omm
ons
Attr
ibut
ion-
Non
Com
mer
cial
3.0
Unp
orte
d L
icen
ce.
View Article OnlineDOI: 10.1039/D1SC04232G

ARTICLE Journal Name
10 | J. Name., 2012, 00, 1-3 This journal is © The Royal Society of Chemistry 20xx
Please do not adjust margins
Please do not adjust margins
occur on a local scale from the cooperative, long-range, crystallographic transformation.
More generally, we note the utility of the Pearson slope, |p′|, as a straightforward general measure of the onset or occurrence of changes in system owing to reaction or transformation; a measure that is based on the raw data itself, independent of the type of data or models of the data. As such, we propose that has use as a metric for real-time automatic feedback and decision-making for active experiment control,52 for example, to increase the density with which data is collected in regions where the data and sample are changing rapidly.
While there are many different correlation coefficients and metrics for comparing data, we selected a Pearson correlation analysis as it measures the normalized, linear relationship between data. If the structure and chemistry changes smoothly (e.g., linearly) as a function of temperature, the data should also change linearly except where transitions occur. Thus, the change in the Pearson correlation coefficient as a function of temperature highlights transition regions. This differential Pearson analysis affords a readily obtainable fingerprint of a reaction and determines its characteristic changes as a function of temperature.
ConclusionsThe push to combine insights from multiple complementary characterization tools, each sensitive to different aspects of a system, is a natural evolution of the drive to deepen our understanding of materials’ properties and function in systems of increasing complexity. In this endeavor, simultaneous multimodal measurements, such as the DRIAD-X measurements applied here, are, potentially, revolutionary; this potential has only now been fully realized through the analytical approach outlined herein. The development of multimodal experimental capabilities has long outpaced our ability to meaningfully analyze and interpret the resulting multimodal data and which has been predominately limited to ad hoc comparisons of the observations from the different techniques, as one might do for data from separate experiments. By incorporating generally applicable data science tools to unify the interpretation of the individual technique data, we take advantage of the efficiencies and self-consistency of multimodal experiments.
In the case of Ag nanoparticle formation in the aluminosilicate zeolite LTA the integration of the multimodal experimental data effectively resolves the interplay between local atomic changes, chemical transport and crystallographic transformations that govern reaction. By comparing the transformation in different chemical environments, we were able to identify and classify distinct stages in the nanoparticle formation. Thermal dehydration of water provides physical access to the pore, while inducing a localized displacement of Ag+ cations that collectively leads to a cooperative crystallographic transformation wherein the apertures between pores are re-blocked by Ag+ cations. Intrusion of reducing gas into the open pores reduces cationic Ag+ to small Ag0 clusters, and following the crystallographic transition, progressively reduces the aperture-blocking Ag+ cations to reopen pores and, ultimately reverse the crystallographic transition. This allows free movement of species within the pores and migration
of Ag clusters to the outer surface of the zeolite particles before they can aggregate into large nanoparticles.
The present analytical approach leverages the synchronicity of the measurements by considering the multimodal data as a whole, as well as technique-by-technique, to decouple causal phenomena that drive the reaction from correlated structural and chemical changes—a unified analysis of a single comprehensive multimodal experiment. This goes beyond what is possible by combining insights from multiple separate experiments. By looking at different reaction conditions, or heating rates, we can decouple different discrete intermediates and products in the reaction. For the formation of nanoparticles in zeolites, this analysis allows us to go beyond simplified model systems, with flat surfaces and under high vacuum, that often used as proxies to explore catalytic nanoparticle formation and reactivity, to real systems. The analytical toolkit outlined here is generally applicable and can be applied to multimodal experiments independent of the experimental tools being combined.
Conflicts of interestThere are no conflicts to declare.
AcknowledgementsWork performed at Argonne and use of the Advanced Photon Source were supported by the U. S. Department of Energy (DOE), Office of Science, Office of Basic Energy Sciences, under Contract No. DE-AC02-06CH11357. The multimodal measurements, the reduction and conventional analysis of the PDF, X-ray scattering and DRIFTS data and the integrative data science analyses were supported as part of GENESIS: A Next Generation Synthesis Center, an Energy Frontier Research Center funded by the U.S. Department of Energy, Office of Science, Basic Energy Sciences under Award Number DE-SC0019212. Synthesis of the Ag-exchanged zeolite, assignment of the DRIFTS bands and interpretation of LTA crystallographic changes were supported as part of the Center for Understanding and Control of Acid Gas-Induced Evolution of Materials for Energy (UNCAGE-ME), an Energy Frontier Research Center funded by the U.S. Department of Energy, Office of Science, Basic Energy Sciences under Award # DE-SC0012577. We gratefully acknowledge help with the X-ray experimental set up from Kevin A. Beyer of Argonne. T.M.N. gratefully acknowledges the help with experimental work performed by David X. Rademacher, and helpful technical discussions with Jessica Rimsza, both at Sandia. Sandia National Laboratories is a multi-mission laboratory managed and operated by National Technology & Engineering Solutions of Sandia, LLC, a wholly owned subsidiary of Honeywell International Inc., for the U.S. Department of Energy’s National Nuclear Security Administration under contract DE-NA0003525. The views expressed in the article do not necessarily represent the views of the U.S. DOE or the United States Government.
Notes and references
Page 10 of 12Chemical Science
Che
mic
alS
cien
ceA
ccep
ted
Man
uscr
ipt
Ope
n A
cces
s A
rtic
le. P
ublis
hed
on 1
3 Se
ptem
ber
2021
. Dow
nloa
ded
on 1
0/2/
2021
7:4
7:12
PM
. T
his
artic
le is
lice
nsed
und
er a
Cre
ativ
e C
omm
ons
Attr
ibut
ion-
Non
Com
mer
cial
3.0
Unp
orte
d L
icen
ce.
View Article OnlineDOI: 10.1039/D1SC04232G

Journal Name ARTICLE
This journal is © The Royal Society of Chemistry 20xx J. Name., 2013, 00, 1-3 | 11
Please do not adjust margins
Please do not adjust margins
1. J. Zhang, L. Wang, B. Zhang, H. Zhao, U. Kolb, Y. Zhu, L. Liu, Y. Han, G. Wang, C. Wang, D. S. Su, B. C. Gates and F.-S. Xiao, Nat. Catal., 2018, 1, 540-546.
2. Y. Chai, W. Shang, W. Li, G. Wu, W. Dai, N. Guan and L. Li, Adv. Sci., 2019, 6, 1900299.
3. H. Liu, M. Wolf, K. Karki, Y. S. Yu, E. A. Stach, J. Cabana, K. W. Chapman and P. J. Chupas, Nano Lett., 2017, 17, 3452-3457.
4. E. M. Tennyson, T. A. S. Doherty and S. D. Stranks, Nat. Rev. Mater., 2019, 4, 573-587.
5. J. Park, H. Zhao, S. D. Kang, K. Lim, C.-C. Chen, Y.-S. Yu, R. D. Braatz, D. A. Shapiro, J. Hong, M. F. Toney, M. Z. Bazant and W. C. Chueh, Nat. Mater., 2021, 20, 991-999.
6. A. Grenier, P. J. Reeves, H. Liu, I. D. Seymour, K. Märker, K. M. Wiaderek, P. J. Chupas, C. P. Grey and K. W. Chapman, J. Am. Chem. Soc., 2020, 142, 7001-7011.
7. K. Kalz, R. Kraehnert, M. Dvoyashkin, R. Dittmeyer, R. Gläser, U. Krewer, K. Reuter and J.-D. Grunwaldt, ChemCatChem, 2016, 9.
8. T. Sun and K. Seff, Chem. Rev., 1994, 94, 857-870.9. E. Fron, S. Aghakhani, W. Baekelant, D. Grandjean, E.
Coutino-Gonzalez, M. Van der Auweraer, M. B. J. Roeffaers, P. Lievens and J. Hofkens, J. Phys. Chem. C, 2019, 123, 10630-10638.
10. S. H. Krishna, C. B. Jones and R. Gounder, Annu. Rev. Chem. Biomol. Eng., 2021, 12, 115-136.
11. Y. Matsumura, K. Yoshikata, S.-i. Kunisaki and T. Tsuchido, Appl. Environ. Microbiol., 2003, 69, 4278-4281.
12. J. G. Serafin, A. C. Liu and S. R. Seyedmonir, J. Mol. Catal. A: Chem., 1998, 131, 157-168.
13. Z. Qu, M. Cheng, W. Huang and X. Bao, J. Catal., 2005, 229, 446-458.
14. E. Coutiño-Gonzalez, W. Baekelant, J. A. Steele, C. W. Kim, M. B. J. Roeffaers and J. Hofkens, Acc. Chem. Res., 2017, 50, 2353-2361.
15. K. W. Chapman, P. J. Chupas and T. M. Nenoff, J. Am. Chem. Soc., 2010, 132, 8897-+.
16. M. A. Newton and W. van Beek, Chem. Soc. Rev., 2010, 39, 4845-4863.
17. M. A. Newton, B. Jyoti, A. J. Dent, S. G. Fiddy and J. Evans, Chem. Commun., 2004, DOI: 10.1039/B405694A, 2382-2383.
18. G. L. Chiarello, M. Nachtegaal, V. Marchionni, L. Quaroni and D. Ferri, Rev. Sci. Instrum., 2014, 85.
19. Y.-C. K. Chen-Wiegart, I. Waluyo, A. Kiss, S. Campbell, L. Yang, E. Dooryhee, J. R. Trelewicz, Y. Li, B. Gates, M. Rivers and K. G. Yager, Synchrotron Radiat. News, 2020, 33, 44-47.
20. K. A. Beyer, H. Y. Zhao, O. J. Borkiewicz, M. A. Newton, P. J. Chupas and K. W. Chapman, J. Appl. Crystallogr., 2014, 47, 95-101.
21. K. W. Chapman, K. A. Beyer, H. Y. Zhao and P. J. Chupas, Crystengcomm, 2013, 15, 9377-9381.
22. V. Petkov, Y. Maswadeh, A. L. Lu, S. Y. Shan, H. Kareem, Y. G. Zhao, J. Luo, C. J. Zhong, K. Beyer and K. Chapman, ACS Appl. Mater. Interfaces, 2018, 10, 10870-10881.
23. H. Y. Zhao, T. M. Nenoff, G. Jennings, P. J. Chupas and K. W. Chapman, J. Phys. Chem. Lett., 2011, 2, 2742-2746.
24. L. McCusker, Acta Crystallogr., Sect. A: Fundam. Crystallogr., 1991, 47, 297-313.
25. A. Grenier, G. E. Kamm, Y. Li, H. Chung, Y. S. Meng and K. W. Chapman, J. Am. Chem. Soc., 2021, 143, 5763-5770.
26. T. Li, A. J. Senesi and B. Lee, Chem. Rev., 2016, 116, 11128-11180.
27. J. J. Pluth and J. V. Smith, J. Am. Chem. Soc., 1980, 102, 4704-4708.
28. V. Gramlich and W. M. Meier, Z. Kristallogr. Cryst. Mater., 1971, 133, 134-149.
29. C. Baerlocher and L. B. McCusker, Database of Zeolite Structures:, http://www.iza-structure.org/databases/).
30. A. Hammersley, J. Appl. Crystallogr., 2016, 49, 646-652.31. A. Coelho, J. Appl. Crystallogr., 2018, 51, 210-218.32. A. A. Yakovenko, Z. Wei, M. Wriedt, J.-R. Li, G. J. Halder and
H.-C. Zhou, Cryst. Growth Des., 2014, 14, 5397-5407.33. X. Yang, P. Juhas, C. L. Farrow and S. J. L. Billinge, 2014,
arXiv:1402.3163 34. C. L. Farrow, P. Juhas, J. W. Liu, D. Bryndin, E. S. Bozin, J.
Bloch, T. Proffen and S. J. L. Billinge, J. Phys.: Condens. Matter, 2007, 19, 335219.
35. P. Virtanen, R. Gommers, T. E. Oliphant, M. Haberland, T. Reddy, D. Cournapeau, E. Burovski, P. Peterson, W. Weckesser, J. Bright, S. J. van der Walt, M. Brett, J. Wilson, K. J. Millman, N. Mayorov, A. R. J. Nelson, E. Jones, R. Kern, E. Larson, C. J. Carey, İ. Polat, Y. Feng, E. W. Moore, J. VanderPlas, D. Laxalde, J. Perktold, R. Cimrman, I. Henriksen, E. A. Quintero, C. R. Harris, A. M. Archibald, A. H. Ribeiro, F. Pedregosa, P. van Mulbregt, A. Vijaykumar, A. P. Bardelli, A. Rothberg, A. Hilboll, A. Kloeckner, A. Scopatz, A. Lee, A. Rokem, C. N. Woods, C. Fulton, C. Masson, C. Häggström, C. Fitzgerald, D. A. Nicholson, D. R. Hagen, D. V. Pasechnik, E. Olivetti, E. Martin, E. Wieser, F. Silva, F. Lenders, F. Wilhelm, G. Young, G. A. Price, G.-L. Ingold, G. E. Allen, G. R. Lee, H. Audren, I. Probst, J. P. Dietrich, J. Silterra, J. T. Webber, J. Slavič, J. Nothman, J. Buchner, J. Kulick, J. L. Schönberger, J. V. de Miranda Cardoso, J. Reimer, J. Harrington, J. L. C. Rodríguez, J. Nunez-Iglesias, J. Kuczynski, K. Tritz, M. Thoma, M. Newville, M. Kümmerer, M. Bolingbroke, M. Tartre, M. Pak, N. J. Smith, N. Nowaczyk, N. Shebanov, O. Pavlyk, P. A. Brodtkorb, P. Lee, R. T. McGibbon, R. Feldbauer, S. Lewis, S. Tygier, S. Sievert, S. Vigna, S. Peterson, S. More, T. Pudlik, T. Oshima, T. J. Pingel, T. P. Robitaille, T. Spura, T. R. Jones, T. Cera, T. Leslie, T. Zito, T. Krauss, U. Upadhyay, Y. O. Halchenko, Y. Vázquez-Baeza and C. SciPy, Nat. Methods, 2020, 17, 261-272.
36. M. Wojdyr, J. Appl. Crystallogr., 2010, 43, 1126-1128.37. W. McKinney, Austin, Texas, 2010.38. F. Pedregosa, G. Varoquaux, A. Gramfort, V. Michel, B.
Thirion, O. Grisel, M. Blondel, P. Prettenhofer, R. Weiss, V. Dubourg, J. Vanderplas, A. Passos, D. Cournapeau, M. Brucher, M. Perrot and É. Duchesnay, J. Mach. Learn. Res., 2011, 12, 2825–2830.
39. A. A. Yakovenko, J. H. Reibenspies, N. Bhuvanesh and H.-C. Zhou, J. Appl. Crystallogr., 2013, 46, 346-353.
40. L. C. Gallington, I. S. Kim, W. G. Liu, A. A. Yakovenko, A. E. Platero-Prats, Z. Y. Li, T. C. Wang, J. T. Hupp, O. K. Farha, D. G. Truhlar, A. B. F. Martinson and K. W. Chapman, J. Am. Chem. Soc., 2016, 138, 13513-13516.
41. J. Baumann, R. Beer, G. Calzaferri and B. Waldeck, J. Phys. Chem., 1989, 93, 2292-2302.
42. S. I. Zones and R. A. Van Nordstrand, Zeolites, 1988, 8, 166-174.
43. J. T. Kloprogge and R. L. Frost, Spectrochim. Acta A, 1999, 55, 1359-1369.
Page 11 of 12 Chemical Science
Che
mic
alS
cien
ceA
ccep
ted
Man
uscr
ipt
Ope
n A
cces
s A
rtic
le. P
ublis
hed
on 1
3 Se
ptem
ber
2021
. Dow
nloa
ded
on 1
0/2/
2021
7:4
7:12
PM
. T
his
artic
le is
lice
nsed
und
er a
Cre
ativ
e C
omm
ons
Attr
ibut
ion-
Non
Com
mer
cial
3.0
Unp
orte
d L
icen
ce.
View Article OnlineDOI: 10.1039/D1SC04232G
ARTICLE Journal Name
12 | J. Name., 2012, 00, 1-3 This journal is © The Royal Society of Chemistry 20xx
Please do not adjust margins
Please do not adjust margins
44. J. T. Kloprogge, H. Ruan and R. L. Frost, Spectrochim. Acta A, 2000, 56a, 2405-2411.
45. O. Marie, P. Massiani and F. Thibault-Starzyk, J. Phys. Chem. B, 2004, 108, 5073-5081.
46. K. W. Chapman, S. H. Lapidus and P. J. Chupas, J. Appl. Crystallogr., 2015, 48, 1619-1626.
47. D. O'Nolan, G. Huang, G. E. Kamm, A. Grenier, C.-H. Liu, P. K. Todd, A. Wustrow, G. Tran Thinh, D. Montiel, J. R. Neilson, S. J. L. Billinge, P. J. Chupas, K. S. Thornton and K. W. Chapman, J. Appl. Cryst., 2020, 53, 662-670.
48. H. S. Geddes, H. Blade, J. F. McCabe, L. P. Hughes and A. L. Goodwin, Chem. Commun., 2019, 55, 13346-13349.
49. F.-X. Coudert and D. Kohen, Chem. Mater., 2017, 29, 2724-2730.
50. M.-F. Hsieh, Y. Zhou, H. Thirumalai, L. C. Grabow and J. D. Rimer, ChemCatChem, 2017, 9, 1675-1682.
51. R. von Ballmoos and W. M. Meier, Nature, 1981, 289, 782-783.
52. Y. Rakita, D. O’Nolan, R. D. McAuliffe, G. M. Veith, P. J. Chupas, S. J. L. Billinge and K. W. Chapman, J. Am. Chem. Soc., 2020, 142, 18758–18762.
Page 12 of 12Chemical Science
Che
mic
alS
cien
ceA
ccep
ted
Man
uscr
ipt
Ope
n A
cces
s A
rtic
le. P
ublis
hed
on 1
3 Se
ptem
ber
2021
. Dow
nloa
ded
on 1
0/2/
2021
7:4
7:12
PM
. T
his
artic
le is
lice
nsed
und
er a
Cre
ativ
e C
omm
ons
Attr
ibut
ion-
Non
Com
mer
cial
3.0
Unp
orte
d L
icen
ce.
View Article OnlineDOI: 10.1039/D1SC04232G