View from a front row seat: Watching forest change in the
46
Forest Inventory and Analysis View from a front row seat: Watching forest change in the Interior Western States The Interior West Forest Inventory and Analysis Program John D. Shaw (and Team) Rocky Mountain Research Station Inventory and Monitoring Program USDA Forest Service August 22, 2016 Spring Valley Field Station Planning Workshop
View from a front row seat: Watching forest change in the Interior Western States
The Interior West Forest Inventory and Analysis Program
John D. Shaw (and Team) Rocky Mountain Research Station Inventory and Monitoring Program USDA Forest Service
August 22, 2016 Spring Valley Field Station Planning Workshop
Presenter
Presentation Notes
xxxxxxxx
Overview of the Forest Inventory & Analysis (FIA) program (The Seat)
• History • Sample design and plot design • Standard applications
Example analyses in Nevada and elsewhere (The View)
• Population-level assessment of tree species of interest
• Fire effects
1928 – McSweeney-McNary Forest Research Act Established USFS research program (Forest Survey) and “...a comprehensive survey of the present and prospective requirements for timber and other forest products of the United States...” This created the 3rd nationwide forest inventory in the world.
1974 – Forest and Rangeland Renewable Resources Planning Act
“...to make and keep current a comprehensive inventory and analysis of the present and prospective conditions of and requirements of the forest and range lands of the United States…”
1988 – Forest Ecosystems and Atmospheric Pollution Research Act “...increase the frequency of forest inventories in matters that relate to atmospheric pollution and conduct such surveys as are necessary to monitor long-term trends in the health and productivity of domestic forest ecosystems.”
Mandates a nationally consistent, ongoing inventory to monitor both timber and forest health.
History of forest inventory in the U.S.
Presenter
Presentation Notes
Various laws have shaped the mission of the Forest Inventory and Analysis program, starting with the McSweeny-McNary Act (which created what was then called Forest Survey), and continuing with the 1998 and later versions of the Farm Bill
Northern FIA
Southern FIA
Pacific NW FIA
Interior West FIA
FIA Regional Programs
Presenter
Presentation Notes
There are currently four regional FIA programs
Sample design
Spatial resolution: One plot per hexagon Each plot represents ~2,400 ha (~6000 acres) Plots ~5 km (~3 mi) apart
Temporal resolution: Annual sample = “(sub)panel” Subpanels are spatially interpenetrating All plots done on 10-yr cycle (eastern states use 5- or 7-year cycles
Presenter
Presentation Notes
The sampling grid is based on a system of nested hexagons that cover the entire Earth. These hexagons are divided into a system of (sub)panels that allow for combination of panels and varying cycle length. Plots included within each panel are spatially unbiased.
Annual samples are spatially interpenetrating
Colorado
Presenter
Presentation Notes
Each colored plot location represents a separate panel, which is assigned an inventory year. Plots measured in 2002 will be re-measured in 2012, 2022, etc.
Our 8 states contain ~35,000 forested plots. About 3,500 plots are (re)measured per year. Plots occur across all ownership/management categories and all forest types.
Presenter
Presentation Notes
The plots shown in this map are those that have at least one condition (see following slides) that meets the FIA definition of forest (10% projected canopy cover, either currently or prior to the most recent disturbance).
FIA Plot Design
Key
4 30 °
150 °
270 °
30 °
150 °
270 °
30 °
150 °
270 °
30 °
150 °
270 °
3
2
1
Transect Information
FWD < 0.25” & 0.26” - 0.99”
FWD 1.00” - 2.99”
CWD = > 3.00 ”
6 ft. s.d.
10 ft. s.d.
24 ft. h.d.
s.d.= slope dist., h.d.=horizontal dist.
Sub - plot
Micro - plot
CWD Transect
FWD Transect
Distances between sub - plot points: 120 ft., Distance from sub - plot center and microplot center: 12 ft., Distance between Sub - plot 1 and sub - plots 2, 3, and 4: 207.8 ft. at angles (degrees) 150, 210, and 270 respectively.
Presenter
Presentation Notes
The plot design consists of a combination of large subplots (for trees >=5” diameter and understory vegetation), smaller microplots (seedlings and trees <5” diameter), and transects (downed woody material, canopy cover). When soil is sampled, it is done between the subplots.
The plot location is not changed when the center falls near a condition edge. Conditions are defined by a several criteria, including stand type, stand age, size class, and ownership. Defining conditions is similar to defining stand boundaries in other types of inventories.
• Site and stand variables
• Trees • Measurements for allometric equations • Damage and mortality agents • Regeneration (microplot)
• Understory vegetation – 2 protocols 1) Species composition 2) Structure (by life form and height class)
• Down woody material • Noxious weeds • Soils (1/16 of plots) • Lichens (partly done on 1/16 of plots)
Data collected
Presenter
Presentation Notes
A large number of site, stand, and tree variables are collected. There are special protocols for understory vegetation, downed woody material, soils, and lichens. Noxious weeds are done separately from understory vegetation, but they may be included in the understory veg inventory.
Standard FIA products • Forest land area
• Total in each state • By attribute of interest (reserved land, ownership group, forest type,
stand age, etc.) • Within smaller units of interest (counties, ecoregions, large tribal
holdings, specific National Forests, etc.)
• Tree estimates • Volume (stocks) • Fluxes (growth, mortality, removals) • Density/numbers of trees • By species of interest and in total
• Carbon and biomass
• Noxious weed abundance
Presenter
Presentation Notes
Variables collected in the field and variables computed in the office are combined to produce a wide range of estimates on forest area, volume, growth mortality, etc.
Standard FIA products
Presenter
Presentation Notes
Forest statistics are usually summarized and reported at the state level, and updated are published approximately every 5 years.
Data availability: http://www.fia.fs.fed.us/tools-data/index.php
Presenter
Presentation Notes
Most of the data collected in the field are made available to the public within 6 months of closing out the previous field season. FIA also provides a variety of online tools that allow users to create and customize their own queries and tables.
Forested FIA plots in Nevada 11,339 plot locations 1,773 equivalent forested 10.6 million forest acres
Presenter
Presentation Notes
This and the following slides come from the current report on the forest resources of Nevada, which is now in press. There are over 10 million acres of forest in Nevada, which the FIA monitors using almost 1800 plots. Most FIA plot locations in the state do not occur on forest land.
Forest types and stocking Singleleaf pinyon Utah juniper Mountain mahogany
Presenter
Presentation Notes
These three species make up the vast majority of trees tallied on FIA plots in Nevada (~90%). As a result, woodland types occupy the majority of forested land in Nevada.
Forest types and stocking Other types and species relatively uncommon Our area is a diversity hotspot
Presenter
Presentation Notes
The less common forest types tend to be found in localized areas of Nevada, such as where the Sierra Nevada crosses the state line, the Raft River mountains and vicinity, and the Spring Mountains. White Pine County is a major hotspot for tree species and forest type diversity in the state.
Growth and mortality A fundamental component of FIA analysis Positive net growth is the “norm” Negative net growth is patchy
Gross – mortality = net
Presenter
Presentation Notes
During the decade represented in the current report (2004-2013), most plots showed positive net growth on average over the decade – that is, growth of trees exceeded mortality. Areas of negative net growth tend to be clustered, usually due to insect outbreaks and fire.
Figure 23. Net annual growth and mortality on forest land by seven major species, Nevada, 2004-2013.
Gross – mortality = net
Presenter
Presentation Notes
In spite of drought and fire during most of the inventory period, most species showed positive net growth on average – that is, more tree volume grew than died. Singleleaf pinyon had high mortality, but due to its abundance it had more net growth than the next two ranking species combined.
Figure 25. Average annual per-acre mortality on forest land by cause of death and reserved status, Nevada, 2004-2013.
Differences among causes and land classes
Presenter
Presentation Notes
Caused of mortality varied by cause of death and land classification. Reserved lands, such as wilderness areas and parks, generally had higher per-acre mortality. However, this does not take into account the fact that the mix of forest lands is different between reserved and non-reserved lands.
Figure 61. Mean annual mortality and mean annual net growth for major tree species of Nevada, as measured at co-located plots that were measured during the 1994-1997 inventory (t1) and again between 2004 and 2013 (t2).
Presenter
Presentation Notes
One important question is how conditions compare between the current inventory and past inventories. This can be known after adjustments are made such the areas sampled during both inventories are common. For some species there has been relatively little change, but for others, such as aspen and the 5-needle pines, mortality appears to have increased dramatically.
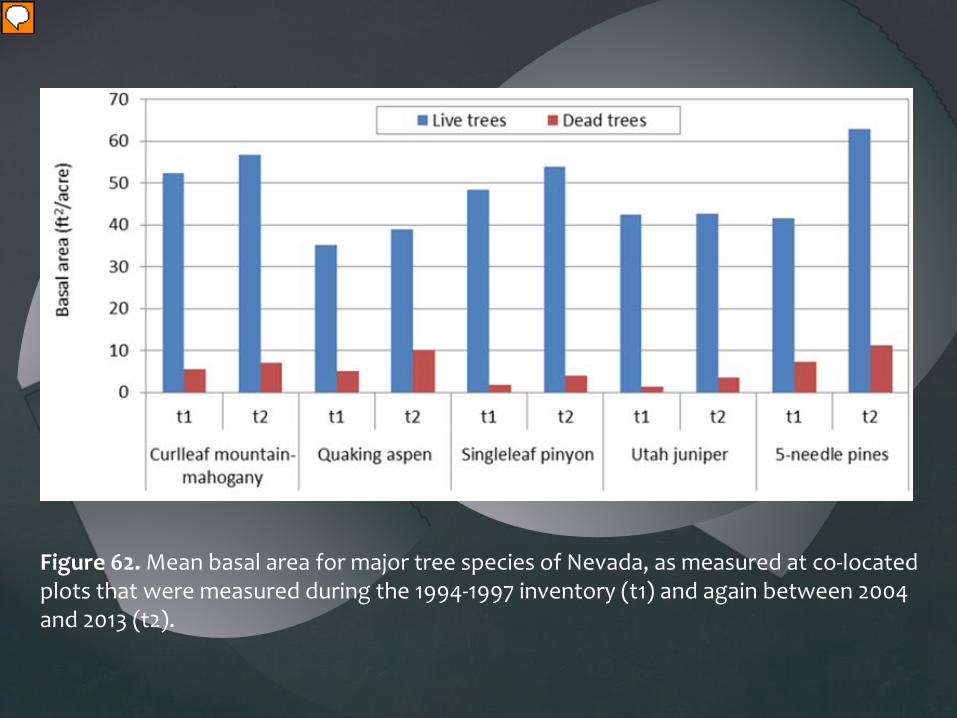
Figure 62. Mean basal area for major tree species of Nevada, as measured at co-located plots that were measured during the 1994-1997 inventory (t1) and again between 2004 and 2013 (t2).
Presenter
Presentation Notes
Despite some of the mortality trends shown in the previous slide, there appears to be more live basal area of all major trees species, with the exception of Utah juniper, which is unchanged. Along with the increase in live basal area, there is also more standing dead basal area.
P-J Expansion vs Recovery
Presenter
Presentation Notes
One question about forest change is whether pinyon-juniper woodlands are expanding their range or recovering from past removal, and if different things are happening in different places.
Figure 29. Proportion of Nevada's pinyon/juniper woodland currently experiencing in-fill (by stand age class) as determined by the presence of pinyon pine or juniper seedlings on the plot, Nevada, 2004-2013.
Presenter
Presentation Notes
A necessary component of both recovery and expansion is successful reproduction. This and the following two slides show examples of data exploration, looking for patterns of seedling presence. Seedling presence appears to decrease slightly with stand age, which is consistent with older stands being more densely stocked and having fewer space for seedling establishment.
Figure 30. Pinyon/juniper woodlands currently experiencing in-fill (by elevation class) as determined by the presence of pinyon pine or juniper seedlings on the plot, Nevada, 2004-2012.
Presenter
Presentation Notes
Pinyon/juniper woodland ranges from below 6000 ft, to more than 8000 ft, but most occurs between 6000 and 7500 ft. It appears that proportionally fewer acres of the middle-elevation stands have seedlings present.
Figure 31. Pinyon/juniper woodlands currently experiencing in-fill (by aspect class) as determined by the presence of pinyon pine or juniper seedlings on the plot, Nevada, 2004-2012.
What’s Up with Mountain Mahogany?
Presenter
Presentation Notes
Many managers and ecologists think that there may be a reproduction deficit with mountain mahogany. There appear to be many mature stands, but young stands appear to be rare.
Figure 47. Acreage of the woodland hardwoods forest-type group by 20-year age classes, Nevada, 2004-2013.
Presenter
Presentation Notes
FIA data on the stand age distribution of mountain mahogany confirms part of the perception that young stands are rare. The majority of mountain mahogany stands are in the age range of 100-200 years, with relatively few acres occupied by young stands. However, there has been a recent increase in the area of young mountain mahogany stands, possibly regenerated by recent fires.
Presenter
Presentation Notes
The age class distribution of mountain mahogany in Nevada somewhat resembles the age class distribution of forest land in the Interior West. This pattern is common throughout the Interior West at different scales and within different forest types, and has been created partly by forest resource use to support mining, railroads, and construction of settlements..
Fire Area and Effects
Presenter
Presentation Notes
The area burned and the effects of fire on vegetation is an important topic for a wide range of people.
Presenter
Presentation Notes
There is a project that is not part of FIA, called Monitoring Trends in Burn Severity, that maps all “large” fires (>=1000 acres in the West, and >=500 acres in the East) and classifies the area within fire perimeters according to the severity of fire. Classification is done using interpretation of satellite imagery.
Presenter
Presentation Notes
We intersect FIA plot locations with the fire boundaries and severity data to compare ground measurements and satellite image interpretations. Some FIA plots were done before fires burned over them, and some plots were measured after fire. So far, there are a relatively small number of plots (735) that have at least one pre-fire and post-fire plot visit.
Figure 52. Number of years between fire and plot visit for post-fire plots, Nevada, 2004-2013 and MTBS, 1984-2012.
Presenter
Presentation Notes
This graph shows the time since fire for plots that were measure after fire in Nevada. Most plots were measured relatively soon after fire.
State
Plot
measurements within burned
perimeters1
Percent nonforest
Percent forest
Total acreage burned
Number of pre-fire
forest plots
Number of post-fire
forest plots
Arizona 788 45.9% 54.1% 4,837,906 237 361
Colorado 211 39.5% 60.5% 1,460,609 45 136
Idaho 1,726 56.8% 43.2% 10,562,802 209 569
Montana 967 35.1% 64.9% 6,050,826 170 589
Nevada 1,390 89.9% 10.1% 8,138,978 27 131
New Mexico 617 56.7% 43.3% 4,510,332 51 234
Utah 503 57.6% 42.4% 3,332,783 119 227
Wyoming 170 44.9% 55.1% 3,610,600 1 113
Total 6,372 58.6% 41.4% 42,504,834 859 2,360
FIA – MTBS Intersection Results
Presenter
Presentation Notes
FIA data can be used to classify the area within burn boundaries as forest vs nonforest. This is a summary of the numbers of plots that occurred with burned boundaries, either before or after. There were over 50 million acres of land burned between 1984 and 2012, but over 10 million acres were burned more than once. Of the 42.5 million unique acres of land burned between 1984 and 2012, only 41.4% was classified as forest land.
AllOwnership Forest Nonforest Lands
National Forests 151.9 295.7 447.6Bureau of Land Management 634.9 5,386.4 6,021.3U.S. Fish and Wildlife Service 4.5 155.0 159.6Department of Defense or Energy 6.0 12.0 18.1Undifferentiated private 38.2 1,639.9 1,678.1Total 835.7 7,489.1 8,324.8
Table 9. Area of total land area, forest land area, and nonforest land inside fire perimeters mapped 1984 to 2012, by ownership, Nevada, 2004-2013.
Presenter
Presentation Notes
Only 10% of the land burned in Nevada was forest.
Fire Rotation Interval in Nevada
Nevada has 10.9 million acres of forestland (FIA definition of >10% cover) Area in large (>1000 acre) fires from 1984-2012 is 8.3 million acres, of which 836 thousand acres was forest land Annual rate of forest burned 1984 to 2012 = 836,700 / 29= 28,817 acres per year Annual percentage of forest burned = 28,817 / 10.9 MM = 0.26% per year Fire rotation interval = 1/0.0026 = 385 years in forestland
Presenter
Presentation Notes
At the average rate of fire burning forest acreage, it would take 385 years to burn all of the forest land in Nevada. That assumes that no forest acreage burns more than once. This rate is too low to maintain species like aspen, which is relatively short lived and usually needs fire to regenerate.
Figure 54. Distribution of average live basal area for post-fire plots at time of measurement, Nevada, 2004-2013 and MTBS, 1984-2012.
Presenter
Presentation Notes
Not all trees are killed as fire burns through forest. Complete tree mortality happens on less than half of burned land. On the rest, varying levels of severity leave tree density ranging from small remnants to relatively well-stocked stands. Even small remnants of the previous stand can provide a seed source for regeneration.
Figure 55. Estimates of pre-fire and post-fire live and standing-dead average basal area per acre, Nevada, 2004-2013 and MTBS, 1984-2012.
Presenter
Presentation Notes
In general, fire leaves forest acreage with fewer live trees and a larger proportion of standing dead trees. The dead trees will eventually form downed woody material.
Whitebark Pine
Presenter
Presentation Notes
An interesting example outside Nevada is whitebark pine, which has been in decline to varying degrees for the past 70 years or so.
Whitebark Pine Volume Trends
See Goeking (2015) Journal of Forestry for periodic to annual comparisons
Presenter
Presentation Notes
Estimates of decline by state vary. The late 1990s inventory of Wyoming likely counted more area of whitebark pine than is currently considered forest land. However, there has been substantial decline since the previous inventory.
Presenter
Presentation Notes
This map shows the occurrence of whitebark pine on FIA plots (blue) compared to fire boundaries.
Presenter
Presentation Notes
Although whitebark pine forests are considered to be strongly influenced by fire, a zoom-in to the area of the greater Yellowstone ecosystem shows that relatively few whitebark pine stands were burned between 1984 and 2012. This is interesting because of the large amount of fire that occurred in the area, including the 1988 Yellowstone fires.
Whitebark Pine Mortality Causes - Idaho
Annual Mortality (cubic feet per year) Agent Proportions
Presenter
Presentation Notes
Looking at cause of death, it is apparent that the increase in mortality has been caused mostly by insects. The left side shows total mortality, while the right graph shows agents by proportion. In the 1990s inventory of Idaho, the proportions of mortality were evenly distributed among fire, disease, and insects. That inventory did not cover all whitebark stands, so the level of mortality shown is probably less than actual in the 1990s. In the 2000s, however, insects became an increasingly important cause of death for whitebark pine.
Whitebark Pine Mortality Causes - Montana
Annual Mortality (cubic feet per year) Agent Proportions
Presenter
Presentation Notes
The same kind of analysis in Montana shows the same pattern as was found in Idaho.
Some Take-Home Points
• FIA sampling and analysis are wall-to-wall; all ownerships, all forest types
• By necessity and design, sample is proportional to the abundance of certain characteristics on the landscape
• Strength of the data is ability to describe statistical distribution of characteristics, and changes over time
• FIA data are now at “critical mass” (and growing) such that we can do analysis and monitoring never possible before
• Data can be used in a wide variety of applications
So…how is FIA relevant to location-specific research, such as the proposed Spring Valley Station?
• FIA data and analysis provide a context for the research done locally • FIA data can be used as a basis to extrapolate local findings to other
parts of the Great Basin • The continuous monitoring of forest trends can be used to validate
conclusions based on station-based research • Having coverage of all forest land, FIA can help identify issues that are
occurring elsewhere, and have not yet been identified as potential research subjects
• FIA has the potential to tie together results from different research networks, such as biological field stations, LTER sites, NEON sites, and Experimental Forests and Ranges
Questions?
John D. Shaw USFS Rocky Mountain Research Station [email protected] 801-598-5902