view this presentation (pdf 786 kb) - s21.q4cdn.com · 2 safe harbor statement except for the...
TRANSCRIPT

1
Earnings Conference Call – First Quarter 2018 May 2, 2018
John Wiehoff, Chairman & CEOAndrew Clarke, CFO
Robert Biesterfeld, COO & President of NASTRobert Houghton, VP of Investor Relations
2
Safe Harbor StatementExcept for the historical information contained herein, the matters set forth in this presentation and the accompanying earnings release are forward-looking statements that represent our expectations, beliefs, intentions or strategies concerning future events. These forward-looking statements are subject to certain risks and uncertainties that could cause actual results to differ materially from our historical experience or our present expectations, including, but not limited to such factors as changes in economic conditions, including uncertain consumer demand; changes in market demand and pressures on the pricing for our services; competition and growth rates within the third party logistics industry; freight levels and increasing costs and availability of truck capacity or alternative means of transporting freight, and changes in relationships with existing truck, rail, ocean and air carriers; changes in our customer base due to possible consolidation among our customers; our ability to integrate the operations of acquired companies with our historic operations successfully; risks associated with litigation and insurance coverage; risks associated with operations outside of the U.S.; risks associated with the potential impacts of changes in government regulations; risks associated with the produce industry, including food safety and contamination issues; fuel prices and availability; changes to our share repurchase activity; risk of unexpected or unanticipated events or opportunities that might require additional capital expenditures; the impact of war on the economy; and other risks and uncertainties detailed in our Annual and Quarterly Reports.
2

3
Q1 2018 – Key Themes
▪ Created Chief Operating Officer role to drive operating efficiencies and accelerate digital transformation
▪ Strong demand and tight capacity driving robust freight market
▪ Double-digit increase in truckload cost and price
▪ Acceleration in spot market freight opportunities
▪ Emphasis on award management
3

4
Results Q1 2018
Three Months Ended March 31
in thousands, except per share amounts and headcount
4
2018 2017 % Change
Total Revenues $3,925,327 $3,415,125 14.9%
Total Net Revenues $625,925 $568,566 10.1%
Net Revenue Margin % 15.9% 16.6% (70 bps)
Personnel Expenses $328,297 $290,504 13.0%
Selling, General, and Admin $106,043 $90,104 17.7%
Income from Operations $191,585 $187,958 1.9%
Operating Margin % 30.6% 33.1% (250 bps)
Depreciation and Amortization $24,241 $22,431 8.1%
Net Income $142,297 $122,080 16.6%
Earnings Per Share (Diluted) $1.01 $0.86 17.4%
Average Headcount 15,088 14,279 5.7%
▪ Total revenues increase driven by higher pricing, volume and fuel costs
▪ Operating expenses growth driven by increases in headcount, variable compensation and bad debt expense. Prior year period included a $8.75M favorable legal settlement.
▪ Net income and earnings per share increases include favorable impact of U.S. corporate tax reform

‹#›
Q1 2018 Other Income Statement Items
▪ Q1 effective tax rate of 21.3% vs. 31.7% last year
▪ Adopted new revenue recognition accounting policy in 2018 Q1
▪ Interest expense increase due to higher debt levels and an increase in variable interest rates
▪ Weighted average diluted shares outstanding is approximately flat
5

‹#›
Q1 2018 Cash Flow and Capital Distribution
▪ $107.9 million increase in cash flow driven by improved working capital
▪ $134.7 million of net income returned to shareholders
▪ $65.4 million cash dividends
▪ Dividend payout ratio of 45.9%
▪ $69.3 million in share repurchases
▪ 750,130 shares repurchased in the first quarter at an average price of $92.37 per share
▪ $15.5 million in capital expenditures
$92.7M
$200.6M
+ 116.4%
Q1 Operating Cash Flow
6
‹#›
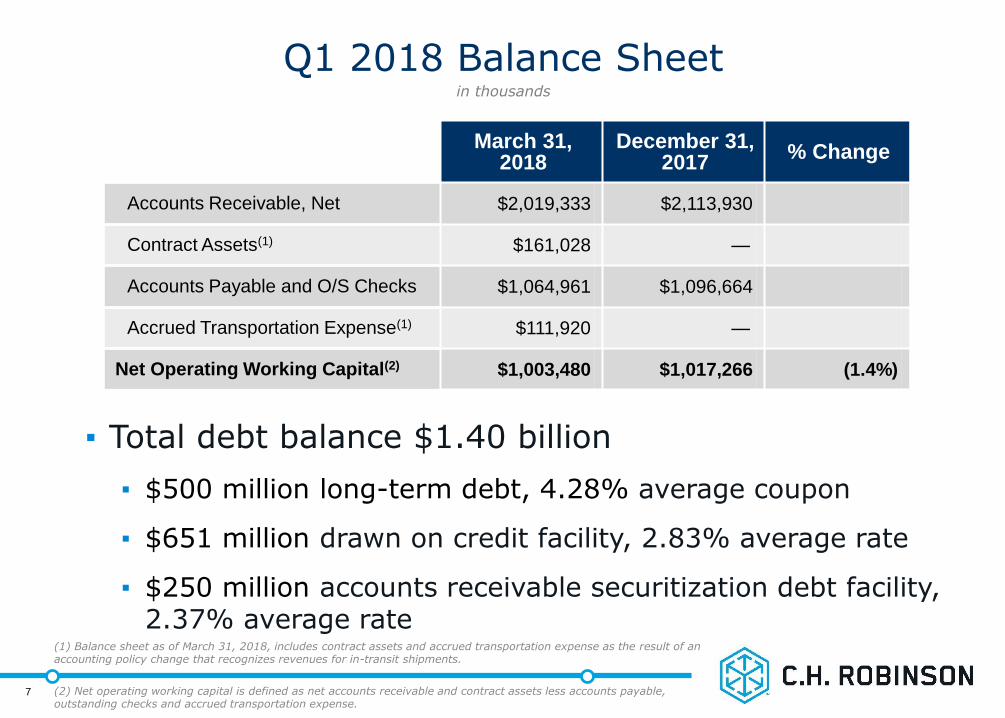
▪ Total debt balance $1.40 billion
▪ $500 million long-term debt, 4.28% average coupon
▪ $651 million drawn on credit facility, 2.83% average rate
▪ $250 million accounts receivable securitization debt facility, 2.37% average rate
Q1 2018 Balance Sheetin thousands
7
(1) Balance sheet as of March 31, 2018, includes contract assets and accrued transportation expense as the result of an accounting policy change that recognizes revenues for in-transit shipments.
(2) Net operating working capital is defined as net accounts receivable and contract assets less accounts payable, outstanding checks and accrued transportation expense.
March 31,2018
December 31, 2017
% Change
Accounts Receivable, Net $2,019,333 $2,113,930
Contract Assets(1) $161,028 —
Accounts Payable and O/S Checks $1,064,961 $1,096,664
Accrued Transportation Expense(1) $111,920 —
Net Operating Working Capital(2) $1,003,480 $1,017,266 (1.4%)

8
Inaugural Bond Offering
▪ Inaugural public debt offering on April 9, 2018
▪ $600 million of 10-year senior unsecured notes due April 2028
▪ 4.2% fixed rate
▪ Investment grade rated by both S&P and Moody's
▪ Proceeds used to repay outstanding balance on credit facility
▪ Provides additional capital structure flexibility
8

9
Second Quarter Trends – April
▪ April to date total company net revenue per day has increased approximately 11 percent when compared to April 2017
▪ Truckload volume has declined approximately 6 percent on a year-over-year basis in April
9

‹#›
TR
AN
SP
OR
TA
TIO
N N
ET
REV
EN
UE M
AR
GIN
▪ North America Truckload cost and price change chart represents truckload shipments from all North America segments. Transportation net revenue margin represents total Transportation results from all segments.
(1) Cost and price change exclude the estimated impact of fuel.
North America Truckload Cost and Price Change(1)
10
Transportation Net Revenue Margin
YoY Price Change
YoY Cost Change
North America Truckload Q1
Volume (7.0%)
Price 21.0%
Cost 21.5%
Net Revenue Margin

‹#›
Q1 2018 NAST Results by Service LineTruckload, Less Than Truckload and Intermodal
in thousands
11 (1) Represents price and cost YoY change for North America shipments across all segments.
(2) Pricing and cost measures exclude the estimated impact of the change in fuel prices.
Three Months Ended March 31
▪ Double-digit price increases in most service lines
▪ Aggregate volume increase of 1 percent
▪ Volume increases in LTL and intermodal
▪ Added 4,200 new carriers in the quarter
Net Revenues 2018 2017 % Change
Truckload $294,757 $267,605 10.1%
LTL $107,348 $93,517 14.8%
Intermodal $6,182 $7,175 (13.8%)
Other $6,482 $4,143 56.5%
Total $414,769 $372,440 11.4%
Truckload(1) LTL(1) Intermodal(1)
Pricing(2) 21.0%
Cost(2) 21.5%
Volume (7.0%) 8.0% 3.0%
Net Revenue Margin
‹#›
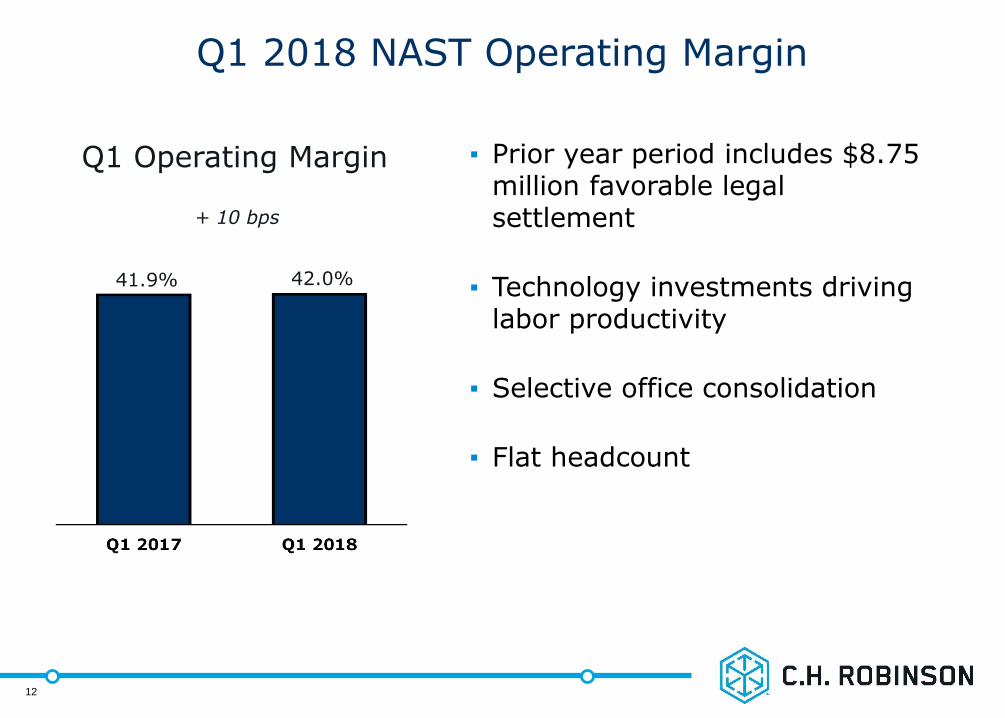
Q1 2018 NAST Operating Margin
▪ Prior year period includes $8.75 million favorable legal settlement
▪ Technology investments driving labor productivity
▪ Selective office consolidation
▪ Flat headcount
12
41.9% 42.0%
+ 10 bps
Q1 Operating Margin

‹#›
Ocean Air
Pricing
Volume
Net Revenue Margin
Net Revenues 2018 2017 % Change
Ocean $68,694 $63,419 8.3%
Air $26,037 $20,396 27.7%
Customs $20,655 $16,077 28.5%
Other $7,651 $6,654 15.0%
Total $123,037 $106,546 15.5%
Three Months Ended March 31
Q1 2018 Global Forwarding Results by Service Line Ocean, Air and Customs
in thousands
13
▪ Double-digit volume increases in all service lines
▪ Milgram & Company acquisition net revenue impact to Global Forwarding:
▪ Ocean +3 ppts
▪ Air +2 ppts
▪ Customs +21 ppts

‹#›
Q1 2018 Global Forwarding Operating Margin
▪ Investments in headcount, technology and leased warehouses
▪ 21.4 percent headcount increase
▪ Milgram headcount impact of 7.5 percentage points to Global Forwarding
▪ Margin improvement plan underway
▪ Technology deployment
▪ Process automation
14
15.2%
6.7%
(850 bps)
Q1 Operating Margin

‹#›
Q1 2018 Robinson Fresh ResultsTransportation and Sourcing
in thousands
15
(1) Does not include intersegment revenues.
Three Months Ended March 31
Sourcing 2018 2017 % Change
Total Revenues(1) $287,687 $313,082 (8.1%)
Net Revenues $29,887 $30,408 (1.7%)
Net Revenue Margin % 10.4% 9.7% 70 bps
Transportation 2018 2017 % Change
Total Revenues(1) $262,782 $237,363 10.7%
Truckload $18,029 $21,369 (15.6%)
Other $5,954 $5,060 17.7%
Net Revenues $23,983 $26,429 (9.3%)
Net Revenue Margin % 9.1% 11.1% (200 bps)
▪ Sourcing net revenue decline due to strategic customer exiting fresh produce
▪ Sourcing case volume flat
▪ Truckload net revenue decline driven by lower volume
▪ Truckload volume decline of 9 percent

‹#›
Q1 2018 Robinson Fresh Operating Margin
▪ Increased variable compensation expenses
▪ Write-off of a supplier advance
▪ Operating expense reduction initiatives underway
▪ Headcount reduction
▪ Service center closure
▪ Operating expense controls
16
25.8%
17.3%
(850 bps)
Q1 Operating Margin

‹#›
Managed Services
▪ $1 billion in freight under management in Q1 (19 percent increase versus first quarter of 2017)
▪ 40 bps of operating margin expansion
Europe Surface Transportation
▪ Volume growth in truckload and LTL
Q1 2018 All Other and Corporate ResultsManaged Services and Other Surface Transportation
in thousands
17
Three Months Ended March 31
Net Revenues 2018 2017 % Change
Managed Services $18,317 $17,193 6.5%
Other Surface Transportation $15,932 $15,550 2.5%
Total $34,249 $32,743 4.6%
‹#›
Final Comments
▪ Expect current freight market fundamentals to continue
▪ Strong demand
▪ Tight capacity
▪ Increased costs and pricing
▪ Continued investment in people, processes and technology
▪ Digital transformation
▪ Increased insights and capabilities
▪ Improved efficiency
18

19
Appendix

‹#›
Q1 2018 Transportation Results(1)
in thousands
(1) Includes results across all segments.
20
Three Months Ended March 31
Transportation 2018 2017 % Change
Total Revenues $3,637,640 $3,102,043 17.3%
Total Net Revenues $596,038 $538,158 10.8%
Net Revenue Margin % 16.4% 17.3% (90 bps)
Transportation Net Revenue Margin %
2009 2010 2011 2012 2013 2014 2015 2016 2017 2018
Q1 22.6% 17.4% 17.2% 16.9% 16.3% 15.3% 16.8% 19.7% 17.3% 16.4%
Q2 20.6% 15.8% 16.2% 14.9% 15.4% 16.0% 17.5% 19.3% 16.2%
Q3 19.8% 16.6% 16.4% 15.6% 15.0% 16.2% 18.4% 17.6% 16.4%
Q4 18.3% 17.6% 16.3% 15.8% 15.1% 15.9% 19.0% 17.2% 16.6%
Total 20.2% 16.8% 16.5% 15.8% 15.4% 15.9% 17.9% 18.4% 16.6%

‹#›
Q1 2018 NAST Resultsin thousands, except headcount
21
(1) Does not include intersegment revenues.
Three Months Ended March 31
2018 2017 % Change
Total Revenues(1) $2,663,011 $2,259,252 17.9%
Total Net Revenues $414,769 $372,440 11.4%
Net Revenue Margin % 15.6% 16.5% (90 bps)
Income from Operations $174,078 $155,877 11.7%
Operating Margin % 42.0% 41.9% 10 bps
Depreciation and Amortization $6,133 $5,590 9.7%
Total Assets $2,383,229 $2,126,900 12.1%
Average Headcount 6,855 6,844 0.2%

‹#›
2018 2017 % Change
Total Revenues(1) $553,754 $468,788 18.1%
Total Net Revenues $123,037 $106,546 15.5%
Net Revenue Margin % 22.2% 22.7% (50 bps)
Income from Operations $8,221 $16,206 (49.3%)
Operating Margin % 6.7% 15.2% (850 bps)
Depreciation and Amortization $8,909 $8,020 11.1%
Total Assets $805,184 $699,139 15.2%
Average Headcount 4,767 3,926 21.4%
Q1 2018 Global Forwarding Resultsin thousands, except headcount
22
(1) Does not include intersegment revenues.
Three Months Ended March 31

‹#›
in thousands, except headcount
Q1 2018 Robinson Fresh Results
23
(1) Does not include intersegment revenues.
Three Months Ended March 31
2018 2017 % Change
Total Revenues(1) $550,469 $550,445 0.0%
Total Net Revenues $53,870 $56,837 (5.2%)
Net Revenue Margin % 9.8% 10.3% (50 bps)
Income from Operations $9,307 $14,652 (36.5%)
Operating Margin % 17.3% 25.8% (850 bps)
Depreciation and Amortization $1,173 $1,146 2.4%
Total Assets $412,415 $409,972 0.6%
Average Headcount 907 961 (5.6%)

‹#›
Q1 2018 All Other and Corporate Resultsin thousands, except headcount
24
Three Months Ended March 31
2018 2017 % Change
Total Revenues(1) $158,093 $136,640 15.7%
Total Net Revenues $34,249 $32,743 4.6%
Income from Operations ($21) $1,223 NM
Depreciation and Amortization $8,026 $7,675 4.6%
Total Assets $706,948 $539,733 31.0%
Average Headcount 2,559 2,548 0.4%
(1) Does not include intersegment revenues.

25