silviachandra.weebly.comsilviachandra.weebly.com/.../8/37182905/final_qm_report.docx · web viewa...
TRANSCRIPT
SCHOOL OF HOSPITALITY, TOURISM AND CULINARY ARTS
BACHELOR OF INTERNATIONAL HOSPITALITY
MANAGEMENT (Hons)
HTM2203Quantitative Method
BH6
FULL NAME STUDENT ID NO GROUP
Ashveen Kaur 0312743 G1
Evelyn 0312300 G1
Silvia Chandra 0311317 G3
Tew Mun Shean 1102K13228 G1
Quantitative Method Page 1

Introduction, Topic Rationale & Method
A survey containing several questions regarding a Malaysian cuisine restaurant is conducted
because a businessman that has the intention of opening up a restaurant in a local university in
Malaysia which has a high percentage of international students wanted to know the international
student’s perception towards having a Malaysian cuisine restaurant available in the university, in order
to assist him in deciding whether or not to open up the particular restaurant in that location and to
determine the feasibility of opening that restaurant.
The survey consists of 4 demographic questions to analyze students from different ethnic
groups and 10 test variable questions to focus on understanding international student’s point of view
towards Malaysian food and their expected restaurant’s ambience.
This topic is important to study if a businessman has the intention to open up a whole new
restaurant of his own (not franchise), in order for him to research the market condition and understand
the public’s opinion towards his intention. The information gained will aid his future business as he
will understand his customer’s perception towards his business and will be able to deliver the
customer’s expectations effectively.
The results taken from the descriptive statistics of the demographic questions in the conducted
survey will show the gender, age, race & monthly allowance of the respondents. Hence, it will ease the
work of the conductors to distinguish between the groups that responded to the survey most. According
to the results collected, the respondents to the survey are mainly female compared to male, the age
group of 16—19 (26) followed by 20—23 (21), 24—28 (12) and > 28(2) being the least. Other than
that, the Chinese responded most in contrast with the other races. There is also a big difference in the
number of monthly allowance amount received by the respondents, where majority receives RM1000
—2000 each month, whereas minority receives more than RM3000 monthly.
Based on the information gathered from the test variable of the survey, it can be analyzed that
most international students consume Malaysian food on an average basis. 57% of the respondents
prefer the recipe of the food to be altered to match their taste buds in order for them to fully enjoy their
meal. Also, 55% of them think that it is crucial to consume nutritional balanced food. Hence, it is
important that the restaurant alter their recipe to a state that the ingredients used are in proportion and
good for the health of the consumers. In terms of value in various elements in a restaurant such as
Quantitative Method Page 2

convenience, atmosphere, service, food and entertainment, majority of the international students voted
as food having the most value where food appearances should also be taken into account and others as
equally important. When asked about the price international students are willing to pay for a plate of
Malaysian dish such as ‘Nasi Lemak’, most chose the price range of RM5—10. For the service of the
restaurant, many international students suggested that the restaurant adopt a fast casual service with
Wi-Fi included. Lunch & dinner set menu is also seen as a very attractive promotional idea as
compared to the others, such as happy hour, 10% membership discount and menu of the day.
Findings & Discussions
Quantitative Method Page 3

35%
65%
Gender
MaleFemale
Figure 1 : Gender
These data come from a study conducted for the purpose of understanding customer preferences as a guideline for opening Malaysian Cuisine Restaurantin Taylor’s University. The study involves 62 respondents which consist of 22 male respondents (35%) and 40 female respondents (65%).
<16
16-19
20-23
24-28
>28
1
26
21
12
2
How old are you?
Figure 2 : Age distribution
A horizontal bar graph has been used to show a comparison of these data. This Figure 2 shows the breakdown of students maturity at Taylor’s University who are immigrants by their last country of permanent residence. The graph shows that only one person is less than 16 years old, 26 respondents can be categorized in the age of 16 to 19 years old, 21 respondents fall under 20 to 23 years old, followed by 12 respondents who are 24 to 28 years old and two respondents are more than 28 years old.
Quantitative Method Page 4

Chinese Indian African Asian Other
39
6
0
12
5
Classification of the race/ethnicity
Figure 3 : Classification of the race/ethnicity
Figure 3 explains the general distribution of where the respondent’s nationalities are mainly fall. In this study, we were unable to get hands on the African people. The most study mainly come from Chinese people which consist of 39 respondents, followed by other races which are Asian (12), Indian (6), and the other represents Eurasian, Lebanese, and Kazakhstan with total number of 5 respondents.
< RM 1000 RM 1000 -2000 RM 2000-3000 > RM 300005
10152025303540
What is your monthly allowance?
Figure 4 : Total of monthly allowances
The figure 4 above displays on the variation of international students allowances in one month period. Generally, 58% and 30 % of total respondents claim that they receive RM 1000- 2000 and less than RM 1000 respectively per month. In addition, only a small portion of population which is represented by 9% able to get RM 2000 to 3000 monthly. Lastly, only 1% of the respondents get more than RM 3000 monthly.
Quantitative Method Page 5

Always10%
often29%
sometimes39%
seldom19%
never3%
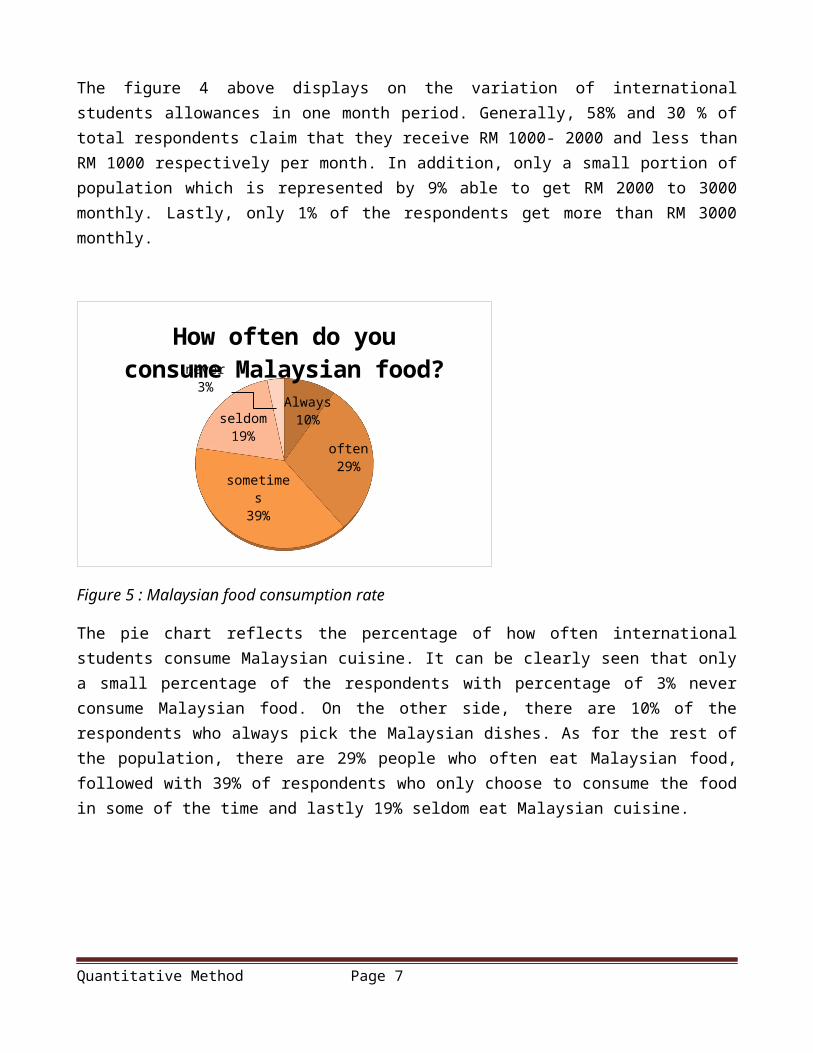
How often do you consume Malaysian food?
Figure 5 : Malaysian food consumption rate
The pie chart reflects the percentage of how often international students consume Malaysian cuisine. It can be clearly seen that only a small percentage of the respondents with percentage of 3% never consume Malaysian food. On the other side, there are 10% of the respondents who always pick the Malaysian dishes. As for the rest of the population, there are 29% people who often eat Malaysian food, followed with 39% of respondents who only choose to consume the food in some of the time and lastly 19% seldom eat Malaysian cuisine.
21%
55%
23%2%
How crucial is it to consume nutritional balanced food for
your diet?very importantimportantslightly importantnot important at all
Figure 6 : Importance of nutritional balanced food
As at shown in the figure 6, more than a half of the respondents feel very important of the nutritional balanced. Mostly respondents claim that 22% are slightly important with a close respond of 21% that state the importance of nutrition balance. However, there are also small percentages that do not care at all of this issue
Quantitative Method Page 6
19%
56%
24%
According to your preference, how would you like your food to be?
As authentic as possibleMatch my taste budsSomewhere in between
Figure 7 : Preference of Malaysian Cuisine
Based on the figure 7, most of the international students in the Taylor’s University choose to have the Malaysian cuisines that are made to match their buds, looked from 57% figure. Surprisingly, only 19% of the respondents prefer to have the food as authentic as possible. While the rest of the population simply like to have it somewhere in between, represented by percentage of 54%.
Quantitative Method Page 7

Table 1 : Customer’s Perspective of The Value of Convenience in a Malaysian Restaurant
Descriptive statisticscount 62 mean 2.23 sample variance 0.96 sample standard deviation 0.98 minimum 1 maximum 4 range 3 skewness 0.28 kurtosis -0.94 coefficient of variation (CV) 44.12%1st quartile 1.00 median 2.00 3rd quartile 3.00 interquartile range 2.00 mode 2.00
0.5 1 1.5 2 2.5 3 3.5 4 4.5
BoxPlot
From the descriptive statistics above, we can describe the respondent opinions about the value of convenience in a Malaysian Cuisine Restaurant. The descriptive statistics table above conclude the research by displaying the mean, mode, standard deviation, variance & skewness of 62 responds generated from Taylor’s International Students. The question itself gives 5 choice of responds which are : Most Important (1), Important (2), Average (3), Little bit Important (4), Not Important at All (5). The data that mostly appear (mode) is 2, which refer to important. It means that providing convenience in terms of the chair softness, etc is important for the target market. The standard deviation for this question is 0.98, while the skewness is positive with 0.28 as the value. From the boxplot above, we can get the median value. The median value is pointed by the vertical line in the middle of the box which is 2.
Quantitative Method Page 8

Table 2 : Customer’s Perspective of The Value of Atmosphere in a Malaysian Restaurant
Descriptive statisticscount 62 mean 2.15 sample variance 0.85 sample standard deviation 0.92 minimum 1 maximum 4 range 3 skewness 0.22 kurtosis -0.93 coefficient of variation (CV) 42.91%1st quartile 1.00 median 2.00 3rd quartile 3.00 interquartile range 2.00 mode 2.00
0.5 1 1.5 2 2.5 3 3.5 4 4.5
BoxPlot
From the descriptive statistics above, we can describe the respondent opinions about the value of atmosphere in a Malaysian Cuisine Restaurant. The descriptive statistics table above conclude the research by displaying the mean, mode, standard deviation, variance & skewness of 62 responds generated from Taylor’s International Students. The question itself gives 5 choice of responds which are : Most Important (1), Important (2), Average (3), Little bit Important (4), Not Important at All (5). The mode for this question is 2 which is equal to important. It means that most of the respondents agree that developing good atmosphere is an important factor when deciding to open Malaysian Cuisine Restaurant. The table shows that the standard deviation is 0.92 and the skewness is positive with value of 0.22. The boxplot above shows the distribution pattern of the data. The median of this data is 2 which is pointed by the vertical line in the middle of the box.
Quantitative Method Page 9
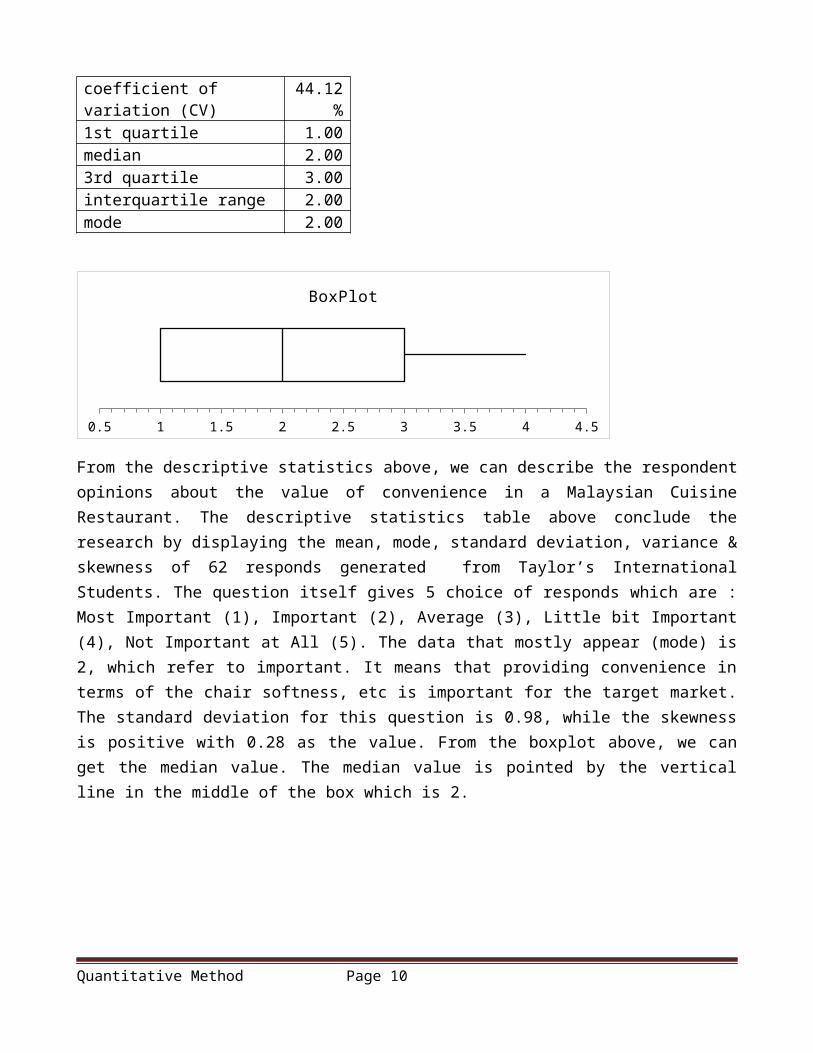
Table 3 : Customer’s Perspective toward The Value of Service in a Malaysian Restaurant
Descriptive statisticscount 62 mean 2.24 sample variance 1.14 sample standard deviation 1.07 minimum 1 maximum 4 range 3 skewness 0.33 kurtosis -1.12 coefficient of variation (CV) 47.57%1st quartile 1.00 median 2.00 3rd quartile 3.00 interquartile range 2.00 mode 1.00
From the descriptive statistics above, we can describe the respondent opinions about the value of service in a Malaysian Cuisine Restaurant. The descriptive statistics table above conclude the research by displaying the mean, mode, standard deviation, variance & skewness of 62 responds generated from Taylor’s International Students. The question itself gives 5 choice of responds which are : Most Important (1), Important (2), Average (3), Little bit Important (4), Not Important at All (5). From the descriptive table above, we can get 2 which is equal to important, as the mode value. It means that it’s important for Malaysian Cuisine Restaurant to plan properly about good service customer expect from the restaurant. The standard deviation for this table is 1.07 and it has positive skewness of 0.33. The boxplot above shows the distribution of the data. From the boxplot we can get 2 as the value of the median.
Quantitative Method Page 10
0.5 1 1.5 2 2.5 3 3.5 4 4.5
BoxPlot

Table 4 : Customer’s Perspective toward The Value of Food in a Malaysian Restaurant
Descriptive statistics
count 62
mean 2.00
sample variance 1.64
sample standard deviation 1.28
minimum 1
maximum 4
range 3
skewness 0.73
kurtosis -1.27
coefficient of variation (CV) 64.02%
1st quartile 1.00
median 1.00
3rd quartile 3.00
interquartile range 2.00
mode 1.00
0.5 1 1.5 2 2.5 3 3.5 4 4.5
BoxPlot
From the descriptive statistics above, we can describe the respondent opinions about the value of food in a Malaysian Cuisine Restaurant. The descriptive statistics table above conclude the research by displaying the mean, mode, standard deviation, variance & skewness of 62 responds generated from Taylor’s International Students. The question itself gives 5 choice of responds which are : Most
Quantitative Method Page 11

Important (1), Important (2), Average (3), Little bit Important (4), Not Important at All (5). From the table above, we can get 1 as the value of mode. It means that the food taste is the most important factor that management team should carefully take into high consideration when opening Malaysian Cuisine Restaurant. The standard deviation of the data is 1.28, while the skewness has positive value of 0.73. The boxplot display the distribution of the data. It is shown that there’s no vertical line in the middle of the box which means the median is the same as one of the quartile. In this case, the table shows that the median value is 1 which is the same as Quartile 1.
Table 5 : Customer’s Perspective toward The Value of Entertainment in a Malaysian Restaurant
Descriptive statisticscount 61 mean 2.62 sample variance 0.77 sample standard deviation 0.88 minimum 1 maximum 4 range 3 skewness -0.08 kurtosis -0.65 coefficient of variation (CV) 33.50%1st quartile 2.00 median 3.00 3rd quartile 3.00 interquartile range 1.00 mode 3.00
0.5 1 1.5 2 2.5 3 3.5 4 4.5
BoxPlot
From the descriptive statistics above, we can describe the respondent opinions about the value of entertainment in a Malaysian Cuisine Restaurant. The descriptive statistics table above conclude the research by displaying the mean, mode, standard deviation, variance & skewness of 62 responds generated from Taylor’s International Students. The question itself gives 5 choice of responds which
Quantitative Method Page 12

are : Most Important (1), Important (2), Average (3), Little bit Important (4), Not Important at All (5). From the table above we can get 3 as the value of the mode. Relating it to the question, it means that entertainment function in Malaysian Cuisine Restaurant has important of average level only. The statistics shows that the standard deviation is 0.88 while the skewness is negative with the value of -0.08. The boxplot above tell the distribution status of the data. By analyzing the boxplot, we can see that there’s no vertical line in the middle of the box. It means that the median value is the same as one of the quartile which is Quartile 3 with the value of 3.
Table 6 : The Appropriate Price of a Plate of Malaysian Food (eg: Nasi Lemak)
Descriptive statisticscount 62 mean 1.61 sample variance 0.70 sample standard deviation 0.84 minimum 1 maximum 4 range 3 skewness 1.19 kurtosis 0.54 coefficient of variation (CV) 51.88%1st quartile 1.00 median 1.00 3rd quartile 2.00 interquartile range 1.00 mode 1.00
0.5 1 1.5 2 2.5 3 3.5
BoxPlot
From the descriptive statistics above, we can describe the respondent opinions about the appropriate price for 1 plate of Malaysian food such as Nasi Lemak. The description table conclude the research by displaying the mean, mode, standard deviation, variance & skewness of 62 responds generated from
Quantitative Method Page 13

Taylor’s International Students. The question itself gives 4 choice of responds which are : RM 5-10 (1), RM 10-15 (2), RM 15-20 (3), RM 20-25 (4). After processing the count, the mode resulted from this research is 1 which representing RM 5-10. It means that most of the international students think that the appropriate price for 1 plate of Malaysian food will be in RM 5-10 range. Calculation of other aspects in statistic report shows that the data collected has standard deviation of 0.84 & positive skewness of 1.19. The boxplot above describe the distribution of the data. Because it has no vertical line in the middle of the rectangle, the median amount should be the same with Q1 or Q3. In this case the median is 1, similar with Quartile 1.
Table 7 : Type of Service Malaysian Cuisine Restaurant Should Adopt
Descriptive statisticscount 62 mean 1.89 sample variance 1.54 sample standard deviation 1.24 minimum 1 maximum 4 range 3 skewness 0.96 kurtosis -0.84 coefficient of variation (CV) 65.85%1st quartile 1.00 median 1.00 3rd quartile 2.75 interquartile range 1.75 mode 1.00
0.5 1 1.5 2 2.5 3 3.5 4 4.5
BoxPlot
From that descriptive statistics above, we can describe respondent views about the type of service that Malaysian Cuisine Restaurant should adopt. The description table conclude the research by displaying the mean, mode, standard deviation, variance & skewness of 62 responds generated from Taylor’s International Students. The question itself offers 4 choice of responds which are : Fast Casual (1), Fine Dining (2), Buffet Style (3) and Self-Service (4). By conducting the necessary research & calculation,
Quantitative Method Page 14

we get number 1 as the mode. Mode is the number that appears most in the data. Number 1 refer to Fast Casual Restaurant, so most of the respondents feel that the Fast Casual Service is best suited the concept of Malaysian Cuisine Restaurant. From the data generated & counted, we can get the standard deviation of 1.24 with positive skewness of 0.96. The boxplot above shows the distribution of the data. Rectangle box + horizontal line spreading from number 1-4 means the minimum & maximum value of the data is 1 & 4. There’s no vertical line in the middle of the box since the median value is the same as Quartile 1 value, which is 1.
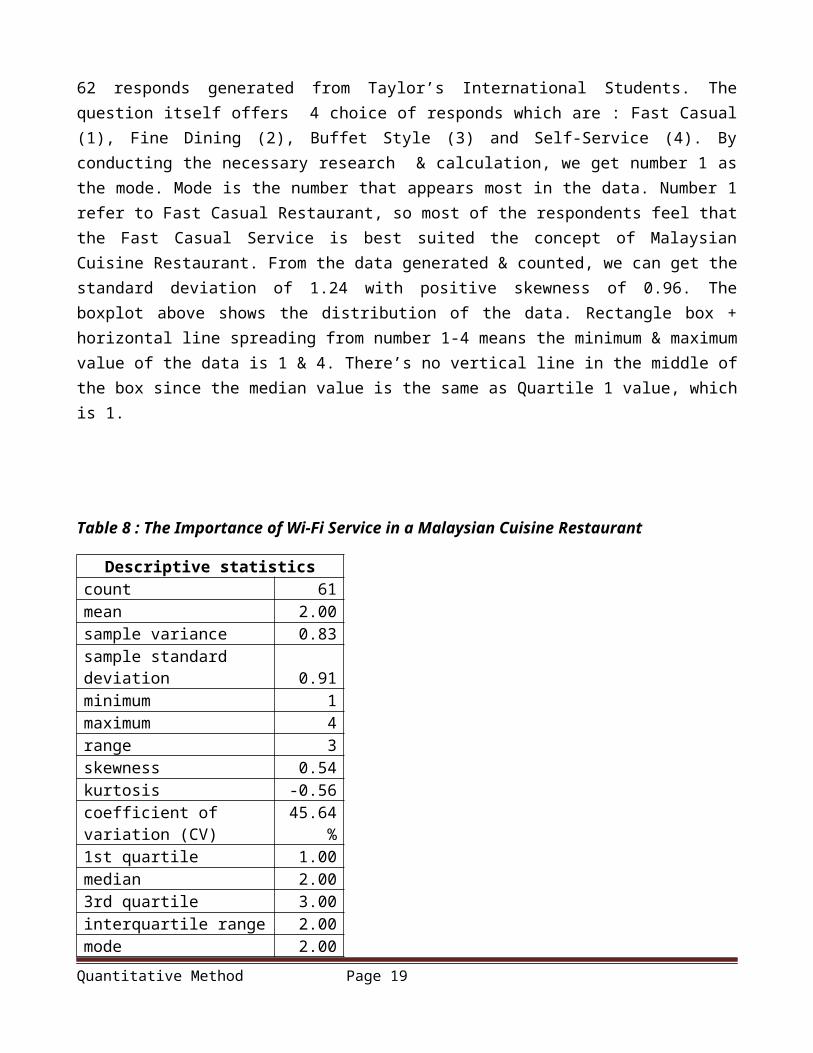
Table 8 : The Importance of Wi-Fi Service in a Malaysian Cuisine Restaurant
Descriptive statisticscount 61 mean 2.00 sample variance 0.83 sample standard deviation 0.91 minimum 1 maximum 4 range 3 skewness 0.54 kurtosis -0.56 coefficient of variation (CV) 45.64%1st quartile 1.00 median 2.00 3rd quartile 3.00 interquartile range 2.00 mode 2.00
0.5 1 1.5 2 2.5 3 3.5 4 4.5
BoxPlot
From that descriptive statistics above, we can examine respondent opinions about the importance of providing wi-fi service in Malaysian Cuisine Restaurant in relation with customer dining experience. The description table conclude the research by displaying the mean, mode, standard deviation, variance & skewness of 62 responds generated from Taylor’s International Students. The question itself
Quantitative Method Page 15

provides 4 choice of responds which are : Very Important (1), Important (2), Slightly Important (3) and Not Important at All (4). From the statistic report counts, we get 2 as the value of the mode. It means that most of the students feel that the availability of wi-fi is an important factor for their considerations when choosing to dine in Malaysian Cuisine Restaurant. Analyzing other aspects of statistics, we can get 0.91 as the value of standard deviation & positive skewness of 0.54. The boxplot above shows the distribution of the data. By all means, the data value is ranging from 1-4 (4 choices. The vertical line in the middle of the boxplot define the median value which is 2.
Table 9 : The Effect of The Appearance of Foods and Beverages toward Customer’s Dining Experience
Descriptive statisticscount 61 mean 1.08 sample variance 0.08 sample standard deviation 0.28 minimum 1 maximum 2 range 1 skewness 3.13 kurtosis 8.03 coefficient of variation (CV) 25.56%1st quartile 1.00 median 1.00 3rd quartile 1.00 interquartile range 0.00 mode 1.00
0.5 0.7 0.9 1.1 1.3 1.5 1.7 1.9 2.1
BoxPlot
From that descriptive statistics above, we can examine respondent thoughts about whether the appearance of the food; in terms of garnishes, plating and color combination will affect the customer dining experience in a Malaysian Cuisine Restaurant. The description table conclude the research by
Quantitative Method Page 16

displaying the mean, mode, standard deviation, variance & skewness of 62 responds generated from Taylor’s International Students. The choices provided as an answer are : Yes (1) and No (2). So the range between both maximum & minimum values is 1. From the statistics itself, the result appear in mode box is 1 which refer to Yes. It shows that most of respondents agree upon the fact that even if in Malaysian Cuisine Restaurant, creation & innovation toward food appearance is important. The standard deviation calculated based on this report is 2.8, while the skewness has positive value of 3.13. The boxplot above has unique shape. It’s only have one vertical line & 1 horizontal line without the box. It means that the value of Q1, Q3 and median is the same amount, which is 1.
Table 10 : The Attractiveness of Happy Hour as a Promoting Idea
Descriptive statisticscount 62 mean 2.34 sample variance 1.15 sample standard deviation 1.07 minimum 1 maximum 4 range 3 skewness 0.19 kurtosis -1.20 coefficient of variation (CV) 45.77%1st quartile 1.00 median 2.00 3rd quartile 3.00 interquartile range 2.00 mode 2.00
0.5 1 1.5 2 2.5 3 3.5 4 4.5
BoxPlot
From that descriptive statistics above, we can understand respondent opinions about the level of attractiveness of giving happy hour as a promotional item in Malaysian Cuisine Restaurant. The description table conclude the research by displaying the mean, mode, standard deviation, variance &
Quantitative Method Page 17

skewness of 62 responds generated from Taylor’s International Students. The 4 choices given in the questionnaire are : Very Attractive (1), Attractive (2), Slightly Attractive (3) and Not Attractive at All (4). The table shows that the mode (the number appears most) for this questionnaire is 2. It means that happy hour is an attractive promotional tool that can be implemented in Malaysian Cuisine Restaurant to target International Students. Another part of the statistics tell that the data has standard deviation of 1.07 & positive skewness of 0.19. The boxplot can be read for distributional information of the data. The median of the data is 2 which is shown by the value pointed by the vertical line in the middle of the box.
Table 11 : The Attractiveness of Lunch & Dinner Set Menu as a Promoting Idea
Descriptive statisticscount 62 mean 1.87 sample variance 0.93 sample standard deviation 0.97 minimum 1 maximum 4 range 3 skewness 0.94 kurtosis -0.04 coefficient of variation (CV) 51.65%1st quartile 1.00 median 2.00 3rd quartile 2.00 interquartile range 1.00 mode 1.00
0.5 1 1.5 2 2.5 3 3.5
BoxPlot
From that descriptive statistics above, we can understand respondent opinions about the level of attractiveness of lunch & dinner set menu as a promotional item in Malaysian Cuisine Restaurant. The description table conclude the research by displaying the mean, mode, standard deviation, variance &
Quantitative Method Page 18
skewness of 62 responds generated from Taylor’s International Students. The 4 choices given in the questionnaire are : Very Attractive (1), Attractive (2), Slightly Attractive (3) and Not Attractive at All (4). The statistics for this data display 1 as the value of the mode. It means that Lunch & Dinner Set Menu is a highly attractive promotional tool that should be used by Malaysian Cuisine Restaurant, based on target market’s preferences. The standard deviation for this data is 0.97, while the skewness is positive with value of 0.94. Looking from the boxplot shown, the median value is the same as one of the quartile. The value of the median is similar as Q3 which is 2.
Table 12 : The Attractiveness of 10% Membership Discount as a Promoting Idea
Descriptive statisticscount 62 mean 2.32 sample variance 1.11 sample standard deviation 1.05 minimum 1 maximum 4 range 3 skewness 0.27 kurtosis -1.10 coefficient of variation (CV) 45.31%1st quartile 1.25 median 2.00 3rd quartile 3.00 interquartile range 1.75 mode 2.00
0.5 1 1.5 2 2.5 3 3.5 4 4.5
BoxPlot
From that descriptive statistics above, we can understand respondent opinions about the level of attractiveness of giving 10% membership discount as a promotional item in Malaysian Cuisine Restaurant. The description table conclude the research by displaying the mean, mode, standard
Quantitative Method Page 19

deviation, variance & skewness of 62 responds generated from Taylor’s International Students. The 4 choices given in the questionnaire are : Very Attractive (1), Attractive (2), Slightly Attractive (3) and Not Attractive at All (4). From the descriptive statistics table above, we can get 2 as the value of the mode. It means that 10% membership discount will be attractive as a promotional tool for Malaysian Cuisine Restaurant. The statistics also show that the standard deviation is 1.05, while the skewness is positive with value of 0.27. The boxplot above shows the distribution of the data. The vertical line in the middle of the box points the value of median which is 2.
Table 13 : The Attractiveness of Menu of The Day as a Promoting Idea
Descriptive statisticscount 62 mean 2.21 sample variance 0.73 sample standard deviation 0.85 minimum 1 maximum 4 range 3 skewness 0.24 kurtosis -0.54 coefficient of variation (CV) 38.56%1st quartile 2.00 median 2.00 3rd quartile 3.00 interquartile range 1.00 mode 2.00
0.5 1 1.5 2 2.5 3 3.5 4 4.5
BoxPlot
From that descriptive statistics above, we can understand respondent opinions about the level of attractiveness of giving menu of the day as a promotional item in Malaysian Cuisine Restaurant. The description table conclude the research by displaying the mean, mode, standard deviation, variance &
Quantitative Method Page 20

skewness of 62 responds generated from Taylor’s International Students. The 4 choices given in the questionnaire are : Very Attractive (1), Attractive (2), Slightly Attractive (3) and Not Attractive at All (4). Mode is the answer that has the highest frequency in the data gathered. The mode value of this data is 2, which refer to attractive. It means that Menu of The Day is an attractive promotional tool option for Malaysian Cuisine Restaurant. This question has standard deviation of 0.73 and positive skewness of 0.24. The boxplot tell us about the distribution of the data. The absence of the middle vertical line in the box means that the value of the median is the same as one of the quartile. In this case, the value of median is 2, which is similar to Quartile 1.
Implications for Practices and Research Process Reflection.
The results of conducting the survey is to determine foreign students point of view towards Malaysian Cuisine and was obtained from the response of 62 foreign students who reside, study or stay in Malaysia so that they’ve tasted Malaysian Traditional Food & are familiar with its’ varieties. The results were tabulated based on demographical data including age groups, personal backgrounds, nationality, spending power and priority to consume notorious food. So we can roughly know their preferences relating to their demographical status. The objectives of this survey or questionnaire prior to the foreign student’s point of view towards Malaysian cuisine, it is important to be able to know the reasons of their perception and view towards Malaysian cuisine and what they expect from a local food outlet in order to analyze and take into considerations.
This questionnaire results which were explained deeper by graph, descriptive statistics table, boxplot and some further words elaboration will ease the works of practitioners. Again, the purpose of this study is to gather data about which type & what kind of Malaysian Restaurant that a university with lots of International Students would like to have in campus From this study we can know that it’ll be good for having Authentic Malaysian Cuisine Restaurant in campus since most of the foreign students eat Malaysian Food in the rate of sometimes & above. It means that there is a target market already. The first step for our survey was to design the survey format with suitable and appropriate questions, it took us some time before finalizing the questions as we had too many questions in our mind and had to drop off a few questions. Besides that, we also faced slight difficulty in terms of time management as we had to follow up with the respondents as we had to continue asking people to do the survey. The next important need is to design the restaurant tangible aspect in condition that match customers’ preferences. From the elaboration of the data, practitioners will get sets of standard/guideline in terms of setting & choosing the appropriate food prices, ambience of the restaurants, type of the restaurant service, degree of authenticity in the food taste, additional facilities & services, also effective promotional tool.
Quantitative Method Page 21

By engaging in the experience of conducting this simple survey and questionnaire, we members of the team have learnt and gained a better understanding about the steps how surveys are being conducted. We understand the 2 main components of a survey which are demographic questionnaire and test variables. Along the project, we learn how to create appropriate questions for survey based on responds we want to gather/analyse from them later. Implicitly, we increase our IT awareness because we practice using the google form for our online surveys. There’s not much layout choice given, but it looks neat & tidy. Gathering responds from our target market is another step. We learned to approach people with diverse backgrounds, so that we can get the most accurate results possible for our research. Truthfully, internet survey was challenging for us because we can only approach our friends through Facebook and we didn’t know whether ‘that friend’ has filled in the form or not. So we approached as many friends as possible and regularly checked the Response Form in the online spreadsheet given.
The final step for this project is to arrange the data neatly and support it with the graph, descriptive statistics and boxplot given in the report. We learned how to turn figure & graph into the words and also explained the important findings we get from each questionnaire. In this stage, we learned how to use Megastat for helping us to convert the data gathered into some components needed to elaborate further explanations such as mean, mode, standard deviation, etc. Throughout the process, we learned how to interpretate the data nicely but straightforwardly after understanding the important points. By doing this project, we learned to apply some of useful knowledge we got from cognitive learning in the class.
There are lots of challenging scenario along the way. It’s not easy to design the questions since it was confusing to set clear objectives at the first step. Furthermore must watched the grammar very carefully. It’s important to communicate what we want to know by creating each question effectively so that the respondents can answer accordingly. As the example, recently we noticed that some of our questionnaires weren’t filled with appropriate answers that we expect. We went back through our questions to analyse what happen. In the end, we find that some of our questions weren’t clear enough for respondents to understand. As the consequences, the data was another story to write for us. We couldn’t compare what we supposed to compare. We explain the data separately instead and the usage of the data becomes less effective toward our first objective. We learned that we were failed to effectively get what we expect from the questions. It was sad but good experience for us. By undergoing this experience early, we can make sure that we won’t repeat the case again in the future.
Converting the graph and descriptive statistics into the words were another hard part. We tried to pick the words carefully so that it was aesthetic & creative enough to spark reader’s interest but also easy & straightforward enough to digest. It’s challenging to pay enormous amount of attention of what we write since it was involving lots of numbers and figures. Finally, we need to make sure that what we was trying to communicate through this report is well understood by the readers.
Practitioners must aware that there is demand for Malaysian Traditional Cuisine as long as the products and services designed carefully to match their preferences. This report will help in determining some important aspects that they need to consider for developing the new restaurant concept. All in all, this is only small sample of big population, so it’s not fully accurate. But, still we
Quantitative Method Page 22

hope that this simple research can contribute some percentage of success if ones plan to establish a Malaysian Cuisine Restaurant in university area.
Quantitative Method Page 23