· web viewfailure mode effect analysis (fmea) –requirements of reliability, failure rate, fmea...
TRANSCRIPT
UNIT 4
UNIT IV TOOLS AND TECHNIQUES FOR QUALITY MANAGEMENT Quality functions development (QFD) – Benefits, Voice of customer, information organization,House of quality (HOQ), building a HOQ, QFD process. Failure mode effect analysis (FMEA) –requirements of reliability, failure rate, FMEA stages, design, process and documentation. Seven Tools (old & new). Bench marking and POKA YOKE.
Quality Function Deployments or Development:
QFD theory was first defined by Yoji Akao in 1966 and applied in Mitsubishi company(Japan).
Meaning of QFD(2 mark Qustion)QFD is a System in which translating the customer’s requirements into Company or Engineering specifications.QFD Process: (16 mark Questions)
1. Identify the Customer(s)2. Classify the customer requirements3. Prioritize each requirement4. Identify design dependent Parameters5. Correlate requirements and Parameters(Correlation matrix)6. Check correlation Grid7. Benchmarking customer Perception8. Benchmark design Parameters9. Set Target values for each Engineering Specification10. Translate Customer Requirements into Measurable Engineering
specifications
Elements of QFD:i. Customer requirements planning process2. Technicial features deployment matrix3. Correlation Matrix4. Operating instructions
3techniques of QFD:
1 | P a g e
1. Voice of the customer – The customer’s requirements expressed in their own terms.2. Information Organization:In this stages, the information are organized by Proper ways. Methods of Information Organization:a. Affinity DiagramsB.Interrelationship diagramsc. Tree Diagramsd. Cause and Effect diagrams3. House of Quality
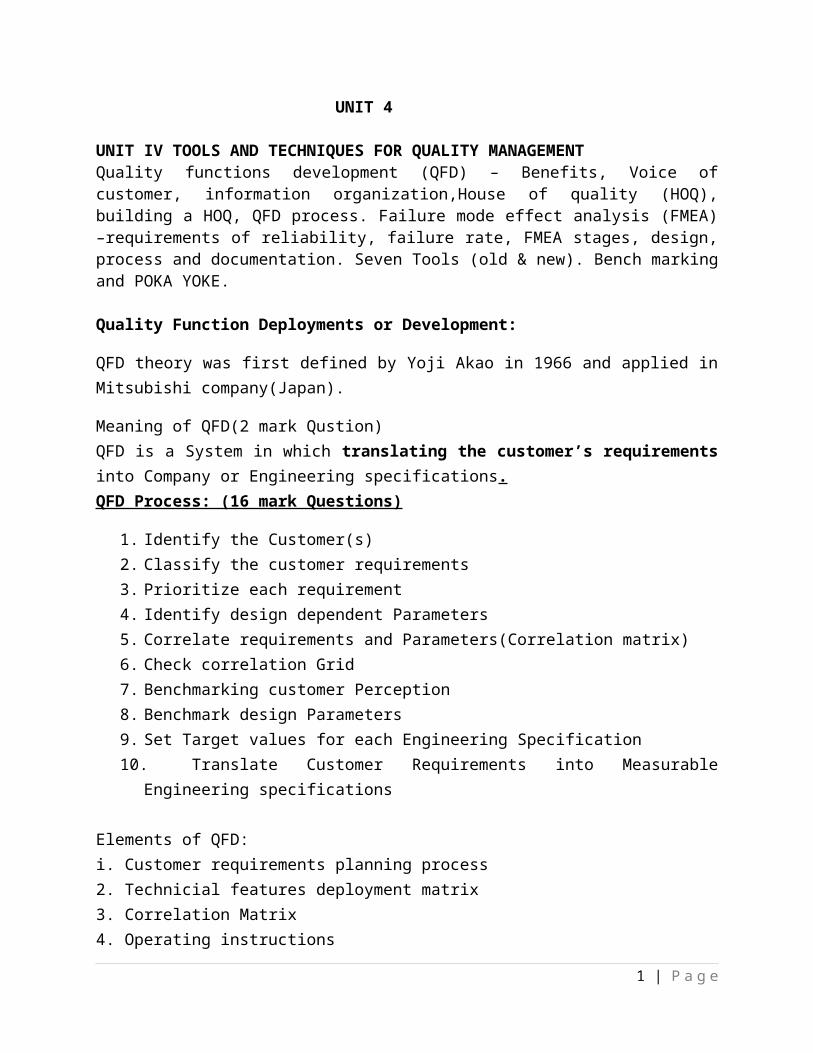
What do you mean QFD Process? Describe the four phases of QFD process.
Quality Function Development (QFD) may be defined as a system for translating consumer requirements into appropriate requirements at every stage.
What are the four phases of product development in QFD process?
2 | P a g e
Phase I
Product Planning
Phase II
Part Development
Phase III
Process Planning
Phase IV
Production planning
Product planning Part Development Process planning Production planning
Advantages or Benefits of QFD:1. Efficiency in Product design and Process2. Applied in cross functional team.3. Maintain customer database4. QFD helps in good decision making5. It foster organizational harmony6. Reduction in cycle time7. Low cost8. It is time saving process.9. It improve the Quality of product10. Support value engineering analysis
House of Quality (HOQ)It is one of the famous tool of QFD.It is an excellent quality planning tool.It is originated in Japan 1972 (Mitsubishi co)
16 mark Questions:1. Define the term House of Quality. Elaborately discuss the
concept of Elements or steps in house of quality with neat diagramme (Nov/Dec 09/12)
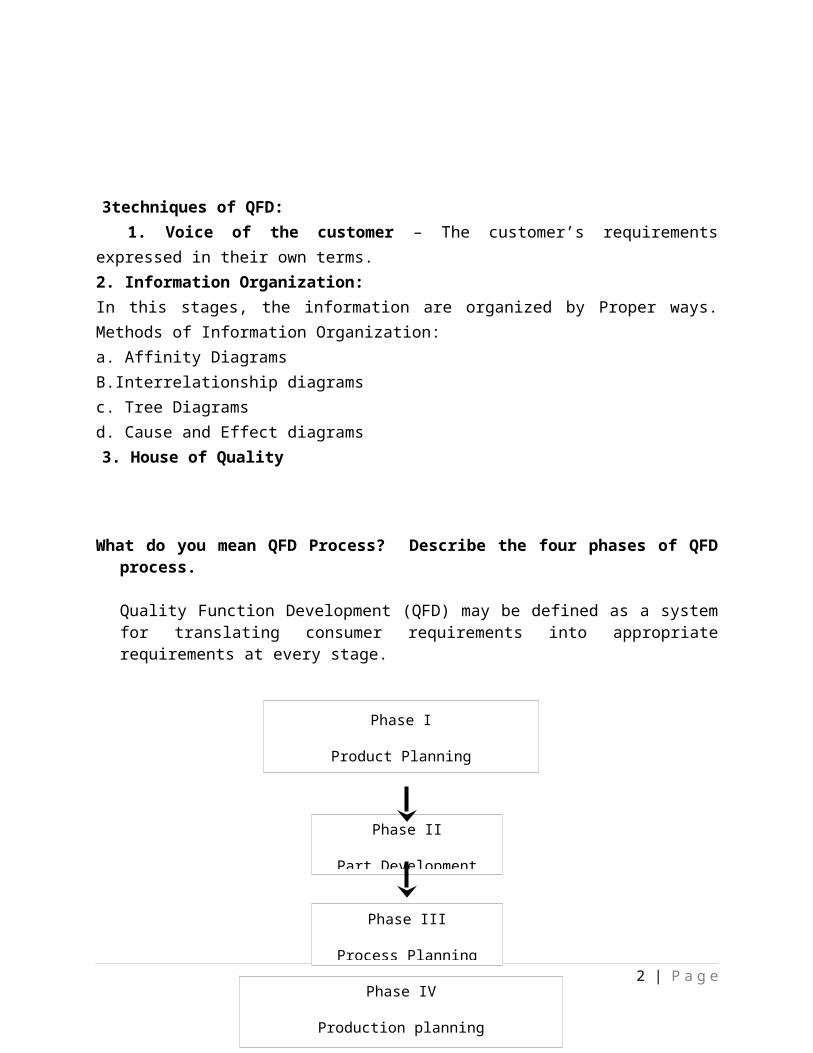
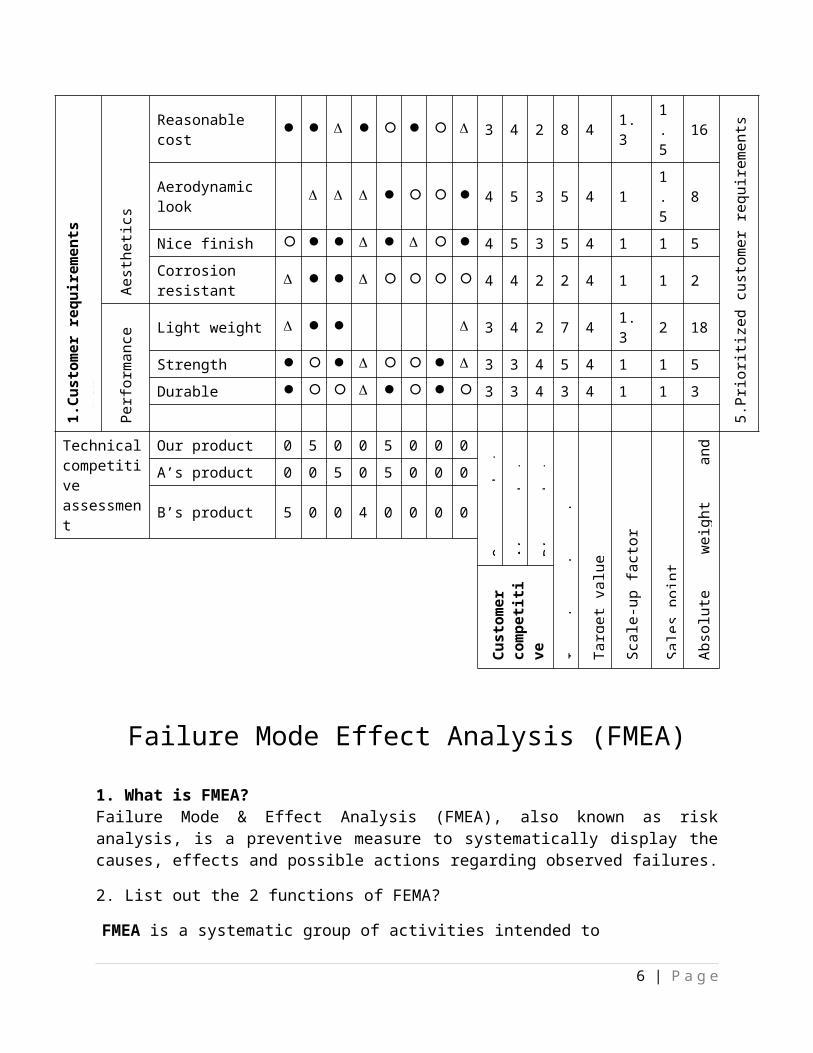
The primary planning tool used in QFD is the House of Quality (HOQ). The house of quality converts the voice of the customer into product design characteristics. QFD uses a series of matrix diagrams, also called ‘quality tables’ that resemble connected houses.
Steps in Building A House Of Quality:1. List Customer Requirements (What’s)2. List Technical Descriptors (How’s)
3 | P a g e

3. Develop Relationship (What’s & How’s)4. Develop Interrelationship (How’s)5. Competitive Assessments6. Prioritize Customer Requirements
7 .Prioritize Technical DescriptorsHouse of quality Digramme.
4. Interrelationship Between technical descriptors
Interrelationship between Technical descriptors (correlation matrix) HOWs Vs. HOWs
Technical descriptors(HOWs)
Relationship between customer requirements and
4 | P a g e
+9 Strong positive+3 Medium -3 Negative
-9 Strong Negative
2.Technical descriptors
(voice of the organization)
6. Prioritized
Technical descriptors
3. Relationship between requirements and description
1.Cu
stom
er
requ
irem
ents
(Voi
ce o
f the
Cu
stom
er)
5.Pr
iori
tize
d Cu
stom
er
requ
irem
ents
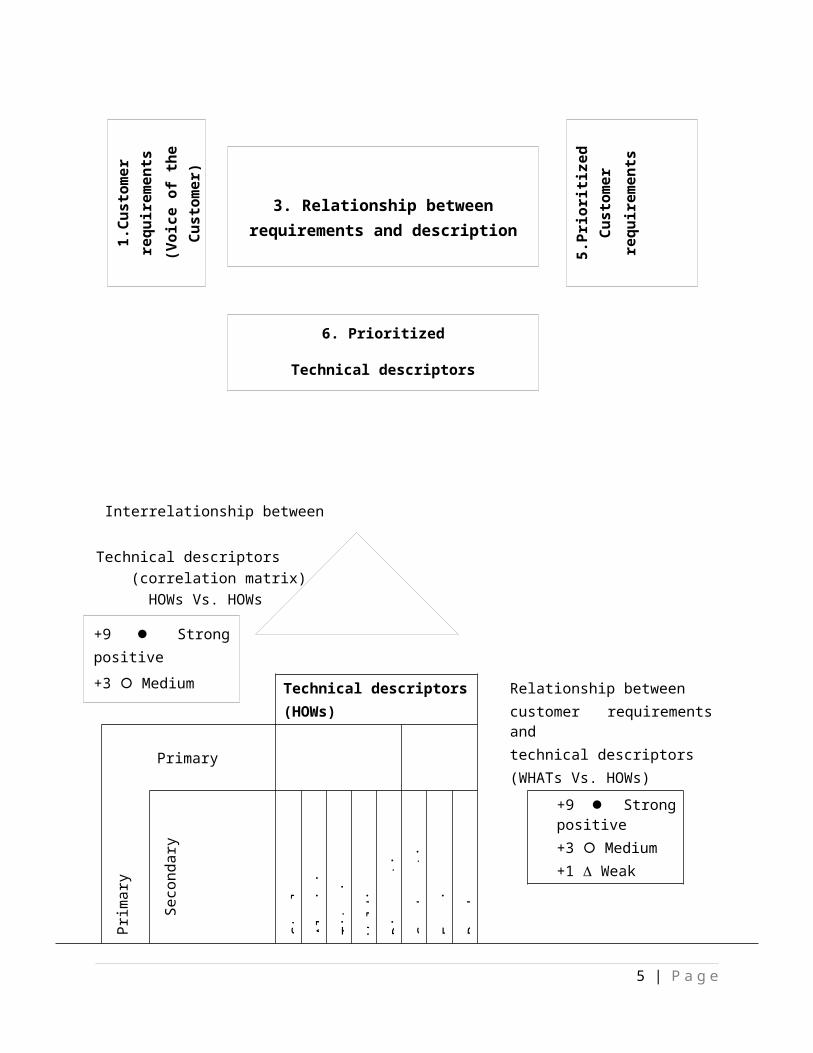
technical descriptors(WHATs Vs. HOWs)
PrimaryPr
imar
y
Se
cond
ary
Stee
l
Alu
min
ium
Tita
nium
Wel
ding
Die
cas
ting
Sand
cas
ting
Forg
ing
Pow
der m
etal
lurg
y
+9 Strong positive+3 Medium+1 Weak
1.C
usto
mer
req
uire
men
ts(W
HA
Ts)
Aes
thet
ics
Reasonable cost 3 4 2 8 4 1.3 1.5 16
5.Pr
iorit
ized
cu
stom
er
requ
irem
ents
Aerodynamic look 4 5 3 5 4 1 1.5 8
Nice finish 4 5 3 5 4 1 1 5
Corrosion resistant 4 4 2 2 4 1 1 2
Perf
orm
ance Light weight 3 4 2 7 4 1.3 2 18
Strength 3 3 4 5 4 1 1 5
Durable 3 3 4 3 4 1 1 3
Technical competitive assessment
Our product 0 5 0 0 5 0 0 0O
ur p
rodu
ct
A’s
pro
duct
B’s
pro
duct
Impo
rtanc
e to
cus
tom
er
Targ
et v
alue
Scal
e-up
fact
or
Sale
s po
int
Abs
olut
e w
eigh
t and
per
cent
A’s product 0 0 5 0 5 0 0 0
B’s product 5 0 0 4 0 0 0 0
Cus
tom
er
com
petit
ive
asse
ssm
ent
Failure Mode Effect Analysis (FMEA)1. What is FMEA?Failure Mode & Effect Analysis (FMEA), also known as risk analysis, is a preventive measure to systematically display the causes, effects and possible actions regarding observed failures.2. List out the 2 functions of FEMA?FMEA is a systematic group of activities intended to
5 | P a g e
(a) Identify and evaluate the potential failure of a product/process (b) Identify action that could eliminate or reduce the change of the
occurrence of potential failure.3. State the objective of FMEA.The objective of FMEA is to anticipate/Expect failures and prevent them from occurring FMEA priorities failures and attempts to eliminate their causes.4. What are the various types of FMEA?The various types of FMEA are:
System FMEA Process FMEA Equipment FMEA Concept FMEA
Design FMEA Service FMEA Maintenance FMEA Environmental FMEA
5. List the benefits of FMEA.The benefits of FMEA include: Improved product or process reliability and quality. Increased customer satisfaction. Early identification and elimination of potential product or process failure modes. Prioritized product or process deficiencies.
6. List the four stages of FMEA.The four stages of FMEA are:
Specifying possibilities Quantifying risk Correcting high risk causes Re-evaluation of risk.
7. Differentiate the terms Failure Mode and Failure Effects.A failure mode is defined as the manner in which a component, subsystem, system, process etc. could potentially fail to meet the design purpose.A failure effect is defined as the result of a failure mode on the function of the product or process as perceived by the customer.8. Define Risk Priority Number (RPN). Also state its significance.The risk priority number (RPN) is defined as the product of the severity (S), occurrence (O), and detection (D) rakings.
6 | P a g e
i.e., RPN = S O D.The RPN is used to prioritize items that require additional quality planning or action.9. What is Failure Rate:
Probability of survival of a product using expendable distribution may be expressed as Rt = e
- λt
Where ‘Rt’ is reliability or probability of survival,‘t’ is time specified for operation without failure, ‘’ is failure rate, ‘’ is Mean time to failure.Elaborately discuss the Process and stages of FMEA in detail? (16 Mark Qustion)Step: 1. List out the item and function2. Detect a failure mode (FM)3. Document the failure mode-FEMA Documentation.4. Describe the effect of failure mode5. Identify the causes of failure mode6. Identify the Severity number (SEV)7. Decide Probability number (Occur)8. Identify the Detection number (DETEC)
To calculate Risk Priority Number (RPN)RPN = S O D.Severity (S), occurrence (O), and detection (D) rakings.9. Assign Responsibility10. Implememtation and follow up Process.The various types of FMEA are:
System FMEA Process FMEA Equipment FMEA Concept FMEA
Design FMEA Service FMEA Maintenance FMEA Environmental FMEA
7 | P a g e
Describe in detail about the seven statistical (OLD and NEW) tools of quality.
Introduction:-
Prof. Ishikawa proposed seven tools based on statistical techniques. The seven basic tools are used to facilitate successful accomplishment of quality improvement objectives.
The seven OLD statistical tools of quality are as follows:
1. Process Flow-diagram2. Cause & effect diagram or Fishbone diagram3. Histogram4. Pareto diagram5. Check sheet6. Scatter diagram 7. Control chartsThe following are the New 7 Tools of quality:
1. Affinity or KJ diagram 2. Relationship diagram3. Tree diagram4. Matrix diagram5. Decision Tree or process decision program me chart6. Arrow diagram (PERT)
7. Matrix data Analysis
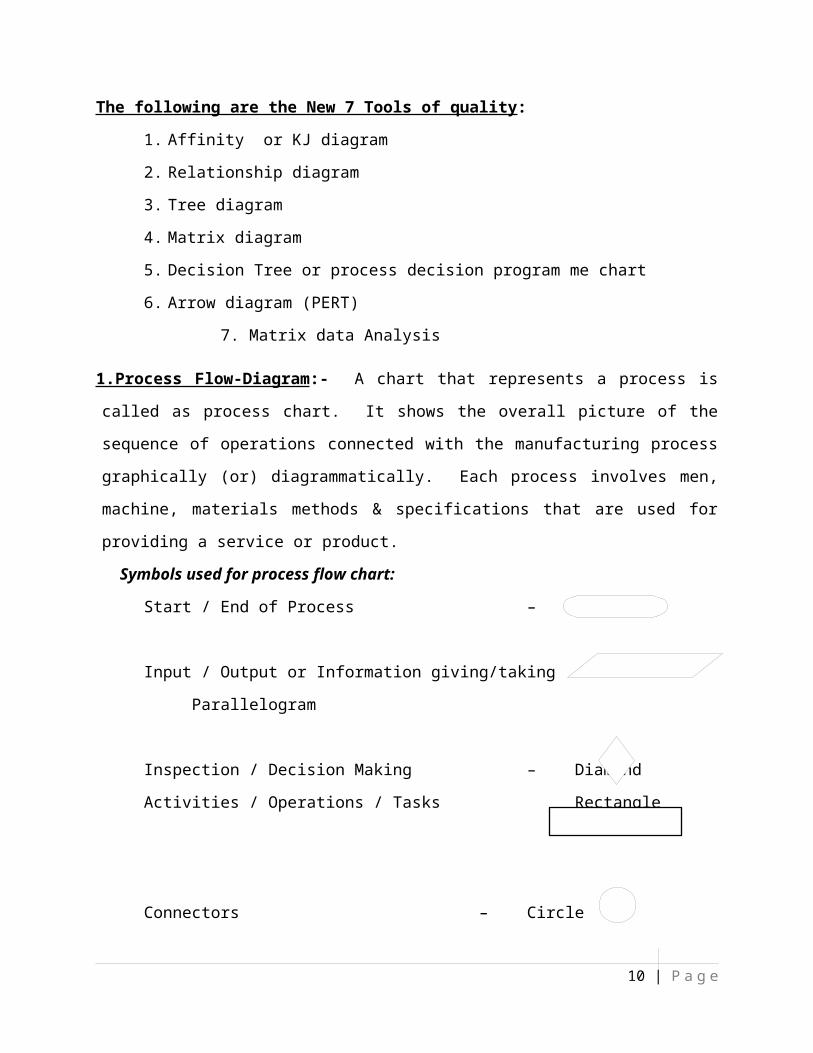
1.Process Flow-Diagram:- A chart that represents a process is called as process chart. It shows the overall picture of the sequence of operations connected with the manufacturing process graphically (or) diagrammatically. Each process involves men, machine, materials methods & specifications that are used for providing a service or product.
Symbols used for process flow chart:Start / End of Process – Ellipse
8 | P a g e
Input / Output or Information giving/taking – Parallelogram
Inspection / Decision Making – DiamondActivities / Operations / Tasks Rectangle
Connectors – Circle
To connect the portions of the chart – Lines or
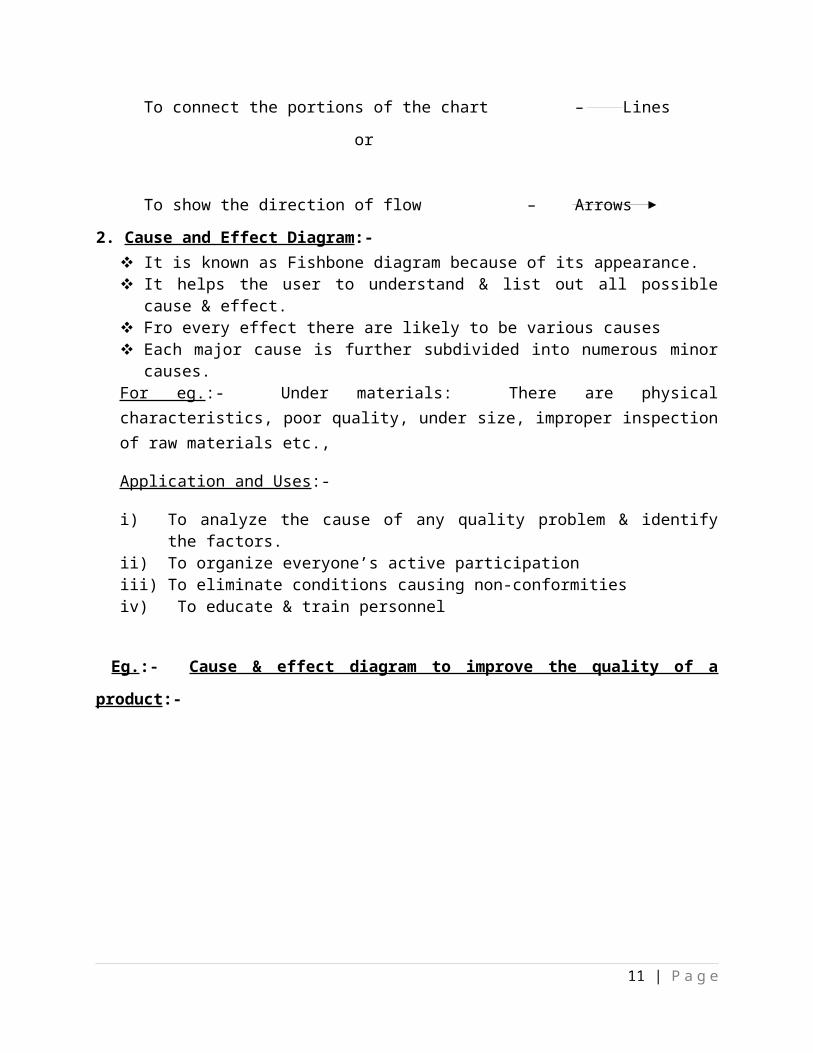
To show the direction of flow – Arrows2. Cause and Effect Diagram:-
It is known as Fishbone diagram because of its appearance. It helps the user to understand & list out all possible cause & effect. Fro every effect there are likely to be various causes Each major cause is further subdivided into numerous minor causes.For eg.:- Under materials: There are physical characteristics, poor quality, under size, improper inspection of raw materials etc.,
Application and Uses:-
i) To analyze the cause of any quality problem & identify the factors.ii) To organize everyone’s active participationiii) To eliminate conditions causing non-conformitiesiv) To educate & train personnel
Eg.:- Cause & effect diagram to improve the quality of a product:-
9 | P a g e
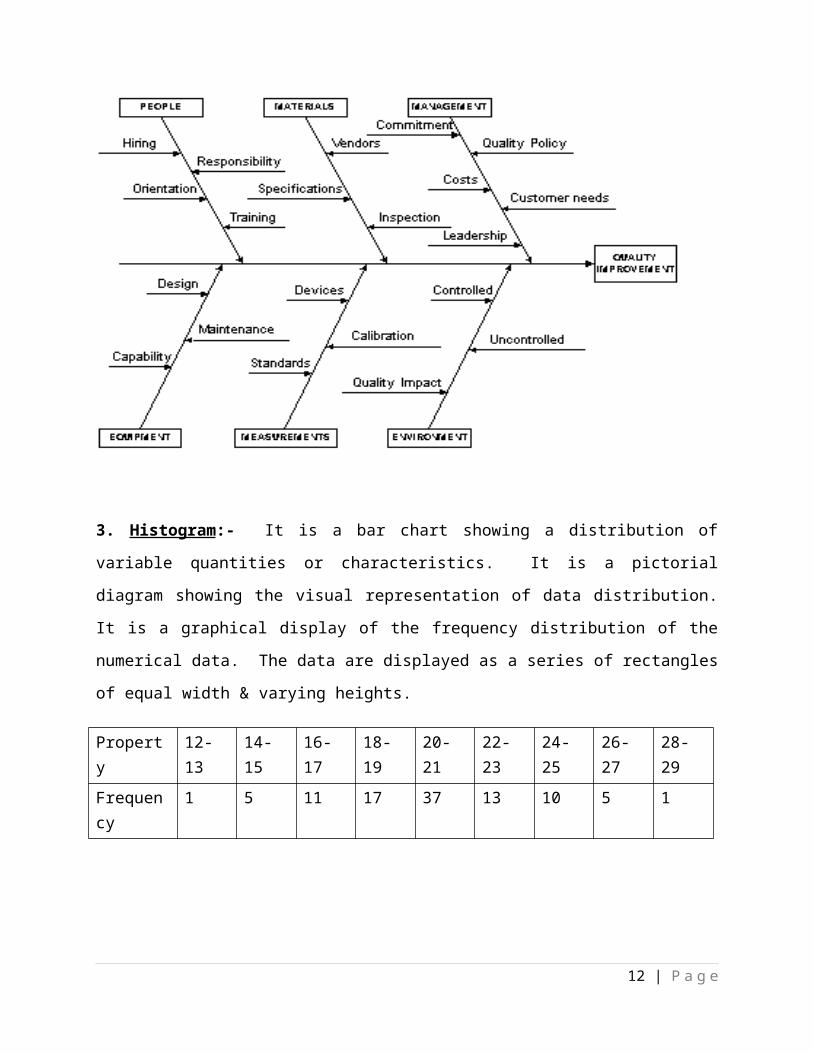
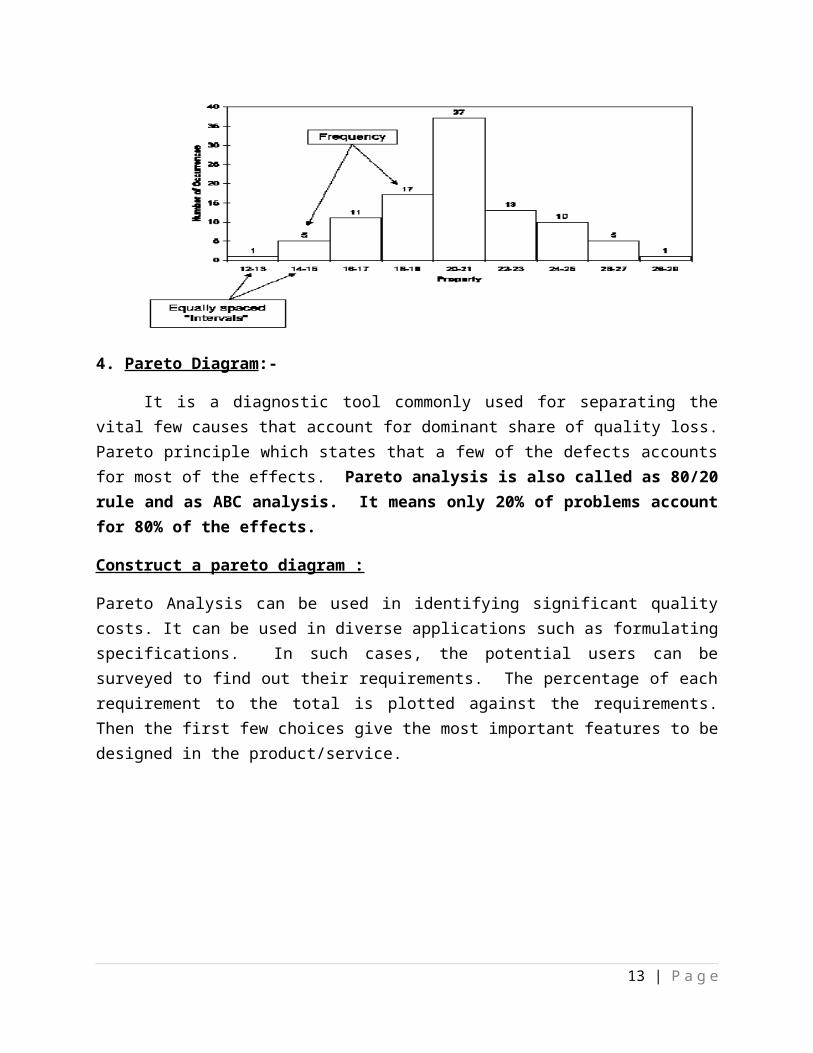
3. Histogram:- It is a bar chart showing a distribution of variable quantities or characteristics. It is a pictorial diagram showing the visual representation of data distribution. It is a graphical display of the frequency distribution of the numerical data. The data are displayed as a series of rectangles of equal width & varying heights.
Property 12-13
14-15
16-17
18-19
20-21
22-23
24-25
26-27
28-29
Frequency
1 5 11 17 37 13 10 5 1
10 | P a g e
4. Pareto Diagram:-
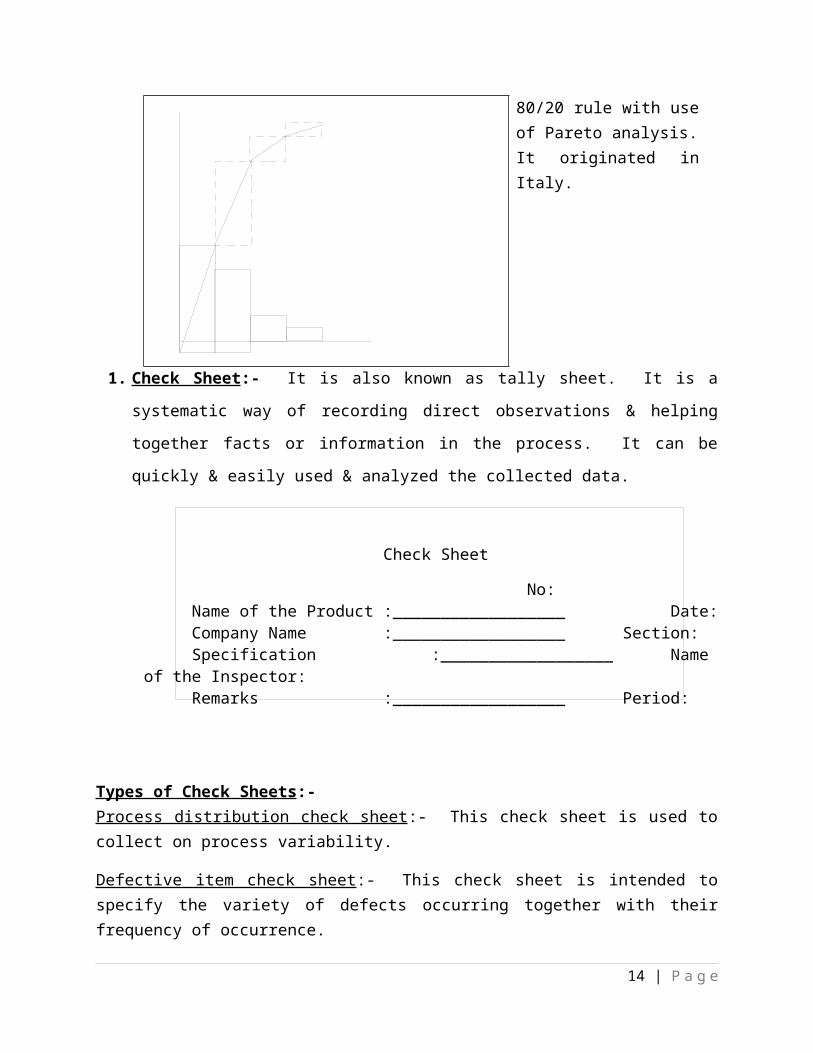
It is a diagnostic tool commonly used for separating the vital few causes that account for dominant share of quality loss. Pareto principle which states that a few of the defects accounts for most of the effects. Pareto analysis is also called as 80/20 rule and as ABC analysis. It means only 20% of problems account for 80% of the effects.
Construct a pareto diagram :
Pareto Analysis can be used in identifying significant quality costs. It can be used in diverse applications such as formulating specifications. In such cases, the potential users can be surveyed to find out their requirements. The percentage of each requirement to the total is plotted against the requirements. Then the first few choices give the most important features to be designed in the product/service.
80/20 rule with use of Pareto analysis.It originated in Italy.
11 | P a g e
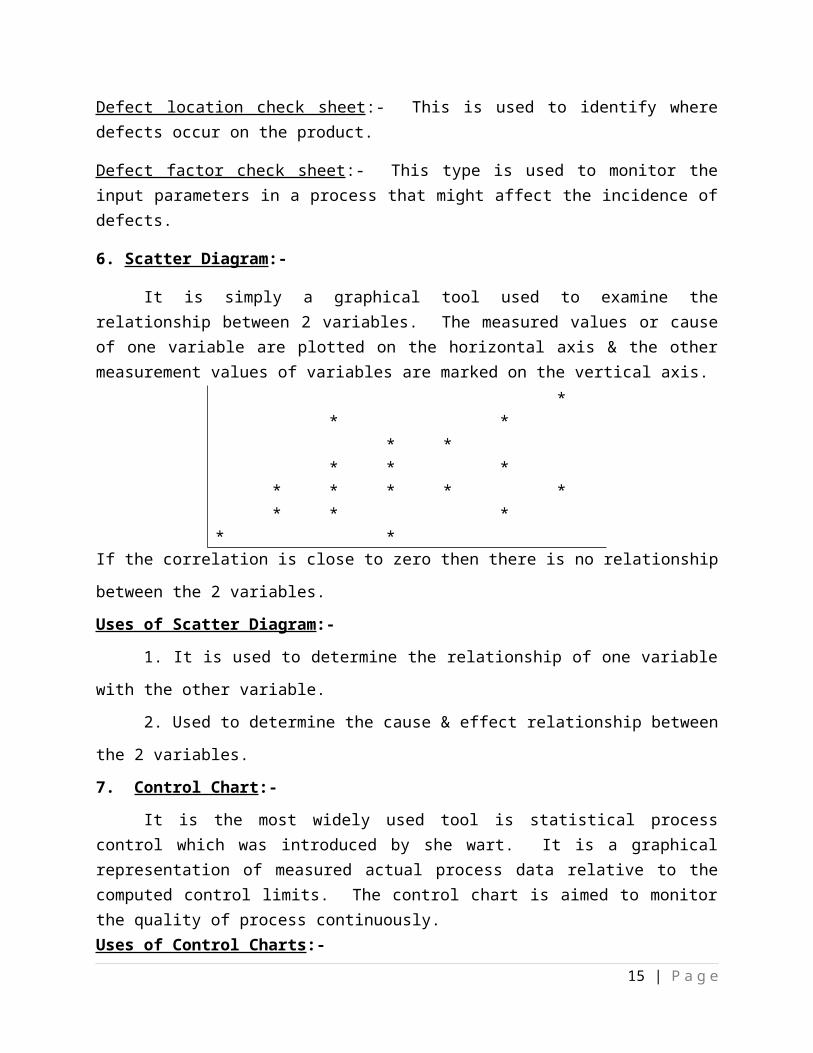
1. Check Sheet :- It is also known as tally sheet. It is a systematic way of recording direct observations & helping together facts or information in the process. It can be quickly & easily used & analyzed the collected data.
Check SheetNo:
Name of the Product :__________________ Date:Company Name :__________________ Section:Specification :__________________ Name of
the Inspector:Remarks :__________________ Period:
Types of Check Sheets:- Process distribution check sheet:- This check sheet is used to collect on process variability.
Defective item check sheet:- This check sheet is intended to specify the variety of defects occurring together with their frequency of occurrence.
Defect location check sheet:- This is used to identify where defects occur on the product.
Defect factor check sheet:- This type is used to monitor the input parameters in a process that might affect the incidence of defects.
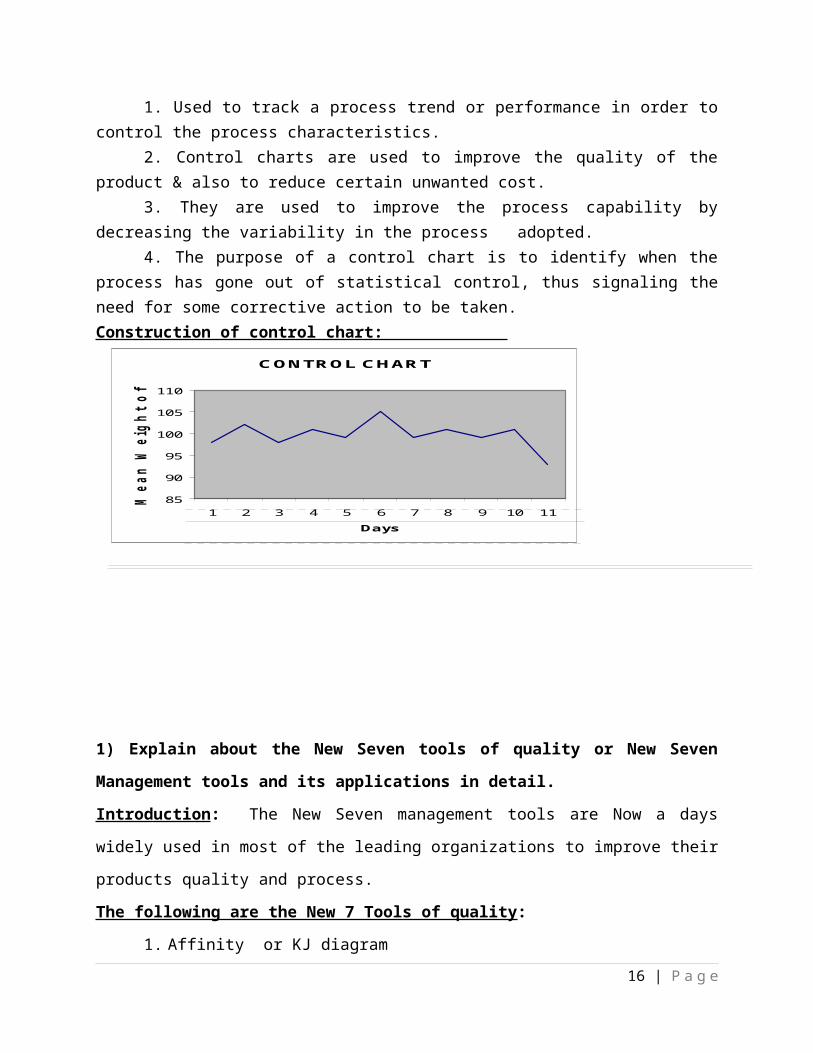
6. Scatter Diagram:-
It is simply a graphical tool used to examine the relationship between 2 variables. The measured values or cause of one variable are plotted on the horizontal axis & the other measurement values of variables are marked on the vertical axis.
** *
* ** * *
* * * * ** * *
* *
12 | P a g e
If the correlation is close to zero then there is no relationship between the 2 variables.Uses of Scatter Diagram:-
1. It is used to determine the relationship of one variable with the other variable.
2. Used to determine the cause & effect relationship between the 2 variables.7. Control Chart:-
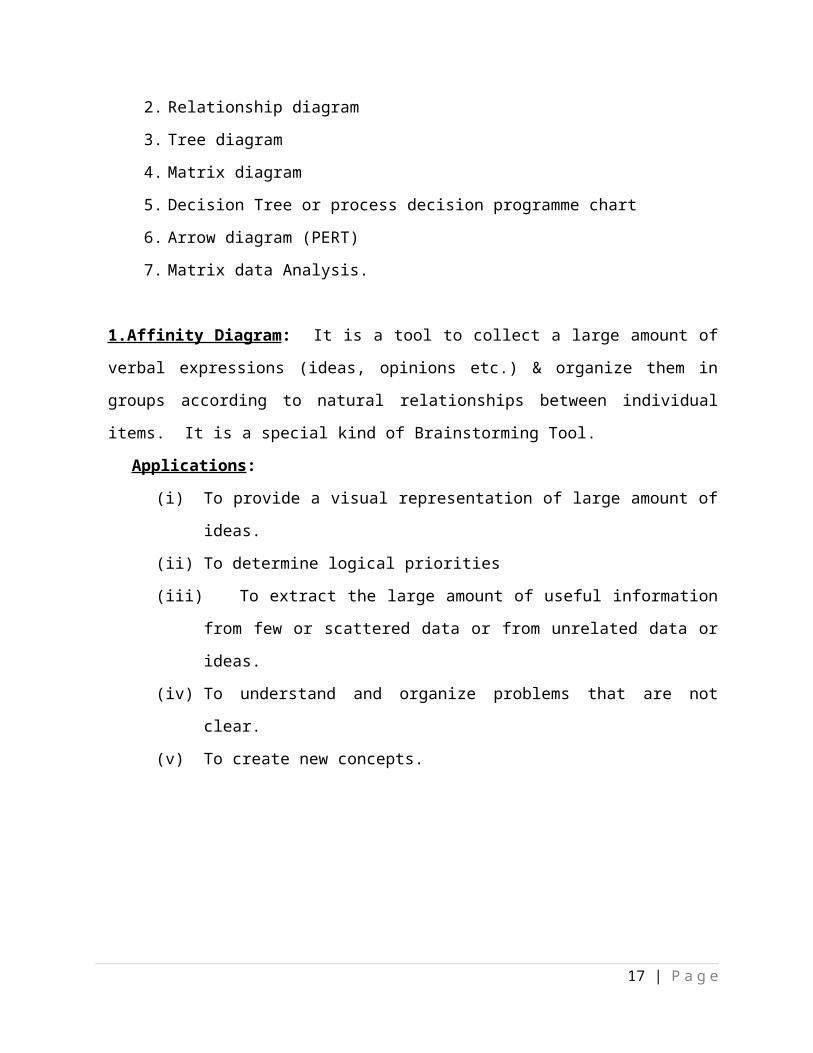
It is the most widely used tool is statistical process control which was introduced by she wart. It is a graphical representation of measured actual process data relative to the computed control limits. The control chart is aimed to monitor the quality of process continuously.Uses of Control Charts:-
1. Used to track a process trend or performance in order to control the process characteristics.
2. Control charts are used to improve the quality of the product & also to reduce certain unwanted cost.
3. They are used to improve the process capability by decreasing the variability in the process adopted.
4. The purpose of a control chart is to identify when the process has gone out of statistical control, thus signaling the need for some corrective action to be taken.Construction of control chart:
CONTROL CHART
85
90
95
100
105
110
1 2 3 4 5 6 7 8 9 10 11
Days
Mea
n W
eigh
t of t
he P
acke
ts
13 | P a g e
1) Explain about the New Seven tools of quality or New Seven Management tools and its applications in detail.Introduction: The New Seven management tools are Now a days widely used in most of the leading organizations to improve their products quality and process.The following are the New 7 Tools of quality:
1. Affinity or KJ diagram2. Relationship diagram3. Tree diagram4. Matrix diagram5. Decision Tree or process decision programme chart6. Arrow diagram (PERT)7. Matrix data Analysis.
1.Affinity Diagram: It is a tool to collect a large amount of verbal expressions (ideas, opinions etc.) & organize them in groups according to natural relationships between individual items. It is a special kind of Brainstorming Tool.
Applications:(i) To provide a visual representation of large amount of ideas.(ii) To determine logical priorities(iii) To extract the large amount of useful information from few or
scattered data or from unrelated data or ideas.(iv) To understand and organize problems that are not clear.(v) To create new concepts.
14 | P a g e
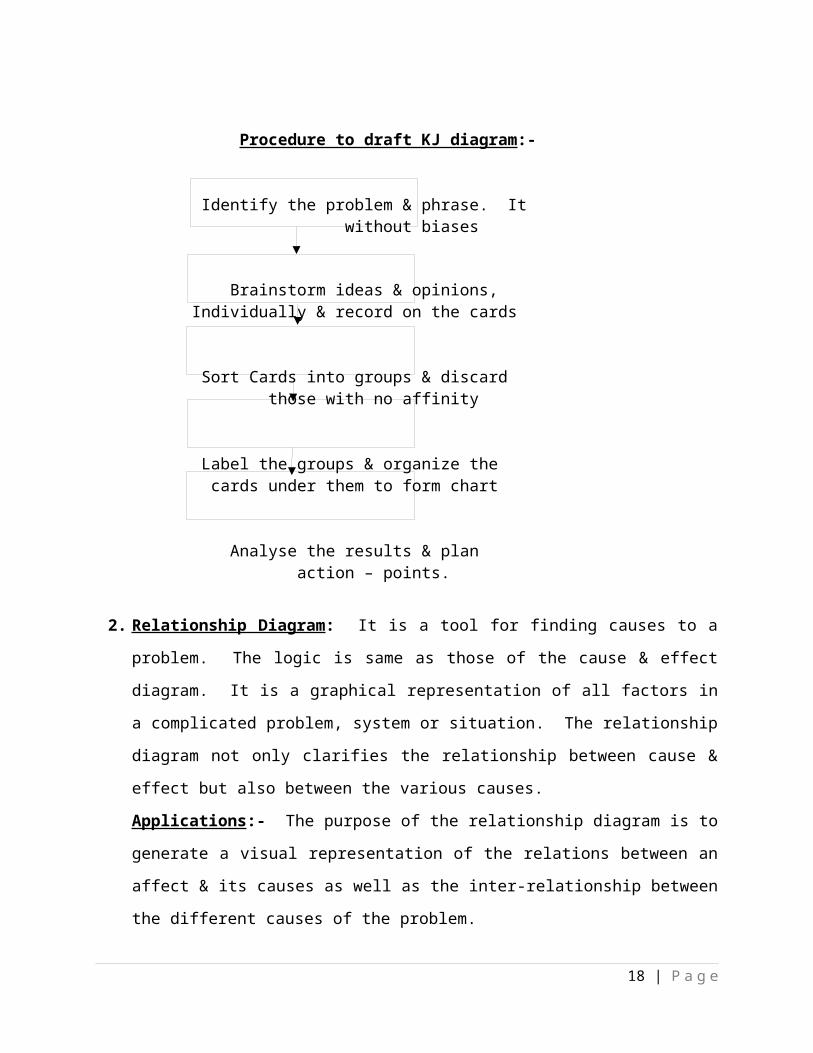
Procedure to draft KJ diagram:-
Identify the problem & phrase. It without biases
Brainstorm ideas & opinions,Individually & record on the cards
Sort Cards into groups & discard those with no affinity
Label the groups & organize the cards under them to form chart
Analyse the results & plan action – points.
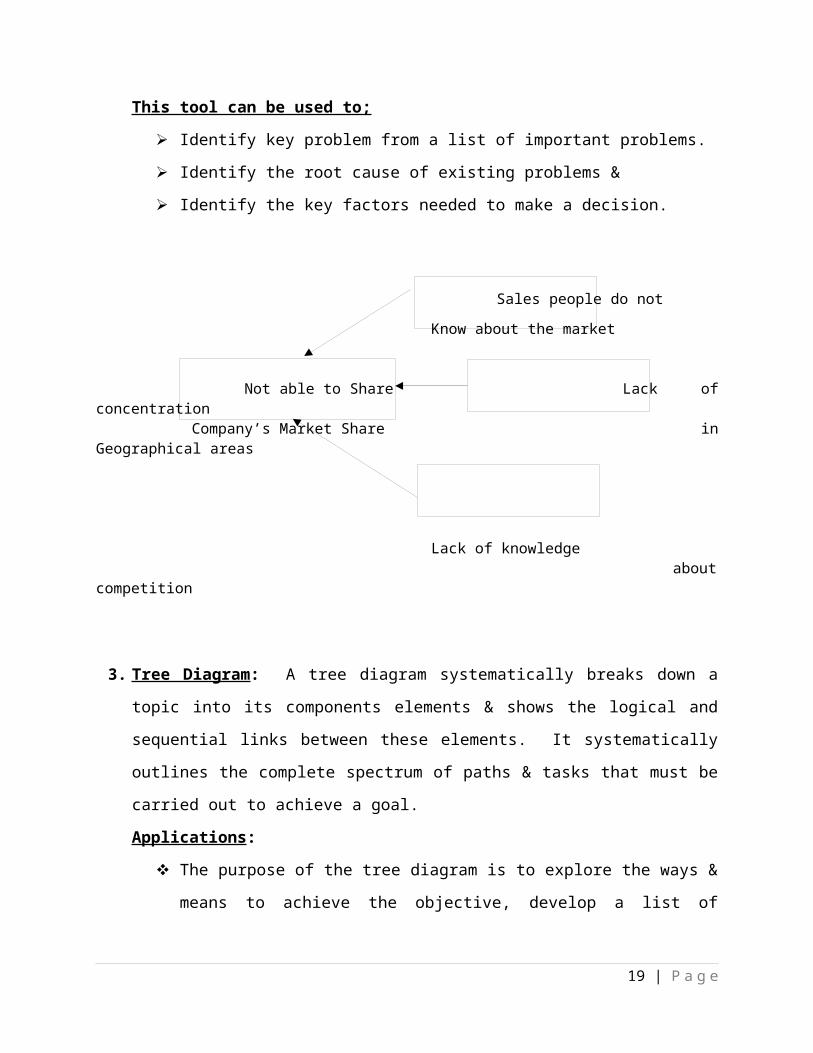
2. Relationship Diagram : It is a tool for finding causes to a problem. The logic is same as those of the cause & effect diagram. It is a graphical representation of all factors in a complicated problem, system or situation. The relationship diagram not only clarifies the relationship between cause & effect but also between the various causes. Applications:- The purpose of the relationship diagram is to generate a visual representation of the relations between an affect & its causes as well as the inter-relationship between the different causes of the problem.This tool can be used to;
Identify key problem from a list of important problems. Identify the root cause of existing problems & Identify the key factors needed to make a decision.
15 | P a g e
Sales people do not
Know about the market
Not able to Share Lack of concentrationCompany’s Market Share in Geographical areas
Lack of knowledge
about competition
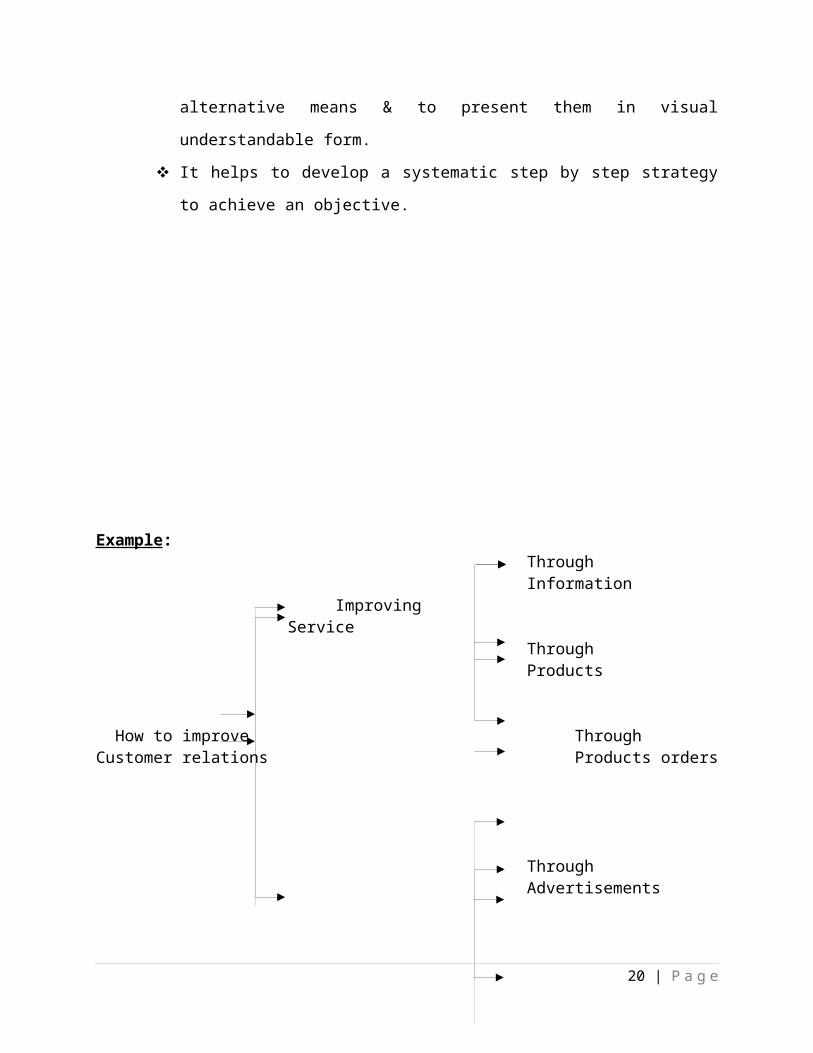
3. Tree Diagram : A tree diagram systematically breaks down a topic into its components elements & shows the logical and sequential links between these elements. It systematically outlines the complete spectrum of paths & tasks that must be carried out to achieve a goal.Applications:
The purpose of the tree diagram is to explore the ways & means to achieve the objective, develop a list of alternative means & to present them in visual understandable form.
It helps to develop a systematic step by step strategy to achieve an objective.
16 | P a g e
Example:ThroughInformation
ImprovingService
ThroughProducts
How to improve Through Customer relations Products orders
ThroughAdvertisements
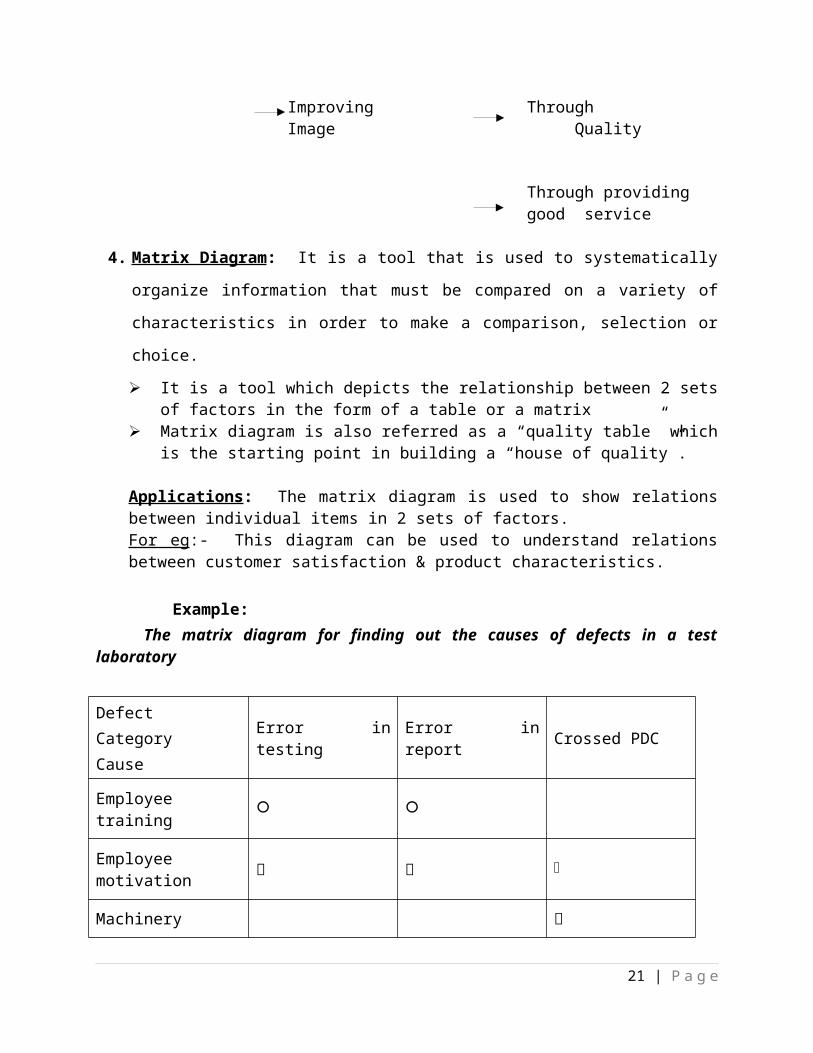
Improving ThroughImage Quality
Through providinggood service
4. Matrix Diagram : It is a tool that is used to systematically organize information that must be compared on a variety of characteristics in order to make a comparison, selection or choice. It is a tool which depicts the relationship between 2 sets of factors in
the form of a table or a matrix Matrix diagram is also referred as a “quality table” which is the
starting point in building a “house of quality”.
Applications: The matrix diagram is used to show relations between individual items in 2 sets of factors.For eg:- This diagram can be used to understand relations between customer satisfaction & product characteristics.
Example:The matrix diagram for finding out the causes of defects in a
test laboratory
17 | P a g e
Defect CategoryCause
Error in testing Error in report Crossed PDC
Employee training
Employee motivation
Machinery
Methods
Supervisor
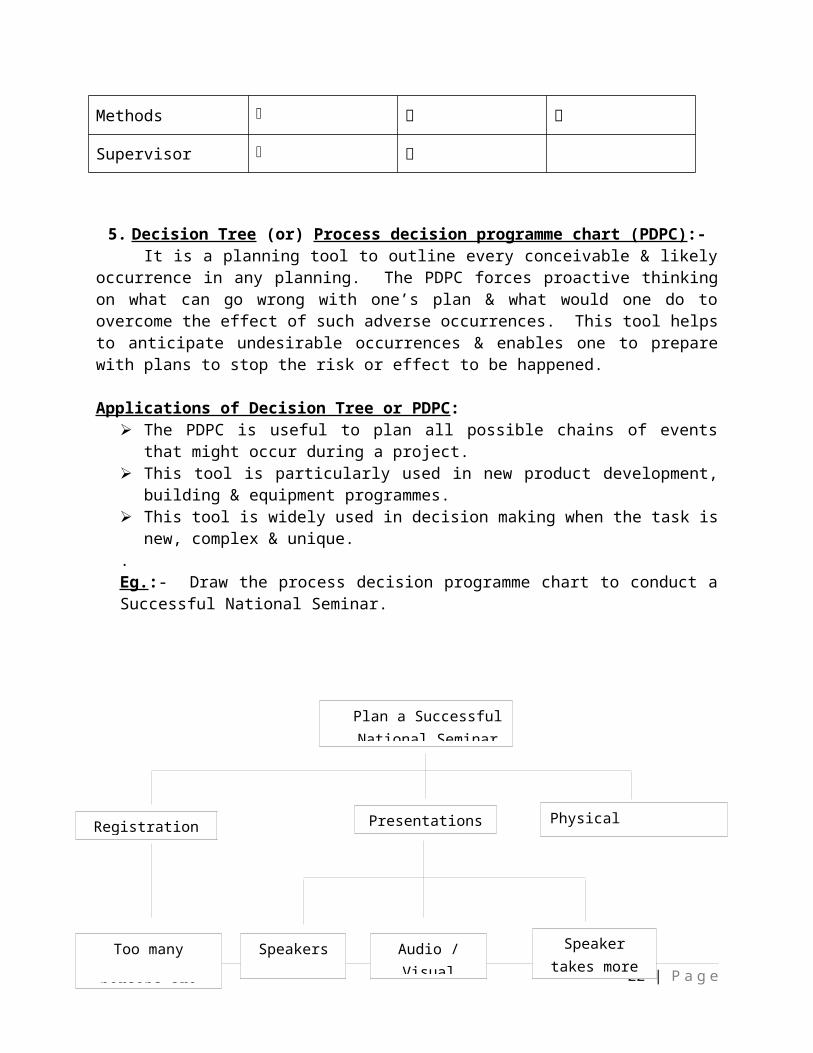
5. Decision Tree (or) Process decision programme chart (PDPC):-
It is a planning tool to outline every conceivable & likely occurrence in any planning. The PDPC forces proactive thinking on what can go wrong with one’s plan & what would one do to overcome the effect of such adverse occurrences. This tool helps to anticipate undesirable occurrences & enables one to prepare with plans to stop the risk or effect to be happened.
Applications of Decision Tree or PDPC: The PDPC is useful to plan all possible chains of events that might
occur during a project. This tool is particularly used in new product development, building &
equipment programmes. This tool is widely used in decision making when the task is new,
complex & unique.. Eg.:- Draw the process decision programme chart to conduct a Successful National Seminar.
18 | P a g e
Plan a Successful National Seminar
Registration Physical arrangementsPresentations
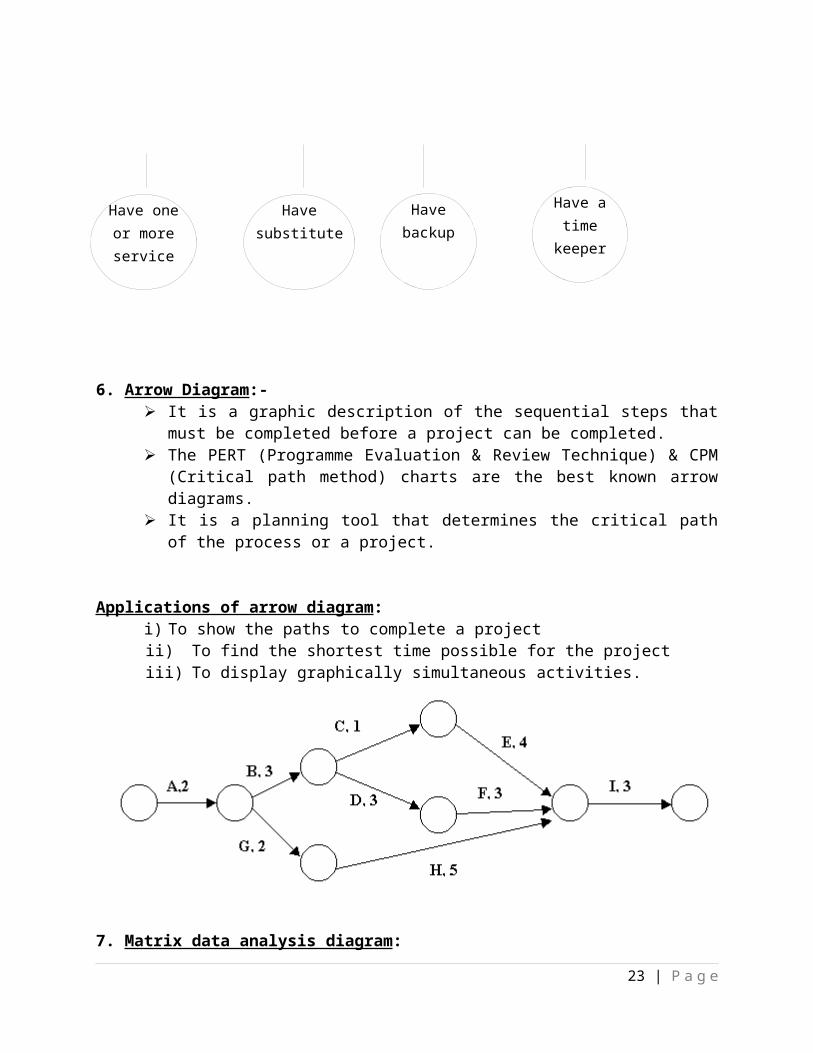
6. Arrow Diagram:- It is a graphic description of the sequential steps that must be
completed before a project can be completed. The PERT (Programme Evaluation & Review Technique) & CPM
(Critical path method) charts are the best known arrow diagrams. It is a planning tool that determines the critical path of the process
or a project.
Applications of arrow diagram:i) To show the paths to complete a projectii) To find the shortest time possible for the projectiii) To display graphically simultaneous activities.
7. Matrix data analysis diagram:
It is a very much similar to a matrix diagram19 | P a g e
Speaker takes more time
Audio / Visual
failure
Speakers
late
Too many
persons are waiting
Have one or more service
Have a time keeper
Have backupHave substitute
The difference is that numerical data is used instead of symbols indicating the existence & strength of relationship.
It is the only tool among 7 tools which uses numerical data & produces numerical results.
Applications: The purpose is to present numerical data about 2 sets of factors in a matrix form & analyze it to get numerical output. This tool is used in ‘Principle Component Analysis’ where only 2 characteristics can be studied at a time. It is advantageous in studying the parameters of production processes in analyzing market information in finding links between numerical & non-numerical variables.
BenchmarkingMr.Robert C.Camp first coined the term benchmarking in 1980 in XEROX company.1.What is Benchmarking?1. “Benchmarking is finding and Implementing Best practices/World class in business”.2. Benchmarking is the process of identifying, understanding and adapting, outstanding practices and processes from organizations anywhere in the world to an organization to improve its performance.
2. List out the Features of Benchmarking:1. It is structured2. It is ongoing process3. Comparison is with best practice
3. Discuss the different types of Benchmarking?I. Problem based benchmarkingII. Process based benchmarking
III. Benchmarking based on “What is to be compared1. Product benchmarking
20 | P a g e
2. Performance benchmarking3. Process benchmarking4. Strategic benchmarking
IV.Benchmarking based on “Whom to compare”
1. Internal benchmarking2. Industry benchmarking3. Competitive benchmarking4. Best-in-class benchmarking5. Relationship benchmarking
4. Elaborately discuss Steps in Benchmarking Process:Phase: 1 Planning1. Decide what to benchmark2 .Identify comparator organization3. Collect the dataPhase:2 Analysis4. Determine Performance Gap5. Project future Performance levelsPhase:3 Integration6. Communicate Benchmarking findings7. Establish clear cut goalsPhase:4 Action8. Develop Action plans9. Implement changes and Monitor ProgressPhase:5 Maturity10. Recalibrate the benchmarks.
POKA-YOKE1.What do you mean by POKA-YOKE?Shigeo Shingo Introduced the concept of Poke-yoke in 1961 at Toyota Motor company.In simple words ,POKA-YOKE means “Mistake –Proofing’In a Japanese term POKA means- In advertent errors
21 | P a g e
YOKE means- To avoidPoke-Yoke are mechanism used to mistake-proof of an entire process. It performs a detective function, eliminating defects in the process as early as possible.2.Objectives of Poka-yoke:1. To achieve Zero defects2. Quality assurance process3. It predict the error rate3.What are the various types of POKA-YOKE?I. Prevention based POKA-YOKE(i) Control method(ii) Warning methodII. Detection –Based POKA-YOKE:
(i) Direct Contact Method(ii) Fixed value method - ODD Part out method(iii) Motion step method
4 .List out the Steps in Poke-Yoke?1. Identify Problem2. Observation at work station3. To collect new ideas4. Select best ideas5. Implement the ideas6. Follow-up and action.
22 | P a g e
23 | P a g e