· web viewnorthern territory department of correctional services annual statistics | 2012-2013 iv...
TRANSCRIPT

Northern TerritoryDepartment of
Correctional Services
Annual Statistics2012 – 2013

Northern Territory Department of Correctional Services Annual Statistics | 2012-2013
Northern Territory Department of Correctional Services
Annual Statistics2012 - 2013
© Northern Territory of Australia, Department of Correctional Services, 2014
All rights reserved.
Whilst all reasonable care has been taken in the preparation of this report, the Northern Territory of Australia, its employees and agents do not warrant or represent that the report is free from errors or omission, or that it is exhaustive. No liability is assumed for any errors or omissions.
Produced by:Criminal Justice Research and Statistics Unit
Northern Territory Government
GPO Box 1722
DARWIN NT 0801
Telephone: (08) 8935 7446
Website: www.nt.gov.au/justice/
i

Northern Territory Department of Correctional Services Annual Statistics | 2012-2013
CONTENTSAnnual Statistics....................................................................................................................................................... 1
Introduction........................................................................................................................................................... 1
Caseload Overview...........................................................................................................................................3
Adult Prisoners..................................................................................................................................................... 4
Population......................................................................................................................................................... 4
Receptions........................................................................................................................................................ 4
Imprisonment Rates..........................................................................................................................................4
Sentenced Prisoners........................................................................................................................................5
Offence............................................................................................................................................................. 5
Last Known Address.........................................................................................................................................5
Indigenous Status.............................................................................................................................................6
Age................................................................................................................................................................... 6
Sex.................................................................................................................................................................... 6
Marital Status.................................................................................................................................................... 7
Youth Detainees................................................................................................................................................... 8
Population......................................................................................................................................................... 8
Receptions and Sentence Status.....................................................................................................................9
Offence............................................................................................................................................................. 9
Indigenous Status.............................................................................................................................................9
Age................................................................................................................................................................... 9
Sex.................................................................................................................................................................... 9
Foreign National Prisoners.................................................................................................................................10
Adult Prisoners...............................................................................................................................................10
Youth Detainees.............................................................................................................................................10
Community Corrections Programs......................................................................................................................11
Program Caseload..........................................................................................................................................11
Commencements............................................................................................................................................11
Indigenous Status...........................................................................................................................................11
Age................................................................................................................................................................. 11
Sex.................................................................................................................................................................. 11
OVERVIEW OF PERFORMANCE.........................................................................................................................12
Performance....................................................................................................................................................... 12
SUPPORTING TABLES.........................................................................................................................................15
Census of Adult Prisoners as at 30 June 2013...................................................................................................15
Adult Prisoner and Youth Detainee Turnover During 2012-13...........................................................................20
Adult Prisoners During 2012-13..........................................................................................................................22
Youth Detainees During 2012-13.......................................................................................................................30
Community Corrections Caseload as at 30 June 2013......................................................................................35
Community Corrections Turnover During 2012-13.............................................................................................37
APPENDIX 1........................................................................................................................................................... 38
Offence Classifications.......................................................................................................................................38
ii

Northern Territory Department of Correctional Services Annual Statistics | 2012-2013
T A B L E STable 1 Summary of adult prisoner numbers in 2012-13 by correctional institution................................................4
Table 2 Summary of youth detainee numbers in 2012-13 by detention centre.......................................................8
Table 3 Summary of estimated daily average foreign prisoners and detainees from 1995-96 to 2012-13...........10
Table 4 National Performance Indicators..............................................................................................................13
Table 5 Census of prisoners by correctional institution, sentence status, Indigenous status and sex.................15
Table 6 Census of prisoners by correctional institution and employment status at time of reception..................15
Table 7 Census of prisoners by correctional institution and age...........................................................................16
Table 8 Census of prisoners by correctional institution and marital status............................................................16
Table 9 Census of sentenced prisoners by correctional institution and aggregate sentence................................16
Table 10 Census of prisoners by correctional institution, last known address and Indigenous status..................17
Table 11 Census of prisoners by offence and sentence status.............................................................................18
Table 12 Census of prisoners by correctional institution, Indigenous status and type of sentence......................19
Table 13 Adult and youth turnover summary.........................................................................................................20
Table 14 Adult and youth escapes (incidents and persons)..................................................................................20
Table 15 Adult and youth receptions by sentence status, Indigenous status and sex..........................................21
Table 16 Adult monthly daily average by correctional institution and sentence status..........................................22
Table 17 Adult exits by correctional institution, release reason and Indigenous status.........................................23
Table 18 Distinct adults received by correctional institution, age, sex and Indigenous status..............................24
Table 19 Distinct adults received by correctional institution, place of origin and Indigenous status.....................25
Table 20 Adult sentenced episode commencements by aggregate sentence, offence and Indigenous status. 26
Table 21 Adult sentenced episodes held by aggregate sentence, offence and Indigenous status.......................28
Table 22 Youth monthly daily average by sentence status...................................................................................30
Table 23 Youth exits by institution, release reason and Indigenous status...........................................................30
Table 24 Youth orders and distinct episode commencements by Indigenous status and sex..............................31
Table 25 Distinct youths received by last known address, age and Indigenous status.........................................32
Table 26 Youth receptions by offence...................................................................................................................34
Table 27 Community Corrections adult program caseload by office, Indigenous status and program...................35
Table 28 Community Corrections youth program caseload by office, Indigenous status and program................36
Table 29 Conditional liberty program completions.................................................................................................37
Table 30 Conditional liberty program commencements by Indigenous status and sex.........................................37
Table 31 Conditional liberty distinct persons commencing by Indigenous status and sex....................................37
iii
Northern Territory Department of Correctional Services Annual Statistics | 2012-2013
F I G U R E SFigure 1 Northern Territory Correctional Services distinct client caseload..............................................................3
Figure 2 Yearly daily average adult prisoners from 1991-92 to 2012-13.................................................................4
Figure 3 Estimated adult imprisonment rates by jurisdiction, 2012-13....................................................................5
Figure 4 Estimated adult Indigenous imprisonment rates by jurisdiction, 2012-13..................................................6
Figure 5 Estimated adult female imprisonment rates, 2006-07 to 2012-13.............................................................7
Figure 6 Yearly daily average youth detainees from 1991-92 to 2012-13...............................................................8
Figure 7 Community Corrections program caseload (adult and youth).................................................................11
iv
Northern Territory Department of Correctional Services Annual Statistics | 2012-2013
ANNUAL STATISTICS
INTRODUCTIONThe Northern Territory Department of Correctional Services (NTDCS) supervise both adults and youths who are subject to imprisonment/detention or community based court orders. Persons in custody are located at:Adults -
Alice Springs Correctional Centre; Darwin Correctional Centre; and Barkly Work Camp.
Youths - Aranda House, located in Alice Springs, which is a temporary youth holding facility; Alice Springs Youth Detention Centre, located within the Alice Springs Correctional Precinct; and Don Dale Youth Detention Centre, located 16 km south of Darwin.
The non-custodial orders are administered by officers located in eight offices throughout the Northern Territory (NT):
Palmerston and Top End Region (Jabiru, Maningrida, Oenpelli, Tiwi Islands); Casuarina; Alice Springs; Katherine; Tennant Creek; Groote Eylandt (Alyangula); Wadeye (Port Keats); and Nhulunbuy.
This report presents detailed statistics on adults and youths supervised by NTDCS during2012-13. Data from 2011-12 are supplied for comparison purposes as well as some long term data to show trends.
Statistics in this report include demographic characteristics of prisoners and community corrections clients, receptions, sentence status, offence types, last known address, caseload, community corrections client turn over, imprisonment rates and sentence durations.
The majority of the data are extracted from the Integrated Offender Management System (IOMS). Some internal data compiled by NTDCS are also used, (eg escape information, daily averages).
National rates of imprisonment, compiled by the Australian Bureau of Statistics (ABS) are provided for comparison with NT rates.
Selected characteristics in relation to the NT and other jurisdictions for 2012-13 from the ‘Report on Government Services’ are presented in this report.
Care should be taken when comparing information from this with other publications (eg ABS publications, Department of Justice Annual Report and Report on Government Services), as different data collection timeframes, data extractions dates, different data sources or different counting methods may have been used.
The tables provided in this publication relating to the census of prisoners held on 30 June 2013 only include prisoners held in NT Correctional Centres. It does not include two prisoners who were held in Police Prisons on the night of 30 June 2013. These police prisoners are included in the ABS publication “Prisoners in Australia” therefore some differences may occur between figures in this report and figures published by the ABS.
The basis for reporting on offences is the Most Serious Offence (MSO) for the episode as recorded in IOMS. To enable national comparability, reporting on offences is in accordance with the Australian and New Zealand Standard Offence Classification (ANZSOC) divisions and selected subdivisions. Offence table abbreviations and classifications can be found in Appendix 1.
The totals in some tables (eg daily averages) may differ to the sum of the components due to rounding of the values of the components.
1

Northern Territory Department of Correctional Services Annual Statistics | 2012-2013
This comprehensive set of statistics is primarily used by NTDCS staff for tactical and strategic planning relating to correctional services in the Northern Territory. Researchers and practitioners from other jurisdictions may also find this publication informative.
This report was compiled by the Criminal Justice Research and Statistics Unit, Northern Territory Government and is available via the website:
http:/www.nt.gov.au/justice/
2

Northern Territory Department of Correctional Services Annual Statistics | 2012-2013
CASELOAD OVERVIEW
On 30 June 2013, the Northern Territory Correctional Services caseload consisted of 2,705 distinct persons, either undertaking a community based program or in custody in a correctional institution. This is estimated as 1,362 per 100,0001 persons in the Northern Territory.
1 Derived from the Australian Bureau of Statistics publication (3101.0) – Australian Demographic Statistics, September 2012
3
Figure 1 Northern Territory Correctional Services distinct client caseload as at 30 June 2013.
Object 2

Northern Territory Department of Correctional Services Annual Statistics | 2012-2013
ADULT PRISONERS
PopulationThe daily average number of prisoners held in adult correctional institutions in the Northern Territory in 2012-13 was 1,474 which was 10% higher than the previous year (1,337). The following figure shows the prison population has steadily been increasing over the past 22 years.
The minimum and maximum number of prisoners that were held in custody in an adult correctional institution in the Northern Territory on any day during 2012-13 was 1,358 and 1,575 respectively. The average occupancy level of the combined correctional institutions was 122% during the year.
ReceptionsThere were 3,922 receptions into Northern Territory adult correctional institutions during 2012-13, an increase of 14% from the previous year. These receptions involved 3,055 distinct persons.
Imprisonment RatesThe rate of imprisonment2 of adults in the Northern Territory for 2012-13 is estimated to be 853 per 100,000 adults, which continues to be significantly higher than in other jurisdictions (see Figure 3 below). The national rate of imprisonment is estimated as 171 per 100,000 adults.
2 Derived from the Australian Bureau of Statistics publication (4512.0) – Corrective Services Australia, June quarter 2013.4
Figure 2 Yearly daily average adult prisoners from 1991-92 to 2012-13.
Table 1 Summary of adult prisoner numbers in 2012-13 by correctional institution.
Correctional Institution Minimum Maximum Daily Average Design Capacity
Average Occupancy
Level
Alice Springs Correctional Centre 522 650 602 476 126%
Darwin Correctional Centre 775 857 814 678 120%
Barkly Work Camp 43 74 58 50 116%
All Centres 1358 1575 1474 1204 122%

Northern Territory Department of Correctional Services Annual Statistics | 2012-2013
Sentenced PrisonersOn 30 June 2013, sentenced prisoners represented 75% of those in custody. Of these 41% had a sentence of less than 12 months.
During 2012-13, sentenced prisoners represented 66% of the receptions and 77% of the daily average number of prisoners in adult correctional institutions.
The average sentence length for prisoners sentenced to imprisonment during 2012-13 (excluding prisoners with life sentences) was 238 days and the median aggregate sentence length was 122 days. This is noticeably less than the average and median aggregate sentence for 2011-12 (299 and 141 days respectively). The average sentence length for Indigenous prisoners who were sentenced was 219 days.
The most common offence for sentenced episode commencements was ‘Acts intended to cause injury’ which represented 47% of the commencements and the average aggregate sentence length was 243 days. The longest average aggregate sentences were recorded for ‘Murder’ (life), ‘Manslaughter and driving causing death’ (3523 days), ’Sexual assault and related offences’ (approximately 2134 days), and ‘Robbery, extortion and related offences’ (1264 days).
The average sentence length for all sentenced prisoners held in custody during 2012-13 (excluding prisoners with life sentences) during the period was 507 days and the median sentence length was 181 days.
OffenceThe most common offences3 for prisoners held in custody on 30 June 2013 were ‘Acts intended to cause injury’ (50% of prisoners), followed by ‘Sexual assault and related offences’ (12% of prisoners) and ‘Homicide and related offences’ (8% of prisoners).
Last Known AddressAlice Springs was the most common last known address for prisoners held in custody on 30 June 2013 representing 20% (286) of prisoners in custody. This was followed by Katherine at 8% (118), Casuarina and Darwin both at 7% (104), and Tennant Creek at 6% (93).
3 The most serious offence for the custody episode as recorded in IOMS.5
Figure 3 Estimated adult imprisonment rates by jurisdiction, 2012-13.
Estimates of imprisonment rate per 100,000 adult population based on ABS Corrective Services Australia (4512.0).

Northern Territory Department of Correctional Services Annual Statistics | 2012-2013
Indigenous StatusThe daily average number of Indigenous prisoners in custody during 2012-13 was 1,247, which represented 85% of the total daily average.
On 30 June 2013, there were 1,239 Indigenous prisoners in custody in an adult correctional institution in the Northern Territory, which represented 86% of total prisoners.
The figure below shows the estimated rate of imprisonment of Indigenous adults in the Northern Territory was 2,837 persons per 100,000 Indigenous adults, which is 22% more than the national average of 2,320 persons per 100,000 Indigenous adults.
The estimated Northern Territory non-Indigenous rate of imprisonment was 176 per 100,000 non-Indigenous adults, compared with the national rate of 126 per 100,0004. Excluding People Smugglers from the non-Indigenous prisoner population, the estimated Northern Territory non-Indigenous rate of imprisonment would be 154 per 100,000 non-Indigenous adults.
Age
The average age of distinct prisoners received into custody during 2012-13 was 33 years. There were 25 distinct prisoners received into custody who were aged 60 years or older, with the oldest prisoner aged 71 at reception.
SexOn 30 June 2013, there were 106 female prisoners in custody, which represented 7% of the Northern Territory prison population. During 2012-13, there were 259 sentenced female receptions, a 32% increase compared with the previous year (196).
The daily average number of adult females in custody during 2012-13 was 91, which was 34% higher than the previous year (68). During 2012-13, the average daily proportion of females in the Northern Territory prison population was 6%, which is noticeably lower than the national average of 8% for the same period5.
The estimated Northern Territory female imprisonment rate for 2012-13 was 111 per 100,000 adult females, an increase of 31% from the previous year. The estimated Australian rate for the same period was 25 per 100,000 adult females.
4 The NT and national non-Indigenous adult population estimates for 2012-13 were derived from rates used in ABS (4512.0) Corrective Services Australia – June Quarter 2013.5 Figures for 2012-13 - Estimates based on ABS Corrective Services Australia – June Quarter 2013.6
Figure 4 Estimated adult Indigenous imprisonment rates by jurisdiction, 2012-13.
Estimates of imprisonment rate per 100,000 adult Indigenous population based on ABS Corrective Services Australia (4512.0).
Northern Territory Department of Correctional Services Annual Statistics | 2012-2013
Marital StatusOn 30 June 2013, 50% of the prisoners had stated at the time of their reception into custody, that they were married.
7
Figure 5 Estimated adult female imprisonment rates, 2007-08 to 2012-13.
Estimates of imprisonment rate per 100,000 adult female population based on ABS Corrective Services Australia (4512.0).

Northern Territory Department of Correctional Services Annual Statistics | 2012-2013
YOUTH DETAINEES
PopulationAs shown in the figure below, there has been considerable fluctuation in the annual daily average number of detainees held in youth detention centres over the past 22 years.
The daily
average number of detainees held in custody during 2012-13 was 49, which was an increase of 29% from the previous year.
The estimated detention rate for the Northern Territory was 187 per 100,000 youths aged between 10 and 17 years6.
The minimum number of detainees held in custody on any day during the year was 33 and the maximum was 73.
6 Ten to seventeen year old population estimates were derived from ABS Estimated Resident Population (see ABS publication 3101.0). The estimates include persons from 10 years old, up to but not including person 18 years old.8
Figure 6 Yearly daily average youth detainees from 1991-92 to 2012-13.
Note: Prior to June 2000, 17 year olds were classified as adults.
Table 2 Summary of youth detainee numbers in 2012-13 by detention centre.
Youth Detention Centre Minimum Maximum Daily Average Design Capacity Average Occupancy Level
Don Dale Youth Detention Centre 18 49 34 38 89%Aranda House 0 10 2 10 20%Alice Springs Youth Detention Centre 7 25 14 16 88%All Centres 33 73 49 64 77%

Northern Territory Department of Correctional Services Annual Statistics | 2012-2013
Receptions and Sentence StatusThere were 429 receptions into youth detention centres in the Northern Territory in 2012-13, which involved 227 distinct youths.
Most youths are unsentenced at the time of reception into a detention centre. However, during an episode a detainee may commence several types of orders. Thus during the period, there were 502 distinct order commencements consisting of 421 remand order commencements and 81 sentenced detention order commencements. The daily average number of sentenced detainees during 2012-13 was 22.
OffenceThe most common offences7 for youths received into detention during 2012-13 were ‘Acts intended to cause injury’ (36% of all receptions) and ‘Unlawful entry with intent/burglary, break and enter’ (32% of all receptions). There was a 37% increase in the number of youths received into detention for ‘Acts intended to cause injury’ (from 112 offences in 2011-12 to 153 offences in 2012-13).
Indigenous StatusDuring 2012-13, 380 (89%) of the 429 youth receptions involved Indigenous detainees. Of the 81 sentenced youth receptions 93% (75) were Indigenous.
AgeOf the 227 distinct detainees who commenced at least one episode in a youth detention centre during 2012-13, only 26% were aged less than 15 years.
SexMost of the detainees received into a youth detention centre during 2012-13 were males. Only 59 (14%) of the 429 receptions were for female detainees, which was 16% more than the previous year’s figure of 51 (16% of 328 receptions).
7 Most serious offence as recorded in IOMS.9

Northern Territory Department of Correctional Services Annual Statistics | 2012-2013
FOREIGN NATIONAL PRISONERSForeign national prisoners are often held in Northern Territory correctional institutions and are included in the counts as non-Indigenous. The yearly daily average number of foreign national prisoners reached a peak of 145 in 2000-01.
Between 1999-00 and 2002-03, the majority of foreign national prisoners held in Northern Territory correctional institutions were classified as people smugglers. People smugglers are generally non-Australian citizens in custody for federal ‘people smuggling’ offences8. There was a rapid increase in the number of receptions of people smugglers during the 1999-00 financial year. During the period 1999-00 to 2001-02, people smugglers represented a significant proportion of the total custody population and a large proportion of the non-Indigenous custody population. The yearly daily average number of people smugglers reached a peak of 122 in 2000-01. Since then it has been decreasing. By 2003-04, the number of people smugglers became negligible.
Adult PrisonersOn 30 June 2013, there were 28 foreign nationals in custody in an adult correctional institution, representing 2% of the total adult correctional institution population. Of these, 6 were ‘people smugglers’.
Youth DetaineesOn 30 June 2013, there were no foreign national youths in custody in a correctional institution.
8 Most serious offence as recorded in IOMS.10
Table 3 Summary of estimated daily average foreign prisoners and detainees from 1995-96 to 2012-13.
Year/Quarter
Foreign Citizens
% of All Prisoners and Detainees
Offence TypeTotal Foreign
CitizensFederalNon-Federal
People Smugglers Other Federal
1995-96 1 13 16 30 6%
1996-97 3 10 19 32 6%
1997-98 2 11 26 39 6%
1998-99 2 14 25 41 6%
1999-00 71 12 28 112 18%
2000-01 122 12 12 145 21%
2001-02 121 14 6 141 20%
2002-03 40 14 5 59 8%
2003-04 6 12 8 26 3%
2004-05 2 26 8 37 5%
2005-06 1 9 9 18 2%
2006-07 1 14 9 24 3%2007-08 1 11 8 21 3%
2008-09 1 8 13 22 2%2009-10 na na na na na2010-11 18 7 24 49 4%2011-12 35 8 21 64 5%2012-13 28 5 19 52 3%
Sep. qtr 2012 36 7 19 61 4%
Dec. qtr 2012 35 4 19 58 4%
Mar. qtr 2013 28 4 20 53 3%
Jun. qtr 2013 13 5 17 35 2%
na – not available.
Northern Territory Department of Correctional Services Annual Statistics | 2012-2013
COMMUNITY CORRECTIONS PROGRAMS
Program CaseloadAs at 30 June 2013, the Community Corrections caseload consisted of 1,097 adult programs and 171 youth programs. Of these, 924 (73%) were for probation orders and 199 (16%) were community work orders.
CommencementsDuring 2012-13, there were 1,939 community-based program commencements, which was 36% (512) more than the previous year. The number of community work orders and parole orders increased by 69% (189) and 62% (68) respectively. Probation orders were the most common community-based commencement, followed by community work orders, comprising 60% (1,165) and 24% (461) respectively.
Indigenous StatusIndigenous people represented 83% (1,617) of the community-based program commencements.
AgeThe majority (1,648 or 85%) of community-based program commencements were for adults. The average and median age for distinct persons who commenced a community-based program during 2012-13 was 29 years and 28 years respectively. The youngest person to commence an order was 10 years and the oldest was 73 years.
SexFemales comprised 16% (314) of the community-based program commencements for 2012-13.
11
Figure 7 Community Corrections program caseload (adult and youth) as at 30 June 2013.
Object 4

Northern Territory Department of Correctional Services Annual Statistics | 2012-2013
OVERVIEW OF PERFORMANCEThis part of the report is committed to reporting the activities and progress of the Department against the five key focus areas, which are described in detail in the Business Plan:
Containment
Supervision
Offender Rehabilitation and Reintegration
Reparation
Advice to Sentencing Authorities
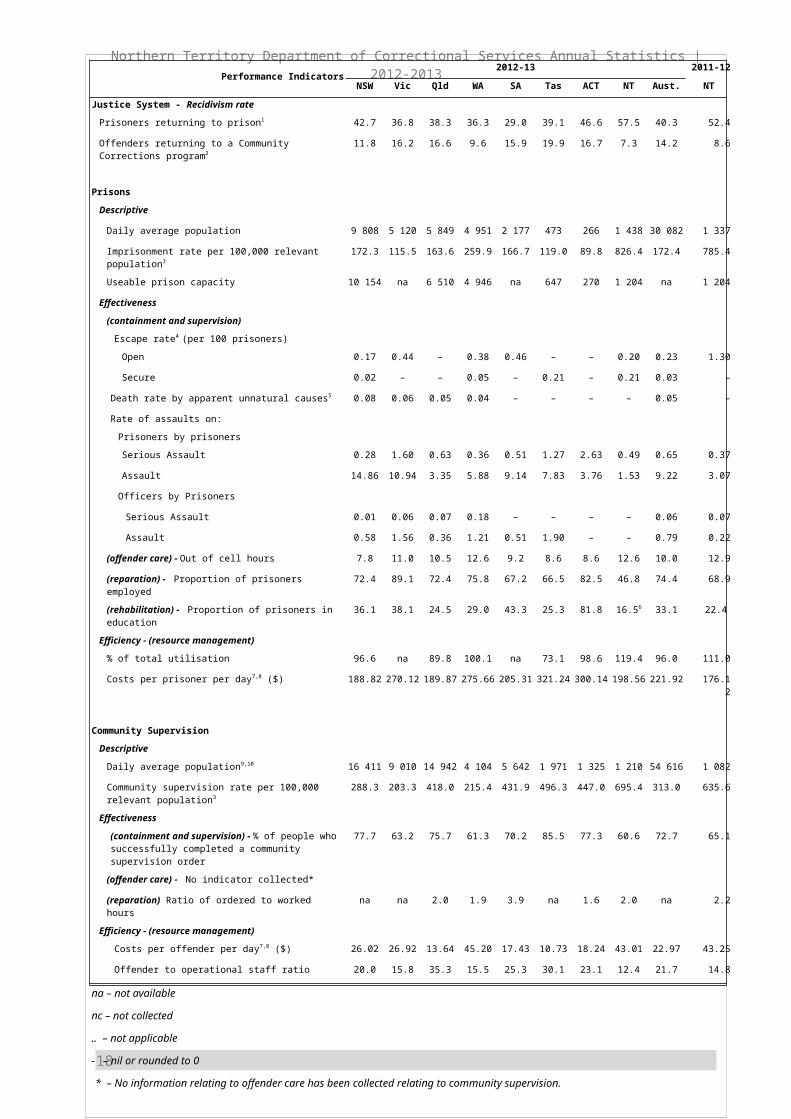
PERFORMANCEThe following table contains information produced by the Steering Committee for the Review of Commonwealth/State Service Provision (SCRCSSP) contained in the ‘Report on Government Services, 2014’, which compares service delivery performance across jurisdictions in Australia. Each jurisdiction provides standard information by which comparisons can be made. For corrective services, performance is categorised according to efficiency or effectiveness. Key focus areas mentioned above are addressed by at least one indicator and a selection of summary indicators are presented in the following table.
The information presented in the following table for other jurisdictions is for 2012-13. The Agency uses many of the findings from this exercise to establish benchmarks for its own business planning exercises.
In many instances, the Northern Territory differs from other jurisdictions. These unique characteristics include the small general population of which a high proportion is comprised of Indigenous persons, dispersion of the population and remoteness, which results in higher costs for goods and services, and the physical location of the Northern Territory in comparison to other states.
It should also be noted that some of the indicators used in the following table might differ from those used elsewhere in this Annual Report. This may be due to differences between jurisdictions in accrual or cash accounting processes and the exclusion of youth justice from the SCRCSSP exercise.
As can be seen, the Northern Territory compares reasonably with other jurisdictions in most of the performance indicators mentioned above. The measure of recidivism is seen to be a partial measure of the whole justice system, not just the correctional system. It is recognised that the rates of recidivism is partially determined by many factors outside the justice system, including education, employment and social conditions. The measures of recidivism used are limited in that they do not consider the types of re-offending, only follow a person within the same jurisdiction in which they completed the original corrections program and do not include any offences which result in an outcome not administered by correctional services (e.g. fines, bonds and suspended sentences).
12

Northern Territory Department of Correctional Services Annual Statistics | 2012-2013
Table 4 National Performance Indicators.
13

Northern Territory Department of Correctional Services Annual Statistics | 2012-2013
Notes for Table 4:1. All prisoners released following a period of sentenced imprisonment who return to prison in the same
jurisdiction within 2 years of their release.
14
Performance Indicators2012-13 2011-12
NSW Vic Qld WA SA Tas ACT NT Aust. NT
Justice System - Recidivism ratePrisoners returning to prison1 42.7 36.8 38.3 36.3 29.0 39.1 46.6 57.5 40.3 52.4
Offenders returning to a Community Corrections program2 11.8 16.2 16.6 9.6 15.9 19.9 16.7 7.3 14.2 8.6
PrisonsDescriptive
Daily average population 9 808 5 120 5 849 4 951 2 177 473 266 1 438 30 082 1 337
Imprisonment rate per 100,000 relevant population3 172.3 115.5 163.6 259.9 166.7 119.0 89.8 826.4 172.4 785.4
Useable prison capacity 10 154 na 6 510 4 946 na 647 270 1 204 na 1 204
Effectiveness(containment and supervision)
Escape rate4 (per 100 prisoners)
Open 0.17 0.44 – 0.38 0.46 – – 0.20 0.23 1.30
Secure 0.02 – – 0.05 – 0.21 – 0.21 0.03 –
Death rate by apparent unnatural causes5 0.08 0.06 0.05 0.04 – – – – 0.05 –
Rate of assaults on:
Prisoners by prisoners
Serious Assault 0.28 1.60 0.63 0.36 0.51 1.27 2.63 0.49 0.65 0.37
Assault 14.86 10.94 3.35 5.88 9.14 7.83 3.76 1.53 9.22 3.07
Officers by Prisoners
Serious Assault 0.01 0.06 0.07 0.18 – – – – 0.06 0.07
Assault 0.58 1.56 0.36 1.21 0.51 1.90 – – 0.79 0.22
(offender care) - Out of cell hours 7.8 11.0 10.5 12.6 9.2 8.6 8.6 12.6 10.0 12.9
(reparation) - Proportion of prisoners employed 72.4 89.1 72.4 75.8 67.2 66.5 82.5 46.8 74.4 68.9
(rehabilitation) - Proportion of prisoners in education 36.1 38.1 24.5 29.0 43.3 25.3 81.8 16.56 33.1 22.4
Efficiency - (resource management)% of total utilisation 96.6 na 89.8 100.1 na 73.1 98.6 119.4 96.0 111.0
Costs per prisoner per day7,8 ($) 188.82 270.12 189.87 275.66 205.31 321.24 300.14 198.56 221.92 176.12
Community SupervisionDescriptive
Daily average population9,10 16 411 9 010 14 942 4 104 5 642 1 971 1 325 1 210 54 616 1 082
Community supervision rate per 100,000 relevant population3
288.3 203.3 418.0 215.4 431.9 496.3 447.0 695.4 313.0 635.6
Effectiveness(containment and supervision) - % of people who successfully completed a community supervision order
77.7 63.2 75.7 61.3 70.2 85.5 77.3 60.6 72.7 65.1
(offender care) - No indicator collected*
(reparation) Ratio of ordered to worked hours na na 2.0 1.9 3.9 na 1.6 2.0 na 2.2
Efficiency - (resource management)Costs per offender per day7,8 ($) 26.02 26.92 13.64 45.20 17.43 10.73 18.24 43.01 22.97 43.25
Offender to operational staff ratio 20.0 15.8 35.3 15.5 25.3 30.1 23.1 12.4 21.7 14.8
na – not available
nc – not collected
.. – not applicable
- – nil or rounded to 0
* – No information relating to offender care has been collected relating to community supervision.

Northern Territory Department of Correctional Services Annual Statistics | 2012-2013
2. Offenders returning to a community corrections program in the same jurisdiction within 2 years of them successfully completing a program.
3. Relevant population refers to all person aged 18 years and over.
4. Per 100 prisoners and refers to prisoners, not incidents. Rate is determined by the number of prisoners divided by prisoner daily average (open or secure).
5. Per 100 prisoners and is determined by the number of deaths divided by the prisoner daily average.
6. Prior to 2009-10 figures were counted as at 30 June for persons serving 3 months or more. In 2009-10, the NT changed its counting methodology to count all prisoners enrolled on the first school day of the month, averaged over 12 months.
7. Includes direct employee expenses (excluding payroll tax and long service leave) and operational costs, apportioned indirect costs for corporate support services provided by umbrella and expenditure incurred by other departments on our behalf.
8. Capital costs not included.
9. Community supervision counts distinct persons not orders and for the Northern Territory, home detention clients are included in this group.
10.Northern Territory figures do not include clients whose order has been in suspense (breach) for three years or more.
15

Northern Territory Department of Correctional Services Annual Statistics | 2012-2013
SUPPORTING TABLESTable 5 Census of prisoners by correctional institution, sentence status, Indigenous status and
sex.
Correctional institution/Sentence Status
Indigenous Non-Indigenous All Total 2013 Total 2012
Male Female Male Female Male Female Number % of Total Number % of
TotalAlice Springs Correctional Centre
Sentenced 360 49 33 3 393 52 445 441Unsentenced 129 10 5 1 134 11 145 140Total 489 59 38 4 527 63 590 41.1% 581 41.4%
Darwin Correctional CentreSentenced 418 25 112 2 530 27 557 576Unsentenced 167 13 35 3 202 16 218 203Total 585 38 147 5 732 43 775 54.0% 779 55.4%
Barkly Work CampSentenced 68 0 1 0 69 0 69 45Unsentenced 0 0 0 0 0 0 0 0Total 68 0 1 0 69 0 69 4.8% 45 3.2%
Total 30 June 2013Sentenced 846 74 146 5 992 79 1071Unsentenced 296 23 40 4 336 27 363Total 1142 97 186 9 1328 106 1434 100%
Total 30 June 2012Sentenced 841 42 171 8 1012 50 1062Unsentenced 267 27 46 3 313 30 343Total 1108 69 217 11 1325 80 1405 100%
Sentenced – Includes prisoners detained in custody at the Administrator's pleasure and persons in custody for fine default.
CENSUS OF ADULT PRISONERS AS AT 30 JUNE 2013 There were 2% more prisoners in custody in Northern Territory correctional institutions on
30 June 2013 than for the same day last year.
Males represented 93% of the prisoners on 30 June 2013.
On 30 June 2013, 75% of prisoners were sentenced.
Indigenous prisoners represented 86% of the total prison population on the night of 30 June 2013.
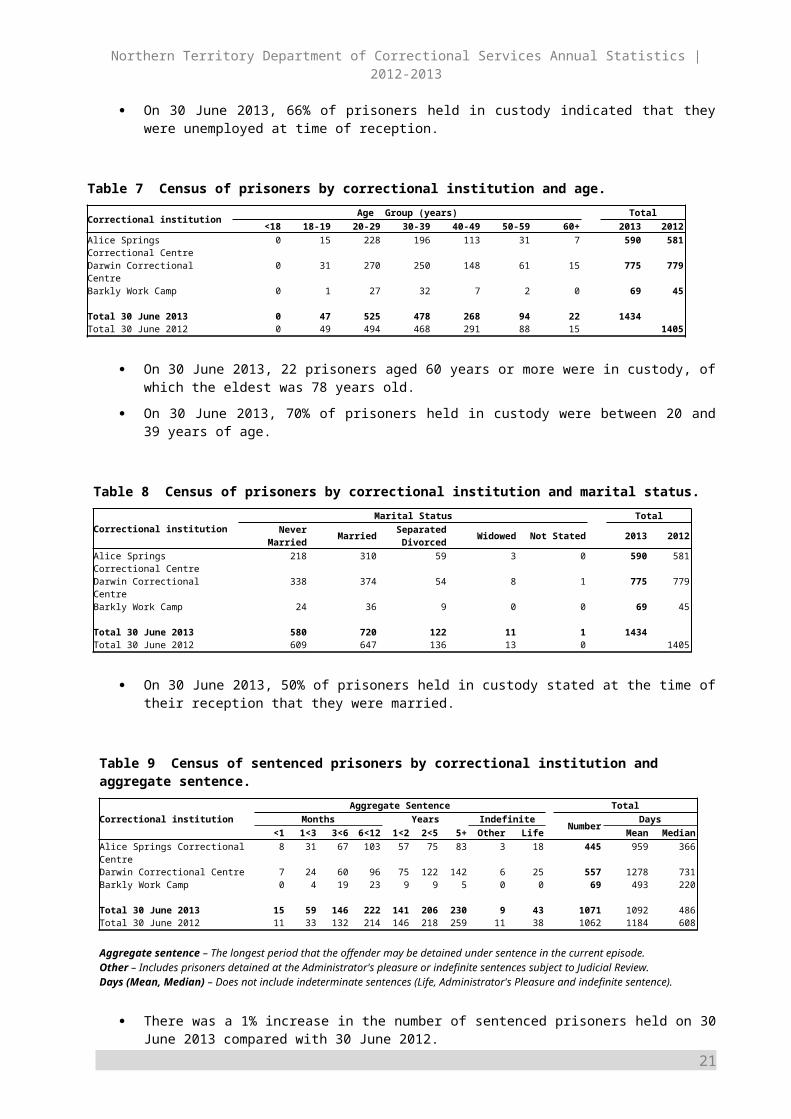
On 30 June 2013, 66% of prisoners held in custody indicated that they were unemployed at time of reception.
16
Table 6 Census of prisoners by correctional institution and employment status at time of reception.
Correctional institution Employment Status TotalEmployed Unemployed Other Not Stated 2013 2012
Alice Springs Correctional Centre 140 421 29 0 590 581Darwin Correctional Centre 209 471 89 6 775 779Barkly Work Camp 17 50 2 0 69 45
Total 30 June 2013 366 942 120 6 1434Total 30 June 2012 371 915 119 0 1405
Other – Includes students, pensioners and home duties.

Northern Territory Department of Correctional Services Annual Statistics | 2012-2013
On 30 June 2013, 22 prisoners aged 60 years or more were in custody, of which the eldest was 78 years old.
On 30 June 2013, 70% of prisoners held in custody were between 20 and 39 years of age.
On 30 June 2013, 50% of prisoners held in custody stated at the time of their reception that they were married.
There was a 1% increase in the number of sentenced prisoners held on 30 June 2013 compared with 30 June 2012.
On 30 June 2013, 26% of the sentenced prisoners held in custody had an aggregate sentence of five years or longer (including life sentences).
There was a 79% increase in the number of prisoners with aggregate sentences of between 1 month and less than 3 months on 30 June 2013, compared with 30 June 2012.
The median aggregate sentence of sentenced prisoners held in Alice Springs Correctional Centre decreased by 27% from the same time last year.
17
Table 7 Census of prisoners by correctional institution and age.
Correctional institution Age Group (years) Total<18 18-19 20-29 30-39 40-49 50-59 60+ 2013 2012
Alice Springs Correctional Centre 0 15 228 196 113 31 7 590 581Darwin Correctional Centre 0 31 270 250 148 61 15 775 779Barkly Work Camp 0 1 27 32 7 2 0 69 45
Total 30 June 2013 0 47 525 478 268 94 22 1434Total 30 June 2012 0 49 494 468 291 88 15 1405
Table 8 Census of prisoners by correctional institution and marital status.
Correctional institutionMarital Status Total
Never Married Married Separated Divorced Widowed Not Stated 2013 2012
Alice Springs Correctional Centre 218 310 59 3 0 590 581Darwin Correctional Centre 338 374 54 8 1 775 779Barkly Work Camp 24 36 9 0 0 69 45
Total 30 June 2013 580 720 122 11 1 1434Total 30 June 2012 609 647 136 13 0 1405
Table 9 Census of sentenced prisoners by correctional institution and aggregate sentence.
Correctional institutionAggregate Sentence Total
Months Years Indefinite Number Days<1 1<3 3<6 6<12 1<2 2<5 5+ Other Life Mean Median
Alice Springs Correctional Centre 8 31 67 103 57 75 83 3 18 445 959 366Darwin Correctional Centre 7 24 60 96 75 122 142 6 25 557 1278 731Barkly Work Camp 0 4 19 23 9 9 5 0 0 69 493 220
Total 30 June 2013 15 59 146 222 141 206 230 9 43 1071 1092 486Total 30 June 2012 11 33 132 214 146 218 259 11 38 1062 1184 608
Aggregate sentence – The longest period that the offender may be detained under sentence in the current episode.Other – Includes prisoners detained at the Administrator's pleasure or indefinite sentences subject to Judicial Review.Days (Mean, Median) – Does not include indeterminate sentences (Life, Administrator's Pleasure and indefinite sentence).

Northern Territory Department of Correctional Services Annual Statistics | 2012-2013
Table 10 Census of prisoners by correctional institution, last known address and Indigenous status.
Alice Springs was the most common last known address for prisoners held in custody on 30 June 2013 representing 20% (286) of prisoners in custody. This was followed by Katherine at 8% (118), Casuarina and Darwin both at 7% (104), and Tennant Creek at 6% (93).
18
Last Known Address
Darwin Correctional Centre
Alice Springs Correctional Centre Barkly Work Camp Total
Indigenous Non-Indig IndigenousNon-Indig Indigenous Non-Indig 2013 2012
Adelaide River 0 1 0 0 0 0 1 1
Ali Curung 1 0 8 0 6 0 15 16
Alice Springs 11 2 229 19 24 1 286 291
Alyangula 40 0 0 0 0 0 40 25
Avon Downs 0 0 1 0 0 0 1 1
Batchelor 4 2 0 0 0 0 6 4
Borroloola 28 1 1 0 0 0 30 21
Casuarina 61 42 1 0 0 0 104 93
Daly River 5 0 0 0 0 0 5 3
Darwin 63 31 5 5 0 0 104 123
Elliot 1 0 3 0 3 0 7 6
Harts Range 1 0 7 0 0 0 8 15
Hermannsburg 1 0 37 0 3 0 41 31
Humpty Doo 10 16 0 0 0 0 26 25
Jabiru 5 0 0 0 0 0 5 5
Kalkaringi 7 0 0 0 1 0 8 16
Katherine 102 11 3 2 0 0 118 87
Kintore 1 0 19 0 2 0 22 25
Kulgera 0 0 13 0 0 0 13 12
Lajamanu 15 0 3 0 0 0 18 21
Maningrida 21 0 1 0 0 0 22 22
Maranboy 20 0 0 0 1 0 21 37
Mataranka 9 0 0 0 0 0 9 8
Ngukurr 19 0 0 0 0 0 19 27
Nhulunbuy 31 0 1 1 0 0 33 24
Oenpelli 21 0 0 0 0 0 21 17
Palmerston 47 23 4 3 0 0 77 84
Papunya 1 0 39 0 5 0 45 43
Pine Creek 0 0 0 0 0 0 0 5
Pirlangimpi 1 0 0 0 0 0 1 3
Tennant Creek 7 1 68 3 14 0 93 62
Ti Tree 1 0 27 0 3 0 31 30
Timber Creek 14 0 0 0 0 0 14 22
Tiwi Islands 0 0 0 0 0 0 0 2
Wadeye 47 0 2 0 0 0 49 31
Wurrumiyanga 13 0 0 0 0 0 13 10
Yuendumu 3 0 43 0 3 0 49 48
Yulara 3 0 17 0 2 0 22 11NT Unknown 1 0 0 0 0 0 1 0
Interstate 6 13 16 8 1 0 44 54Overseas 0 8 0 1 0 0 9 40
No fixed abode 2 1 0 0 0 0 3 4
Total 2013 623 151 548 42 68 1 1434Total 2012 595 184 537 44 45 0 1405

Northern Territory Department of Correctional Services Annual Statistics | 2012-2013
The most common offence for people held in custody on 30 June 2013 were 'Acts intended to cause injury' which represented 50% of the total prisoner population. This was followed by ‘Sexual assault and related offences’ representing 12%.
The number of prisoners held for ‘Offences against justice procedures, gov't security and operations’, ‘other’ category, decreased by 83%. These were mainly attributed to people smuggling offences.
19
Table 11 Census of prisoners by offence and sentence status.
Most Serious Offence SentencedUnsentence
d Total201
3201
2201
3201
2201
3201
2
Homicide and related offences
Murder 44 39 16 16 60 55
Manslaughter and driving causing death 52 58 2 1 54 59
Other 0 3 3 3 3 6
Acts intended to cause injury 489 450 233 219 722 669
Sexual assault and related offences 132 126 38 37 170 163
Dangerous or negligent acts endangering persons
Driving under the influence of alcohol or drugs 0 0 0 0 0 0
Dangerous or negligent driving 7 12 2 3 9 15
Other 23 18 4 3 27 21
Abduction and related offences 8 6 4 2 12 8
Robbery extortion and related offences 31 27 5 3 36 30
Unlawful entry with intent 41 55 17 13 58 68
Theft and related offences
Motor vehicle theft and related offences 5 4 1 0 6 4
Other 4 5 2 2 6 7
Deception and related offences 8 4 1 1 9 5
Illicit drug offences 31 35 19 15 50 50Weapons and explosive offences 3 2 5 10 8 12
Property damage and environmental pollution 18 20 5 4 23 24
Public order offences 8 3 0 0 8 3
Road traffic and motor vehicle regulatory offences
Driving licence offences 36 34 1 1 37 35
Exceeding the prescribed content of alcohol 35 45 3 4 38 49
Other 1 3 0 1 1 4Offences against justice procedures, gov't security and operations
Breach of justice order 89 77 2 5 91 82
Other 6 36 0 0 6 36
Miscellaneous offences 0 0 0 0 0 0
Other 0 0 0 0 0 0
Total 30 June 2013107
1 363143
4
Total 30 June 2012106
2 343140
5
Most serious offence – As recorded in IOMS.Sentenced – Includes prisoners detained in custody at the Administrator's pleasure and for fine default.
Northern Territory Department of Correctional Services Annual Statistics | 2012-2013
Of those who were unsentenced, 88% were Indigenous.
Indigenous prisoners comprised 99% of those with fixed term sentences and 82% of those with max-min sentences.
'Max-Min' sentences represented the most common type of sentence. There was a 5% decrease in the number of max-min sentences on 30 June 2013 compared with the previous year.
20
Table 12 Census of prisoners by correctional institution, Indigenous status and type of sentence.
Correctional institution UnsentencedSentenced Total
Fine Default
Fixed Term
Max-Min
Indefinite 2013 2012Parole Other LifeAlice Springs Correctional Centre
Indigenous 139 0 186 208 12 3 0 548 537Non-Indigenous 6 0 3 27 5 0 1 42 44Total 145 0 189 235 17 3 1 590 581
Darwin Correctional CentreIndigenous 180 0 156 271 12 4 0 623 595Non-Indigenous 38 0 13 86 12 2 1 152 184Total 218 0 156 357 24 6 1 762 779
Barkly Work CampIndigenous 0 0 37 31 0 0 0 68 45Non-Indigenous 0 0 1 0 0 0 0 1 0Total 0 0 38 31 0 0 0 69 45
Total 30 June 2013Indigenous 319 0 379 510 24 7 0 1239Non-Indigenous 44 0 17 113 17 2 2 195Total 363 0 383 623 41 9 2 1434
Total 30 June 2012Indigenous 294 0 341 510 22 10 0 1177Non-Indigenous 49 0 16 146 14 1 2 228Total 343 0 357 656 36 11 2 1405
Fine default – Those prisoners who are serving a sentence for non-payment of a fine and are subject to no other sentence at the time. Offenders who are serving fine default sentences while on remand are counted as sentenced (fine default) prisoners.
Max-Min – Maximum term specified and minimum term or non-parole period set.Fixed term – No post-release follow-up period set.Indefinite - Other – Includes prisoners detained at the Administrator's pleasure or subject to Judicial Review.Indefinite -Parole – Prisoners who have received a life sentence with a non-parole period set.
Northern Territory Department of Correctional Services Annual Statistics | 2012-2013
ADULT PRISONER AND YOUTH DETAINEE TURNOVER DURING 2012-13
21
Table 13 Adult and youth turnover summary.
Indigenous Non-Indigenous TotalMale Female Male Female 2012-13
Held at 30 June 2012 Adult 1108 69 217 11 1405Youth 30 2 1 0 33
Received during 2012-13 Adult 3138 408 340 36 3922Youth 324 56 46 3 429
Youth to adult Youth 12 2 0 0 14
Releases during 2012-13 Adult 3116 382 371 38 3907Youth 303 52 45 3 403
Held at 30 June 2013 Adult 1142 97 186 9 1434Youth 39 4 2 0 45
Youth to adult – Youths attaining adult status while detained.
Table 14 Adult and youth escapes (incidents and persons).
Financial YearAlice Springs Correctional
Centre
Darwin Correctional
Centre
Barkly Work Camp Youth Detention
Centres Total
Incidents 2012-13 1 2 2 1 62011-12 2 1 2 3 82010-11 5 2 0 1 82009-10 3 1 - 1 52008-09 2 1 - 0 32007-08 1 0 - 0 12006-07 3 1 - 2 62005-06 2 2 - 2 62004-05 2 0 - 1 32003-04 1 1 - 0 22002-03 2 0 - 0 22001-02 2 1 - 1 42000-01 2 0 - 0 21999-00 0 0 - 2 21998-99 0 0 - 0 01997-98 0 1 - 1 2
Persons 2012-13 1 2 6 2 112011-12 2 2 2 9 152010-11 7 2 0 1 102009-10 3 1 - 1 52008-09 2 2 - 0 42007-08 1 0 - 0 12006-07 4 1 - 4 92005-06 2 5 - 3 102004-05 2 0 - 1 32003-04 1 1 - 0 22002-03 2 0 - 0 22001-02 2 1 - 2 52000-01 2 0 - 0 21999-001998-991997-98
000
001
---
202
203
Escapes include under escort and from hospital.
Northern Territory Department of Correctional Services Annual Statistics | 2012-2013
Table 15 Adult and youth receptions by sentence status, Indigenous status and sex.
There was a 17% decrease in the number of non-Indigenous sentenced male receptions in adult correctional centres in 2012-13 compared with the previous year.
There was a 31% increase in the number of sentenced Indigenous female receptions and a 30% increase in the number of unsentenced Indigenous female receptions into adult correctional centres during 2012-13 compared with the previous year.
There was a 71% increase in the number of unsentenced non-Indigenous female receptions into adult correctional centres during 2012-13 compared with the previous year.
22
Correctional Institution
Sentenced Unsentenced Total
IndigenousNon-
Indigenous IndigenousNon-
IndigenousFemal
e Male Female Male Female Male Female Male2012-13 2011-12
Adult
Alice Springs Correctional Centre149 1113 6 25 62 306 2 27 1690 1545
Darwin Correctional Centre98 1056 6 132 99 663 22 156 2232 1910
Total 2012-13247 2169 12 157 161 969 24 183 3922
Total 2011-12188 1881 8 189 124 864 14 187 3455
Youth
Aranda House0 0 0 0 0 5 0 0 5 2
Alice Springs Youth Detention Centre2 36 0 1 2 93 0 5 139 120
6 31 0 5 46 159 3 35 285 206

Northern Territory Department of Correctional Services Annual Statistics | 2012-2013
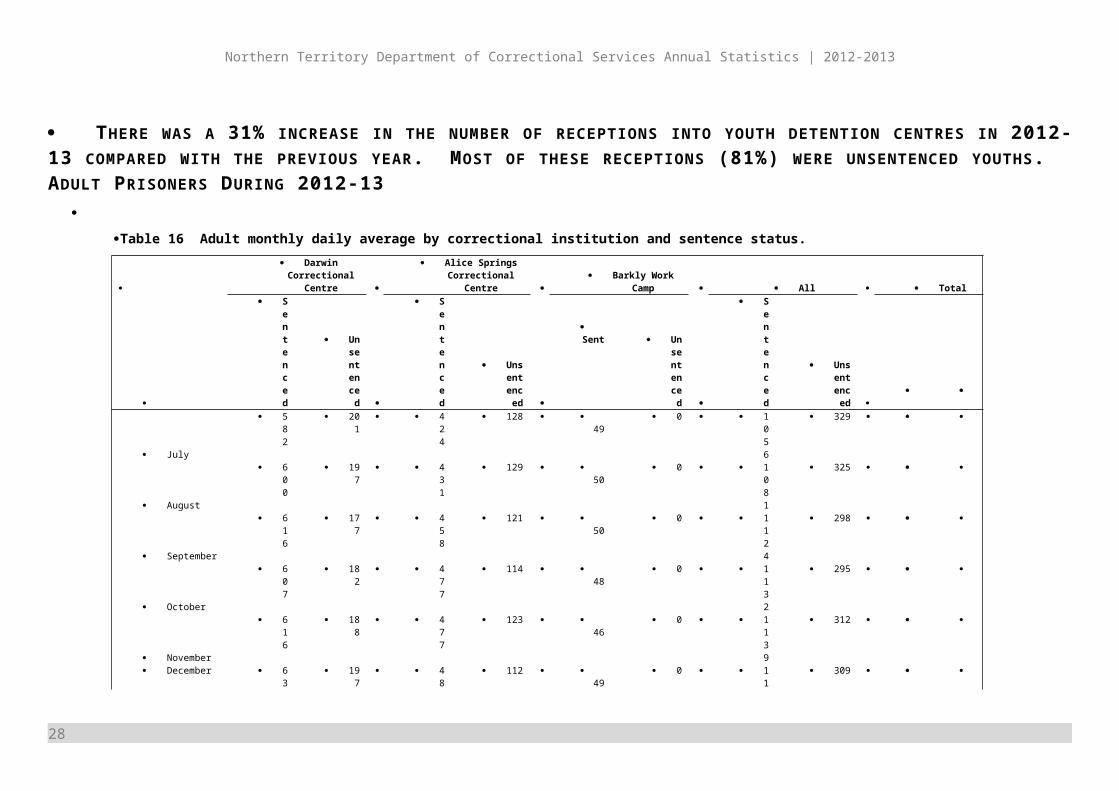
THERE WAS A 31% INCREASE IN THE NUMBER OF RECEPTIONS INTO YOUTH DETENTION CENTRES IN 2012-13 COMPARED WITH THE PREVIOUS YEAR. MOST OF THESE RECEPTIONS (81%) WERE UNSENTENCED YOUTHS. ADULT PRISONERS DURING 2012-13
Table 16 Adult monthly daily average by correctional institution and sentence status.
Darwin Correctional
Centre
Alice Springs Correctional
Centre Barkly Work
Camp All Total
Sentenced
Unse
ntenced
Sentenced
Unsentenc
ed
Sent
Unse
ntenced
Sentenced
Unsentence
d
July
582
201
424
128 49
0 1056
329
August
600
197
431
129 50
0 1081
325
September
616
177
458
121 50
0 1124
298
October
607
182
477
114 48
0 1132
295
November
616
188
477
123 46
0 1139
312
December
635
197
486
112 49
0 1169
309
January
621
232
480
137 56
0 1157
369
February 6 23 4 148 0 1 382
23

Northern Territory Department of Correctional Services Annual Statistics | 2012-2013
03
4 93
63 159
March
612
229
511
137 73
0 1195
366
April
608
217
503
138 72
0 1183
355
May
619
207
479
126 68
0 1166
333
June
582
207
463
131 68
0 1114
338
Indigenous 2012-13
461
170
439
119 58
0 958
289
Total 2012-13
608
206
474
129 58
0 1140
334
Total 2011-12
557
173
437
132 38
0 1032
304
Note:
The figures represent the averages rounded to the nearest integer.
There was a 10% increase in the yearly daily average compared to the previous year.
Indigenous prisoners represented 85% of the daily average compared to 83% the previous year.
24
Northern Territory Department of Correctional Services Annual Statistics | 2012-2013
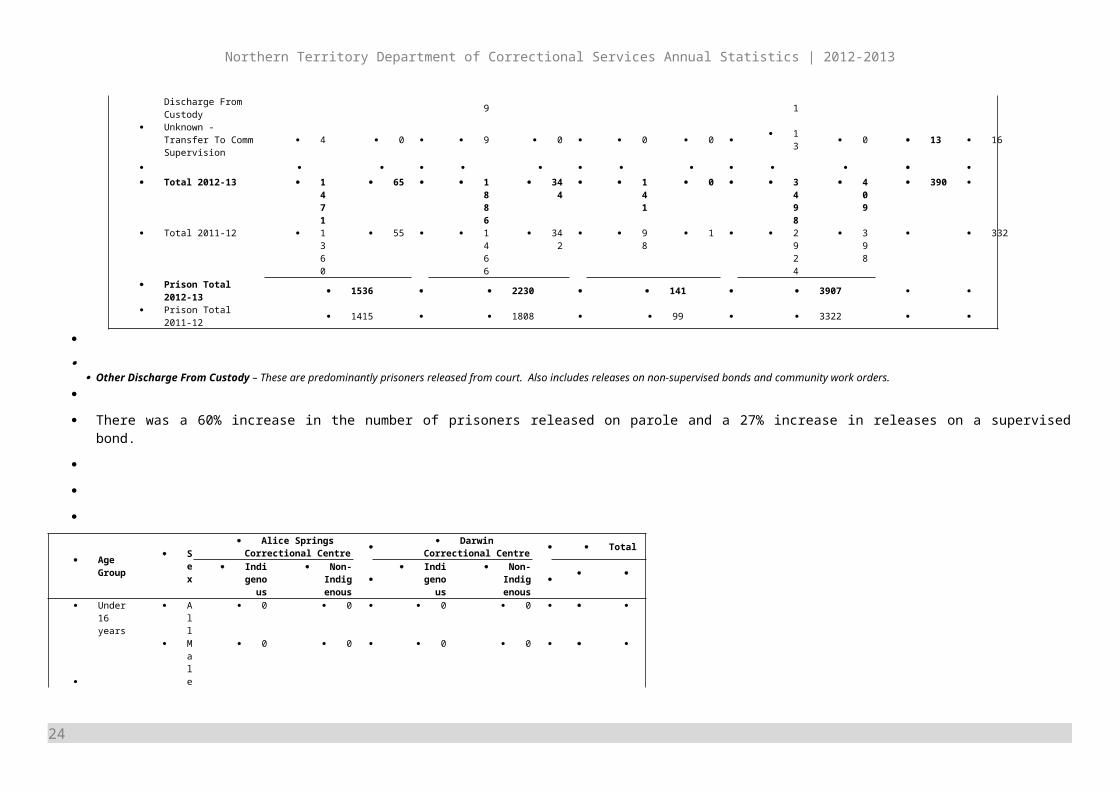
Table 17 Adult exits by correctional institution, release reason and Indigenous status.
Release Reason
Alice Springs Correctional
Centre
Darwin Correctional
Centre Barkly Work
Camp All Prisons Total
Indigenous
Non-
Indigenous
Indigenous
Non-
Indigenous
Indigenous
Non-I
ndi
genous
Indigenous
No
n-Indigeno
us
201 201
Death 0 0 1 0 0 0 1 0 1 2
Deportation 0 0 0 11 0 0 0 11 11 5
Expiry Of Sent (Full Term)
645
15 6
61
41 1
16
0
1422
56 147 132
Extradition 5 4 3 3 0 0 8 7 15 13
Home Detention 1 0 4 1 0 0 5 1 6 1
Interstate transfer 1 0 1 1 0 0 2 1 3 4
Other Discharge From Custody
334
28 6
44
171 1 0
979
199
117 104
Parole 51 5 6
3 45 7 0 1
21
50 171 107
Supervised bond 4
27
12 4
80
63 17 0
924
75 999 784
Under Appeal 1 0 1 3 0 0 2 3 5 2 Unknown - Discharge
From Custody 2 1 19 5 0 0 2
1 6 27 14
Unknown - Transfer To Comm Supervision 4 0 9 0 0 0 1
3 0 13 16
Total 2012-13 1
47
65 188
344
141
0 349
409
390
23

Northern Territory Department of Correctional Services Annual Statistics | 2012-2013
1 6 8 Total 2011-12 1
360
55 1466
342
98
1 2924
398
332
Prison Total 2012-13 1536 2230 141 3907
Prison Total 2011-12 1415 1808 99 3322
Other Discharge From Custody – These are predominantly prisoners released from court. Also includes releases on non-supervised bonds and community work orders.
There was a 60% increase in the number of prisoners released on parole and a 27% increase in releases on a supervised bond.
Age Group
Sex
Alice SpringsCorrectional Centre Darwin
Correctional Centre Total
Indigenou
s
Non-Indigen
ous
Indigenou
s
Non-Indigen
ous
Under 16 years
All
0 0 0 0
Male
0 0 0 0
16 to 17
years A
ll 0 0 0 0
Male
0 0 0 0
18 to 19
years A
ll 61 4 109 9
Male
54 4 99 8
20 to 24
years A
ll 232 7 279 44
Male
202 7 262 39
24

Northern Territory Department of Correctional Services Annual Statistics | 2012-2013
25 to 29
years A
ll 258 5 287 55
Male
210 4 265 54
30 to 34
years A
ll 228 5 244 39
Male
200 4 221 35
35 to 39
years A
ll 186 8 221 40
Male
161 5 194 37
40 to 44
years A
ll 136 10 153 36
Male
120 9 128 30
45 to 49
years A
ll 95 4 103 23
Male
78 4 91 21
50 to 59
years A
ll 58 6 67 18
Male
55 5 57 16
60 years
and older
All
6 4 6 9
Male
6 4 6 9
Unknow
n A
ll 0 0 0 0
Ma
0 0 0 0
25

Northern Territory Department of Correctional Services Annual Statistics | 2012-2013
le
Average age
All
33 38 32 35
Total 2012-13
All
1260 53 1469 273
Male
1086 46 1323 249
Female
174 7 146 24
Total 2011-12
All 1148 56 1183 288
Male
986 53 1087 273
Female
162 3 96 15
Note: The age group and correctional institution is for the first reception for a distinct person. The average age of distinct Indigenous adults received into custody in 2012-13 was 32 years and for distinct non-Indigenous adults was 35 years.
During 2012-13, there were 25 distinct persons aged 60 years or older received into custody which represented less than 1% of distinct persons received. The eldest person was 71 years of age.
26

Northern Territory Department of Correctional Services Annual Statistics | 2012-2013
I n t e r s t a t e p r i s o n e r s c o m p r i s e d 1 2 % ( 3 7 0 ) o f d i s t i n c t p r i s o n e r s r e c e i v e d i n t o a n a d u l t c o r r e c t i o n a l c e n t r e d u r i n g t h e y e a r a n d 5 3 % o f t o t a l d i s t i n c t n o n - I n d i g e n o u s
27
Table 18 Distinct adults received by correctional institution, place of origin and Indigenous status.
Indigenous Non-Indigenous Indigenous Non-Indigenous 2012-13 2011-12Australia
Ali Curung 47 0 7 0 54 52Alice Springs 665 5 59 4 733 657Alyangula 1 0 47 0 48 46Avon Downs 6 1 0 0 7 2Batchelor 0 0 0 0 0 1Borroloola 4 0 13 0 17 11Daly River 0 0 2 0 2 6Darwin 9 0 478 42 529 443Elliot 5 0 6 0 11 9Harts Range 38 0 0 0 38 33Hermannsburg 37 0 2 0 39 47Humpty Doo 0 0 1 0 1 2J abiru 0 0 8 0 8 4Kalkaringi 3 0 22 0 25 27Katherine 11 0 232 6 249 213Kintore 3 0 0 0 3 3Kulgera 12 0 0 0 12 9Lajamanu 4 0 16 0 20 31Maningrida 0 0 41 0 41 38Maranboy 0 0 25 0 25 14Mataranka 1 0 8 0 9 4Ngukurr 0 0 24 0 24 19Nhulunbuy 0 0 105 1 106 81Oenpelli 0 0 24 0 24 14P apunya 73 0 1 0 74 69P ine Creek 0 0 1 0 1 2P irlangimpi 0 0 3 0 3 2Tennant Creek 68 1 20 1 90 74Ti Tree 44 0 1 0 45 52Timber Creek 1 0 17 0 18 16Wadeye 0 0 47 0 47 21Wurrumiyanga 0 0 14 0 14 14Yuendumu 83 0 6 0 89 79Yulara 9 0 0 0 9 5NT Other 39 3 101 2 145 8Interstate 89 36 109 136 370 312Unknown 8 1 28 15 52 196Total 1260 47 1468 207 2982 2616
OverseasIndonesia 0 0 0 1 1 2New Zealand 0 3 0 17 20 8United Kingdom 0 2 0 10 12 7Other 0 1 0 39 40 42Total 0 6 0 67 73 59
Total 2012-13 1260 53 1468 274 3055Total 2011-12 1148 56 1183 288 2675
Alice Springs Correctional Centre
Darwin Correctional Centre TotalP lace of Origin
Place of origin – Self reported location of origin, as recorded in IOMS and aggregated into Police Districts. Note: The correctional institution is for the first reception for a distinct person.

Northern Territory Department of Correctional Services Annual Statistics | 2012-2013
prisoners.
The Alice Springs district represented 24% of distinct prisoner receptions.
The number of prisoners whose place of origin was Wadeye increased by 124% or 26 distinct prisoners from the previous year.
Additional ‘place of origin’ variables in 2012-13, assisted to decrease the number of ‘Unknown’ values compared to the previous year. As a consequence, ‘NT Other’ increased significantly from the previous year.
28

Northern Territory Department of Correctional Services Annual Statistics | 2012-2013
Table 19 Adult sentenced episode commencements by aggregate sentence, offence and Indigenous status.
29
Northern Territory Department of Correctional Services Annual Statistics | 2012-2013
2012-13 2011-120-<1 1-<3 3-<6 6-<12 1-<2 2-<5 5-<10 10 + Life* mean median Total Total
Homicide and related offencesMurder all - - - - - - - - 7 life life 7 2
indigenous - - - - - - - - 2 life life 2 1
Manslaughter and driving causing death all - - - - - - 2 3 - 3523 3651 5 17indigenous - - - - - - 2 3 - 3523 3651 5 17
Acts intended to cause injury all 48 241 415 315 97 68 5 1 243 162 1190 1057indigenous 45 235 404 306 91 61 3 1 235 159 1146 938
Sexual assault and related offences all - - - 3 6 10 8 4 2 1878 1489 33 43indigenous - - - 3 2 6 7 4 2 2134 1917 24 35
Dangerous or negligent acts endangering persons
Driving under the influence of alcohol all 1 2 4 - - - - - - 100 106 7 7or drugs indigenous 1 1 4 - - - - - - 107 111 6 5
Dangerous or negligent driving all 2 5 7 5 2 1 - - - 222 135 22 27indigenous 2 5 6 5 2 1 - - - 226 146 21 25
Other Dangerous Acts all 2 7 11 9 10 - - - 469 364 39 22indigenous 2 7 10 7 10 - - - 469 364 36 16
Abduction, harassment and all 1 - 1 2 - 1 - - - 314 273 5 7 other offences against the person indigenous 1 - 1 2 - 1 - - - 314 273 5 5
Robbery, extortion and related offences all - - - - 7 8 4 - - 1264 1002 19 24indigenous - - - - 6 4 3 - - 1153 820 13 19
Unlawful entry with intent, burglary, all 5 28 46 36 15 5 1 - - 244 160 136 146 break and enter indigenous 5 27 41 35 9 3 1 - - 222 151 121 131
Theft and related offencesIllegal use of motor vehicle all 1 5 5 5 3 1 - - - 220 181 20 16
indigenous 1 4 5 5 2 1 - - - 215 181 18 16
Theft other all 19 10 5 2 2 3 - - - 159 42 41 30indigenous 17 10 5 2 2 2 - - - 142 42 38 27
Fraud, deception and related offences all 1 1 2 3 2 1 - - - 332 219 10 3indigenous 1 - 1 2 1 - - - - 280 245 5 3
Illicit drug offences all 6 9 10 6 13 14 1 - - 490 355 59 66indigenous 6 6 8 4 3 - - - - 157 119 27 45
Prohibited and regulated weapons and all 4 12 7 4 - - - - - 105 91 27 21 explosive offences indigenous 4 12 7 4 - - - - - 105 91 27 20
Property damage and environmental all 13 19 9 8 4 3 - - - 164 88 56 37 pollution indigenous 13 17 8 7 3 3 - - - 161 74 51 33
Public order offences all 2 11 5 3 - - - - - 98 81 21 18indigenous 2 10 5 3 - - - - - 101 86 20 16
Traffic and vehicle regulatory offencesDriving licence offences all 9 52 32 13 1 - - - - 106 90 107 181
indigenous 8 51 31 13 1 - - - - 108 90 104 163
Exceeding the prescribed content of alcohol all 10 70 84 27 4 - - - - 123 120 195 175indigenous 10 65 79 26 4 - - - - 124 120 184 164
Traffic other all - 2 1 - - - - - - 90 91 3 1indigenous - 2 1 - - - - - - 90 91 3 1
Offences against justice procedures, gov't security and gov't operations
Breach of justice order all 212 149 78 55 21 16 1 - - 120 45 532 346indigenous 204 139 75 50 15 13 - - - 110 41 496 315
Immigration offences all - - - - - - - - - na na 0 5indigenous - - - - - - - - - na na 0 0
Justice other all 4 8 5 - - - - - - 74 65 17 9indigenous 3 8 5 - - - - - - 78 67 16 9
Miscellaneous offences all - 1 - - 1 - - - - 305 305 2 3indigenous - 1 - - - - - - - 63 63 1 2
Total all 338 627 723 498 187 141 22 7 10 238 122 2553 2263indigenous 323 595 693 477 148 105 16 7 5 219 121 2369 2006
* includes indefinite sentencesNote: 'life' sentences not included in total mean and median calculations.
Most Serious Offence
Aggregate LengthMonths Years Days
30

Northern Territory Department of Correctional Services Annual Statistics | 2012-2013
Aggregate sentence – Is determined as the period between the most recent full-time discharge date (as at 30 June 2013) and the date of reception for the episode.
Most serious offence – As recorded from information derived from IOMS and IJIS.
There were 2553 sentenced episode commencements during 2012-13, which was a 13% more than in 2011-12. This includes 212 people who were on remand on 30 June 2012 who became sentenced within the same episode during the following 12 months.
These sentenced episode commencements relate to 2183 distinct persons.
‘Acts intended to cause injury’ were the most common offence type for sentences commencing in 2012-13 comprising 47% of the commencements. This is followed by
‘Offences against justice procedures, government security and government operations’ (22%) and ‘Traffic and vehicle regulatory offences’ (12%).
‘Homicide and related offences’ on average received the longest aggregate sentences (more than 3523 days). This was followed by ‘Sexual assault and related offences’
and ‘Robbery, extortion and related offences’ all of which had an average aggregate sentence of more than 3 years.
Seven people commenced a life sentence for murder during 2012-13
66% of the sentenced episode commencements had an aggregate sentence of less than 6 months.
Indigenous people represented 93% of the sentenced episode commencements. The average aggregate sentence length for Indigenous prisoners was 219 days which was 19 days less than for all persons. Aggregate sentence – Is determined as the period between the most recent full-time discharge date (as at 30 June 2013) and the date of reception for the episode.
Most serious offence – As recorded from information derived from IOMS and IJIS.
31
Table 20 Adult sentenced episodes held by aggregate sentence, offence and Indigenous status.
2012-13 2011-120-<1 1-<3 3-<6 6-<12 1-<2 2-<5 5-<10 10 + Life* mean median Total Total
Homicide and related offencesMurder all - - - - - - - - 46 life life 46 40
indigenous - - - - - - - - 26 life life 26 23
Manslaughter and driving causing death all - - 1 - - 3 32 27 - 3294 3282 63 67indigenous - - 1 - - 3 29 23 - 3294 3282 56 58
Homicide other all - - - - - - - - - na na 0 1indigenous - - - - - - - - - na na 0 1
Acts intended to cause injury all 50 260 487 437 176 163 42 4 7 367 183 1626 1416indigenous 47 254 472 426 164 147 38 1 7 349 183 1556 1277
Sexual assault and related offences all - - - 4 8 35 70 40 3 2759 2555 160 172indigenous - - - 3 3 26 54 31 3 2762 2555 120 126
Dangerous or negligent acts endangering persons
Driving under the influence of alcohol or drugs all 1 2 4 1 - - - - - 122 111 8 8indigenous 1 1 4 1 - - - - - 131 116 7 6
Dangerous or negligent driving all 2 5 7 8 2 5 5 - - 649 244 34 39indigenous 2 5 6 8 2 3 4 - - 558 240 30 34
Other Dangerous Acts all - 2 8 12 12 22 3 1 - 738 550 60 33indigenous - 2 8 11 10 22 3 1 - 752 552 57 25
Abduction, harassment and all 1 - 1 3 1 1 1 - - 554 288 8 11 other offences against the person indigenous 1 - 1 3 1 1 1 - - 554 288 8 8
Robbery, extortion and related offences all - - - 1 9 24 11 2 - 1460 1312 47 39indigenous - - - 1 7 14 6 - - 1208 1033 28 28
Unlawful entry with intent, burglary, all 5 31 57 54 34 21 1 1 - 352 205 204 201 break and enter indigenous 5 30 52 53 27 17 1 - - 320 190 185 180
Theft and related offencesIllegal use of motor vehicle all 1 6 5 8 3 1 - - - 218 182 24 23
indigenous 1 5 5 6 2 1 - - - 207 181 20 23- - -
Theft other all 19 10 5 6 2 4 - - - 185 48 46 39indigenous 17 10 5 4 2 2 - - - 147 43 40 33
Fraud, deception and related offences all 1 1 2 3 4 1 2 - - 629 322 14 6indigenous 1 - 1 2 2 - 1 - - 617 279 7 5
Illicit drug offences all 6 10 10 10 14 30 10 3 2 924 727 95 105indigenous 6 7 8 7 3 1 - - - 191 121 32 52
Prohibited and regulated weapons and all 4 12 8 5 - - - - - 110 91 29 23 explosive offences indigenous 4 12 8 5 - - - - - 110 91 29 21
Property damage and environmental pollution all 14 19 9 11 6 4 1 - - 229 91 64 52indigenous 14 17 8 10 5 4 1 - - 233 91 59 45
Public order offences all 2 11 5 4 - - - - - 104 86 22 24indigenous 2 10 5 4 - - - - - 107 90 21 22
Traffic and vehicle regulatory offencesDriving licence offences all 11 56 43 18 1 - - - - 113 91 129 236
indigenous 9 55 42 18 1 - - - - 115 91 125 218
Exceeding the prescribed content of alcohol all 10 77 107 46 6 - - - - 136 122 246 221indigenous 10 72 101 45 6 - - - - 137 122 234 210
Traffic other all - 2 1 - - - - - - 90 91 3 2indigenous - 2 1 - - - - - - 90 91 3 2
Offences against justice procedures, gov't security and gov't operations
Breach of justice order all 217 158 92 69 47 45 1 - 1 183 62 630 420indigenous 209 148 89 63 38 39 - - 1 172 61 587 380
Immigration offences all - - - - - 32 4 - - 1638 1595 36 38indigenous - - - - - - - - - na na 0 0
Justice other all 4 9 5 - - - - - - 75 67 18 10indigenous 3 9 5 - - - - - - 78 68 17 10
Miscellaneous offences all - 1 - - 1 - - - - 305 305 2 3indigenous - 1 - - - - - - - 63 63 1 2
Total all 348 672 857 700 326 391 183 78 59 507 180 3614 3229indigenous 332 640 822 670 273 280 138 56 37 434 170 3248 2789
* includes indefinite sentencesNote: 'life' sentences not included in total mean and median calculations.
Most Serious Offence
Aggregate LengthMonths Years Days

Northern Territory Department of Correctional Services Annual Statistics | 2012-2013
There were 3614 episodes which commenced prior to or during 2012-13 which were sentenced prior to or became sentenced during 2012-13; 90% of these episodes was for Indigenous prisoners.
The average aggregate sentence for those held during 2012-13 was 507 days and the median was 180 days. During 2012-13, there were 59 episodes in which the aggregate sentence for the prisoner was either a life or indefinite sentence; murder was the most serious
offence for 46 of these episodes.
32

Northern Territory Department of Correctional Services Annual Statistics | 2012-2013
YOUTH DETAINEES DURING 2012-13
The yearly daily average increased by 29% compared with the previous year.
The number of youth exits increased by 28% from the previous year.
33
Table 21 Youth monthly daily average by sentence status.
Aranda
House
Alice Spring
s Youth Detenti
on Centre
Don Dale
Centre All Total
S
S Un
S
S
July
0
5
9 1
1
August
3
2
8 1
1
September
2
2
10 1
2
October
0
2
11 2
2
November
0
4
9 2
2
December
0
6
6 1
2
January
1
3
14 1
2
February
0
3
7 2
2
March
0
5
11 1
2
April
0
4
13 1
2
May
0
5
9 1
2
June
0
6
9 1
2
Indigeno
us 2012-13
0
4
10 1
2
Total 2012-13
0
4 10
1
2
Total 2011-12
0
3 10
1
1
Note: The figures represent the averages rounded to the nearest integer.
Table 22 Youth exits by institution, release reason and Indigenous status.
Release Reason
Alice
Springs
Don Dale
All Total
Aranda House
Youth Detention Centre
Youth
Detentio
n Centre
N
I
N
N
I
N
20
Expiry Of Sent (Full Term)
0
9
0
0
2
0
15
Home Detention 0
0
0
0
0
0 2
Other Discharge From Custody
0
3
1
1
1
1
10
Parole 0
1
0
0
5
0 2
Supervised Bond 0
4
1
2
1
2
14
Unknown - Discharge From Custody
0
1
1 3
1
4 38
Northern Territory Department of Correctional Services Annual Statistics | 2012-2013
Table 23 Youth orders and distinct episode commencements by Indigenous status and sex.
Order Type Indigenous Non-Indigenous Total
Male Female Male Female
Sentenced/Detention
67 8 6 0
Fine Default 0 0 0 0
Remand 317 55 46 3
Immigration 0 0 0 0 Total 2012-13 384 63 52 3
Total 2011-12 299 52 28 6
Distinct episodes
2012-13 324 56 46 3
Distinct episodes 2011-12
251 45 26 6
Note: It is common for more than one type of order to commence during an episode; consequently, the total number of order type commencements may exceed the number of distinct episodes.
Remand orders comprised 84% of order type commencements in 2012-13.
During 2012-13, 76% of the distinct episodes commenced were for Indigenous male youths.
Indigenous
Status Age Group (Years) Total
10-14
15-16
1
20 20
34
Table 24 Distinct youths received by last known address, age and Indigenous status.

Northern Territory Department of Correctional Services Annual Statistics | 2012-2013
Last Known Adelaide River All 1 0
0 1 0
Indigenous 0 00 0 0
Ali Curung All 0 01 1 0
Indigenous 0 01 1 0
Alice Springs All 15 37
1
63 54
Indigenous 14 36
1
60 53
Alyangula All 0 83 11 2
Indigenous 0 83 11 2
Batchelor All 0 11 2 4
Indigenous 0 00 0 3
Borroloola All 3 21 6 0
Indigenous 3 21 6 0
Casuarina All 7 119 27 20
Indigenous 5 106 21 18
Daly River All 0 10 1 0
Indigenous 0 10 1 0
Darwin All 2 53 10 7
Indigenous 2 43 9 5
Harts Range All 0 0
1 1 2
Indigenous 0 01 1 2
Hermannsburg All 0 0
1 1 1
Indigenous 0 01 1 1
Humpty Doo All 0 20 2 4
Indigenous 0 10 1 3
Jabiru All 0 00 0 1
35

Northern Territory Department of Correctional Services Annual Statistics | 2012-2013
Indigenous 0 00 0 1
Katherine All 5 74 16 12
Indigenous 5 74 16 12
Kulgera All 0 00 0 1
Indigenous 0 00 0 1
Lajamanu All 0 00 0 1
Indigenous 0 00 0 1
Maningrida All 3 12 6 6
Indigenous 3 12 6 6
Maranboy All 0 10 1 2
Indigenous 0 10 1 2
Ngukurr All 0 00 0 3
Indigenous 0 00 0 3
Nhulunbuy All 1 20 3 8
Indigenous 1 20 3 8
Oenpelli All 0 01 1 0
Indigenous 0 01 1 0
Palmerston All 18 135 36 31
Indigenous 16 113 30 24
Papunya All 0 01 1 0
Indigenous 0 01 1 0
Pine Creek All 0 01 1 0
Indigenous 0 01 1 0
Tennant Creek All 2 2
4 8 4
Indigenous 2 24 8 4
Ti Tree All 0 02 2 1
Indigenous 0 02 2 1
Wadeye All 1 2 8 1
36

Northern Territory Department of Correctional Services Annual Statistics | 2012-2013
5
Indigenous 1 25 8 1
Wurrumiyanga All 0 1
1 2 3
Indigenous 0 11 2 3
Yuendumu All 0 10 1 1
Indigenous 0 10 1 1
Yulara All 0 00 0 2
Indigenous 0 00 0 2
Interstate All 0 01 1 6
Indigenous 0 00 0 4
Unknown All 2 93 14 7
Indigenous 2 92 13 5
Total 2012-13 All 60 106
6
22
Indigenous 54 99
5
20
Total 2011-12 All 46 88
5
18
Indigenous 43 79
4
16
Last known address – As recorded in IOMS and aggregated into Police districts. Age – In years at first reception.
28% of distinct youths received in 2012-13 came from the Alice Springs district. This was followed by Palmerston at 16%, Casuarina at 12% and Katherine at 7%.
37

Northern Territory Department of Correctional Services Annual Statistics | 2012-2013
38
Northern Territory Department of Correctional Services Annual Statistics | 2012-2013
39
Table 25 Youth receptions by offence.
Most Serious Offence Age Group
(Years) Total
10 1
2012-13
Homicide and related offences Murder 0
0 0
Manslaughter and driving causing death 0 1
1
Other 0 0
0
Acts intended to cause injury 37 4
153
Sexual assault and related offences 2 4
13
Dangerous or negligent acts endangering persons
Driving under the influence of alcohol or other substance
0 1
1
Dangerous or negligent driving of a vehicle 2 2
14
Other 2 0
3
Abduction, harassment and other offences against the person
1 0
1
Robbery, extortion and related offences 2 1
7
Unlawful entry with intent/burglary, break and enter 56 2
138
Theft and related offences
Motor vehicle theft and related offences 6 4
11
Other 6 5
18
Fraud, deception and related offences 0 0
0
Illicit drug offences 1 2
3
Prohibited and regulated weapons and explosive offences 10 6
19
Property damage and environmental pollution 5 1
13
Public order offences 3 0
4
Traffic and vehicle regulatory offences
Driving licence offences 0 0
0
Exceeding the prescribed content of alcohol 0 0
0
Other 0 0
0
Offences against justice procedures, gov’t security and gov’t operations
Breach of justice order 17 5
30
Other 0 0
0
Miscellaneous offences 0 0
0
Total 2012-13 15 9
429
Total 2011-12 10
Northern Territory Department of Correctional Services Annual Statistics | 2012-2013
‘Acts intended to cause injury’ were the most common offence type for youth receptions in 2012-13 comprising 36% of receptions. This was followed by ‘Unlawful entry with intent/burglary, break and enter’ comprising 32% of receptions.
The offence group ‘Unlawful entry with intent/burglary, break and enter’ increased by39% or 39 offences from 2011-12.
Youths aged 15-16 comprised 42% of total youth receptions during 2012-13.
40

Northern Territory Department of Correctional Services Annual Statistics | 2012-2013
COMMUNITY CORRECTIONS CASELOAD AS AT 30 JUNE 2013 There was a 5% increase in the caseload as
at 30 June 2013 compared with the same time the previous year.
Indigenous persons represented 80% of the caseload as at 30 June 2013.
There was a 38% increase in programs for the Tennant Creek office and a 27% decrease in programs for the Groote Eylandt office.
Community Work Orders increased by 43% compared with the same time the previous year.
41
Table 26 Community Corrections adult caseload by office, Indigenous status and program.
Parole Probation Home Detention
Community Based Order
Community Custody Order
Community Work Order
Mental Impairment
Order
Alcohol Intervention
Order
Smart Order 2013 2012
Alice Springs All 30 209 2 1 10 20 0 0 0 272 256Indigenous 24 188 2 0 8 15 0 0 0 237 220
Casuarina All 24 101 8 1 3 41 0 2 4 184 225Indigenous 9 56 1 1 2 20 0 0 2 91 89
Groote Eylandt All 2 22 0 0 0 11 0 0 0 35 48Indigenous 2 22 0 0 0 11 0 0 0 35 46
Katherine All 8 171 4 0 2 32 0 1 0 218 189Indigenous 7 156 0 0 1 30 0 1 0 195 169
Nhulunbuy All 1 24 1 0 0 12 0 0 1 39 40Indigenous 1 23 0 0 0 12 0 0 0 36 37
Palmerston All 22 176 0 1 2 17 0 0 0 218 184Indigenous 10 129 0 1 1 15 0 0 0 156 123
Tennant Creek All 8 87 0 0 2 9 0 0 0 106 77Indigenous 8 82 0 0 2 8 0 0 0 100 72
Wadeye All 1 12 0 0 0 12 0 0 0 25 25Indigenous 1 12 0 0 0 12 0 0 0 25 25
Total 30 June 2013 All 96 802 15 3 19 154 0 3 5 1097Indigenous 62 668 3 2 14 123 0 1 2 875
Total 30 June 2012 All 85 746 37 4 28 108 0 8 28 1044Indigenous 53 584 13 3 27 78 0 6 17 781
Program TotalOffice
Note: Adult status is based on age at commencement of program. Figures are distinct by program thus the total figure does not represent distinct clients, as a client may have different programs
active simultaneously. Active orders counted only ie no orders in breach included.
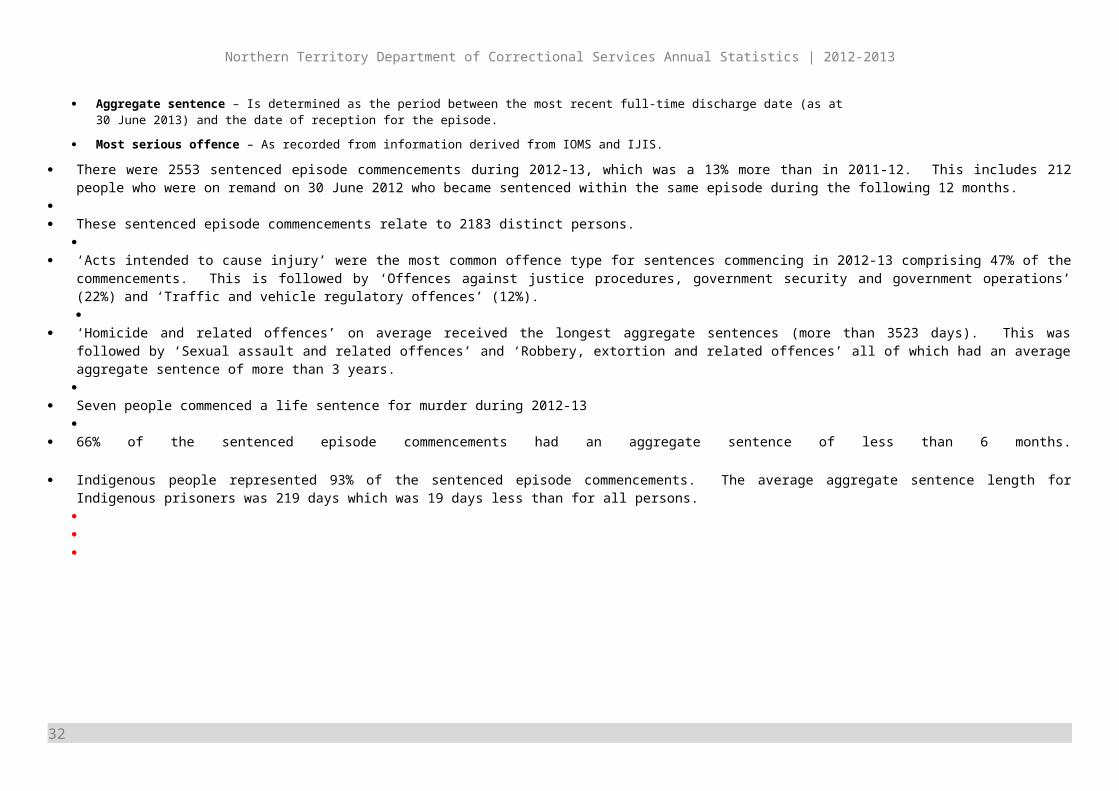
Northern Territory Department of Correctional Services Annual Statistics | 2012-2013
COMMUNITY CORRECTIONS TURNOVER DURING 2012-13
42
Table 27 Community Corrections youth caseload by office, Indigenous status and program.
Office Parole Probation Community Work Order
Youth Alternative Home Detention Order 2013 2012
All 1 33 10 1 45 32Indigenous 1 33 10 1 45 28
All 2 20 13 0 35 40Indigenous 2 13 10 0 25 29
All 0 6 4 0 10 3Indigenous 0 6 4 0 10 3
All 0 18 5 0 23 20Indigenous 0 18 5 0 23 19
All 0 4 0 0 4 4Indigenous 0 4 0 0 4 4
All 0 32 9 0 41 47Indigenous 0 23 8 0 31 36
All 0 3 0 0 3 5Indigenous 0 3 0 0 3 5
All 0 6 4 0 10 3Indigenous 0 6 4 0 10 3
All 3 122 45 1 171Indigenous 3 106 41 1 151
All 1 118 32 3 154Indigenous 1 99 26 1 127
Palmerston
Program
Tennant Creek
Wadeye
Total 30 June 2013
Total 30 June 2012
Total
Alice Springs
Casuarina
Groote Eylandt
Katherine
Nhulunbuy
Note: Youth status is based on age at commencement of program. Figures are distinct by program thus the total figure does not represent distinct clients, as a client may have different programs
active simultaneously. Active orders counted only ie no orders in breach included.
There was a 11% increase in the caseload as at 30 June 2013 compared with the same time the previous year.
Indigenous persons represented 88% of the caseload as at 30 June 2013.
Community work orders increased by 41% compared with the same time the previous year.

Northern Territory Department of Correctional Services Annual Statistics | 2012-2013
43
Table 28 Community-based program completions.
Program
Completions Success Rate
Success
ful
Unsuccessfu
l Other Total
2012-
13
2011-
12 Community work
orders
Adult 200 78 1 279 72
% 77
%
Youth 46 28 0 74 62
% 48
% Home
detention/Youth alternative detention
Adult 33 8 0 41 80
% 86
%
Youth 2 1 0 3 67
% -
Parole
Adult 52 75 22 149 41
% 48
%
Youth 0 1 0 1 0
% -
Probation
Adult 434 306 11 751 59
% 63
%
Youth 68 69 3 140 50
% 63
% Community
custody order
Adult 51 34 1 86 60
% 75
% Community
based order
Adult 3 2 0 5 60
%
Total 2012-13 889 602 38 1529 61
%
Total 2011-12 736 414 15 1165 64%
Other – Includes interstate transfers, withdrawal of order and deaths. Success rate – Is expressed as a proportion of successful and unsuccessful completions only. na – not applicable
Table 29 Community-based program commencements by Indigenous status and sex.
Program
Indigenous
Non-Indigeno
us
All Total
Community work order
Adult
Youth
Home detention/Youth alternative detention
Adult Youth
Parole
Adult
Youth Probation
Adult
Youth
Table 30 Distinct persons commencing a Community-based program by Indigenous status and sex.
Indigenou
s
Non-Indigen
ous All Total
Distinct adults
Distinct youths
Distinct
persons 2012-

Northern Territory Department of Correctional Services Annual Statistics | 2012-2013
There were 32% more distinct persons commencing a community-based program in 2012-13 compared with the previous year.
Females represented 17% of the distinct persons who commenced a community-based program in 2012-13.
44

Northern Territory Department of Correctional Services Annual Statistics | 2012-2013
APPENDIX 1
OFFENCE CLASSIFICATIONS The offences used in this report are based on the Australian and New Zealand Standard Offence Classification. Offences are grouped into Division and Subdivision
level and are as follows:
Offences Against the person Homicide and related offences Murder Attempted murder Manslaughter and driving causing death Acts intended to cause injury Assault Other acts intended to cause injury Sexual assault and related offences Sexual assault Non-assaultive sexual offences Dangerous or negligent acts endangering persons Dangerous or negligent operations of a vehicleOther dangerous or negligent acts endangering personsAbduction, harassment and other offences against the person Abduction and kidnappingDeprivation of liberty/False imprisonment Harassment and threatening behaviour
Robbery, extortion and related offences RobberyBlackmail and extortion
45

Northern Territory Department of Correctional Services Annual Statistics | 2012-2013
Property Offences
Unlawful entry with intent/Burglary, break and enter Unlawful entry with intent/Burglary, break and enter Theft and related offences Motor vehicle theft and related offencesTheft (except motor vehicles) Receive or handle proceeds of crimeIllegal use of property (except motor vehicles) Fraud, deception and related offences Obtain benefit by deception Forgery and counterfeitingDeceptive business/government practicesOther fraud and deception offences
Property damage and environmental pollution Property damageEnvironmental pollution Other Offences
Illicit drug offences Import or export illicit drugsDeal or traffic in illicit drugsManufacture or cultivate illicit drugsPossess and/or use illicit drugsOther illicit drug offences
Prohibited and regulated weapons and explosive offences Prohibited weapons/Explosives offencesRegulated weapons/Explosives offences
46

Northern Territory Department of Correctional Services Annual Statistics | 2012-2013
Public order offences Disorderly conductRegulated public order offences Offensive conduct
Traffic and vehicle regulatory offences Driver licence offencesVehicle registration and roadworthiness offencesRegulatory driving offences (eg Exceeding the prescribed content of alcohol, Exceed legal speed limit) Pedestrian offences
Offences against justice procedures, government security and government operations Breach of custodial order offences Breach of community-based orders Breach of violence and non-violence ordersOffences against government operations Offences against government security Other offences against justice procedures
Miscellaneous offences Defamation, libel and privacy offences Public health and safety offencesCommercial/industry/financial regulationOther miscellaneous offences
47