· web viewthe results provide notable implications for organizational leaders facing a posting to...
TRANSCRIPT

Proceedingsof the Tenth Annual Conference
of theApplied Business and Entrepreneurship
Association International
Program ChairBahram Adrangi
Program Co-ChairsArjun Chatrath
Mary E. Allender
Pamplin School of Business AdministrationThe University of Portland
November 2013Honolulu, Hawaii
Articles published in this Conference Proceedings are accepted based on the double-blind peer-review process.

Giving Hollywood a Brand-Lift: A Marketing Case Study
Frank Sadighian and Michael R. Summers, Business Administration Division,Pepperdine University, Malibu, CA 90263, Phone: (310) 506-4536,
email: [email protected]
Abstract
For nearly a century the Hollywood brand has been associated with the filmmaking industry, movie stars, music, and entertainment. It has attracted large numbers of tourists and visitors for decades, creating economic benefits for the city of Los Angeles and the state of California. The present reality for visitors, however, is drastically different from their expectations, thereby leaving them disappointed. They come with perceptions of the Hollywood phenomenon and leave with the reality of Hollywood Boulevard. This case study gives students the opportunity to maximize the brand potential of Hollywood by creating a cohesive and enjoyable experience for visitors. They must perform research and analysis of a potential development by a major entertainment company, such as Universal Studios or Paramount Pictures. By focusing on the glamour of past and present Hollywood, this project should provide economic benefits to stakeholders as well as enjoyment for visitors.
Introduction
Just as an individual may decide to undergo a face-lift in order to present a more youthful appearance, so also might an organization or group try to improve an outdated and uninspiring image with a “brand-lift.” This paper describes a case study for undergraduate marketing students where the students must do their own research on the background data and then present an analysis and proposal to help update one of the most well-known brands in the world – Hollywood, California.
In its Golden Age (1930’s and 1940’s) Hollywood’s image was of a place where dreams came true and stars were born. That period saw the rise of the studio system, where the eight major studios produced over 7,500 films between 1930 and 1945. Each week over 80 million Americans saw at least one movie; and 95% of all American movies were produced by the Hollywood studios. With the breakup of the studio system and the introduction of television, these gaudy numbers began to decline in the late 1940’s.
Over the years Hollywood’s image has gradually become tarnished. Today people are more likely to associate Hollywood with congestion, homelessness, crime, and a sense of unwelcome. Currently the Hollywood neighborhood of Los Angeles, with a population of about 85,000 people in 2008, averages 68.1 crimes per week. It ranks 28th worst out of 209 Los Angeles neighborhoods in violent crimes and 32nd worst in property crimes per 10,000 people. Also, the production of movies is no longer concentrated so heavily in Hollywood, with major international competition from Bollywood and with financial incentives luring filmmakers to locations all over the United States and the world.

Hollywood’s brand could definitely use some sprucing up. Stakeholders such as the state of California and the city of Los Angeles depend on Hollywood for tourism, tax revenues, and jobs. While these governmental agencies are currently unable to give much financial help to boost Hollywood’s image, they can at least help in facilitating improvements in the area that in turn can improve Hollywood’s brand. Other stakeholders in the brand of Hollywood include such entertainment giants as Universal Studios, Paramount Pictures, and Disney. Such corporations might have an interest in investing in Hollywood’s improved image. Local citizens and merchants also have an obvious stake in the success of Hollywood’s brand, as do potential visitors from near and far seeking entertainment.
Figure 1 shows the central Hollywood area. A few miles to the northwest along the 101 freeway is Universal City, including Universal Studios and Citywalk. Paramount Pictures is a couple of miles to the southeast. Many of the major television and movie studios, such as Warner Brothers, NBC, and Disney, are about 5 miles to the north in the Burbank area.
Figure 1The Hollywood Area


The Situation
Hollywood’s brand is obviously tarnished and underutilized. When moviegoers around the world see the spectacular results of Hollywood’s efforts on the screen, they have high expectations when they visit the area, only too often to be disappointed. In the areas where visitors tend to congregate, near the intersection of Hollywood and Highland and the intersection of Hollywood and Vine, they most often are confronted with beggars and trinket sellers rather than the magic place that they had expected. On the other hand, places such as the Hollywood Bowl and Universal Studios are much more satisfying because they are destinations for a specific experience and one that is provided with high quality. The challenge is for the rest of Hollywood to capitalize on its brand and to meet the expectations of the stakeholders.
The focus of this project is the area near Hollywood Boulevard and Highland Avenue (Figure 2). On the northwest corner of that intersection is the Hollywood and Highland Center, built in 2001. The center includes more than 75 shops, the TCL Chinese Theatre (formerly Grauman’s and Mann’s), and the Dolby Theatre (formerly Kodak), which hosts the Academy Awards and previously the Cirque du Soleil show “Iris.” The surrounding area is a hodgepodge of uses that fails to provide a satisfying Hollywood experience to visitors and, in fact, can be dangerous. On June 18, 2013, at 8:10 in the evening a visitor was stabbed to death by panhandlers at that intersection when she wouldn’t give them a dollar after taking a picture with her cell phone.
Figure 2Hollywood and Highland
Source: http://hollywood and highland.com

The challenge is to produce a plan whereby an interested party with the necessary expertise and financial resources, such as Paramount or Universal, would develop the nearby area south of Hollywood Boulevard into a cohesive, safe, and attractive entertainment complex that would take advantage of and reinvigorate the Hollywood brand. A Hollywood-focused theme park in that area could include such attractions as museums devoted to Hollywood history, hands-on film-making, live Las Vegas-style entertainment, restaurants, rides, retail stores, theaters, and hotels. These attractions might not necessarily be confined within one contiguous area, and existing theaters and hotels could be incorporated into the plan.
Areas of research necessary to develop this plan would include such things as land costs, zoning, traffic, a survey of attitudes of various stakeholders, existing attractions in the area, the economic impact of movies to the area, trends in the number of visitors to local theme parks and the general southern California area, and how the locations of other attractions might affect and be affected by the proposal.
The Assignment
Student groups are asked to conduct research, including the areas mentioned above, and to prepare a marketing plan for the project. Exhibit 1 shows the general outline for marketing plans that students are supposed to follow in their written and oral presentations. As can be seen, the project requires a substantial amount of data collection and analysis.
Exhibit 1Marketing Plan Outline
1. Cover page (subject, authors, date)
2. Table of Contents
3. Executive Summary (1 page – explain the product/value, then summary of the plan)

4. What is our business? (the big picture) **Note: steps 4-9 require primary & secondary data Mission/vision statement Company background Core competencies
5. Where are we now? (situation analysis – snapshot as of today) SWOT analysis (the overall company) Environmental scan and description of trends (social, including demographics and cultural effects;
economic, micro and macro; technology; competitive; political; regulatory; and natural) Detailed description of plan objectives (financial and non-financial; related to the target product) Industry analysis/market needs (related to the target product) Buyer behavior (related to the target product) Competitor analysis (related to the target product)
6. Where do we want to go? Business portfolio analysis (market growth rate vs. market share; company’s related products) Product-market analysis (current/new; product/market; company’s related products)
7. How do we get there? **Note: step 7 requires FAB sheet(s) Marketing mix strategies (detailed 4P’s plus Positioning; related to the target product)
8. Implementation (related to the target product) Resources required (estimate – HR, operations and production) Action/timing and who is responsible (Gantt chart) Estimated budget (required total $ for above required resources) Organization chart
9. Evaluation and control (related to the target product) What data to monitor (sales, growth rate, market share, profit, etc.) Frequency to check the results Marketing mix modifications required to achieve objectives
Teaching Note
This project has so far been assigned to two student groups in the basic undergraduate marketing course, which consists mainly of sophomores and juniors. Different student groups are assigned different topics for their projects. Students are given 5 weeks to work on the project, and it represents 20% of their course grade. They work closely with the professor throughout the process. The two groups that have worked on this project took the roles of two potential companies capable of undertaking such a development, Universal Studios and Paramount Pictures. Other companies, including the possibility of a foreign investor group, could also be assigned.
The objective is that students undertaking this project will
Better understand and define market opportunities Apply creativity and innovation in identifying possible strategies Experience developing marketing 4P strategies for a real situation Analyze alternatives and evaluate their potential results Develop control mechanisms to monitor and implement future necessary changes in their plans

Student papers, and also their Powerpoint presentations, closely follow the Marketing Plan Outline in Exhibit 1. Exhibit 2 shows examples of student Powerpoint slides that address several of the topics in the Outline, taking the role of Universal Studios. These slides demonstrate the level of detail that students undertake; of course, their paper explains these points much more completely. In our experience so far, students really seem to enjoy the project and are willing to devote a great deal of time and effort to it. Their numerical results may not always be completely realistic, but for an introductory marketing course they get to experience some important marketing processes.
Exhibit 2Examples of Powerpoint Slides (Universal Studios)
Experienced in product and image development
Experience in research and development
Brand Equity Loyal Customers One of the “Big 6”
in the industry Huge disposable
income

Too much diversificationLack of influence in City of
HollywoodOnly 9.8% of theme park
market share Competitor Cooperation Not as innovative as
competitors Plummeting Advertising
Sales
Exhibit 2 (Cont.)Examples of Powerpoint Slides (Universal Studios)
Growing demand for quality Hollywood tourism
Increase travelPromote brand image Premium architectsRevenues
Current storesTraffic Artery Competition EarthquakesTraffic RegulationsEconomic stateZoning lawsHigh crime area
Exhibit 2 (Cont.)Examples of Powerpoint Slides (Universal Studios)
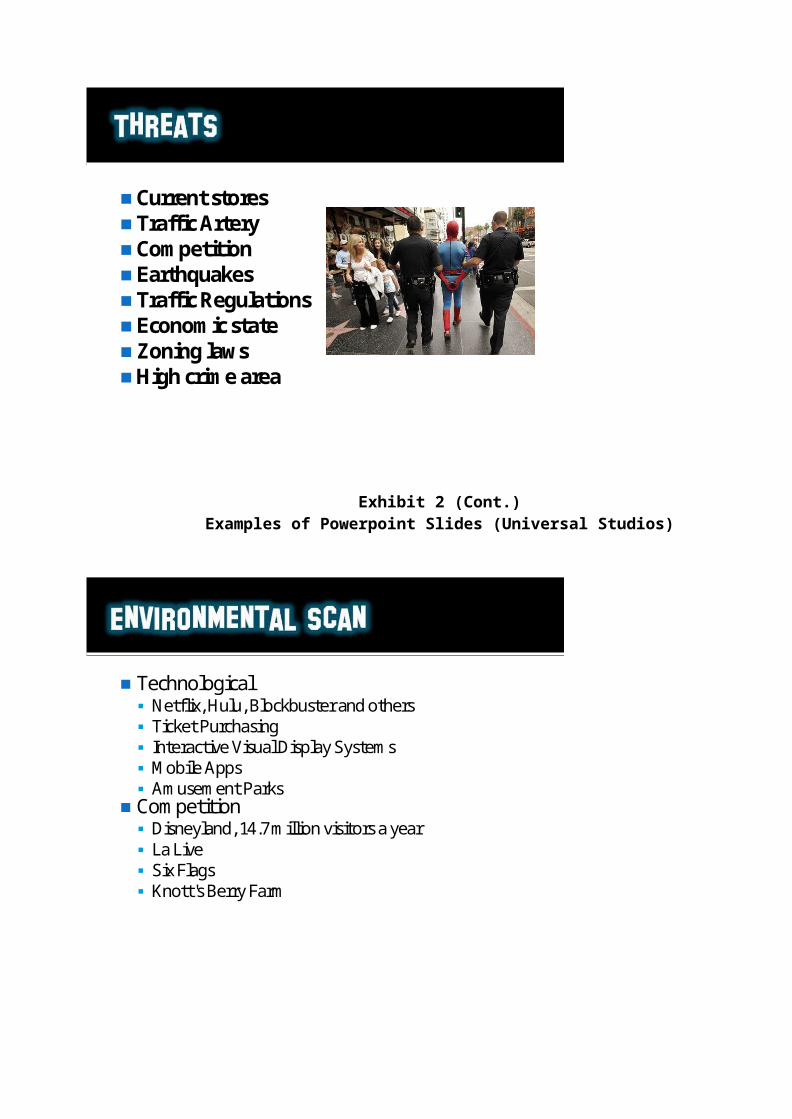
Technological Netflix, Hulu, Blockbuster and others Ticket Purchasing Interactive Visual Display Systems Mobile Apps Amusement Parks
Competition Disneyland, 14.7 million visitors a year La Live Six Flags Knott's Berry Farm

Regulatory City of Los Angeles
Environmental Quality Act Regulations of LA Green
Code Mobility & Transportation
initiatives Zoning regulations and
conditional use permits
Exhibit 2 (Cont.)Examples of Powerpoint Slides (Universal Studios)
Segmented by income demographics Income 50-60K +
Young Los Angeles Natives International TouristsFamiliesHigher income demographics

•99 million domestic tourists•13.4 million tourists international•11.5% of all domestic travels in the US•Traveler Spending-68.23 billion dollars•873,000 jobs•$2.1 billion in local taxes and $4.0 billion dollars in California state taxes. •Universal Studios is also the top 10 US theme parks •5 million visitors per year
Exhibit 2 (Cont.)Examples of Powerpoint Slides (Universal Studios)
Features Advantages Benefits
A single tangible location for the
Hollywood Experience
Conveniently experiencing
all Hollywood has to offer
Saves time and money
Entertainment options for all
ages
Occupies all members of the
family
Saves time and money
Improved safety of Hollywood Safer feel for visitors Saves time and money
Improved brand equity of
Hollywood
Improved reputation of the
entertainment industry
Saves time and money
Increase in tourism Increase in revenues for
businesses and taxes for the
state
Saves time and money
Creation of Jobs Increase economic state of
California
Saves time and money

•Museum•Retail Stores •Restaurants•Architecture•Nightlife•Ticket Kiosks•Movie Studios
Exhibit 2 (Cont.)Examples of Powerpoint Slides (Universal Studios)
TICKET
PACKAGES
General
Admission
Senior Citizen Children under 18 Children under 5
Elvis Presley
Museum Access
$30 $20 $20 Free*
Audrey Hepburn
Museum and Rides
$65 $50 $50 Free*
Marilyn Monroe
Museum and Rides plus a tour of a
Television Set plus Dinner
$150 $130 $130 Free*
Discounts
Hollywood Hotel Discount for
Museum Plus Rides
$10 discount on any
package or 25% discount on the Marilyn
Monroe Package
$10 discount on any package or
25% discount on the Marilyn
Monroe Package
$10 discount on any package or
25% discount on the Marilyn
Monroe Package
No Discount
•Advertising •Commercials on television networks & online•Featured in TV shows •Out-of-home advertising •Busses, billboards, buildings
Exhibit 2 (Cont.)Examples of Powerpoint Slides (Universal Studios)
•Several Blocks of Hollywood Blvd.•NBC website•NBC Television Production

Low quality High quality
Low Price
High Price
Hollywood Experience
Disney Land
Universal Studios
Walk of Fame
Kodak Theatre Grauman’sChinese Theatre
Ripley’s Believe it or Not
Six Flags
Exhibit 2 (Cont.)Examples of Powerpoint Slides (Universal Studios)
Estimate Budget & Resources Required:
*Design & architectural fees, legal fees, furnishings, engineering, site clearing, advertising, insurance…etc. Also included in soft costs are our Human Resources. Primary costs are for engineers, architects, and managers of various departments.

References
Google Maps. “Hollywood Map.” http://maps.google.com
Hollywood and Highland Center. http://hollywoodandhighland.com
Los Angeles Times. “Fatal Stabbing a Reminder of Gussied-Up Tinseltown’s Darker Past.”http://articles.latimes.com/2013/jun/21/local/la-me-hollywood-killing-20130622
Los Angeles Times. “Hollywood Crime – Mapping LA.”http://projects.latimes.com/mapping-la/neighborhoods/neighborhood/hollywood/crime/
University of North Carolina. “The Golden Age of Hollywood: 1930s – 1940s.”http://ils.unc.edu/dpr/path/goldenhollywood/

Expatriate adjustment in the UAE: Effects of pre-departure training
Dr. Hanan Al Mazrouei, Department of Business and Economics, United Arab Emirates University, Al Ain, UAE, Phone: +97150 783 8886, [email protected],
Abstract
The purpose of this study is to investigate the impact of cross-cultural pre-departure training on expatriate leaders’ adjustment. Questionnaires are used to examine the factors relating to expatriate leader adjustment in the United Arab Emirates (UAE). There was a positive correlation between expatriate adjustment and attending ‘pre-departure training’. Analysis concluded that ‘pre-departure training’ was a significant variable predicting expatriate adjustment. The results provide notable implications for organizational leaders facing a posting to the UAE and HRM specialists in their organizations.
Introduction
Expatriate assignments are a fact of life in the international business world today. With the rapid spread of international organizations, many managers concentrate on their organization’s core business at the expense of understanding cultural variations (Miroshnik, 2002). Managers who can effectively work across cultures and achieve organizational objectives are increasingly sought after as a source of competitive advantage. These managers must successfully negotiate the many challenges that cross-cultural leadership presents if they are to overcome the barriers related to working with members of a different culture and manage their organization’s business and its local idiosyncrasies.
Frequently the inability to adapt is based on a lack of preparation (Deresky, 2002; Hodgetts and Luthans, 2000). Proper preparation would emphasise the difficulties associated with developing effective working relationships with people in foreign cultures (Beamish, Killing, Lecraw and Morrison, 1994). Inadequate cross-cultural training (CCT) is one of a number of reasons for less than successful expatriate adaptation and an early return from a failed assignment (Dowling and Welch, 2004; Edwards and Rees 2006). This can often be the result of poor organizational planning but, unfortunately, usually the individual takes the blame (Deresky, 2002; Hodgetts and Luthans, 2000).
The aim of this study is to add to the fields of international business, management, and human resource management by focusing on global leadership and cultural awareness and is aimed both at the development of existing adjustment theory and its practical application for HR practitioners. This article examines HRM in the international context, particularly as it relates to the pre-departure training of candidates for expatriate assignments to enhance expatriates’ ability to adapt to their new environment. This study contributes to current knowledge by addressing critical gaps in cross-cultural management theory including training, adaptation and intercultural awareness. It also improves the understanding of adaptation as well as enhancing expatriates’ ability to work in the UAE which will assist organizations with expatriates in the UAE or those intending to send leaders there. This study uses quantitative methods to analyze the hypotheses and address the research objectives. Exploratory research is utilised to determine the relationship between CCT and expatriate leaders’ adjustment within the context of UAE organizations.
Data and methodology
This article uses quantitative methods to address the hypotheses. Exploratory research is utilised to establish the critical determinants influencing expatriate adaptation to the culture within UAE organizations. Primary data is collected using questionnaires to assist the researcher to identify the effectiveness of pre-departure training undertaken by expatriate leaders who have successfully adapted to the UAE culture. Self-reporting

surveys may not be the most effective way to quantify cultural values (Schaffer and Riordan, 2003) but are considered the most popular and efficient method of doing so as it is less demanding on researcher resources (Taras, Rowney and Steel, 2009).
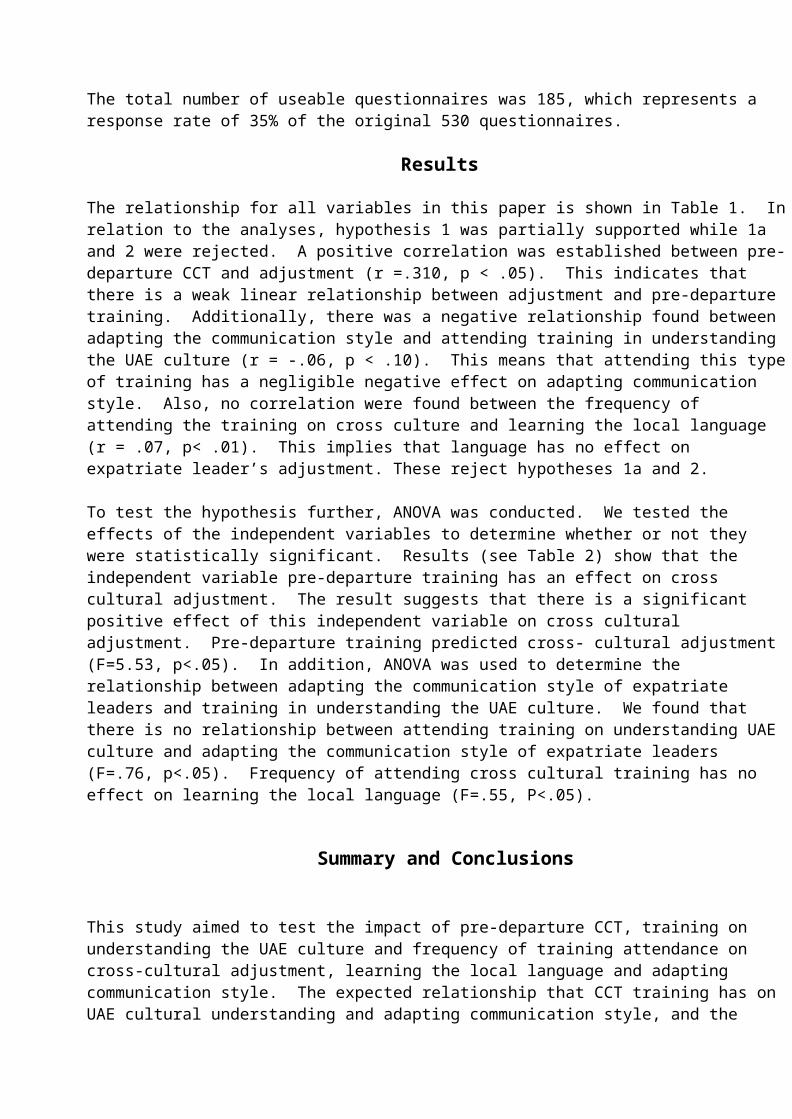
Participants in this study include expatriate senior executive and middle management from a variety of UAE industries. Respondents in this research were expatriate leaders coming from a number of different countries and working in hospitals, hotels and commercial centers. The selection criteria for this research sample were based on respondents being non-UAE nationals and their having worked between two months and twenty years in UAE organizations. Two weeks were allowed for them to complete their surveys. After this time, those who had not yet completed their questionnaires were urged to do so. A further week was allowed following which further responses were collected. Any expatriates with surveys still outstanding were reminded of the benefits of the research. The total number of useable questionnaires was 185, which represents a response rate of 35% of the original 530 questionnaires.
Results
The relationship for all variables in this paper is shown in Table 1. In relation to the analyses, hypothesis 1 was partially supported while 1a and 2 were rejected. A positive correlation was established between pre-departure CCT and adjustment (r =.310, p < .05). This indicates that there is a weak linear relationship between adjustment and pre-departure training. Additionally, there was a negative relationship found between adapting the communication style and attending training in understanding the UAE culture (r = -.06, p < .10). This means that attending this type of training has a negligible negative effect on adapting communication style. Also, no correlation were found between the frequency of attending the training on cross culture and learning the local language (r = .07, p< .01). This implies that language has no effect on expatriate leader’s adjustment. These reject hypotheses 1a and 2.
To test the hypothesis further, ANOVA was conducted. We tested the effects of the independent variables to determine whether or not they were statistically significant. Results (see Table 2) show that the independent variable pre-departure training has an effect on cross cultural adjustment. The result suggests that there is a significant positive effect of this independent variable on cross cultural adjustment. Pre-departure training predicted cross- cultural adjustment (F=5.53, p<.05). In addition, ANOVA was used to determine the relationship between adapting the communication style of expatriate leaders and training in understanding the UAE culture. We found that there is no relationship between attending training on understanding UAE culture and adapting the communication style of expatriate leaders (F=.76, p<.05). Frequency of attending cross cultural training has no effect on learning the local language (F=.55, P<.05).
Summary and Conclusions
This study aimed to test the impact of pre-departure CCT, training on understanding the UAE culture and frequency of training attendance on cross-cultural adjustment, learning the local language and adapting communication style. The expected relationship that CCT training has on UAE cultural understanding and adapting communication style, and the frequency of training attendance and learning the local language would increase expatriate adjustment was not supported by our data. However, this study has emphasized the effect of pre-departure CCT on expatriate leaders’ adjustment to the UAE culture.
Because the sample used in this study does not represent all the industries nor all cities in the UAE the results are only applicable to the sample population. If a result is not able to be applied to the general population then conclusions must be restricted to the study sample (Field, 2009). In conclusion, the results of this

research support the findings of Waxin and Panaccio (2005) relating to the impact of pre-departure CCT on expatriate adjustment.
References
Beamish, P.W., Killing, J.P., Lecraw, D.J. and Morrison, A.J. (1994), International Management: Text and Cases, Burr Ridge, Illinois, USA, Richard Irwin.Deresky, H. (2002), International Management: Managing Across Borders and Cultures, Fourth edition, Upper Saddle River, New Jersey, Pearson Education.Dowling, P.J. and Welch, D. (2004), International Human Resource Management: Managing People in a Multinational Context, Fourth edition, London, Thomson Learning.Edwards, T. and Rees, C. (2006), International Human Resource Management: Globalisation, National Systems and Multinational Companies, Harlow, Essex, UK, Pearson Education Limited.Field, A. (2009), Discovering Statistics Using SPSS, London, Sage Publications.Miroshnik, V. (2002), “Culture and international management: a review”, Journal of Management Development, Vol. 21, pp. 521-44.Schaffer, B.S. and Riordan, C.M. (2003), “A review of cross-cultural methodology for organizational research: a best-practices approach”, Organizational Research Methods, Vol. 6, pp. 169-215.Taras, V., Rowney, J. and Steel, P. (2009), “Half a century of measuring culture – review of approaches, challenges, and limitations based on the analysis 121 instruments for quantifying culture”, Journal of International Management, Vol. 15, pp. 357-373.Waxin, M-F. and Panaccio, A. (2005), “Cross-cultural training to facilitate expatriate adjustment: it works!”, Personnel Review, Vol. 34, pp. 51-67.
Process Capability Approaches for the Process Improvement of a Meal Line: Some Experiments and Observations
Dr. Ram Roy, Eastern Institute of Technology, Hawke’s Bay, New Zealand, [email protected]
AbstractThis study was initiated by Meal Line of XYZ Food Company which has received numerous complaints from customers regarding missing fillings in their meals. These meals are prepared with multiple ingredients filled in by various machineries in the Meal Line. The ingredients weights in the meals are designed in such a way that a missed drop/fill should cause the meal to be underweight. In spite of having a validated checkweigher, that should detect and remove underweight meals, such meals are still making into the market. The objective of this study was to identify the causes behind the problem. To search for the problems, an understanding of the line, machinery and process was undertaken. Then the Six Sigma approach (DMAIC) was used to understand and improve the capability of the process. It was identified that the weight of the fillings dropped into meals by the fillers were heavier than specifications, causing finished meals to be heavier. This allowed the meals with missed fillings to go past the checkweigher without being detected. Samples were collected and analysed to determine the capability of the process. Along with the general observations, certain experiments were also conducted during the study. The operators and quality controller were interviewed and their opinions noted. The outcomes of these observations and results were analysed and the conclusions drawn were: rejection capability of the system is not high; improvements on the fill weights may not be enough to improve the efficiency of rejection process and more changes to the checkweigher and other machinery are required. These recommendations should improve the process capability and reduce the number of customer complaints.

IntroductionProcess capability indices, according to Jackson (2001), were invented to enable an organization to make economically sound decisions for process management. Process capability is a comparison of the voice of the process with the voice of the customer. The two popular process capability indices in use are Cp and Cpk. Cp = {USL – LSL}/6σ, and Cpk = min of {(USL-µ)/3σ, (µ-LSL)/3σ}; where, LSL = lower specification limit; USL = upper specification limit; σ = process standard deviation, and µ = process mean (Jackson, 2001).
Meagher (2000) explained the concept of process capability with an interesting example. Think of driving different types of vehicles on a road under construction. The vehicle's width is the variability of the process (±3σ), and construction barriers on either side of the road are specification limits. Every time the vehicle approaches a barrier, getting closer to one of the specification lines, the opportunity for success is lowered. This is equivalent to Cpk, the process performance, which is the distance from the centre of the vehicle to the closest barrier divided by the distance from the centre of the vehicle to its edge closest to the same barrier.
Let the width of a lane is 10 feet, through which different vehicles have to pass: a motorcycle (3 feet wide), a car (6 feet wide); a truck (9.5 feet wide); and a home (14 feet wide). All the vehicles running through the lane is, Cp, the process potential (width of lane or specification/variability). So, the capability of motorcycle would be 3.33 (10/3); car, 1.67 (10/6); truck, 1.05 (10/9.5); and home, just 0.71 (10/14). So, which vehicle would you like to be driving? Your only concern will be the closest side as that is the only one likely to be damaged. For example, capability of motorcycle running 2 feet away from barrier would be 2 {i.e. (5 - 2)/1.5 = 2, and capability of car would be 1 {i.e. (5 - 2)/3 = 1} (Meagher, 2000).
Some researchers are sceptical about using capability indices as they do not deal with all the problems in the process. According to Nelson, “. . . the concept of attempting to characterize a process with a single number is fundamentally flawed” (Nelson….cited in Jackson, 2001). Similarly, Kitska stated, “I would prefer eliminating Cp and Cpk statistics. They grossly oversimplify process characteristics and, without adequate exploratory analysis, often lead to erroneous or meaningless conclusions” (Kitska….cited in Jackson, 2001).
Palmer and Tsui (1999) suggested some indices other than the popular ones used by practitioners of industrial statistics. According to them, selection of a set of capability indices, for use in directing process improvement activities, should be based on the stated requirements of the customer and the current ability of the process to satisfy those requirements.
Taking the opinions of various researchers into account, this paper deals with the issues of process control from various perspectives without depending too much on the process capability indices.
Company’s BackgroundXYZ is an iconic company of New Zealand that manufactures jams, dressings, soups, sauces, and even burgers. It also processes tonnes of fruits, vegetables, baked beans, spaghetti, and various meals. XYZ has three manufacturing sites, two in the north and one in the south island of New Zealand. In 2011 XYZ won Readers Digest most trusted food brand in New Zealand for the second year in a row. Marketing general manager of HW considers this award as recognition by people of NZ, as a privilege. One of the two food processing sites of XYZ is located in Hastings where they have they have a major production centre called the Meal Line. Here they make various types of meals for XYZ and other brands like Weight Watchers (WW). There are two Meal Lines capable of producing meals. This paper is based on products made on Meal line 2 which is used to make ‘ready to eat’ frozen meals such as: Tuna Bake, Chicken Hotpot, Chicken

Risotto, Macaroni Cheese, Thai Chicken Curry, Chicken Fried Rice, etc. As the meals are prepared for weight watchers, the final meals are required to be within the specific weight limits.
Meal specifications: The meals are assigned to meet certain weight specifications. Every meal must ‘fit’ within the minimum and maximum weights specified for the particular meal. Each component of the meal is given a weight specification (min and max) and the overall design is such that if a component is missed then the total weight will be outside the specifications and therefore will be rejected by the checkweigher. Every meal has its own set of fillings as part of recipe. There are five different machineries used to dispense each of these fillings on empty plates placed on a moving conveyor belt. Figure 1 shows detailed layout of Meal Line 2. A part of its quality control system is a checkweigher which is attached with a reject system. It works perfectly every time it is tested but customer complaints show that underweight meals are still getting through to the market. The meals have up to 5 ingredients, and the validated checkweigher should remove underweight products. However, the missed filling complaints on all the WW products are consistently high. Customers complain on missing pasta or chicken/meat in the meal.
Objectives and ApproachThe objective of this paper is to determine causes behind the meals with missed fillings making past the checkweigher without being rejected, and to work with the meal line to fix the issue.
The approach for this study will be to understand the process of making meals and then to look at the customers’ complaints to find out the reasons and then suggest ways to process improvement. This will require applying the principles of Six Sigma (DMAIC) at Meal Line (Muthiah, 2011).
Learning at the ProcessThe Meal Line makes use of 11 equipment/machineries out of which 8 are filling stations. The scope of the project is quite broad as the causes are not specifically known. The steps taken are as follows: (a) Understanding the machinery and processes involved as there could be multiple factors causing the problems. (b) Full process and machinery will be looked at to find the contributing factors. Observations will start from the checkweigher end of the line and continue towards other machineries and filling stations. (c) A series of experiments will be conducted to determine the efficiency of the checkweigher and the process. They will be conducted with the cooperation from the operators (OP) and quality controllers (QC) working on the line along with the team leaders (TL) and some casual workers. Their opinions and suggestions will be noted down during the study along with other activities. (d) The data collected during the study will be analysed and discussed with the team members and any new development will be reported. This study would also include the opinions and actions taken by the team. (e) Effectiveness of these changes will be observed and improvements noted.
Process Observation for various Meals
1. Weight Watcher’s Tuna Bake: The first meal observed on Meal Line 2 was Weight Watcher’s Tuna Bake with the specifications given in Table 1. Fillings added by different dispensers are: multi filler (pasta), piston filler (sauce), manual filling (Tuna), mondini (broccoli), and cheese dispenser (cheese). There was high inconsistency in the amount of tuna placed in the plates manually. According to the quality controller (QC) the inconsistency was because of the texture of tuna and the high speed of meals moving on the belt. The workers were sometimes unable to keep up with the speed at which the meals moved. The checkweigher is placed at the end of the production line after the meal gets sealed by mondini sealer (Figure 1 Appendix).

There is no cover on the belt of the checkweigher, and the belt does not seem tight enough. It appears slightly lifted above the surface on one side. The machine operator commented that the key slot used to tighten the belt was ground so it cannot be further tightened. It can be observed that the key slot to tighten the belt is worn-out.
Sometimes a pile of meals get accumulated at the rework table. There are no fillings/ingredients placed at the rework table to fill the missing ingredients in the meal. The workers at the rework station use one of the existing rejected meals on the table to fill the others with the help of a spoon. First the seals of the meals are removed by hand. The weights are then adjusted to within the specifications with the help of a scale. A small sealer that is positioned next to the rework table is used to reseal the meals. They are then placed on the moving belt after the checkweigher which takes them towards pack offs (final product packaging).
At times the rework table is completely full, and the meals start to build up back towards the rejecter arm. There is a sensor between the rework table belt and the rejecter arm to stop the main belt when the meals start piling up towards the rejecter arm. This stops the whole processing line and prevents meals from reaching towards belt going to the pack offs.
The meals that have been rejected by the checkweigher are shaken up in the process and are mixed up. The appearance of most of the meals going through to reworks and even some of the finished meals from reworks, do not look anything like the picture on the packaging. It is observed that the meals get literally whacked by the rejecter arm and are mixed up.
Upon observing the meals moving on checkweigher, it seems like there is a lag between the readings of weights on the checkweigher panel. Meals are moving too fast for the eye to detect if checkweigher is weighing every meal. The checkweigher displays the number of meals passing through it every minute and it matches the speed on the panel used by the operator to control the meal line. The checkweigher is capable of rejecting 100 meals a minute. According to an operator the testing process is such that they pass 100 out of specifications items within a minute.
The QC checks the meals every half hour. Four samples of each of the fillings are taken in empty plates. The results are fed into a system that calculates process capability with the aid of graphs for records. 4 samples of each fillings are tested from 3000/2400 meals depending on the speed of the line. A discussion with OP revealed that the checkweigher is not required to be zero error tested. But, he kept an unofficial record of the results of testing done by him over a period of time. The results of the test conducted on request are given in Table 2.
Table 1: WW’s Tuna BakeIngredient USL LSL Target
Sauce 200 183 193Pasta 93 80 86Tuna 36 12 24
Broccoli 37 15 26Cheese 6 2 2.9
QC Sheets 359 311 353Rework 357 320
Checkweigher 357 311
Table 2Average weight (gms) 0
Standard deviation 1.26Min weight -3.20Max weight 3.10
Calculated range 6.30
As per the operator the accumulated grime (on that day) on the checkweigher was due to the cheese dispenser. If the Meal Line is stopped for any reasons the cheese dispenser does not stop the flow of cheese which gets collected on the conveyor belts and then gets spread across the belt by sticking to the bottom of the plates.
The QC and the OPs differed whether the meal with weight equal to LSL should be rejected or accepted by the checkweigher. The QC believed it should be rejected whereas in operators’ opinion the meal should be acceptable. It was observed that meals that weighed equal to LSL were accepted by the checkweigher. The QC suggested that it was due to the alteration in the target weight which gets updated every 10 minutes (see discussion in Appendix).
Ishida display panel shows the weights passing through its buckets to the next one. It also shows the combined weight dropped. Frozen broccoli being filled by Ishida bounces and drops outside often. QC commented that when they do the visual observations for tuna they look highly inconsistent. However, when it comes down to weighing the samples, the weights are accurate. The QC believes that this is because when they weigh the manual feeding of tuna, the people on line doing the hand fill become aware of QC’s intentions when empty plates approach them and so the readings are always within limits. Checkweigher rejecter arms are mounted on a belt. It is inside a cage. Some meals after rejection collide inside the cage area, and observation is summarised in Table 3.
Table 3
Totalobservations
No. ofcollision
Totalcollisions
inside cage
Recoiledback after colliding
Recoiled backonto conveyor
belt
Comments
74 51 20 3 0 Seal coverings came off many times causing spillage around cage and
Experiment 1 Comparing meals: Meals were first weighted on scales and then reading taken from the checkweigher. According to the QC the scales and checkweigher have been calibrated but they are not sure why there is variation (Table 4).
Table 4Weight on scale (gms) Weight on checkweigher
(gms)Difference (gms)
331 333 -2346 347 -1335 336 -1340 341 -1324 323 -1333 330 3334 332 2
During later observations, a series of meals that were partially full were rejected by the rejecter. Some empty and very partially filled meals got trapped in the cage. It was suggested by the operator that the empty or light meals have a high tendency to get trapped inside the cage of the rejecter arm. An experiment was conducted which required putting back rejected meals that were still intact back on the line, before checkweigher for a second time to check if the checkweigher rejects them again. The results of the experiment are shown in Table 5.
QC’s underweight sample got accepted while the above trial was being conducted. Upon second trial the same meal got rejected. The QC mentioned they had no idea why the same test meal which was under weight, was accepted at first and then rejected the second time. The QC added that it does not happen often but there are times when similar incident has happened.
Table 5: LSL = 311, USL = 357Number Weight on checkweigher Weight on scales Difference Comments
1 358 355 3 2nd time accepted

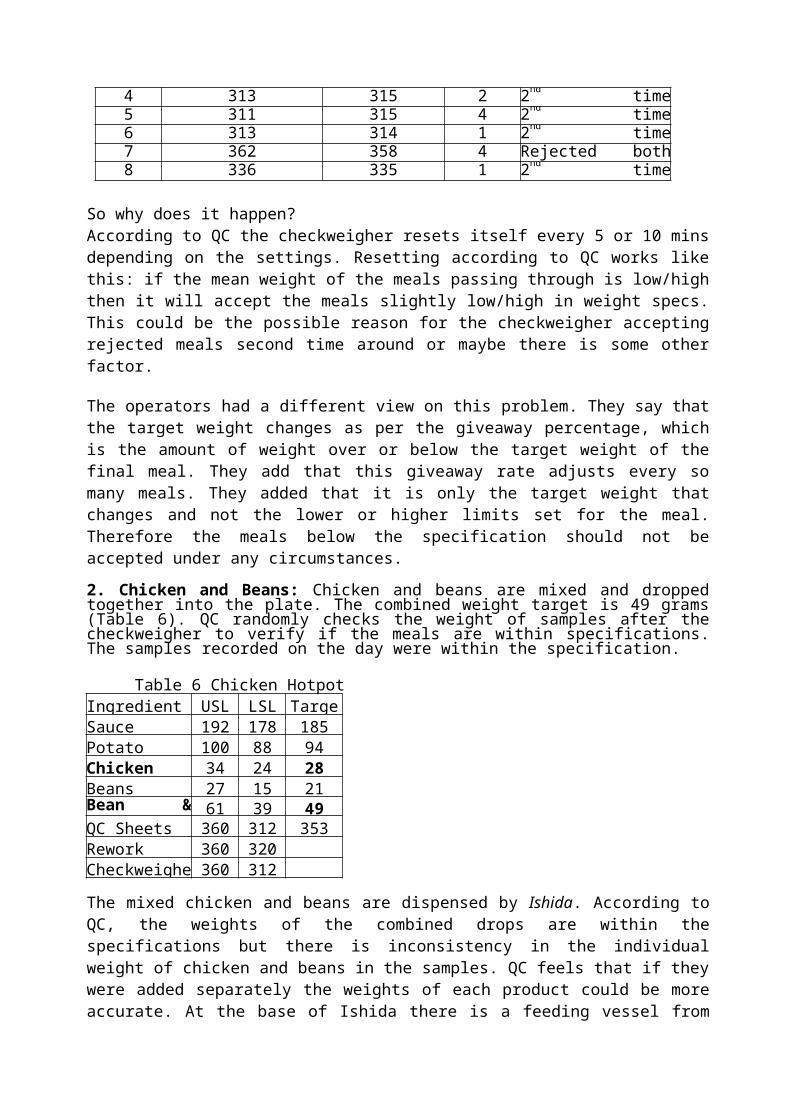
2 353 353 0 2nd time accepted3 306 309 3 Rejected both times4 313 315 2 2nd time accepted5 311 315 4 2nd time accepted6 313 314 1 2nd time accepted7 362 358 4 Rejected both times8 336 335 1 2nd time accepted
So why does it happen?According to QC the checkweigher resets itself every 5 or 10 mins depending on the settings. Resetting according to QC works like this: if the mean weight of the meals passing through is low/high then it will accept the meals slightly low/high in weight specs. This could be the possible reason for the checkweigher accepting rejected meals second time around or maybe there is some other factor.
The operators had a different view on this problem. They say that the target weight changes as per the giveaway percentage, which is the amount of weight over or below the target weight of the final meal. They add that this giveaway rate adjusts every so many meals. They added that it is only the target weight that changes and not the lower or higher limits set for the meal. Therefore the meals below the specification should not be accepted under any circumstances.
2. Chicken and Beans: Chicken and beans are mixed and dropped together into the plate. The combined weight target is 49 grams (Table 6). QC randomly checks the weight of samples after the checkweigher to verify if the meals are within specifications. The samples recorded on the day were within the specification.
Table 6 Chicken HotpotIngredient USL LSL TargetSauce 192 178 185Potato Mesh 100 88 94Chicken 34 24 28Beans 27 15 21Bean & Chicken
61 39 49QC Sheets 360 312 353Rework 360 320Checkweigher 360 312
The mixed chicken and beans are dispensed by Ishida. According to QC, the weights of the combined drops are within the specifications but there is inconsistency in the individual weight of chicken and beans in the samples. QC feels that if they were added separately the weights of each product could be more accurate. At the base of Ishida there is a feeding vessel from which the frozen fillings (chicken, bean, etc.) flowed into the Ishida bottom collector. On several occasions the opening at the bottom clogs which stops the flow of materials into Ishida. When this occurs, it makes a vibrating sound to alert the operators to stir it so the flow can return to normal.
Examining the motion of Ishida buckets dropping into the plates it was found that some of the fillings bounce off the plate. The fillings being dropped are in a frozen state and the position of buckets from which they get dropped in the plates is high.
Experiment 2: According to OPs, the maximum number of meals passing through checkweigher in a minute is 100, so the checkweigher should be capable of rejecting upto 100

meals/minute. An experiment was conducted to test the rejection capability of the checkweigher. To pass 10 meals at the speed of 100 meals/min, the time of opening is 6 seconds. So, the plan of experiment is to place meals on line in such a way that 10 meals pass through the checkweigher in 6 seconds. If all the meals get rejected, it will validate the checkweigher to be capable of rejecting up to 100 meals a minute. 10 underweight meals were placed simultaneously, and observations are shown in Table 7.
Table 7
Trial no
Total out ofspec meals
No of meals
Result Timetarget
Time taken Comments
1 10 10 All mealsrejected
6 seconds Unable tokeep track
Could not keep track of time between meals while observing the experiment
2 10 10 All meals rejected
6 seconds Unable to keep track
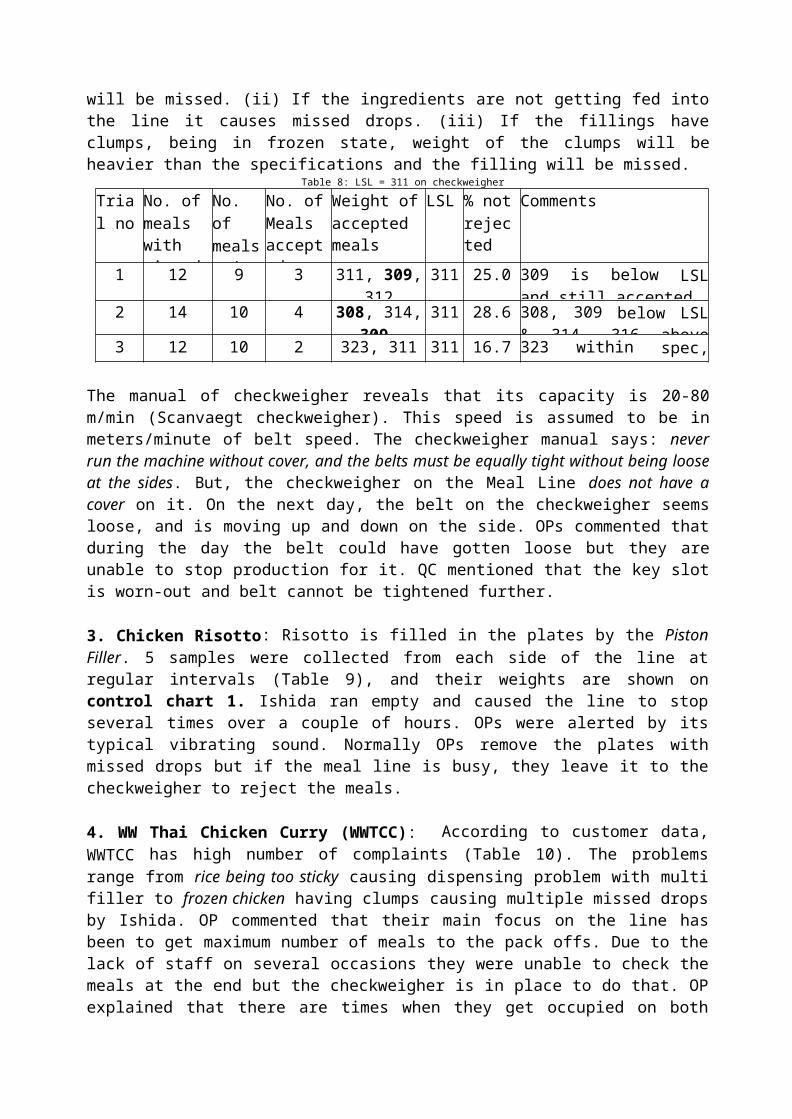
Experiment 3: Missed drops from Ishida: The purpose of this is to check if the checkweigher rejects the meals with drops missed by Ishida. The Operator made Ishida miss fillings on purpose. We expect the meals (with the missed fillings) to be below the LSL and should be rejected by the checkweigher (Table 8). For higher confidence level of accuracy it is suggested that more observations are taken. In spite of missing the drop weight of 28 gms (target weight in Table 6) of chicken, some of the meals were within the specification limits.
According to the operators, the line would automatically stop only if Ishida misses 5 drops in a row. So if Ishida was to miss up to 4 drops in a row, line will continue to run. The operators believe there are many reasons that contribute to the missing drops: (i) If the weight in the final buckets is too heavy, drop will be missed. (ii) If the ingredients are not getting fed into the line it causes missed drops. (iii) If the fillings have clumps, being in frozen state, weight of the clumps will be heavier than the specifications and the filling will be missed.
Table 8: LSL = 311 on checkweigher
Trial no
No. ofmeals with missed
No. ofmeals rejected
No. ofMeals accepted
Weight ofaccepted meals
LSL % notrejected
Comments
1 12 9 3 311, 309, 312 311 25.0 309 is below LSL and still accepted
2 14 10 4 308, 314, 309,316
311 28.6 308, 309 below LSL & 314, 316 above LSL
3 12 10 2 323, 311 311 16.7 323 within spec, 311 on LSL
The manual of checkweigher reveals that its capacity is 20-80 m/min (Scanvaegt checkweigher). This speed is assumed to be in meters/minute of belt speed. The checkweigher manual says: never run the machine without cover, and the belts must be equally tight without being loose at the sides. But, the checkweigher on the Meal Line does not have a cover on it. On the next day, the belt on the checkweigher seems loose, and is moving up and down on the side. OPs commented that during the day the belt could have gotten loose but they are unable to stop production for it. QC mentioned that the key slot is worn-out and belt cannot be tightened further.
3. Chicken Risotto: Risotto is filled in the plates by the Piston Filler. 5 samples were collected from each side of the line at regular intervals (Table 9), and their weights are shown on control chart 1. Ishida ran empty and caused the line to stop several times over a couple of hours. OPs were alerted by its typical vibrating sound. Normally OPs remove the plates with missed drops

but if the meal line is busy, they leave it to the checkweigher to reject the meals.
4. WW Thai Chicken Curry (WWTCC): According to customer data, WWTCC has high number of complaints (Table 10). The problems range from rice being too sticky causing dispensing problem with multi filler to frozen chicken having clumps causing multiple missed drops by Ishida. OP commented that their main focus on the line has been to get maximum number of meals to the pack offs. Due to the lack of staff on several occasions they were unable to check the meals at the end but the checkweigher is in place to do that. OP explained that there are times when they get occupied on both ends of line. They do checks by themselves but the weights of the fills are tested by the QC and the results are relayed to them.
Table 9: Chicken RisottoIngredient USL LSL TargetRisotto 305 288 300Chicken 35 24 28QC Sheets 340 312 328Rework 340 320Checkweigher 340 312
Table 10: WW Thai Chicken Curry
Ingredient USL LSL TargetGap
Rice 112 102 108Chicken 35 23 29 12Sauce 171 159 165Beans &Peas 39 19 28 20QC Sheets 360 312 48Rework 360 320 40Checkweigher 360 312 48
A change was made on the line affecting the motion of the belts. The entire belt would stop if the belts after the rejecter stop for any reason. The purpose of this change is to stop meals from building up and pushing their way through the rejecter. The sensors have tripped off few times stopping the entire line. Samples were collected over 3 hours as shown in control chart 2.
Analysis of Observations
Checkweigher: This is the sole mechanism to control the end product. It shows high variations upon testing yet nobody knows the exact cause of the problem. The experiment shows the inconsistency in weights of meals taken by checkweigher and scales (Table 4). The fact that same meals are first rejected and then accepted by the checkweigher indicates the inconsistency on its part (Table 5). There is no cover on top of the checkweigher. Vents of air conditioning and stray wind can cause variations in the weighing process (Kopczynski & Ness, n. d.). The checkweigher manual also suggests never to use it without a cover.
Gap within specification limits: The gap (Gap = USL – LSL) is more than the weights of certain fill ingredients. This gap can be observed from the target weight of the fillings and finished product from Table 10. This means that if the drop of fillings highlighted in the tables are missed and other ingredients are heavier than specified, the meals can get past the checkweigher undetected. For example, in the making of Thai Chicken Curry if the drop of chicken was missed and the rice or sauce is being filled heavier than specification, it is highly likely the meal will sneak past the checkweigher without being rejected.
Impact of target weight: Result of the experiment of placing rejected meals for second time before checkweigher (Table 5) is explained by QC who says it could be due to checkweigher updating itself every 10 minutes which changes its target weight and acceptance limits.
Checkweigher efficiency: Table 8 shows that upto 28.6% of meals with missed drops made through the checkweigher undetected. The average flawed meals that went past the checkweigher is 23.43%. The process is automated and relies on the checkweigher to detect missed drops. We may conclude that out of 100 meals with missed drops, only 77 will be

rejected and 23 will make it to the market as there is no other check point beyond the checkweigher.
Checkweigher validity: Table 7 indicates that the checkweigher is capable of rejecting meals at high speed. However, the meals used were hugely underweight and the checkweigher does perform properly with acutely underweight meals. The meal samples used by QC for testing the checkweigher are quite under and overweight. Even then on some occasions the samples have made past the checkweigher undetected which shows it is not just the process but the checkweigher needs to be improved. Checkweigher validated this way may still be incapable of detecting slightly underweight meals.
Reworks station: At the reworks the meals are placed after the checkweigher. According to OP, to place them before the checkweigher, he will need to use a movable table to move meals and possibly interrupt the line to place them. Observing the pattern of placement of meals after the checkweigher and rejecter, it was noted that they are placed in the gaps between the lots of six meals. Normally the little gap occurs because of the pattern of 6 meals movement by the main sealer. This pattern of gap starts before the checkweigher and follows through. Therefore the meals can be placed before the checkweigher using the same time gap. This will eliminate human errors from reworked meals in weight of ingredients.
Multi fillers: Chart 2 (appendix) shows that both the multi fillers were dropping significantly heavier fills. The observations were made independently and within 3 hours. The sheet used by QC showed all the weights within the specifications. This indicates that the sample size used by the QC is too small to identify heavier meals being processed. Due to the management’s decision, the sample size of fillings was increased from 4 to 10 every half hour. Instead of 2, now 5 samples are taken from each side of the line and weighed. Management intends to designate the OP instead of the QC to record the weights of the meals. Management instructed OP to run the machinery in such a way that the fill weights are on par with the target weight required instead of being anywhere within the specifications. The focus is to document optimum settings of the machinery for particular fills.
Grime on checkweigher belts and its effects: Residue from potato meshed and cheese dropper sticks to the bottom of the meal plates and gets carried to the checkweigher belt. The deposit on the belt has been observed on many occasions but it is not known w hether i t a f f ec ts th e w ei g h ing p r ocess or no t . F e w p a r ticl es al so g e t co ll ected o n t h e edges of the belt as a result of that. According to QC, the only weight that is measured is at the centre of the checkweigher. However, OP demonstrated by using hand compression that the weight on the sides is also measured. The answer to whether the grime and particles contribute to added weight variation is inconclusive.
Mixed fillings: The fillings of chicken and vegetables mixed together, as pointed by the QC, leads to inconsistent amount of both chicken and vegetables into the fill. But it has its advantages also. The combined weight of the drops is heavier than the individual weights of chicken and vegetables. Due to this, if there was a missed drop of this mixture, it is more likely to be detected by the checkweigher.
Ishida: The line gets automatically stopped if Ishida misses 5 drops in a row. It can be reduced to up to 3 missed drops. The issue of clumps is a major factor for Ishida to miss the drops. The clumps are not always easy to find and the operators do not particularly look for them. The clumps get removed by the operators only if they come across any. As the process is highly automated the chances of that happening is quite low. The low efficiency of checkweigher and other factors involved indicate that Meal Line should not fully rely on the checkweigher. The clumps in frozen ingredients should be stopped before making into the fillers.

Rejecter: Instead of rejected meals passing easily onto the reworks table, they collide within the cage of the rejecter. This collision rate is fairly high and has been observed on almost all types of meals. This collision causes spillage of packaging inside the cage.
Piston fillers: The potato mesh is difficult to weigh because of the fillings getting stuck to the plates. The operators try and use heavier fills in the mesh to keep them from getting off the line. However from chart 2 the sauce dispensed is fairly accurate. The data fed into NWA for mesh is not accurate as this weight is derived by using estimated weights of other fillings. The workers at the reworks sometimes try to clear tables in a rush. This may lead to slightly underweight meals getting to pack offs. Throughout the observations no meals processed after the reworks lacked any fillings. Although this suggests the meals were complete, there may still be discrepancy in the quantity of fillings processed at the reworks station. It can be an issue but it does not seem to fit in to the nature of the customer complaints described for this project.
Process capabilityCpk indicates the capability of the process. Cpk = 1 shows that the process meets the capability and Cpk > 1 shows that process is better than specifications required. However, if the Cpk < 1, the products do not meet the specifications (Heizer & Render, 2008, p. 237). Therefore it is ideal to have Cpk value greater than 1. The analysis of the samples collected has shown mixed results. The Cpk of multi filler 1 is between -0.33 and 1.11, and Cpk for multi filler 2 is between - 0.95 and 1.17. Cpk over 1 is good but in most instances Cpk < 1 or sometimes even negative. The multi fillers, piston filler and Ishida, all have low Cpk values, indicating that most of the fillers have a big room for improvement. This means the process is out of control, and serious changes need to be made on the multi fillers.
Multi fillers are the starting point for the fillings in the meal, and they are not operated to the specific requirements of fill weights. If the fillings done by the first filler is heavy then the rest of the machinery may have to be altered for adjustment of remaining weight. This could, however, alter the fill weights of other ingredients. If they continue to run heavy then any missed drops are unlikely to be detected by the checkweigher and will add to the customer complaints of missing ingredients.
ConclusionsThe process related questions and their answers are as follows: (a) Is the process rejecting the correct meals? Yes, it is rejecting the correct meals. (b) Is it rejecting all of the required meals? It is not rejecting all the meals that it should. (c) If it doesn’t reject correctly, what is the root cause? The checkweigher has high variation in its testing which causes underweight meals to be read wrongly as within the specifications. The difference in the USL and LSL of the finished meals is such that if a drop of some ingredients is missed, it will not be detected by the checkweigher. It does not help that the weights of the fills have very high variation. Some of the ingredients in the meal are being filled very heavily, contributing to the problem. (d) What causes the reject arm to jam up? The belt on which the arms are mounted gets jammed sometimes. (e) Do meals bounce back on the line after being rejected? No meals were observed to be bouncing back on the line but they do collide inside the cage and bounce back towards the rejecter arms. (f) What is the root cause of this? It has been observed to occur due to low space for meals to pass through because of the mounted cage on top of rejecter. (g) When the reject table is full, do the sensors correctly trigger the conveyors to stop in the correct sequence? Yes. (h) What actions should be taken to error proof the checkweigher and reject system? As explained in recommendations. (i) Do we need to make changes to our control systems? Yes.

Further improvements are needed in the entire process so the fill weights being dropped in the meals are within the specifications. Initiatives taken for improvement include new sensors for rejecter, plates around Ishida dispenser and recently weighing of samples by the operators. Other areas that need improvement are: missed drops by Ishida due to clumps of frozen ingredients, and inability to accurately measure the fills of potato mesh by piston fillers.
The improvement in the process should be backed by high capability rejection process as just the awareness of the workers would not be enough. On an average, 23% of the meals that should be rejected could be making it to the market. The rejection process is largely automated and raising its current capability is essential.
The progress in process capability may not bring the same amount of improvement in rejection ability. In fact there may not be much influence of the improvements in the fill weights on the accuracy of rejection process. As long as necessary changes to the checkweigher are not made there can be little certainty that all the meals that should be removed are being rejected.
Other issues like: the amount of acceptable variation on checkweigher, whether it should be covered, and whether the grime stuck on belts from time to time contribute to its high variation also need to be addressed.
Recommendationsa) By raising cage on top of the rejecter arms, to the level of cage above the belts (or just above), the number of recoils and collisions of the meals can be reduced considerably.b) Meals altered at rework table should be fed into the line before and not after the checkweigher. There would be no need to stop line for this and it should take the same time as it is currently to place the meals. The only extra time consumed will be the time taken to move meals from reworks table to the point before checkweigher.
c) An expert advice should be sought to address the issues of variation in readings of the checkweigher. A cover should be used to reduce the impact of environmental factors.
d) Customer complaints have mentions of missing fillings (chicken, etc.), which are dispensed by Ishida. The clumps have been identified as the biggest problem by operators and QC on the line. Currently a grill covers Ishida feeder for safety purpose. Instead of the frozen fillings (chicken, beef, etc.) passing under the grill they could be made to pass through the grill with some modification. This will prevent any frozen clumps from entering the Ishida belts. None of the clumps would sneak past the operators while they are attending other jobs.
e) By increasing the lower limit of all the meals on the checkweigher itself, the problem of weight variation could be countered. This may result in few more meals at the rework but will give much higher assurance that meals with missed fillings will not make it to the market. The lower limit could be raised upto 3 or 4 grams which is close to the maximum difference found between weight of meals on scales and checkweigher. For example, if the lower limit of the meal is 311 grams it could be raised to 314 or 315 grams.
f) For future reference and improvement purpose a check sheet should be used by the operators to record the variation of checkweigher during testing. The variations should be recorded twice a day to compare and observe changes in the readings.
ReferencesCudney, E. A. & Drain, D. (2007). Effective use of process capability indices for supplier management. Proceedings of the 2007 Industrial Engineering Research Conference, p.584-589.
Heinz Wattie’s, Our Company (2012). Retrieved 28 February 2012, from

http://www.heinzwatties.co.nz/About-Us/Our-Company
Heizer, J., & Render, B. (2008). Operations Management (9th ed.), p.237, Upper SaddleRiver, New Jersey: Pearson, Prentice Hall.
Kitska, D. Cp and Cpk statistics should be discontinued. Quality Progress. 24(3), p.188-195.
Kopczynski, T., & Ness, D., n.d. Five factors that can affect your weighing system’s accuracy, p. 1. Retrieved 5 March 2012, from http://www.hardyinst.com/newsletter/march2006/weighing%20_accuracy.pdf
Meagher, J. (2000). Process capability: Understanding the concept. Quality Progress, Jan 2000; 33, 1; p.136.
Muthiah, G. (2011). Retrieved from, http://ganeshmuthiah.com/dmaic-explained-under-60-seconds/
Nelson, P., Editorial, Journal of Quality Technology, 24, p.175.
Palmer, K. & Tsui, K. (1999). A review and interpretations of process capability indices. Annals of Operations Research; 1999; 87, p. 31-47.
Appendix
Table 13: Discussion with Operator and Quality Controller on various issuesCheckweigher variationWhen was the checkweigher calibration done last? Officially not required.Did you ever do it? Yes.When? It is not required but I do it sometimes before the line starts.How was it done? It was not exactly calibration but just the readings on empty belts.What was the empty reading on running belt? Average weight = 0; Std deviation = 1.26; min wt = -3.2; max wt = 3.1Is this reading acceptable? No, readings should be close to zero. What is the reason for variation? I do not know.Do you think a daily check sheet to calibrate checkweigher help? Maybe. But it is not required as yet. Cheese Dispenser: Upon pointing to the grime on the belts of the checkweigher.Do you think that this grime on the belt is causing the variations? Maybe.How does get collected on the belt? Takes me over to the cheese dispenser. The cheese just falls off the dispenser even if there is no meal passing underneath. If there is a hold up for a while and we are busy the cheese keeps dispensing. This collects on the belt and under the plates of the meals. It moves along the belt and sticks on the belt of the checkweigher.Meals on LSL: Many meals that pass through have the reading on the checkweigher as 311gms (which is the LSL).Should they be rejected or accepted by the checkweigher? QC: It should be rejected. OP: Not sure.

So, why does it not get rejected? QC: This could be due to the average weight of the meals. If average weight is above target then the meal close to LSL gets accepted. The same happens, when the average weight is below target. The checkweigher updates the average weight every 10 mins.
Control Chart 1
310
305
300
295
Weights
LSL
US
L
290
2851 2 3 4 5 6 7 8 9 10 11 12 13 14 15 16 17 18 19 20 21 22 23 24 25 26
Control Chart 2: For Multi-fillers 1 & 2
135
130
125
120
115
110
105
Multi filler 1
Multi filler 2
USL
Target
LSL
100
95 0 5 10 15 20 25 30

8
Mul
ti fil
ler 2
Mul
ti fil
ler 1
Con
veyo
r bel
t with
pla
tes
Empt
y pl
ates
Plat
e A
ddin
g St
atio
n
The conveyor belt moves from right end to left end.
Meal within spec moving towardspack offs Check
Weigher
Ishida 2 Ishida 1
RejecterArm
Plate (meal) Sealer
Direction of belt movement
Reworks Table
Out of spec, rejected meals
Pocket filler
ReworkPlateSealer
Piston filler 2
Piston filler 1
Cheese dropperFigure 1 Meal Line Layout
Measuring Efficiency in Management Decision Making - Theoretical Analysis and State of Research
Josef Neuert, Faculty of International Business Economics, Fulda University, Germany, Marquardstrasse 35, 36039 Fulda, Germany,
Phone: 0049-661-9640-2551, [email protected]
Christopher A. Hoeckel, Faculty of Economics and Management, University of Latvia, Biberstrasse 19, 83098 Brannenburg, Germany,
Phone: 0049-8034-70588-63, [email protected]
Abstract
In the past many authors (cf. Gzuk, 1975; Hauschildt et al. 1983; Simon, 1997; Witte, 1988) have dealt with the issue of efficiency in management decision making and therefore various concepts were proposed on how to measure efficiency in management decision making. But very few, like Neuert (1984), have covered socio-economic efficiency measures within the decision making process, meaning the combination of economic efficiency measures like benefits, costs, time, etc. in decision making with behavioral efficiency measures of managers (Hauschildt et al., 1983). To give a clearer picture on the current status on how to measure efficiency in management decision making, this paper aims to provide an overview of different approaches and outlines the operationalization of a socio-economic efficiency measurement in decision making processes.
The Notion of Decision Making Efficiency
Organizations and respectively their members are interested in satisfying the purposes and aims of the organization so that at least in an indirect manner their own needs are satisfied. In the case of decision making within the organization, Gzuk (1975) believes the purpose or aim is to reach high quality within the decision making process. For Gzuk (1975), quality in this sense, can be substantiated as an activity to reach a purpose or aim. He refers to activity, in this context, also as efficiency. Gzuk (1975) sees the main purpose in managerial decision making in its relevant economic efficiency. Barnard (1938/1968) describes a personal or organizational action as effective, if a specific desired end is attained or a certain aim is reached. This action can also be considered as efficient if it satisfies motives of that aim. In the case that a certain aim is not reached but the motives are still satisfied, the action may not be effective but still efficient and the other way around. For Barnard, efficiency most likely relates to the satisfaction of motives of individuals in an organization and effectiveness relates to the achievement of certain aims of the

organization. Hauschildt et al. (1983) see the main causes of efficiency of decision making processes by this complexity, mainly displayed by the type of decision (routine decision, decision of mid complexity or innovative decision), the amount of alternatives, and how much information is requested.
For Gzuk (1988), efficiency in general shows, how well a dedicated target is reached with a minimum of resources (output versus input). Gzuk understands, in this sense, the output as tangible or intangible results, and the input as the deployment of mental or tangible resources. For him efficient decisions are characterized by fulfilling the target with a comparatively low amount of resources (input). Simon (1997) describes efficiency more generally as the ratio between input and output. For commercial organizations, which are generally guided by profits, the criterion of efficiency is the yield of the greatest net income. The simplicity is related to the fact that money provides a common understanding for the measurement of efficiency in terms of output and income. But this concept needs to be expanded for specific activities in commercial organizations (e.g. personell department) or for non-commercial organizations where factors are involved which cannot be directly measured in monetary terms. For Simon (1997), to make an efficient decision, it is necessary to have empirical knowledge of the expected results that are associated with different alternative and possibilities. Neuert (1987) supports this view. He believes that efficiency can be characterized as an expression of a performance rate (output-input relation) and “quality”. He explicitly differentiates the term effectiveness from efficiency. For him, effectiveness characterizes whether a measure is in general suitable to achieve a certain target. In this case efficiency can be seen as the “quality level” of the results within the decision making process. In the context of decisions, Gzuk (1975) sees efficiency as the degree of which a purpose is reached containing two additional conditions: first, the purpose is reached with a minimum use of resources (economic input) and the result of the decision ensures a problem solution which lasts for a longer period of time. It seems not to be enough to measure the efficiency of a decision by itself rather than the outcome of a mental or tangible activity (cf. Bronner, 1973, Gzuk, 1975).
Efficiency within the organization can also be reviewed by different approaches. Within the target approach, organizations have explicit targets and efficiency can be defined by the degree of target achievement. The systems approach considers, besides the targets, also the structures and processes of the system-environment relationship. Efficiency in this case evolves from a “concrete”, uni-dimensional to an “abstract” and multidimensional construct. The organizational member approach considers the interests of the external stakeholders. An organization in this sense is efficient when the expectances of these members satisfied or fulfilled. Closely related to the organizational member’s approach is the interest approach. The interest approach assumes that evaluating the same object will lead to different efficiency evaluations due to different evaluating persons and their individual value and preference structure as well as to their different interests. The management audit approach is a more application orientated approach. Within the management audit approach the organizational efficiency is determined by evaluating the organization through analyzing certain “parts” of it in periodical intervals with relevant questions and by variance analysis (budget-actual) of the key indicators (Grabatin).

Dimensions and Approaches of Decision Making Efficiency and Efficiency Measurement
Decision making in business management can be characterized by different dimensions of decision efficiency. Neuert (1987) describes as one dimension the material efficiency, where the measurement is a “realistic” input and output comparison in “commercial” activities which can be measured by objective criteria like earnings, profitability, growth and financial independence. Bronner (1973) refers to this part of efficiency as the economic efficiency. As it seems undisputed that the individual behavior also has a major impact on the decision making outcomes, the individual efficiency can serve as a further dimension of the decision making efficiency (Neuert, 1987). For Neuert (1987) in contrast to the material efficiency, the individual efficiency shows rather subjective results of the decision making processes. As “subjective results” he understands expected team outcomes, identification with the team work, self reflection of the group behavior and the individual role within the group. In sum, he characterizes the individual efficiency as the subjective evaluation of the decision makers concerning the results of their decision making process as well as the self reflection on their behavior during the decision making process. Bronner (1973) supports this view. For him it is also not possible to measure the individual efficiency on an objective base. He advocates measuring it via the personal activity of the decision maker within a decision making group and the satisfaction of other group members with his activity, in addition to the estimation of the overall achievement of the decision making group. For Bronner (1973), within the decision making process, time or time pressure is usually an influencing factor. He believes, there is also a dimension of “temporal” efficiency. “Temporal” efficiency again is an objective criterion because it can be measured by time. For Bronner time, in this sense, can be a direct measurement (e.g when trying to reduce lead time in a process) or an indirect measurement (e.g. measuring not quantifiable deployment of persons or material in rather complex mental processes).
Grabatin (1981), reviewing efficiency from an organizational perspective, splits the total efficiency into different efficiency dimensions. For him, the dimensions are the “general” economic efficiency, the efficiency of the internal system, which includes indicators to evaluate organizational processes and the necessary constrains for the realization of the organizational efficiency. Typical criteria for the general economic efficiency (for Grabatin) are turnover, profit, market share, etc. For the necessary constraints he picks criteria like flexibility, growth, communication, etc. Grabatin splits the internal system efficiency dimension again into various dimensions, like the efficiency of the organizational structure, the efficiency of the task fulfillment and socioeconomic efficiency factors. For the socioeconomic efficiency, Grabatin introduces efficiency criteria like satisfaction of individuals, motivation, etc.
According to Nutt (2008), decision makers in real life business report that rapid actions are a key factor for them. In this case he sees the duration of the decision making process as a relevant indicator for measuring efficiency. On the other hand, efficiency also depends on the “quality” of the decision and this also needs to be taken into account. In this sense the duration is measured by the elapsed time from the point of recognition until the time when the decision is adopted or abandoned. To Nutt objective indicators to value the quality of the decision are preferred. But as they are mostly difficult to collect and they need to be converted into common metrics and those

conversions again can be argumentative and hard to describe, he advocates for measures by informants who subjectively estimate the values. Therefore the quality of the decision is rated by an anchored rating scale using five anchors. A rating of 5 (outstanding) is to be given to a decisive contribution which provides an exceptional quality. A rating of 1 (poor) is to be given to a decision which had no impact or merit. The rating of 4 is termed good, the rating of 3 is adequate and the rating 2 is disappointing. To avoid the fact that decision makers can make self serving estimates on rating the quality of the decision, Nutt advocates that only two secondary informants value the quality of the decision. These two informants value the quality of the decision independently along the rating scale and without discussion. To enhance the precision of rating the quality and move the subjective estimates to a rather true value, Nutt introduces the estimate-discuss-estimate (EDE) procedure. He therefore computes the initial results and then has them discussed by the informants. When the individual results are far off, the informants need to explain this with compulsory arguments, which are then weighted. Taking the average out of the second rating with weighted arguments seems, for Nutt (2008), to raise the rating toward a true value.
To define the concept of efficiency by Gzuk (1975) it is necessary to have a purpose or aim, a realized output or result and an input or the use of resources. For Gzuk (1975), to achieve efficiency in the decision making process there are two conditions which need to be fulfilled: first, a decision must realize the most efficient ratio between output and input and second, a decision must bring results which ensure that the aimed objectives will be achieved. To operationalize the measurement of efficiency in the decision making process, Gzuk (1975) advocates establishing a multi dimensional indicator model (Figure 1). This multi dimensional indicator model contains four efficiency dimensions: The target-output relation, the input-output relation, the target-input relation and the provision for the realization of the decision. Within those efficiency dimensions indicators need to be established to enable the operationalization of the model which then allows the measurement of the “total” efficiency of a decision (Neuert, 1987). To achieve an acceptable certainty on the measurement of efficiency, Gzuk (1988) advocates that for each dimension there should be more than one indicator.
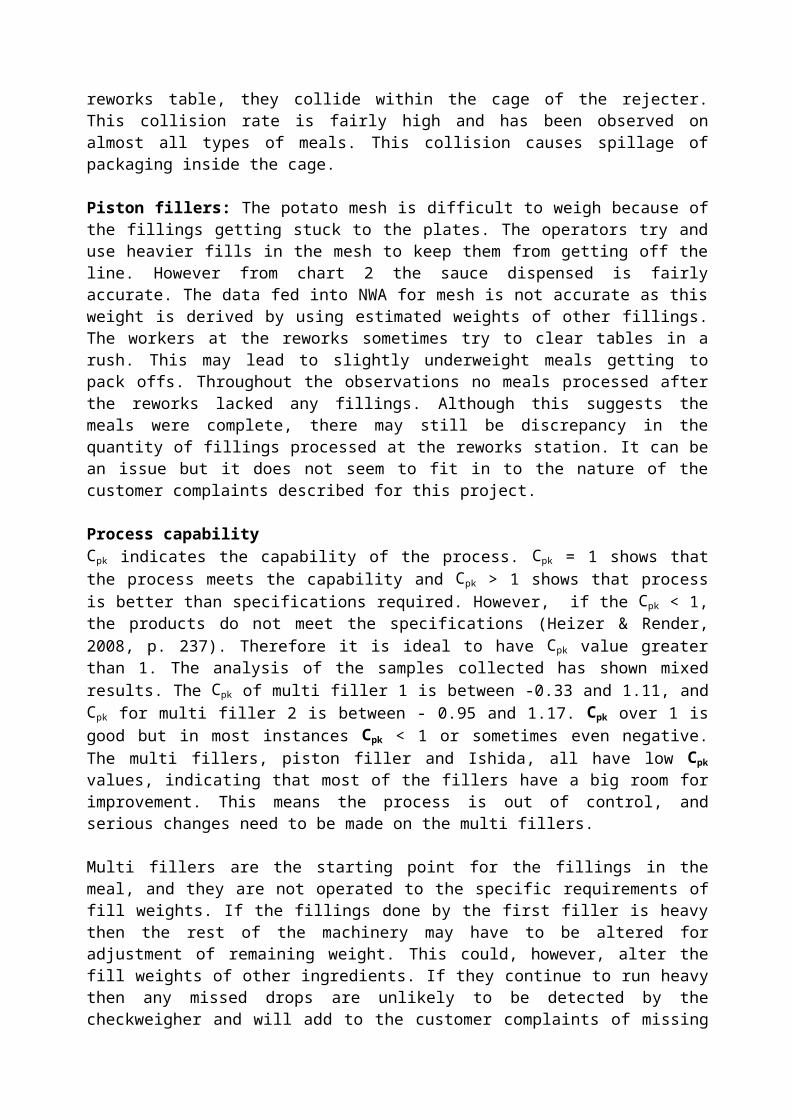
Figure 1. Multi-dimensional indicator model for the efficiency measurement
By definition the decision making process can be understood as a target orientated process (target-output relationship) where from a current/actual state we aim to reach a future/target state. In this sense the decision making with its various sub processes can be seen as a formal instrument for solving problems by taking choices when selecting between alternatives (Gzuk, 1975). The comparison between those alternatives can be described as formal efficiency. The level of the formal efficiency can be determined by comparing the aimed target or the desired situation with the current situation. In this sense a higher coincidence between the targeted and the current state/situation indicates a higher efficiency and in turn a lower coincidence between the targeted and the current situation indicates a lower efficiency.
To measure the total efficiency Neuert (1987) has modified the multi dimensional model of Gzuk (Figure 2). In Neuert’s multi dimensional model there are three relevant dimensions, the formal efficiency, the material efficiency and the individual efficiency.
Figure 2. Modified multi dimensional indicator model for the efficiency measurement
Each dimension can have from one to several efficiency criteria. A criterion for the formal efficiency could, for example, be the comparison between a targeted situation and the actual situation. The formal efficiency in this case reflects more the qualitative aspect of the decision making efficiency. In turn, the material efficiency reflects more the quantitative part of the decision making efficiency. Management science has created a series of key indicators to display the material efficiency in decision making. Mostly these are measures which indicate economic achievements as input-output relationships with performance indicators like profitability, costs and returns or costs and benefits. The formal and the material efficiency rather deal with the “hard facts” and reflect more the economic and therefore the “objective” detectable and

reproducible side of the decision making. The individual efficiency reflects more the socio-psychological and “subjective” part in decision making and therefore deals with results which can be considered as “soft facts” and are related to the emotions, feelings, acceptance and satisfaction of individuals. From a more general view the authors see the individual efficiency here as the subjective expectance of the decision maker when comparing the factual results and the formerly planed results after the decision making processes. The individual efficiency is more characterized by the decision makers hope to fulfill the expectation. The individual efficiency in this sense can also be described as the satisfaction of the decision maker concerning the achieved results (Neuert, 1987).
The classification of the three efficiency dimensions (the formal, the material and the individual efficiency) seem to provide a relevant concept to measure various dimensions of efficiency in the management decision making processes. The single efficiency dimensions are suitable to measure special aspects of the decision making processes under a certain view but still need to be combined to result in a comprehensive efficiency concept, the total efficiency. There are various concepts being developed (cf. Grabatin, 1981, Gzuk, 1975, Neuert, 1987) on how to combine the different efficiency dimensions to satisfy the efficiency concept and to achieve the total “socio-economic” efficiency. Grabatin (1981) advocates an “efficiency analysis of the organization” as an approach to determine the efficiency of organizations in general. In this case he defines an n-dimensional area which is limited by negotiated tolerance (target) limits. As satisfying solutions are in the focus instead of optimal solutions, the tolerance or target limits frame a valid solution space which then can be defined as the area of the efficient organization. Neuert (1987) criticizes this approach, as tolerance (target) limits always need to be known, which does not seem to be the case in reality. Grabatins concept also does not give the possibility to weight the efficiency dimensions differently. Gzuk (1975), in his approach, defines an algorithm for the construction of the total efficiency index, where the total efficiency of a decision is measured by the positive discrepancy of the worst possible efficiency profile. As in this approach the possibility to weight different dimensions of efficiency is up to the user, this concept also does not seem to be suitable for the real life business. Neuert (1987) has conducted a survey, taking a representative sample from the business management population, to evaluate the weighting of different efficiency dimensions as they are present in reality to setup a “amalgamation” concept. The evaluation indicated the material efficiency with a 70% weight, the formal efficiency with a 20% weight and the individual efficiency with a 10% weight.
Exemplary Excursus: Decision Efficiency Distribution Measurement
From an empirical point of view the question arises, how decision making efficiency is comprised of not only from a theoretical angle but particularly how it is “shaped” in “real world cases”. In this context, it is of special interest if in reality business decisions are made according to the requirements of rational conduct and/or to which degree actual decision making behavior and decision making efficiency deviate from the ideal decision making/decision efficiency function, assuming that increasing degrees of decision making rationality induce increased levels of decision making efficiency (cf. Isen, 2008).

The data sets gained from an own laboratory experiment, conducted by Neuert (Neuert, 1987) and replicated in 2007 (in a slightly modified way, Neuert, 2010) provide the following empirical findings:- There is indeed a functional relation between the degree of rational behavior and the degree
outcomes efficiency in strategic business decision making processes;- however, there is no linear relation observable, but a degressively shaped function,
approximately depictable by a second degree function(y=a+bx+cx²…);- in addition, by standardizing the described regression function, it is empirically obvious that
none of the “tested” decision makers within the experimental sample shows a decision making behavior with a degree of less than ca.20% of “standard rationality”, but also none of them exceeds a degree of more than 80% “standard rationality”;
- also, the degree of decision making efficiency is indeed shaped along the expectations of the formulated degressive regression function, suggesting that none of “tested” decisions was either “totally inefficient” or “totally efficient”.
Given those experimental findings, there is-in particular- another research question evolving, reasoning whether any kind of typical distribution patterns concerning business decision making behavior (and thus decision making efficiency) can be theoretically developed and empirically observed.
Dealing with this research question we utilize the analytical procedures of the Lorenz-curve and the Gini-coefficient in order to form a hypothetical outline of a “generalizable” decision making efficiency distribution and to empirically examine the actual “concentration measures” of the “distributive patterns” of decision making outcomes (Krapp & Kraus, 2013).
Applying the Lorenz-curve approach to our research question, it suggests that the actual distribution of decision making efficiency outcomes within a “population” or a sample of real world decisions more or less strongly deviates from a linear distribution, based on the notion that decision efficiency is “equally” distributed over a sample divided into quintiles (cf. Cowell, 2011). The Lorenz-curve indicates the actual concentration or dispersion of the decision making efficiency measures within the specific quintiles (i.e. 20% of the sample efficiency “very low” up to20% “very high”) in comparison to the 45-degree line of the coordinate system, depicting the accumulated portions of the sample quintiles of the decisions made on the x-axis, and the respective accumulated average degrees of decision making efficiencies on the y-axis (Krapp & Kraus, 2013).
In order to measure the actual distribution of the empirically gained decision efficiency data within our experimental sample quintiles, we utilize the concept of the Gini-coefficient (GC).The GC measures the areas between the 45-degree y/x-linear line and the “empirical” curve, gained by the experimental data of decision efficiency assigned to the respective sample quintiles.
The experimental data are based on a sample of advanced business students (n1=65) and a “reference” sample of business managers (n2=16) with a total sample size of 81. All of the experimentees had to fulfill 4 strategic business decision rounds each, ultimately providing an overall sample of ca. 320 single decision making measures pertaining to the respective degrees

of decision making rationality and the respective degrees of decision efficiencies as well (Neuert, 1987).The results were the following ones:- The average degrees of decision efficiency vary between 0.2 (meaning 20% of the optimal
decision making efficiency) and 0.8 (80% of the optimum);- those data represent the following distribution of the average decision efficiencies within the
sample quintiles (Qn):Q1=0.2; Q2=0.4; Q3=0.5; Q4=0.6; Q5=0.7);- the accumulated decision efficiency averages are Q1=0.2; Q1-2=0.3; Q1-3=0.37; Q1-4=0.42;
Q1-5=0.48.
In order to compute the Gini-coefficient (GC) for our empirical efficiencies distribution, we have to take into account that the “45-degree” line starts out at the 0.2 level on the y-axis and ends at the 0.8 level on the y-axis, because the actual data do neither “deceed” nor exceed the 0.2 resp. the 0.8-echelon.The linear line has to be shaped accordingly and the efficiency average values have to be modified by a 0.2-subtraction as well, accordingly. Thus, the actual modified values read as follows: Q1=0; Q2=0.1; Q3=0.17; Q4=0.22; Q5=0.28. Finally, the relative contribution of each quintile to the overall decision efficiency of the experimental sample has to be computed. Therefore, the single experimentees (n=81) degrees of decision efficiencies per round have to be added up and assigned to each quintile in relation to the total sum of decision efficiencies (x% for each of the 5 quintiles as a relation between the total sum of 320 single efficiency measures divided by the sum of each relative quintile for n=81 that means 16 “lowest” efficiencies up to 16 “highest” efficiencies. The “shares” of each quintile are as follows: Q1=8%; Q2=12%; Q3=40%; Q4=30%; Q5=10%. This empirical distribution approximates a “normal distribution”. The following table depicts the development of the GC:
Table 1. Gini-coefficient of decision efficiency distribution
1 2 3 4 5Cumulated portion of decision makers (n=81) in % 20 20 20 20 20
Standardized cumulated average decision efficiency degree 0.0 0.1 0.17 0.22 0.28
Relative "share" of decision making efficiencies per quintile (p) 0.08 0.12 0.40 0.30 0.10
Quintiles
Gini-coefficient computation:
(1)

The GC of 0.09 suggests that the distribution of decision making efficiency in our experimental sample shows a fairly equal dispersion of “low”, ”average” up to “high” degrees of decision efficiencies and thus represents a normal distribution of decision making performance.
The concept of the Lorenz-curve and the Gini-coefficient can be further demonstrated by the following graphical representation:
Figure 3. Empirical decision efficiencies and Lorenz-curve
The Lorenz-curve approach and the Gini-coefficient represent one possible concept-among various others (cf. Newell et al., 2011) to measure the distribution of decision making efficiency and decision making rationality, based on the assumption of “rational choice” behavior and in comparison to that the respective deviation of “actual conduct” in “real world” decision making processes.
Remaining Operationalization Issues of the Measurement of Decision Making Efficiency
Management science has created a series of key indicators to display efficiencies in decision making. Mostly these are measures which indicate economic activities as input-output relationships with performance indicators like profitability, costs and returns or costs and benefits (Neuert, 1987). So whenever profitability, costs or returns can be brought into relationship with decision making effort these indicators seem to provide a valid base to measure

management decision making efficiencies. But especially in complex environments or decision making situations where rather qualitative issues are addressed it sometimes seems rather difficult to directly measure costs and returns. In this context the time consumption of the decision making process, as an indirect measure for costs, can serve as a suitable indicator for the material efficiency (cf. Bronner, 1973, Nutt, 2008). As the time as a measurement indictor does not give any indication on quality of the decision making process, which is also a main criterion of efficiency (Gzuk, 1975), the measurement of the formal efficiency can give an indication on the quality of the decision making process. The formal efficiency in this case can be measured by comparing the results of problem solutions to the “optimal results”. The formal efficiency in this case can either be evaluated by quantitative facts like a calculation, if it pertains to a rather mathematical task, or by an expert’s solution, if it pertains to a rather qualitative task.
The socio-psychological efficiency can be represented by the individual or personal efficiency and represents the more “subjective part” within the decision making process, dealing with results which can be considered as “soft facts” and are related to emotions, feelings, acceptance and satisfaction of individuals. The individual efficiency is more characterized by the decision makers hope to fulfill the expectation and in this sense can also be described as the satisfaction of the decision maker concerning the achieved results. As in this case it is rather hard or almost impossible to track personal “attitudes” (like satisfaction, self reflection, etc.) by observing participants, the utilization of a questionnaire which contains mainly questions about the personal satisfaction of the participants on solving the problem tasks, how systematic they rate their approach solving the task and how they rate their own cognitive style, seems to appropriate. In this case the satisfaction and acceptance of the decision making behavior of the participants describe their individual efficiency.
Examples of phrases within a questionnaire (Neuert, 1987) could have the following structure:How satisfied were you today with your problem solution process?
very unsatisfied 1 2 3 4 5 very satisfied
To which degree can you identify yourself with the final problem solution?
very little 1 2 3 4 5 very much
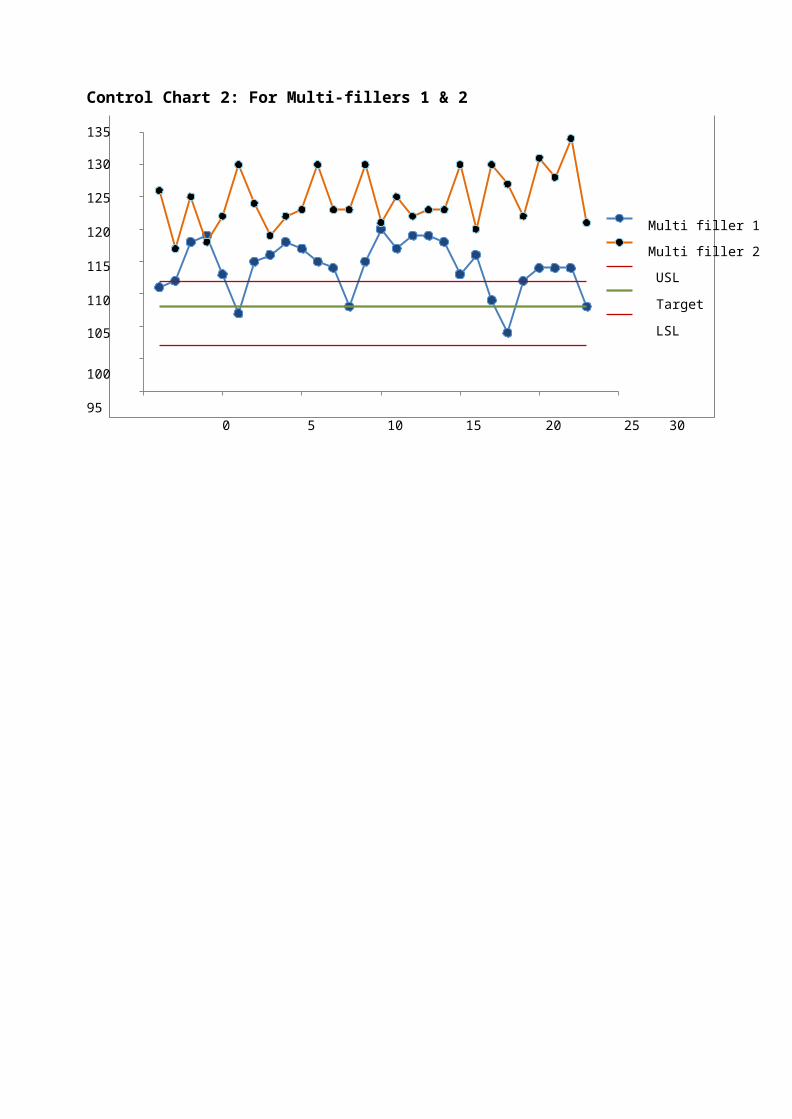
These two questions would measure the satisfaction of the participants concerning their decision making process. According to the needs of the decision making problem the structure of the questionnaire needs to be setup in detail.
Conclusion
Various authors (cf. Gzuk, 1975; Neuert, 1987; Nutt, 2008) in the literature have identified several kinds of efficiency terms and measures, like the material, the formal and the individual efficiency in one or the other way. Therefore, the models of Gzuk (1975) and Neuert (1987) seem to provide a solid foundation for the measurement of decision making efficiencies. Unfortunally, there a not many studies conducted having used this methodology to measure decision making efficiencies and therefore there is not much to compare or to draw deeper conclusions on how these indicators might reflect the “reality”. Therefore more research studies concerning improved measurement approaches of decision making behavior and decision making performance could provide a deeper insight and would allow for creating more standardized “application” how to measure various kinds of decision problem situations and solutions.
References
Barnard, C.I. (1938/1968), The functions of the executive. Cambridge MA, USA, Harvard Univ. Press, p. 334.Bronner, R. (1973), Entscheidung unter Zeitdruck. Tübingen, Germany, Mohr, p. 180.Cowell, F.A. (2011), Measuring Inequality. 3rd ed., Oxford, England, Oxford University Press, p. 233.Grabatin, G. (1981), Effizienz von Organisationen. Berlin, Germany, Walter de Gruyter, p. 341.Gzuk, R. (1975), Messung der Effizienz von Entscheidungen. Tübingen, Germany, J.C.B. Mohr, p. 490.Gzuk, R. (1988), Messung der Effizienz von Entscheidungen. In: Eberhard Witte (Hg.): Innovative Entscheidungsprozesse. Die Ergebnisse des Projektes "Columbus". Tübingen: J.C.B. Mohr, pp. 125–140.Hauschildt, J., Gmünden, H.G., Grotz-Martin, S., Haidle, U. (1983). Entscheidungen der Geschäftsführung Typologie, Informationsverhalten, Effizienz. Tübingen, J.C.B. Mohr, p. 299.Hoeckel, C. (2012), The Impact of Personality Traits and Behavioral Patterns on the Outcomes of Business Management Decision Making – A Framework for an Empirical Study. In: New Challenges of Economic and Business Development Conference Proceedings, Riga, Latvia, pp. 259–269.Isen, A. (2008), Positive affect and decision making. In: Goldstein, W., Hogarth, R.: Research on Judgment and Decision Making. Cambridge, U.K, Cambridge University Press, p. 768.Krapp, M, Kraus, J. (2013). Konzentrationsrechnung. In: Das Wirtschaftsstudium 7/13, pp. 967-972.Neuert, J.O. (1987), Planungsgrade Eine experimentelle Untersuchung zum Zusammenhang zwischen Planungsverhalten und Planungserfolg. Spardorf, Germany, Rene F. Wilfer, p. 359.

Neuert, J. O. (2010), The Impact of Intuitive and Discursive Behavioral Patterns on Decision Making Outcomes: Some Conjectures and Empirical Findings. In: WDSI Annual Conference Readings, Lake Tahoe, USA, pp. 4471–4496.Neuert, J., Hoeckel, C. (2013), The Impact of Personality Traits and Problem Structures on Management Decision-Making Outcomes. In: Journal of Modern Accounting and Auditing 9 (3), pp. 382-393.Newell, B., Weston, N., Shanks, D. (2011), Empirical Tests of a Fast and Frugal Heuristic. In: Gigerenzer, G., Hertwig, R., Pachur, T.:Heuristics-The Foundations of Adaptive Behavior. Oxford, England, Oxford University Press, p. 872.Nutt, P.C. (2008), Investigating the Success of Decision Making Processes. Journal of Management Studies, Vol. 45, No. 2, pp. 425–455.Simon, H. A. (1997), Administrative behavior. A study of decision-making processes in administrative organizations. 4. Aufl. New York, USA, Free Press, p. 384.Witte, E. (Ed.) (1988), Innovative Entscheidungsprozesse. Die Ergebnisse des Projektes "Columbus". Tübingen: J.C.B. Mohr.
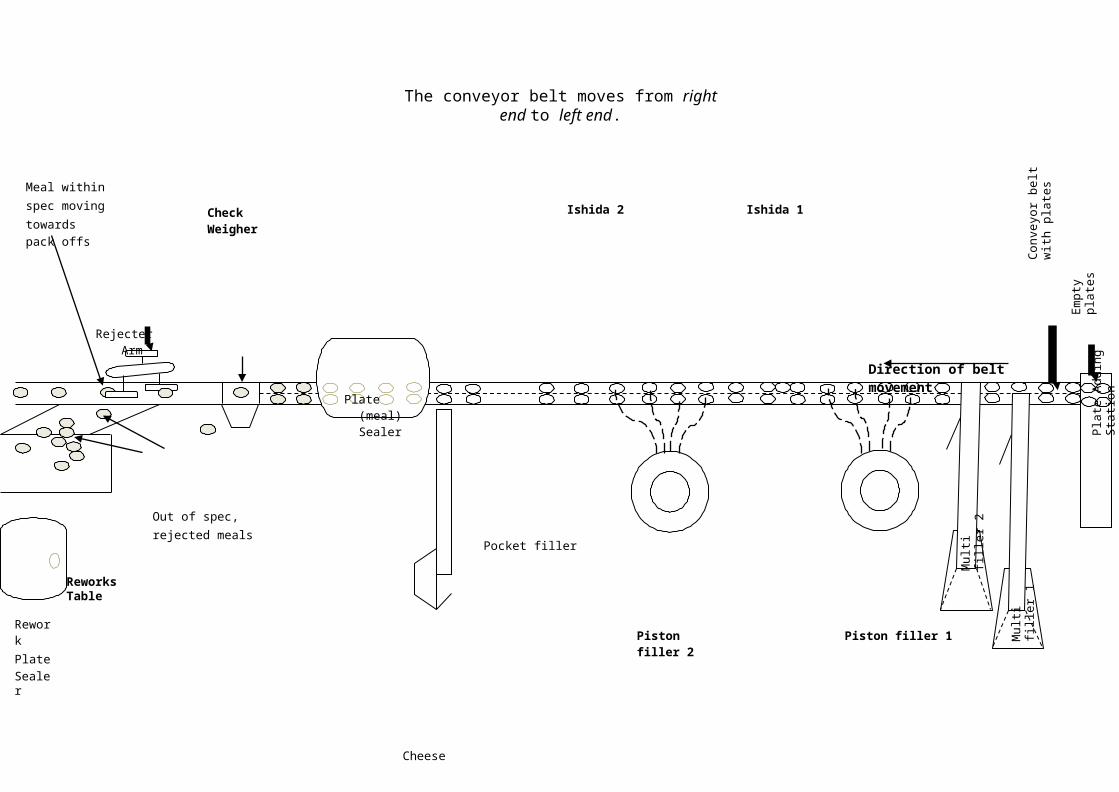
Who Are Mexican Entrepreneurs And Small Business Owners: An analysis of motivation and obstacles?
Nina Radojevich-Kelley, Metropolitan State University of Denver, Campus Box 78, PO Box 173362
email : [email protected]
Abstract
Entrepreneurship and small business have traditionally been key financial chauffeurs for many nations throughout the world. Free enterprise is a perplexing challenge for all countries, but it is especially difficult when a nation is ruled by corruption, or has a wide-spread gap between wealthy and poor citizens, as evident in Mexico. Mexican entrepreneurs tussle with numerous problems from gaining electricity to operate their venture, to registering property, to paying taxes, to enforcing business contracts. Many claim that bribery is widespread, and that government bureaucracy makes it difficult to run their business efficiently. The purpose of this study is to examine entrepreneurship and small business in Mexico. The intent is to understand how Mexican small business owners operate in their country and the obstacles they face. Specifically, the study investigates 64 Mexican entrepreneurs and small business owners. Commonalities in funding a venture are identified, motivations for starting a business are discussed and challenge or obstacles that small business owner face are addressed. Results from the study indicate that the majority of Mexican entrepreneurs rely on equity funding more than debt funding to start their business. In addition, Mexican small business owners use cash as their primary means to fund, then rely on family and friends with few owners using bank loans to finance their businesses. The primary motivation for a Mexican business owner to start a business is for financial independence, with few owners citing personal freedom and pursuing their dreams as primary motivations. In the early years, entrepreneurs in Mexico tend to bootstrap their ventures and borrow money from friends or family. Lastly, they tend to provide services, rather than create or develop new products. The study highlights similarities and differences between entrepreneurs in America and other nations similar to Mexico.

Discussions of Systems Thinking in Books about Toyota Motor CompanyJohn H. Seiler, Rutgers University Mini-MBA Program
Rutgers, the State University of New Jersey, New Brunswick, NJ [email protected]
ABSTRACTThis study used a document and content analysis framework to study reported instances of systems thinking concepts in monographs about the Toyota Motor Company. Since Toyota is a well-known leader in using systems thinking for operations, planning, and customer service, this project aimed to uncover whether details of this complex cognitive and organizational process made it into the secondary literature about the company. The researcher, with an independent second coder, documented evidence of discussion about systems as a thought and decision process deployed purposefully by individual managers or the organization as a whole, as described in a sample of the secondary monograph literature. Results showed that while many detailed ideas of systems thinking were clearly pervasive throughout the company, there weren’t as many instances of their description in the company’s popular legacy as expected. In the future, companies may want to emphasize to researchers, interviewers, and journalists the important theoretical contributions they have made to their industry and to business in general, so that their cerebral efforts are praised in similar degrees to their operational or financial achievements.INTRODUCTION
Systems thinking has become a buzz-worthy topic lately among executives and scholars alike, mainly due in part to the emergence of large data streams and the increased analytical capabilities across a bevy of industries. No longer can a construction company, a taxi service or even a wholesale liquidator say they can make substantial and sound business decisions solely based on simple hunches or past successes. Since data mining has become a more high-volume, high-yield normality in 2013, it too appears that the mechanism for which decisions are being made also needs to be upgraded. Thinking about how a system balances and interacts insures that more than one source of data is taken into account, and that knowledge of ways in which one action affects other components in the system is evaluated before action is taken.
The fundamentals of systems thinking require decision making to become a fluid, learning continuum by which all sets of possibilities and opportunities are acknowledged. By doing so, the individual, company, or institution is able to make informed decisions along several sectors of business simultaneously, and therefore can manipulate this knowledge to his/her advantage. While diagraming a systems platform for day-to-day business tasks can seem simple enough, the adoption and implementation of doing so certainly is not an easy undertaking. This complexity is what researchers inherently find interesting about this topic. Only a select few in the history of business have been able to apply data, theory, and practice into such a sustained amalgam of success.BACKGROUND
The Toyota Motor Company is one of the few entities in today’s corporate landscape provides us with a documented account of both process and achievement. With over 60 monographs written exclusively about the company and its history, and another hundred mentioning the company among its peers, a vast amount of knowledge is available for examination. Also, the author pool provides us with a diverse mix of former employees, industry analysts, historical scholars, as well as a cross-cultural group of Americans and Japanese. It
certainly cannot be overlooked that the largest and most successful automobile manufacturer in the world (with profits of over 900 billion yen in the 2012 fiscal year) uses systems thinking as one of its foundational tools. Furthermore, Toyota has consistently been acclaimed as one the top quality manufacturers of vehicles for decades, surpassing competition whose prices are three times as high. This factor seems to reveal a paradox. How can Toyota charge less for an automobile and still achieve a higher level of craftsmanship over a competitor? Could it be the financial benefit of systems thinking? These are just a few examples which demonstrate why the Toyota Motor Company is a unique case to examine in regards to maintaining a physically and theoretically holistic systems-driven environment.
While Toyota may be the considered the king of the everyman’s automobile, it is also regarded as a pioneer in successful systems thinking implementation. A tenet of Toyota’s systems thinking is their organizational concentration on a program of self-awareness and continual development, called the Toyota Production System (TPS). The active learning that occurs in the TPS allows Toyota to build a foundation of perpetual growth. This progress is evidence that Toyota’s TPS is a monument to systematic learning – a type of learning that started in the company long ago, and as they continue to learn, shows that the performance gap is still growing (Seddon & Caulkin, 2007). Heralded not only as a model for its peers, the Toyota system is so efficient that it has garnered praise as an ideal illustration for the business world itself. In many publications over the last 30 years, the TPS has been lauded as probably the most highly developed, best articulated, and most successful examples of systems thinking applied to business organization in the world (Seddon & Caulkin, 2007). This study begins to examine the ways in which monographs about Toyota capture the aspects of systems thinking which have naturally occurred in the operations and development of the Toyota Motor Company.METHODS & RESULTS
Two independent readers evaluated four foundational books about the Toyota Motor Company. The readers were academic researchers knowledgeable about the concept of systems thinking and familiar with the field of business. The readers also independently coded the monographs via a content analysis framework, marking themes and ideas in the text in a master Excel spreadsheet before comparison. Each reader approached the text with slightly different theoretical constructs of systems thinking. Reader/coder #1 appeared to approach the text from the conceptual frameworks of business authors. Reader/coder #1:
Defines Systems Thinking as an approach for studying and managing complex feedback systems, such as one finds in corporations and other social systems.
Believes Systems Thinking is a set of habits or practices to problem solving in which "problems" are viewed as parts of an overall system, rather than reacting to specific part, outcomes or events and potentially contributing to further development of unintended consequences.
Maintains that Systems Thinking is based on the assumption that a component of a system can best be understood in the context of relationships with each other and with other systems, rather than in isolation.
Theorists which formulated their theoretical lens: Forrester, Senge, Checkland, Sterman
In a similar way, Reader/coder #2 approached the text from the conceptual frameworks of the broader field of education and learning dynamics. Reader/coder #2:
Defines Systems Thinking is a representation of the dynamic between the different or contributing parts of an event, activity, or process.
Believes components of a process function much like Activity Theory, in which all of the elements in balance can be upset by any particular element being out of balance.
Maintains that Systems Thinking is therefore a way of seeing how a change in only one component can affect all of the other components in different ways.
Theorists which helped formulate their theoretical lens: Leont'ev, Engeström, Nardi, Kaptelinin
Although any combination of reader/coders will produce a measure of dissent in content validity when performing an open-coding exercise such as this, the pilot was nevertheless successful. Coder compliance, or agreement on the application of a code which identified a systems thinking concept, has helped to determining how any educated reader might find similar information on this topic in these works.
The table below presents the coding results of the four books our two coders used in this study. The first numerical column inhabits the results of Coder 1and the second column has the data of Coder 2. The third column houses the number of results that both Coders marked similarly for evidence of systems thinking. Additionally, the Total Compliance percentage for each title is represented in the last column.
Table 1. Coding Results for Individual Readers and Compliance on Codes

Books ReviewedCoder 1 Coder 2 Both Total Compliance
Chester Dawson 23 8 8 34.8Lexus: The relentless pursuit: How Toyota Motor went from "0-60" in the Global Luxury Car Market (2004)
Matthew E. May 32 35 22 62.9The Elegant Solution: Toyota's Formula for Mastering Innovation (2007)
David Magee 34 18 13 33.3How Toyota Became #1: Leadership Lessons from the World's Greatest Car Company (2007)
Satoshi Hino 45 30 21 38.9Inside the Mind of Toyota: Management Principles for Enduring Growth (2006)
The results of the table show a striking similarity among three of the four compliance levels at approximately 35 percent. Coder 1 found a higher number of results in these three books which may suggest his/her definition is broader than Coder 2. The May book, with a compliance level of 63 percent, is the most unusual of the group in both compliance and trend. While the compliance is much higher than any other selection, the number of results from Coder 2 is greater than Coder 1 in this singular instance. It is unknown if further study with more selections may reveal the May book to be an anomaly. While this study did not factor in total page or word counts against sheer results, the Dawson selection did yield the lowest volume of examples by both Coders. CONCLUSION
The reverence for Toyota does not end with its ability to perpetually learn and extend profits vertically, as the last 15 years have recognized TPS’s lateral suppleness in a multitude of departments as well. Many authors have noted that in terms of its manufacturing capabilities, Toyota’s TPS is famous for its shift from the flexibility-and-efficiency tradeoff in order to attain both superior flexibility and efficiency in operational processes (Yang & Liu, 2008). Moreover, Toyota’s systems thinking culture has introduced a variety of progressive systems that may be adopted on a variety of levels (in totality or à la carte) by competitors and admiring industries alike. The TPS system has been termed “ambidextrous,” yielding a bevy of associated tactics including: lean operations, Just-in-Time, pull system for defects, total quality control, and kaizen (Yang & Liu 2008).
One item that appears to be in dispute is whether or not the adoption of such a vast system as that of Toyota’s is even possible for others. Some scholars believe that even with the abundance of information readily available on TPS and the Toyota culture, “it is now almost

impossible for its U. S. rivals to catch up” (Seddon & Caulkin, 2007, p. 13). Does this mean that companies in direct competition with Toyota have no chance of succeeding at their level? Or does it mean that any company that wants to follow Toyota’s principles of systems thinking must also follow a strict diet of processes and procedures? Another view points in the direction of compartmentalizing ventures into smaller battles in hopes of one day winning the automobile war. Yang and Liu (2008) note that “although it currently seemed almost no company outside Toyota’s family has ever been able to match Toyota’s systematic and continuous improvement in quality and cost competitiveness, Western companies have shown impressive improvements in operational performance such as inventory management in 1990s” (p. 3). A salient argument here is that the systems thinking culture seasoned at Toyota is transferable to external companies to some extent -- even if it cannot be argued that the entire matrix of idiosyncrasies can be. Even scholars themselves are perplexed by the apparent failure by some to adopt these topics in their boardroom meetings, “it is something of a mystery as to why these disciplines have not been applied more widely” (Seddon & Caulkin, 2007, p. 9), nor, as evidenced via this research, documented more widely when the opportunity arises.
REFERENCES Dawson, C. (2004). Lexus: The relentless pursuit: How Toyota Motor went from "0-60" in the
global luxury car market. Hoboken, NJ: John Wiley & Sons.Hino, S. (2006). Inside the mind of Toyota : management principles for enduring growth.
New York, NY: Productivity Press. Magee, D. (2007). How Toyota became #1: Leadership lessons from the world's greatest car
company. New York: Portfolio. May, M. E. (2007). The elegant solution: Toyota's formula for mastering innovation.
New York, NY: Free Press.Nielsen, K. A., & Nielsen, J. A. (2009). Systems thinking: Understanding services as a system.
Dethinking Service Rethinking Design: First Nordic Conference on Service Design & Service Implementation. Oslo, Norway, November 6-9.
Seddon, J., & Caulkin, S. (2007). Systems thinking, lean production and action learning. Action Learning: Research and Practice, 4(1), 9-24.
Yang, S. J. S., & Liu, Y. E. (2010). Competitive dynamics of business process improvement. Proceedings of the 28th International Conference of the System Dynamics Society. Seoul, Korea, July 25-29.

Legal and Ethical Issues in Teaching about Electronic Business ResourcesMichelle Kowalsky and Susan Fink
Rowan University, 201 Mullica Hill Road, Glassboro, NJ [email protected]; [email protected]
ABSTRACTMany colleges and universities demonstrate a need for awareness about the specific legal and ethical issues encountered by users of their library’s electronic resources. In addition, users need to understand the implicit agreements which govern their use of these licensed resources, although they may seem easily and seamlessly available on the Web. This study performed a recent review of websites of the top business colleges and universities in the U.S. as accessed via their official university web presence. Not surprisingly, they generally demonstrate a lack of user instruction and overall instruction about the ways in which users are able to obtain and use information gleaned from these online databases. Also, the sites do not appear to have any technological means, such as agreement or warning screens as we do regularly with Title 17 Copyright laws, to remind users of appropriate or fair uses of the information gathered therein. Most do not mention salient details of common but illegal student and faculty use of database information, such as having students download and share industry reports with their internship sites, or using business statistics from library databases wholesale to gain clients for their student start-up businesses without students digesting the data and forming their own analyses. Results of this study suggest recommendations which include interpersonal solutions as well as technical solutions that can help assist the educational community. Describing the ways in which subscription-based database information can be used, and how access or availability alone is not a guarantee of legal and ethical use of licensed resources, become important opportunities to teach about the legal and ethical use of information in a business context.IntroductionThe American Library Association (ALA) has been offering training for their members for the past ten years in dealing with database license agreements and other legal issues associated with providing information to the public. ALA’s Business Reference and Services Section (BRASS) and the College & University Business Libraries (CUBL) Section’s Core Competencies Task Force committee is also currently writing guidelines for core competencies (discipline-specific and task-oriented information literacy standards) for business students. The committee is basing the standards on their own professional experiences, on student and faculty feedback, on broad-based literature reviews, and on identified employer needs. Reference & User Services Association (RUSA) Standards and those of the Association of College and Research Libraries (ACRL) also exist to aid those teaching business students or answering business reference questions in all types of libraries. This paper will examine some of these issues as well as those related to license agreements, access points, and training of staff and students to insure compliance. Database vendors are also helpful in providing training, generating customizable data, or modifying agreements based on institutional needs. More of this type of training is clearly needed at all levels of academia to insure development of legally and ethically sound information habits.Related LiteratureMost colleges and universities demonstrate a need for awareness about the specific legal and ethical issues encountered by users of their library’s electronic resources, as well as the implicit agreements they must uphold in using resources that seem easily available on the Web. Business
degree programs may not have embraced widespread use of library resources such as databases, especially when it comes to involving faculty in collaborative teaching models with librarians. Matthies (2004), Arp, Woodward, Lindstrom, and Shonrock (2006), and Detlor, Julien, Willson, Serenko, and Lavallee (2011) provide a variety of individual examples of university library outcomes of information literacy instruction for business students with a variety of beneficial results. In typical style of the most common information literacy lessons, students in these scenarios were taught how to critically evaluate the content and credibility of their chosen sources, and the benefits of these efforts are too numerous to count. Much effort over a sustained period of time has indeed improved business faculty’s use of the discipline-specific resources that libraries have to offer. However, direct instruction is only part of the legal and ethical discussion about information. Research indicates that libraries need to strive toward a more complex communication of their understandings of database content use by both students and faculty. The present study aims to expand the call for added information fluency by requesting users’ improved facility with the legal and ethical processes surrounding use of database information for a variety of different purposes. Ideally, users would not only think of ethics when quoting sources effectively, but also when using information gleaned from licensed sources for other non-research-paper assignments or on-the-job activities.Related studies have uncovered a variety of issues which make widespread information literacy for business sources difficult to develop and sustain. Dewald (2005) found that business faculty regularly view free Web information sources as acceptable for their own research and for their students’ research, and that business faculty in a large and geographically distributed public university did not strongly encourage the use of subscription databases for their students' research to any appreciable levels (p. 214). Dubicki (2010) found that when business students did request assistance from faculty on assignments, only a few students suggested that faculty provided useful support in finding sources for their projects, and so a full 70 percent of the students who encountered problems in business classes turned instead to their peers for help (p. 373). In the Dubicki study, librarians were only consulted by 28 percent of the students who encountered problems, while family members provided additional help for 24 percent of those students (p. 373). This proves to be in alarming alignment with other studies that explain how many of today’s students see people in their closest social network as “just as useful” or sometimes more useful than experts or professionals to which they have access. In the case of legal and ethical use of information, however, nearest peers may not be the best source of comparison for learning the parameters of ethical information behavior -- the letter and spirit of the law will be the ultimate arbiter of this behavior, not the judgment of one’s nearest social network -- whether at school or in the field.Methodology & ResultsUsing the U. S. News and World Report’s “2014 Best Business Graduate Schools -- Top 25 List,” we reviewed each business school’s university library pages to determine if had any statement or acknowledgement of copyright or license requirements were displayed for the end-users. Researchers specifically started at the library’s main page or business library’s page, looking for some type of article searching or A-Z database list, which would be the starting point for a user’s interaction with these licensed resources. Some institutions listed a specific link including key words such as ‘copyright,’ ‘terms & conditions’ or ‘appropriate use.’ If those or similar terms were not obvious, then researchers would select one of the prominent databases such as ABI-Inform or Academic Search Premier to see if there were any notices which appeared

closer to the point at which the user may have to login (if using it remotely) to access a resource. Ideally, it was assumed that users would be instructed about their appropriate use before or near the point of access. The website reviews took place in late September and October of 2013.Twelve of the 25 institutions (48%) had no obvious warning or acknowledgement to the user about copyright or license restrictions related to the databases provided to them. Four of the 25 institutions (16%) had a vague copyright statement somewhere on the webpages leading to the database access. Two of the 25 institutions (8%) had a statement but it was not easy to find because it was located away from the database access pages. Seven of the 25 institutions (28%) had specific statements about copyright/licensing reasonably close to the point of access. Most universities have statements which identify a general use of network resources by un-authenticated users as prohibited, but it is unclear if this type of warning is sufficient for either teaching or policy enforcement purposes. An institution’s own students and staff have access to resources, so blanket adherence to authenticated use does not cover many of the more detailed questions and issues which arise when users are apprised of their many rights and responsibilities regarding electronically-supplied resources.Unfortunately, most websites do not mention salient details of common but illegal student and faculty use of database information, such as having students download and share industry reports with their internship sites, or using business statistics from library databases wholesale to gain clients for their student start-up businesses, without digesting the data and forming their own analyses and original reports. The scenarios encountered may become useful contextual explanations, or teaching topics, for both online and in-person education of all users. Yet some universities have determined ways to deal with these issues, as uncovered via this systematic investigation.
A few of the better examples are as follows: The University of California at Berkeley provides a clear list of actions that are permitted and
not such as bullet number four under the not permitted – “transmitting, disseminating or otherwise making online content available to unauthorized users.”
http://www.lib.berkeley.edu/AboutLibrary/conditions_of_use.html Duke University also provides clear language for the users and note that it is above the “A-Z
List” in the side menu to help bring attention to it.
http://library.fuqua.duke.edu/dbterms.htm Dartmouth College provides some clear language for their users with the ‘Peer-to-Peer’
wording on their policy and guidelines, but could add a section specifically about database articles and licensed database information.
http://www.dartmouth.edu/copyright/peer2peer/index.html The University of Texas at Austin has a comprehensive of list of policies for the user, but
they are not located at or along the path to access the databases.
http://www.utexas.edu/cio/policiesDiscussionNaturally, we would be interested in seeing more universities, their libraries, and information vendors adopt a more detailed system of alerts and notices to encourage appropriate uses of database content. Our recommendations include interpersonal solutions as well as technical
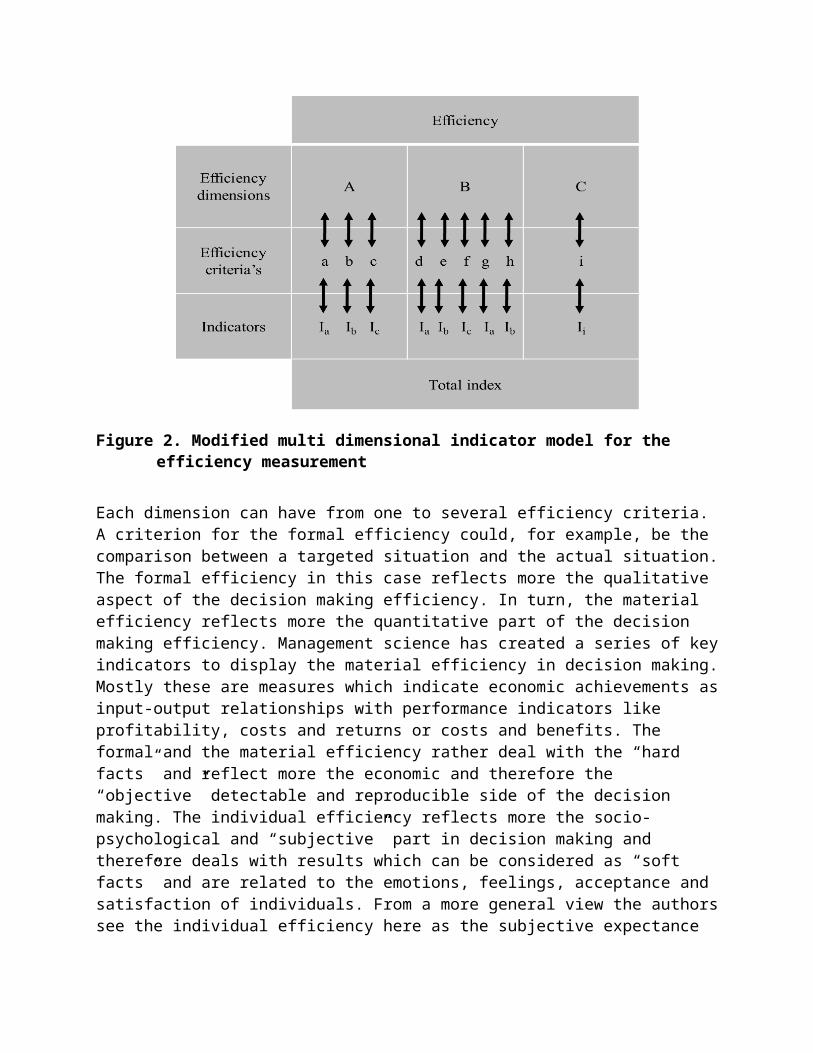
solutions which can help educate the business community about the ways in which licensed information can be used. Similarly, the university community could use a refresher, since new ways of access or new online methods encouraging the availability of information is not a guarantee of legal and ethical use of that information. We encourage the initiation and continuation of these types of activities by faculty and librarians in order to facilitate a campus-wide understanding of electronic resources:1) Continue to improve student instruction at both the undergraduate and graduate levels.
Again, many regular library users may not be aware of the contexts in which their use of electronic information is authorized. Using examples and scenarios as teaching methods may help prevent information-use violations and bad habits from developing in the first place.
2) Investigate multiple methods of collaboration with faculty. Librarians also have an obligation to influence faculty-designed assignments to include practice in using more subscription-based resources appropriately. Dewald (2005) explains that:
An additional important factor in faculty resource requirements is the nature of the assignments given. If the types of information students are asked to find is available on the free Web, then free Web resources will suffice. On the other hand, if faculty ask students to find in-depth company and industry analyses, economic data and analysis, legal resources, research reports, trend data, etc., that can only be found in subscription databases, then students will need to access the databases. Librarians need to work with individual faculty members to identify the unique capabilities of subscription databases (p. 214).
3) Work toward extinguishing “sufficing” behaviors. University librarians can help re-adjust documented student and faculty tendencies to use “less-knowledgeable” or “non-expert” others as a source of legal or ethical information simply because their opinions may be “good enough.” Waters, Kasuto, and McNaughton (2012) identified that particular skills in finding and interpreting gray literature were considered most useful for new engineering students as they entered the workforce (p. 131). Helping students identify good information in ethical ways, rather than relying on the web searches to make decisions for them, will be another important result of the collaborations above.
4) Provide technical solutions which require acknowledgement of policies “in the path of search.” In other words, visibility of license agreement information and terms of use should appear somewhere within the sequence of clicks which a typical user may follow.
5) Participate in the dissemination of ethics information. Increasingly, information about ethical dilemmas or resolutions is becoming scarce as publishers and authors fear litigation for even discussing this topic as we have here. Schlegelmilch and Öberseder (2010) show that the Journal of Marketing, a top journal, even has begun to “appear reluctant to publish marketing ethics manuscripts despite their high practical relevance and importance” (p. 13). Without a broad and deep discussion of legal and ethical topics by the profession itself, there

may not be a need for any training, particularly if the profession itself does not encourage scholarly or practical discussion of appropriate ethical behaviors.
ConclusionThe information landscape in which any university community operates is now more complex than ever. Licensed business, marketing, industry, and company information, as well as online journals and reports, are a mainstay of modern learning, decision making, and research. In the workplace, even “entry-level business-information researchers may not be held accountable [...], nor may they appreciate, the difference between information their organization pays for and information that is passed along without regard for license agreements” (Sokoloff, 2012, p. 16). This makes a higher education experience which praises appropriate and ethical use of information all the more important for our students’ futures. As librarians, faculty, and business professionals, we have an obligation not only to train others about legal and ethical uses of information, but also to contribute to the ongoing discussion of standards and guidelines ourselves.
ReferencesArp, L., Woodward, B. S., Lindstrom, J., & Shonrock, D. D. (2006). Faculty-librarian
collaboration to achieve integration of information literacy. Reference & User Services Quarterly, 46(1), 18-23.
“Conditions of use and licensing restrictions [University of California at Berkeley].” Last retrieved November 5, 2013, from http://www.lib.berkeley.edu/AboutLibrary/ conditions_of_use.html
Detlor, B., Julien, H., Willson, R., Serenko, A., & Lavallee, M. (2011). Learning outcomes of information literacy instruction at business schools. Journal of the American Society for Information Science and Technology, 62, 572–585.
Dewald, N. H. (2005). What do they tell their students? Business faculty acceptance of the web and library databases for student research. The Journal of Academic Librarianship, 31(3), 209-15.
Dubicki, E. (2010). Research behavior patterns of business students. Reference Services Review, 38(3), 360-84.
“Ford Library database terms of use [Duke University].” Last retrieved November 5, 2013, from http://library.fuqua.duke.edu/dbterms.htm
“IT Policies, Standards and Guidelines [University of Texas at Austin].” Retrieved November 5, 2013, from http://www.utexas.edu/cio/policies/
Matthies, B. (2004). The road to faculty-librarian collaboration. Academic Exchange Quarterly, 8(4), 138–39.
“Peer-to-peer file sharing and copyright law [Dartmouth College].” Last retrieved

November 5, 2013, from http://www.dartmouth.edu/copyright/peer2peer/index.html
Schlegelmilch, B. & Öberseder, M. (2010). Half a century of marketing ethics: Shifting perspectives and emerging trends. Journal of Business Ethics, 93(1), 1-19.
Sokoloff, J. (2012). Information literacy in the workplace: Employer expectations. Journal of Business and Finance Librarianship, 17(1), p. 1-17.
Waters, N., Kasuto, E., & McNaughton, F. (2012). Partnership between engineering libraries: Identifying information literacy skills for a successful transition from student to professional. Science & Technology Libraries, 31(1), 124-32.

Concepts of Human Nature, Social Effectiveness and Communication in the Workplace
Anna Horodecka, Ph.D., Warsaw School of Economics, al. Niepodległości 162, 02-554
Warszawa, Poland, phone: +48 507 252 149, email: [email protected];
Katarzyna Martowska, Ph.D., Institute of Psychology, Cardinal Stefan Wyszyński University in
Warsaw, ul. Wóycickiego 1/3, 01-938 Warszawa, Poland, email: [email protected]
Emilia Wrocławska-Warchala, Ph.D., Psychological Test Laboratory of the Polish Psychological
Association, ul. Belwederska 6A, 00-762 Warszawa, Poland, email:
Abstract
Concepts of human nature may be seen as crucial for explaining human behavior, however they
are not explored enough in contemporary social sciences and economics. The concepts of human
nature may serve as a basis for perceiving the social world, judging the problems occurring in
professional life and building relationships with other people at work. In our research we
checked the relation between concepts of human nature and various psychological variables
predicting social effectiveness (locus of control, sense of coherence, emotional intelligence and
leadership style, measured with the use of questionnaires). We measured concepts of human
nature using questionnaire and narrative methods. The results showed that accepted images of
man may affect social effectiveness and communication in the workplace – both in positive and
in negative way, depending on the content of a given image.
Introduction

The first purpose of the paper is to explore the role of the concept of human nature in developing social effectiveness and good communication in the organization. The second purpose is to evaluate different possibilities of measurement of relation between concepts of human nature and various aspects of social effectiveness.
Concepts of human nature (or “images of man”) are seen as crucial for explaining human behavior and so an important subject of research in social sciences and in economics (Fahrenberg, 2004, 2006; Fahrenberg & Cheetham, 2007; Müller, 2012; Oerter, 1988, 1991, 1996, 1999, 2007; Rollka & Schultz, 2011). In the business area of research classical works describe the influence of the concepts of human nature on organizational life (McGregor, 2002; Schein, 1970; Weber, 2000; Weinert, 1984, 1995).
However, there are some problems and shortages with using the theoretical concepts of human nature. Concepts of human nature described in the literature are based on different schools of psychology (psychoanalytical, behavioral, humanistic and cognitive); these concepts may not reflect the whole spectrum of common images of man, and in consequence they do not have enough explaining power for phenomena of general human behavior. In our research (Study B) we tried to overcome this difficulty by using a discourse method to explore variety of concepts of man.
The Theoretical Framework
The theoretical context of the exploration can be placed in the broad field of business ethics, which is a good platform to explore connections between different forms of communication taking place in the organization (internal communication between workers and their leaders determined by preferred styles of management, and external communication encompassed as well within the concept of stakeholder) and on the same time concerned with the human being as an individual and his/her attitude to other people determined by images of world and image of man the person has. It is as well a good opportunity to address the issue of values people have, which are behavior leading and are connected with a specific concept of human nature (cf. Schwartz, 1992).
Why this theoretical context is the one chosen for this exploration? It is because the specific attitude to other people is something what can be traced in all social relations occurring in the workplace and all affairs conducted by the organization – concept of human nature affects not only the contacts with other people in the organization but the way we solve specific problems, deal with business partners, clients, suppliers and launching business strategy. If there is a specific model of human nature which could prove to have positive influence on human communication, it should be not only involved in all relationships, but also introduced in all processes and decisions taken in the organization. The problem is, that without introducing such a model deliberately, decisions taken in the organization implicitly or explicitly transmit an image of man we have, and if we don't reflect it – this will be the dominant economic model of man we adopted in other organizations. Therefore it is important to reflect on the image we transmit and possibly choose the right one.

In our research we focused on psychological dispositions which may be crucial for functioning of the individual in the context of organization. In the first part of our research (Study A) we decided to check if concepts of human nature may be connected with leadership style and work locus of control. In this study we based on the list of concepts of human nature described in earlier works: Economic (utility maximizer), Social (adopting values and goal of its environment), Imperfect (driven by unconscious drives) and Humanistic (striving for self-realization) (McGregor, 2002; Schein, 1970; Turek, 2010). In the second part (Study B) we checked if there is a relationship between concepts of human nature, emotional intelligence and sense of coherence. In this study we decided to explore the variety of concepts of human nature with the use of narrative methods.
Hypotheses
In Study A we formulated two main hypotheses:
H1 There is a connection between individual concept of human nature and leadership stylesH2 There is a connection between individual concept of human nature and locus of control
In Study B we formulated also two main hypotheses:
H3 There is a connection between individual concept of human nature and leadership style emotional intelligenceH4 There is a connection between individual concept of human nature and sense of coherence
Figure 1
Note. WLC – Work Locus of Control; INEF – Inefficacy; F-D – Fate Dependence; O-D – Other Dependence; PC – Personal Control; IC – Ideology of Control; LOS – Locus of Successes; LOF – Locus of Failures; CS – Control Scale.
Methodology

Study A
Participants were students of social sciences and arts (N = 154, 121 women, 33 man, aged 19-23, M = 21.26; SD = .81). In the analysis of the connection between concepts of human nature and leadership styles due to lack of data we could analyze only 148 questionnaires, in the analysis of the connection between concepts of human nature and locus of control we used all 154 questionnaires.
In this study only questionnaire measures and quantitative analysis were used.
Concepts of human nature were measured with the use of self-report questionnaire by Dariusz Turek (Concepts of Human Nature Questionnaire; CNHQ, Turek, 2010); The questionnaire comprises of 24 statement describing different behaviors. The respondent’s task is to specify, on a five point continuum (from “definitely disagree” to “definitely agree”), to what extent each statement relates to him or her. This tool consists of four scales, corresponding to four concepts of human nature: Economic, Social, Imperfect and Humanistic.
Leadership styles were measured with the use of self-report questionnaire prepared by the research team of Psychological Test Laboratory of Polish Psychological Association (Leadership Styles Questionnaire, WERK, Brzezińska & Rafalak, in print); this tool allows to measure four leadership styles: Cheerleader (cooperative, agreeable), Steward (perfectionist, conservative), Revolutionist (creative, innovative) and Captain (realistic, stable); this questionnaire consists of 15 items; in each item the respondent evaluate four adjectives, corresponding to four leadership styles, ranging them from the one, which describes him/her best, to the one which does not describe him/her well.
Locus of control was measured with the use of another self-report questionnaire Individual in the Workplace (Matczak et al., 2009). It consists of 60 items in form of declarative sentences, subject has to answer in four-grade Likert scale. This questionnaire allows to check general type of locus of control (internal or external), as well as specific aspects of the individual locus of control and comprises of following scales: Inefficacy, Personal Control, Control Ideology, Locus of Success, Locus of Failure, Fate Dependence, Other Dependence. For all scales high result means external locus of control, low – internal one. Both reliability (internal consistency as well as stability) and validity of the questionnaires proved to be satisfactory.
Study B
In this study participated students and adults with differentiated level of education, coming from different regions of Poland (N = 120; 75 women, 45 men, aged 18-60, M = 27.31, SD = 11.06).
The main method applied in this study was semi-structured narrative interview, elaborated by the authors for the purpose of the research. The aim of applying this tool was to check the implicit concepts of human nature, which reflect in the narrative schemes of the individual. Interview consisted of two parts; in the first part research participants were asked some questions concerning possible scenarios of the future of humanity in general, about the possible reactions

of people in difficult life circumstances and the motives in situations demanding making choices. The second part was a kind of undisclosed stories test; one-sentence beginnings of the stories were presented to the participants and they were asked to finish them. Interviews were made by the students research team from Cardinal Stefan Wyszynski University in Warsaw (Sylwia Dudziak, Magdalena Dziedzic, Katarzyna Glińska, Barbara Janota-Bzowska, Agnieszka Poniatowska, Patrycja Wyszyńska, Marta Zając and Malwina Zielińska); students received training in narrative methods prior to the research. Narratives were recorded, transcribed and then subjected to the content analysis (Krejtz, Krejtz, 2005). After distinguishing 20 concepts of human nature by one author, the narratives were analyzed by two independent raters. If there were any differences between raters, narrative was revalued by the arbiter. Inter-rater reliability was satisfactory, considering the complex character of the narrative data (c.a. 80% of the same ratings) for all of the distinguished concepts except for two concepts, which were revalued. Then the frequency of the concepts in the narratives was checked.
83 interviewees (47 women and 36 men, aged 18-58, M = 26.05; SD = 9.80) fulfilled also two self-report questionnaires. Emotional intelligence was estimated by means of Polish version of the Schutte et al. questionnaire (INTE; Schutte et al., 1998; Jaworowska, Matczak, 2001). The tool is based on the first version of the emotional intelligence model by Peter Salovey and John D. Mayer. INTE comprises of 33 statement describing different behaviors. The respondent’s task is to specify, on a five point continuum (from “definitely disagree” to “definitely agree”), to what extent each statement relates to him or her. Sense of Coherence was estimated by questionnaire SOC (Antonovsky, 1993). SOC comprises of 29 items, each single item offers seven possible answers (seven-grade Likert scale). The respondent is requested to select the number which best corresponds to the extent to which each statement is applicable to him/her. SOC measures the general sense of coherence and three dimensions: comprehensibility (cognitive component of sense of coherence), manageability (behavioral component of sense of coherence) and meaningfulness.
Empirical Results
Study A
As it is presented in the Table 1, we found many significant correlations between Humanistic concept of human nature and locus of control. This concept of man appears to be connected with the internal locus of control (for all scales high result means external locus of control, low – internal one; negative correlations show that humanistic concept of man is negatively correlated with eternal locus o control). Correlations with the subscales show that people having humanistic image of man feel more efficacious, certain that they control their life-course and their success depend on themselves, but also are persuaded that people in general may control their life. They may also feel less fate-dependent and other-dependent. Fewer correlations were found for Social and Economic concepts of man; the direction show, that in some aspects these images of man may be connected also with internal locus of control.Many significant correlations, but negative ones, were found for Imperfect man concept and locus of control. People having this concept of man tend to have external locus of control - feel

more other-dependent and fate-dependent, do not think that people have control over successes and failures in their life and are persuaded that people in general do not control their life-course. As far as connection between concepts of human nature and leadership styles is concerned, we found significant correlation only for social sciences students (N = 54) and not for students of art (N = 94). In the first group we found positive correlation between Humanistic concept of man and Revolutionist (r = .37; p < .05) and negative correlation between Humanistic concept of man and Captain (r = -.34; p < .05) and Steward (r = -36; p < .05). Moreover, we found that Social concept of man is connected with Cheerleader leadership style.
[Table 1]
Study B
In the analysis of the narratives 20 concepts of human nature were distinguished. These were (in order of frequency): Society-made-man, Family man, Self-made-man, Materialistic man, Selfish man, Reasonable man (Enlightened man), Technocrat, Moral man, Inert man, Self-actualizing man, Aggressive man, Pro-social man (Altruist man), Animal sociale, Spiritual man, Irrational man, Nature-made man, Ecological man, Romantic man, Idle man, Virtual man.
[Table 2]
Statistically significant results of the analysis of the relation between emotional intelligence, sense of coherence and concepts of human nature used in the narratives are presented in the Table 3.
[Table 3]
First, we compared the group with high and low emotional intelligence (criteria: “high” was defined as the result of half of standard deviation over the mean; as “low” the results half of standard deviation below the mean) as far as the frequency of various concepts of man in the narratives is concerned.In the narratives of respondents with high level of emotional intelligence less often appears concept of Materialistic man than in the narratives of respondents with low level of emotional intelligence (chi2 = 3.97; p < .05). Then we compared the group with high and low sense of coherence (criteria: “high” was defined as the result of half of standard deviation over the mean; as “low” the results half of standard deviation below the mean).In the narratives of respondents with high level of sense of coherence less often appears concept of Aggressive man (chi2 = 4.05; p < .05) and Technocrat (chi2 = 4.15; p < .05) than in the narratives of respondents with low level of sense of coherence.In the narratives of respondents with high results in comprehensibility (cognitive component of sense of coherence) less often appears concept of Egoistic man (chi2 = 8.41; p < .05) than in the narratives of respondents with low level of comprehensibility. In the narratives of respondents with high level of manageability (behavioral component of sense of coherence) less often appears concept of Aggressive man (chi2 = 7.08; p < .05) and concept of Egoistic man (chi2 = 7.71; p < .05), than in the narratives of respondents whit low level of comprehensibility. In the narratives of respondents with high level of meaningfulness, in comparison with those with

lower level, less often appears concept of Aggressive man (chi2 = 3.30; p < .10; statistical tendency), and more often concept of Rational man (chi2 = 11.06; p < .05).
Conclusions
From among concepts of man often described in the literature (Economic, Social, Humanistic and Imperfect) we found that only two last ones have a lot of connections with work locus of control (Humanistic and Imperfect) and leadership styles (Humanistic). It may be due to the fact, that Economic and Social man concepts are complex, have various aspects which should be measured separately.
Humanistic concept of human nature seems to be most important correlate of variables connected with social effectiveness – more in-depth analysis of the concept may enable to elaborate ways of introducing it within the organization.
The results of the second part of our research point to the fact, that a Rational man concept should be introduced in the organization; it may enhance sense of coherence among the employees. It is interesting that it is not Animal sociale nor Altruist – for these concepts we did not find important correlation with sense of coherence – maybe they are not sufficient for adjusting to changing environment and structure of the organization. Results also show that we should avoid following concepts of human nature among leaders and employees, by introducing alternatives (in bracks): (1) non-aggressive (cooperative); (2) non-materialistic (oriented on other than materialistic goals); (3) non-egoistic (his/her goals integrated with group goals). We may do it by the means of: checking existing images of man for any signals of such components.

References
Antonovsky, A. (1993). The structure and properties of the Sense of Coherence Scale. Social Science and Medicine, 36, 725-733.
Brzezińska, U. & Rafalak, M. (in print). Inwentarz Stylów Kierowania WERK. Podręcznik. [Leadership Styles Inventory WERK. User’s guide]. Warszawa: Pracownia TestówPsychologicznych Polskiego Towarzystwa Psychologicznego.
Fahrenberg, J. (2004). Annahmen über den Menschen. Heidelberg: Asanger.Fahrenberg, J. (2006). Annahmen über den Menschen. Eine Fragebogenstudie mit 800
Studierenden der Psychologie, Philosophie, Theologie und Naturwissenschaften, Forschungsberichte des Psychologischen Instituts der Albert-Ludwigs-Universität Freiburg i. Br.
Fahrenberg, J. & Cheetham, M. (2007). Assumptions About Human Nature and the Impact of Philosophical Concepts on Professional Issues: A Questionnaire-Based Study with 800 Students from Psychology, Philosophy, and Science. Philosophy, Psychiatry & Psychology, 14, 183-201.
Jaworowska, A. & Matczak, A. (2008). Kwestionariusz Inteligencji Emocjonalnej INTE N.S. Schutte, J.M. Malouffa, L.E. Hall, D. Haggerty’ego, J.T. Cooper, C.J. Goldena i L. Dornheim. Podręcznik. Wydanie II zmienione. [Emotional Intelligence Questionnaire INTE by N.S. Schutte, J.M. Malouff, L.E. Hall, D. Haggerty, J.T. Cooper, C.J. Golden & L. Dornheim. User’s guide]. Warszawa: Pracownia Testów Psychologicznych Polskiego Towarzystwa Psychologicznego.
Krejtz, K. & Krejtz, I. (2005). Metoda analizy treści – teoria i praktyka badawcza. [Content Analysis – theory and research practice.] In: Stemplewska-Żakowicz, K., Krejtz, K. (Eds.) Wywiad psychologiczny. Tom 1: Wywiad jako postępowanie badawcze. Warszawa: PTP, pp. 129-149.
Matczak, A., Jaworowska, A., Fecenec, D., & Stańczak, J. (2009). Człowiek w Pracy. Podręcznik. [Individual in the Workplace. User’s guide]. Warszawa: Pracownia Testów Psychologicznych Polskiego Towarzystwa Psychologicznego.
McGregor, D. (2002). Theory X and Theory Y. Workforce, 81, 32-35.McGregor, D. (2006). The Human Side of Enterprise. New York: McGraw-Hill.Müller, C. (2012). Zum Menschenbild von Kindern und Jugendlichen eine empirische
Untersuchung. München: Ludwig-Maximilian-Universität.Oerter, R. (1988). Persons' Conception of Human Nature: A Cross-Cultural Comparison, In: J.
Valsiner (Ed.) Child Development within Culturally Structured Environments. Volume 3: Comparative-Cultural and Constructivist Perspectives (pp. 210-242). Greenwood Publishing Group.
Oerter, R. (1991). Self-object relation as a basis of human development. The origins of action. New York: Springer.
Oerter, R. (1996). The Concept of Human Nature in East Asia: Etic and Emic Characteristics. Culture Psychology, 2, 9-51.
Oerter, R. (1999). (Ed.) Menschenbilder in der modernen Gesellschaft [Concepts of human nature in modern society]. Stuttgart: Ferdinand Enke Verlag.

Oerter, R. (2007). Menschenbilder im Kulturvergleich [cross-cultural comparison of concepts of human nature], in: von G., Kornadt, H-J., Hogrefe (ed.), Kulturvergleichende Psychologie Bd.1: Theorien Und Methoden der kulturvergleichenden Psychologie. Enzyklopädie der Psychologie, Trommsdorff, Göttingen 2007, 487-530.
Rollka, B. & Schultz, F. (2011). Kommunikationsinstrument Menschenbild: Zur Verwendung Von Menschenbildern in Gesellschaftlichen Diskursen [Concepts of human nature as a communication tool of man: Application of concepts of human nature in societal discourses]. Wiesbaden: VS Verlag fur Sozialwissenschaften GmbH.
Salovey, P. & Mayer, J.D. (1990). Emotional intelligence. Imagination, Cognition and Personality, 9, 185-211.
Schein, E. (1970). Organizational psychology. N. J.: Prentice-Hall, Englewood Cliffs.Schutte, N. S., Malouff, J.M., Hall, L.E., Haggerty, D., Cooper, J.T., Golden, C.J. & Dornheim,
L. (1998). Development and validation of a measure of emotional intelligence. Personality and Individual Differences, 25, 167-177.
Schwartz, S. H. (1992). Universals in the content and structure of values: Theoretical advances and empirical tests in 20 countries. Advances in experimental social psychology, 25, 1-65.
Turek, D. (2010). Koncepcje człowieka a modele pracownika. Inspiracje dla ZZL. [Concepts of human nature and employee models. Inspiration for HR.] Edukacja Ekonomistów i Menedżerów, 16, 11-25.
Weber, G. (2000). Praxis der Organisationsaufstellungen. Grundlagen, Prinzipien, Anwendungsbereiche [Practice of organizational constellations. Basics, principles, applications]. Heidelberg: Carl-Auer Verlag GmbH.
Weinert, A. B. (1984). Menschenbilder als Grundlagen von Führungstheorien [Concepts of human nature as foundations of leadership theories]. Zeitschrift für Führung und Organisation, 2, 117-123.
Weinert, A. B. (1995). Menschenbilder in Organisationen und Führungstheorien. Erste Ergebnisse einer empirischen Überprüfung [Concepts of human nature in organizations and leadership theories. First results of an empirical examination]. Zeitschrift für Betriebswirtschaft, 54, 1, 30-62.
Table 1 CONCEPTS OF HUMAN NATURE AND LOCUS OF CONTROL (N = 154)
WLC INEF F-D O-D PC IC LOS LOF CSEconomic -.21* .19*Social -.26* -.14† -.17* .20*Imperfect .20* .25* .33* .21* .19* .22* .14† -.16†Humanistic -.30* -.37* -.19* -.14† -.27* -.30* -.32* -.19* .24*Note. WLC – Work Locus of Control; INEF – Inefficacy; F-D – Fate Dependence; O-D – Other Dependence; PC – Personal Control; IC – Ideology of Control; LOS – Locus of Successes; LOF – Locus of Failures; CS – Control Scale.* p < .05; †p < .10 (tendency)

Table 2CONCEPTS OF HUMAN NATURE IN THE NARRATIVES
Concept of human nature Frequency DefinitionSociety-made man 103 is shaped by the society, by the social
group he/she belongs to and by its values
Family man 101 takes care about others, but only about those others who are his/her family
membersMaterialistic man 95 strives for material goods (money,
wealth), is motivated by the lack of money (wants to make money)
Self-made-man 95 is the smith of his own destiny - he strives to set himself/herself targets, has
strong willSelfish man 91 strives for his/her own good, without
any concern for othersRational man (Enlightened man) 89 is reflective, perceives reason as a main
factor that shapes his/her life and makes rational choices
Technocrat 84 in a positive sense - controlling the world through technology \ in a negative sense – alienating himself/herself from
the world and other people by technology
Moral man 73 rates on the scale of good-evil, evaluates behaviors according to the moral
standardsInert man 73 externally controlled, has no influence
on the important events in his/her life and on his/her fate
Self-actualizing man 65 strives for self-development, pursues the voice of personal passion
Pro-social man (Altruist man) 64 helps other peopleAggressive man 62 fights with others for resources,
according to the belief that homo homini lupus est
Animal sociale 55 lives among the people and needs other people, seeks harmonious relationships
with others; without the presence of others, he/she loses the joy and meaning
of lifeSpiritual man 49 seeks for spiritual experiencesIrrational man 41 is driven by the impulse and intuition,
not by reasonNature-made man 35 biologically determined, he/she

inherited his/her essential characteristics and tendencies
Ecological man 33 protects the environment, tries to reverse the process of alienation from nature
Romantic man 27 strives for loveIdle man 26 lives from day to day, striving for
nothingVirtual man 13 has poor direct relationships with others,
communicates only with the use of technology
Table 3EMOTIONAL INTELLIGENCE, SENSE OF COHERENCE, AND CONCEPTS OF
HUMAN NATUREConcepts of Human Nature Emotional intelligence Chi2
Low HighMaterialistic Man 87.5% 61.9% 3.97*
Sense of coherence – comprehensibilityLow High
Selfish Man 100.0% 71.4% 8.41*Sense of coherence – manageability
Low HighAggressive Man 79.2% 42.9% 7.08*Selfish Man 95.8% 64.3% 7.71*
Sense of coherence – meaningfulnessLow High
Aggressive Man 63.0% 37.5% 3.30Reasonable Man 63.0% 100.0% 11.06*Note. * p < .05

Optimizing Operational and Financial Efficiency in Corporate Treasury
ManagementPetr Polak, FBEPS, Universiti Brunei Darussalam, Jalan Tungku Link, Gadong
BE1410, Brunei, e-mail: [email protected]
Abdullah Ejaz, Universiti Brunei Darussalam, Jalan Tungku Link, Gadong BE1410,
Brunei, e-mail: [email protected]
AbstractThe paper sheds the light on treasury efficiency. It discusses the definition of treasury efficiency, its importance, benefits and problems. Then it further discusses about improvement in treasury efficiency. It also converses about the treasury efficiency in practice, treasury efficiency surveys. In the last it argues about treasury management model to achieve treasury efficiency. Optimizing operational and financial efficiency has been among the main objectives for treasurers for some years. Increasing operational efficiency in treasury management is closely connected to risk management. There are wide variety of ways to increase efficiecy, which in turn mitigates the risk of human failure and fraud. Furthermore, efficient business processes reduce costs, which reduce pressure on marging, and facilitate better decision-making based on greater visibility over information and transactions. One of the foundations for achieving efficiency is to have full visibility over cash flow in all currencies and countries.Keywords: treasury management, treasury, efficiency, automation, standardization, risk management.
IntroductionAccording to Merriam-Webster dictionary, the meaning of efficiency is the capability to generate something while not wasting resources which are provided for the generation. According to the meaning of efficiency above, “Treasury Efficiency” can be defined as the ability to achieve maximum output with given amount of funds or the ability to use the funds of the company in a way that it can create the maximum value of the firm with given amount of funds.Treasury efficiency has become more important after the financial crisis and Polak, Robertson and Lind (2011) in their research paper “The New Role of the Corporate Treasurer: EmergingTrends in Response to the Financial Crisis” have categorized “Treasury Efficiency” as one of the most important emerging challenges that a corporate treasurer could face. Blake (2011) also
highlighted the importance of treasury efficiency by arguing that extraordinary challenges have been experienced by the firms in modern corporate world and these unparalleled challenges are ‘risk management, access to cash/credit and efficiency”. Seifert (2011) also argued that financial regulations like Basel III also emphasizes on betterment of indigenous financing efficiencies. While talking about the efficient treasury process, Ala (2011) argued that centralization, standardization, simplification and automation should be the central part of the efficient treasury process. Polak et al. (2010) further argued that greater amount of efficiency can be achieved through centralization of treasury functions. Hartung (2010) further argued that financial crisis has led more companies to take advantage of the expertise of the regional treasury centers for the better management of their liquidity. Similarly, Polak, Sirpal and Hamdan (2012) wrote in their paper “Post-Crisis Emerging Role of the Treasurer” that before financial crunch it was easy to access capital or the circumstances were not severe for the cash accessibility. But financial crisis and post financial crisis period made corporate financial managers realized the necessity of building dependable ways of financing and lifting up the cash liquidity. But Stewart (2005) argues that financial motivations have significant impacts on the legal composition and financial activities of the multi-national companies and it gives the rise of usage of “special purpose vehicles”, “inter firms’ loans”, “back to back loans” etc. Therefore it is necessary to have right combinations of funds to improve treasury efficiency in an organization to achieve maximum value.
How to achieve improvements in efficiency
Optimizing operational and financial efficiency has been among the objectives for treasurers in recent years. Increasing operational efficiency in treasury and finance management is closely connected to its risk management role. There are a wide variety of ways to increase efficiency, which in turn help to mitigate the risk of error and fraud. Efficient business processes reduce costs, which reduce pressure on margins, and facilitate better decision-making based on greater visibility over information and transactions. Automation and process optimization reduce the potential for errors or data latency. Improved efficiency can also improve the speed and quality of information – a critical component for Treasury in dynamically assessing risk and liquidity.
Potential efficiency improvements for MNCs (Multi National Corporations) include:
• Automation of low value added operational tasks including basic intelligence activities, such as, for example, managing payment and investments.• Location of staff in low cost / high talent centers.• Removal of paper documentation from the entire process.• Migration to e-payments and mobile payments • Leveraging the scale of partners to reduce unit costs of activities.• Improving straight-through processing of payments and collections to minimize costly exception processing.
One of the foundations for achieving efficiency is to have full visibility over cash flow in all currencies and countries. While it is very easy to understand in theory, it is a problem in practice as detailed payment formats vary by country and companies often work with multiple banks that

frequently store and communicate information in disparate formats and frequencies. Companies may also operate multiple general ledger systems, often due to acquisitions, each with unique data elements and formats. Another problem is that in many of the fastest growing economies, e.g. China and India, movement of cash is trapped or, at best, severely constrained through regulation and cannot be sweeped to a single concentration location. Further, many emerging economies are characterized by banks with incomplete or delayed information reporting capabilities and poor transparency into payment execution and settlement.A common first step in increasing the efficiency of treasury operations is to centralize the control of the treasury processes. A centralized treasury management system is a prerequisite for supporting efficiency. But even if the company has centralized processes, it may still need to standardize and simplify both the internal and external processes, and those steps must be attempted before automation. During the recent credit crisis, the value of real-time access to key information – global visibility of cash position, immediate access to counterparty risk, and global cash flow forecasting - was further highlighted. The crisis also increased the need for real-time management reporting.
There are a variety of reasons why companies decide to automate their treasury functions, including improved cash forecasting and straight-through processing, integration with multiple banks and multiple formats, increased visibility of cash, improved management of risk, and regulatory compliance – just to name a few. However, the recent convergence of several environmental factors such as globalization, rapid business growth, increased competition, has made treasury automation a priority for many corporations. In addition, treasury’s increasing ability to affect the bottom line has resulted in a significant shift in the role and responsibilities of corporate treasury professionals. This shift has brought about a renewed focus on cash forecasting and global cash management, interest rate and foreign currency risk management, and overall working capital management. This, in turn, is further driving the need for automation and collaboration across a broader ecosystem. Corporate treasurers continue to demand more automated solutions for the cash management function. This is certainly not a new development; over the past few years, corporate treasurers have pursued various automation initiatives. Early initiatives focused on streamlining of settlement processes, enabling many corporate treasury departments to settle transactions automatically via treasury workstations or direct interfaces with their banks.
A second wave of automation initiatives focused on automating the cash position and liquidity forecasting processes. Corporate treasurers asked their banks to build interfaces directly into their treasury workstation or ERP systems in order to provide timely cash positions and liquidity forecasts. Automation provides transparency, mitigates operational risks and creates one standardized process that is repeated every time. Today, automation can include daily cash investments and borrowings (via sweeps or portals). Further, as the reporting requirements of treasury have grown due to risk and regulatory pressures, many treasury units have automated a battery of periodic and ad-hoc reports so as to avoid time rekeying and formatting data.
Efficiency is strongly tied with a pressure on standardization of the format of financial messaging between counterparties, which in turn facilitates greater interoperability. At the present time the scene is set for substantial progress towards standardization in the form of ISO 20022 financial messaging standards based on XML. ISO 20022 is succeeding where previous efforts have failed, because it is supported by SWIFT to consolidate channels to over 8,000

banks and almost 1,000 corporations globally. In emerging economies, especially in Asia, where financial markets and their regulation are taking a different evolutionary path from those of Europe or the United States, deploying new technology and leveraging new technical standards is often easier as there are fewer legacy issues and vested interests to address. But the most important trend amongst companies that are mostly operating in emerging or growing markets is to adopt significant automation and leverage their standards to integrate payment and treasury data directly to the core system to maintain their competitive edge and reduce costs. As more companies expand operations across international borders, the erratic behavior of the international financial market forces standardization of international payments, as the simplification of fund movements becomes the extended challenge for corporate treasury. Corporate treasury is required to be more aware of the volatility of the international financial market and conversant with the current payment standards practiced by other corporate treasuries, in order to keep up with international trends. For example, the recent implementation of the single euro payments area (SEPA) has resulted in the SEPA Credit Transfer (SCT) replacing myriad payment instruments across the EU countries. The SCT was introduced in January 2008, and the SEPA Direct Debit in November 2009. Standardization of data promises faster, more comprehensive, and more efficient consolidation of data – which in turn will enable treasurers to access strategic insights more quickly – e.g., identifying variances to forecast and expediting the inclusion of data into automated general ledger posting and forecasting systems.
Treasury efficiency in practice
Bird (2013) at Financial Times is of the view that in today’s world automation is the key to achieve efficiency. Treasurers in the companies are asked to avoid extra funds in the deposits that have low interest rates, immediately indicate overdue payments and lessen the costs of transaction. But one problem in achieving above targets is the downsizing in finance departments. Cindy Murray, head of global treasurer, platforms and e-channels at BoAML argued that Treasurers are asked to do achieve more through automation in order to make activities more efficient. Paul Bramwell, senior vice president for treasury solutions at SunGard is of the view that the purpose of the financial managers is to display how much amount of liquidity they possess and where it is at any given point of time. Some clients require the update on financial situation daily or hourly. One client of BoAML wants accounting equation updates in the subsidiaries after every five minutes. In case of overseas companies, numerous payment formats just made the task difficult for instance Brazil have her own payment formats. Ms. Murray is of the view that several formats only permit to join 15 to 20 characters to the data. Then, it becomes very difficult to identify which data belongs to what and when for instance corresponding payment to invoice. But automation has solved this problem, Ms. Murray argued. BoAML’s has automated treasury service that collects the data on payments from clients and transform into a format which is in conformity with the International Standards Organizations Guidelines. It improves efficiency and frees the treasurer from spending time on reconciliation, hence, allowing manager to spend more time on analysis. Having data in standard formats is very helpful in answering questions like “what if?” says, Mr. Bramwell. Paul Tivnann, global head of foreign exchange and commodity electronic trading at Bloomberg, also says that more currencies and more interest rates increases risk due to price variation but automation helps to manage risks. Bloomberg has FXGO service that can unite many news analyses internationally with

simultaneously performing transactions with 300 banks. It helps greatly in buying or selling currencies and chose the best available offer from the range of offers. FXGO requests several banks for the quotes and also calculates the difference in dollar terms. It eliminates the risks of human errors, follows up on audit and helps in bringing compliance. BoAML’s CashPro Accelerate has locked the historical data of the company so that it cannot be manipulated and use this data to forecast the future trend. Hence, avoiding the problem of the creation of individual spread sheets based on inefficient data by many managers.
Ludovic A. Pech is a chief financial officer at Orange Romania. Pech (2012) wrote an article “A Local Approach to Treasury Efficiency” in Treasury International Management. Pech wrote that Orange brand is owned by The France Télécom group. Pech (2012) further wrote that there is a central group based in Paris with the name of “Group Treasury” and there are in-country finance teams whereas Group Treasury is responsible for designing financial policies and carrying out broad set of activities around the globe for the group and for its subsidiaries as well. In-country finance teams are responsible for managing cash position locally, performing daily treasury activities and managing risk. Pech is of the view that the organization follows a collaborative approach. In-country teams works very closely to the Group treasury. The central group provides them with financing, liquidity and refined treasury management and financing tools which are difficult to obtain in the local environment. As Romania, although EU member since 2007, is not included in the Euro Zone, therefore the nature of risks faced Orange Romania are different than the risk faced by the other group members. The risks involved are currency risk, credit default risk etc. In the presence of such risks, the close cooperation between the central group and in-country finance team at Orange Romania is termed as “positive one” by Pech. They also seek advises from the group on short term financing strategies. But Pech is of the view that Orange is the third largest profit earning organization in Romania and investing of its two-third profits to bring innovation to the market. Therefore, it is very necessary to maintain strong relationship with the local businesses and banking fraternity. Pech is also of the view that local bank ING in Romania helped Orange to achieve that status by providing them exceptional service. Nicoleta Forfota, Head of local sector – Telecom, Media and Technology at ING, is of the view that there bank is very proud on its contribution of making Orange as one of the leading company in the market. Nicoleta is also of the view that bank has supported this rapid growth of orange by the provision of quality banking infrastructure, appropriate operational support, advice on key matters and continuous expert opinion on products in a rapidly changing and difficult business environment. She further wrote that ING tries to build close relationship with clients by detailed understanding of clients’ business and responding them with “tailor-made” customized solutions. Pech (2012) also wrote that there must be a balance between centralization and decentralization of treasury activities. To achieve a successful combination of centralized and decentralized treasury management activities, policy, procedures and information flow should be clearly defined between central and regional finance teams and also, in-country finance teams should ensure that they have right skills to manage liquidity positions, risks and banking relationships. Similarly, a right local banking partner is also needed that can understand the business, offer efficient solutions and able to support centralized treasury activities.
Treasury efficiency surveys

Lindorff (2010) wrote that companies spent large amount of money on automating their treasury activities but Association for Finance Professionals’ (AFP) benchmarking survey indicates that the most important factor in bringing betterment to treasury efficiency is possessing highly educated, continuously trained and experienced employees in departments of treasury. Tom Hunt, treasury services director at AFP, told that it was found out through the survey that education level of employees was the important indicator in achieving efficiency. Certified and degree holder employees could efficiently perform treasury activities at treasury departments. The survey also revealed that training also played a role in achieving efficiency. The employees who received training for four to six days in a year in order to remain up to date on technological, regulatory and industrial changes performed better than those employees who spend only two days on training in a year but training more than six days had diminishing benefits. Tom Hunt also told that generally firms spent three-fourths of finance budgets on employees yet they receive different results because results are based on factors like level of education, experience, training and service duration. He further said that there were areas where ability of employees mattered than other factors for instance long duration on job had little effect on treasury functions’ performance but experienced employees are better at physical pooling of cash and maintain daily cash positions. Similarly survey also revealed that long tenure employees achieved some treasury activities at a slower rate but they were able to work with small work force. They survey also surfaced some important findings. For instance efficient treasury companies takes a day to resolve inconsistencies in a day whereas average treasury companies will take two days to solve this issue. Traditionally it is a two hour operation of physical pooling of cash and setting up daily cash position but efficiently managed companies could achieve the same in an hour. Similarly short term cash flow forecasting could be achieved by good companies in 1.7 hours whereas the same achieved by the average companies in 4 hours. The survey is of the clear view that highly educated, well experienced and trained employees are necessary for improving efficiency in treasury departments. Staff at Treasury and Risk (2013) discussed a survey that was done by Kyriba and UK’s Association of Corporate Treasurers. The survey provided the statistical evidence that spread sheets are not the efficient way for performing treasury functions. Most of the respondents belonged to UK and Ireland. There were total 269 respondents in the survey whereas 78% and 75% of the respondents were involved in cash management and reporting and forecasting of liquidity positions on daily basis respectively. Also, 66%, 58% and 43% of respondents were involved in managing risk, providing data to higher management on corporate decisions and strategic financial analysis on day to day basis respectively.
Figure 1: Platform used for treasury and cash management (broken out by company revenues)

Source: Treasury and Risk Staff, 2013.
It is clear from the Figure 1 that companies that have annual revenue of £500m or under £500m have used the spread sheets for managing their cash up to almost 50%. It is observable that as the revenue of the firms’ increases, the use of spread sheets decreases which leads to the increased usage of a software for managing funds. Server software is a Treasury Management System (TMS) which provides services to clients for managing their funds. Firms that have revenue of £ 10b or more have taken the support of automation for managing their treasury whether this automation is in the name of TMS or ERP or In-house system. One thing is very clear from the above figure that companies encourage the use of automation in managing treasury once their revenue increases. Similarly automation of treasury management could also increase productivity and save ample amount time as it is evident from the figure below.
Figure 2: Time per day spent on manual/operational tasks
Source: Treasury and Risk Staff, 2013.
It is clear from figure 2, employees that used TMS to perform operational task were almost 45% and spend less than hour to complete the given task where ERP users were only 38%. And, only 30% were the once who used spread sheets and performed the task in less than an hour. It is quite evident from figure 2 that automation of treasury management can increase productivity, could save the time of employees and that saved time can be used on other strategic matters which in turn will increase the overall level of productivity and efficiency of the firm.

PWC’s treasury management model
PWC’s Finland has prepared the following model to manage treasury activities efficiently.
Picture 1: Finance and treasury value chain
Source: http://www.pwc.fi
The above model clearly suggests that there should be a holistic approach to achieve treasury efficiency. Such policy of treasury should be made that supports the vision and strategy of the firm, loan requirements should be outlined and excess funds should be invested. Working capital should be managed efficiently with simultaneously managing risks and implementation of management information system should be insured in order to achieve treasury efficiency.
ConclusionThe meaning of efficiency is the capability to generate something while not wasting resources which are provided for the generation. According to the meaning of efficiency above, “Treasury Efficiency” can be defined as the ability to achieve maximum output with given amount of funds or the ability to use the funds of the company in a way that it can create the maximum value of the firm with given amount of funds.Potential efficiency improvements for MNCs (Multi National Corporations) include:• Automation of low value added operational tasks including basic intelligence activities, such as, for example, managing payment and investments.• Location of staff in low cost / high talent centers.• Removal of paper documentation from the entire process.• Migration to e-payments and mobile payments • Leveraging the scale of partners to reduce unit costs of activities.• Improving straight-through processing of payments and collections to minimize costly exception processing.
Treasury policyEstablish treasurypolicy andalign this withcorporate vision and strategy
Fundingmanagement(Liability)Set fundingRequirements,raise funds;manage groupfinance structure;
Surplusmanagement(Asset)Investing surpluscash; equityrepatriation
Cashmanagement(Working Capital)make efficientuse of liquidfunds; cashconcentrati
RiskManagementFX hedging,credit andinterest riskmanagement
InformationManagementDesign andimplementsystems

One of the foundations for achieving efficiency is to have full visibility over cash flow in all currencies and countries. While it is very easy to understand in theory, it is a problem in practice as detailed payment formats vary by country and companies often work with multiple banks that frequently store and communicate information in disparate formats and frequencies. Companies may also operate multiple general ledger systems, often due to acquisitions, each with unique data elements and formats. Another problem is that in many of the fastest growing economies, e.g. in China, movement of cash is trapped or, at best, severely constrained through regulation and cannot be sweeped to a single concentration location. Further, many emerging economies are characterized by banks with incomplete or delayed information reporting capabilities and poor transparency into payment execution and settlement.A common first step in increasing the efficiency of treasury operations is to centralize the control of the treasury processes. A centralized treasury management system is a prerequisite for supporting efficiency. But even if the company has centralized processes, it may still need to standardize and simplify both the internal and external processes, and those steps must be attempted before automation. During the recent credit crisis, the value of real-time access to key information – global visibility of cash position, immediate access to counterparty risk, and global cash flow forecasting - was further highlighted. The crisis also increased the need for real-time management reporting.
References
[1] Ala, Laura., 2011. “Treasury Trends for 2011.” GTNews, viewed 18 May 2013, http://gtnews.com/article/8216.cfm
[2] Bird, J., 2013. Cash Management: Automation Drives Treasury Efficiency. Financial Times March 26, http://www.ft.com/intl/cms/s/0/19b5fe96-8717-11e2-9dd7-00144feabdc0.html#axzz2TuSV0qnA
[3] Blake, N., 2011. “What matters today in the treasurer’s role?” In: Association of CorporateTreasurers. The International Treasurer’s Handbook 2011 (pp.58-60). London: ACT.
[4] Hartung, R., 2010. “Regional Treasury Centres Grow in Asia.” GTNews, viewed 18 May2013, http://www.gtnews.com/feature/428.cfm
[5] Lindorff, D., 2010. Quality Staff Key to Treasury Efficiency. Treasury and Risk Nov. 15, http://www.treasuryandrisk.com/2010/11/15/quality-of-
employees-is-key-to-treasury-efficiency
[6] Pech, L. A., 2012. A Local Approach to Treasury Efficiency. Treasury Management International 210, 46-48.
[7]Polak, P., Robertson D.C. and Lind, M., 2011. The New Role of the Corporate Treasurer: Emerging Trends in Response to the Financial Crisis. International Research Journal of Finance and Economics 78.

[8] Polak, P. and Klusacek, I., 2010. Centralization of Treasury Management. 1st Ed. Sumy:Business Perspectives. 100 pages. ISBN 978-966-2965-08-7.
[9] Polak, P., Sirpal, R. and Hamdan, M., 2012. Post-Crisis Emerging Role of the Treasurer. European Journal of Scientific Research, issue 86, 319-339.
[10] Seifert, E., 2011. “The Future Role of the Corporate Treasurer.” GTNews, viewed 18 May 2013, http://gtnews.com/article/8415.cfm
[11] Stewart, J., 2005. Fiscal incentives, corporate structure and financial aspects of treasury management operations. Accounting Forum 29, 271 – 288.
[12] Treasury and Risk Staff. 2013. Treasury Management Systems Boost Productivity. Treasury and Risk May 9,
http://www.treasuryandrisk.com/2013/05/09/treasury-management-systems-boost-productivity
Online Links:
http://www.learnersdictionary.com/search/efficiency
https://www.pwc.fi/fi/tilintarkastus-ja-muut-varmennuspalvelut/tiedostot/PwC_Treasury_Solution_Services_2011_web.pdf