vii meeting with investors - cpfl energia
TRANSCRIPT
© CPFL Energia 2009. Todos os direitos reservados.
Overview and Outlook Wilson Ferreira Jr CEO of CPFL Energia
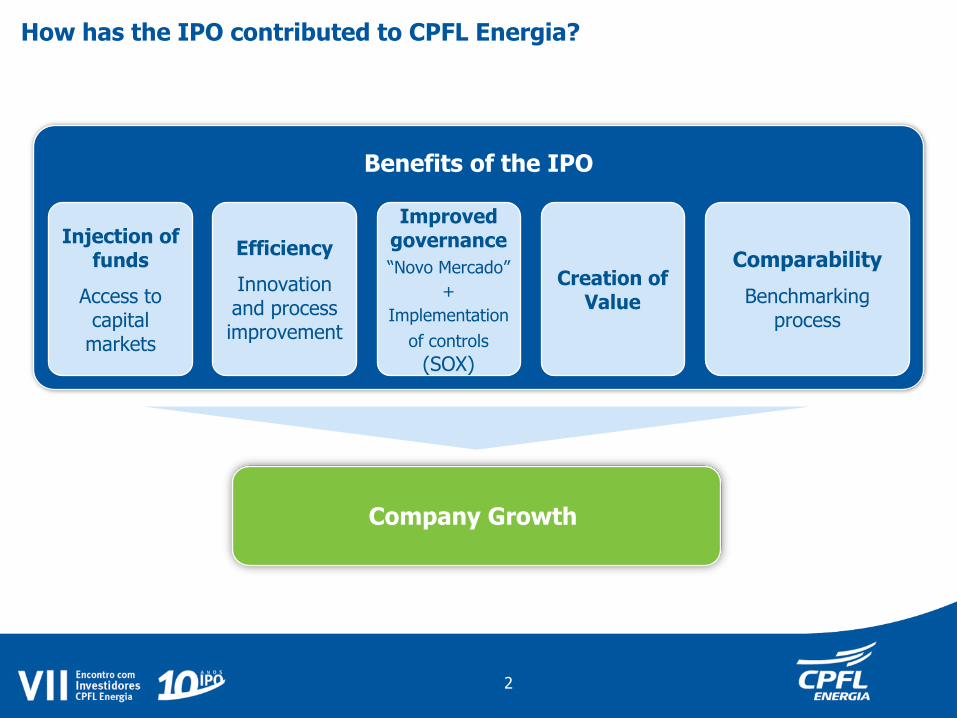
Benefits of the IPO
Injection of funds
Access to capital
markets
Efficiency
Innovation and process improvement
Improved governance
“Novo Mercado”
+
Implementation
of controls (SOX)
Creation of Value
Company Growth
Comparability
Benchmarking process
How has the IPO contributed to CPFL Energia?
2
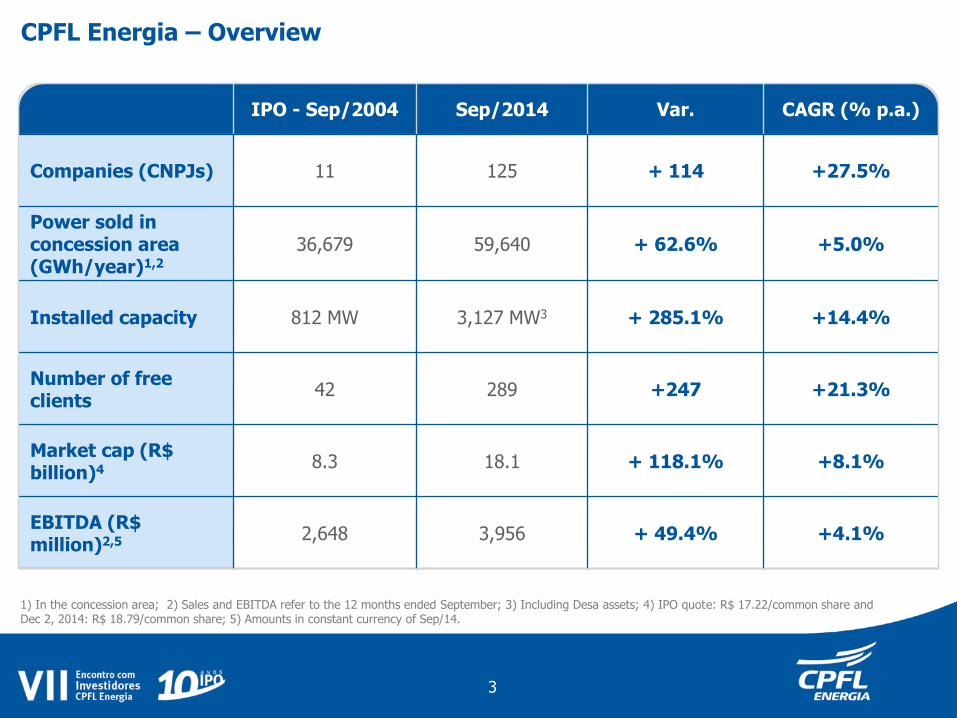
IPO - Sep/2004 Sep/2014 Var. CAGR (% p.a.)
Companies (CNPJs) 11 125 + 114 +27.5%
Power sold in concession area (GWh/year)1,2
36,679 59,640 + 62.6% +5.0%
Installed capacity 812 MW 3,127 MW3 + 285.1% +14.4%
Number of free clients
42 289 +247 +21.3%
Market cap (R$ billion)4 8.3 18.1 + 118.1% +8.1%
EBITDA (R$ million)2,5 2,648 3,956 + 49.4% +4.1%
CPFL Energia – Overview
1) In the concession area; 2) Sales and EBITDA refer to the 12 months ended September; 3) Including Desa assets; 4) IPO quote: R$ 17.22/common share and Dec 2, 2014: R$ 18.79/common share; 5) Amounts in constant currency of Sep/14.
3
Privatization
1998 2002 2004 2000 1997 2001 2003
IPO
2004 2006 2005 2007
IPO
2008 2010 2009 2011 2012 2013 2014
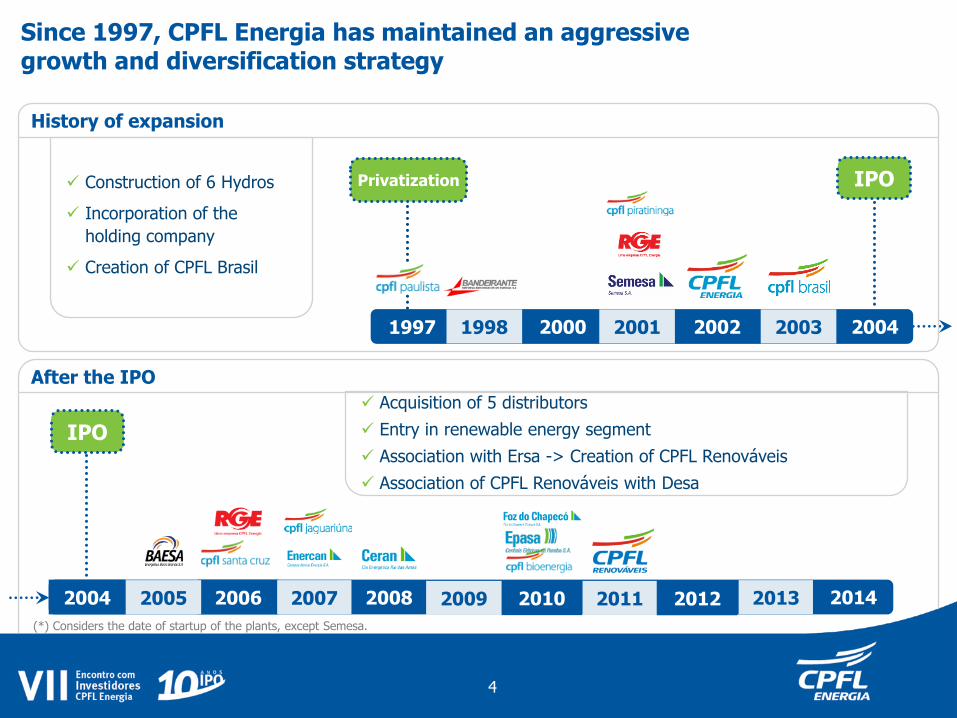
Since 1997, CPFL Energia has maintained an aggressive growth and diversification strategy
History of expansion
After the IPO
Construction of 6 Hydros
Incorporation of the
holding company
Creation of CPFL Brasil
Acquisition of 5 distributors
Entry in renewable energy segment
Association with Ersa -> Creation of CPFL Renováveis
Association of CPFL Renováveis with Desa
4
(*) Considers the date of startup of the plants, except Semesa.
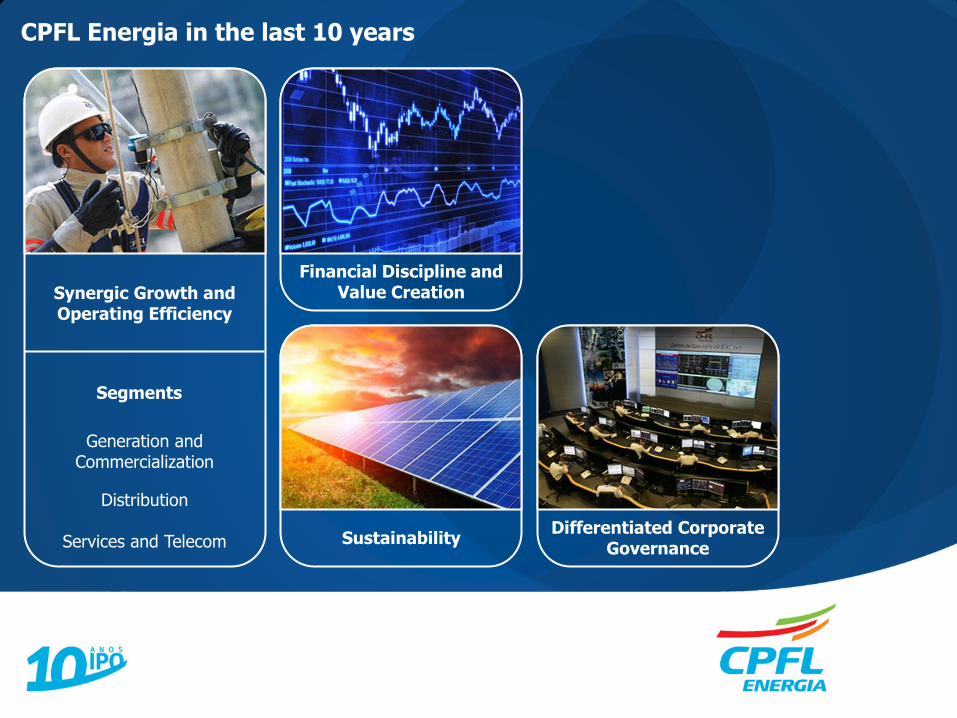
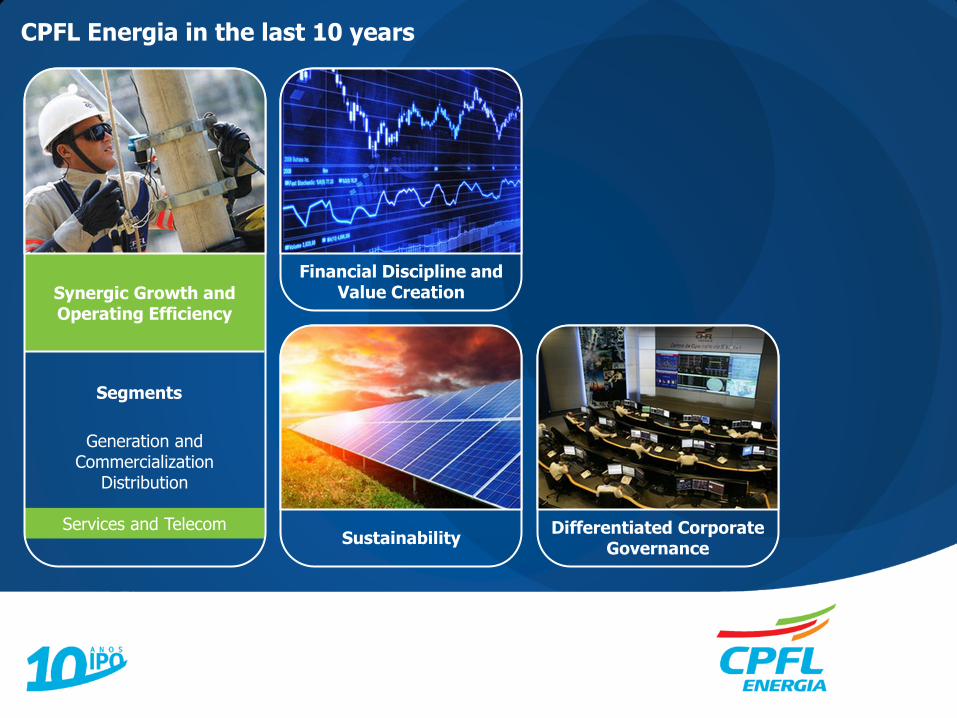
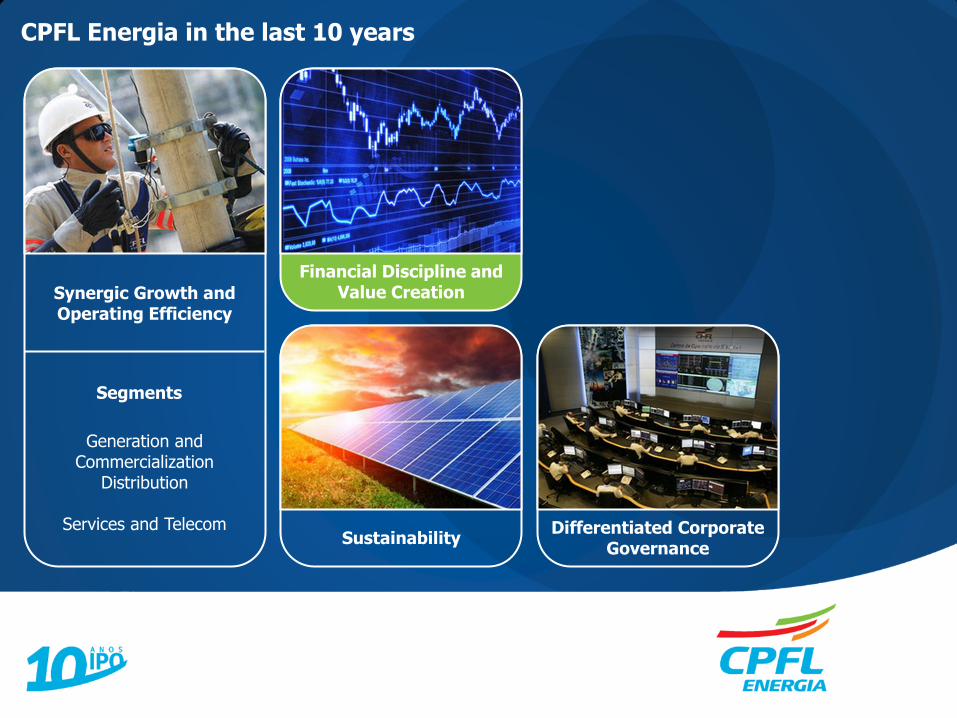
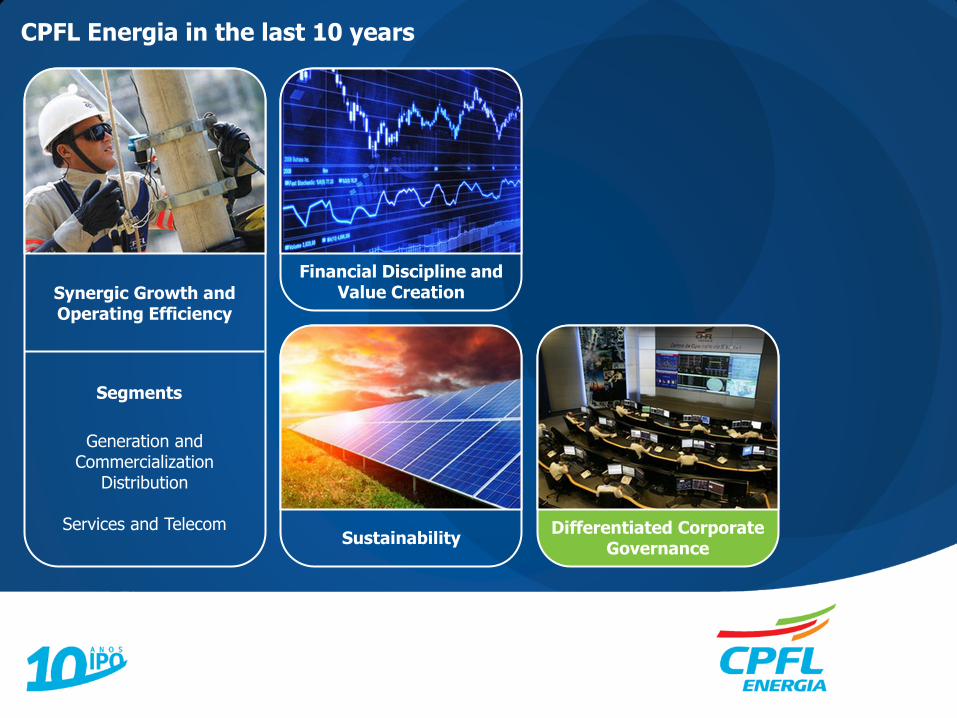
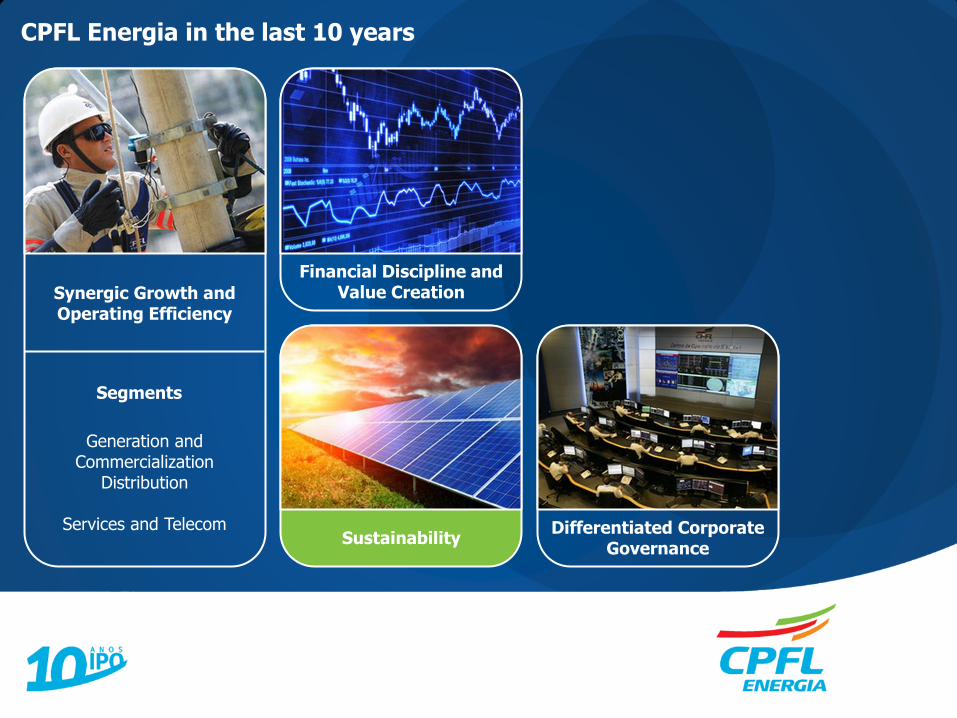
CPFL Energia in the last 10 years
Sustainability Differentiated Corporate
Governance
Financial Discipline and Value Creation Synergic Growth and
Operating Efficiency
Generation and Commercialization
Segments
Distribution
Services and Telecom
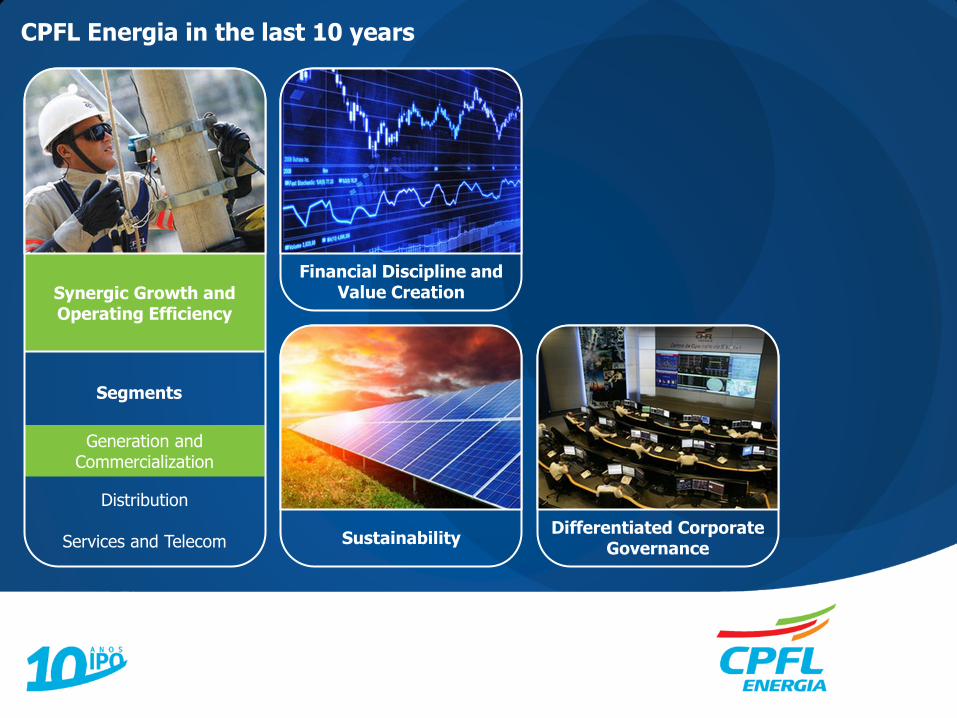
CPFL Energia in the last 10 years
Sustainability Differentiated Corporate
Governance
Financial Discipline and Value Creation Synergic Growth and
Operating Efficiency
Generation and Commercialization
Segments
Distribution
Services and Telecom
Generation & Commercialization
2005 2003 2007 2008 2010 2004
IPO
Commercial Expertise
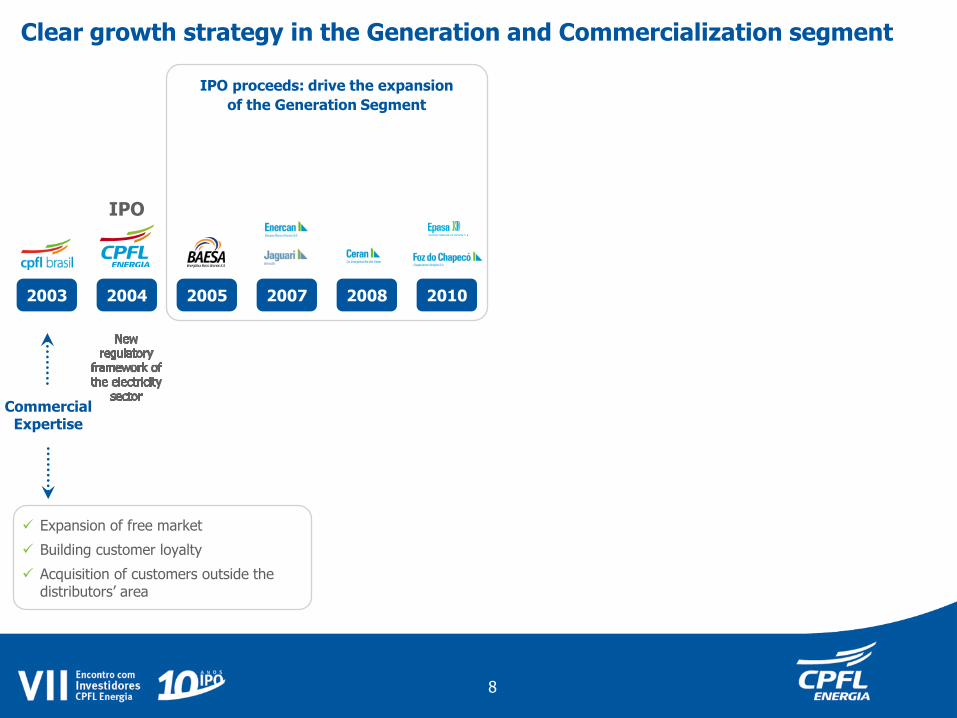
Clear growth strategy in the Generation and Commercialization segment
IPO proceeds: drive the expansion
of the Generation Segment
Expansion of free market
Building customer loyalty
Acquisition of customers outside the distributors’ area
8
2005 2003 2007 2008 2010 2004
IPO
Commercial Expertise
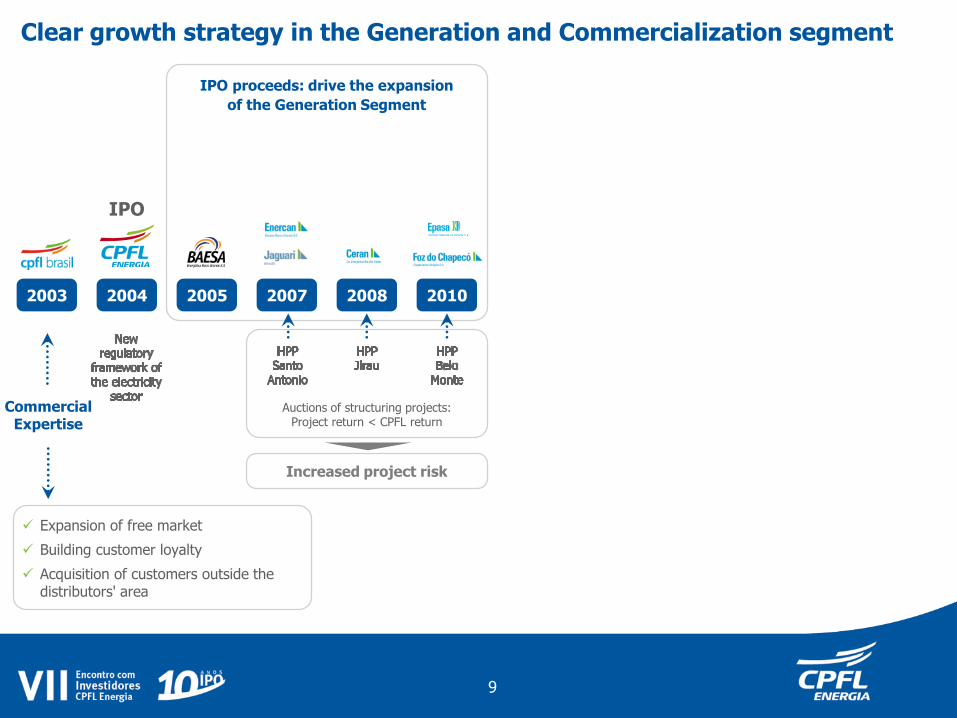
Clear growth strategy in the Generation and Commercialization segment
IPO proceeds: drive the expansion
of the Generation Segment
Expansion of free market
Building customer loyalty
Acquisition of customers outside the distributors' area
9
Increased project risk
Auctions of structuring projects: Project return < CPFL return
2005 2003 2007 2008 2010 2004
IPO
Commercial Expertise
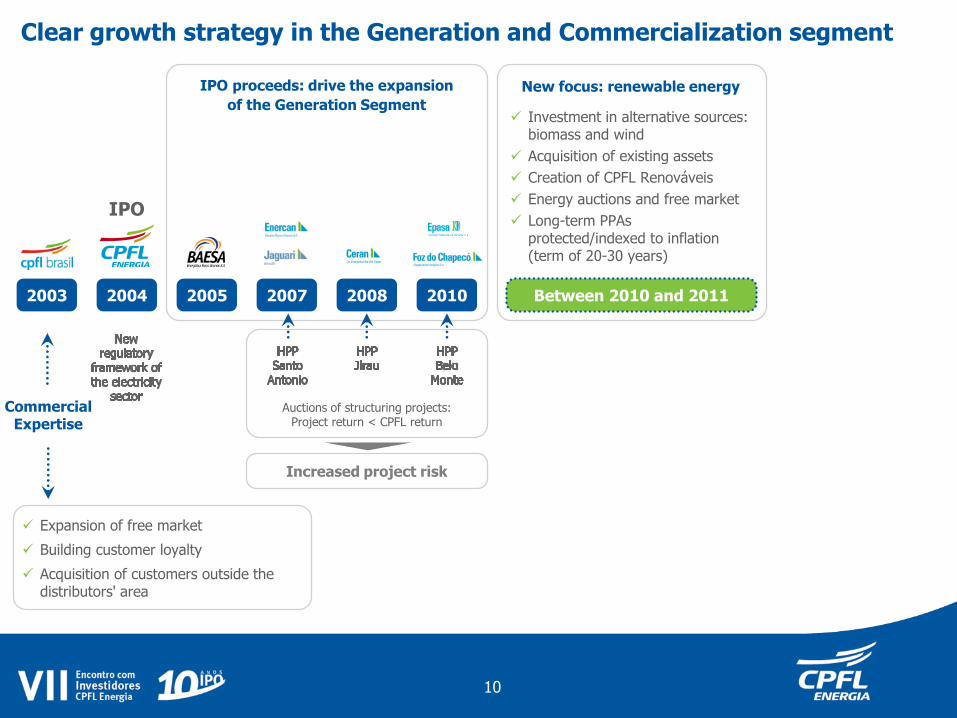
Clear growth strategy in the Generation and Commercialization segment
IPO proceeds: drive the expansion
of the Generation Segment
New focus: renewable energy
Investment in alternative sources: biomass and wind
Acquisition of existing assets
Creation of CPFL Renováveis
Energy auctions and free market
Long-term PPAs protected/indexed to inflation (term of 20-30 years)
Between 2010 and 2011
Expansion of free market
Building customer loyalty
Acquisition of customers outside the distributors' area
10
Increased project risk
Auctions of structuring projects: Project return < CPFL return
Increased project risk
2005 2003 2007 2008 2010 2013
IPO
2011 2004
IPO
Commercial Expertise
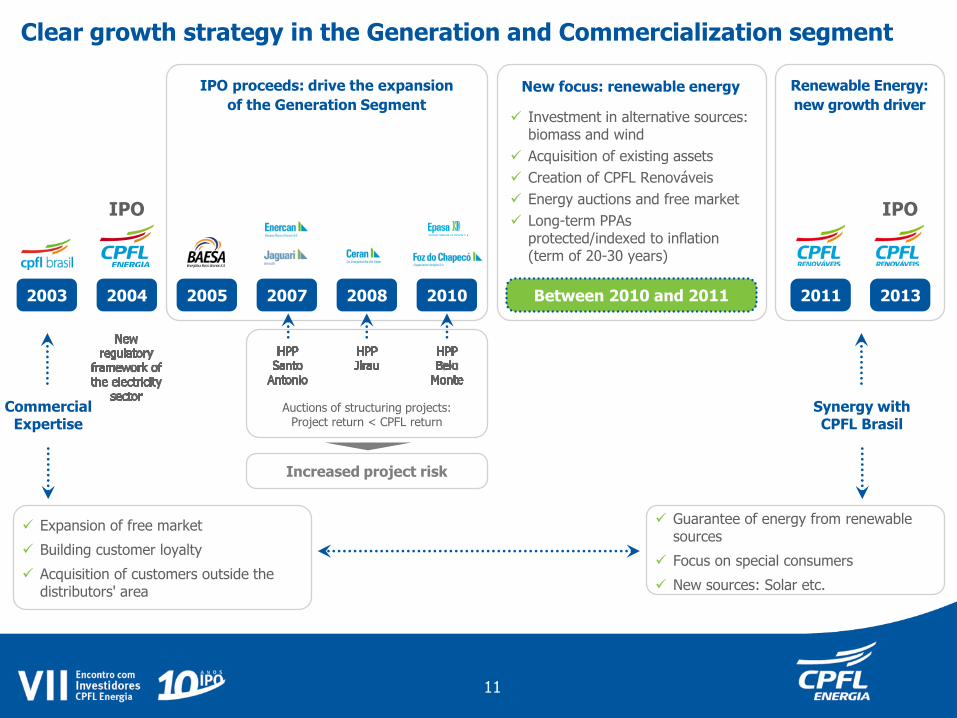
Clear growth strategy in the Generation and Commercialization segment
IPO proceeds: drive the expansion
of the Generation Segment
Renewable Energy:
new growth driver
New focus: renewable energy
Investment in alternative sources: biomass and wind
Acquisition of existing assets
Creation of CPFL Renováveis
Energy auctions and free market
Long-term PPAs protected/indexed to inflation (term of 20-30 years)
Expansion of free market
Building customer loyalty
Acquisition of customers outside the distributors' area
Guarantee of energy from renewable sources
Focus on special consumers
New sources: Solar etc.
Synergy with CPFL Brasil
Auctions of structuring projects: Project return < CPFL return
Between 2010 and 2011
11
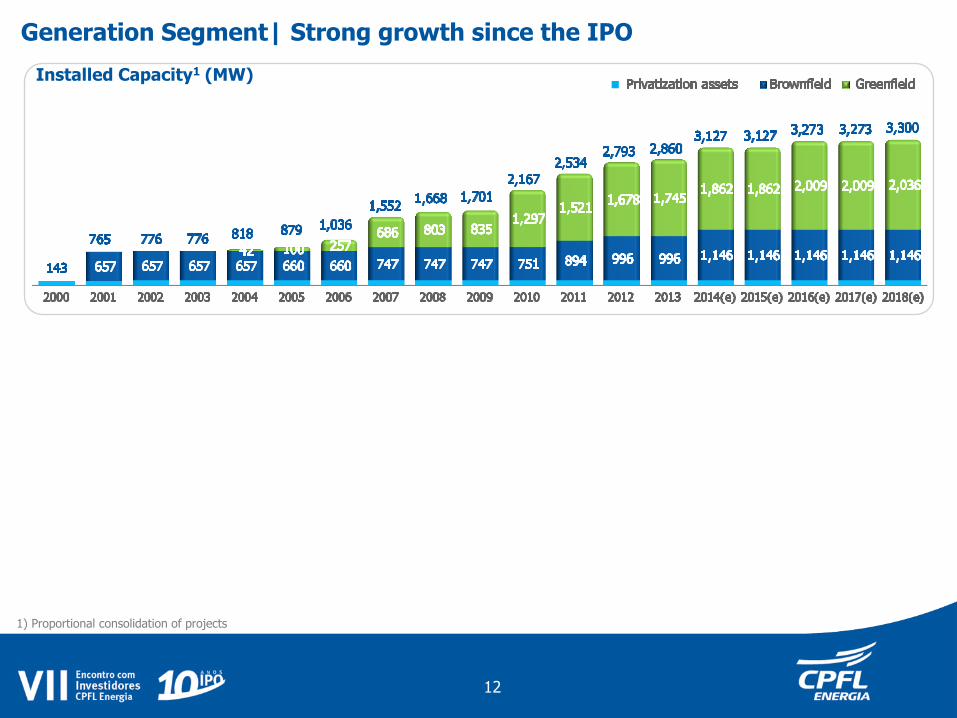
Generation Segment| Strong growth since the IPO
1) Proportional consolidation of projects
12
Installed Capacity1 (MW)
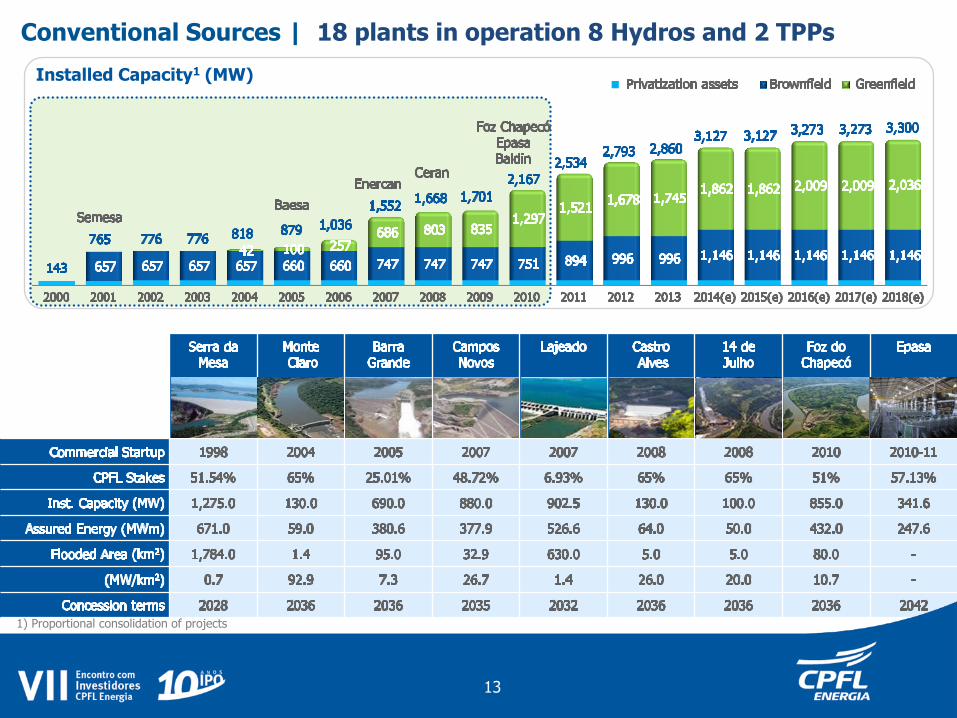
Conventional Sources | 18 plants in operation 8 Hydros and 2 TPPs
Installed Capacity1 (MW)
13
1) Proportional consolidation of projects
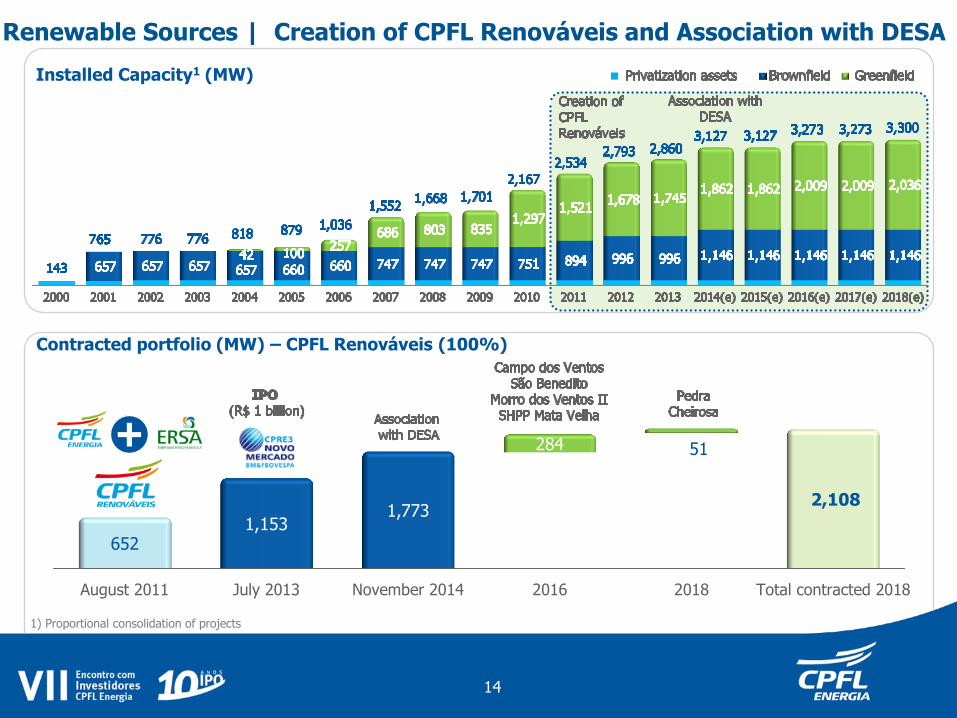
August 2011 July 2013 November 2014 2016 2018 Total contracted 2018
652
1,153 1,773
284 51
2,108
Contracted portfolio (MW) – CPFL Renováveis (100%)
+
Renewable Sources | Creation of CPFL Renováveis and Association with DESA
14
1) Proportional consolidation of projects
Installed Capacity1 (MW)
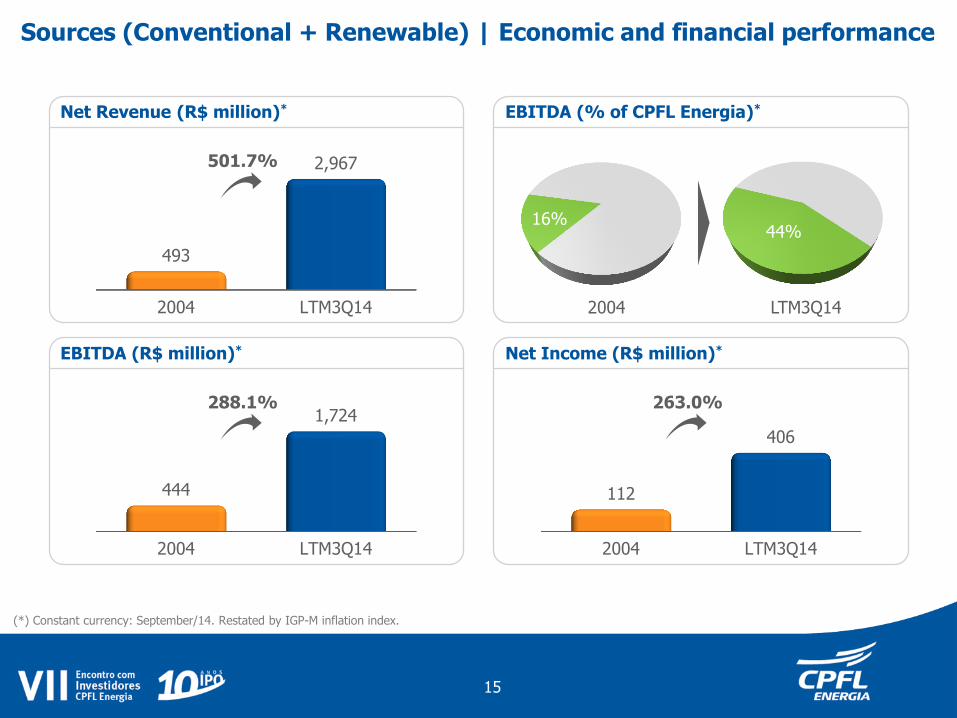
Net Revenue (R$ million)* EBITDA (% of CPFL Energia)*
EBITDA (R$ million)* Net Income (R$ million)*
Sources (Conventional + Renewable) | Economic and financial performance
2004 LTM3Q14
493
2,967 501.7%
2004 LTM3Q14
444
1,724 288.1%
2004 LTM3Q14
112
406
263.0%
2004 LTM3Q14
16% 44%
(*) Constant currency: September/14. Restated by IGP-M inflation index.
15
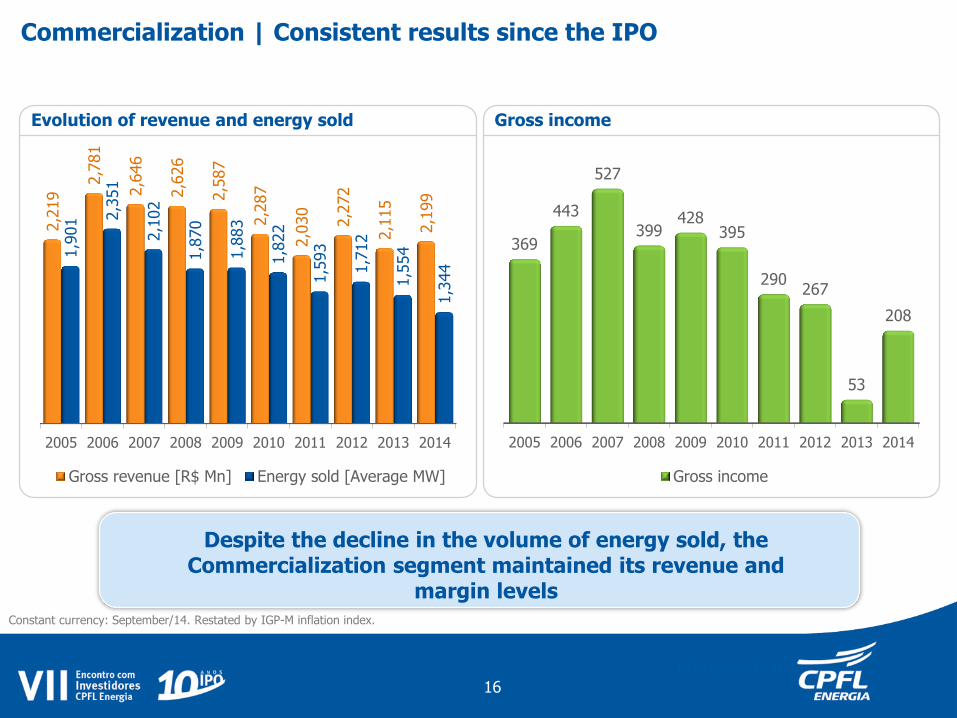
Despite the decline in the volume of energy sold, the Commercialization segment maintained its revenue and
margin levels
Margem Bruta
2005 2006 2007 2008 2009 2010 2011 2012 2013 2014
369
443
527
399 428
395
290 267
53
208
Gross income
Commercialization | Consistent results since the IPO
Evolution of revenue and energy sold Gross income
2005 2006 2007 2008 2009 2010 2011 2012 2013 2014
2,2
19 2
,781
2,6
46
2,6
26
2,5
87
2,2
87
2,0
30
2,2
72
2,1
15
2,1
99
1,9
01 2,3
51
2,1
02
1,8
70
1,8
83
1,8
22
1,5
93
1,7
12
1,5
54
1,3
44
Gross revenue [R$ Mn] Energy sold [Average MW]
Constant currency: September/14. Restated by IGP-M inflation index.
16
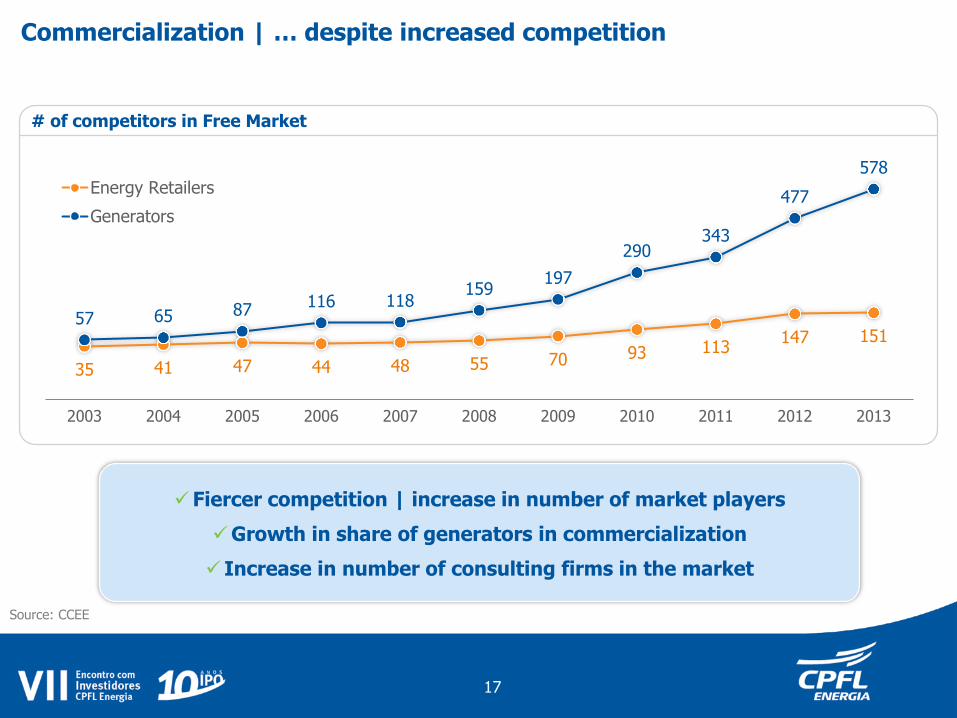
Commercialization | … despite increased competition
35 41 47 44 48 55 70 93 113 147 151
57 65 87 116 118
159 197
290 343
477
578
2003 2004 2005 2006 2007 2008 2009 2010 2011 2012 2013
Energy Retailers
Generators
# of competitors in Free Market
Source: CCEE
Fiercer competition | increase in number of market players
Growth in share of generators in commercialization
Increase in number of consulting firms in the market
17
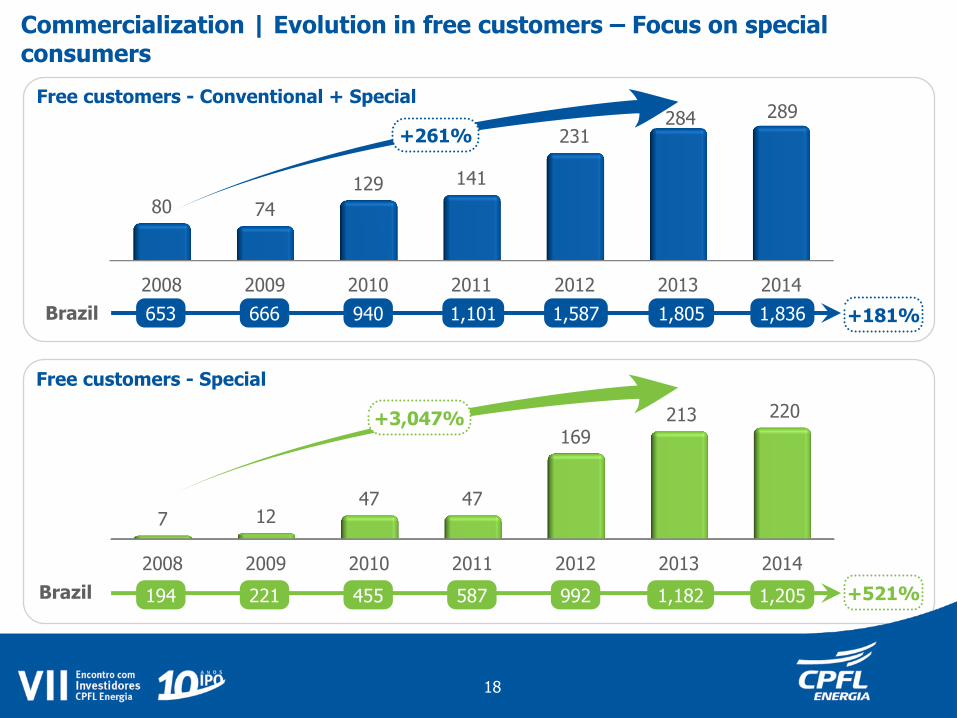
Commercialization | Evolution in free customers – Focus on special consumers
2008 2009 2010 2011 2012 2013 2014
7 12 47 47
169 213 220
+181%
+521%
1,836 1,805 1,587 1,101 940 666 653
1,205 1,182 992 587 455 221 194
+261%
+3,047%
Brazil
Brazil
Free customers - Conventional + Special
Free customers - Special
2008 2009 2010 2011 2012 2013 2014
80 74
129 141
231 284 289
18
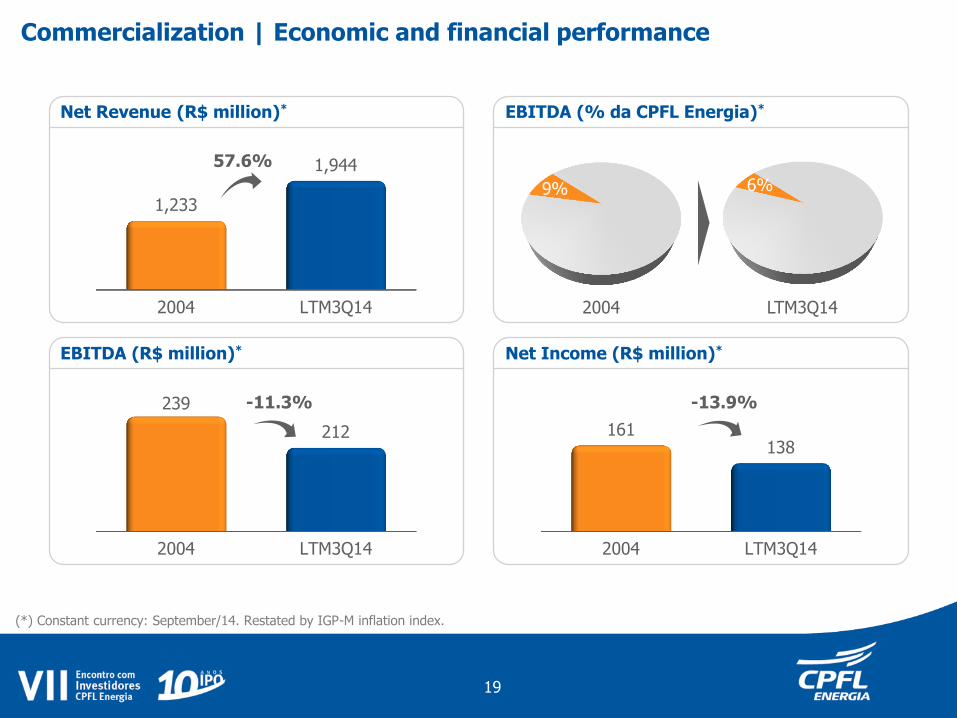
Net Revenue (R$ million)* EBITDA (% da CPFL Energia)*
EBITDA (R$ million)* Net Income (R$ million)*
Commercialization | Economic and financial performance
2004 LTM3Q14
1,233
1,944 57.6%
2004 LTM3Q14
239
212
-11.3%
2004 LTM3Q14
161 138
-13.9%
2004 LTM3Q14
9% 6%
(*) Constant currency: September/14. Restated by IGP-M inflation index.
19

CPFL Energia in the last 10 years
Sustainability
Differentiated Corporate Governance
Financial Discipline and Value Creation Synergic Growth and
Operating Efficiency
Generation and Commercialization
Segments
Distribution
Services and Telecom
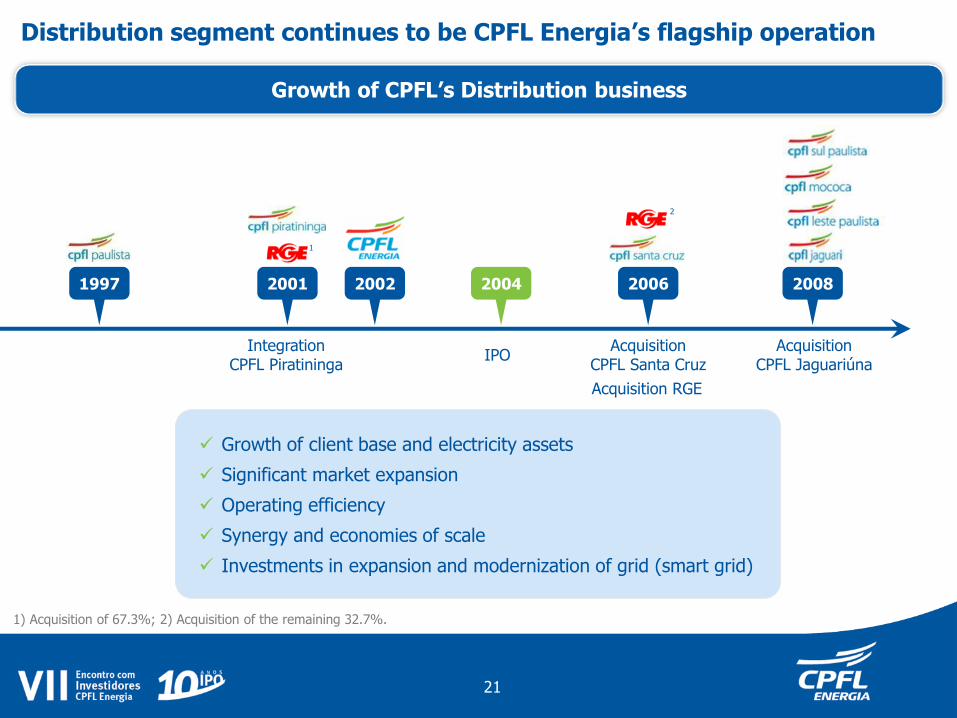
Distribution segment continues to be CPFL Energia’s flagship operation
1) Acquisition of 67.3%; 2) Acquisition of the remaining 32.7%.
Integration CPFL Piratininga
1
Acquisition CPFL Santa Cruz
Acquisition RGE
2
IPO Acquisition
CPFL Jaguariúna
2008 2006 2004 2002 2001 1997
Growth of client base and electricity assets
Significant market expansion
Operating efficiency
Synergy and economies of scale
Investments in expansion and modernization of grid (smart grid)
Growth of CPFL’s Distribution business
21
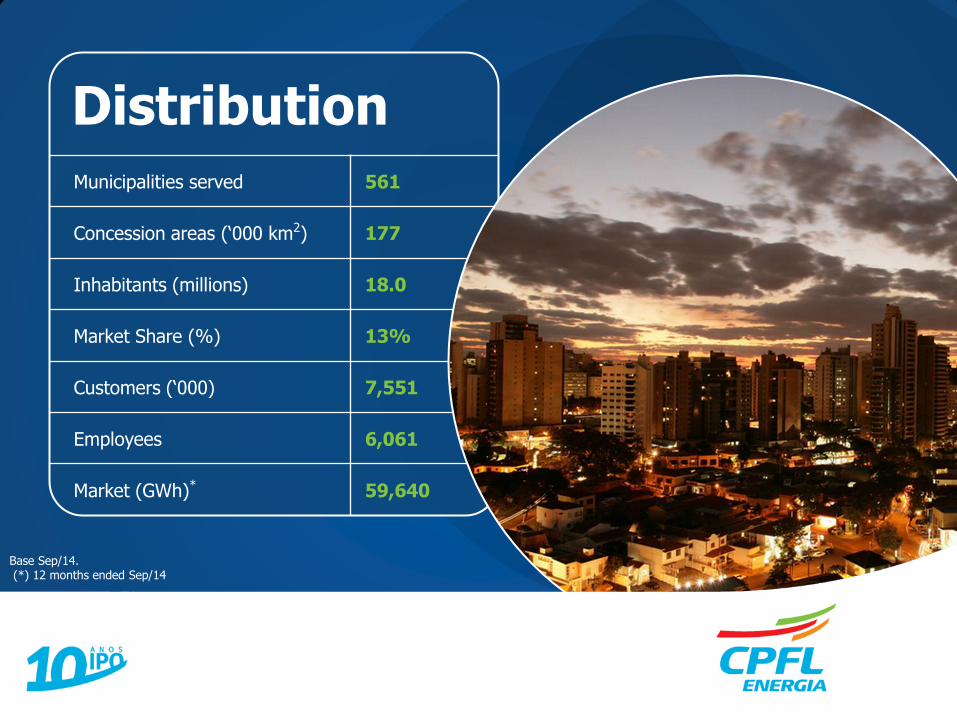
Distribution Municipalities served 561
Concession areas (‘000 km2) 177
Inhabitants (millions) 18.0
Market Share (%) 13%
Customers (‘000) 7,551
Employees 6,061
Market (GWh)* 59,640
Base Sep/14. (*) 12 months ended Sep/14
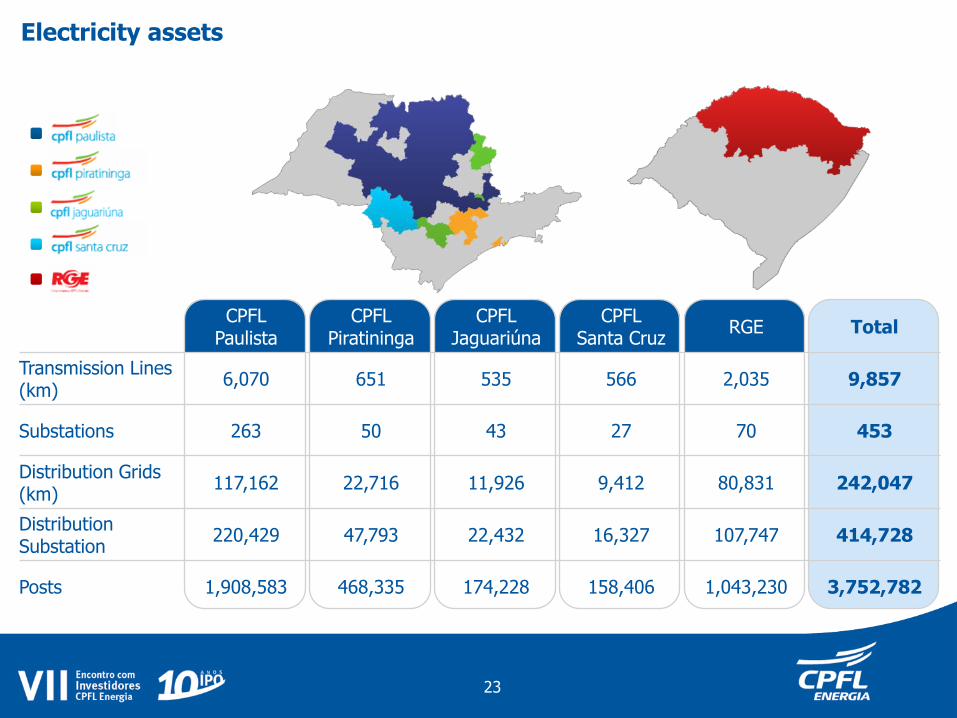
Electricity assets
CPFL Paulista
CPFL Piratininga
CPFL Jaguariúna
CPFL Santa Cruz
RGE Total
Transmission Lines (km)
6,070 651 535 566 2,035 9,857
Substations 263 50 43 27 70 453
Distribution Grids (km)
117,162 22,716 11,926 9,412 80,831 242,047
Distribution Substation
220,429 47,793 22,432 16,327 107,747 414,728
Posts 1,908,583 468,335 174,228 158,406 1,043,230 3,752,782
23
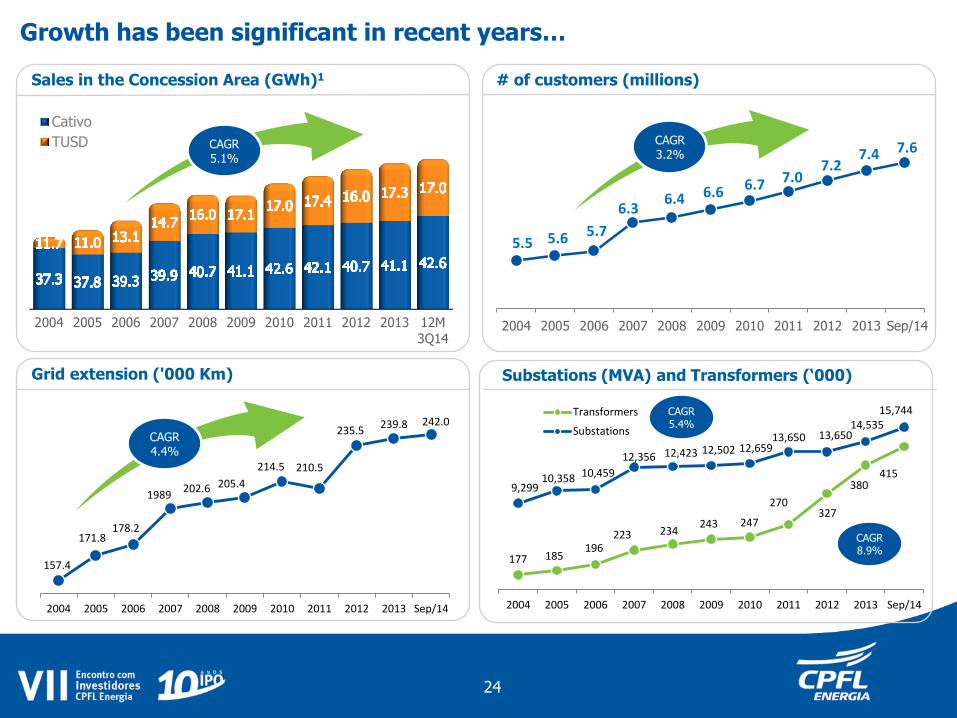
157.4
171.8 178.2
1989 202.6 205.4
214.5 210.5
235.5 239.8 242.0
2004 2005 2006 2007 2008 2009 2010 2011 2012 2013 Sep/14
2004 2005 2006 2007 2008 2009 2010 2011 2012 2013 12M
3Q14
Cativo
TUSD
# of customers (millions)
Grid extension ('000 Km)
Sales in the Concession Area (GWh)1
5.5 5.6 5.7
6.3 6.4 6.6 6.7 7.0
7.2 7.4 7.6
2004 2005 2006 2007 2008 2009 2010 2011 2012 2013 Sep/14
CAGR 5.1%
177 185 196
223 234 243 247
270 327
380 415
9,299 10,358 10,459
12,356 12,423 12,502 12,659 13,650 13,650
14,535 15,744
2004 2005 2006 2007 2008 2009 2010 2011 2012 2013 Sep/14
Transformers
Substations
Substations (MVA) and Transformers (‘000)
Growth has been significant in recent years…
CAGR 4.4%
CAGR 3.2%
CAGR 5.4%
CAGR 8.9%
24
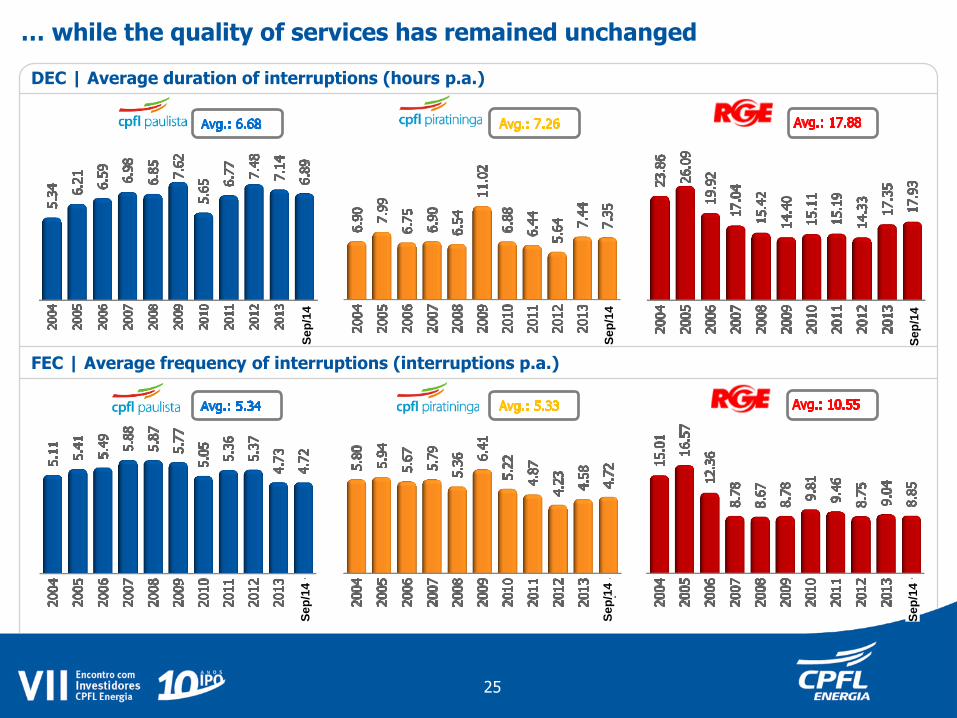
… while the quality of services has remained unchanged
DEC | Average duration of interruptions (hours p.a.)
FEC | Average frequency of interruptions (interruptions p.a.)
25
Se
p/1
4
Se
p/1
4
Se
p/1
4
Se
p/1
4
Se
p/1
4
Se
p/1
4
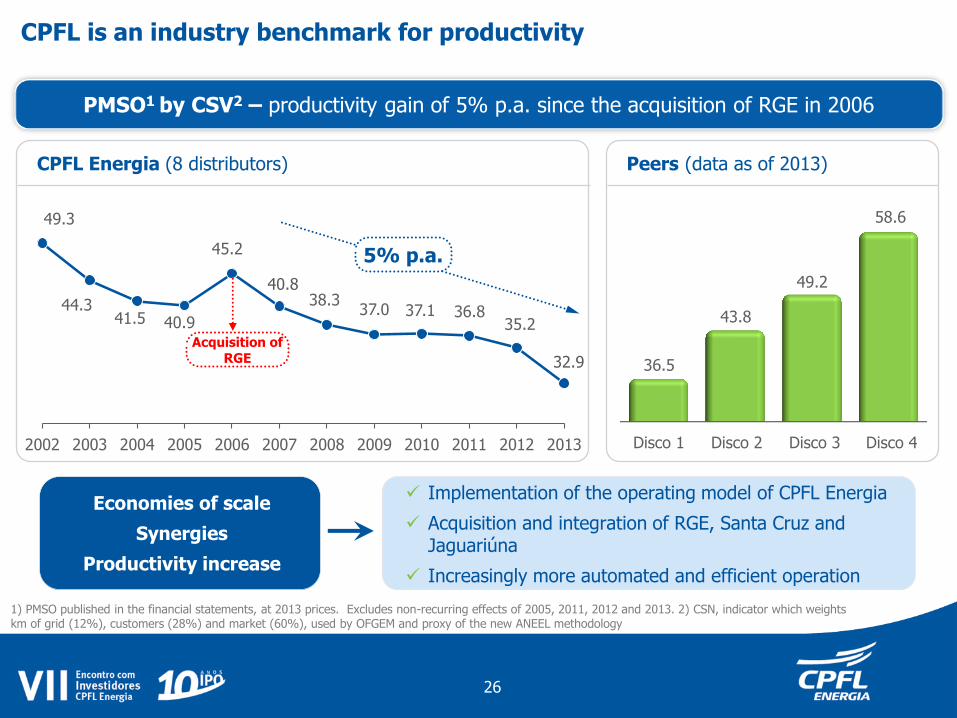
CPFL is an industry benchmark for productivity
1) PMSO published in the financial statements, at 2013 prices. Excludes non-recurring effects of 2005, 2011, 2012 and 2013. 2) CSN, indicator which weights km of grid (12%), customers (28%) and market (60%), used by OFGEM and proxy of the new ANEEL methodology
36.5
43.8
49.2
58.6
Disco 1 Disco 2 Disco 4 Disco 3
Peers (data as of 2013)
PMSO1 by CSV2 – productivity gain of 5% p.a. since the acquisition of RGE in 2006
49.3
44.3 41.5 40.9
45.2
38.3 37.0 37.1 36.8
35.2
2002 2003 2004 2005 2006 2007 2008 2009 2010 2011 2012 2013
CPFL Energia (8 distributors)
40.8
32.9
5% p.a.
Implementation of the operating model of CPFL Energia
Acquisition and integration of RGE, Santa Cruz and Jaguariúna
Increasingly more automated and efficient operation
Economies of scale
Synergies
Productivity increase
26
Acquisition of RGE
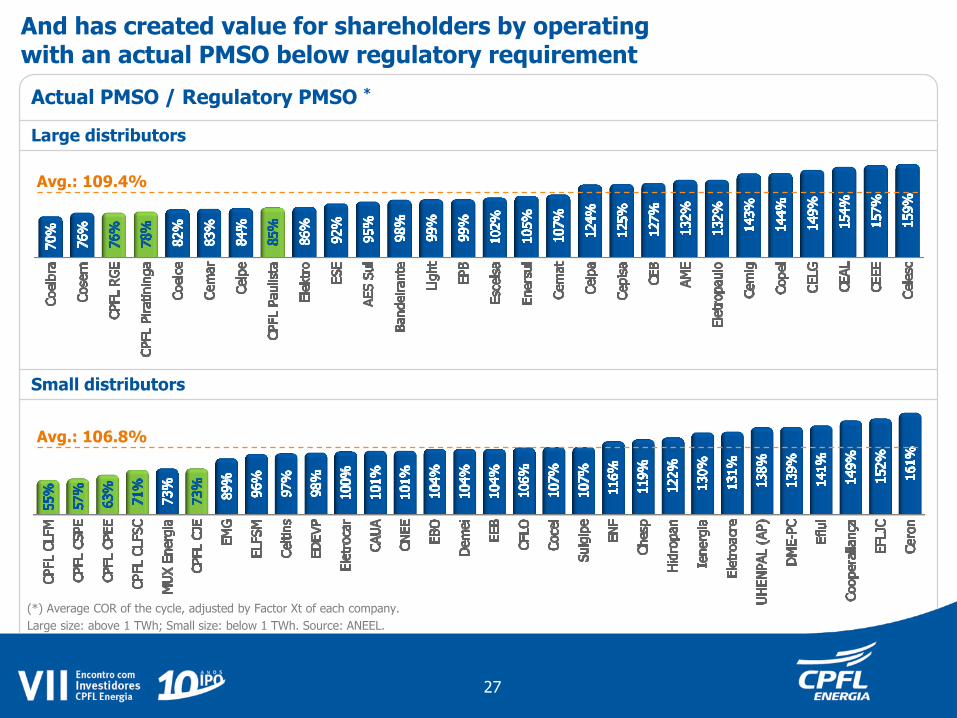
And has created value for shareholders by operating with an actual PMSO below regulatory requirement
Small distributors
Large distributors
Actual PMSO / Regulatory PMSO *
(*) Average COR of the cycle, adjusted by Factor Xt of each company.
Large size: above 1 TWh; Small size: below 1 TWh. Source: ANEEL.
Avg.: 109.4%
Avg.: 106.8%
27
Peers
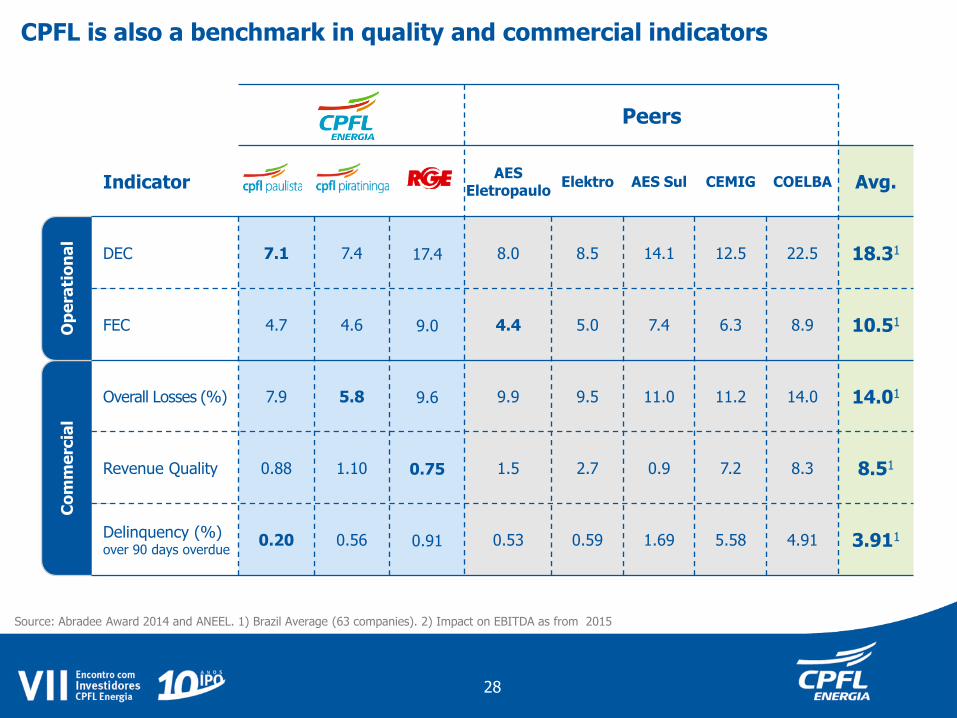
Indicator AES
Eletropaulo Elektro AES Sul CEMIG COELBA Avg.
DEC 7.1 7.4 17.4 8.0 8.5 14.1 12.5 22.5 18.31
FEC 4.7 4.6 9.0 4.4 5.0 7.4 6.3 8.9 10.51
Overall Losses (%) 7.9 5.8 9.6 9.9 9.5 11.0 11.2 14.0 14.01
Revenue Quality 0.88 1.10 0.75 1.5 2.7 0.9 7.2 8.3 8.51
Delinquency (%) over 90 days overdue
0.20 0.56 0.91 0.53 0.59 1.69 5.58 4.91 3.911
CPFL is also a benchmark in quality and commercial indicators
Source: Abradee Award 2014 and ANEEL. 1) Brazil Average (63 companies). 2) Impact on EBITDA as from 2015
Op
era
tio
na
l C
om
me
rcia
l
28
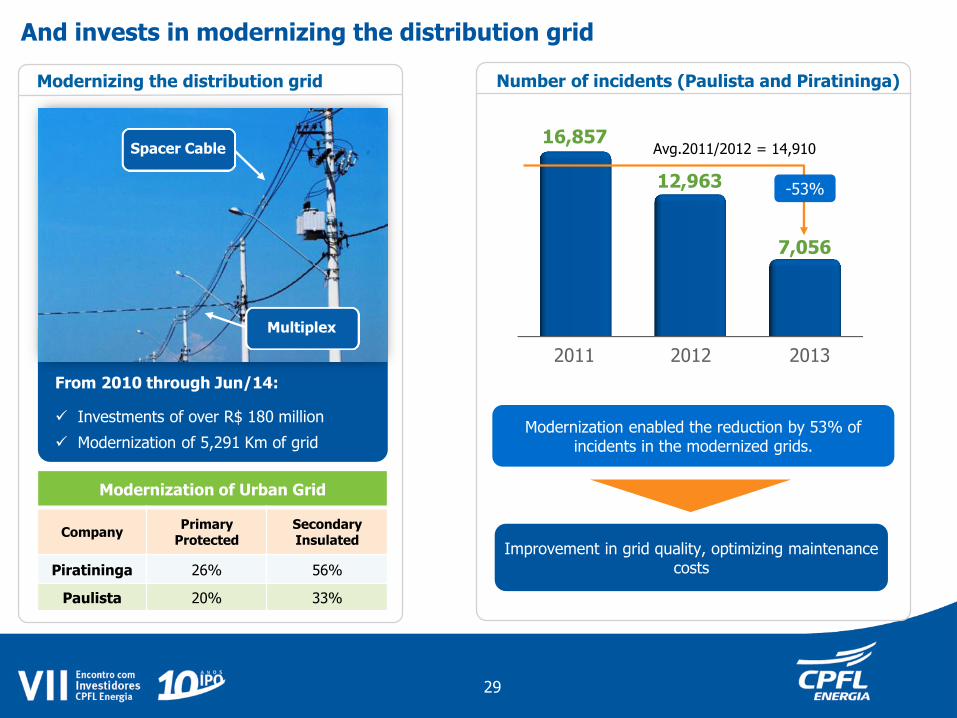
Modernization enabled the reduction by 53% of incidents in the modernized grids.
Modernizing the distribution grid
2013 2012 2011
Number of incidents (Paulista and Piratininga)
Modernization of Urban Grid
Company Primary
Protected Secondary Insulated
Piratininga 26% 56%
Paulista 20% 33%
And invests in modernizing the distribution grid
Spacer Cable
Multiplex
From 2010 through Jun/14:
Investments of over R$ 180 million
Modernization of 5,291 Km of grid
Improvement in grid quality, optimizing maintenance costs
12,963
16,857 Avg.2011/2012 = 14,910
-53%
7,056
29
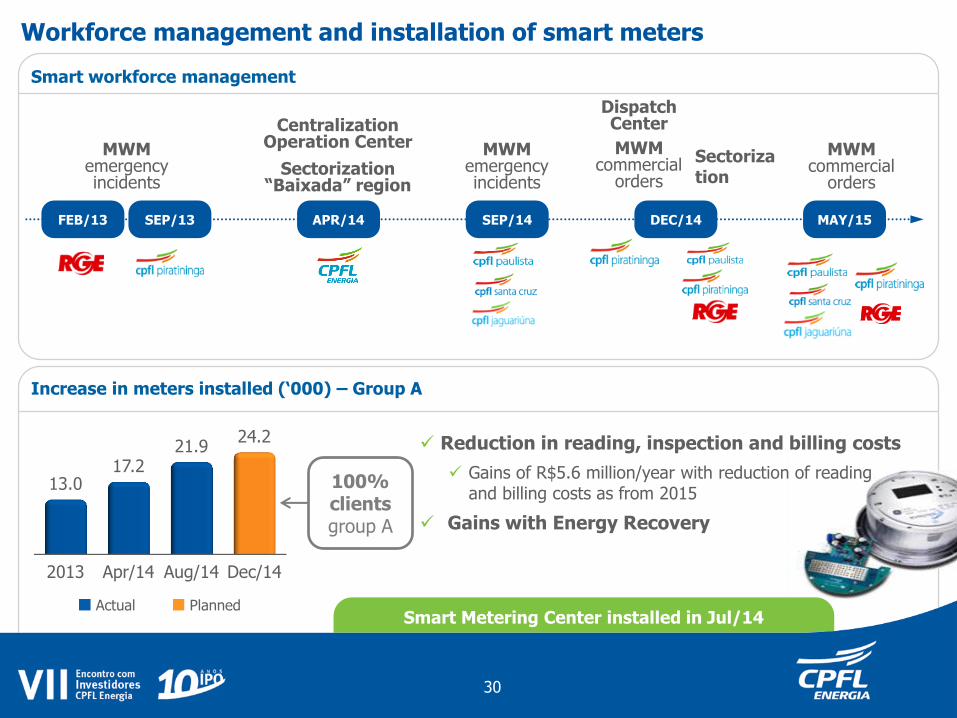
Workforce management and installation of smart meters
Smart workforce management
MWM emergency incidents
Centralization Operation Center
Sectorization “Baixada” region
Dispatch Center
MWM commercial
orders
MWM commercial
orders
MWM emergency incidents
FEB/13 SEP/13 APR/14 SEP/14 DEC/14 MAY/15
Increase in meters installed (‘000) – Group A
2013 Apr/14 Aug/14 Dec/14
13.0 17.2
21.9 24.2
Reduction in reading, inspection and billing costs
Gains of R$5.6 million/year with reduction of reading and billing costs as from 2015
Gains with Energy Recovery
Smart Metering Center installed in Jul/14 Actual Planned
Sectorization
30
100% clients group A
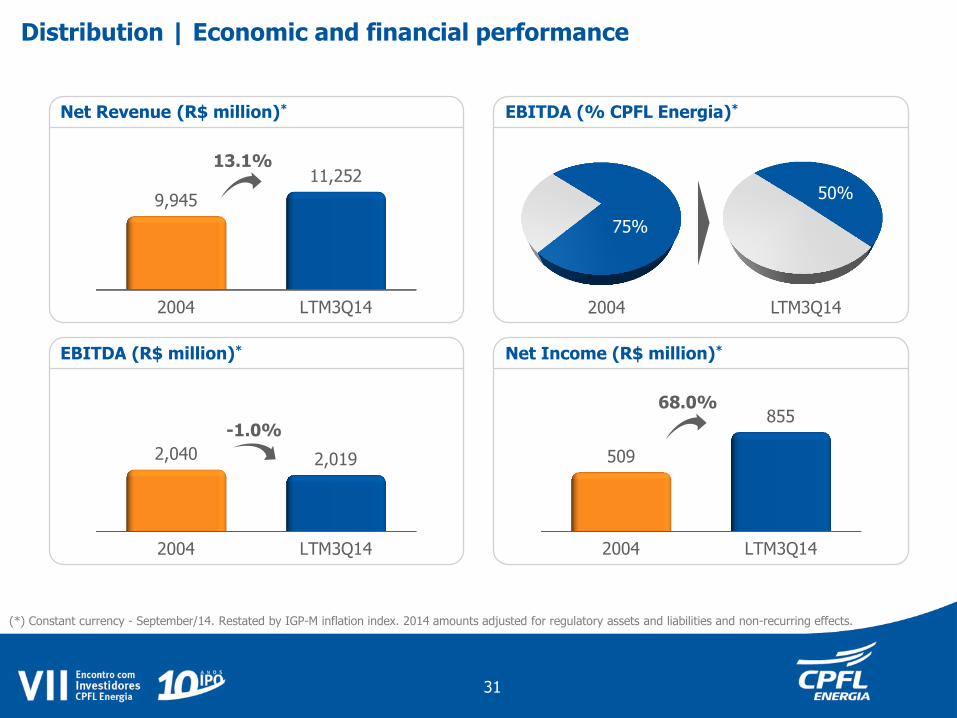
Net Revenue (R$ million)* EBITDA (% CPFL Energia)*
EBITDA (R$ million)* Net Income (R$ million)*
Distribution | Economic and financial performance
2004 LTM3Q14
9,945
11,252 13.1%
2004 LTM3Q14
2,040 2,019
-1.0%
2004 LTM3Q14
509
855 68.0%
2004 LTM3Q14
75%
50%
(*) Constant currency - September/14. Restated by IGP-M inflation index. 2014 amounts adjusted for regulatory assets and liabilities and non-recurring effects.
31
CPFL Energia in the last 10 years
Sustainability
Differentiated Corporate Governance
Financial Discipline and Value Creation Synergic Growth and
Operating Efficiency
Generation and Commercialization
Segments
Distribution
Services and Telecom
Services & Telecom
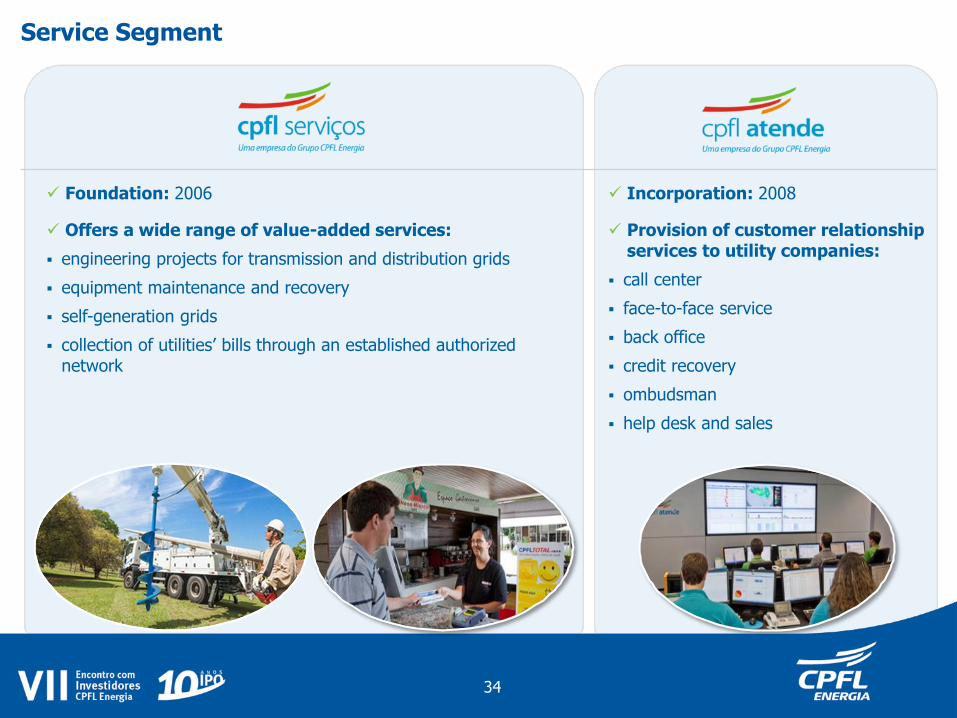
Incorporation: 2008
Provision of customer relationship services to utility companies:
call center
face-to-face service
back office
credit recovery
ombudsman
help desk and sales
Foundation: 2006
Offers a wide range of value-added services:
engineering projects for transmission and distribution grids
equipment maintenance and recovery
self-generation grids
collection of utilities’ bills through an established authorized network
Service Segment
34
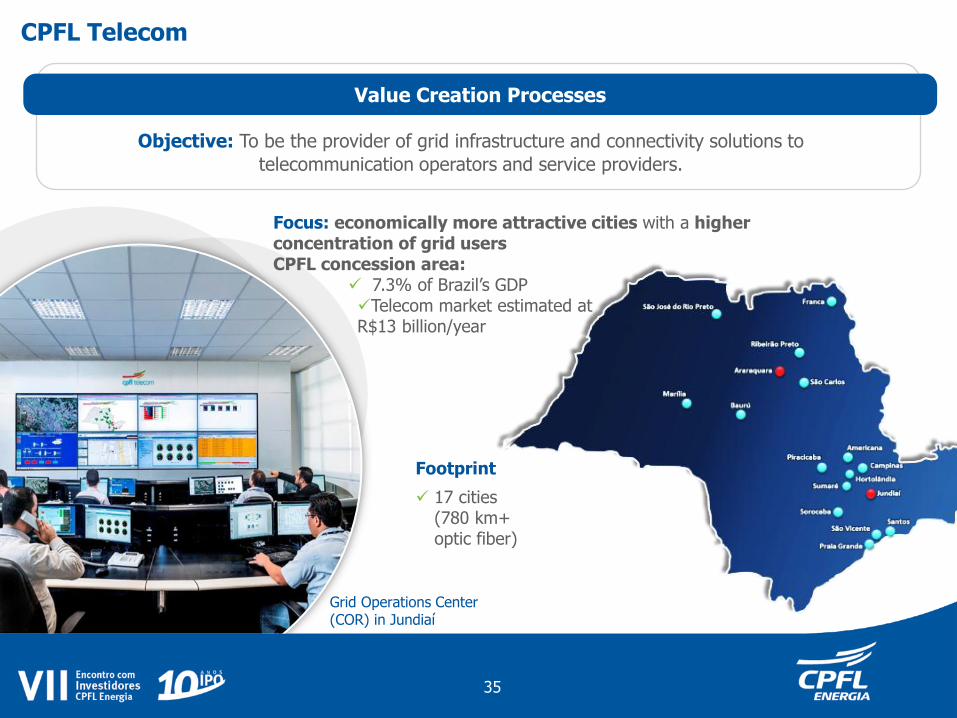
Focus: economically more attractive cities with a higher concentration of grid users CPFL concession area:
7.3% of Brazil’s GDP Telecom market estimated at R$13 billion/year
Value Creation Processes
Objective: To be the provider of grid infrastructure and connectivity solutions to
telecommunication operators and service providers.
CPFL Telecom
Footprint
17 cities (780 km+ optic fiber)
Grid Operations Center (COR) in Jundiaí
35
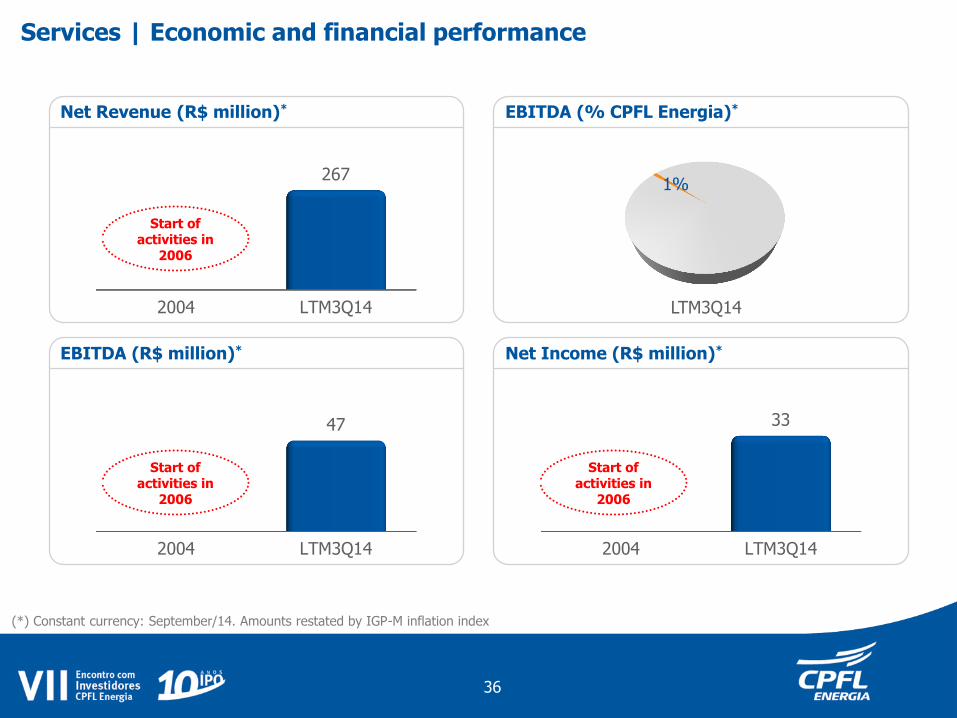
Net Revenue (R$ million)* EBITDA (% CPFL Energia)*
EBITDA (R$ million)* Net Income (R$ million)*
Services | Economic and financial performance
2004 LTM3Q14
267
2004 LTM3Q14
47
2004 LTM3Q14
33
LTM3Q14
9% 1%
(*) Constant currency: September/14. Amounts restated by IGP-M inflation index
Start of activities in
2006
Start of activities in
2006
Start of activities in
2006
36
CPFL Energia in the last 10 years
Sustainability
Differentiated Corporate Governance
Financial Discipline and Value Creation Synergic Growth and
Operating Efficiency
Generation and Commercialization
Segments
Distribution
Services and Telecom
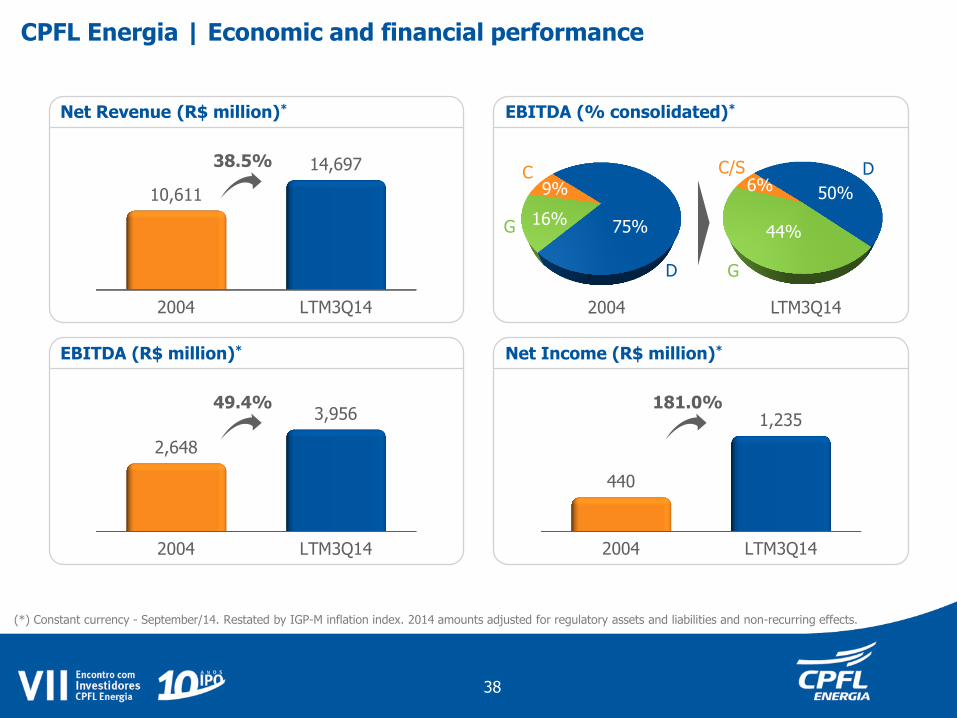
Net Revenue (R$ million)* EBITDA (% consolidated)*
EBITDA (R$ million)* Net Income (R$ million)*
CPFL Energia | Economic and financial performance
2004 LTM3Q14
10,611
14,697 38.5%
2004 LTM3Q14
2,648
3,956
2004 LTM3Q14
440
1,235 181.0%
2004 LTM3Q14
75%
50%
(*) Constant currency - September/14. Restated by IGP-M inflation index. 2014 amounts adjusted for regulatory assets and liabilities and non-recurring effects.
49.4%
9% 6%
16% 44%
C
G
D
C/S
G
D
38
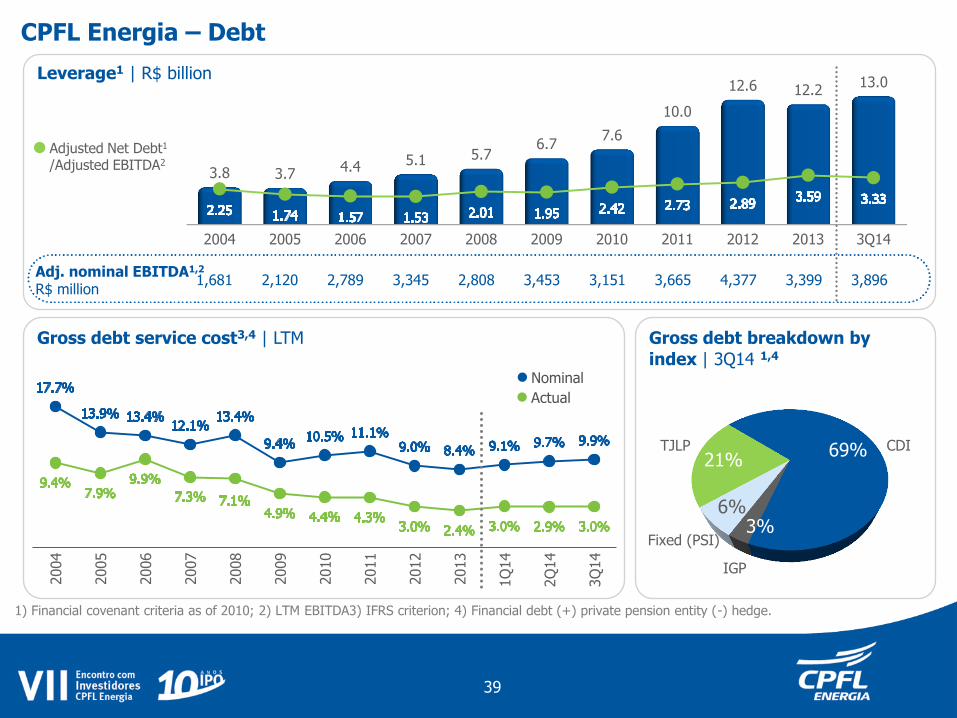
2004 2005 2006 2007 2008 2009 2010 2011 2012 2013 3Q14
3.8 3.7 4.4 5.1 5.7 6.7
7.6
10.0
12.6 12.2 13.0
Leverage1 | R$ billion
Adjusted Net Debt1
/Adjusted EBITDA2
1,681 2,120 2,789 3,345 2,808 3,453 3,151 3,665 4,377 3,399 3,896 Adj. nominal EBITDA1,2
R$ million
69%
3% 6%
21% CDI
Fixed (PSI)
IGP
TJLP
Gross debt breakdown by
index | 3Q14 1,4
Gross debt service cost3,4 | LTM
2004
2005
2006
2007
2008
2009
2010
2011
2012
2013
1Q
14
2Q
14
3Q
14
Nominal
Actual
1) Financial covenant criteria as of 2010; 2) LTM EBITDA3) IFRS criterion; 4) Financial debt (+) private pension entity (-) hedge.
CPFL Energia – Debt
39
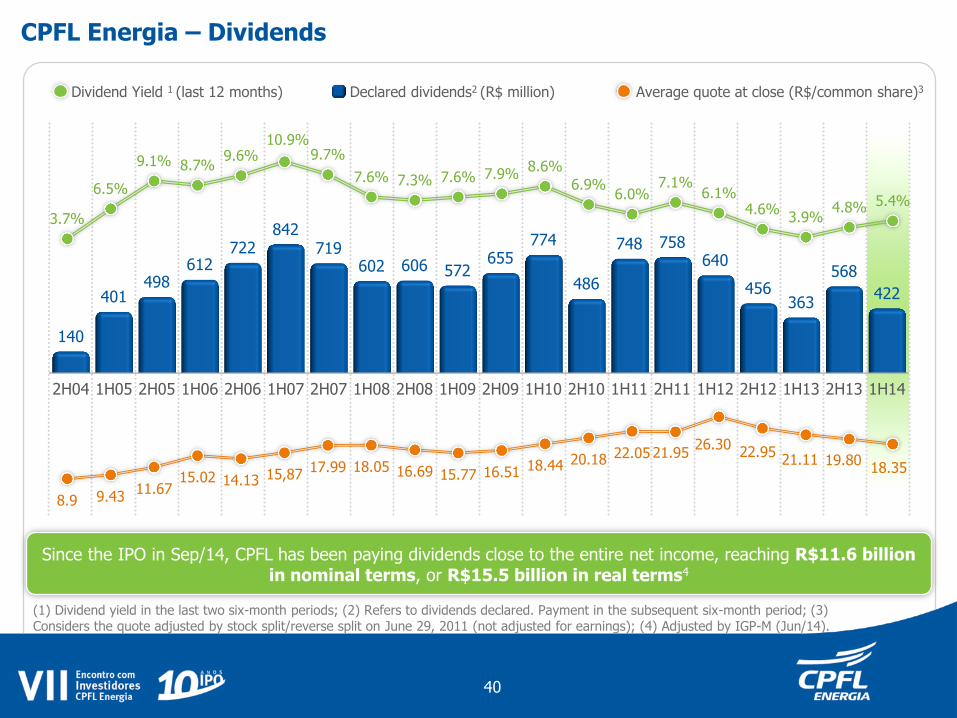
Dividend Yield 1 (last 12 months) Declared dividends2 (R$ million) Average quote at close (R$/common share)3
2H04 1H05 2H05 1H06 2H06 1H07 2H07 1H08 2H08 1H09 2H09 1H10 2H10 1H11 2H11 1H12 2H12 1H13 2H13 1H14
140
401 498
612 722
842 719
602 606 572 655
774
486
748 758 640
456 363
568
422
8.9 9.43 11.67
15.02 14.13 15,87 17.99 18.05 16.69 15.77 16.51 18.44 20.18 22.05 21.95
26.30 22.95
21.11 19.80 18.35
3.7%
6.5%
9.1% 8.7% 9.6%
10.9% 9.7%
7.6% 7.3% 7.6% 7.9% 8.6%
6.9% 6.0%
7.1% 6.1%
4.6% 3.9%
4.8% 5.4%
CPFL Energia – Dividends
Since the IPO in Sep/14, CPFL has been paying dividends close to the entire net income, reaching R$11.6 billion in nominal terms, or R$15.5 billion in real terms4
(1) Dividend yield in the last two six-month periods; (2) Refers to dividends declared. Payment in the subsequent six-month period; (3) Considers the quote adjusted by stock split/reverse split on June 29, 2011 (not adjusted for earnings); (4) Adjusted by IGP-M (Jun/14).
40
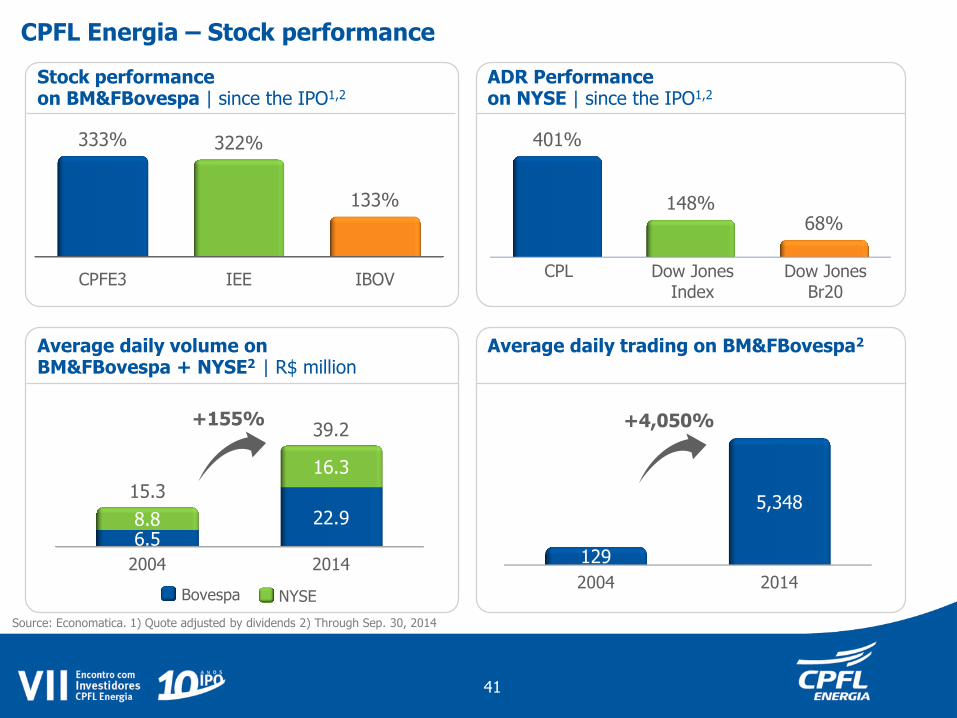
CPFL Energia – Stock performance
Source: Economatica. 1) Quote adjusted by dividends 2) Through Sep. 30, 2014
CPFE3 IEE IBOV
333% 322%
133%
401%
148% 68%
CPL Dow Jones Br20
Dow Jones Index
Bovespa NYSE
Average daily volume on BM&FBovespa + NYSE2 | R$ million
Average daily trading on BM&FBovespa2
ADR Performance on NYSE | since the IPO1,2
Stock performance on BM&FBovespa | since the IPO1,2
2004 2014
6.5 22.9 8.8
16.3
+155%
15.3
39.2
2004 2014
129
5,348
+4,050%
41
CPFL Energia in the last 10 years
Sustainability
Differentiated Corporate Governance
Financial Discipline and Value Creation Synergic Growth and
Operating Efficiency
Generation and Commercialization
Segments
Distribution
Services and Telecom
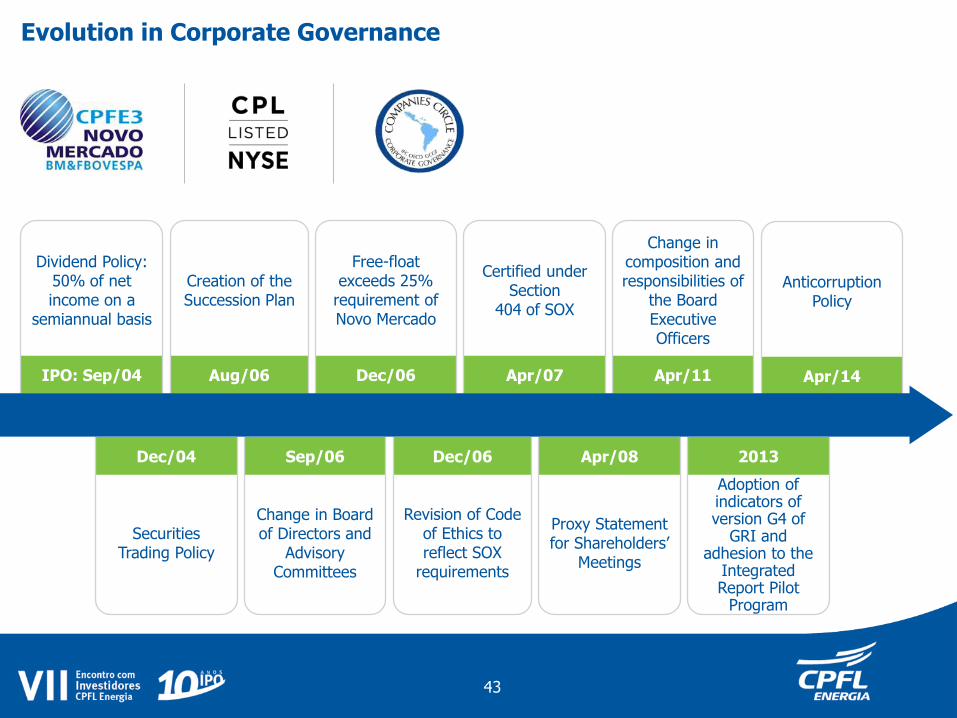
Evolution in Corporate Governance
Securities Trading Policy
Dividend Policy: 50% of net income on a
semiannual basis
Creation of the Succession Plan
Free-float exceeds 25%
requirement of Novo Mercado
Certified under Section
404 of SOX
Change in composition and responsibilities of
the Board Executive Officers
Change in Board of Directors and
Advisory Committees
Revision of Code of Ethics to reflect SOX
requirements
Proxy Statement for Shareholders’
Meetings
Adoption of indicators of version G4 of
GRI and adhesion to the
Integrated Report Pilot
Program
IPO: Sep/04 Aug/06 Dec/06 Apr/07 Apr/11
Dec/04 Sep/06 Dec/06 Apr/08 2013
Anticorruption Policy
Apr/14
43
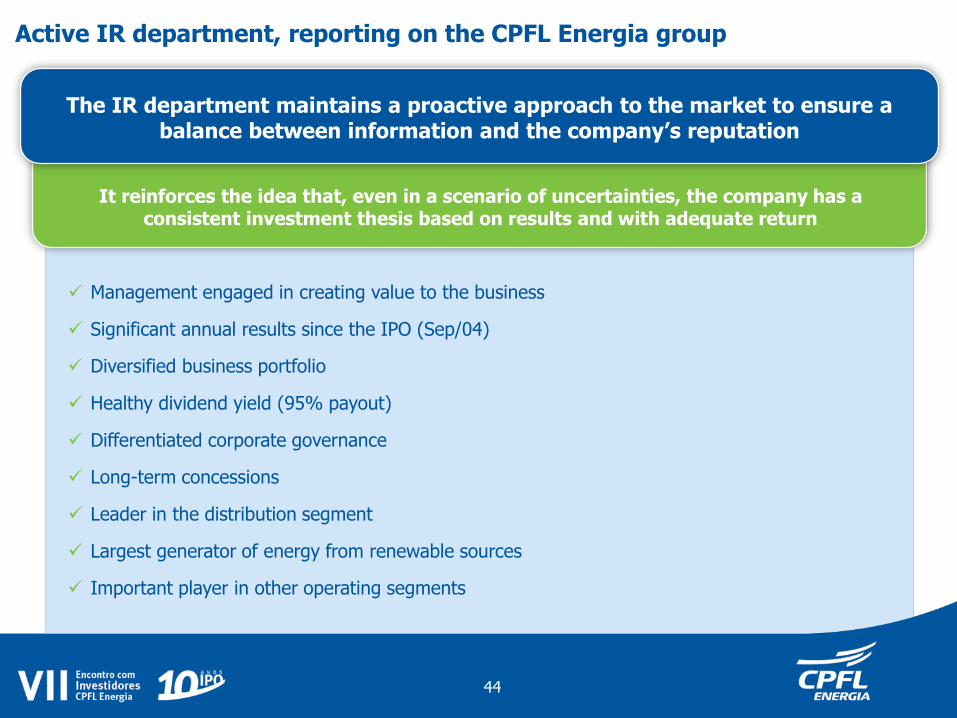
Active IR department, reporting on the CPFL Energia group
Management engaged in creating value to the business
Significant annual results since the IPO (Sep/04)
Diversified business portfolio
Healthy dividend yield (95% payout)
Differentiated corporate governance
Long-term concessions
Leader in the distribution segment
Largest generator of energy from renewable sources
Important player in other operating segments
It reinforces the idea that, even in a scenario of uncertainties, the company has a consistent investment thesis based on results and with adequate return
The IR department maintains a proactive approach to the market to ensure a balance between information and the company’s reputation
44
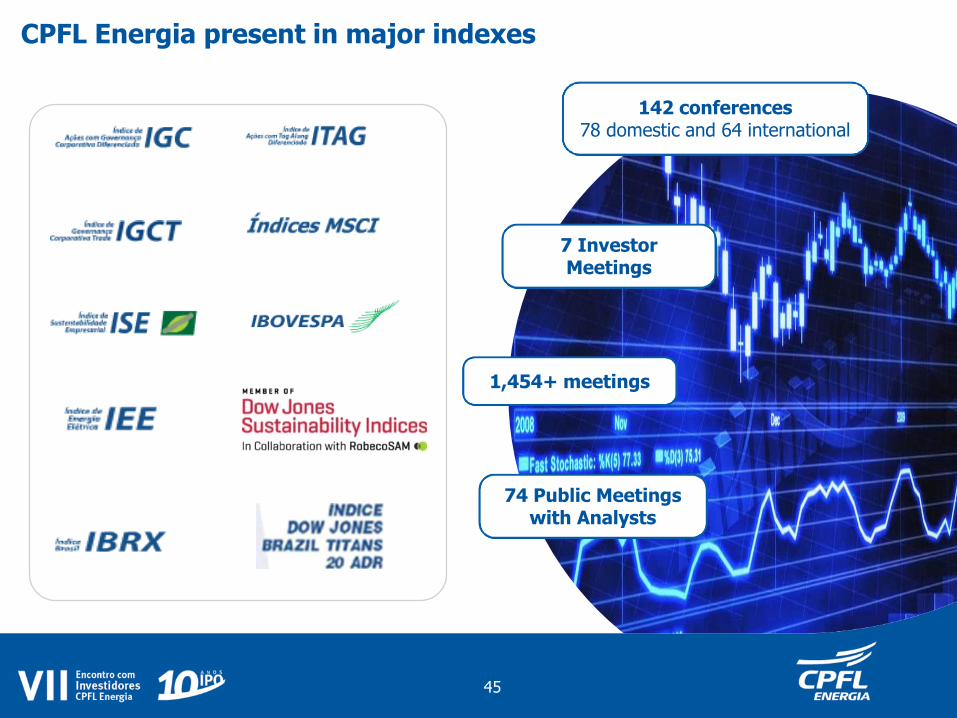
CPFL Energia present in major indexes
1,454+ meetings
142 conferences 78 domestic and 64 international
7 Investor Meetings
74 Public Meetings with Analysts
45
CPFL Energia in the last 10 years
Sustainability
Differentiated Corporate Governance
Financial Discipline and Value Creation Synergic Growth and
Operating Efficiency
Generation and Commercialization
Segments
Distribution
Services and Telecom
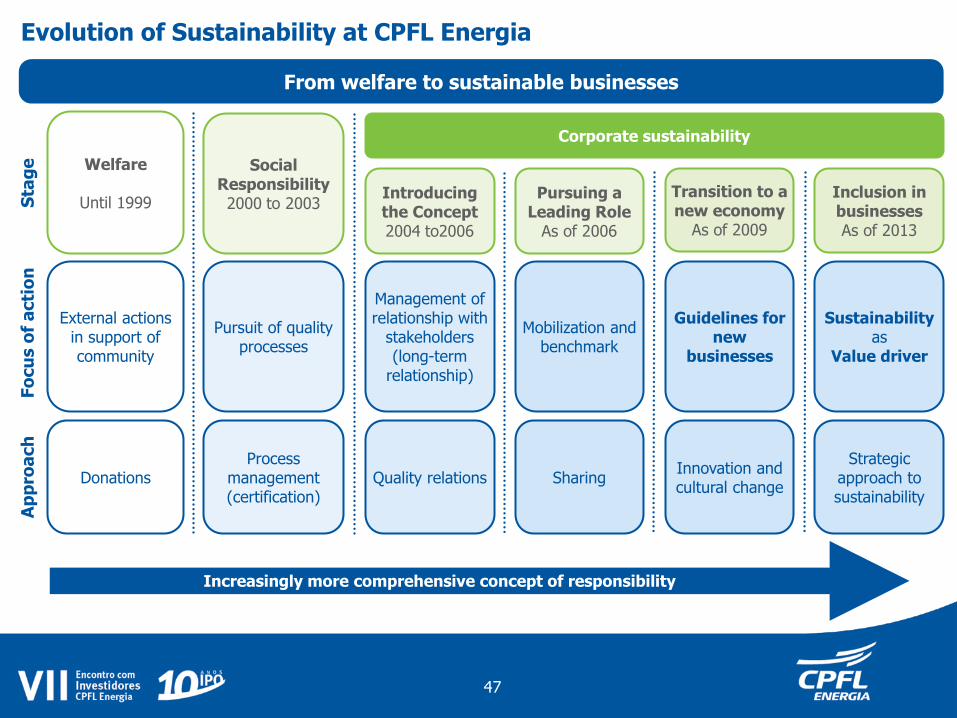
Evolution of Sustainability at CPFL Energia
Increasingly more comprehensive concept of responsibility
Welfare
Until 1999
Donations
External actions in support of community
Social Responsibility 2000 to 2003
Process management (certification)
Pursuit of quality processes
Introducing the Concept 2004 to2006
Quality relations
Management of relationship with
stakeholders (long-term
relationship)
Pursuing a Leading Role
As of 2006
Sharing
Mobilization and benchmark
Transition to a new economy
As of 2009
Innovation and cultural change
Guidelines for new
businesses
Corporate sustainability
Sta
ge
Fo
cu
s o
f a
cti
on
A
pp
roa
ch
Inclusion in businesses As of 2013
Strategic approach to sustainability
Sustainability as
Value driver
From welfare to sustainable businesses
47
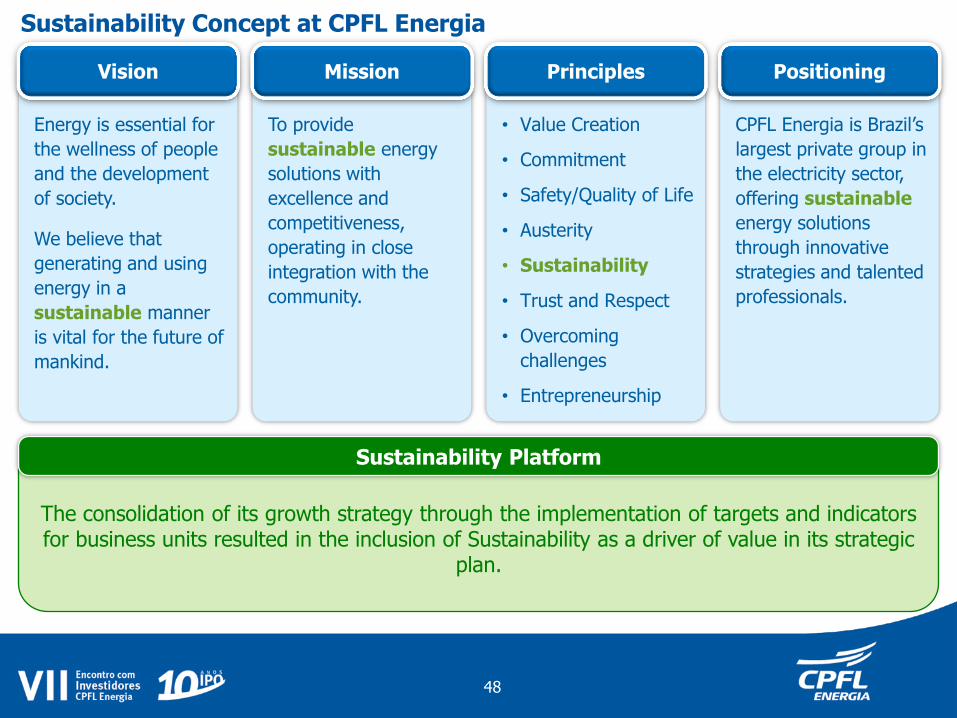
Sustainability Concept at CPFL Energia
Energy is essential for
the wellness of people
and the development
of society.
We believe that
generating and using
energy in a
sustainable manner
is vital for the future of
mankind.
Vision
To provide
sustainable energy
solutions with
excellence and
competitiveness,
operating in close
integration with the
community.
Mission
• Value Creation
• Commitment
• Safety/Quality of Life
• Austerity
• Sustainability
• Trust and Respect
• Overcoming
challenges
• Entrepreneurship
Principles
CPFL Energia is Brazil’s
largest private group in
the electricity sector,
offering sustainable
energy solutions
through innovative
strategies and talented
professionals.
Positioning
The consolidation of its growth strategy through the implementation of targets and indicators for business units resulted in the inclusion of Sustainability as a driver of value in its strategic
plan.
Sustainability Platform
48
Do assistencialismo aos negócios sustentáveis Principais Prêmios e Reconhecimentos
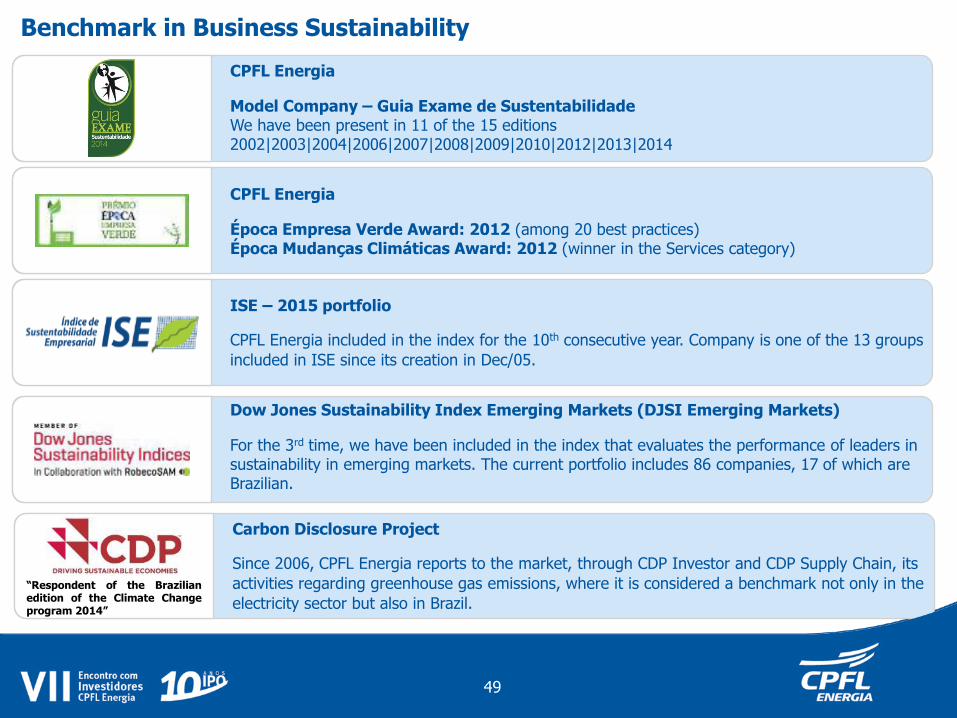
CPFL Energia
Model Company – Guia Exame de Sustentabilidade We have been present in 11 of the 15 editions 2002|2003|2004|2006|2007|2008|2009|2010|2012|2013|2014
CPFL Energia
Época Empresa Verde Award: 2012 (among 20 best practices) Época Mudanças Climáticas Award: 2012 (winner in the Services category)
ISE – 2015 portfolio
CPFL Energia included in the index for the 10th consecutive year. Company is one of the 13 groups
included in ISE since its creation in Dec/05.
Dow Jones Sustainability Index Emerging Markets (DJSI Emerging Markets)
For the 3rd time, we have been included in the index that evaluates the performance of leaders in sustainability in emerging markets. The current portfolio includes 86 companies, 17 of which are Brazilian.
Benchmark in Business Sustainability
Carbon Disclosure Project
Since 2006, CPFL Energia reports to the market, through CDP Investor and CDP Supply Chain, its
activities regarding greenhouse gas emissions, where it is considered a benchmark not only in the
electricity sector but also in Brazil.
“Respondent of the Brazilian edition of the Climate Change program 2014”
49
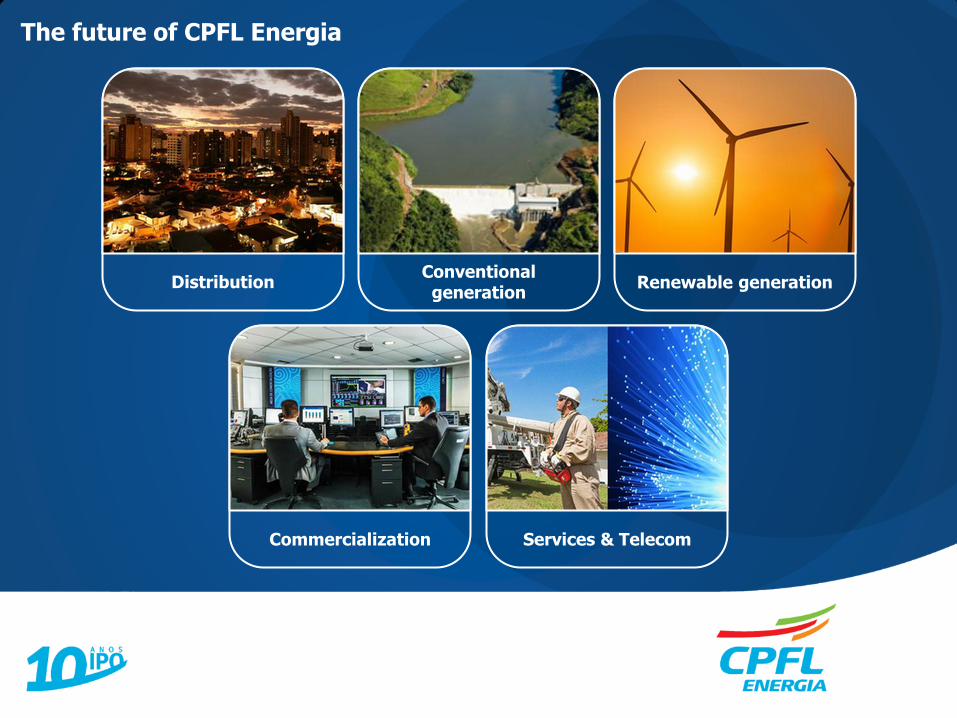
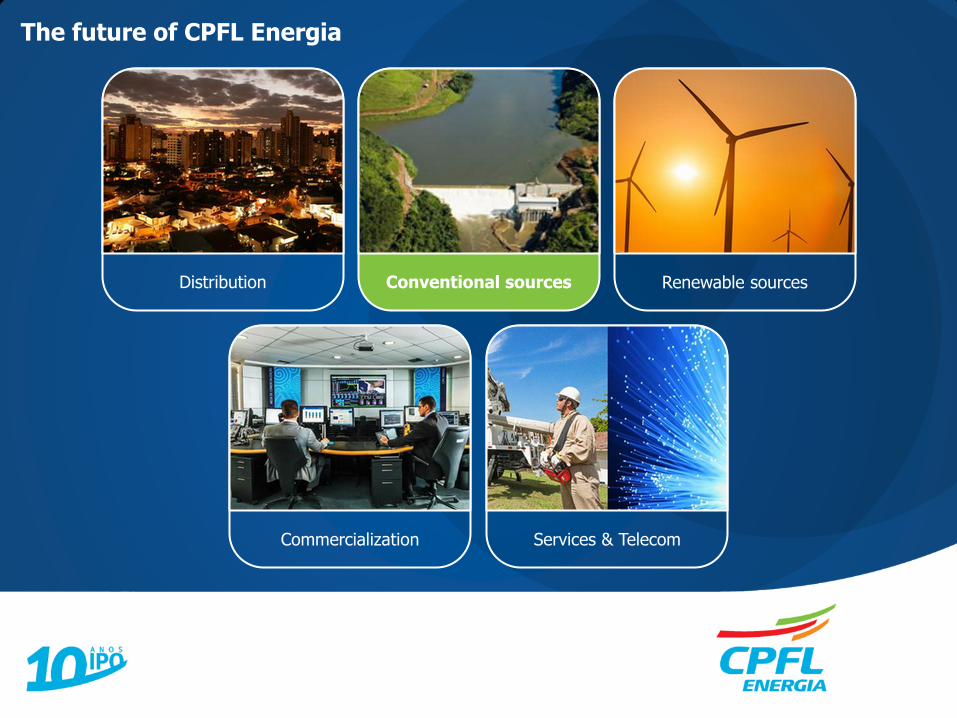
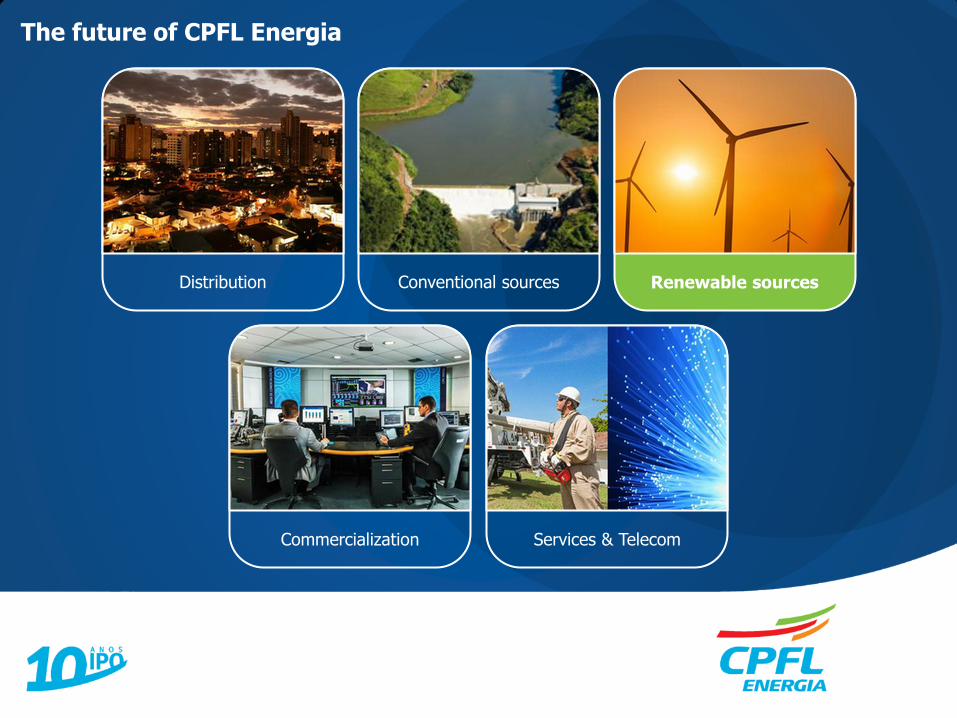
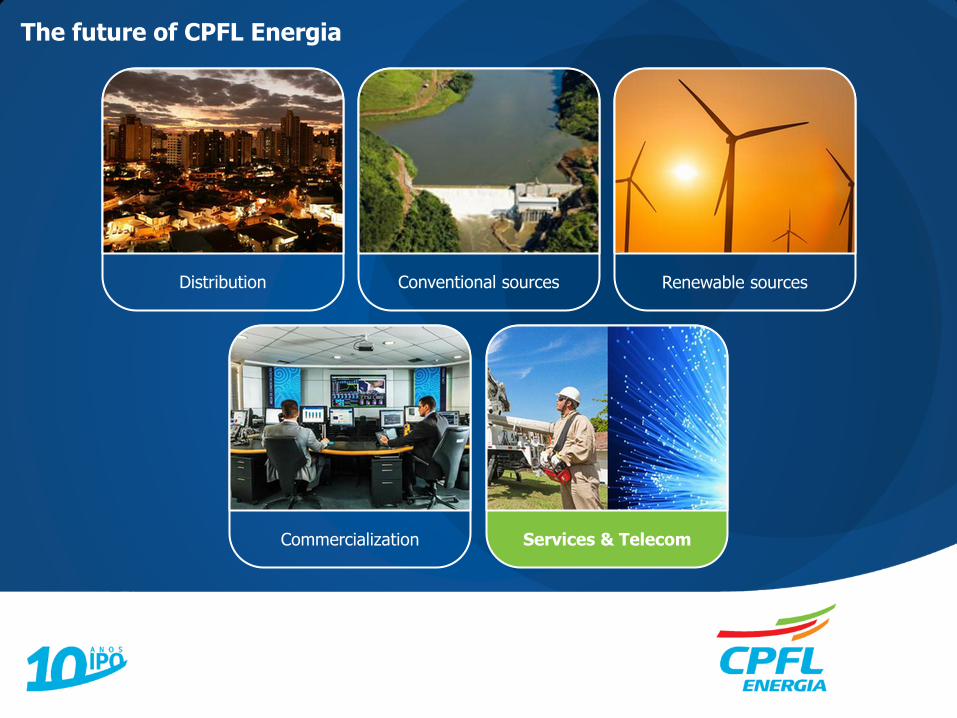
The future of CPFL Energia
Conventional generation
Renewable generation
Commercialization
Distribution
Services & Telecom
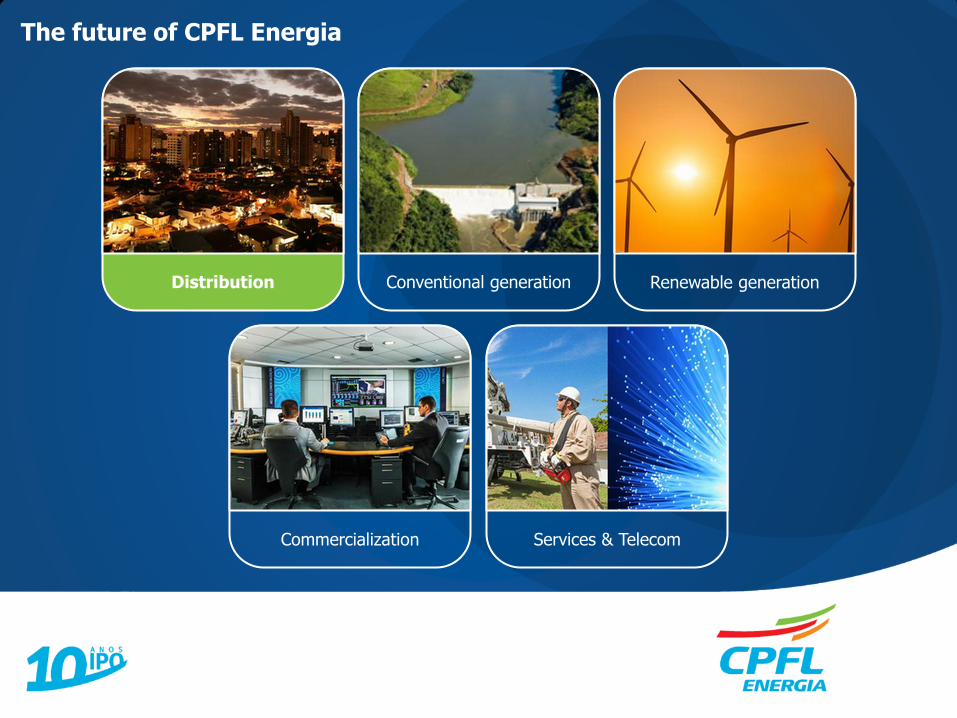
The future of CPFL Energia
Conventional generation Renewable generation
Commercialization
Distribution
Services & Telecom
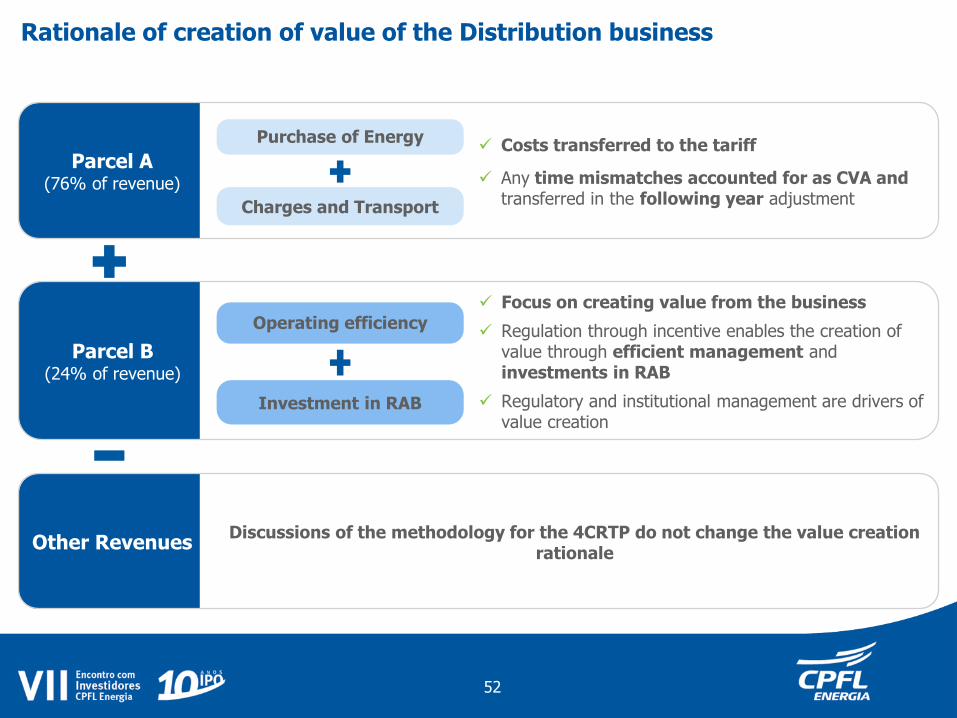
Rationale of creation of value of the Distribution business
Purchase of Energy Costs transferred to the tariff
Any time mismatches accounted for as CVA and transferred in the following year adjustment
Parcela A (76% da receita)
Parcel A (76% of revenue)
Charges and Transport
Focus on creating value from the business
Regulation through incentive enables the creation of value through efficient management and investments in RAB
Regulatory and institutional management are drivers of value creation
Parcel B (24% of revenue)
Operating efficiency
Investment in RAB
Discussions of the methodology for the 4CRTP do not change the value creation rationale
Other Revenues
52
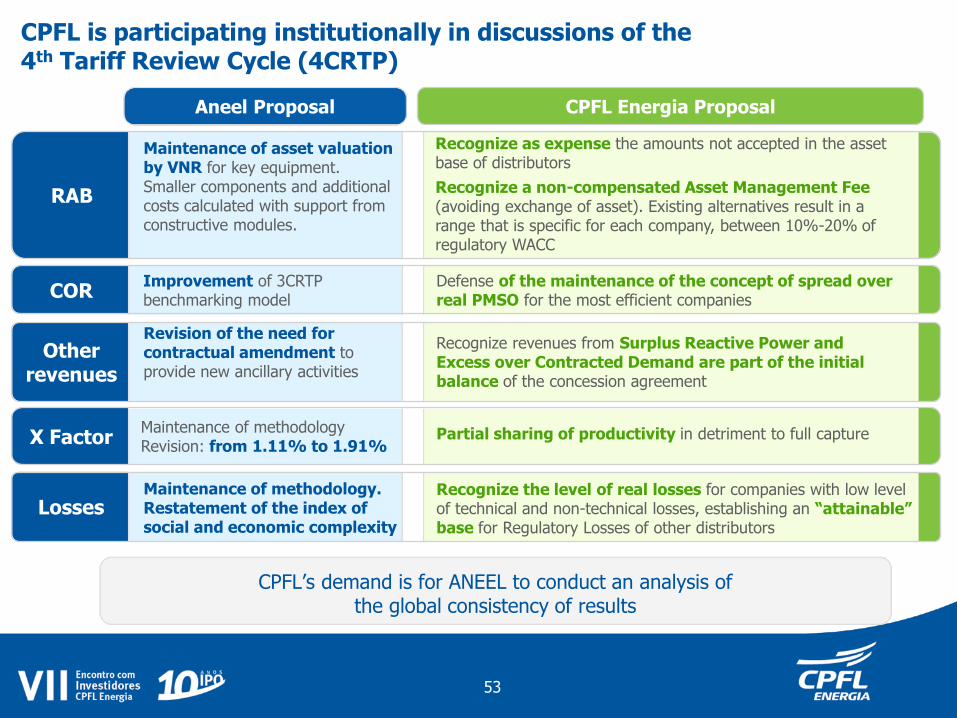
Recognize the level of real losses for companies with low level of technical and non-technical losses, establishing an “attainable” base for Regulatory Losses of other distributors
Recognize as expense the amounts not accepted in the asset base of distributors
Recognize a non-compensated Asset Management Fee (avoiding exchange of asset). Existing alternatives result in a range that is specific for each company, between 10%-20% of regulatory WACC
Recognize revenues from Surplus Reactive Power and Excess over Contracted Demand are part of the initial balance of the concession agreement
Partial sharing of productivity in detriment to full capture
Maintenance of asset valuation by VNR for key equipment. Smaller components and additional costs calculated with support from constructive modules.
Revision of the need for contractual amendment to provide new ancillary activities
Maintenance of methodology Revision: from 1.11% to 1.91%
Maintenance of methodology. Restatement of the index of social and economic complexity
Improvement of 3CRTP benchmarking model
Defense of the maintenance of the concept of spread over real PMSO for the most efficient companies
CPFL’s demand is for ANEEL to conduct an analysis of the global consistency of results
RAB
COR
Other revenues
X Factor
Losses
CPFL Energia Proposal Aneel Proposal
53
CPFL is participating institutionally in discussions of the 4th Tariff Review Cycle (4CRTP)
WACC
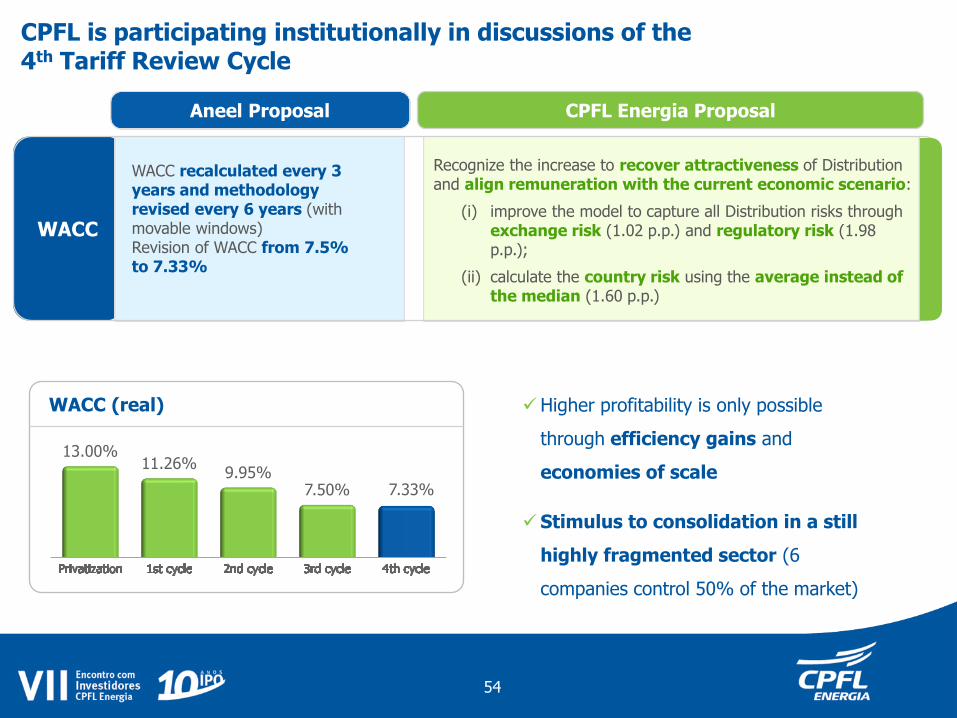
CPFL is participating institutionally in discussions of the 4th Tariff Review Cycle
WACC recalculated every 3 years and methodology revised every 6 years (with movable windows) Revision of WACC from 7.5% to 7.33%
13.00% 11.26%
9.95% 7.50% 7.33%
Higher profitability is only possible
through efficiency gains and
economies of scale
Stimulus to consolidation in a still
highly fragmented sector (6
companies control 50% of the market)
Recognize the increase to recover attractiveness of Distribution and align remuneration with the current economic scenario:
(i) improve the model to capture all Distribution risks through exchange risk (1.02 p.p.) and regulatory risk (1.98 p.p.);
(ii) calculate the country risk using the average instead of the median (1.60 p.p.)
WACC (real)
CPFL Energia Proposal Aneel Proposal
54
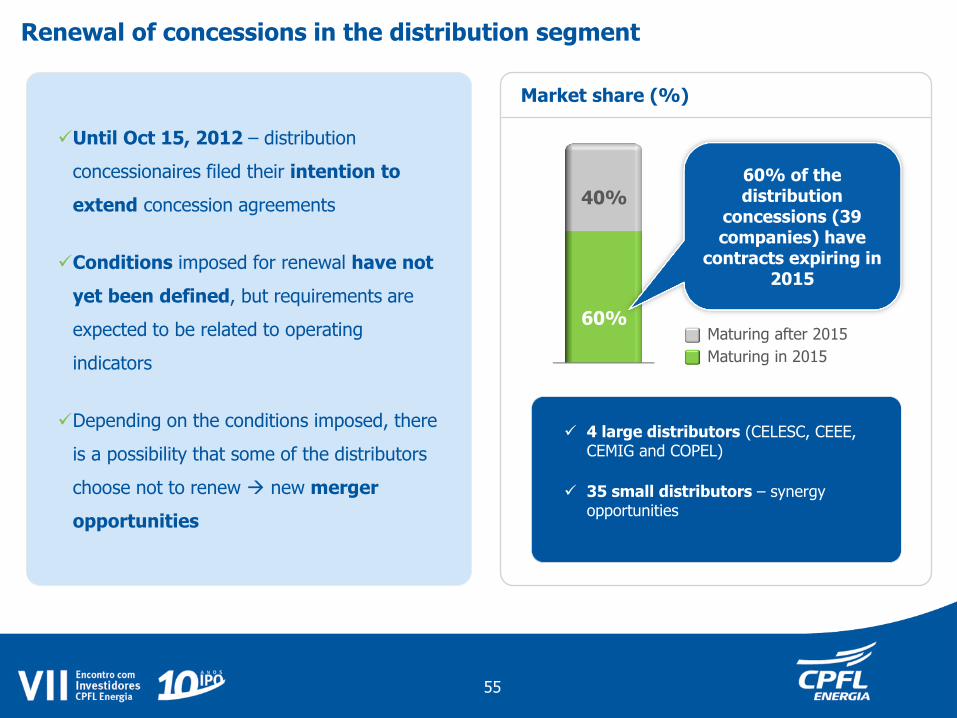
Maturing in 2015
Maturing after 2015
4 large distributors (CELESC, CEEE, CEMIG and COPEL)
35 small distributors – synergy opportunities
Until Oct 15, 2012 – distribution
concessionaires filed their intention to
extend concession agreements
Conditions imposed for renewal have not
yet been defined, but requirements are
expected to be related to operating
indicators
Depending on the conditions imposed, there
is a possibility that some of the distributors
choose not to renew new merger
opportunities
60%
40%
60% of the distribution
concessions (39 companies) have
contracts expiring in 2015
Renewal of concessions in the distribution segment
Market share (%)
55
The future of CPFL Energia
Conventional sources Renewable sources
Commercialization
Distribution
Services & Telecom
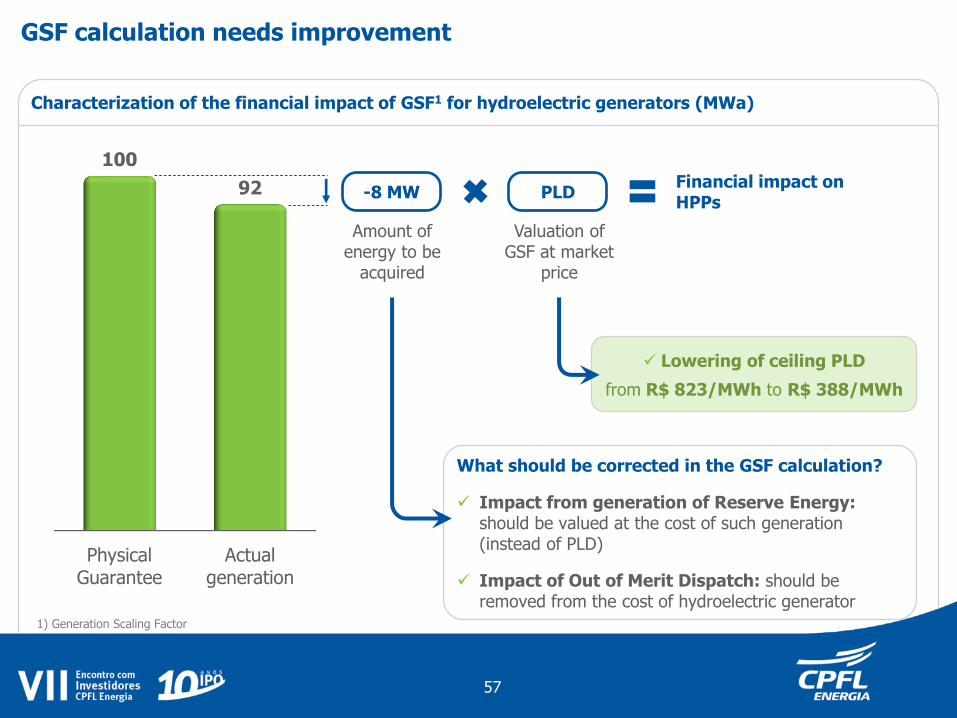
PhysicalGuarantee
Actualgeneration
100
92
GSF calculation needs improvement
Characterization of the financial impact of GSF1 for hydroelectric generators (MWa)
-8 MW
Amount of energy to be
acquired
Valuation of GSF at market
price
PLD Financial impact on HPPs
Lowering of ceiling PLD
from R$ 823/MWh to R$ 388/MWh
What should be corrected in the GSF calculation?
Impact from generation of Reserve Energy: should be valued at the cost of such generation (instead of PLD)
Impact of Out of Merit Dispatch: should be removed from the cost of hydroelectric generator
57
1) Generation Scaling Factor
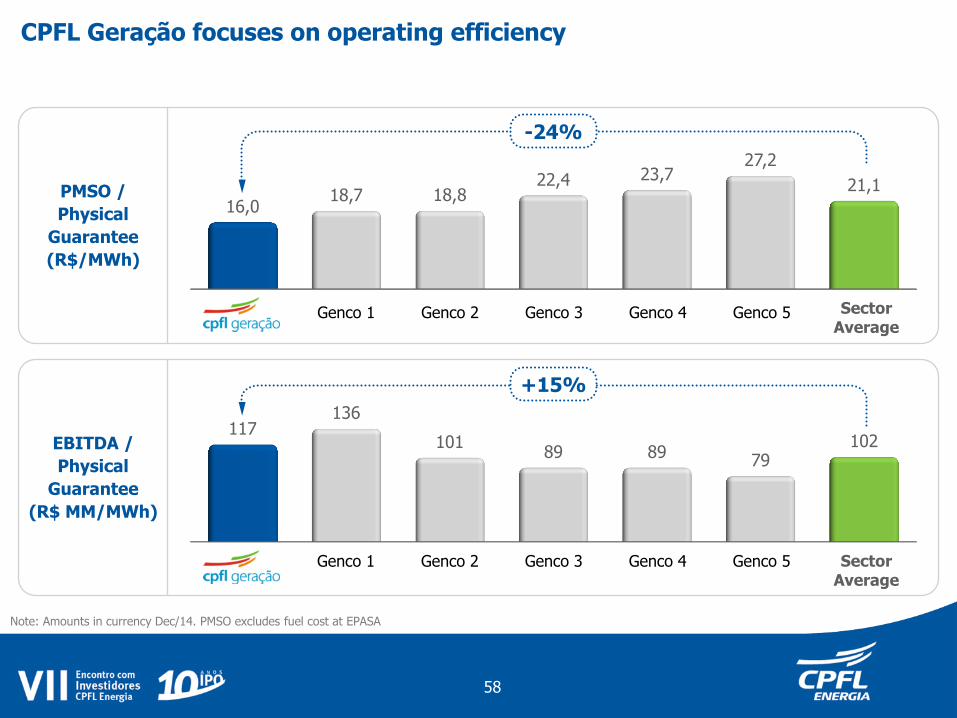
16,0 18,7 18,8
22,4 23,7 27,2
21,1
CPFL Geração focuses on operating efficiency
Note: Amounts in currency Dec/14. PMSO excludes fuel cost at EPASA
PMSO /
Physical
Guarantee
(R$/MWh)
EBITDA /
Physical
Guarantee
(R$ MM/MWh)
Sector Average
Sector Average
117 136
101 89 89 79
102
-24%
+15%
58
Genco 1 Genco 2 Genco 3 Genco 4 Genco 5
Genco 1 Genco 2 Genco 3 Genco 4 Genco 5
The future of CPFL Energia
Conventional sources Renewable sources
Commercialization
Distribution
Services & Telecom
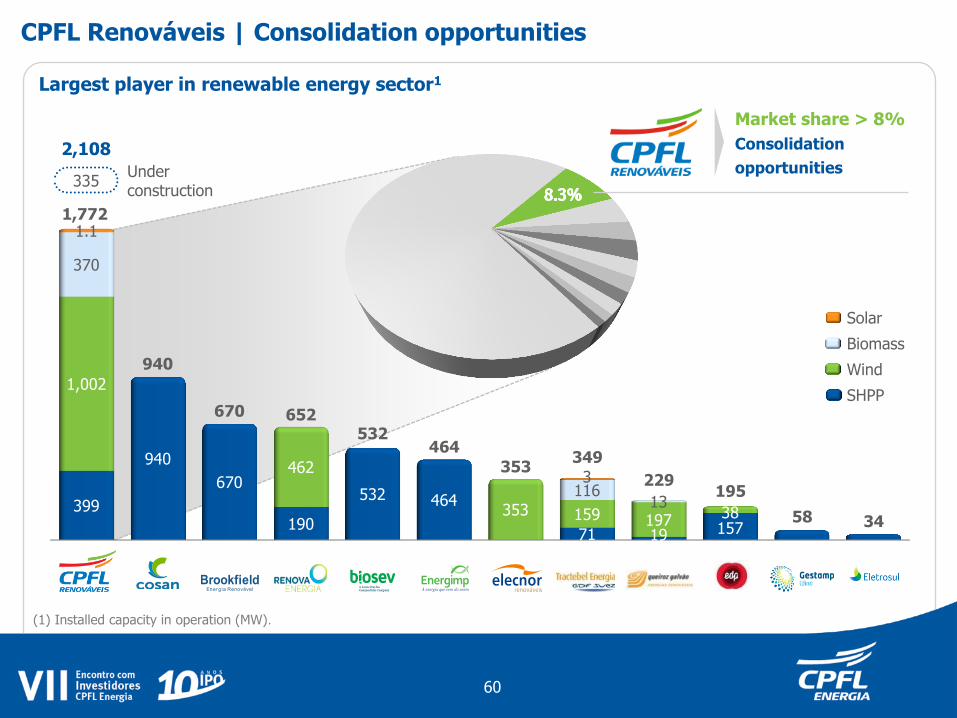
Largest player in renewable energy sector1
399
940
670
190
532 464
71 19 157
1,002
462
353 159 197 38
370
116 13
1.1
3
335
940
670 652 532
464
353 349
229 195
58 34
2,108
Under construction
SHPP
Biomass
Solar
Wind
1,772
Market share > 8%
Consolidation
opportunities
CPFL Renováveis | Consolidation opportunities
60
(1) Installed capacity in operation (MW).
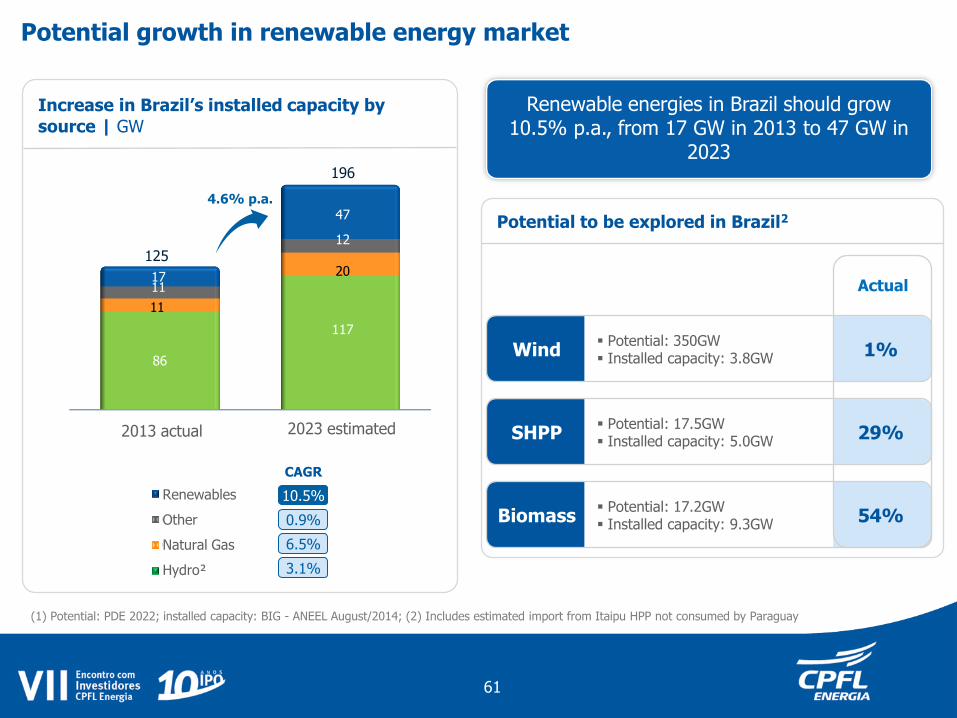
Potential growth in renewable energy market
86
117
11
12
11
20 17
47
Renováveis
Outros
Gás Natural
Hidro
2023 estimated 2013 actual
Increase in Brazil’s installed capacity by
source | GW
4.6% p.a.
196
125
CAGR
0.9%
10.5%
6.5%
3.1% 2
Renewable energies in Brazil should grow 10.5% p.a., from 17 GW in 2013 to 47 GW in
2023
1% Wind Potential: 350GW
Installed capacity: 3.8GW
29% SHPP Potential: 17.5GW Installed capacity: 5.0GW
54% Biomass Potential: 17.2GW Installed capacity: 9.3GW
Potential to be explored in Brazil2
Actual
61
(1) Potential: PDE 2022; installed capacity: BIG - ANEEL August/2014; (2) Includes estimated import from Itaipu HPP not consumed by Paraguay
Renewables
Other
Natural Gas
Hydro²
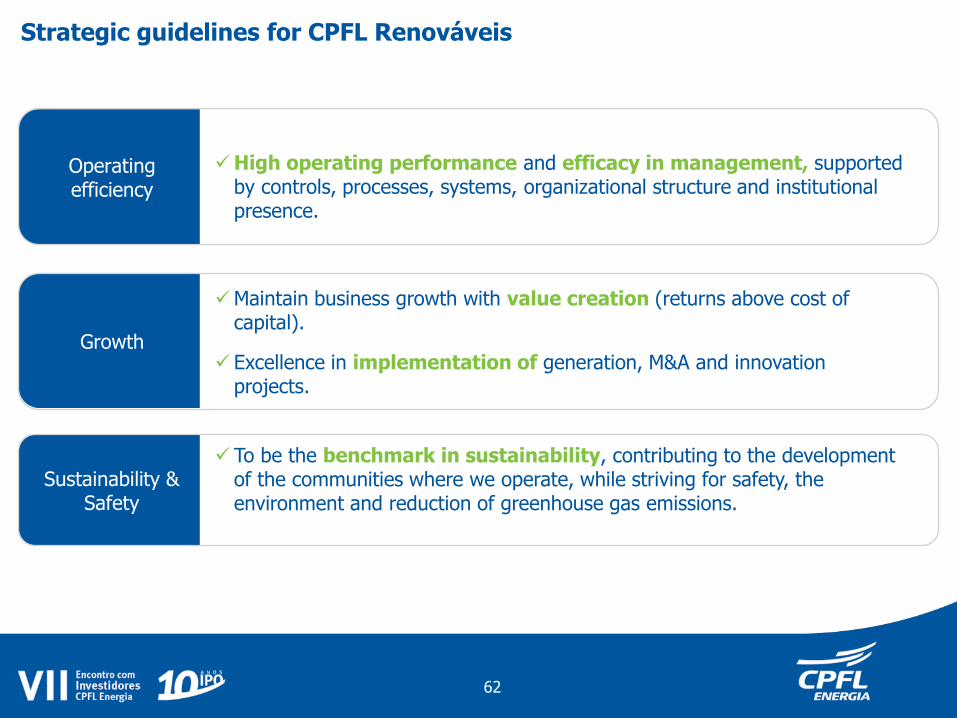
Sustainability & Safety
Operating efficiency
Growth
Strategic guidelines for CPFL Renováveis
High operating performance and efficacy in management, supported by controls, processes, systems, organizational structure and institutional presence.
To be the benchmark in sustainability, contributing to the development of the communities where we operate, while striving for safety, the environment and reduction of greenhouse gas emissions.
Maintain business growth with value creation (returns above cost of capital).
Excellence in implementation of generation, M&A and innovation projects.
62
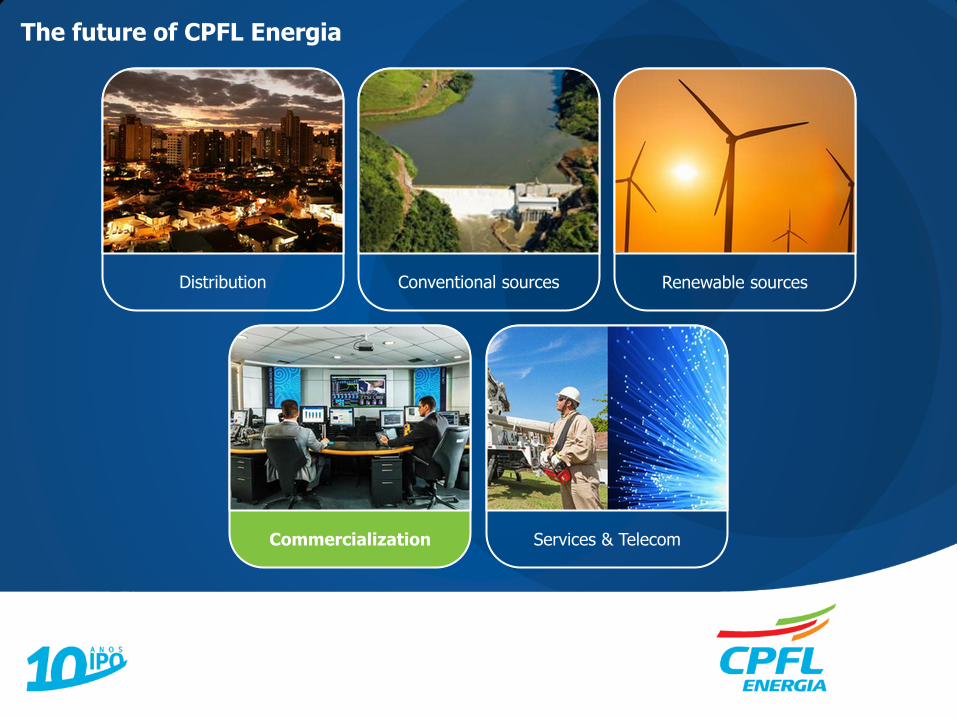
The future of CPFL Energia
Conventional sources Renewable sources
Commercialization
Distribution
Services & Telecom
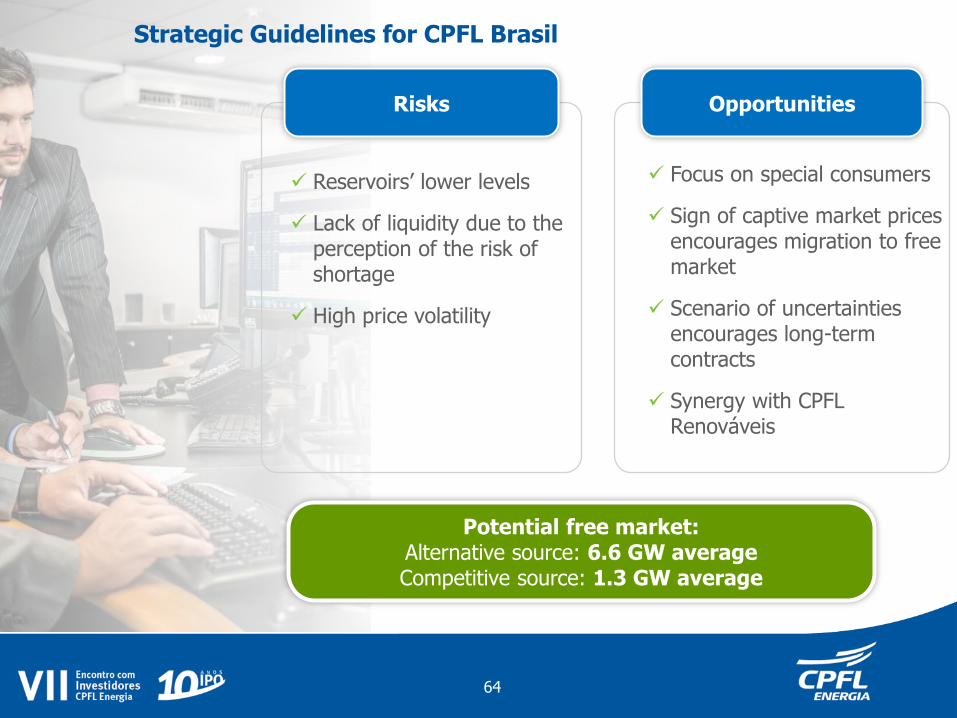
64
Reservoirs’ lower levels
Lack of liquidity due to the perception of the risk of shortage
High price volatility
Potential free market: Alternative source: 6.6 GW average Competitive source: 1.3 GW average
Focus on special consumers
Sign of captive market prices encourages migration to free market
Scenario of uncertainties encourages long-term contracts
Synergy with CPFL Renováveis
Strategic Guidelines for CPFL Brasil
Risks Opportunities
The future of CPFL Energia
Conventional sources Renewable sources
Commercialization
Distribution
Services & Telecom
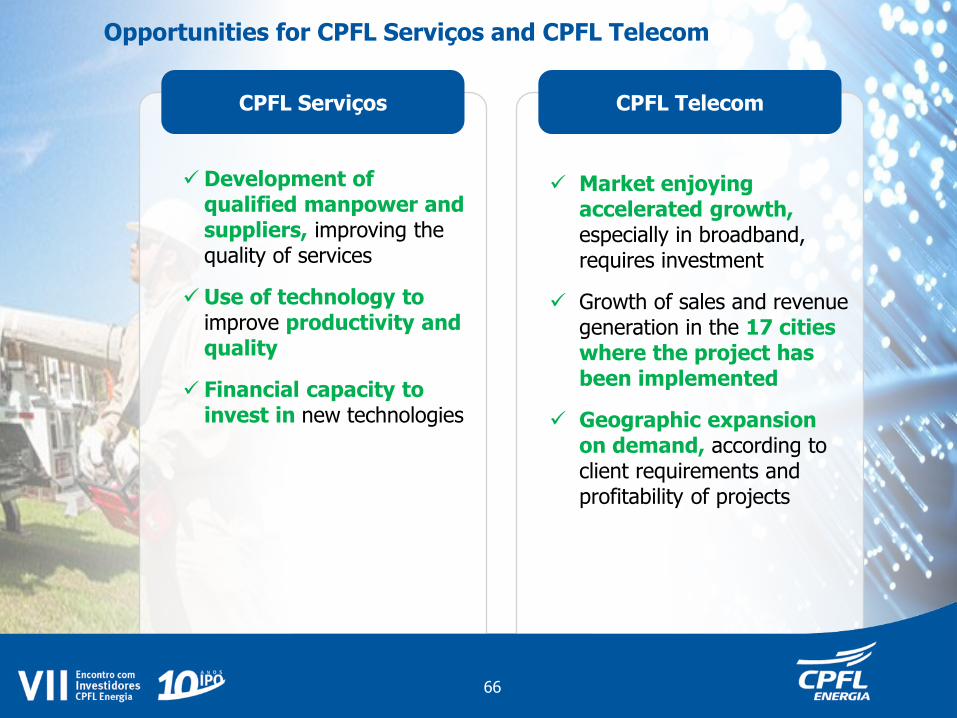
Market enjoying accelerated growth, especially in broadband, requires investment
Growth of sales and revenue generation in the 17 cities where the project has been implemented
Geographic expansion on demand, according to client requirements and profitability of projects
CPFL Telecom
Opportunities for CPFL Serviços and CPFL Telecom
CPFL Serviços
Development of qualified manpower and suppliers, improving the quality of services
Use of technology to improve productivity and quality
Financial capacity to invest in new technologies
66
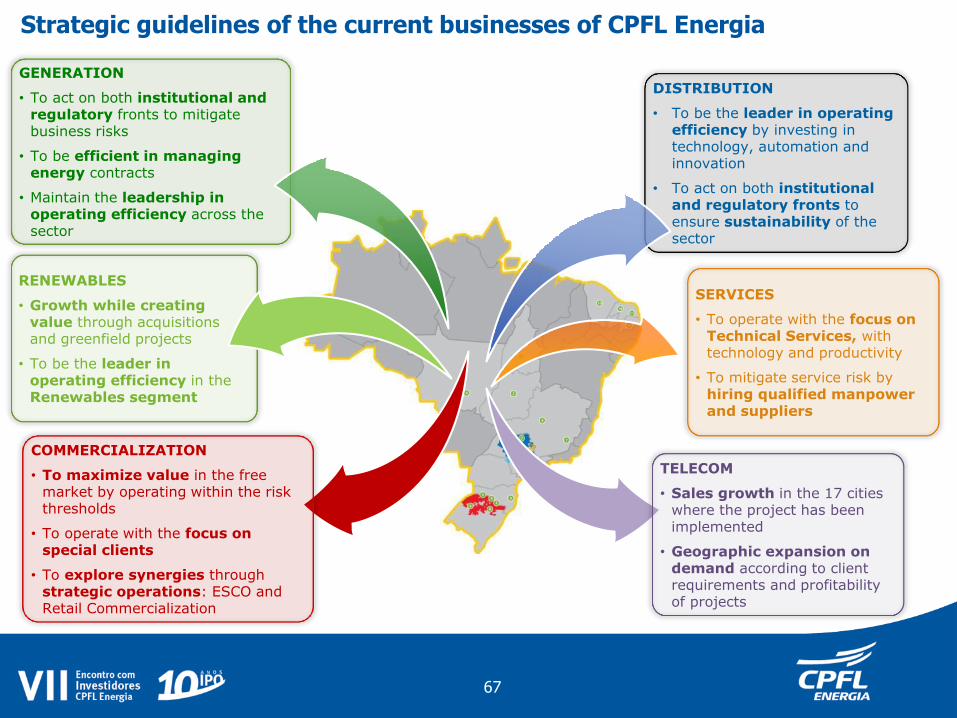
GENERATION
• To act on both institutional and regulatory fronts to mitigate business risks
• To be efficient in managing energy contracts
• Maintain the leadership in operating efficiency across the sector
Strategic guidelines of the current businesses of CPFL Energia
COMMERCIALIZATION
• To maximize value in the free market by operating within the risk thresholds
• To operate with the focus on special clients
• To explore synergies through strategic operations: ESCO and Retail Commercialization
DISTRIBUTION
• To be the leader in operating efficiency by investing in technology, automation and innovation
• To act on both institutional and regulatory fronts to ensure sustainability of the sector
SERVICES
• To operate with the focus on Technical Services, with technology and productivity
• To mitigate service risk by hiring qualified manpower and suppliers
RENEWABLES
• Growth while creating value through acquisitions and greenfield projects
• To be the leader in operating efficiency in the Renewables segment
TELECOM
• Sales growth in the 17 cities where the project has been implemented
• Geographic expansion on demand according to client requirements and profitability of projects
67