viirs cloud mask (vcm) issues cryosphere team · viirs cloud mask (vcm) issues . cryosphere team ....
TRANSCRIPT
VIIRS Cloud Mask (VCM) Issues Cryosphere Team
Jeff Key NOAA/NESDIS Madison, WI
Contributors:
Robert Mahoney (NGAS), Yinghui Liu (CIMSS), Dan Baldwin (CU), Mark Tschudi (CU), Jim Maslanik (CU), Peter Romanov (CREST),
Igor Appel (IMSG), Tony Schreiner (CIMSS), Jeff Key (NOAA)
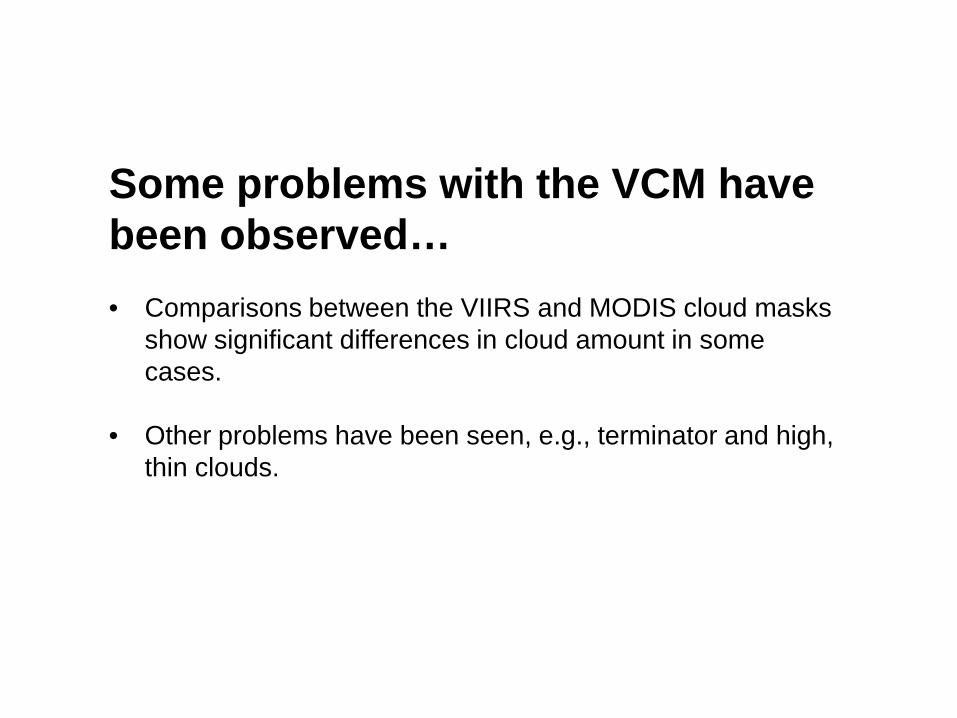
Some problems with the VCM have been observed… • Comparisons between the VIIRS and MODIS cloud masks
show significant differences in cloud amount in some cases.
• Other problems have been seen, e.g., terminator and high, thin clouds.
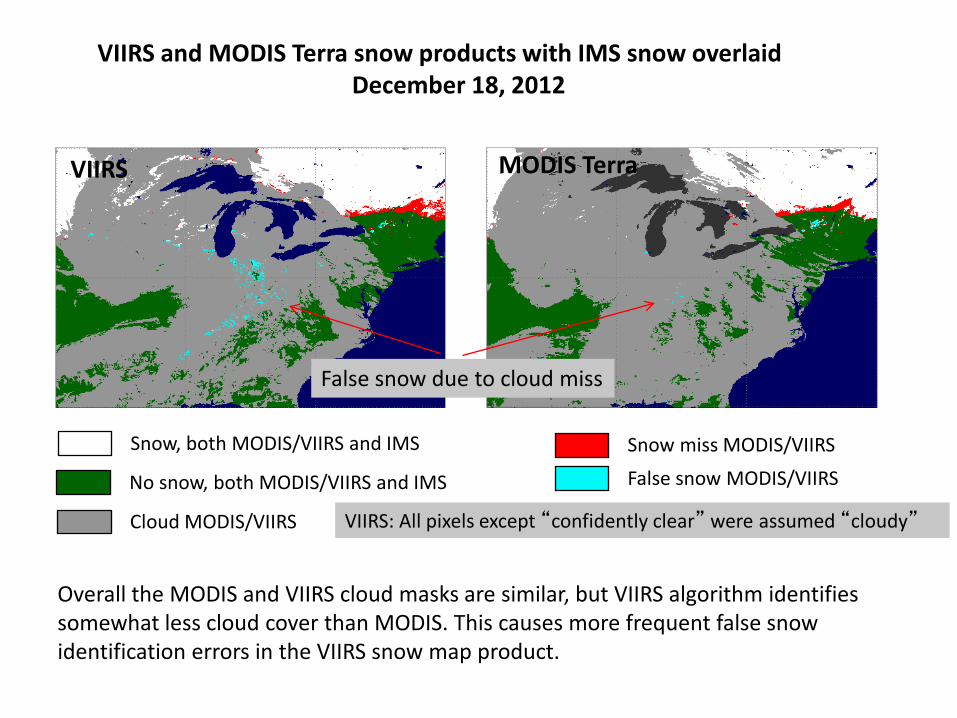
Snow, both MODIS/VIIRS and IMS
No snow, both MODIS/VIIRS and IMS
Cloud MODIS/VIIRS
Snow miss MODIS/VIIRS False snow MODIS/VIIRS
VIIRS MODIS Terra
VIIRS and MODIS Terra snow products with IMS snow overlaid December 18, 2012
Overall the MODIS and VIIRS cloud masks are similar, but VIIRS algorithm identifies somewhat less cloud cover than MODIS. This causes more frequent false snow identification errors in the VIIRS snow map product.
False snow due to cloud miss
VIIRS: All pixels except “confidently clear” were assumed “cloudy”
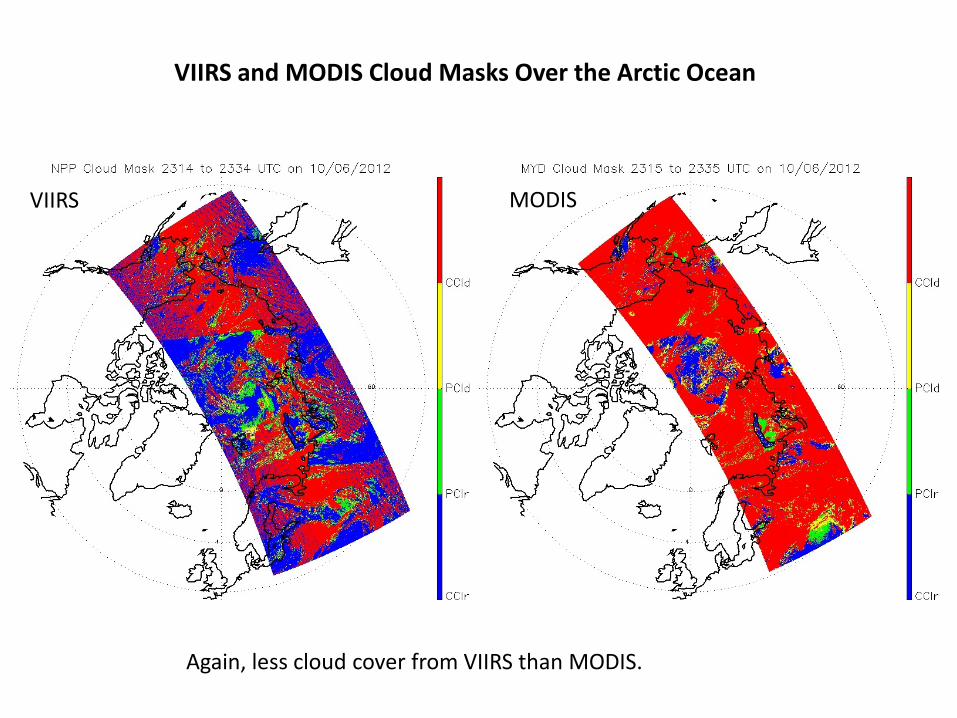
Again, less cloud cover from VIIRS than MODIS.
VIIRS MODIS
VIIRS and MODIS Cloud Masks Over the Arctic Ocean
5
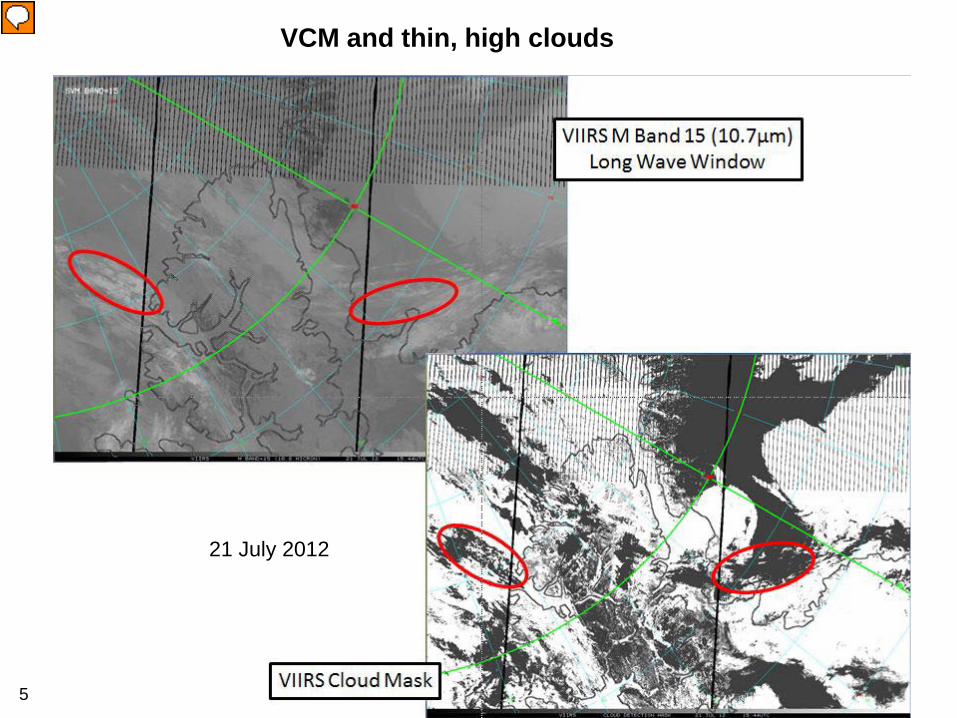
VCM and thin, high clouds
21 July 2012
6
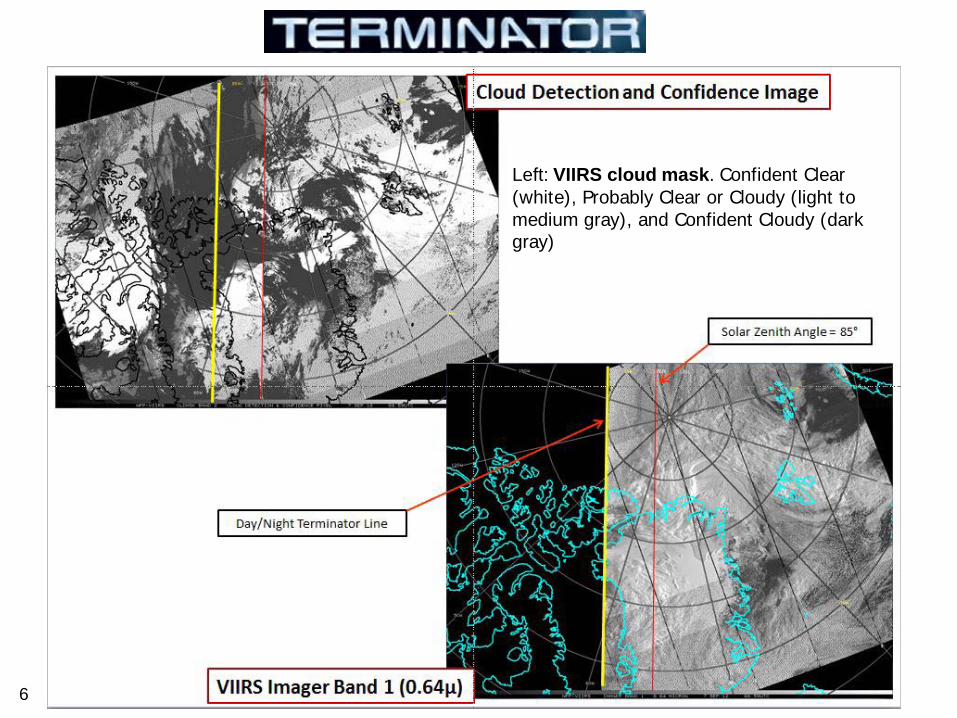
Left: VIIRS cloud mask. Confident Clear (white), Probably Clear or Cloudy (light to medium gray), and Confident Cloudy (dark gray)
7
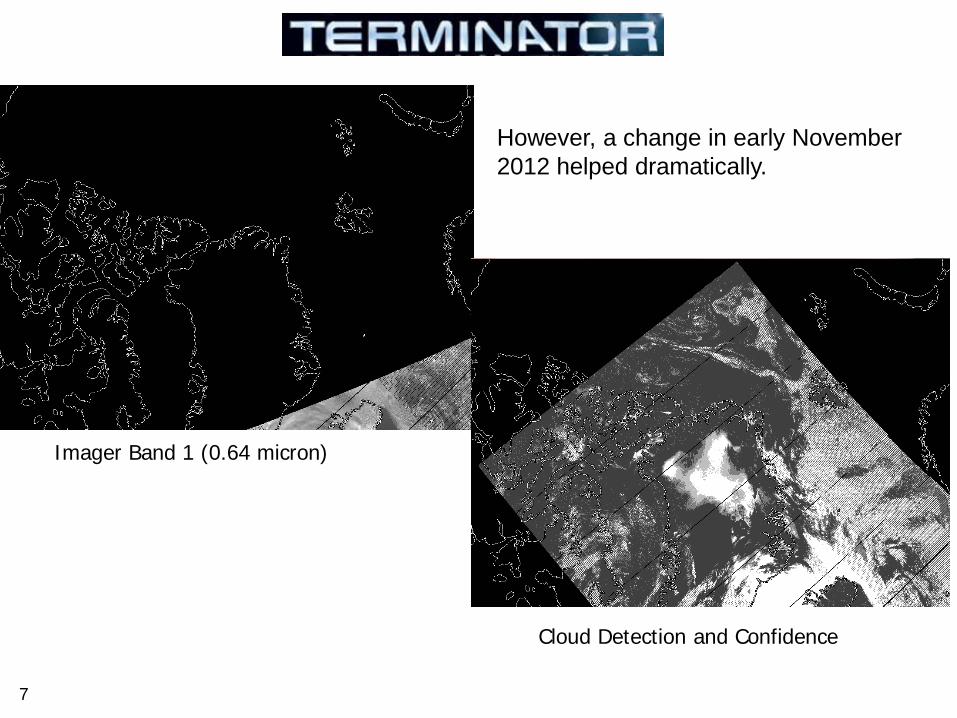
However, a change in early November 2012 helped dramatically.
Imager Band 1 (0.64 micron)
Cloud Detection and Confidence
Analyses of VIIRS gridding problems led to the cloud mask… • VIIRS gridding was activated for 17 days for three test periods
(Sep. 29 to Oct. 13; Oct 17, 2012 and Nov. 28 to Nov. 30, 2012).
• Significant amounts of false sea ice were observed in the GridIP-VIIRS-Snow-Ice-Cover-Rolling-Tile that were accumulated from gridding of poor quality Sea Ice Concentration IP retrievals.
• Many of the areas of false snow and ice appear to be related to the VCM. This is not to say that the VCM cloud tests are problematic -- though some might be -- but rather that interactions between the VCM, the sea ice concentration IP, and the Snow/Ice Cover Rolling Tiles give rise to errors in each.
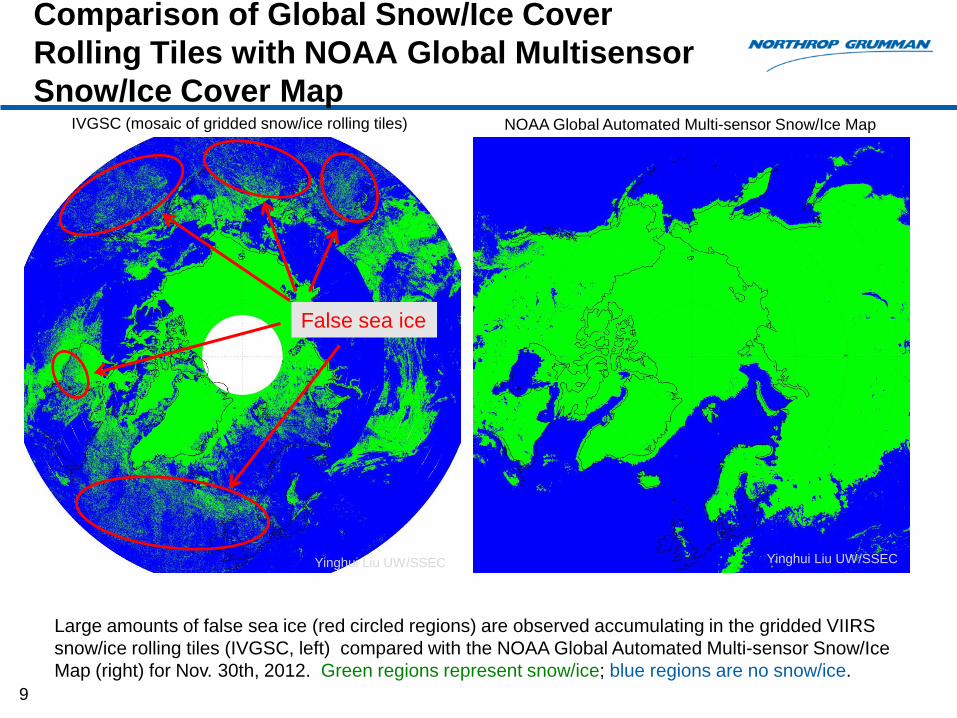
Comparison of Global Snow/Ice Cover Rolling Tiles with NOAA Global Multisensor Snow/Ice Cover Map
9
Yinghui Liu UW/SSEC Yinghui Liu UW/SSEC
Large amounts of false sea ice (red circled regions) are observed accumulating in the gridded VIIRS snow/ice rolling tiles (IVGSC, left) compared with the NOAA Global Automated Multi-sensor Snow/Ice Map (right) for Nov. 30th, 2012. Green regions represent snow/ice; blue regions are no snow/ice.
False sea ice
IVGSC (mosaic of gridded snow/ice rolling tiles) NOAA Global Automated Multi-sensor Snow/Ice Map
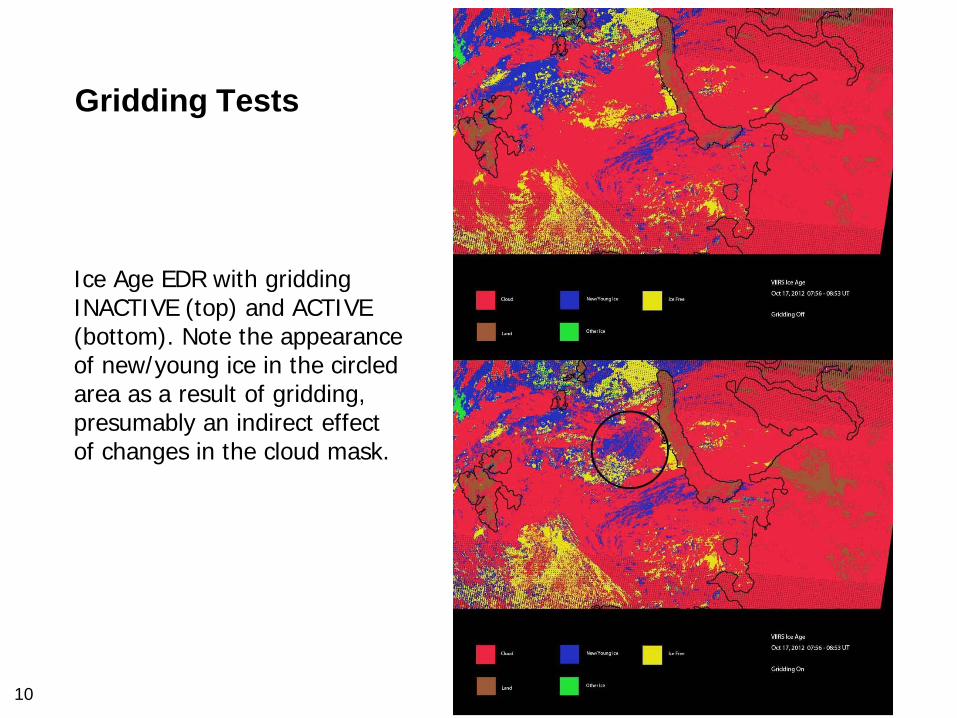
Gridding Tests
10
Ice Age EDR with gridding INACTIVE (top) and ACTIVE (bottom). Note the appearance of new/young ice in the circled area as a result of gridding, presumably an indirect effect of changes in the cloud mask.
12
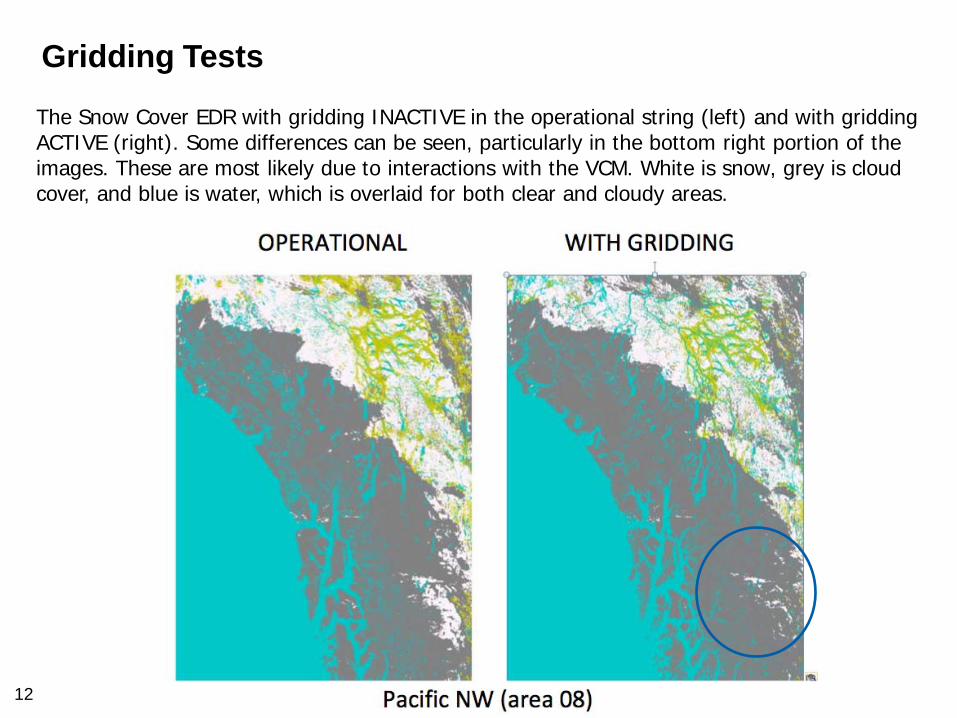
The Snow Cover EDR with gridding INACTIVE in the operational string (left) and with gridding ACTIVE (right). Some differences can be seen, particularly in the bottom right portion of the images. These are most likely due to interactions with the VCM. White is snow, grey is cloud cover, and blue is water, which is overlaid for both clear and cloudy areas.
Gridding Tests
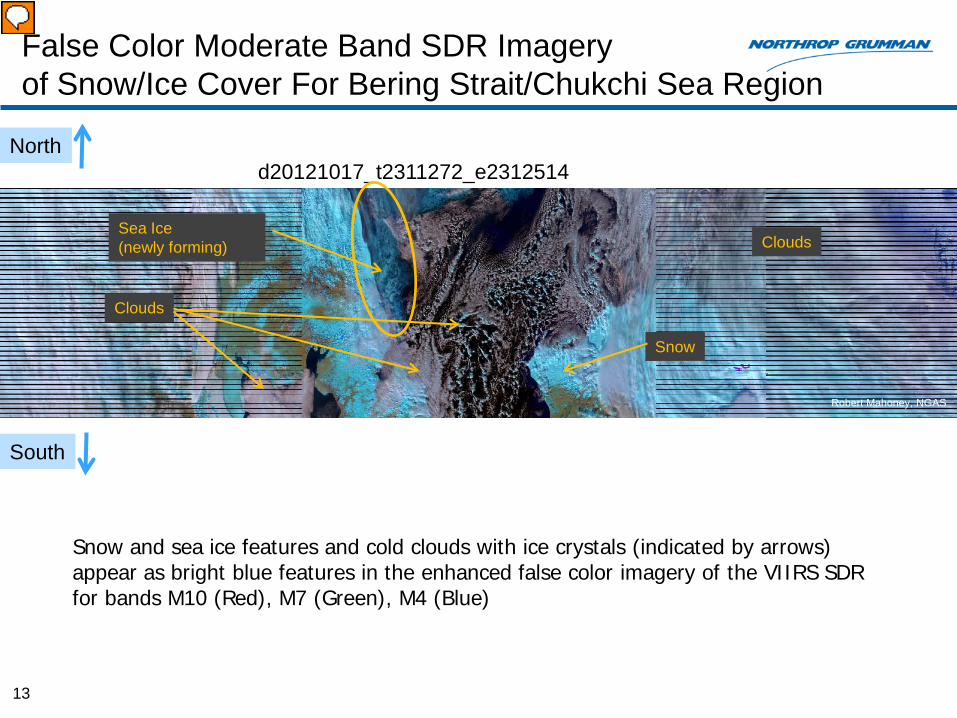
False Color Moderate Band SDR Imagery of Snow/Ice Cover For Bering Strait/Chukchi Sea Region
Snow and sea ice features and cold clouds with ice crystals (indicated by arrows) appear as bright blue features in the enhanced false color imagery of the VIIRS SDR for bands M10 (Red), M7 (Green), M4 (Blue)
13
d20121017_t2311272_e2312514
Sea Ice (newly forming)
Snow
Clouds
Clouds
Robert Mahoney, NGAS
North
South
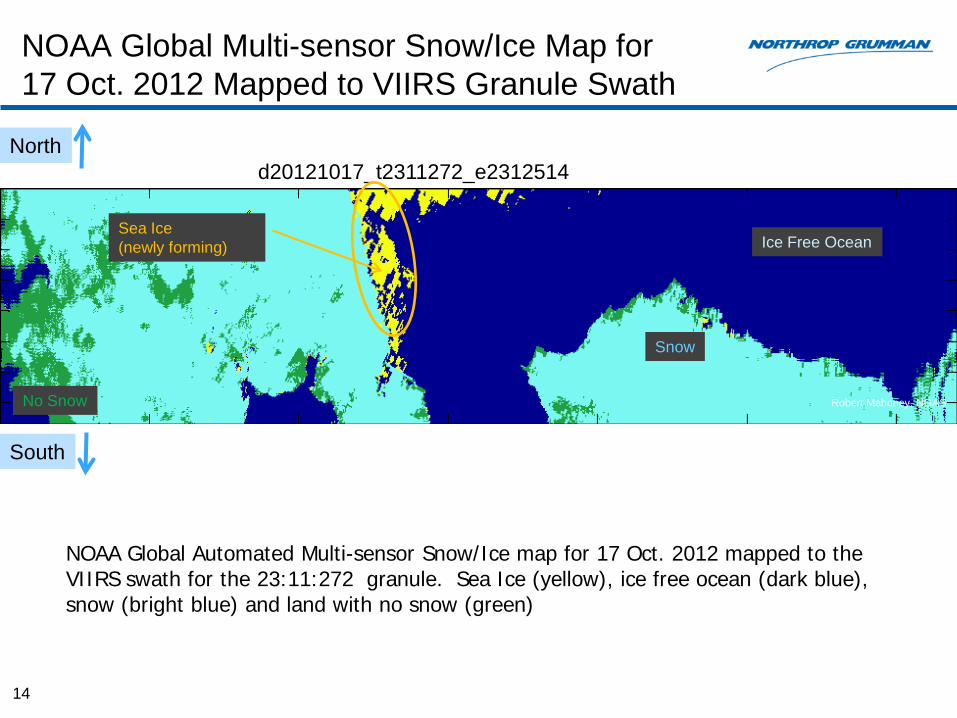
NOAA Global Multi-sensor Snow/Ice Map for 17 Oct. 2012 Mapped to VIIRS Granule Swath
NOAA Global Automated Multi-sensor Snow/Ice map for 17 Oct. 2012 mapped to the VIIRS swath for the 23:11:272 granule. Sea Ice (yellow), ice free ocean (dark blue), snow (bright blue) and land with no snow (green)
14
d20121017_t2311272_e2312514
Sea Ice (newly forming)
Snow
Robert Mahoney, NGAS
North
South
No Snow
Ice Free Ocean
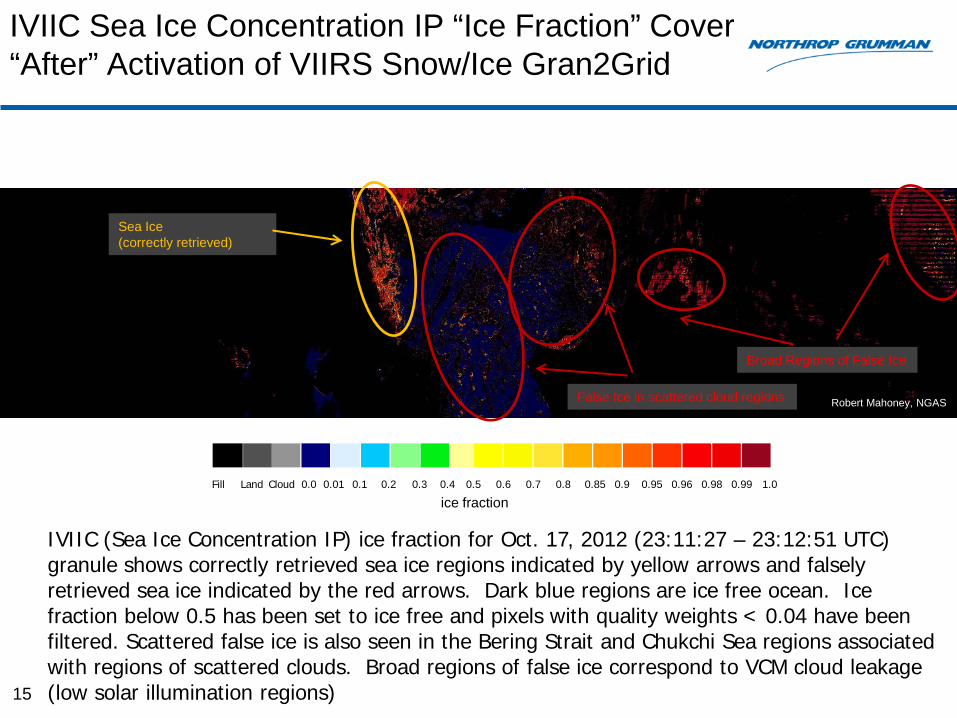
IVIIC Sea Ice Concentration IP “Ice Fraction” Cover “After” Activation of VIIRS Snow/Ice Gran2Grid
15
IVIIC (Sea Ice Concentration IP) ice fraction for Oct. 17, 2012 (23:11:27 – 23:12:51 UTC) granule shows correctly retrieved sea ice regions indicated by yellow arrows and falsely retrieved sea ice indicated by the red arrows. Dark blue regions are ice free ocean. Ice fraction below 0.5 has been set to ice free and pixels with quality weights < 0.04 have been filtered. Scattered false ice is also seen in the Bering Strait and Chukchi Sea regions associated with regions of scattered clouds. Broad regions of false ice correspond to VCM cloud leakage (low solar illumination regions)
Sea Ice (correctly retrieved)
Broad Regions of False Ice
Fill Land Cloud 0.1 0.2 0.3 0.4 0.5 0.6 0.7 0.8 0.85 0.99 1.0 0.98 0.96 0.95 0.9 0.01 0.0
ice fraction
Robert Mahoney, NGAS False Ice in scattered cloud regions
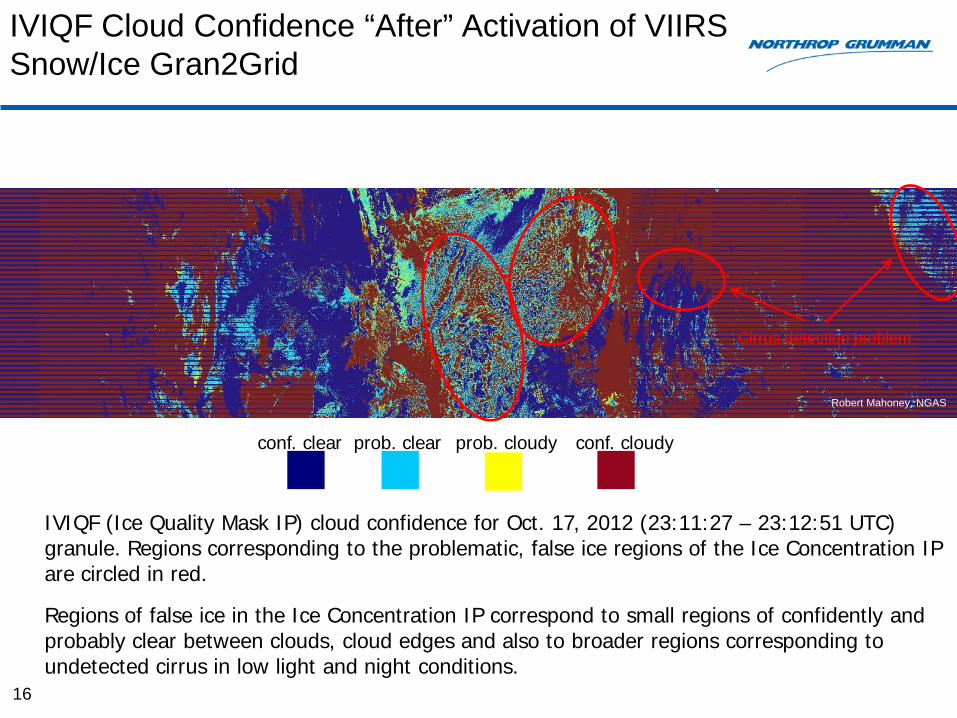
IVIQF Cloud Confidence “After” Activation of VIIRS Snow/Ice Gran2Grid
16
IVIQF (Ice Quality Mask IP) cloud confidence for Oct. 17, 2012 (23:11:27 – 23:12:51 UTC) granule. Regions corresponding to the problematic, false ice regions of the Ice Concentration IP are circled in red.
Regions of false ice in the Ice Concentration IP correspond to small regions of confidently and probably clear between clouds, cloud edges and also to broader regions corresponding to undetected cirrus in low light and night conditions.
Cirrus detection problem
prob. clear conf. clear conf. cloudy prob. cloudy
Robert Mahoney, NGAS
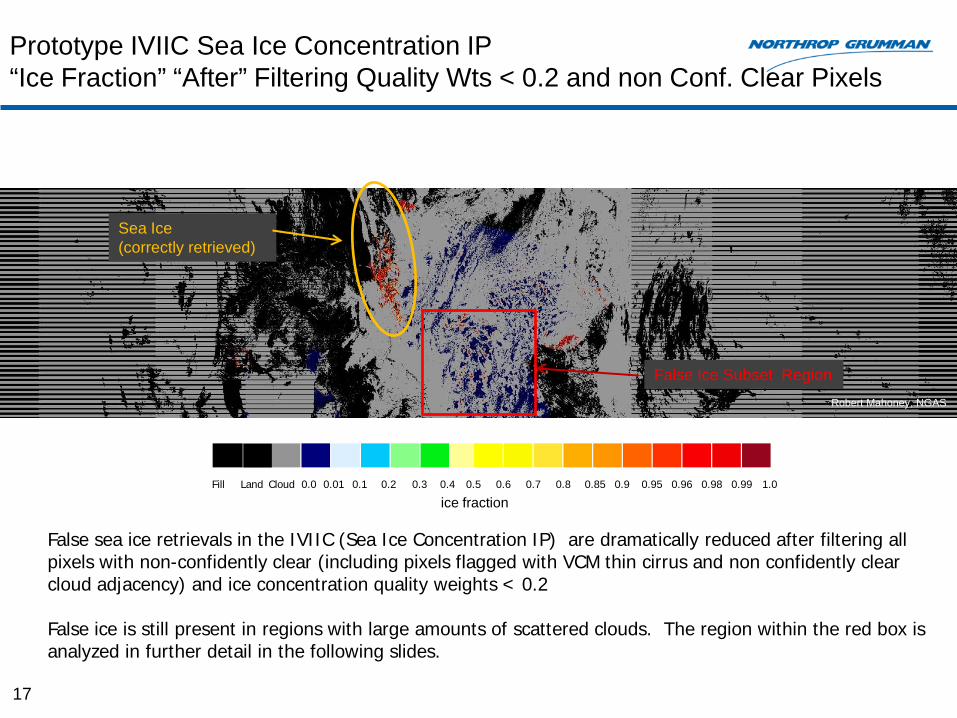
Prototype IVIIC Sea Ice Concentration IP “Ice Fraction” “After” Filtering Quality Wts < 0.2 and non Conf. Clear Pixels
17
False sea ice retrievals in the IVIIC (Sea Ice Concentration IP) are dramatically reduced after filtering all pixels with non-confidently clear (including pixels flagged with VCM thin cirrus and non confidently clear cloud adjacency) and ice concentration quality weights < 0.2 False ice is still present in regions with large amounts of scattered clouds. The region within the red box is analyzed in further detail in the following slides.
Sea Ice (correctly retrieved)
False Ice Subset Region
Fill Land Cloud 0.1 0.2 0.3 0.4 0.5 0.6 0.7 0.8 0.85 0.99 1.0 0.98 0.96 0.95 0.9 0.01 0.0
ice fraction
Robert Mahoney, NGAS
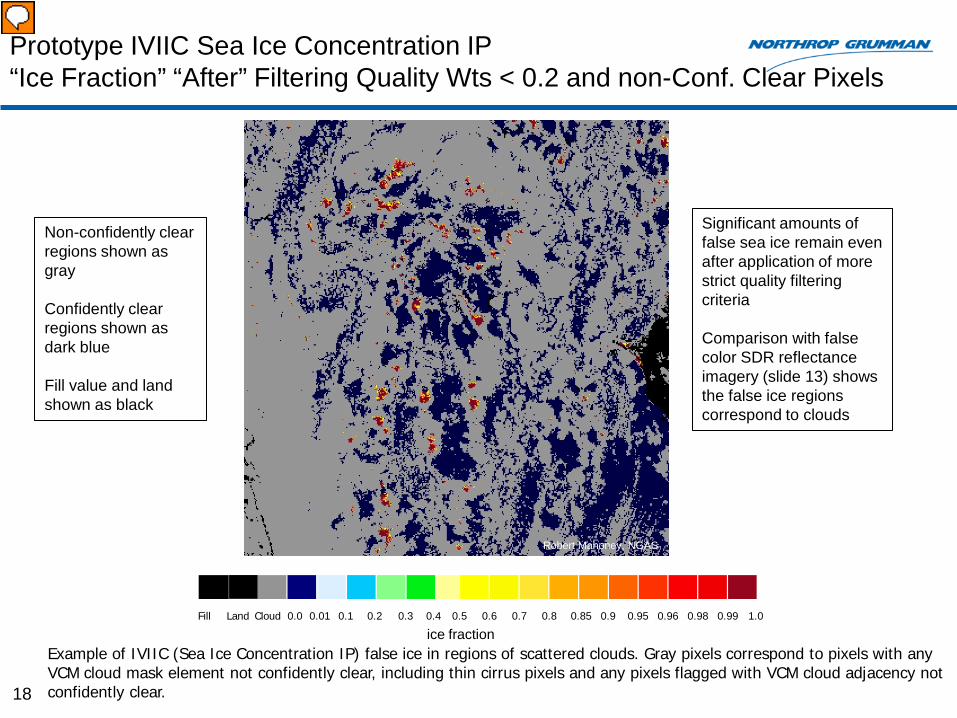
Prototype IVIIC Sea Ice Concentration IP “Ice Fraction” “After” Filtering Quality Wts < 0.2 and non-Conf. Clear Pixels
18
Example of IVIIC (Sea Ice Concentration IP) false ice in regions of scattered clouds. Gray pixels correspond to pixels with any VCM cloud mask element not confidently clear, including thin cirrus pixels and any pixels flagged with VCM cloud adjacency not confidently clear.
Fill Land Cloud 0.1 0.2 0.3 0.4 0.5 0.6 0.7 0.8 0.85 0.99 1.0 0.98 0.96 0.95 0.9 0.01 0.0
ice fraction
Robert Mahoney, NGAS
Robert Mahoney, NGAS
Non-confidently clear regions shown as gray Confidently clear regions shown as dark blue Fill value and land shown as black
Significant amounts of false sea ice remain even after application of more strict quality filtering criteria
Comparison with false color SDR reflectance imagery (slide 13) shows the false ice regions correspond to clouds
19
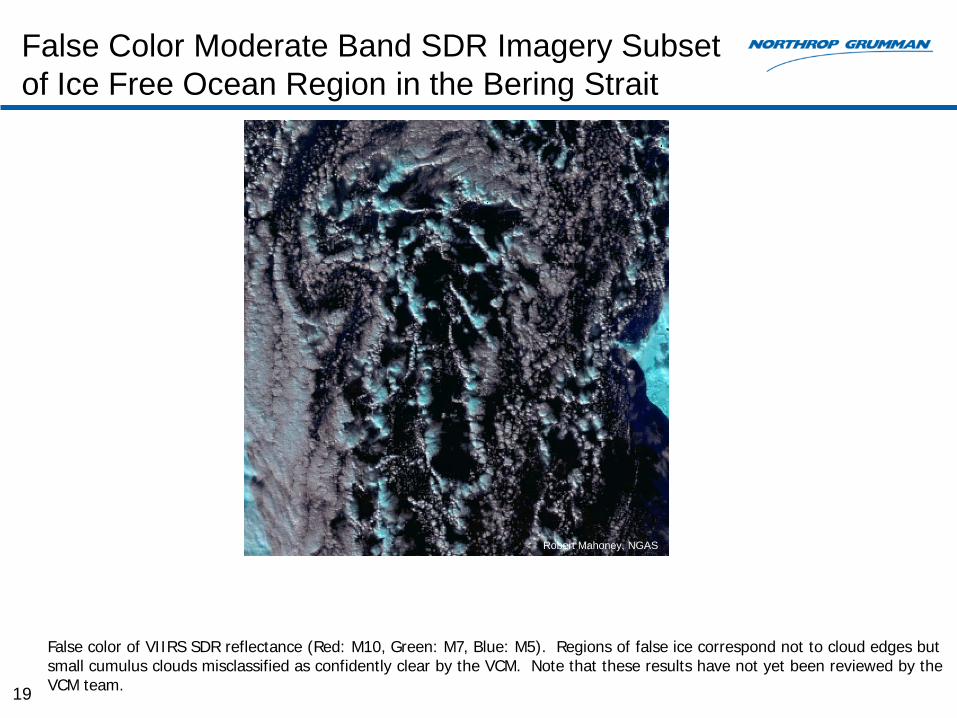
False color of VIIRS SDR reflectance (Red: M10, Green: M7, Blue: M5). Regions of false ice correspond not to cloud edges but small cumulus clouds misclassified as confidently clear by the VCM. Note that these results have not yet been reviewed by the VCM team.
Robert Mahoney, NGAS
Robert Mahoney, NGAS
False Color Moderate Band SDR Imagery Subset of Ice Free Ocean Region in the Bering Strait
Summary of Issues
20
• The VCM identifies less cloud than the MODIS cloud mask.
• Significant discontinuities in the VCM have been observed across the terminator.
• Misclassification of ice in regions of undetected thin cirrus is common.
• Large regions of false sea ice have been observed in the IVGSC (gridded snow/ice rolling tiles) are confirmed by comparison to passive microwave based sea ice products.
• Most of the false sea ice observed in the Ice Concentration IP corresponds to small cumulus cloud tops that have been misclassified as confidently clear by the VCM.
• There is potential for accumulation and propagation of errors (false sea ice) due to the feedback of VCM cloud leakage at night over the polar regions and Sea Ice Concentration retrieval errors through the IVGSC.
Potential Solutions
21
• Daily updates to the Snow/Ice Rolling Tiles with microwave data should help significantly, possibly with a small change in VCM logic to not use its snow/ice test if the ancillary data says it’s snow/ice.
• Thresholding the percent of non-confidently clear pixels within the VIIRS Ice Concentration IP algorithm’s ice tie point search window.
• VIIRS M12 and M13 (3.7 and 4.0 micrometer) brightness temperature differences might help with cloud detection.
• Improved VCM cloud detection or flagging of regions with additional VCM cloud confidence uncertainty.