village of lyndonville electric department integrated ...village of lyndonville electric department...
TRANSCRIPT
1
Village of Lyndonville Electric Department Integrated Resource Plan
2015 - 2034
Part 1 – Utility Overview
Presented to the Vermont Public Service Board
Filed: July 17, 2015 Revised: March 23, 2017
Submitted by: Vermont Public Power Supply Authority
2
Table of Contents
1. Overview ..................................................................................................................... 3
Table 1-1: 2013 Sales and Revenues ........................................................................... 3
2. Load Forecast .............................................................................................................. 4 Table 2-1: Load Forecast ............................................................................................. 4
3. Supply Resources ........................................................................................................ 5 3.1. Current Resources ................................................................................................ 5
Figure 3-1: Lyndonville 2013 Portfolio .................................................................... 6
Table 3-1: Lyndonville 2013 Power Supply Resource Summary ................................. 6
3.2. Supply Outlook ................................................................................................... 11 Figure 3-2: Projected Energy Resources and Forecasted Energy Need ................ 12
Figure 3-3: Annual Capacity Obligation versus Capacity Supply .......................... 13
3.3. Supply Options Inventory ................................................................................... 13

3
1. Overview The Village of Lyndonville Electric Department (LED) is one of the largest municipal utilities in the State of Vermont. It is located in Caledonia County, and is home to Lyndon State College and the Burke Mountain Ski Area. The Department serves a 246 square mile service area within the Village boundaries and the Towns of Burke, East Haven, Glover, Kirby, Lyndon, Newark, Sheffield, St. Johnsbury, Sutton, Westmore and Wheelock. Economic activity is a balanced mix of residential and commercial activity. LED was incorporated in 1896; the first of LED’s hydroelectric units was constructed and put into service as Great Falls Units 1 and 2 in 1915. The second hydroelectric generator entered service in 1949 and LED’s last hydroelectric generating unit was placed into service in 1979. LED served 5,642 customers in 2013; the system is rural in nature and serves a balanced mix of residential and commercial load with approximately 49% of its annual retail sales coming from the residential class. The breakdown of 2013 sales and revenues by class is as follows:
Table 1-1: 2013 Sales and Revenues
Class Annual kWh % Residential sales (440) 31,622,167 49% Large Power 714,927 1% Small commercial and industrial sales (442) 1000 Kw or less 10,364,477 16% Large commercial and industrial sales (442) above 1,000 Kw 14,923,613 23% Public street and highway lighting (444) 485,659 1% Other sales to public utilities 6,764,331 10% Total 64,875,174 100%
In 2013, Lyndonville’s system Real-Time Load Obligation (RTLO) totaled 69,892,205 kWh; it has decreased from an annual RTLO of 77,705,313 kWh in 2004. Lyndonville’s historic system peak RTLO of 15,298 kW occurred in December 2008. Lyndonville had a system peak RTLO in 2013 of 13,481 kW and an annual system load factor of 59%. In 2013, LED produced 2.8% of its resource requirement from internal hydroelectric resources. The remainder of LED’s resource requirement was provided by unit entitlements and contracts.

4
2. Load Forecast The Lyndonville load forecast is prepared by Vermont Public Power Supply Authority (“VPPSA”), and VPPSA’s methodology is described in detail in the Model section of the IRP. The results of the Lyndonville annual load forecast for peaks and energy are as follows:
Table 2-1: Load Forecast
Utility's Name: Lyndonville
Utility ID (1): LYN Sub- On-Peak
VPPSA Member? VPPSA transmission Energy
PEAK DEMAND ENERGY LOSSES Utilization
(kW) (kWh) (%) (%)
2015 12,325 64,818,877 0.01% 52.53% 2016 12,316 65,048,802 0.01% 52.52% 2017 12,448 64,990,804 0.01% 52.74% 2018 12,345 64,624,624 0.01% 52.36% 2019 12,321 64,627,758 0.01% 52.32% 2020 12,226 64,714,678 0.01% 52.51% 2021 12,158 64,410,082 0.01% 52.52% 2022 12,341 64,179,753 0.01% 52.75% 2023 12,372 63,948,208 0.01% 52.69% 2024 12,335 63,899,295 0.01% 52.52% 2025 12,214 63,756,867 0.01% 52.33% 2026 12,188 63,790,367 0.01% 52.57% 2027 12,164 63,824,436 0.01% 52.53% 2028 12,358 63,880,233 0.01% 52.69% 2029 12,369 63,768,742 0.01% 52.68% 2030 12,344 63,771,841 0.01% 52.36% 2031 12,254.0 63,774,933 0.01% 52.47% 2032 12,276.0 63,985,477 0.01% 52.43% 2033 12,392.0 63,812,051 0.01% 52.41% 2034 12,434.0 63,784,167 0.01% 52.64%

5
At the time of writing in 2015, Lyndonville had a 5.5% net metering penetration rate.
3. Supply Resources VPPSA VPPSA is a private authority (and body politic and corporate) of the State of Vermont empowered under 30 VSA, Chapter 84 with broad authority to contract to buy and sell wholesale power and other market products within Vermont and wholesale and retail power outside Vermont, as well as to issue tax-free debt on behalf of municipal and cooperative electric utilities within Vermont. VPPSA presently has twelve Vermont municipal electric utility members, and each member system holds a seat on VPPSA’s Board of Directors in accordance with the VPPSA statute. VPPSA has broad authority to provide such services as may be required in support of the activities of its member municipal utilities. As part of these activities VPPSA provides the following portfolio management services to Lyndonville. Lyndonville is a signatory to a broad Master Supply Agreement with VPPSA. Under this Agreement and the broad statutory authority of VPPSA, Lyndonville’s assets are pooled with the assets of other VPPSA members under VPPSA’s Independent System Operator – New England (“ISO-NE”) identification number. This allows VPPSA to administer Lyndonville’s loads in the New England power markets operated by ISO-NE, rather than requiring Lyndonville to devote the staff and time to do so itself. Under the relevant VPPSA agreements and protocols, Lyndonville has given VPPSA the authority to make short term (generally daily to several months but in all cases no longer than one year) purchases on Lyndonville’s behalf.
3.1. Current Resources Lyndonville’s power supply portfolio is made up of generation resources, long-term contracts, and short-term contracts. The diversified portfolio acts as a means to financially hedge the cost of serving load at the Vermont Zone in the ISO-NE market system. Lyndonville’s 2013 fuel mix is summarized in the following chart. Additional information is provided in the table that follows. A brief description of each resource concludes this section.

6
Figure 3-1: Lyndonville 2013 Portfolio*
* Prior to sale of any renewable attributes. Residual Mix are market contracts without a known fuel source.
Table 3-1: Lyndonville 2013 Power Supply Resource Summary
Resource
2013 Max Qualified Capacity 2013 kWh Type Description Fuel Location Expiration
J.C. McNeil 1,620 9,599,460 On Peak Wood Unit Wood Essex Node
Life of Unit
NYPA 735 4,397,879 ATC Block Power Hydro
Roseton Interface Varies
VEPPI 197 1,732,082 Varies PURPA
Units Wood/Hy
dro Various VT
nodes Varies
Stonybrook 1,558 495,615 Peaker Dispatched
Natural Gas or Fuel Oil Stonybrk115
Life of Unit
Hydro Quebec 4,227 25,313,560
Dispatchable Dispatched Hydro
HQHighgate120
2012 - 2038

7
J. C. McNeil The McNeil wood-fired generating facility is located in Burlington, Vermont. The facility has a maximum generating capability of 54 MW. Lyndonville’s entitlement to McNeil for energy, capacity, and renewable energy credits is provided through an agreement with VPPSA (which owns 19% of McNeil) for the life of the power plant. Lyndonville expects the generation to be mostly composed of wood, but natural gas is used periodically as an alternate fuel source and for startup. Oil is also available and is used primarily as a startup fuel. New York Power Authority (NYPA) The New York Power Authority provides hydroelectric energy and capacity to the utilities in Vermont under two contracts. The first contract is a 1 MW entitlement to the Robert Moses Project (a.k.a. “St. Lawrence”) located in Massena, New York. The second contract, known as the “Niagara Contract,” is for a 14.3 MW entitlement to the Niagara Project located at Niagara Falls, New York. The contract for St. Lawrence has been extended through April 30, 2017. The Niagara Contract has been extended through September 1, 2025. Vermont Electric Power Producers (VEPP Inc.) Lyndonville receives power from several independent power projects (IPP) through a state mandated arrangement administered by the Rule 4.100 appointed purchasing agent. All current IPP generation resources in Vermont are
Lyndonville Hydro 343 1,893,826
Run of River Hydro Hydro St. Johnsbury
Life of Unit
Fitchburg Landfill 893 6,517,440 ATC Landfill Gas
Landfill Gas Ashbrnhm115
2026 (extendable to 2031)
Yarmouth 200 53,126 Peaker Dispatched
Natural Gas or Fuel Oil
UN.YARMOUTH22 YAR4
Life of Unit
P10 9,367 119,306 Peaker Dispatched Fuel Oil UN.HIGHGATE13.8SWC1
Life of Unit
Standard Offer 12 82,317 Varies
In-State Renewable
Various Renewab
le Varies Varies
Market Contracts N/A 13,183,499 Daily
ISO-NE bilateral
System Mix Mass Hub
Varies from 2009-2017

8
hydroelectric. Vermont Electric Power Producers (VEPP Inc.) assigns energy and capacity to all Vermont utilities under Vermont Public Service Board (PSB) Rule 4.100 based on a pro-rata share of electric sales which is updated annually. Contracts between VEPP Inc. and its constituent power producers began to terminate in 2008. The last VEPP Inc. contract is scheduled to end in 2021. Stony Brook Combined Cycle Facility Lyndonville holds an energy and capacity entitlement to Stony Brook. The Stony Brook facility is a dual-fuel facility located in Massachusetts which is comprised of three generating units. While this facility has the capability of generating electricity from fuel oil, natural gas is the primary source of fuel. The Stony Brook owners completed construction of a gas pipeline extension which enables the facility to operate multiple units on natural gas. During winter the facility’s generation is a mix of natural gas and oil due to the inability to fully procure natural gas for peak periods. Hydro-Quebec/Vermont Joint Owners’ (HQ/VJO) Contract Lyndonville’s existing energy and capacity entitlement in the HQ/VJO contract is 4,227 kW. Lyndonville’s entitlements are broken into multiple schedules and are summarized as follows:
HQ Schedule
Entitlement (kW) End Date
B 2,438 2015 C3 5 2015 C4a 1,158 2016
During the term of the contract the VJO were permitted to reduce or increase the annual capacity factor between 70% and 80% on five occasions. Hydro-Quebec was allowed to implement three reductions. The VJO and HQ have utilized all options to increase or decrease allowances of the HQ contract. HQ’s permanent annual energy deliveries were set at 75% capacity factor starting with the contract year beginning November 1, 2007, and will stay at that level for the remainder of the contract. Under the terms of the contract monthly capacity factors can range from 25% to 95%. However, in order to comply with ISO-NE’s Standard Market Design rules the monthly capacity factor cannot be less than 47%, on average. In 2010 a new statewide Hydro Quebec contract for energy only was negotiated and executed. Energy deliveries are scheduled to phase in slowly as existing

9
schedules expire. Lyndonville’s entitlements under the new contract are as follows:
Time Period Entitlement (kW) Nov 1, 2012 – Oct 31, 2015 42 Nov 1, 2015 – Oct 31, 2016 511 Nov 1, 2016 – Oct 31, 2020 603 Nov 1, 2020 – Oct 31, 2030 603 Nov 1, 2030 – Oct 31, 2035 622 Nov 1, 2035 – Oct 31, 2038 153
Lyndonville Hydro Lyndonville’s run-of-river hydroelectric facilities, Vail and Great Falls, are located on the Passumpsic River in Lyndonville, Vermont. Lyndonville owns the facilities and currently utilizes all of their output. In 2013 the hydro facilities produced 1,893 MWh, which represents an annual capacity factor of approximately 9%. Over the past ten years the units have averaged a combined 4,719 MWh per year. It provides approximately 600kW of market capacity. Recent decline in generation is due to failure of the Vail station; at the time of writing in 2015 the station was undergoing repair; the facility has since restarted operation again after being dormant for more than 5 years. The FERC licenses for Vail and Great Falls expire on February 28, 2034 and May 31, 2019 respectively. Lyndonville is actively taking the steps to re-license the Great Falls facility. Fitchburg Landfill Lyndonville holds an allotment of 24.80% in a contract for the output of a landfill gas-fired generation facility at Fitchburg Landfill in Westminster, MA. Beginning in 2012 the 15 year contract provides nine VPPSA members with 3 MW of firm energy, capacity and renewable attributes for years 1-5, 3MW of firm energy, capacity and renewable attributes plus 1.5MW of unit contingent energy, capacity and renewable attributes for years 6-10, and 4.5MW of unit contingent energy, capacity and renewable attributes for years 11-15. The contract includes an option to extend deliveries for 4.5MW of unit contingent energy for an additional five years (years 16-20). Ryegate Ryegate is a 21-MW woodchip-fired generator located in Ryegate, VT. A new 10-year contract between Ryegate Associates and VEPP Inc. began in November 2012. Each Vermont utility receives a portion of the energy and capacity from the plant, along with renewable energy credits as described below. The expected annual plant output is about 160,000 MWh. In 2015 Ryegate became a qualified
10
Class I renewable energy source in Connecticut. A REC sharing agreement between Ryegate and the Vermont utilities was reached such that through September 2016 VPPSA utilities receive 10% of the Class I RECs, the next four years VPPSA utilities receive 50% of the RECs, and starting in October 2021 VPPSA utilities receive 90% of the RECs. Yarmouth Unit No. 4 The Yarmouth Unit No. 4 (a.k.a. W.F. Wyman Unit No. 4) is a fuel-oil fired generating facility located in Yarmouth, Maine. The facility has a maximum generating capability of 620 MW. Lyndonville’s energy and capacity entitlement is 204 kW. Project 10 Lyndonville held a municipal vote to authorize the execution of a Power Sales Agreement (PSA) with VPPSA for 19.60% of a 40 MW peaking facility constructed in Swanton, Vermont. Eleven municipal utilities and one Vermont cooperative have signed Purchase Sales Agreements for the project which is 100% owned by VPPSA and which came online in 2010. The project constructed 46 MW of fast-start generation capacity designed to provide reliability services (in addition to capacity) to the participating municipal utilities at prices below projected New England market prices over the life of the facility. Additionally, the facility runs during peak price times to mitigate price spikes that occur when New England loads reach peak levels in the summer and winter. Standard Offer Lyndonville receives power from several independent power producers according to the state mandate set forth in the Vermont Energy Act of 2009 (i.e. Act 45) which is administered by the Sustainably Priced Energy Enterprise Development (SPEED) facilitator. The prices paid to developers under Act 45 were initially standardized based on the type of renewable energy technology; however, in April 2013 the SPEED facilitator implemented a price-based Request for Proposals for developers of Standard Offers projects. Lyndonville receives a share of all Standard Offer contracts based on its pro rata share of Vermont’s prior-year kWh retail sales. The duration of standard offer contracts is permitted to be between 10 and 20 years with the exception of solar which is permitted to contract for 25 years.

11
In July 2015, VPPSA was awarded two Standard Offer contracts for two solar projects to be located in Lyndonville, VT. The projects, 475 kW and 500 kW in size, will be included in the Standard Offer provider block. They are expected to come online prior to January 2017 and the generation from these projects will be distributed to the state’s utilities in the same manner as the generation from developer projects. Seabrook Lyndonville participated in a recent transaction to purchase energy from the Seabrook Nuclear generating station in New Hampshire in the years 2018-2022. The contract provides energy at flat, fixed pricing for the five-year term. This purchase will help maintain stable, predictable power supply costs through 2022. This resource does not provide capacity benefit. Market Purchases Lyndonville meets the remainder of its load obligations through ISO-NE’s day-ahead and real-time energy markets, physical bilateral transactions, and financial transactions. Lyndonville participates in the wholesale markets based on its forecasted energy requirements. Short-term transactions are made periodically to adjust the portfolio in an effort to match resources to Lyndonville’s load obligations. Market purchases range in size, duration, and by provider and can be transacted in small amounts. It should be noted that market purchases longer than five years in duration or above certain quantities of historic peak load require Vermont Public Service Board approval.
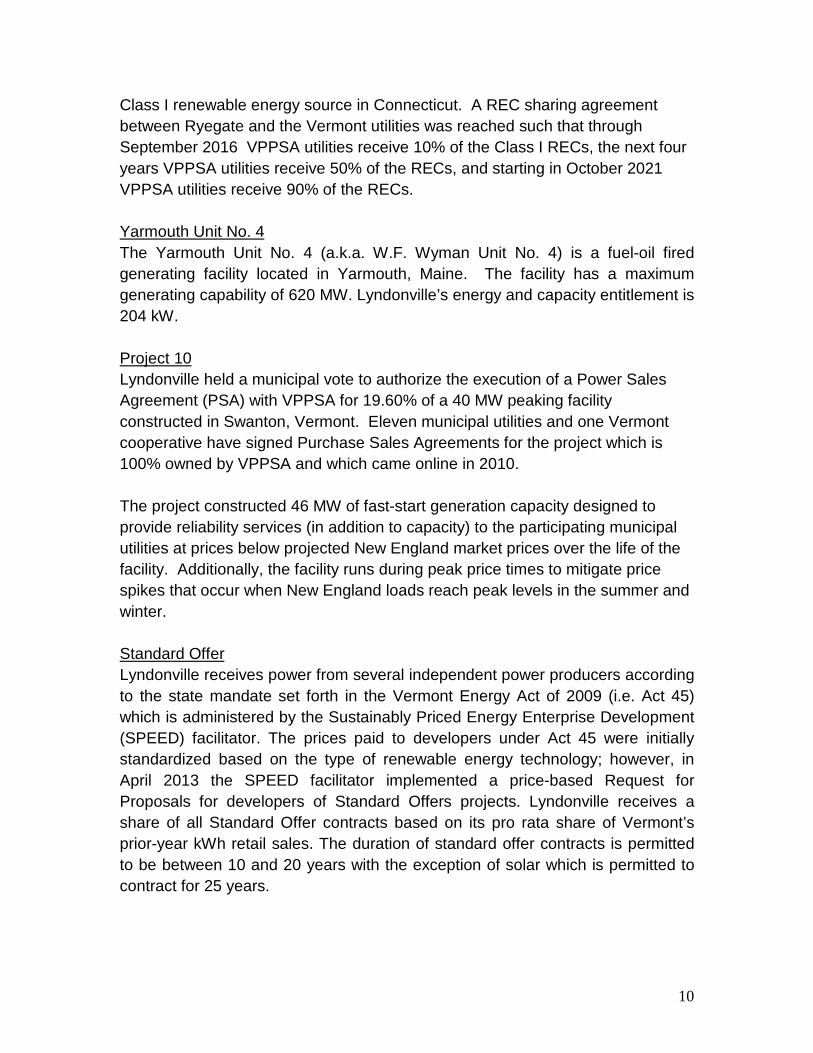
3.2. Supply Outlook Energy Presented below is a graph of projected energy available from existing contracts and resources from 2015 through 2034 as compared with Lyndonville’s projected energy needs. Energy is the largest component of utility costs at this time. The resources included on the graph are those committed resources as of the time of this report. As supply falls below load, Lyndonville will acquire new resources that meet the utility’s decision making criteria. It should be noted that a growing gap between these two lines is a normal part of the utility business with expirations of existing contracts occurring over time and a continuing search for economical ways to provide energy.
12
Figure 3-2: Projected Energy Resources and Forecasted Energy Need
Capacity Also presented is a graph of the forecast of market capacity available from existing resources and a forecast of the utility’s capacity obligations. Capacity is the second largest dimension in utility power costs, and represents the ability to generate electricity when needed (as opposed to energy which is the actual energy generated). In broad terms, capacity is important in providing reliability and avoiding prices spikes during peak demand. The graph below shows the utility’s capacity available from existing resources as compared to its projected capacity need. Similar to energy, the chart shows a gap occurs in the future. Lyndonville will acquire resources that meet the utility’s decision making criteria in the future.
Hydro
BioMass Fossil FuelsStandard Offer
Planned Purchases(Residual Mix)
Landfill Gas
Nuclear
Solar
Spot Market Purchases(Residual Mix)
0%
10%
20%
30%
40%
50%
60%
70%
80%
90%
100%
110%
120%
130%
Lyndonville Electric DeptProjected Energy Resources and Forecasted Energy Need
(Percent of Need by Fuel Type)

13
Figure 3-3: Annual Capacity Obligation versus Capacity Supply
3.3. Supply Options Inventory As one of twelve municipal members of VPPSA, Lyndonville is afforded ongoing opportunities for inter-utility coordination, coordinated procurement and power pooling. Near-Term Resource Adequacy – 0-6 Months: On a regular basis, each VPPSA member’s resources are evaluated against its load individually to determine the need for balancing transactions. VPPSA operates an internal power pool to the extent possible, allowing members to match needs with each other before transacting with the open market. Transactions between members occur at market prices, ensuring that each system is treated equitably, but allowing for the elimination of market-making spreads to which each utility would otherwise be exposed if they acted independently.
Mid-Term Resource Adequacy – 6 Months to 5 Years: VPPSA employs a planned purchasing program which evaluates members’ resource coverage incrementally every six months. While each evaluation does
0%
20%
40%
60%
80%
100%
120%
140%
Current Capacity Resources as a Percent of Forecast Need -Lyndonville
Hydro Biomass Landfill Gas Fossil Fuel Solar Market Purchases

14
not necessarily result in a recommendation to transact, the periodic nature provides the opportunity for evaluation of conditions impacting each system, and the wider market. Forward transactions made in this manner complement long-term resources already in the portfolio.
Long-Term Resource Adequacy – Greater than 5 Years: VPPSA maintains an active inventory of long-term resources which includes both existing generation and projects proposed for development. Each resource is evaluated for its economic impact to VPPSA’s portfolio, including potential volatility and risks associated with the generation technology and counterparty. Resources meeting VPPSA’s goals are offered to members on a pro-rata basis. VPPSA targets resources that diversify Lyndonville’s exposure and include predictable pricing mechanisms that are not indexed.
Using these procurement methods, VPPSA has secured a significant portion of Lyndonville’s resource needs over the coming years. Due to the stable pricing mechanisms targeted, Lyndonville’s exposure to volatility has been minimized. By executing balancing trades among VPPSA’s members Lyndonville can eliminate some of the associated costs charged by market makers. At this time VPPSA is targeting the development of approximately 10MW of solar generation within a member territory. As a VPPSA member, Lyndonville will be offered a share of any VPPSA generation project. It is anticipated that Lyndonville would not initially own any of the facility, instead employing an ownership strategy which maximizes available incentives to reduce total cost to Lyndonville’s ratepayers. Further, Lyndonville anticipates that solar energy is attainable for costs within its existing rate structure. Additional resources with a variety of technology types have historically approached VPPSA and its members seeking long-term purchase-power-agreements. From those interactions it seems most likely that generation developed in the future will be in the form of solar, wind and natural gas. Existing resources employing biomass and natural gas technologies appear to be abundantly available in the future; however, price volatility makes them less suitable for VPPSA’s stability goals.

1
Village of Lyndonville Electric Department
Integrated Resource Plan
2016 - 2036
Part 2 – Transmission and Distribution
Presented to the Vermont Public Service Board
March 23, 2017
Submitted by:
Vermont Public Power Supply Authority

2
Village of Lyndonville Electric Department
2016 Integrated Resource Plan
Transmission and Distribution Section
INTRODUCTION
This component of the Integrated Resource Plan (“IRP”) of the Village of
Lyndonville Electric Department (“LED”) addresses the transmission and
distribution components of LED’s electric system. Consistent with
collaboration between LED, Vermont Public Power Supply Authority
(“VPPSA”) and the Vermont Public Service Department (“PSD”), the
format of this Transmission and Distribution (“T&D”) section of the IRP
follows the key topics contained within the addendum to the PSD’s 2011
Vermont Electric Plan.
The Village of Lyndonville Electric Department was incorporated in 1896.
Unlike most of Vermont’s smaller municipal utilities, many of its utility
functions, such as office staffing, are carried out by employees who have
no responsibilities in other aspects of village municipal operations. LED
remains guided by the Vermont Public Service Board (“PSB”) rules as
well as by the American Public Power Association’s (“APPA”) safety
manual, National Electric Code (“NEC”) and the National Electric Safety
Code (“NESC”). Well-established practices keep LED operating efficiently.
LED’s service territory is located in rural Caledonia and Essex Counties
in the Northeast Kingdom of Vermont. We serve a balanced mix of
residential and commercial load with approximately 50% residential,
38% commercial and 12% for municipal and street lights. LED’s service
territory encompasses the Village of Lyndonville as well as portions of
twelve surrounding towns: Burke, East Haven, Glover, Kirby, Lyndon,

3
Newark, Sheffield, St. Johnsbury, Sutton, Victory, Westmore and
Wheelock. Our service territory can be seen on the Vermont Utility
Service Territory map found below. LED serves approximately 5,700
retail customers with about 48% of LED’s customers served within the
village and town portions of Lyndon. Lyndon State College and Burke
Mountain are similar in load demand and LED’s two largest customers.
In 2015, LED’s peak demand in the winter months was 12.259 mW and
9.800 mW during the summer and shoulder months. Historically, LED
is a winter peaking utility. Annual energy sales for 2015 were
61,330,575 kWh and the annual load factor for 2015 was 57%.
LED receives its power from a ring bus configuration within VELCO’s
115kV substation located in Lyndonville. LED’s primary source of power,
prior to construction of the VELCO 115kV Substation, was a sub
transmission line connection with CVPS, now GMP. This sub-
transmission line remains in place and can be used as a redundant feed
to LED or as a source to GMP.

4
SERVICE TERRITORY
VILLAGE OF LYNDONVILLE ELECTRIC DEPARTMENT
Village of
Lyndonville Electric
Department Service
Territory

5
VILLAGE OF LYNDONVILLE ELECTRIC DEPARTMENT
SYSTEM OVERVIEW
The following table shows LED’s number of customers and retail sales for
the past 5 years.
Number of Retail Customers Retail kWh Sales
2011 2012 2013 2014 2015 2011 2012 2013 2014 2015
Residential
Sales 4,738 4,761 4,778 4,782 4,843 31,207,548 30,907,609 31,622,167 31,397,407 30,901,331
Large
Power 42 35 12 12 12 1,188,918 1,068,890 714,927 638,289 616,158
Small
commercial 778 784 812 827 845 10,468,823 10,363,933 10,364,477 10,613,300 11,003,573
Industrial 42 41 40 43 42 17,878,569 16,461,298 14,923,613 15,234,394 11,487,547
Street
Lighting 506,362 487,317 485,659 481,699 483,807
Municipal 6,690,559 6,890,761 6,764,331 6,571,713 6,838,159
Total 5,600 5,621 5,642 5,664 5,742 67,940,779 66,179,808 64,875,174 64,936,802 61,330,575
Municipal customers are counted in small or
industrial rate -3% -2% 0% -6%
The following table shows LED’s annual system peak with the day and
hour that it occurred for the past 5 years.
Annual System Peak Demand
2011 2012 2013 2014 2015
Peak Demand KW 12.892 12.614 13.468 13.309 12.259
Peak Demand Date 1/10/11 1/19/12 1/7/13 1/23/14 1/7/15
Peak Demand Hour 7:00
PM
8:00
PM
8:00
PM
7:00
PM
7:00
PM

6
LED-owned Generation:
LED owns two “run of the river” hydro stations comprising four
generators with LED utilizing all of their output. In 2015 the hydro
facilities produced 3,574 mWh (the annual capacity factor was
approximately 4.62% in 2015). Yearly average output for the stations is
3,573,895 kWh.
Lyndonville Owned Generation
Rating 2015 Annual Generation-KWH
Great Falls 1,700 3,573,895
Vail 400 0 (Under Repair)
Great Falls Hydro Station
Located at 76 Great Falls Drive, Lyndon on the Passumpsic River and is a run of the river facility having three turbines: one 1700kW Leffel turbine; and two smaller GE 400mW turbines.
Vail Hydro Station
Located at 166 Light Plant Drive, Lyndon on the Passumpsic River and is a run of the river facility having a single 400mW GE turbine.
Sub-Transmission System:
LED has twelve miles of 34.5kV sub-transmission interconnecting four of our five substations with VELCO’s 115kV substation and a connecting tap to a connection point with GMP’s 34.5 sub transmission line. GMP’s line is the previous sole feed to LED and can be used to receive or to feed power on to GMP’s grid.
Distribution System General:
LED has four hundred miles of distribution line. Given LED’s rural service territory, the majority of LED’s lines are off road and inaccessible from a street or highway. LED operates a total of nine (9) regulated

7
12.47 kV distribution feeders. All of the distribution mainline is overhead. The distribution system has been fully converted to 12.47/7.2 kV (four-wire) operation. The distribution system is in good physical condition and has been adequately maintained. The minimum conductor size that is now used is 1/0 ACSR. Some older, smaller diameter copper conductor is still present on some of the fused branch lines, where the thermal loading is generally quite small.
LED SUBSTATIONS
Substation name and description:
LED currently operates five substations. Each substation is briefly
described below.
Great Falls Substation (#1)
Great Falls substation is located at 76 Great Falls Drive, Lyndon, near
the St. Johnsbury/Lyndon town line. Unlike other LED substations,
Great Falls is a low-voltage substation. Generation from both hydro
stations is fed into the low-side of the substation bus at 2400 volts
through a 12470/2400 grounded wye transformer and distributed to the
Industrial Park Substation. Metering for hydro generation is located in
this substation, however there is no SCADA communication with this
substation.
Industrial Park Substation
Industrial Park Substation is located at 867 Industrial Parkway within
the St. Johnsbury /Lyndon Industrial Park. High-side voltage is 34.5kv
and is lowered to 12470 volts via 3.7mVa grounded wye step down
transformer. Voltage regulation is governed by 167kV GE regulators via
the bus. At the time of construction, the sub was to be utilized only for
the load developed within the Industrial Park. However, development in
the park fell short of expectations so to make the most of substation
capacity it was decided that residential distribution would concurrently
be served therefrom. Circuit 1 is the only circuit originating out of the
substation and is protected by a Cooper oil filled breaker. There is no
SCADA communication with this substation.

8
Hill Street Substation (#2)
Number Two Sub, as it is sometimes called, is located at 360 Hill Street,
Lyndonville. This is LED’s largest substation in regard to load and
footprint. Hill Street Sub consists of a 7.5 MVA with a 34.5kV high side
and a 12470/7200 grounded wye low side. Circuits originating from this
sub are Lines: 4 and 8. All circuits are protected by Cooper VWEs oil
filled breakers. Voltage regulation is via the bus governed by Siemens
250kVA regulators. There is no SCADA communication with this
substation.
Pudding Hill Substation
Located at 516 Pudding Hill Road, Lyndon, Pudding Hill is comprised of
34.5kV high side to 5MVA 12,740/7200 ground wye low side. Voltage
regulation is via the bus regulated by 167kV regulators. Circuits out of
the sub are lines 2, 3 and 42. All circuits are protected by Cooper oil
filled breakers. There is no SCADA communication with this substation.
Burke Mountain Substation
Burke Mountain Sub is the only LED substation outside of the town of
Lyndon. As with all other subs, Burke has a 34.5kV high side, a 5MVA
grounded wye transformer to 12470/7200 low side. Voltage regulation,
also as other LED subs is via the bus governed by 167kV regulators.
Circuits emanating from the sub are 6 and X6. These circuits are
protected by Cooper oil filled breakers. There is no SCADA
communication with this substation.

9
The location of LED’s major substation facilities are shown in the map below.
LED SUBSTATIONS
Circuit Description:
Circuit Name Description Outages by
Circuit 2016
Line: 1 Broad St., South Wheelock, Kirby 97
Line: 2 Broad St., Wheelock 8
Line: 3 Lyndon Center, Lyndon St. College 9
Line: 4 Lyndon, Burke, Newark, Westmore 75
Line: 42 Lyndon, Sutton, Wheelock, Glover 56
Line: 6 East Burke, East Haven 57
Line: X6 Burke Mountain 1
Line: 7 Lyndon, Kirby 26
Line: 8 Lyndonville Village, Broad St. 5
LED has nine feeder circuits in total. LED does not consider any of its
circuits to be particularly long. LED operates its system to maintain 114
to 126 volts at the customer’s outlets.
10
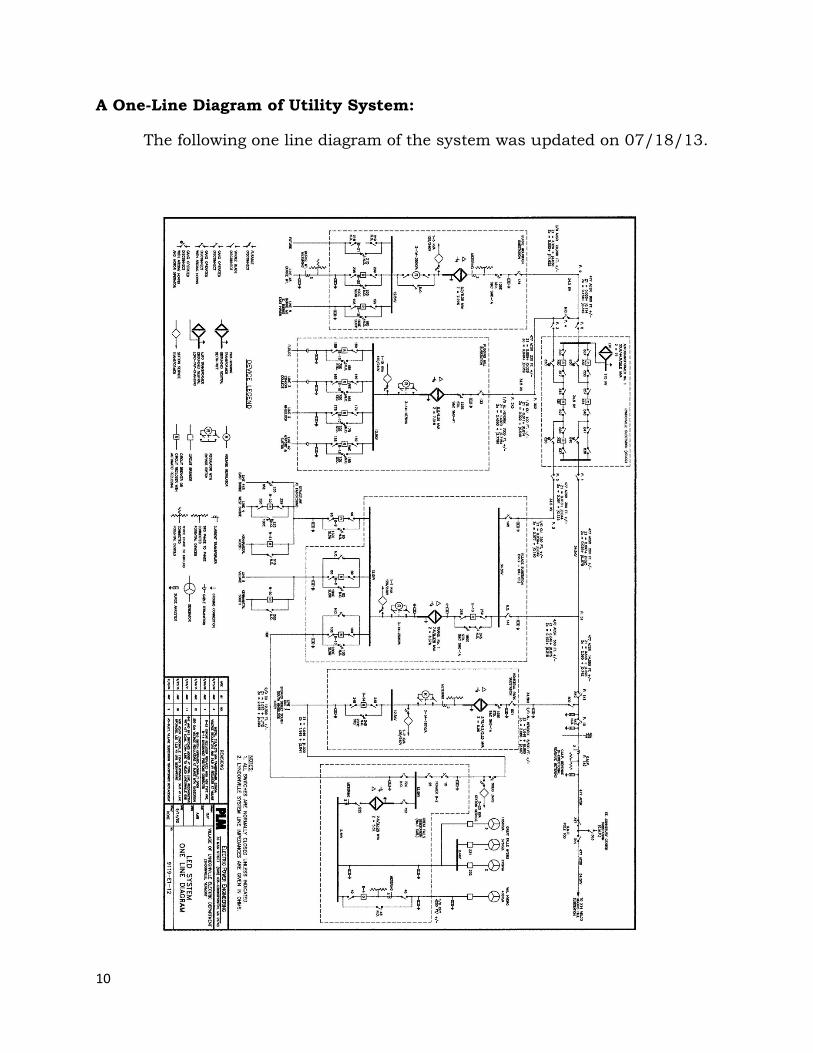
A One-Line Diagram of Utility System:
The following one line diagram of the system was updated on 07/18/13.
11
The IRP should contain a detailed description of how and when the utility
evaluates individual T&D circuits to identify the optimum economic and
engineering configuration for each circuit, while meeting appropriate
reliability and safety criteria.
LED evaluates T&D circuits on an ongoing basis in order to identify the
optimum economic and engineering configuration for each circuit. The
evaluations include the review of the Rule 4.900 Outage Reports and
data collected from load loggers. In addition, LED periodically completes
long term system planning studies to develop overall strategies for
improving the performance of the T&D facilities. The cost of the
improvements recommended in the study are developed into a 5 year
budget and approved by the Trustees based upon the financial position
of LED’s electric department.
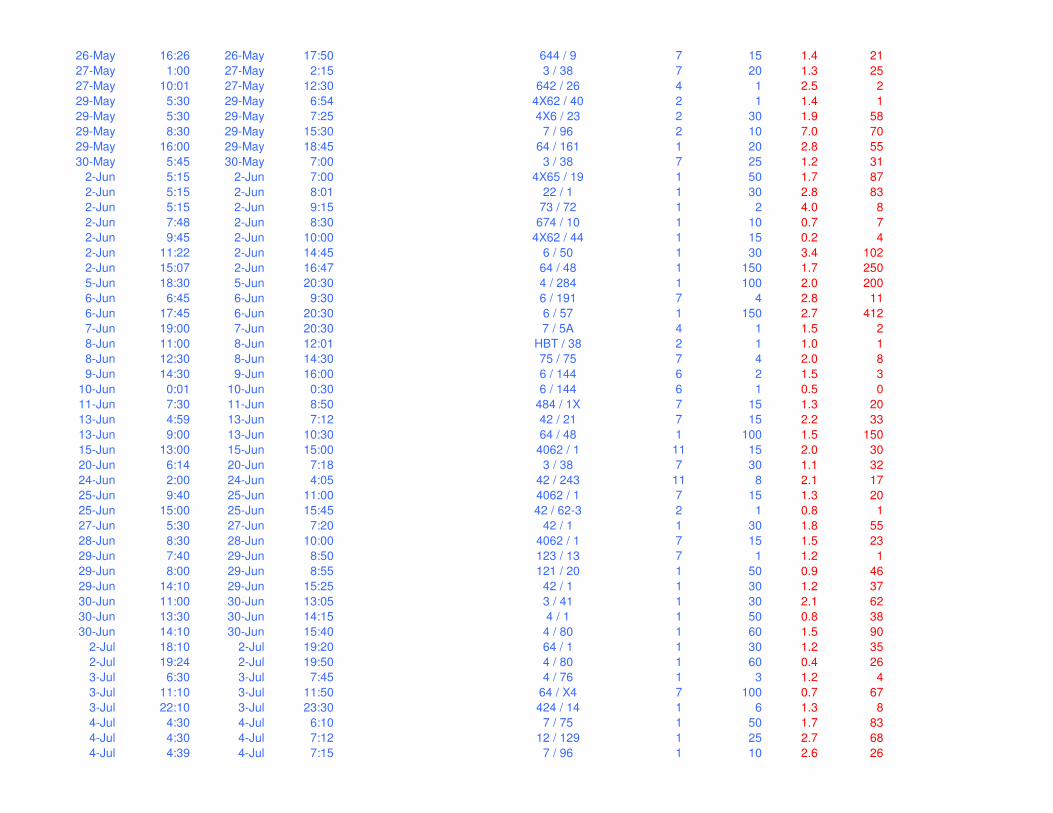
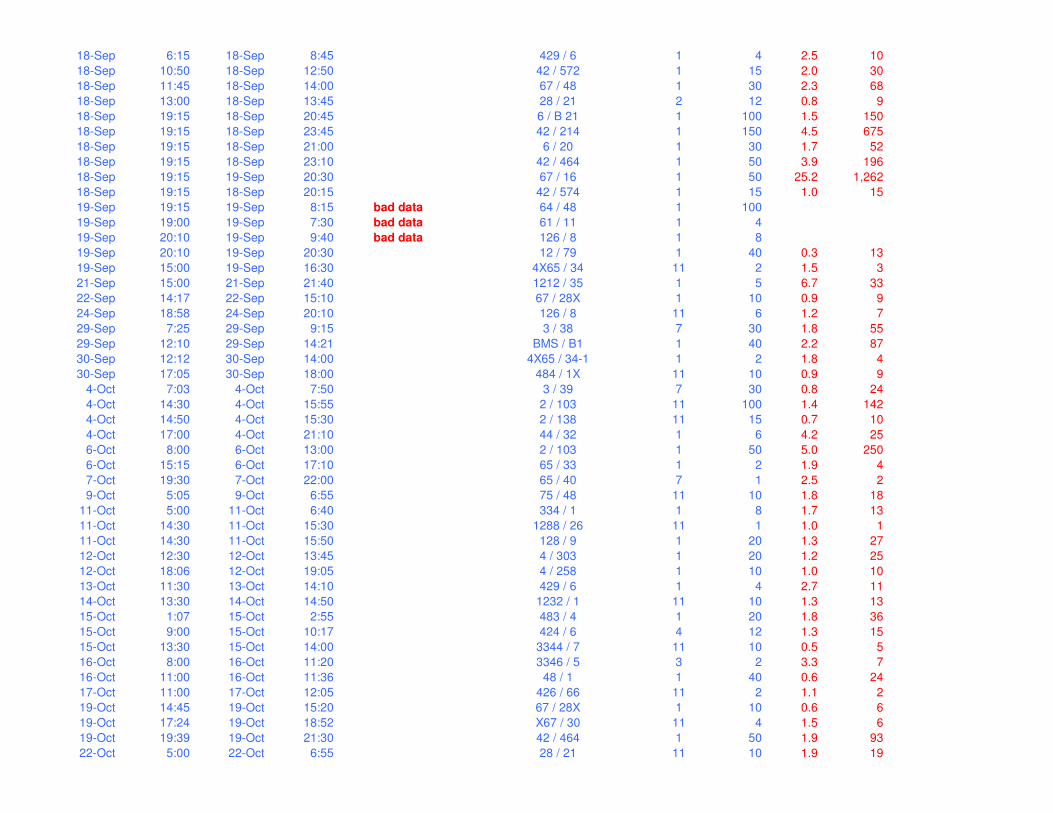
LED’s Public Service Board Rule 4.900 Electricity Outage Reports,
reflecting the last four years (2012-2015) in their entirety, can be found
at the end of this document.
LED has committed to performance standards for reliability that measure
the frequency and duration of outages affecting its customers. There are
two primary measures for the frequency and duration of outages. The
Public Service Board’s Rule 4.900 defines them as:
System Average Interruption Frequency Index ("SAIFI"):
Customers Out divided by Customers Served. SAIFI is a
measure of the average number of times that the average
customer experienced an Outage.
Customer Average Interruption Duration Index ("CAIDI"):
Customer Hours Out divided by Customers Out. CAIDI is a
measure of the average length of time, in hours, that was
required to restore service to customers who experienced an
Outage.
LED has committed to achieve performance levels for its distribution
system below an index of 3.0 for SAIFI and 2.6 for CAIDI. LED maintains
a record of and reports on all its system outages, including the root
cause of an outage. While some outages cannot be prevented, there are a
number of specific, cost-effective steps that can be taken to maintain or
improve system reliability by working to eliminate the potential for some

12
outages to occur and making changes that will promote reduced outage
times when an unavoidable outage does occur.
The following table summarizes LED’s SAIFI and CAIDI values for the
years 2012 – 2015.
Baseline 2012 2013 2014 2015
SAIFI 3.0 1.6 2.9 1.5 2.0
CAIDI 2.6 2.8 2.6 2.5 2.2
LED has a number of initiatives underway to improve reliability. Each of these initiatives is described below.
Feeder back-up
The design of LED’s distribution system allows for feeder backup only within the greater limits of Lyndonville. Where possible we have installed fusing and solid cutouts to re-route power from different substations in the event that a feeder is lost.
Automatic Reclosers/Fusing
All circuits originating from a substation are protected by oil filled reclosers.
Only line 4 has a recloser at its origin outside of a substation. None of LED
reclosers have communication integrated; all reclosers operate per programmed
settings. The bulk of LED’s lines are protected by aerial fusing.
Animal Guards
All aerial pathways into our substation bus work are covered by animal
guards. Additionally, it is our practice to install animal guards on all new
distribution transformer installations or change outs.
Fault Locators
We have installed fault locators on the out feed of our underground
distribution enclosures to help in identifying de-energized conductor.
Aerially, we rely on fusing to indicate downstream issues.

13
Page A-10 T&D System Evaluation
1) The current power factor of the system, and any plans for power factor correction; As of an August 2010 Transmission and Distribution System Study LED had a power factor of 94%. With new management in place, LED has recently began investigating options to improve power factor.
2) Distribution circuit configuration, phase balancing, voltage upgrades where appropriate, and opportunities for feeder back-up; Phase Balancing
Each of LED’s distribution feeders have been checked for load balance between phases. It should be noted that limited options exist for load balancing on certain feeders (Pudding Hill B-17 and B-18), as these feeders each feed a long single phase branch that load one phase of the circuit more heavily. Where balancing was possible, losses were slightly reduced and end of line voltage improved. Voltage Conversion
LED completed its system wide voltage conversion in 2000 from
4800/2800 to 12470/7200.
Feeder Back-ups As stated previously, due to the design of LED’s distribution grid, only feeders in the vicinity of Lyndonville have been altered to allow for feeder back-up.
3) Sub transmission and distribution system protection practices and methodologies;
LED has system protection that covers transmission, substations and
distribution plant. Each protection methodology is discussed
individually below.
Transmission
The VELCO Lyndonville substation has a single 115 to 34.5 kV transformer and a 5-breaker 34.5 kV ring bus. One position in the ring bus is used for the transformer connection. The other four positions are

14
used as terminals for LED’s 34.5 kV lines. The 34.5 kV circuit breakers that supply LED’s 34.5 kV transmission lines have state of the art relay protection and control packages connected to VELCO’s SCADA system.
Substation
At No. 2 Substation (Hill St.), transformer high side protection at the Village substation is accomplished using a 34.5 kV circuit recloser. The recloser has been configured to monitor the transformer neutral CT, which allows it to sense ground faults on the 12.47 kV side of the transformer. This provides fast acting backup capability in the event of a stuck feeder recloser. At Pudding Hill Substation, transformer high side protection at the Village substation is accomplished using power fuses. The fuse size has been selected to coordinate with the source side devices. At Burke Mountain Substation, transformer high side protection at the Burke Mountain substation is accomplished using power fuses. The fuse size has been selected to coordinate with the source side devices. At Industrial Park Substation, transformer high side protection at the Industrial Park substation is accomplished using power fuses. The fuse size has been selected to coordinate with the source side devices.
Distribution
At No. 2 Substation (Hill St.), distribution feeder protection for the B-8, B-9, and B-10 feeders is accomplished using circuit reclosers, with automatic line reclosing. Additional automatic line sectionalizing of the B-9 feeder is accomplished via the mid feeder B-24 line recloser, which is located near the fairgrounds. At Pudding Hill Substation, distribution feeder protection for the B-16, B-17, and B-18 feeders is accomplished using circuit reclosers with automatic line reclosing. At Burke Mountain Substation, distribution feeder protection for the B-19 and B-20 feeders is accomplished using circuit reclosers, with automatic line reclosing. At Industrial Park Substation, distribution feeder protection for the B-24 feeders is accomplished using a circuit recloser.

15
LED utilizes branch fusing on all of its distribution feeders to ensure that line faults are sectionalized in a manner that affects the fewest number of customers.
4) The utility’s planned or existing “smart grid” initiatives such as advanced metering infrastructure or distribution automation; Like the other VPPSA member electric utility systems, LED is part of the docket 7307 collaborative process that continues in both formal and informal means. The ongoing participation of LED and other VPPSA members in various facets of “smart grid” explorations has underscored both the challenges and the opportunities that lie ahead. On the challenge side, the cost effectiveness of AMI infrastructure is significantly less clear in small utilities like LED, where relatively limited savings around meter reading and other labor costs are combined with a terrain that challenges the efficacy of many wireless AMI systems. On the positive side, participation by VPPSA and member systems in municipal smart grid summits and other events have shown that prospective electric-water-sewer AMI applications may have efficiencies and synergies not available in electric only installations, though cost allocation in such situations must be done carefully to avoid subsidization issues. As we continue to collaborate with our Vermont utility colleagues regarding “lessons learned” from their experiences, LED will be in a good position to make technically and financially sound decisions regarding the timing and specifics of the smart grid applications that will be coming. LED is of course mindful of the many facets of the evolving grid, such as rapidly expanding net metering development, heat pump installations, and the advent of electric vehicles. Working with VPPSA, Efficiency Vermont, and other stakeholders, LED stays abreast of these developments and the strategies needed to maintain a safe, reliable, and economically viable distribution system. While definitions of “smart grid” vary even within the industry, LED is also mindful of the increasing importance of cyber-security concerns, and the relationship of those concerns to technology selection and protection. While LED is not presently required to undertake NERC or NPCC registration, VPPSA is a registered entity, and the presence of the LED Manager on the VPPSA Board of Directors provides LED with knowledge and insight regarding ongoing cyber-security developments and risks. On a more local level, LED endeavors to purchase and protect its IT systems (with assistance from VPPSA as needed), in a manner intended to minimize security risks to the system and its

16
ratepayers. LED remains mindful of the balance between the levels of cyber-security risk protection and the associated costs to its ratepayers.
5) Re-conductor lines with lower loss conductors; A section of 34.5 sub transmission from the VELCO 115 kV substation to LED’s connection point with GMP has been re-conductored with larger 477 mcm (Pelican) conductor to strengthen the connection between VELCO/LED/GMP. The distribution system is in good physical condition and has been adequately maintained. The minimum conductor size that is now used is 1/0 ACSR. Some older, smaller diameter copper conductor is still present on some of the fused branch lines, where the thermal loading is generally quite small.
6) Replacement of conventional transformers with higher efficiency transformers; As a practice, LED requires load loss data from vendors when quoting distribution transformers. LED considers manufactures such as ABB, Cooper, and Ermco as trusted brands, and multiple factors such as load losses, cost, brand and delivery are considered in our purchasing decision.
7) Conservation voltage regulation;
New management at LED has begun to investigate and consider CVR in tandem with power factor correction capacitors. Preliminarily, it appears implementation costs are negligible; however, it has yet been determined if a sufficient cost benefit ratio exists.
8) Implementation of a distribution transformer load management (DTLM) or similar program; A program of this type would use customer kWh billing records in order to estimate transformer loading. A list of the most heavily loaded transformers could then be produced, allowing for further investigation by LED. On a rural system such as LED’s, most of the transformers are fairly lightly loaded and many serve single residences. It is unlikely that a DTLM program would be cost effective, given the relatively small number of transformers that could be expected to be heavily loaded.

17
9) A list of the locations of all substations that fall within the 100 and 500 year flood plains, and a plan for protection or relocation of these facilities. None of LED’s substations fall within a flood plain.
10) A current copy of the utility underground Damage Prevention Plan (DPP) (or provide a plan to develop and implement a DPP; if none exists). The bulk of LED lines are aerial; however, we do own a small amount underground primary. All customers own their underground service lateral and a small number of customers own primary underground. LED utilizes the Vermont Utilities Electric Service Requirements manual as its Underground Facilities Standards. LED follows and will continue to adhere to the Vermont Dig Safe Law. LED will collaborate with other VPPSA members to develop a DPP.
Discuss the utility’s process for selecting transmission and distribution
equipment (i.e., net present value of life cycle cost, evaluated on both a
societal and utility/ratepayer basis).
LED purchases equipment that is UL approved or certified by other industry
standards prioritizing factors of quality and reliability.
Set out program to maintain optimal T&D efficiency. Report program
progress.
System Maintenance
Conductor
LED’s standard distribution conductor size is 1/0 aluminum, which is
installed on most of our feeder lines; side taps can be copper conductor
of smaller size. As time and resources allow LED has been replacing
conductor on tap lines. The purchase of a wire puller last year will allow
LED to begin replacing the remaining open secondary with updated
triplex service cable along streets and highways.
Pole Inspection

18
In 2017, LED is going to revive its GPS/GIS program, and from this we
shall be able to “farm” the database for fully depreciated or noted poor
condition poles for replacement. Quarterly, transmission lines are
patrolled and conditions of conductors, poles, and vegetation are noted
and prioritized for repair or replacement.
Equipment
Substation equipment and Gang Operated Switches in the field are
inspected on a monthly basis. Reclosers and regulators are tested
annually. Infra-red testing is also done annually on all substation
equipment and components as well as selected components in the field.
Energy Losses and System Efficiency
In efforts to reduce losses, LED completed conversion to 12,470/7200
voltage system wide in 2000. To further minimize line losses, LED has
standardized on 1/0 AAAC (Azusa) conductor for all new distribution
construction. Older tap lines with lower capacity conductor are being
upgraded on a prioritized basis.
0.00%
2.00%
4.00%
6.00%
8.00%
10.00%
12.00%
14.00%
16.00%
2006 2007 2008 2009 2010 2011 2012 2013 2014 2015
Pe
rce
nta
ge
of
Bo
un
da
ry L
oa
d
System Losses

19
Does the utility use the NJUNS database to track transfer of utilities and
dual pole removal?
Yes, LED utilizes NJUNS database to initiate and track pole activities
between LED and other pole partners.
What is the utility’s philosophy regarding relocating cross-country lines
to road-side?
LED does believe in relocating cross-country lines to road-side. In 2015,
we completed moving one mile of line out of the woods to alongside the
highway to cheers of the field personnel and LED customers. We will
continue to do so as time and finances allow, providing ROWs can be
obtained.
Describe vegetation management plan, per page A-13, and complete the
table on page A-14.
Explain why it's a “least cost program” including details on tree species,
annual growth rates of these species, and vegetation techniques,
including when, where, and how herbicides are used.
LED has set a goal of an eight-year trimming cycle and is striving to do
so. LED utilizes the local Vermont Department of Corrections Offenders
Program during the non-snow months to assist in maintaining ROWs.
An employee of LED accompanies the Corrections Offenders Program
crew along with a Corrections Department supervisor. Cutting/trimming
experience and work ethic varies from crew to crew and year to year but
over time has proven to be a low-cost alternative to other means of
vegetation management. The crew’s primary focus is to remove ground
vegetation, and with assistance from the LED personnel, reclaim the
ROW width. Additionally, LED uses in-house capabilities and hires a
local company for off-road danger trees and trimming where climbing is
required. Starting in 2017, LED’s trimming budget has been increased
to accommodate more aerial trimming on the system. Presently, and for
the foreseeable future, LED will not be incorporating herbicides to curb
vegetation management.

20
LED has not begun to focus on tree species growth cycles yet; we are
striving to complete the entire system within the eight-year time frame.
Once the time framed has been achieved, LED will change focus to trees
species and growth cycles.
Total Miles Miles Needing
Trimming
Trimming Cycle
Transmission 12 6 8
Distribution 400 300 8
Distribution Lines Vegetative Management:
2013 2014 2015 2016 2017 2018
$ Amount
Budgeted
117,881 130,524 150,000 101,015 261,200 TBD
$ Amount
Spent
118,476 139,773 99,449 160,122 TBD TBD
Approx.
Miles
Trimmed
12.68 11.6 11.5 10.2
Transmission Lines Vegetative Management:
2013 2014 2015 2016 2017 2018
$ Amount
Budgeted
7,500 10,000 10,000 378 643 TBD
$ Amount
Spent
7,742 1,250 0 16 TBD TBD
Approx.
Miles
Trimmed
1.5 .39 0 .1

21
Utilities should monitor the # of tree-related outages as compared to the
total number of outages, and provide this information
2011 2012 2013 2014 2015
Tree-Related Outages 197 202 312 141 143
Total Outages 366 372 483 247 283
Tree-Related Outages as % of
Total Outages
53% 54% 65% 57% 51%
Note: The above table is normalized for major storm events.
Describe storm/emergency procedures, such as securing contract crews,
dispatch center, participating in utility conference calls, updating
vtoutages.com.
Like other Vermont municipal electric utilities, LED is an active
participant in the Northeast Public Power Association (“NEPPA”) mutual
aid system, which allows LED to coordinate not only with public power
systems in Vermont, but with those throughout New England. A LED
representative is also on the state emergency preparedness conference
calls, which facilitate in-state coordination between utilities, state
regulators and other interested parties. LED uses the
www.vtoutages.com site during major storms especially if it experiences a
large outage that is expected to have a long duration. LED believes it is
beneficial to inform the Public Service Department if it is experiencing
these types of outages. LED partners with neighboring municipals and
cooperatives when extra crew power is required. LED does not typically
use contract crews.
Discuss last T&D studies, and plans for future studies.
LED completed a Transmission and Distribution System Study just prior
to the VELCO/Lyndonville 115kV Substation coming online in 2010.
LED will contact the authors of the study to inquire if the study remains
relevant or should be updated taking into consideration six years of
operation data with the 115kV Substation energized.

22
Has a fuse coordination study been conducted, and has it been
implemented?
No, a fuse coordination study has not been conducted nor implemented.
LED is not experiencing any issues with fuse coordination at this time.
Historical Capital Projects over last three years (2013-2016):
Actual 2013 Hydro Plant 0
Transmission Plant 0
Distribution Plant 205,007
Transportation 0
Actual 2013 Total: $205,007
Actual 2014 Hydro Plant 34,278
Transmission Plant 0
Distribution Plant 238,238
Transportation 0
Actual 2014 Total: $272,516
0
100,000
200,000
300,000
400,000
500,000
600,000
700,000
800,000
2013 2014 2015 2016
Do
lla
rs
Capital Expenditures 2013-2016

23
2015 Hydro Plant 137,185
Transmission Plant
Distribution Plant 225,375
Transportation 265,177
2015 Total: $627,737
Future Capital Projects for next three years (2016-2018):
Budget 2016 Hydro Plant 516,396
Transmission Plant
Distribution Plant 184,153
Transportation
Budget 2016 Total: $700,549
Budget 2017 Hydro Plant 100,000
Transmission Plant
Distribution Plant
Transportation
Budget 2017 Total: $100,000
Budget 2018 Hydro Plant
Transmission Plant
Distribution Plant
Transportation
Budget 2018 Total: $

VILLAGE OF LYNDONVILLE
ELECTRIC DEPARTMENT
Superintendent’s Office
46 Grove Street, PO Box 167 Lyndonville, Vermont 05851
Telephone (802) 626-9252
Facsimile (802) 626-9253
PSB RULE 4.093(B) (3) OVERALL ASSESSMENT OF SYSTEM RELIABILTIY FOR 2012 It continues as in years past that trees cause over half of the outages on LED’s system. In this past year we continued to use the Vermont Offender Work Program and a LED crew to remove ground vegetation and encroaching trees. Additionally, we hired a tree contractor to supplement our tree removal and reclaim our easement to standards. This is a combination of resources that we are continuing into this year. We are nearing agreement with owners on relocating 4,200 feet of crossing country distribution line to along the highway. This section has been a problem area for many years, given the height of the trees, condition of the trees and access to the right-of-way. If a problem occurred on that section of line, it would take hours to discover, repair and re-energize. Once the line has been relocated, any repair will take only a fraction of the time required in year past. Power Supplier outages that had plagued LED in years past have become a nonexistent due to LED’s power being supplied from the VELCO-Lyndonville substation. Bill Humphrey Superintendent of Operations Village of Lyndonville Electric Department

Lyndonville Electric DepartmentRecord of Outages -- PSB Rule 4.900 Codes for type of outage:
Company Lyndonville Electric Department 1 Trees 6 Accidents
Calendar year 2012 2 Weather 7 Animals
Contact person Bill Humphrey 3 Company initiated outage 8 Power supplier
Phone number 802-626-9252 4 Equipment failure 9 Non-utility power supplier
Customers served 5,520 5 Operator error 10 Other
11 UnknownExamples:
10-Jan 14:10 11-Jan 13:30 3G2 2 50 23.3 1,166.7
10-Jan 12:30 09-Jan 2:00 bad data 3G2 2 50
If indicated, System (if system outage) Calculated columns
Outage Start Outage end Illegal date or time Substation ID (if substation outage) Outage Customers Outage CustomerDay-month Hour:minute Day-month e Please reenter data Circuit ID (if circuit outage) Code Out Duration Hours Out
2-Jan 7:55 2-Jan 9:30 42 / 518 11 20 1.6 32
2-Jan 15:00 2-Jan 17:25 4 / 1 1 80 2.4 193
2-Jan 21:20 2-Jan 23:30 406 / 16 4 1 2.2 2
8-Jan 8:45 8-Jan 10:30 73 / 30 7 3 1.7 5
19-Jan 9:30 19-Jan 10:05 12 / 156 7 1 0.6 1
19-Jan 12:15 19-Jan 13:00 67 / 16 11 75 0.8 56
22-Jan 11:00 22-Jan 13:20 420 / 22 4 1 2.3 2
23-Jan 11:15 23-Jan 12:30 7 / 96-13 4 2 1.3 3
23-Jan 11:20 23-Jan 12:30 7 / 96-13 4 2 1.2 2
25-Jan 7:00 25-Jan 9:50 48 / 24 11 30 2.8 85
27-Jan 20:22 27-Jan 22:15 121 / 77 1 8 1.9 15
29-Jan 8:00 29-Jan 9:00 72 / 19 7 10 1.0 10
29-Jan 8:00 29-Jan 9:00 72 / 19 7 10 1.0 10
1-Feb 8:54 1-Feb 9:31 128 / 46 7 20 0.6 12
2-Feb 3:30 2-Feb 5:00 45 / 1 4 1 1.5 2
8-Feb 13:30 8-Feb 15:00 1212 / 2 7 30 1.5 45
8-Feb 20:45 8-Feb 22:30 X61 / 2-8 7 8 1.7 14
11-Feb 7:09 11-Feb 8:45 42 / 518 7 20 1.6 32
16-Feb 9:00 16-Feb 10:50 49 / 34 7 15 1.8 28
18-Feb 9:10 18-Feb 10:55 4201 / 1 7 30 1.7 52
21-Feb 7:30 21-Feb 8:10 7 / 72 11 50 0.7 33
21-Feb 8:50 21-Feb 9:40 4X6 / 82 7 25 0.8 21
21-Feb 10:20 21-Feb 10:50 126 / 18 7 11 0.5 6
22-Feb 9:00 22-Feb 11:00 128 / 59 1 8 2.0 16
23-Feb 10:30 23-Feb 11:40 401 / 6 7 15 1.2 17
25-Feb 3:30 25-Feb 5:00 7 / 75 11 50 1.5 75
25-Feb 7:30 25-Feb 9:10 IPSub / B-24 2 50 1.7 83
25-Feb 7:30 25-Feb 10:10 4X6 / X28 2 20 2.7 53
25-Feb 7:30 25-Feb 10:34 4X60 / 2 2 80 3.1 245
25-Feb 8:00 25-Feb 10:00 28 / 1 2 30 2.0 60
25-Feb 8:00 25-Feb 10:30 2 / 34 2 2 2.5 5
25-Feb 12:30 25-Feb 13:49 22 / 1 1 20 1.3 26

25-Feb 12:30 25-Feb 16:30 128 / 61 1 15 4.0 60
4-Mar 7:16 4-Mar 8:45 4X65 / 19 11 50 1.5 74
4-Mar 7:45 4-Mar 9:28 64 / 161 11 20 1.7 34
8-Mar 21:45 9-Mar 1:45 402 / 3 2 50 4.0 200
8-Mar 21:45 9-Mar 2:50 12 / 190 2 45 5.1 229
10-Mar 7:40 10-Mar 9:40 609 / 26 7 3 2.0 6
11-Mar 13:32 11-Mar 15:15 42 / 464 11 50 1.7 86
13-Mar 15:35 13-Mar 16:35 46 / 18 11 40 1.0 40
16-Mar 6:07 16-Mar 7:47 46 / 18 1 40 1.7 67
16-Mar 11:30 16-Mar 14:30 46 / 19 4 20 3.0 60
25-Mar 6:30 25-Mar 8:30 430 / 15 11 6 2.0 12
26-Mar 9:00 26-Mar 11:05 402 / 70 1 20 2.1 42
2-Apr 15:45 2-Apr 17:00 6 / 147 1 30 1.3 38
4-Apr 14:00 4-Apr 16:00 15 / X16 1 20 2.0 40
4-Apr 14:00 4-Apr 17:10 4201 / 1 1 15 3.2 48
9-Apr 15:30 9-Apr 16:30 402 / 3 1 50 1.0 50
10-Apr 7:15 10-Apr 10:00 429 / 6 1 4 2.7 11
10-Apr 11:30 10-Apr 14:10 4 / 277 1 8 2.7 21
13-Apr 20:30 13-Apr 23:00 402 / 1X 4 10 2.5 25
14-Apr 16:30 14-Apr 18:00 121 / 63 1 20 1.5 30
16-Apr 17:55 16-Apr 19:10 48 / 23 1 30 1.2 37
22-Apr 8:39 22-Apr 10:10 67 / 24 1 2 1.5 3
23-Apr 7:00 23-Apr 10:20 6 / 57 1 15 3.3 50
23-Apr 8:30 23-Apr 10:30 68 / 50 11 30 2.0 60
24-Apr 16:00 24-Apr 17:20 461 / 8 11 1 1.3 1
27-Apr 14:40 27-Apr 15:50 429 / 6 1 4 1.2 5
29-Apr 4:11 29-Apr 5:45 4 / 76 6 1 1.6 2
29-Apr 14:04 29-Apr 15:49 40 / 32 1 6 1.8 11
29-Apr 15:50 29-Apr 17:00 402 / 3 1 50 1.2 58
29-Apr 20:32 29-Apr 22:50 128 / 1 1 60 2.3 138
4-May 17:15 4-May 18:45 64 / 58-2 4 2 1.5 3
7-May 7:00 7-May 9:00 4X65 / 33 7 3 2.0 6
7-May 15:00 7-May 16:25 2 / 138 6 15 1.4 21
15-May 19:00 15-May 20:20 6 / 164 11 1 1.3 1
16-May 17:08 16-May 21:10 4061 / 14-14 4 1 4.0 4
16-May 17:30 16-May 18:30 3346 / 3 2 6 1.0 6
16-May 17:30 16-May 19:15 406 / 14-20 2 1 1.8 2
16-May 17:30 16-May 19:18 4061 / 14-7 2 10 1.8 18
21-May 14:00 21-May 15:00 12 / 270 1 4 1.0 4
22-May 10:45 22-May 11:50 427 / 47 1 1 1.1 1
24-May 18:49 24-May 20:10 64 / 163 2 1 1.4 1
24-May 18:49 24-May 20:50 4191 / 22-1 2 1 2.0 2
24-May 22:21 24-May 23:55 64 / ? 4 1 1.6 2
25-May 2:17 25-May 4:00 42 / 21 1 20 1.7 34
25-May 13:56 25-May 14:50 48 / 24 1 30 0.9 27
25-May 23:00 26-May 0:25 644 / 9 11 15 1.4 21
26-May 15:26 26-May 16:50 129 / 1 4 1 1.4 1
26-May 16:26 26-May 17:50 644 / 9 7 15 1.4 21
27-May 1:00 27-May 2:15 3 / 38 7 20 1.3 25
27-May 10:01 27-May 12:30 642 / 26 4 1 2.5 2
29-May 5:30 29-May 6:54 4X62 / 40 2 1 1.4 1
29-May 5:30 29-May 7:25 4X6 / 23 2 30 1.9 58
29-May 8:30 29-May 15:30 7 / 96 2 10 7.0 70
29-May 16:00 29-May 18:45 64 / 161 1 20 2.8 55
30-May 5:45 30-May 7:00 3 / 38 7 25 1.2 31
2-Jun 5:15 2-Jun 7:00 4X65 / 19 1 50 1.7 87
2-Jun 5:15 2-Jun 8:01 22 / 1 1 30 2.8 83
2-Jun 5:15 2-Jun 9:15 73 / 72 1 2 4.0 8
2-Jun 7:48 2-Jun 8:30 674 / 10 1 10 0.7 7
2-Jun 9:45 2-Jun 10:00 4X62 / 44 1 15 0.2 4
2-Jun 11:22 2-Jun 14:45 6 / 50 1 30 3.4 102
2-Jun 15:07 2-Jun 16:47 64 / 48 1 150 1.7 250
5-Jun 18:30 5-Jun 20:30 4 / 284 1 100 2.0 200
6-Jun 6:45 6-Jun 9:30 6 / 191 7 4 2.8 11
6-Jun 17:45 6-Jun 20:30 6 / 57 1 150 2.7 412
7-Jun 19:00 7-Jun 20:30 7 / 5A 4 1 1.5 2
8-Jun 11:00 8-Jun 12:01 HBT / 38 2 1 1.0 1
8-Jun 12:30 8-Jun 14:30 75 / 75 7 4 2.0 8
9-Jun 14:30 9-Jun 16:00 6 / 144 6 2 1.5 3
10-Jun 0:01 10-Jun 0:30 6 / 144 6 1 0.5 0
11-Jun 7:30 11-Jun 8:50 484 / 1X 7 15 1.3 20
13-Jun 4:59 13-Jun 7:12 42 / 21 7 15 2.2 33
13-Jun 9:00 13-Jun 10:30 64 / 48 1 100 1.5 150
15-Jun 13:00 15-Jun 15:00 4062 / 1 11 15 2.0 30
20-Jun 6:14 20-Jun 7:18 3 / 38 7 30 1.1 32
24-Jun 2:00 24-Jun 4:05 42 / 243 11 8 2.1 17
25-Jun 9:40 25-Jun 11:00 4062 / 1 7 15 1.3 20
25-Jun 15:00 25-Jun 15:45 42 / 62-3 2 1 0.8 1
27-Jun 5:30 27-Jun 7:20 42 / 1 1 30 1.8 55
28-Jun 8:30 28-Jun 10:00 4062 / 1 7 15 1.5 23
29-Jun 7:40 29-Jun 8:50 123 / 13 7 1 1.2 1
29-Jun 8:00 29-Jun 8:55 121 / 20 1 50 0.9 46
29-Jun 14:10 29-Jun 15:25 42 / 1 1 30 1.2 37
30-Jun 11:00 30-Jun 13:05 3 / 41 1 30 2.1 62
30-Jun 13:30 30-Jun 14:15 4 / 1 1 50 0.8 38
30-Jun 14:10 30-Jun 15:40 4 / 80 1 60 1.5 90
2-Jul 18:10 2-Jul 19:20 64 / 1 1 30 1.2 35
2-Jul 19:24 2-Jul 19:50 4 / 80 1 60 0.4 26
3-Jul 6:30 3-Jul 7:45 4 / 76 1 3 1.2 4
3-Jul 11:10 3-Jul 11:50 64 / X4 7 100 0.7 67
3-Jul 22:10 3-Jul 23:30 424 / 14 1 6 1.3 8
4-Jul 4:30 4-Jul 6:10 7 / 75 1 50 1.7 83
4-Jul 4:30 4-Jul 7:12 12 / 129 1 25 2.7 68
4-Jul 4:39 4-Jul 7:15 7 / 96 1 10 2.6 26

4-Jul 20:24 4-Jul 22:00 64 / 163 1 1 1.6 2
5-Jul 3:27 5-Jul 6:26 4X65 / 19 1 50 3.0 149
6-Jul 1:08 6-Jul 3:26 644 / 9 11 10 2.3 23
9-Jul 14:00 9-Jul 15:03 64 / X1 4 200 1.0 210
10-Jul 13:55 10-Jul 14:45 1286 / 7-1 1 1 0.8 1
11-Jul 7:10 11-Jul 8:30 674 / 2 11 2 1.3 3
11-Jul 8:00 11-Jul 12:50 7 / 72 1 30 4.8 145
11-Jul 12:45 11-Jul 13:45 49 / 37 7 1 1.0 1
12-Jul 9:15 12-Jul 10:30 121 / 63 7 30 1.3 38
17-Jul 11:45 17-Jul 13:00 641 / 11-1 2 6 1.2 7
17-Jul 15:20 17-Jul 15:45 64 / 68 2 1 0.4 0
18-Jul 9:30 18-Jul 13:15 42 / 274 1 6 3.8 23
18-Jul 19:11 18-Jul 20:51 128 / 59 1 10 1.7 17
21-Jul 12:22 21-Jul 14:13 HBT 51 / 3 7 8 1.9 15
21-Jul 12:26 21-Jul 14:15 HBT 51 / 1-2 7 8 1.8 15
22-Jul 8:19 22-Jul 9:35 483 / 4 11 35 1.3 44
23-Jul 19:50 23-Jul 23:00 42 / 214 2 100 3.2 317
23-Jul 20:00 23-Jul 22:00 6 / 109 2 75 2.0 150
23-Jul 20:00 23-Jul 22:30 642 / 14-1 1 2 2.5 5
23-Jul 23:40 24-Jul 1:15 484 / 1X 1 15 1.6 24
23-Jul 22:00 24-Jul 1:40 49 / 34 2 15 3.7 55
23-Jul 23:30 24-Jul 3:00 42 / 518 1 10 3.5 35
23-Jul 20:00 24-Jul 0:15 42 / 75 2 20 4.2 85
23-Jul 20:00 24-Jul 1:30 28 / 21 2 10 5.5 55
23-Jul 20:00 24-Jul 3:40 28 / 41 2 2 7.7 15
23-Jul 23:30 24-Jul 4:00 42 / 464 1 40 4.5 180
23-Jul 20:00 24-Jul 0:30 128 / 18-6 2 1 4.5 5
24-Jul 20:00 24-Jul 9:00 bad data 128 / 18 2 8
24-Jul 10:01 24-Jul 10:45 4833 / 1 1 10 0.7 7
24-Jul 1:40 24-Jul 2:45 6 / 50 2 30 1.1 33
24-Jul 7:00 24-Jul 9:00 42 / 145 1 200 2.0 400
24-Jul 7:00 24-Jul 10:45 42 / 462 1 15 3.8 56
24-Jul 7:00 24-Jul 11:30 42 / 588 2 2 4.5 9
24-Jul 18:04 24-Jul 20:00 42 / 464 1 50 1.9 97
27-Jul 14:15 27-Jul 14:50 HBT5 / 4 6 4 0.6 2
31-Jul 11:10 31-Jul 11:45 42 / 464 1 50 0.6 29
1-Aug 8:52 1-Aug 10:55 123 / 13 7 1 2.1 2
1-Aug 14:45 1-Aug 15:30 3344 / 1 1 75 0.8 56
2-Aug 1:17 2-Aug 3:15 121 / 77 1 8 2.0 16
2-Aug 17:31 2-Aug 18:45 4X62 / 9 4 1 1.2 1
2-Aug 22:34 3-Aug 0:30 644 / 9 11 12 1.9 23
3-Aug 17:45 3-Aug 19:15 40 / 25-2 1 2 1.5 3
4-Aug 11:00 4-Aug 12:25 4 / 438 4 1 1.4 1
5-Aug 23:47 6-Aug 0:50 49 / 34 1 9 1.0 9
5-Aug 23:30 6-Aug 1:50 42 / 588 1 3 2.3 7
7-Aug 10:06 7-Aug 11:06 4 / 303 1 10 1.0 10
7-Aug 22:48 8-Aug 0:06 64 / 154 11 10 1.3 13

10-Aug 11:00 10-Aug 11:30 466 / 15 2 1 0.5 0
10-Aug 14:15 10-Aug 15:00 64 / 40 2 4 0.8 3
10-Aug 15:00 10-Aug 15:26 673 / 1 2 14 0.4 6
10-Aug 16:12 10-Aug 17:12 64 / 68 2 1 1.0 1
10-Aug 16:31 10-Aug 18:10 64 / 172 4 1 1.6 2
10-Aug 21:55 10-Aug 23:36 48 / 24 2 40 1.7 67
12-Aug 6:24 12-Aug 12:09 64 / 68 4 1 5.7 6
12-Aug 7:16 12-Aug 7:35 3 / 51 7 12 0.3 4
12-Aug 8:37 12-Aug 9:52 3344 / 5 7 6 1.3 8
13-Aug 0:30 13-Aug 3:00 12 / 129 1 150 2.5 375
13-Aug 6:21 13-Aug 7:19 3 / 51 11 10 1.0 10
14-Aug 11:55 14-Aug 13:45 1232 / 8 1 1 1.8 2
14-Aug 11:55 14-Aug 14:00 123 / 14 1 15 2.1 31
14-Aug 18:30 14-Aug 19:15 4 / 48 11 40 0.8 30
17-Aug 18:30 17-Aug 19:25 41 / 3-2 11 2 0.9 2
20-Aug 6:20 20-Aug 8:00 128 / 59 7 10 1.7 17
21-Aug 16:15 21-Aug 17:42 42 / 274 1 10 1.5 15
23-Aug 1:30 23-Aug 7:00 4 / 157 4 200 5.5 1,100
24-Aug 13:00 24-Aug 14:05 42 / 1 3 30 1.1 33
27-Aug 9:00 27-Aug 11:55 483 / 11 11 3 2.9 9
27-Aug 12:15 27-Aug 12:45 42 / 1 6 200 0.5 100
28-Aug 9:00 28-Aug 10:50 351 / 1 1 20 1.8 37
29-Aug 9:35 29-Aug 10:30 73 / 72 11 50 0.9 46
29-Aug 12:34 29-Aug 12:45 3346 / 7 1 25 0.2 5
30-Aug 8:30 30-Aug 11:00 128 / 18-7-2 11 1 2.5 3
31-Aug 5:50 31-Aug 8:30 42 / 462 7 15 2.7 40
31-Aug 17:00 31-Aug 19:35 402 / 3 2 50 2.6 129
1-Sep 4:50 1-Sep 8:20 1 / 5 6 50 3.5 175
3-Sep 12:40 3-Sep 13:35 2 / 138 1 16 0.9 15
7-Sep 11:18 7-Sep 11:58 4 / 48 11 30 0.7 20
8-Sep 9:21 8-Sep 11:14 64 / 48 1 200 1.9 377
8-Sep 10:50 8-Sep 12:30 1215 / 1 1 6 1.7 10
8-Sep 11:10 8-Sep 14:20 424 / 14 1 6 3.2 19
8-Sep 11:45 8-Sep 13:15 3344 / 4 1 6 1.5 9
8-Sep 12:50 8-Sep 13:55 15 / X16 2 20 1.1 22
8-Sep 13:55 8-Sep 16:37 46 / 2 1 50 2.7 135
8-Sep 14:10 8-Sep 17:00 42 / 214 1 100 2.8 283
8-Sep 16:48 8-Sep 18:00 2 / 138 2 40 1.2 48
8-Sep 17:59 8-Sep 20:45 6 / 16 1 70 2.8 194
8-Sep 18:15 8-Sep 21:00 424 / 6 1 10 2.8 28
8-Sep 18:40 8-Sep 22:05 6 / 147 1 75 3.4 256
8-Sep 18:40 8-Sep 22:20 4 / 220 1 40 3.7 147
8-Sep 21:15 8-Sep 23:40 4202 / 3 1 2 2.4 5
9-Sep 9:19 9-Sep 11:20 424 / 55 1 1 2.0 2
10-Sep 12:30 10-Sep 13:25 4 / 277 1 8 0.9 7
10-Sep 15:55 10-Sep 18:37 427 / 16 1 2 2.7 5
12-Sep 9:00 12-Sep 11:10 42 / 214 3 100 2.2 217
18-Sep 6:15 18-Sep 8:45 429 / 6 1 4 2.5 10
18-Sep 10:50 18-Sep 12:50 42 / 572 1 15 2.0 30
18-Sep 11:45 18-Sep 14:00 67 / 48 1 30 2.3 68
18-Sep 13:00 18-Sep 13:45 28 / 21 2 12 0.8 9
18-Sep 19:15 18-Sep 20:45 6 / B 21 1 100 1.5 150
18-Sep 19:15 18-Sep 23:45 42 / 214 1 150 4.5 675
18-Sep 19:15 18-Sep 21:00 6 / 20 1 30 1.7 52
18-Sep 19:15 18-Sep 23:10 42 / 464 1 50 3.9 196
18-Sep 19:15 19-Sep 20:30 67 / 16 1 50 25.2 1,262
18-Sep 19:15 18-Sep 20:15 42 / 574 1 15 1.0 15
19-Sep 19:15 19-Sep 8:15 bad data 64 / 48 1 100
19-Sep 19:00 19-Sep 7:30 bad data 61 / 11 1 4
19-Sep 20:10 19-Sep 9:40 bad data 126 / 8 1 8
19-Sep 20:10 19-Sep 20:30 12 / 79 1 40 0.3 13
19-Sep 15:00 19-Sep 16:30 4X65 / 34 11 2 1.5 3
21-Sep 15:00 21-Sep 21:40 1212 / 35 1 5 6.7 33
22-Sep 14:17 22-Sep 15:10 67 / 28X 1 10 0.9 9
24-Sep 18:58 24-Sep 20:10 126 / 8 11 6 1.2 7
29-Sep 7:25 29-Sep 9:15 3 / 38 7 30 1.8 55
29-Sep 12:10 29-Sep 14:21 BMS / B1 1 40 2.2 87
30-Sep 12:12 30-Sep 14:00 4X65 / 34-1 1 2 1.8 4
30-Sep 17:05 30-Sep 18:00 484 / 1X 11 10 0.9 9
4-Oct 7:03 4-Oct 7:50 3 / 39 7 30 0.8 24
4-Oct 14:30 4-Oct 15:55 2 / 103 11 100 1.4 142
4-Oct 14:50 4-Oct 15:30 2 / 138 11 15 0.7 10
4-Oct 17:00 4-Oct 21:10 44 / 32 1 6 4.2 25
6-Oct 8:00 6-Oct 13:00 2 / 103 1 50 5.0 250
6-Oct 15:15 6-Oct 17:10 65 / 33 1 2 1.9 4
7-Oct 19:30 7-Oct 22:00 65 / 40 7 1 2.5 2
9-Oct 5:05 9-Oct 6:55 75 / 48 11 10 1.8 18
11-Oct 5:00 11-Oct 6:40 334 / 1 1 8 1.7 13
11-Oct 14:30 11-Oct 15:30 1288 / 26 11 1 1.0 1
11-Oct 14:30 11-Oct 15:50 128 / 9 1 20 1.3 27
12-Oct 12:30 12-Oct 13:45 4 / 303 1 20 1.2 25
12-Oct 18:06 12-Oct 19:05 4 / 258 1 10 1.0 10
13-Oct 11:30 13-Oct 14:10 429 / 6 1 4 2.7 11
14-Oct 13:30 14-Oct 14:50 1232 / 1 11 10 1.3 13
15-Oct 1:07 15-Oct 2:55 483 / 4 1 20 1.8 36
15-Oct 9:00 15-Oct 10:17 424 / 6 4 12 1.3 15
15-Oct 13:30 15-Oct 14:00 3344 / 7 11 10 0.5 5
16-Oct 8:00 16-Oct 11:20 3346 / 5 3 2 3.3 7
16-Oct 11:00 16-Oct 11:36 48 / 1 1 40 0.6 24
17-Oct 11:00 17-Oct 12:05 426 / 66 11 2 1.1 2
19-Oct 14:45 19-Oct 15:20 67 / 28X 1 10 0.6 6
19-Oct 17:24 19-Oct 18:52 X67 / 30 11 4 1.5 6
19-Oct 19:39 19-Oct 21:30 42 / 464 1 50 1.9 93
22-Oct 5:00 22-Oct 6:55 28 / 21 11 10 1.9 19

25-Oct 16:45 25-Oct 18:45 483 / 4 11 30 2.0 60
29-Oct 11:30 30-Oct 17:05 424 / 14 1 6 29.6 178
29-Oct 14:00 29-Oct 14:45 121 / 63 1 20 0.8 15
29-Oct 14:00 29-Oct 15:20 121 / 79 1 10 1.3 13
29-Oct 14:00 29-Oct 18:00 64 / 31-1 1 1 4.0 4
29-Oct 14:00 29-Oct 21:30 42 / 1 1 50 7.5 375
29-Oct 14:00 29-Oct 22:30 42 / 21 1 15 8.5 127
29-Oct 14:00 29-Oct 15:50 22 / 1 1 20 1.8 37
29-Oct 14:15 29-Oct 16:10 122 / 13 1 6 1.9 11
29-Oct 14:15 29-Oct 17:00 2 / 103 1 40 2.8 110
29-Oct 14:15 29-Oct 17:00 483 / 4 1 30 2.8 83
29-Oct 14:15 29-Oct 18:06 2 / 128 1 10 3.8 38
29-Oct 14:15 29-Oct 18:50 126 / 8 1 8 4.6 37
29-Oct 14:15 29-Oct 18:52 12 / 129 1 150 4.6 693
29-Oct 14:15 29-Oct 22:20 2 / 168 1 2 8.1 16
29-Oct 14:15 29-Oct 23:00 12 / 79 1 20 8.8 175
29-Oct 14:15 29-Oct 17:30 128 / 46 1 20 3.2 65
29-Oct 14:30 29-Oct 22:00 4X65 / 19 1 50 7.5 375
29-Oct 15:30 29-Oct 16:00 2 / 59 2 100 0.5 50
29-Oct 15:30 29-Oct 18:40 4 / 18-4 1 2 3.2 6
29-Oct 15:38 31-Oct 12:30 7 / 106 1 6 44.9 269
29-Oct 15:40 29-Oct 20:25 4 / 1 1 80 4.7 380
29-Oct 15:40 29-Oct 16:52 4 / 453 1 1 1.2 1
29-Oct 16:00 29-Oct 20:52 4 / 18 1 18 4.9 88
29-Oct 16:45 29-Oct 18:57 126 / 18 2 11 2.2 24
29-Oct 17:30 29-Oct 8:48 bad data 4 / 18-4 1 80
29-Oct 17:30 29-Oct 10:55 bad data 402 / 3 1 60
29-Oct 17:30 30-Oct 12:20 40 / 32 1 10 18.8 188
29-Oct 17:30 29-Oct 18:20 4 / 226 1 10 0.8 8
29-Oct 17:30 30-Oct 16:00 4062 / 12-1 1 1 22.5 23
29-Oct 17:30 29-Oct 17:50 4061 / 14-7 1 10 0.3 3
29-Oct 18:20 30-Oct 4:46 6 / 56 1 15 10.4 156
29-Oct 18:30 29-Oct 23:40 64 / X1 1 20 5.2 103
29-Oct 20:45 29-Oct 22:00 7 / 72 1 50 1.2 62
29-Oct 20:45 29-Oct 23:28 6 / 75 1 20 2.7 54
29-Oct 22:20 30-Oct 0:40 12121 / 1 1 15 2.3 35
29-Oct 22:20 30-Oct 1:04 1212 / 2 1 30 2.7 82
29-Oct 23:00 30-Oct 2:30 6 / 57 1 150 3.5 525
29-Oct 23:00 30-Oct 3:30 609 / 6 1 30 4.5 135
29-Oct 23:00 30-Oct 3:40 6 / 109 2 75 4.7 350
29-Oct 23:00 30-Oct 17:34 6 / 147 1 15 18.6 278
29-Oct 23:30 30-Oct 2:30 42 / 214 1 100 3.0 300
29-Oct 23:30 30-Oct 4:35 427 / 14 1 10 5.1 51
29-Oct 23:30 30-Oct 4:45 427 / 14-10-1 1 2 5.3 11
30-Oct 12:05 30-Oct 14:45 407 / 1 1 10 2.7 27
30-Oct 13:15 30-Oct 15:20 427 / 16 1 2 2.1 4
30-Oct 17:15 30-Oct 22:15 122 / 7 1 6 5.0 30

30-Oct 21:30 30-Oct 23:05 68 / 10 4 1 1.6 2
30-Oct 22:10 31-Oct 0:40 121 / 77 1 8 2.5 20
30-Oct 23:30 #VALUE! #VALUE! bad data 420 / 21 1 20
30-Oct 23:30 31-Oct 2:29 42 / 462 1 15 3.0 45
31-Oct 4:30 31-Oct 6:15 645 / 4 1 10 1.7 17
31-Oct 8:30 31-Oct 12:35 4X602 / 16 1 11 4.1 45
31-Oct 9:00 31-Oct 10:00 424 / 18 1 2 1.0 2
31-Oct 17:07 31-Oct 19:40 42 / 474 1 1 2.6 3
1-Nov 10:15 1-Nov 10:31 12 / 269 3 6 0.3 2
1-Nov 13:00 1-Nov 14:45 4061 / 5 3 75 1.8 131
2-Nov 9:00 2-Nov 9:50 424 / 67 4 30 0.8 25
2-Nov 21:36 2-Nov 22:51 42 / 287 7 1 1.2 1
3-Nov 8:00 3-Nov 9:36 6 / 108 11 75 1.6 120
3-Nov 8:07 3-Nov 10:10 609 / 6 11 30 2.1 62
3-Nov 18:51 3-Nov 20:30 1212 / 2 6 30 1.6 49
10-Nov 6:10 10-Nov 7:55 22 / 1 11 20 1.7 35
12-Nov 7:15 12-Nov 8:30 75 / 39 7 1 1.2 1
12-Nov 21:15 12-Nov 23:30 6 / 57 1 25 2.3 56
12-Nov 22:00 13-Nov 1:50 424 / 57 1 3 3.8 12
12-Nov 23:00 13-Nov 9:30 4062 / 1 1 15 10.5 158
13-Nov 3:00 13-Nov 5:00 42 / 274 1 6 2.0 12
13-Nov 5:10 13-Nov 6:30 6 / 107 1 13 1.3 17
24-Nov 8:18 24-Nov 9:21 2 / 138 11 15 1.0 16
27-Nov 15:40 27-Nov 16:20 1288 / 17 7 2 0.7 1
27-Nov 15:40 27-Nov 16:30 128 / 9 7 20 0.8 17
28-Nov 11:00 28-Nov 12:04 609 / 26 1 3 1.1 3
28-Nov 11:00 28-Nov 12:07 609 / 28 1 1 1.1 1
2-Dec 11:46 2-Dec 13:00 1213 / 2 11 15 1.2 19
5-Dec 5:07 5-Dec 7:15 42 / 464 1 50 2.1 107
5-Dec 13:30 5-Dec 14:15 427 / 14 11 10 0.8 8
6-Dec 11:00 6-Dec 11:35 28 / 21 11 4 0.6 2
9-Dec 11:00 9-Dec 15:00 6052 / 3-5-2 4 5 4.0 20
17-Dec 13:15 17-Dec 14:15 22 / 1 11 20 1.0 20
19-Dec 8:13 19-Dec 9:15 420 / 29 1 7 1.0 7
21-Dec 7:45 21-Dec 8:40 73 / 73 1 2 0.9 2
21-Dec 11:00 21-Dec 11:28 IPSUB / B24 1 50 0.5 23
21-Dec 11:30 21-Dec 12:50 42 / 214 1 20 1.3 27
21-Dec 13:30 21-Dec 15:00 121 / 75 1 20 1.5 30
21-Dec 13:50 21-Dec 19:20 X67 / 52 1 80 5.5 440
21-Dec 13:50 21-Dec 21:00 673 / 1 1 12 7.2 86
21-Dec 13:50 21-Dec 22:00 64 / 48 1 100 8.2 817
21-Dec 13:50 21-Dec 22:30 64 / 80 1 1 8.7 9
21-Dec 13:50 21-Dec 23:10 6091 / 10 1 3 9.3 28
21-Dec 13:50 21-Dec 23:10 609 / 17X 1 10 9.3 93
21-Dec 14:20 21-Dec 17:00 6 / 147 1 40 2.7 107
21-Dec 14:20 21-Dec 18:00 6 / 200 1 3 3.7 11
21-Dec 18:20 21-Dec 18:40 42 / B24 1 50 0.3 17

21-Dec 14:30 21-Dec 22:10 4X62 / 44 1 12 7.7 92
21-Dec 15:20 21-Dec 20:45 4 / 80 1 60 5.4 325
21-Dec 15:20 21-Dec 22:42 46 / 19 1 4 7.4 29
21-Dec 15:20 21-Dec 23:11 46 / 28 1 8 7.8 63
21-Dec 15:20 21-Dec 23:15 4833 / 1 1 8 7.9 63
21-Dec 15:20 21-Dec 23:55 48 / 24 1 30 8.6 258
21-Dec 15:40 21-Dec 18:45 426 / 65 1 3 3.1 9
22-Dec 5:50 22-Dec 10:30 4 / 57 1 2 4.7 9
22-Dec 9:25 22-Dec 11:40 291 / 3 1 1 2.3 2
22-Dec 9:25 22-Dec 12:15 29 / 25 11 6 2.8 17
22-Dec 10:56 22-Dec 13:00 7 / 8 1 50 2.1 103
22-Dec 12:22 22-Dec 12:53 72 / 19 1 10 0.5 5
23-Dec 1:56 23-Dec 5:00 4200 / 18 1 1 3.1 3
24-Dec 13:30 24-Dec 15:15 609 / 7 1 2 1.7 3
26-Dec 9:55 26-Dec 11:25 4 / 48 7 40 1.5 60
26-Dec 10:15 26-Dec 10:50 1 / 22 1 2 0.6 1
26-Dec 10:30 26-Dec 11:10 67 / 16 1 50 0.7 33
26-Dec 12:15 26-Dec 14:50 46 / 19 1 10 2.6 26
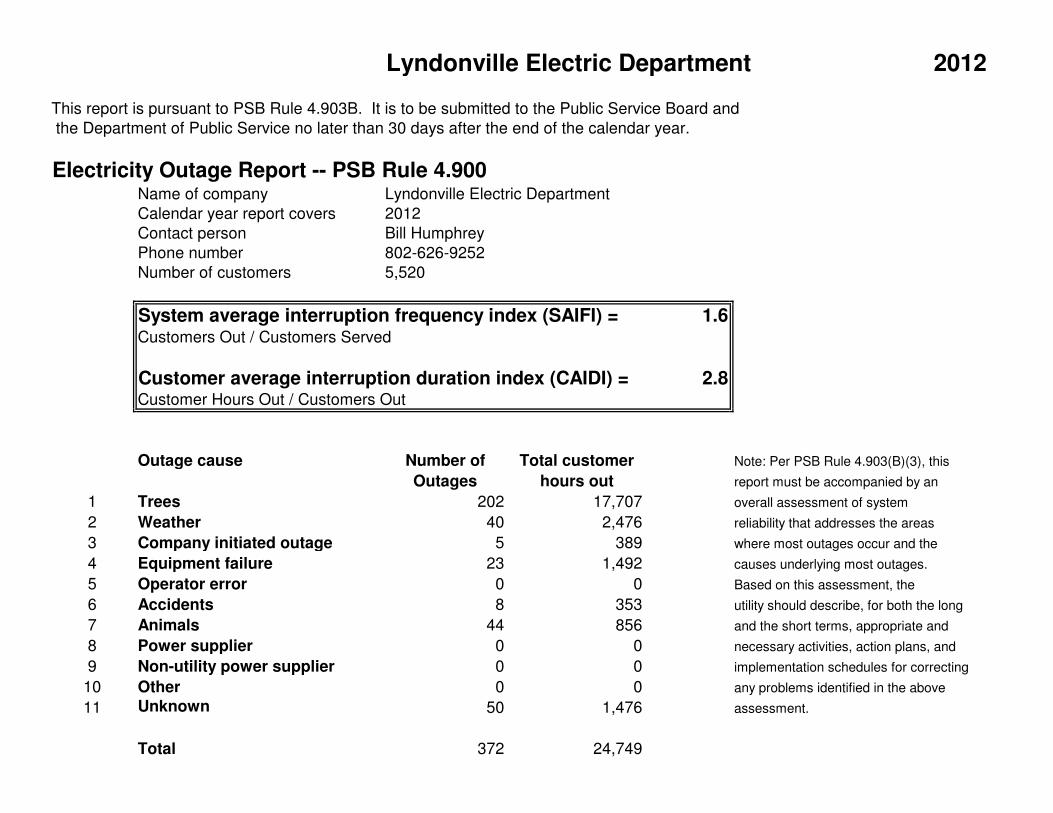
Lyndonville Electric Department 2012
This report is pursuant to PSB Rule 4.903B. It is to be submitted to the Public Service Board and
the Department of Public Service no later than 30 days after the end of the calendar year.
Electricity Outage Report -- PSB Rule 4.900Name of company Lyndonville Electric Department
Calendar year report covers 2012
Contact person Bill Humphrey
Phone number 802-626-9252
Number of customers 5,520
System average interruption frequency index (SAIFI) = 1.6Customers Out / Customers Served
Customer average interruption duration index (CAIDI) = 2.8Customer Hours Out / Customers Out
Outage cause Number of Total customer Note: Per PSB Rule 4.903(B)(3), this
Outages hours out report must be accompanied by an
1 Trees 202 17,707 overall assessment of system
2 Weather 40 2,476 reliability that addresses the areas
3 Company initiated outage 5 389 where most outages occur and the
4 Equipment failure 23 1,492 causes underlying most outages.
5 Operator error 0 0 Based on this assessment, the
6 Accidents 8 353 utility should describe, for both the long
7 Animals 44 856 and the short terms, appropriate and
8 Power supplier 0 0 necessary activities, action plans, and
9 Non-utility power supplier 0 0 implementation schedules for correcting
10 Other 0 0 any problems identified in the above
11 Unknown 50 1,476 assessment.
Total 372 24,749

VILLAGE OF LYNDONVILLE
ELECTRIC DEPARTMENT
Superintendent’s Office
46 Grove Street, PO Box 167 Lyndonville, Vermont 05851
Telephone (802) 626-9252
Facsimile (802) 626-9253
PSB RULE 4.093(B) (3) OVERALL ASSESSMENT OF SYSTEM RELIABILTIY FOR 2013 It has held true again this year as it has in all past years, trees were again the leading cause of outages on our system. With over half our four hundred miles of lines located in the right-of-way coupled with three major storms this years to roll through our service territory, our tree outages exceeded all other years. The silver lining to this grey cloud is that our customer interruption duration is down from last year; which I believe is attributable, in part, to our vegetation management efforts. In years past we jointly trimmed aerial and grade level. This year we are aerial trimming during the winter months based on the logic that more production will be achieved due to lack of foliage. We have a contractor to perform the bulk of the work with assistance from LED crews as scheduling permits. Bill Humphrey Superintendent of Operations Village of Lyndonville Electric Department

Lyndonville Electric DepartmentRecord of Outages -- PSB Rule 4.900 Codes for type of outage:
Company Lyndonville Electric Department 1 Trees 6 Accidents
Calendar year 2013 2 Weather 7 Animals
Contact person Bill Humphrey 3 Company initiated outage 8 Power supplier
Phone number 802-626-9252 4 Equipment failure 9 Non-utility power supplier
Customers served 5,520 5 Operator error 10 Other
11 UnknownExamples:
10-Jan 14:10 11-Jan 13:30 3G2 2 50 23.3 1,166.7
10-Jan 12:30 09-Jan 2:00 bad data 3G2 2 50
If indicated, System (if system outage) Calculated columns
Outage Start Outage end Illegal date or time Substation ID (if substation outage) Outage Customers Outage CustomerDay-month Hour:minute Day-month e Please reenter data Circuit ID (if circuit outage) Code Out Duration Hours Out
1-Jan 5:45 1-Jan 6:21 67 / 16 1 50 0.6 30
1-Jan 6:40 1-Jan 7:28 3346 / 7 1 5 0.8 4
7-Jan 15:50 7-Jan 16:30 4 / 18 1 5 0.7 3
10-Jan 3:44 10-Jan 4:44 3346 / 7 11 15 1.0 15
10-Jan 6:43 10-Jan 6:55 3346 / 7 1 5 0.2 1
10-Jan 6:43 10-Jan 6:55 29 / 21 1 10 0.2 2
11-Jan 20:00 11-Jan 20:42 4 / 177-6-1 1 1 0.7 1
12-Jan 10:30 12-Jan 11:30 605 / 44 11 1 1.0 1
13-Jan 7:00 13-Jan 9:48 605 / 36 4 1 2.8 3
20-Jan 12:30 20-Jan 12:54 64 / X1 1 100 0.4 40
20-Jan 13:20 20-Jan 13:38 4201 / 23 1 5 0.3 2
20-Jan 16:22 20-Jan 17:02 128 / 59 1 10 0.7 7
20-Jan 16:22 20-Jan 17:02 1286 / 7-1 1 1 0.7 1
20-Jan 17:00 20-Jan 17:06 4X6 / 39 1 50 0.1 5
21-Jan 9:10 21-Jan 9:46 4 / 232 1 2 0.6 1
25-Jan 11:30 25-Jan 12:40 609 / 1 1 2 1.2 2
31-Jan 8:15 31-Jan 8:39 424 / 6 1 10 0.4 4
31-Jan 8:28 31-Jan 9:08 402 / 70 1 10 0.7 7
31-Jan 10:00 31-Jan 10:12 4061 / 14-8 1 1 0.2 0
31-Jan 12:01 31-Jan 12:55 4206 / 5 1 2 0.9 2
31-Jan 12:10 31-Jan 12:34 4061 / 14-7 1 6 0.4 2
31-Jan 12:18 31-Jan 14:18 42 / 462 1 10 2.0 20
31-Jan 12:18 31-Jan 14:24 427 / 16 1 2 2.1 4
31-Jan 12:30 31-Jan 13:54 40 / 32 1 10 1.4 14
31-Jan 12:45 31-Jan 13:35 4200 / 18 1 1 0.8 1
31-Jan 14:00 31-Jan 14:36 64 / 48 1 50 0.6 30
31-Jan 15:00 31-Jan 22:15 22 / 31 1 2 7.3 15
31-Jan 15:00 31-Jan 23:00 4 / 232 1 2 8.0 16
31-Jan 16:45 31-Jan 18:10 4 / 107 1 15 1.4 21
31-Jan 17:00 31-Jan 18:42 6 / 147 1 20 1.7 34
31-Jan 17:20 31-Jan 18:02 6 / 20 1 200 0.7 140
31-Jan 17:30 31-Jan 19:00 641 / 11-1 1 6 1.5 9

31-Jan 18:15 31-Jan 18:57 4 / 1 1 700 0.7 490
31-Jan 20:35 1-Feb 0:35 129 / 5 1 6 4.0 24
31-Jan 20:35 1-Feb 1:35 429 / 6 1 4 5.0 20
31-Jan 21:07 1-Feb 1:07 75 / 48 1 10 4.0 40
31-Jan 21:15 1-Feb 2:15 42 / 572 1 5 5.0 25
31-Jan 22:00 31-Jan 23:42 4 / 80 1 400 1.7 680
1-Feb 6:00 1-Feb 6:54 6 / 147 1 40 0.9 36
3-Feb 11:04 3-Feb 12:16 6 / 147 1 40 1.2 48
9-Feb 12:01 9-Feb 12:30 31 / 3 4 1 0.5 0
9-Feb 22:00 9-Feb 22:24 41 / 2 11 10 0.4 4
10-Feb 16:45 10-Feb 17:15 4X6 / X27 4 40 0.5 20
10-Feb 16:45 10-Feb 17:57 4X60 / 1 4 1 1.2 1
14-Feb 13:00 14-Feb 13:30 426 / 67 3 5 0.5 3
15-Feb 13:43 15-Feb 13:48 42 / 96 4 10 0.1 1
21-Feb 13:00 21-Feb 13:36 1213 / 3 4 1 0.6 1
22-Feb 9:45 22-Feb 9:51 121 / 20 1 30 0.1 3
24-Feb 8:05 24-Feb 8:47 12 / 18 1 100 0.7 70
28-Feb 7:15 28-Feb 7:45 HBT 51 / 57 7 5 0.5 2
28-Feb 7:15 28-Feb 7:45 HBT 51 / 1-2 7 6 0.5 3
6-Mar 6:57 6-Mar 7:23 4 / 277 7 5 0.4 2
8-Mar 13:00 8-Mar 13:36 120 / 8 7 3 0.6 2
11-Mar 9:22 11-Mar 9:40 4061 / 63 1 10 0.3 3
12-Mar 16:15 12-Mar 16:51 75 / 53 11 10 0.6 6
13-Mar 10:00 13-Mar 10:42 75 / 53 3 2 0.7 1
20-Mar 8:00 20-Mar 8:30 132 / 23X 1 1 0.5 0
23-Mar 10:45 23-Mar 11:21 1212 / 2 1 20 0.6 12
24-Mar 6:35 24-Mar 6:55 IPSub / B24 7 400 0.3 133
26-Mar 7:27 26-Mar 7:50 128 / 30 7 6 0.4 2
27-Mar 7:30 27-Mar 8:00 64 / 161 7 5 0.5 3
31-Mar 21:53 31-Mar 22:17 12121 / 1 1 2 0.4 1
1-Apr 15:15 1-Apr 15:40 13 / 21 11 1 0.4 0
3-Apr 15:00 3-Apr 15:30 42 / 572 1 10 0.5 5
3-Apr 15:00 3-Apr 16:18 1 / 34C 1 1 1.3 1
9-Apr 5:35 9-Apr 5:53 4 / 1 1 200 0.3 60
9-Apr 5:51 9-Apr 6:15 4 / 80 1 200 0.4 80
9-Apr 11:30 9-Apr 12:24 4061 / 5 1 25 0.9 23
10-Apr 21:45 10-Apr 22:27 402 / 3 11 40 0.7 28
13-Apr 8:01 13-Apr 8:20 HBT / 57 1 5 0.3 2
19-Apr 0:15 19-Apr 0:39 B8 / #2Sub 6 300 0.4 120
19-Apr 11:12 19-Apr 11:42 4 / 48 1 15 0.5 8
19-Apr 12:15 19-Apr 12:36 12 / 1 7 25 0.4 9
19-Apr 15:00 19-Apr 15:18 64 / 48 1 60 0.3 18
19-Apr 23:31 20-Apr 1:00 42 / 1 1 600 1.5 890
20-Apr 0:01 20-Apr 0:48 128 / 9 1 10 0.8 8
20-Apr 7:45 20-Apr 8:27 42 / 48 4 1 0.7 1
20-Apr 14:30 20-Apr 14:48 6 / 2 1 3 0.3 1
21-Apr 9:02 21-Apr 10:30 406 / 13 3 5 1.5 7
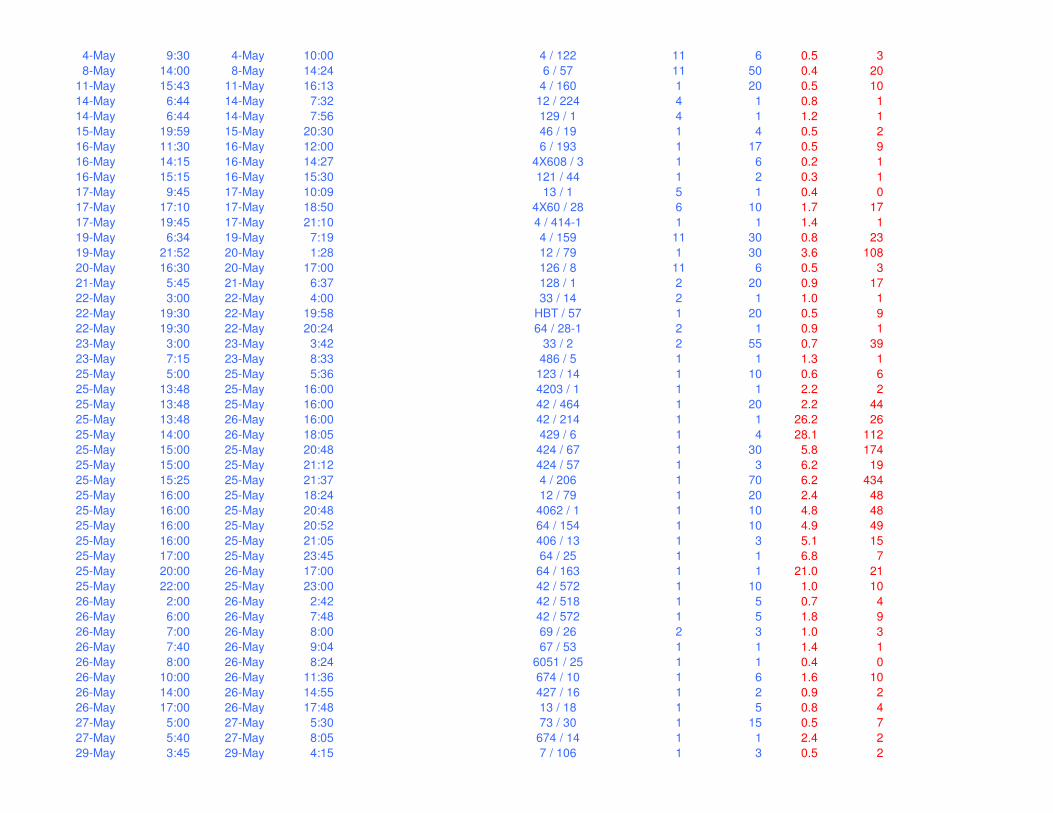
4-May 9:30 4-May 10:00 4 / 122 11 6 0.5 3
8-May 14:00 8-May 14:24 6 / 57 11 50 0.4 20
11-May 15:43 11-May 16:13 4 / 160 1 20 0.5 10
14-May 6:44 14-May 7:32 12 / 224 4 1 0.8 1
14-May 6:44 14-May 7:56 129 / 1 4 1 1.2 1
15-May 19:59 15-May 20:30 46 / 19 1 4 0.5 2
16-May 11:30 16-May 12:00 6 / 193 1 17 0.5 9
16-May 14:15 16-May 14:27 4X608 / 3 1 6 0.2 1
16-May 15:15 16-May 15:30 121 / 44 1 2 0.3 1
17-May 9:45 17-May 10:09 13 / 1 5 1 0.4 0
17-May 17:10 17-May 18:50 4X60 / 28 6 10 1.7 17
17-May 19:45 17-May 21:10 4 / 414-1 1 1 1.4 1
19-May 6:34 19-May 7:19 4 / 159 11 30 0.8 23
19-May 21:52 20-May 1:28 12 / 79 1 30 3.6 108
20-May 16:30 20-May 17:00 126 / 8 11 6 0.5 3
21-May 5:45 21-May 6:37 128 / 1 2 20 0.9 17
22-May 3:00 22-May 4:00 33 / 14 2 1 1.0 1
22-May 19:30 22-May 19:58 HBT / 57 1 20 0.5 9
22-May 19:30 22-May 20:24 64 / 28-1 2 1 0.9 1
23-May 3:00 23-May 3:42 33 / 2 2 55 0.7 39
23-May 7:15 23-May 8:33 486 / 5 1 1 1.3 1
25-May 5:00 25-May 5:36 123 / 14 1 10 0.6 6
25-May 13:48 25-May 16:00 4203 / 1 1 1 2.2 2
25-May 13:48 25-May 16:00 42 / 464 1 20 2.2 44
25-May 13:48 26-May 16:00 42 / 214 1 1 26.2 26
25-May 14:00 26-May 18:05 429 / 6 1 4 28.1 112
25-May 15:00 25-May 20:48 424 / 67 1 30 5.8 174
25-May 15:00 25-May 21:12 424 / 57 1 3 6.2 19
25-May 15:25 25-May 21:37 4 / 206 1 70 6.2 434
25-May 16:00 25-May 18:24 12 / 79 1 20 2.4 48
25-May 16:00 25-May 20:48 4062 / 1 1 10 4.8 48
25-May 16:00 25-May 20:52 64 / 154 1 10 4.9 49
25-May 16:00 25-May 21:05 406 / 13 1 3 5.1 15
25-May 17:00 25-May 23:45 64 / 25 1 1 6.8 7
25-May 20:00 26-May 17:00 64 / 163 1 1 21.0 21
25-May 22:00 25-May 23:00 42 / 572 1 10 1.0 10
26-May 2:00 26-May 2:42 42 / 518 1 5 0.7 4
26-May 6:00 26-May 7:48 42 / 572 1 5 1.8 9
26-May 7:00 26-May 8:00 69 / 26 2 3 1.0 3
26-May 7:40 26-May 9:04 67 / 53 1 1 1.4 1
26-May 8:00 26-May 8:24 6051 / 25 1 1 0.4 0
26-May 10:00 26-May 11:36 674 / 10 1 6 1.6 10
26-May 14:00 26-May 14:55 427 / 16 1 2 0.9 2
26-May 17:00 26-May 17:48 13 / 18 1 5 0.8 4
27-May 5:00 27-May 5:30 73 / 30 1 15 0.5 7
27-May 5:40 27-May 8:05 674 / 14 1 1 2.4 2
29-May 3:45 29-May 4:15 7 / 106 1 3 0.5 2

29-May 7:25 29-May 7:55 6051 / 30 1 10 0.5 5
29-May 17:31 29-May 18:25 7 / 8 1 50 0.9 45
30-May 0:45 30-May 5:15 424 / 14 1 30 4.5 135
31-May 10:10 31-May 10:46 4 / 220 11 20 0.6 12
1-Jun 13:30 1-Jun 14:18 4 / 160 6 40 0.8 32
1-Jun 15:45 1-Jun 16:03 402 / 3 1 40 0.3 12
1-Jun 17:15 1-Jun 17:45 123 / 14 1 10 0.5 5
2-Jun 3:00 2-Jun 14:00 334 / 1 1 40 11.0 440
2-Jun 13:30 3-Jun 4:30 12 / 6-4 1 1 15.0 15
2-Jun 13:30 4-Jun 8:38 12 / 6 1 8 43.1 345
2-Jun 14:30 3-Jun 6:30 4X6 / 39 1 70 16.0 1,120
2-Jun 15:00 2-Jun 15:05 4X60 / 1 1 2 0.1 0
2-Jun 15:00 2-Jun 15:48 4191 / 9 2 40 0.8 32
2-Jun 15:00 2-Jun 16:30 11 / 1 1 10 1.5 15
2-Jun 15:00 2-Jun 16:55 HBT / 1 20 1.9 38
2-Jun 15:00 2-Jun 17:10 6 / 16 1 10 2.2 22
2-Jun 15:00 2-Jun 17:30 4X65 / 2 1 100 2.5 250
2-Jun 15:00 2-Jun 17:55 4X60 / 22 1 1 2.9 3
2-Jun 15:00 2-Jun 19:25 7 / 72 2 40 4.4 177
2-Jun 15:00 2-Jun 21:05 7 / 102 2 3 6.1 18
2-Jun 15:00 2-Jun 21:15 75 / 1 1 60 6.2 375
2-Jun 15:00 2-Jun 21:35 4X60 / 21 1 30 6.6 197
2-Jun 15:00 2-Jun 21:42 75 / 48 1 10 6.7 67
2-Jun 15:00 2-Jun 22:05 3344 / 7 1 10 7.1 71
2-Jun 15:00 2-Jun 22:18 334 / 9 1 6 7.3 44
2-Jun 15:00 2-Jun 23:00 123 / 1 1 30 8.0 240
2-Jun 15:00 2-Jun 23:05 1212 / 2 1 30 8.1 242
2-Jun 15:00 2-Jun 23:35 4X60 / 5 1 5 8.6 43
2-Jun 15:00 2-Jun 23:45 12 / 79 1 10 8.8 88
2-Jun 15:00 2-Jun 23:45 48 / 24 2 20 8.8 175
2-Jun 15:00 3-Jun 1:00 4833 / 1 2 10 10.0 100
2-Jun 15:00 3-Jun 1:10 1221 / 1 1 6 10.2 61
2-Jun 15:00 3-Jun 1:25 483 / 23 2 2 10.4 21
2-Jun 15:00 3-Jun 1:36 64 / 126 2 5 10.6 53
2-Jun 15:00 3-Jun 2:25 605 / 24 1 15 11.4 171
2-Jun 15:00 3-Jun 5:30 645 / 4 1 10 14.5 145
2-Jun 15:00 3-Jun 6:05 121 / 20 1 20 15.1 302
2-Jun 15:00 3-Jun 6:25 1212 / 25 1 15 15.4 231
2-Jun 15:00 3-Jun 7:36 4X65 / 16 1 4 16.6 66
2-Jun 15:00 3-Jun 8:00 4 / 34 1 5 17.0 85
2-Jun 15:00 3-Jun 8:48 73 / 18 1 1 17.8 18
2-Jun 15:00 3-Jun 9:25 12 / 156 1 1 18.4 18
2-Jun 15:00 3-Jun 11:00 15 / X16 1 10 20.0 200
2-Jun 15:00 3-Jun 13:50 73 / 20 1 1 22.8 23
2-Jun 16:50 2-Jun 17:32 3 / 1 4 50 0.7 35
2-Jun 23:58 3-Jun 0:06 2 / 161 2 1 0.1 0
2-Jun 23:58 3-Jun 0:30 2 / 168 2 2 0.5 1
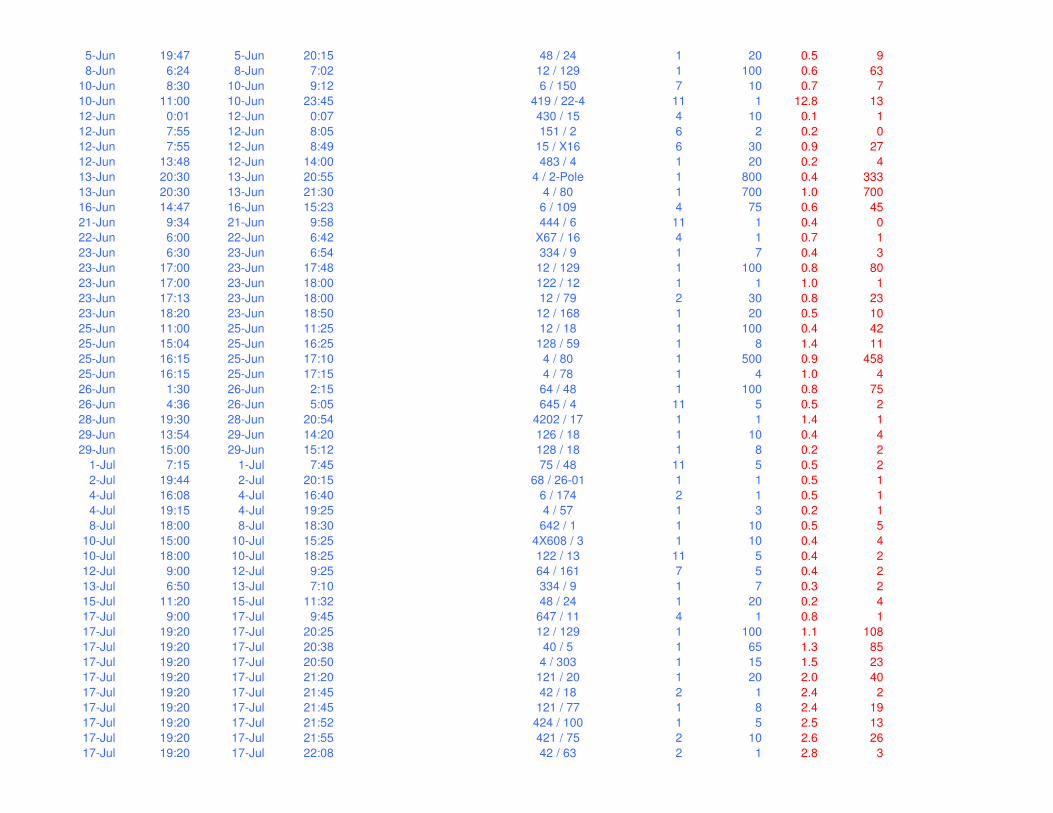
5-Jun 19:47 5-Jun 20:15 48 / 24 1 20 0.5 9
8-Jun 6:24 8-Jun 7:02 12 / 129 1 100 0.6 63
10-Jun 8:30 10-Jun 9:12 6 / 150 7 10 0.7 7
10-Jun 11:00 10-Jun 23:45 419 / 22-4 11 1 12.8 13
12-Jun 0:01 12-Jun 0:07 430 / 15 4 10 0.1 1
12-Jun 7:55 12-Jun 8:05 151 / 2 6 2 0.2 0
12-Jun 7:55 12-Jun 8:49 15 / X16 6 30 0.9 27
12-Jun 13:48 12-Jun 14:00 483 / 4 1 20 0.2 4
13-Jun 20:30 13-Jun 20:55 4 / 2-Pole 1 800 0.4 333
13-Jun 20:30 13-Jun 21:30 4 / 80 1 700 1.0 700
16-Jun 14:47 16-Jun 15:23 6 / 109 4 75 0.6 45
21-Jun 9:34 21-Jun 9:58 444 / 6 11 1 0.4 0
22-Jun 6:00 22-Jun 6:42 X67 / 16 4 1 0.7 1
23-Jun 6:30 23-Jun 6:54 334 / 9 1 7 0.4 3
23-Jun 17:00 23-Jun 17:48 12 / 129 1 100 0.8 80
23-Jun 17:00 23-Jun 18:00 122 / 12 1 1 1.0 1
23-Jun 17:13 23-Jun 18:00 12 / 79 2 30 0.8 23
23-Jun 18:20 23-Jun 18:50 12 / 168 1 20 0.5 10
25-Jun 11:00 25-Jun 11:25 12 / 18 1 100 0.4 42
25-Jun 15:04 25-Jun 16:25 128 / 59 1 8 1.4 11
25-Jun 16:15 25-Jun 17:10 4 / 80 1 500 0.9 458
25-Jun 16:15 25-Jun 17:15 4 / 78 1 4 1.0 4
26-Jun 1:30 26-Jun 2:15 64 / 48 1 100 0.8 75
26-Jun 4:36 26-Jun 5:05 645 / 4 11 5 0.5 2
28-Jun 19:30 28-Jun 20:54 4202 / 17 1 1 1.4 1
29-Jun 13:54 29-Jun 14:20 126 / 18 1 10 0.4 4
29-Jun 15:00 29-Jun 15:12 128 / 18 1 8 0.2 2
1-Jul 7:15 1-Jul 7:45 75 / 48 11 5 0.5 2
2-Jul 19:44 2-Jul 20:15 68 / 26-01 1 1 0.5 1
4-Jul 16:08 4-Jul 16:40 6 / 174 2 1 0.5 1
4-Jul 19:15 4-Jul 19:25 4 / 57 1 3 0.2 1
8-Jul 18:00 8-Jul 18:30 642 / 1 1 10 0.5 5
10-Jul 15:00 10-Jul 15:25 4X608 / 3 1 10 0.4 4
10-Jul 18:00 10-Jul 18:25 122 / 13 11 5 0.4 2
12-Jul 9:00 12-Jul 9:25 64 / 161 7 5 0.4 2
13-Jul 6:50 13-Jul 7:10 334 / 9 1 7 0.3 2
15-Jul 11:20 15-Jul 11:32 48 / 24 1 20 0.2 4
17-Jul 9:00 17-Jul 9:45 647 / 11 4 1 0.8 1
17-Jul 19:20 17-Jul 20:25 12 / 129 1 100 1.1 108
17-Jul 19:20 17-Jul 20:38 40 / 5 1 65 1.3 85
17-Jul 19:20 17-Jul 20:50 4 / 303 1 15 1.5 23
17-Jul 19:20 17-Jul 21:20 121 / 20 1 20 2.0 40
17-Jul 19:20 17-Jul 21:45 42 / 18 2 1 2.4 2
17-Jul 19:20 17-Jul 21:45 121 / 77 1 8 2.4 19
17-Jul 19:20 17-Jul 21:52 424 / 100 1 5 2.5 13
17-Jul 19:20 17-Jul 21:55 421 / 75 2 10 2.6 26
17-Jul 19:20 17-Jul 22:08 42 / 63 2 1 2.8 3
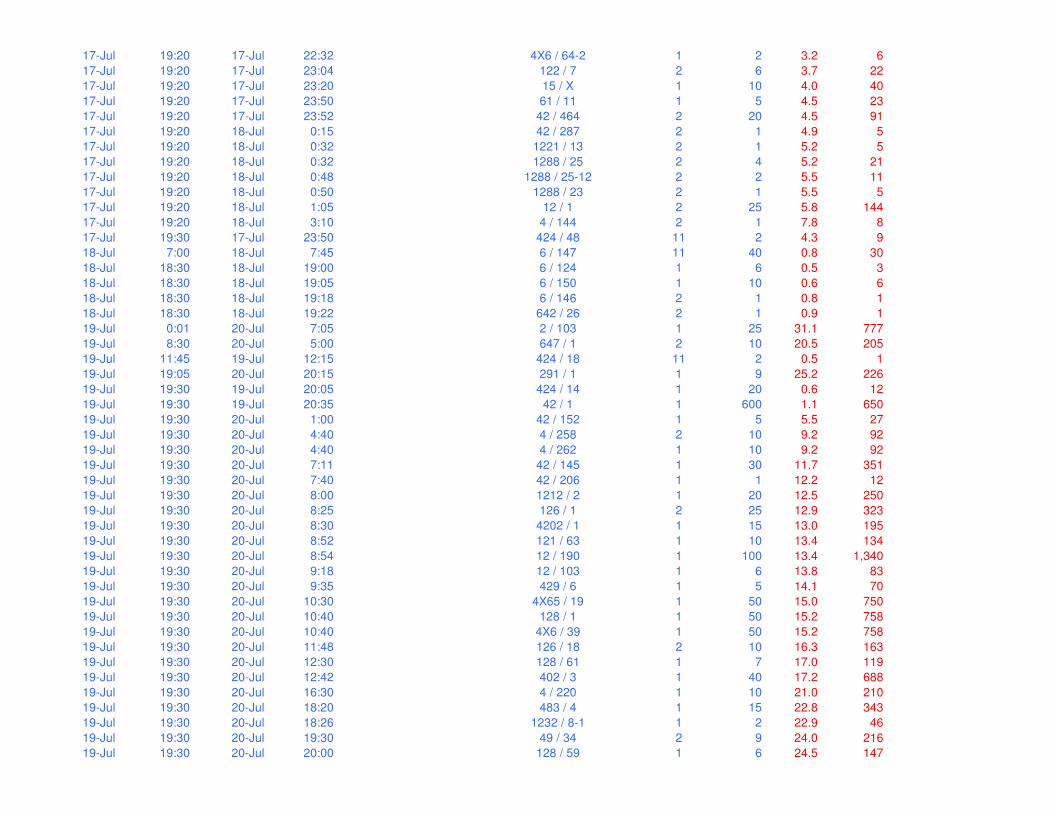
17-Jul 19:20 17-Jul 22:32 4X6 / 64-2 1 2 3.2 6
17-Jul 19:20 17-Jul 23:04 122 / 7 2 6 3.7 22
17-Jul 19:20 17-Jul 23:20 15 / X 1 10 4.0 40
17-Jul 19:20 17-Jul 23:50 61 / 11 1 5 4.5 23
17-Jul 19:20 17-Jul 23:52 42 / 464 2 20 4.5 91
17-Jul 19:20 18-Jul 0:15 42 / 287 2 1 4.9 5
17-Jul 19:20 18-Jul 0:32 1221 / 13 2 1 5.2 5
17-Jul 19:20 18-Jul 0:32 1288 / 25 2 4 5.2 21
17-Jul 19:20 18-Jul 0:48 1288 / 25-12 2 2 5.5 11
17-Jul 19:20 18-Jul 0:50 1288 / 23 2 1 5.5 5
17-Jul 19:20 18-Jul 1:05 12 / 1 2 25 5.8 144
17-Jul 19:20 18-Jul 3:10 4 / 144 2 1 7.8 8
17-Jul 19:30 17-Jul 23:50 424 / 48 11 2 4.3 9
18-Jul 7:00 18-Jul 7:45 6 / 147 11 40 0.8 30
18-Jul 18:30 18-Jul 19:00 6 / 124 1 6 0.5 3
18-Jul 18:30 18-Jul 19:05 6 / 150 1 10 0.6 6
18-Jul 18:30 18-Jul 19:18 6 / 146 2 1 0.8 1
18-Jul 18:30 18-Jul 19:22 642 / 26 2 1 0.9 1
19-Jul 0:01 20-Jul 7:05 2 / 103 1 25 31.1 777
19-Jul 8:30 20-Jul 5:00 647 / 1 2 10 20.5 205
19-Jul 11:45 19-Jul 12:15 424 / 18 11 2 0.5 1
19-Jul 19:05 20-Jul 20:15 291 / 1 1 9 25.2 226
19-Jul 19:30 19-Jul 20:05 424 / 14 1 20 0.6 12
19-Jul 19:30 19-Jul 20:35 42 / 1 1 600 1.1 650
19-Jul 19:30 20-Jul 1:00 42 / 152 1 5 5.5 27
19-Jul 19:30 20-Jul 4:40 4 / 258 2 10 9.2 92
19-Jul 19:30 20-Jul 4:40 4 / 262 1 10 9.2 92
19-Jul 19:30 20-Jul 7:11 42 / 145 1 30 11.7 351
19-Jul 19:30 20-Jul 7:40 42 / 206 1 1 12.2 12
19-Jul 19:30 20-Jul 8:00 1212 / 2 1 20 12.5 250
19-Jul 19:30 20-Jul 8:25 126 / 1 2 25 12.9 323
19-Jul 19:30 20-Jul 8:30 4202 / 1 1 15 13.0 195
19-Jul 19:30 20-Jul 8:52 121 / 63 1 10 13.4 134
19-Jul 19:30 20-Jul 8:54 12 / 190 1 100 13.4 1,340
19-Jul 19:30 20-Jul 9:18 12 / 103 1 6 13.8 83
19-Jul 19:30 20-Jul 9:35 429 / 6 1 5 14.1 70
19-Jul 19:30 20-Jul 10:30 4X65 / 19 1 50 15.0 750
19-Jul 19:30 20-Jul 10:40 128 / 1 1 50 15.2 758
19-Jul 19:30 20-Jul 10:40 4X6 / 39 1 50 15.2 758
19-Jul 19:30 20-Jul 11:48 126 / 18 2 10 16.3 163
19-Jul 19:30 20-Jul 12:30 128 / 61 1 7 17.0 119
19-Jul 19:30 20-Jul 12:42 402 / 3 1 40 17.2 688
19-Jul 19:30 20-Jul 16:30 4 / 220 1 10 21.0 210
19-Jul 19:30 20-Jul 18:20 483 / 4 1 15 22.8 343
19-Jul 19:30 20-Jul 18:26 1232 / 8-1 1 2 22.9 46
19-Jul 19:30 20-Jul 19:30 49 / 34 2 9 24.0 216
19-Jul 19:30 20-Jul 20:00 128 / 59 1 6 24.5 147

19-Jul 19:30 20-Jul 20:10 46 / 19 2 5 24.7 123
19-Jul 19:30 20-Jul 20:43 4 / 282 1 2 25.2 50
19-Jul 19:30 20-Jul 21:10 424 / 6 1 15 25.7 385
19-Jul 19:30 20-Jul 21:45 484 / 1X 1 5 26.3 131
19-Jul 19:30 20-Jul 22:20 4 / 57 1 2 26.8 54
19-Jul 19:30 21-Jul 0:05 424 / 100 1 6 28.6 171
19-Jul 19:30 21-Jul 1:00 46 / 31-1 1 1 29.5 29
19-Jul 19:30 21-Jul 1:01 42 / 572 1 5 29.5 148
19-Jul 19:30 21-Jul 1:10 4 / 199 1 1 29.7 30
19-Jul 19:30 21-Jul 1:20 4 / 414 1 1 29.8 30
19-Jul 19:30 21-Jul 1:40 67 / 53 1 1 30.2 30
19-Jul 19:30 21-Jul 1:50 423 / 20 1 10 30.3 303
19-Jul 19:30 21-Jul 3:41 120 / 19-2 1 1 32.2 32
19-Jul 19:30 21-Jul 3:45 424 / 18 1 2 32.3 65
19-Jul 19:30 21-Jul 5:48 12 / 247 2 7 34.3 240
19-Jul 19:30 21-Jul 6:41 40 / 32 2 10 35.2 352
19-Jul 19:30 21-Jul 8:25 4X6 / 2-11 2 2 36.9 74
19-Jul 19:30 21-Jul 8:40 42 / 214 1 30 37.2 1,115
19-Jul 19:30 21-Jul 9:59 406 / 13 2 3 38.5 115
19-Jul 19:30 21-Jul 10:40 427 / 16 2 1 39.2 39
19-Jul 19:30 21-Jul 11:30 4 / 89-2 2 1 40.0 40
19-Jul 19:30 21-Jul 11:30 1286 / 59 1 10 40.0 400
19-Jul 19:30 21-Jul 13:15 402 / 55-01 1 2 41.8 84
19-Jul 19:30 22-Jul 1:45 42 / 462 1 10 54.2 542
19-Jul 19:30 22-Jul 4:00 42 / 474 1 1 56.5 56
19-Jul 20:30 20-Jul 0:15 6 / 20 2 200 3.8 750
19-Jul 20:30 20-Jul 0:30 B20 / BMSub 2 150 4.0 600
19-Jul 20:30 20-Jul 1:32 6 / 75 2 10 5.0 50
19-Jul 20:30 20-Jul 2:11 64 / 119 1 5 5.7 28
19-Jul 20:30 20-Jul 3:26 4X60 / 21 2 30 6.9 208
19-Jul 20:30 20-Jul 3:50 64 / 48 1 100 7.3 733
19-Jul 20:30 20-Jul 4:15 64 / 161 1 5 7.8 39
19-Jul 20:30 20-Jul 4:39 64 / 154 2 10 8.2 82
19-Jul 20:30 20-Jul 5:30 4X62 / 57 1 1 9.0 9
19-Jul 20:30 20-Jul 5:35 68 / 1 1 15 9.1 136
19-Jul 20:30 20-Jul 5:42 6 / 57 2 40 9.2 368
19-Jul 20:30 20-Jul 5:45 4X62 / 30 2 2 9.3 19
19-Jul 20:30 20-Jul 7:15 3 / 25 1 10 10.8 108
19-Jul 20:30 20-Jul 8:15 3344 / 7 1 10 11.8 118
19-Jul 20:30 20-Jul 8:38 12 / 18 1 100 12.1 1,213
19-Jul 20:30 20-Jul 8:41 1 / 81 1 10 12.2 122
19-Jul 20:30 20-Jul 9:30 609 / 5 1 10 13.0 130
19-Jul 20:30 20-Jul 9:36 6 / 121 1 2 13.1 26
19-Jul 20:30 20-Jul 9:38 6 / 147 1 20 13.1 263
19-Jul 20:30 20-Jul 10:32 42 / 96 1 15 14.0 210
19-Jul 20:30 20-Jul 12:01 64 / X1 1 40 15.5 621
19-Jul 20:30 20-Jul 12:15 351 / 5 2 1 15.8 16

19-Jul 20:30 20-Jul 21:59 6051 / 30 1 6 25.5 153
19-Jul 20:30 21-Jul 0:55 64 / 145 1 4 28.4 114
19-Jul 20:30 21-Jul 1:10 61 / 23 1 1 28.7 29
19-Jul 20:30 21-Jul 1:20 X67 / 8 1 1 28.8 29
19-Jul 20:30 21-Jul 2:40 3346 / 8 1 2 30.2 60
19-Jul 20:30 21-Jul 7:24 64 / 40 1 4 34.9 140
19-Jul 20:30 21-Jul 7:55 67 / 43 1 1 35.4 35
19-Jul 20:30 21-Jul 16:30 605 / 24 1 10 44.0 440
20-Jul 16:30 21-Jul 7:30 22 / 1 1 10 15.0 150
20-Jul 16:30 21-Jul 10:12 2 / 138 1 10 17.7 177
24-Jul 11:45 24-Jul 11:56 609 / 26 5 4 0.2 1
24-Jul 15:00 24-Jul 15:25 48 / 24 11 20 0.4 8
26-Jul 7:30 26-Jul 7:45 4 / 301 1 1 0.2 0
29-Jul 8:00 29-Jul 8:45 X67 / 4X 1 250 0.8 188
31-Jul 10:30 31-Jul 10:55 128 / 46 1 10 0.4 4
1-Aug 12:15 1-Aug 12:33 4 / 160 11 20 0.3 6
1-Aug 13:25 1-Aug 13:50 4 / 160 1 20 0.4 8
1-Aug 18:30 1-Aug 19:00 28 / 21 1 6 0.5 3
1-Aug 18:30 1-Aug 19:30 128 / 59 1 6 1.0 6
2-Aug 12:30 2-Aug 12:55 424 / 14 11 40 0.4 17
2-Aug 13:15 2-Aug 13:40 42 / 464 1 50 0.4 21
2-Aug 17:15 2-Aug 17:51 42 / 572 1 17 0.6 10
3-Aug 6:30 3-Aug 7:00 29 / 5 11 2 0.5 1
4-Aug 18:00 4-Aug 19:00 402 / 3 1 30 1.0 30
7-Aug 9:45 7-Aug 10:05 22 / 1 11 15 0.3 5
8-Aug 9:20 8-Aug 9:40 609 / 6 1 20 0.3 7
9-Aug 13:30 9-Aug 13:54 121 / 63 1 12 0.4 5
10-Aug 12:17 10-Aug 12:35 3 / 53 11 10 0.3 3
14-Aug 9:45 14-Aug 10:10 42 / 174 7 1 0.4 0
14-Aug 16:50 14-Aug 17:02 1 / 81 11 10 0.2 2
17-Aug 4:00 17-Aug 4:42 1 / 51-1 3 8 0.7 6
17-Aug 4:00 17-Aug 4:42 13 / 3 3 10 0.7 7
17-Aug 20:45 17-Aug 21:09 1 / 51-1 11 3 0.4 1
24-Aug 5:15 24-Aug 7:35 43 / 1 6 10 2.3 23
24-Aug 12:15 24-Aug 12:40 43 / 1 1 10 0.4 4
26-Aug 17:23 26-Aug 18:00 40 / 25-1-A 4 1 0.6 1
27-Aug 10:30 27-Aug 23:25 46 / 2 1 30 12.9 388
28-Aug 16:27 28-Aug 17:10 49 / 34 11 9 0.7 6
28-Aug 16:50 28-Aug 16:56 3 / 14A 4 1 0.1 0
2-Sep 6:13 2-Sep 6:45 7 / 78 2 5 0.5 3
2-Sep 23:30 3-Sep 0:01 3 / 52-3 11 5 0.5 3
11-Sep 16:15 11-Sep 16:57 121 / 20 1 30 0.7 21
11-Sep 16:15 11-Sep 17:45 424 / 14 1 40 1.5 60
11-Sep 16:30 11-Sep 17:18 6 / 193 1 10 0.8 8
11-Sep 16:45 11-Sep 22:33 424 / 18-3 1 1 5.8 6
11-Sep 18:10 11-Sep 18:16 3 / 53-3 2 5 0.1 0
11-Sep 19:20 11-Sep 20:50 1212 / 25 1 10 1.5 15

11-Sep 20:00 11-Sep 20:45 4061 / 14-20 2 1 0.8 1
12-Sep 11:00 12-Sep 11:30 4 / 232 1 2 0.5 1
13-Sep 3:25 13-Sep 3:55 3 / 53-3 1 5 0.5 3
13-Sep 17:42 13-Sep 18:12 46 / 28 11 10 0.5 5
16-Sep 15:45 16-Sep 16:15 28 / 164-1 6 1 0.5 1
16-Sep 20:00 16-Sep 21:18 8 / 25 7 1 1.3 1
20-Sep 12:30 20-Sep 12:54 12 / 18 1 25 0.4 10
20-Sep 21:27 20-Sep 21:51 3344 / 1 1 40 0.4 16
21-Sep 12:01 21-Sep 12:43 424 / 100 1 10 0.7 7
21-Sep 14:00 21-Sep 14:20 42 / 96 2 20 0.3 7
21-Sep 18:00 21-Sep 19:12 4 / 80 1 400 1.2 480
21-Sep 18:45 21-Sep 19:39 4 / B22 11 700 0.9 630
22-Sep 4:40 22-Sep 5:22 3 / 53 11 20 0.7 14
22-Sep 8:30 22-Sep 9:05 673 / 1 1 5 0.6 3
25-Sep 9:30 25-Sep 10:42 42 / 75 1 10 1.2 12
26-Sep 13:30 26-Sep 14:12 424 / 67 1 30 0.7 21
1-Oct 2:30 1-Oct 3:45 64 / 48 1 100 1.3 125
3-Oct 15:50 3-Oct 18:05 6 / 107 1 2 2.3 5
7-Oct 14:40 7-Oct 16:05 6 / 57 11 50 1.4 71
7-Oct 15:45 7-Oct 16:05 42 / 572 1 10 0.3 3
7-Oct 16:45 7-Oct 17:05 42 / 214 1 30 0.3 10
7-Oct 17:10 7-Oct 17:52 82 / 1 2 40 0.7 28
7-Oct 17:10 7-Oct 18:10 64 / X1 1 100 1.0 100
7-Oct 17:10 7-Oct 18:52 4 / 80 1 400 1.7 680
7-Oct 17:10 7-Oct 19:40 64 / 48 1 100 2.5 250
7-Oct 17:10 7-Oct 19:52 121 / 20 1 30 2.7 81
7-Oct 17:10 7-Oct 20:53 12 / 190 1 70 3.7 260
7-Oct 17:10 7-Oct 21:05 128 / 9 1 10 3.9 39
7-Oct 17:10 7-Oct 21:54 424 / 6 1 10 4.7 47
7-Oct 17:10 7-Oct 22:28 40 / 32 1 10 5.3 53
7-Oct 17:10 7-Oct 22:28 402 / 70 1 10 5.3 53
7-Oct 17:10 7-Oct 22:35 608 / 3 1 2 5.4 11
7-Oct 17:10 7-Oct 23:22 423 / 20 1 6 6.2 37
7-Oct 17:10 7-Oct 23:22 73 / 30 11 15 6.2 93
7-Oct 17:30 7-Oct 19:24 4X6 / 39 1 100 1.9 190
7-Oct 17:45 7-Oct 18:15 426 / 96 1 10 0.5 5
7-Oct 18:00 8-Oct 1:10 4X608 / 3 1 10 7.2 72
7-Oct 18:15 8-Oct 9:27 73 / 30 4 15 15.2 228
8-Oct 2:15 8-Oct 3:09 7 / 102 1 3 0.9 3
8-Oct 3:40 8-Oct 4:19 42 / 75 11 5 0.6 3
8-Oct 12:01 8-Oct 13:15 73 / 30 4 20 1.2 25
9-Oct 9:30 9-Oct 10:12 4X608 / 3 1 6 0.7 4
12-Oct 10:00 12-Oct 10:18 419 / 22-4 11 1 0.3 0
13-Oct 7:45 13-Oct 8:06 64 / 145 4 6 0.4 2
14-Oct 18:40 14-Oct 19:16 609 / 7 1 1 0.6 1
16-Oct 8:55 16-Oct 9:19 4X607 / 3-1 7 2 0.4 1
18-Oct 12:01 18-Oct 12:58 42 / 214 1 30 0.9 28

19-Oct 13:57 19-Oct 14:40 424 / 117 4 1 0.7 1
20-Oct 8:30 20-Oct 9:25 6 / 208 1 3 0.9 3
20-Oct 8:30 20-Oct 9:25 6 / 193 1 20 0.9 18
20-Oct 17:14 20-Oct 17:32 28 / 21 7 4 0.3 1
22-Oct 16:00 22-Oct 16:15 46 / 19 1 8 0.3 2
30-Oct 7:00 30-Oct 7:30 HBT / 57 11 7 0.5 4
30-Oct 16:00 30-Oct 16:45 44 / 24 7 1 0.8 1
1-Nov 10:00 1-Nov 10:20 6 / 16 1 10 0.3 3
1-Nov 11:39 1-Nov 12:15 4X65 / 49 1 7 0.6 4
1-Nov 11:39 1-Nov 12:20 658 / 9 1 2 0.7 1
1-Nov 11:39 1-Nov 12:21 401 / 6 1 5 0.7 3
1-Nov 11:39 1-Nov 12:33 4 / 57 1 3 0.9 3
1-Nov 11:39 1-Nov 13:05 128 / 59 1 10 1.4 14
1-Nov 11:39 1-Nov 13:57 6 / 50 1 10 2.3 23
1-Nov 11:39 1-Nov 23:47 122 / 7 1 8 12.1 97
1-Nov 12:01 1-Nov 13:07 42 / 588 1 3 1.1 3
1-Nov 16:00 1-Nov 16:15 42 / 540 1 25 0.3 6
1-Nov 19:00 1-Nov 19:30 6 / 200 1 4 0.5 2
1-Nov 19:00 1-Nov 19:36 6 / 193 1 10 0.6 6
1-Nov 19:00 1-Nov 20:00 424 / 67 1 20 1.0 20
1-Nov 21:30 1-Nov 22:35 42 / 572 1 10 1.1 11
3-Nov 12:01 3-Nov 12:48 2 / 103 1 25 0.8 20
5-Nov 13:00 5-Nov 13:47 6 / 97 7 1 0.8 1
7-Nov 7:30 7-Nov 7:55 121 / 77 1 10 0.4 4
11-Nov 3:30 11-Nov 4:30 42 / 462 1 5 1.0 5
11-Nov 3:30 11-Nov 4:42 423 / 20 1 10 1.2 12
11-Nov 6:00 11-Nov 6:45 406 / 13 1 3 0.8 2
11-Nov 16:00 11-Nov 16:20 4 / 160 11 20 0.3 7
16-Nov 8:50 16-Nov 9:45 4061 / 60-1 1 5 0.9 5
16-Nov 9:31 16-Nov 10:25 6 / 124 7 6 0.9 5
16-Nov 9:42 16-Nov 9:55 4191 / 22 1 3 0.2 1
16-Nov 17:01 16-Nov 17:30 4X62 / 52 11 2 0.5 1
16-Nov 22:26 16-Nov 23:15 X67 / 16 1 40 0.8 33
17-Nov 3:01 17-Nov 3:55 4 / 1 1 800 0.9 720
18-Nov 5:05 18-Nov 5:47 6 / 50 1 10 0.7 7
18-Nov 7:00 18-Nov 8:10 42 / 572 1 10 1.2 12
20-Nov 8:00 20-Nov 8:24 609 / 6 1 5 0.4 2
20-Nov 9:58 20-Nov 10:28 4 / 83 1 6 0.5 3
20-Nov 9:58 20-Nov 23:08 407 / 7 1 1 13.2 13
20-Nov 13:50 20-Nov 14:15 4X60 / 27 11 30 0.4 12
23-Nov 6:30 23-Nov 10:24 42 / 462 2 10 3.9 39
24-Nov 0:17 24-Nov 16:59 4 / 220 1 10 16.7 167
24-Nov 13:45 24-Nov 14:03 122 / 7 1 7 0.3 2
25-Nov 9:40 25-Nov 11:35 6052 / 3-4 3 6 1.9 11
25-Nov 13:55 25-Nov 16:00 6052 / 3-4 3 6 2.1 12
26-Nov 12:15 26-Nov 13:09 406 / 13 7 25 0.9 23
27-Nov 6:30 27-Nov 7:12 4 / 1 1 700 0.7 490

27-Nov 8:30 27-Nov 9:06 429 / 6 1 4 0.6 2
30-Nov 12:50 30-Nov 13:55 7 / 102 4 1 1.1 1
4-Dec 14:00 4-Dec 14:48 42 / 17 7 1 0.8 1
11-Dec 9:00 11-Dec 9:48 121 / 20 1 30 0.8 24
12-Dec 18:37 12-Dec 19:07 4X65 / 9 11 2 0.5 1
15-Dec 0:02 15-Dec 0:38 2 / 59 6 100 0.6 60
15-Dec 7:45 15-Dec 8:33 4X6 / 57 1 100 0.8 80
16-Dec 13:45 16-Dec 15:00 1 / ? 3 1 1.3 1
22-Dec 5:45 22-Dec 6:20 4 / 303 2 30 0.6 17
22-Dec 5:45 22-Dec 7:27 42 / 273 2 2 1.7 3
22-Dec 5:45 22-Dec 7:57 42 / 286 2 4 2.2 9
22-Dec 5:45 22-Dec 10:48 424 / 67 2 30 5.0 151
22-Dec 5:45 24-Dec 12:20 427 / 16 2 2 54.6 109
22-Dec 5:47 22-Dec 8:50 427 / 14 2 10 3.0 30
22-Dec 5:52 22-Dec 15:10 42 / 464 2 50 9.3 465
22-Dec 7:00 22-Dec 16:18 42 / 462 2 10 9.3 93
22-Dec 7:00 22-Dec 16:45 423 / 20 2 5 9.8 49
22-Dec 7:00 22-Dec 17:18 42 / 518 2 5 10.3 52
22-Dec 7:00 22-Dec 18:35 42 / 572 2 5 11.6 58
22-Dec 7:00 22-Dec 19:25 42 / 588 2 3 12.4 37
22-Dec 8:30 22-Dec 10:40 128 / 61 2 8 2.2 17
22-Dec 8:45 22-Dec 9:10 424 / 14 2 30 0.4 12
24-Dec 2:00 24-Dec 3:05 402 / 70 2 8 1.1 9
25-Dec 18:00 25-Dec 18:45 42 / 12 4 3 0.8 2
26-Dec 11:55 26-Dec 12:05 646 / 12 1 3 0.2 0
30-Dec 3:50 30-Dec 4:15 12 / 245 1 5 0.4 2
30-Dec 7:30 30-Dec 7:54 75 / 48 1 5 0.4 2
30-Dec 7:30 30-Dec 7:55 72 / 6 1 15 0.4 6

Lyndonville Electric Department 2013
This report is pursuant to PSB Rule 4.903B. It is to be submitted to the Public Service Board and
the Department of Public Service no later than 30 days after the end of the calendar year.
Electricity Outage Report -- PSB Rule 4.900Name of company Lyndonville Electric Department
Calendar year report covers 2013
Contact person Bill Humphrey
Phone number 802-626-9252
Number of customers 5,520
System average interruption frequency index (SAIFI) = 2.9Customers Out / Customers Served
Customer average interruption duration index (CAIDI) = 2.6Customer Hours Out / Customers Out
Outage cause Number of Total customer Note: Per PSB Rule 4.903(B)(3), this
Outages hours out report must be accompanied by an
1 Trees 312 33,487 overall assessment of system
2 Weather 71 6,271 reliability that addresses the areas
3 Company initiated outage 8 49 where most outages occur and the
4 Equipment failure 22 371 causes underlying most outages.
5 Operator error 2 1 Based on this assessment, the
6 Accidents 8 280 utility should describe, for both the long
7 Animals 19 199 and the short terms, appropriate and
8 Power supplier 0 0 necessary activities, action plans, and
9 Non-utility power supplier 0 0 implementation schedules for correcting
10 Other 0 0 any problems identified in the above
11 Unknown 41 1,068 assessment.
Total 483 41,726

VILLAGE OF LYNDONVILLE
ELECTRIC DEPARTMENT
Superintendent’s Office
46 Grove Street, PO Box 167 Lyndonville, Vermont 05851
Telephone (802) 626-9252
Facsimile (802) 626-9253
PSB RULE 4.093(B) (3) OVERALL ASSESSMENT OF SYSTEM RELIABILTIY FOR 2014 Multiple storms that devastated utilities in the state for the most part bypassed LED however, trees remain as the leading cause of outages on our system. Unlike most utilities LED does a large share of vegetation management in house, supplementing our efforts with the Vermont Department of Corrections Vermont Offender Work Program with resources from the local correction facility in St. Johnsbury and local arborist. The Offender Work Program starts after the first of May and assist us through the first of November with snow depth being the determining factor of when to end their assistance for the year. The Offender Work Program has proven to be a cost effective means of managing ground cutting. In the upcoming year we have appropriated more funds to increase the amount right-of-way aerial trimming and potential danger tree removal. After witnessing what other utilities suffered during the storms of this last year it is prudent to place effort into identifying and mitigating damaged from trees alongside but out of the right-of-way. At the conclusion of the year hopefully, we know if our focus was in the correct place. Bill Humphrey Superintendent of Operations Village of Lyndonville Electric Department
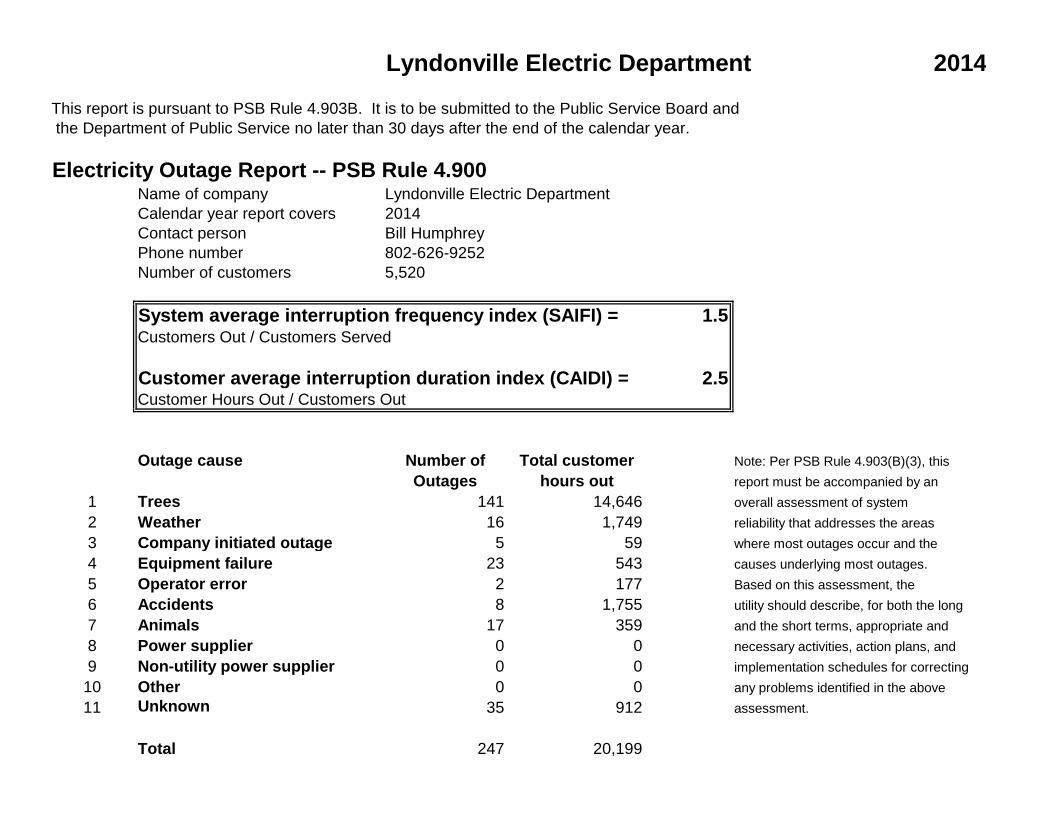
Lyndonville Electric Department 2014
This report is pursuant to PSB Rule 4.903B. It is to be submitted to the Public Service Board and the Department of Public Service no later than 30 days after the end of the calendar year.
Electricity Outage Report -- PSB Rule 4.900Name of company Lyndonville Electric DepartmentCalendar year report covers 2014Contact person Bill HumphreyPhone number 802-626-9252Number of customers 5,520
System average interruption frequency index (SAIFI) = 1.5Customers Out / Customers Served
Customer average interruption duration index (CAIDI) = 2.5Customer Hours Out / Customers Out
Outage cause Number of Total customer Note: Per PSB Rule 4.903(B)(3), this
Outages hours out report must be accompanied by an
1 Trees 141 14,646 overall assessment of system
2 Weather 16 1,749 reliability that addresses the areas
3 Company initiated outage 5 59 where most outages occur and the
4 Equipment failure 23 543 causes underlying most outages.
5 Operator error 2 177 Based on this assessment, the
6 Accidents 8 1,755 utility should describe, for both the long
7 Animals 17 359 and the short terms, appropriate and
8 Power supplier 0 0 necessary activities, action plans, and
9 Non-utility power supplier 0 0 implementation schedules for correcting
10 Other 0 0 any problems identified in the above
11 Unknown 35 912 assessment.
Total 247 20,199

VILLAGE OF LYNDONVILLE
ELECTRIC DEPARTMENT
Superintendent’s Office
46 Grove Street, PO Box 167 Lyndonville, Vermont 05851
Telephone (802) 626-9252
Facsimile (802) 626-9253
PSB RULE 4.093(B) (3) OVERALL ASSESSMENT OF SYSTEM RELIABILTIY FOR 2015 Even though weather related outages doubled from the previous year, tree related outages only increased slightly. Tree related outages accounted for only fifty percent of the outages on our system for the year 2015, being the lowest percentage in six years. Utilization of the Vermont Department of Corrections Vermont Offender Work Program (Work Camp) has benefitted LED rate payers in number of tree related outages and duration. However, much to our shock, the Work Camp is on the state’s chopping block for 2016. This will negatively impact LED financially along with increased outages and durations if we lose the access to the Work Camp. Contingency plans are being developed with realization that no solution we develop will be as cost effective as the Work Camp. We have continued to identify danger trees for removal and used a combined solution of in house personnel and outside contractors working jointly to remove the threatening trees. In areas, inaccessible to bucket trucks and where whole tree removable is not feasible we employ a local contractor to climb and remove encroaching branches. In the upcoming year, we will continue to focus on vegetation management as a means of reducing tree outages by utilizing the same means we have in the past with the exception of the Work Camp. Bill Humphrey Superintendent of Operations Village of Lyndonville Electric Department

Lyndonville Electric DepartmentRecord of Outages -- PSB Rule 4.900 Codes for type of outage:
Company Lyndonville Electric Department 1 Trees 6 Accidents
Calendar year 2015 2 Weather 7 Animals
Contact person Bill Humphrey 3 Company initiated outage 8 Power supplier
Phone number 802-626-9252 4 Equipment failure 9 Non-utility power supplier
Customers served 5,620 5 Operator error 10 Other
11 UnknownExamples:
10-Jan 14:10 11-Jan 13:30 3G2 2 50 23.3 1,166.7
10-Jan 12:30 09-Jan 2:00 bad data 3G2 2 50
If indicated, System (if system outage) Calculated columns
Outage Start Outage end Illegal date or time Substation ID (if substation outage) Outage Customers Outage CustomerDay-month Hour:minute Day-month e Please reenter data Circuit ID (if circuit outage) Code Out Duration Hours Out
1-Jan 5:02 1-Jan 7:35 64 / 119 4 1 2.5 3
1-Jan 7:35 1-Jan 8:42 643 / 7-2 4 1 1.1 1
5-Jan 10:00 5-Jan 12:01 128 / 1 1 40 2.0 81
5-Jan 10:00 5-Jan 15:00 42 / 263 4 1 5.0 5
5-Jan 15:00 5-Jan 16:00 427 / 10-1 3 2 1.0 2
7-Jan 10:45 7-Jan 12:20 3 / 1 1 50 1.6 79
9-Jan 13:30 9-Jan 14:15 6052 / 3 1 10 0.8 8
12-Jan 14:30 12-Jan 17:30 4 / 250A 1 1 3.0 3
19-Jan 0:01 19-Jan 6:30 6 / 57 2 100 6.5 648
19-Jan 0:01 19-Jan 9:00 6 / 50 2 30 9.0 269
19-Jan 0:01 19-Jan 10:30 609 / 6 2 12 10.5 126
19-Jan 0:47 19-Jan 5:30 426 / 67 2 6 4.7 28
19-Jan 0:47 19-Jan 7:44 67 / 16 2 50 7.0 348
19-Jan 0:47 19-Jan 8:23 126 / 8 2 6 7.6 46
19-Jan 1:00 19-Jan 4:30 12 / 18 2 200 3.5 700
19-Jan 1:00 19-Jan 7:00 6 / 47 4 1 6.0 6
19-Jan 1:00 19-Jan 7:55 10 / 2 4 1 6.9 7
19-Jan 2:45 19-Jan 3:15 6 / 1 2 700 0.5 350
19-Jan 6:30 19-Jan 14:30 42 / 518 2 20 8.0 160
19-Jan 12:01 19-Jan 13:30 42 / 262 2 30 1.5 44
19-Jan 12:01 19-Jan 16:35 64 / 80- 2 1 4.6 5
19-Jan 12:55 19-Jan 16:05 643 / 1 2 15 3.2 48
19-Jan 16:00 19-Jan 20:00 61 / 11 2 6 4.0 24
19-Jan 17:15 19-Jan 19:50 61 / 23-4 2 4 2.6 10
19-Jan 18:55 19-Jan 23:00 640 / 1 2 15 4.1 61
19-Jan 21:00 19-Jan 23:30 61 / 11 2 6 2.5 15
21-Jan 10:00 21-Jan 10:45 424 / 57 3 3 0.8 2
24-Jan 11:50 24-Jan 13:25 75 / 53 7 15 1.6 24
8-Feb 13:12 8-Feb 14:38 72 / 9 5 25 1.4 36
8-Feb 13:42 8-Feb 15:36 64 / 161 11 20 1.9 38
11-Feb 14:30 11-Feb 15:28 64 / 158 11 1 1.0 1
12-Feb 12:10 12-Feb 13:35 64 / 163 11 1 1.4 1

Lyndonville Electric DepartmentRecord of Outages -- PSB Rule 4.900 Codes for type of outage:
Company Lyndonville Electric Department 1 Trees 6 Accidents
Calendar year 2015 2 Weather 7 Animals
Contact person Bill Humphrey 3 Company initiated outage 8 Power supplier
Phone number 802-626-9252 4 Equipment failure 9 Non-utility power supplier
Customers served 5,620 5 Operator error 10 Other
11 UnknownExamples:
10-Jan 14:10 11-Jan 13:30 3G2 2 50 23.3 1,166.7
10-Jan 12:30 09-Jan 2:00 bad data 3G2 2 50
If indicated, System (if system outage) Calculated columns
Outage Start Outage end Illegal date or time Substation ID (if substation outage) Outage Customers Outage CustomerDay-month Hour:minute Day-month e Please reenter data Circuit ID (if circuit outage) Code Out Duration Hours Out
13-Feb 18:54 13-Feb 20:00 1 / 59A 5 2 1.1 2
22-Feb 10:42 22-Feb 15:35 123 / 14 7 10 4.9 49
22-Feb 22:30 23-Feb 1:00 1 / B1 4 500 2.5 1,250
22-Feb 22:30 23-Feb 4:30 1 / 21 4 400 6.0 2,400
4-Mar 7:15 4-Mar 8:50 605 / 34-2 11 1 1.6 2
4-Mar 7:19 4-Mar 9:30 4X60 / 40 4 2 2.2 4
5-Mar 21:00 5-Mar 22:15 4X60 / 40-1 4 1 1.3 1
9-Mar 15:00 9-Mar 15:55 4 / 48 6 20 0.9 18
13-Mar 16:43 13-Mar 17:55 4 / 214 10 1 1.2 1
14-Mar 10:15 14-Mar 12:01 4062 / 1 7 10 1.8 18
14-Mar 14:22 14-Mar 15:31 6 / 186 7 1 1.1 1
14-Mar 20:15 14-Mar 21:35 67 / 4 4 1 1.3 1
15-Mar 11:06 15-Mar 12:06 B20 / BMSUB 1 150 1.0 150
15-Mar 12:05 15-Mar 13:02 4X6 / 57 1 60 1.0 57
16-Mar 18:30 16-Mar 20:00 407 / 11-1 4 3 1.5 5
17-Mar 15:00 17-Mar 16:30 406 / 13 1 3 1.5 5
17-Mar 15:30 17-Mar 16:30 64 / 3 1 10 1.0 10
17-Mar 15:30 17-Mar 18:00 61 / 11 1 6 2.5 15
17-Mar 17:00 17-Mar 17:40 4 / X27 1 800 0.7 533
21-Mar 15:00 21-Mar 16:45 128 / 9 1 20 1.7 35
23-Mar 14:00 23-Mar 15:30 10 / 5 11 1 1.5 2
25-Mar 20:15 25-Mar 21:15 1212 / 2 1 25 1.0 25
26-Mar 11:12 26-Mar 12:45 424 / 43 1 1 1.5 2
31-Mar 1:45 31-Mar 3:20 4X60 / 8 6 80 1.6 127
10-Apr 11:59 10-Apr 13:20 64 / 154 1 12 1.4 16
11-Apr 10:15 11-Apr 12:34 4 / 206 1 30 2.3 69
11-Apr 10:15 11-Apr 12:50 64 / 163 4 1 2.6 3
13-Apr 17:00 13-Apr 19:00 42 / 21 1 17 2.0 34
13-Apr 22:42 14-Apr 3:00 46 / 2 1 35 4.3 151
20-Apr 15:45 20-Apr 16:26 64 / 58 1 1 0.7 1
20-Apr 15:45 20-Apr 16:48 640 / 12 1 1 1.0 1
20-Apr 16:00 20-Apr 17:17 4 / 303 2 20 1.3 26

Lyndonville Electric DepartmentRecord of Outages -- PSB Rule 4.900 Codes for type of outage:
Company Lyndonville Electric Department 1 Trees 6 Accidents
Calendar year 2015 2 Weather 7 Animals
Contact person Bill Humphrey 3 Company initiated outage 8 Power supplier
Phone number 802-626-9252 4 Equipment failure 9 Non-utility power supplier
Customers served 5,620 5 Operator error 10 Other
11 UnknownExamples:
10-Jan 14:10 11-Jan 13:30 3G2 2 50 23.3 1,166.7
10-Jan 12:30 09-Jan 2:00 bad data 3G2 2 50
If indicated, System (if system outage) Calculated columns
Outage Start Outage end Illegal date or time Substation ID (if substation outage) Outage Customers Outage CustomerDay-month Hour:minute Day-month e Please reenter data Circuit ID (if circuit outage) Code Out Duration Hours Out
20-Apr 18:00 20-Apr 18:30 4 / 107 1 6 0.5 3
20-Apr 18:00 20-Apr 19:00 66 / 1 1 10 1.0 10
20-Apr 18:00 20-Apr 20:00 642 / 1 1 25 2.0 50
20-Apr 18:00 20-Apr 22:12 6 / 50 1 17 4.2 71
20-Apr 18:45 20-Apr 21:26 6 / 57 1 150 2.7 403
20-Apr 19:30 21-Apr 0:22 46 / 19 1 20 4.9 97
20-Apr 21:10 20-Apr 22:33 642 / 1 1 7 1.4 10
20-Apr 23:00 21-Apr 1:30 6 / B19 1 60 2.5 150
20-Apr 23:00 21-Apr 3:00 6 / 20 1 540 4.0 2,160
21-Apr 21-Apr 4:00 X6,X61 / B20 1 60 4.0 240
21-Apr 7:00 21-Apr 9:27 609 / 26 1 3 2.5 7
21-Apr 9:00 21-Apr 9:30 X61 / 2-14 1 6 0.5 3
21-Apr 10:00 21-Apr 11:56 4061 / 60-10-1 1 2 1.9 4
21-Apr 10:45 21-Apr 12:53 6051 / 30 2 10 2.1 21
21-Apr 13:30 21-Apr 14:00 67 / 28X 1 10 0.5 5
22-Apr 0:24 22-Apr 2:45 4 / 320 11 15 2.3 35
22-Apr 19:30 22-Apr 21:30 1288 / 25 4 5 2.0 10
27-Apr 15:07 27-Apr 15:45 2 / 138 1 15 0.6 9
29-Apr 9:00 29-Apr 11:00 121 / 1 3 80 2.0 160
3-May 8:09 3-May 9:34 6 / 150 7 10 1.4 14
4-May 12:15 4-May 13:44 66 / 1 1 10 1.5 15
4-May 16:21 4-May 17:30 4X601 / 1 1 30 1.1 34
7-May 18:00 7-May 19:37 12 / 101 1 25 1.6 40
10-May 18:40 10-May 20:40 12 / 190 1 60 2.0 120
11-May 4:20 11-May 5:00 IPSub / X82X84 7 500 0.7 333
11-May 20:05 11-May 22:15 6 / 57 1 30 2.2 65
12-May 13:00 12-May 14:05 402 / 70 1 10 1.1 11
12-May 19:10 12-May 20:42 4 / 236 1 10 1.5 15
12-May 20:20 12-May 23:32 406 / 13 1 30 3.2 96
12-May 20:30 12-May 23:25 48 / 1 1 75 2.9 219
15-May 23:23 16-May 0:20 3 / 25 11 7 0.9 7
20-May 10:30 20-May 11:00 42 / 510 5 15 0.5 8

Lyndonville Electric DepartmentRecord of Outages -- PSB Rule 4.900 Codes for type of outage:
Company Lyndonville Electric Department 1 Trees 6 Accidents
Calendar year 2015 2 Weather 7 Animals
Contact person Bill Humphrey 3 Company initiated outage 8 Power supplier
Phone number 802-626-9252 4 Equipment failure 9 Non-utility power supplier
Customers served 5,620 5 Operator error 10 Other
11 UnknownExamples:
10-Jan 14:10 11-Jan 13:30 3G2 2 50 23.3 1,166.7
10-Jan 12:30 09-Jan 2:00 bad data 3G2 2 50
If indicated, System (if system outage) Calculated columns
Outage Start Outage end Illegal date or time Substation ID (if substation outage) Outage Customers Outage CustomerDay-month Hour:minute Day-month e Please reenter data Circuit ID (if circuit outage) Code Out Duration Hours Out
20-May 12:25 20-May 13:28 42 / 75 1 14 1.1 15
20-May 18:50 20-May 20:27 42 / 518 11 15 1.6 24
21-May 7:45 21-May 9:50 673 / 1 7 10 2.1 21
23-May 12:28 23-May 13:55 420 / 11 1 2 1.5 3
24-May 15:55 24-May 17:16 48 / 1 1 80 1.4 108
24-May 19:35 24-May 20:50 423 / 19-10-1 11 2 1.3 3
25-May 18:00 25-May 19:00 401 / 2-1 4 1 1.0 1
27-May 14:40 27-May 16:00 427 / 1 1 17 1.3 23
27-May 17:00 27-May 18:30 11 / 21 2 20 1.5 30
30-May 7:04 30-May 7:50 1212 / 2 1 10 0.8 8
30-May 7:04 30-May 8:50 129 / 5 1 7 1.8 12
30-May 15:00 30-May 16:30 6 / 193 1 20 1.5 30
30-May 20:07 30-May 21:15 4 / 160 6 25 1.1 28
30-May 21:00 30-May 22:00 4 / 206 1 100 1.0 100
31-May 1:30 31-May 4:00 75 / 53 1 20 2.5 50
31-May 4:00 31-May 5:15 IPSUB / B24 11 500 1.3 625
31-May 5:00 31-May 6:15 33 / 1 11 100 1.2 125
1-Jun 8:00 1-Jun 8:29 3 / 35 1 8 0.5 4
2-Jun 3:00 2-Jun 5:00 7 / 75 11 30 2.0 60
2-Jun 16:13 2-Jun 18:41 11 / 2 4 30 2.5 74
2-Jun 19:21 2-Jun 20:32 121 / 44 1 3 1.2 4
8-Jun 19:31 8-Jun 20:20 37 / 10 4 1 0.8 1
9-Jun 16:14 9-Jun 17:40 42 / 75 1 15 1.4 21
10-Jun 15:25 10-Jun 17:25 42 / 75 4 15 2.0 30
13-Jun 1:37 13-Jun 3:21 6 / 147 1 50 1.7 87
13-Jun 10:25 13-Jun 11:47 121 / 63 1 20 1.4 27
13-Jun 12:42 13-Jun 14:05 6 / 121 1 2 1.4 3
18-Jun 19:26 18-Jun 22:30 6 / 57 1 300 3.1 920
19-Jun 8:00 19-Jun 9:45 1213 / 2 1 15 1.7 26
20-Jun 8:00 20-Jun 9:50 402 / 3 1 100 1.8 183
22-Jun 6:45 22-Jun 8:25 420 / 11 1 1 1.7 2
22-Jun 15:30 22-Jun 16:00 64 / 145 1 3 0.5 1

Lyndonville Electric DepartmentRecord of Outages -- PSB Rule 4.900 Codes for type of outage:
Company Lyndonville Electric Department 1 Trees 6 Accidents
Calendar year 2015 2 Weather 7 Animals
Contact person Bill Humphrey 3 Company initiated outage 8 Power supplier
Phone number 802-626-9252 4 Equipment failure 9 Non-utility power supplier
Customers served 5,620 5 Operator error 10 Other
11 UnknownExamples:
10-Jan 14:10 11-Jan 13:30 3G2 2 50 23.3 1,166.7
10-Jan 12:30 09-Jan 2:00 bad data 3G2 2 50
If indicated, System (if system outage) Calculated columns
Outage Start Outage end Illegal date or time Substation ID (if substation outage) Outage Customers Outage CustomerDay-month Hour:minute Day-month e Please reenter data Circuit ID (if circuit outage) Code Out Duration Hours Out
23-Jun 18:02 23-Jun 23:25 12 / 18 1 200 5.4 1,077
24-Jun 2:52 24-Jun 5:01 120 / 8 1 4 2.2 9
24-Jun 4:15 24-Jun 5:45 122 / 7 2 10 1.5 15
27-Jun 11:51 27-Jun 13:45 4 / 421 4 1 1.9 2
28-Jun 13:53 28-Jun 15:00 121 / 78 1 5 1.1 6
29-Jun 14:15 29-Jun 15:15 1 / 52-3 11 1 1.0 1
29-Jun 16:20 29-Jun 17:44 64 / 48 6 150 1.4 210
1-Jul 15:34 1-Jul 16:32 64 / 162 7 1 1.0 1
1-Jul 18:30 1-Jul 20:08 1213 / 2 1 15 1.6 24
1-Jul 19:00 2-Jul 0:15 48 / 24 1 25 5.3 131
2-Jul 10:00 2-Jul 10:40 6 / B19 1 60 0.7 40
4-Jul 7:00 4-Jul 8:30 64 / 40 11 4 1.5 6
7-Jul 6:44 7-Jul 8:50 402 / 70 11 10 2.1 21
7-Jul 7:45 7-Jul 8:32 42 / 42 7 2 0.8 2
7-Jul 7:45 7-Jul 9:20 42 / 20 11 3 1.6 5
10-Jul 19:15 10-Jul 20:50 HBT / 57 7 16 1.6 25
10-Jul 19:15 10-Jul 20:55 HBT / 2-2 7 8 1.7 13
13-Jul 8:00 13-Jul 9:07 4 / 189-4 7 10 1.1 11
15-Jul 5:30 15-Jul 9:20 7 / 106 1 6 3.8 23
16-Jul 7:30 16-Jul 8:50 12 / 103 1 10 1.3 13
16-Jul 9:20 16-Jul 15:10 4X6 / 73 3 1 5.8 6
18-Jul 6:20 18-Jul 8:15 12121 / 1 1 23 1.9 44
18-Jul 15:45 18-Jul 16:15 128 / 9 1 14 0.5 7
18-Jul 22:46 19-Jul 1:00 29 / 138 1 22 2.2 49
19-Jul 8:05 19-Jul 8:45 4 / 189 1 6 0.7 4
19-Jul 17:10 19-Jul 19:48 4 / 120 1 6 2.6 16
19-Jul 18:00 19-Jul 19:40 2 / 270 2 6 1.7 10
19-Jul 20:20 19-Jul 22:10 42 / 245 2 53 1.8 97
19-Jul 20:20 20-Jul 1:50 402 / 3 2 42 5.5 231
19-Jul 20:45 20-Jul 9:40 64 / 45 1 5 12.9 65
19-Jul 20:45 20-Jul 10:30 644 / 5B 1 1 13.7 14
19-Jul 20:55 20-Jul 2:48 4 / 206 1 100 5.9 588

Lyndonville Electric DepartmentRecord of Outages -- PSB Rule 4.900 Codes for type of outage:
Company Lyndonville Electric Department 1 Trees 6 Accidents
Calendar year 2015 2 Weather 7 Animals
Contact person Bill Humphrey 3 Company initiated outage 8 Power supplier
Phone number 802-626-9252 4 Equipment failure 9 Non-utility power supplier
Customers served 5,620 5 Operator error 10 Other
11 UnknownExamples:
10-Jan 14:10 11-Jan 13:30 3G2 2 50 23.3 1,166.7
10-Jan 12:30 09-Jan 2:00 bad data 3G2 2 50
If indicated, System (if system outage) Calculated columns
Outage Start Outage end Illegal date or time Substation ID (if substation outage) Outage Customers Outage CustomerDay-month Hour:minute Day-month e Please reenter data Circuit ID (if circuit outage) Code Out Duration Hours Out
19-Jul 21:35 20-Jul 7:17 6 / 147 1 37 9.7 359
19-Jul 21:40 19-Jul 23:50 64 / 48 2 300 2.2 650
19-Jul 21:40 20-Jul 0:40 641 / 1 2 17 3.0 51
21-Jul 15:45 21-Jul 16:40 128 / 61 11 5 0.9 5
23-Jul 12:55 23-Jul 13:35 64 / 48 1 120 0.7 80
24-Jul 8:45 24-Jul 9:45 64 / 48 5 200 1.0 200
25-Jul 18:07 25-Jul 20:00 122 / 7 11 8 1.9 15
28-Jul 3:45 28-Jul 5:32 12 / 73 4 10 1.8 18
28-Jul 14:45 28-Jul 15:25 5 / 3-6 7 1 0.7 1
28-Jul 14:50 28-Jul 15:10 12 / 73-5 4 4 0.3 1
28-Jul 15:45 28-Jul 18:03 12 / 73-5 4 4 2.3 9
29-Jul 13:00 29-Jul 13:48 121 / 63 1 12 0.8 10
2-Aug 6:12 2-Aug 7:14 64 / 162 2 1 1.0 1
2-Aug 12:38 2-Aug 14:45 226 / 1 11 3 2.1 6
3-Aug 10:50 3-Aug 11:45 48 / 1 1 30 0.9 28
3-Aug 11:00 3-Aug 11:30 120 / 19 11 2 0.5 1
3-Aug 12:35 3-Aug 13:35 64 / 48 5 200 1.0 200
3-Aug 15:50 3-Aug 20:42 42 / 588- 1 4 4.9 19
3-Aug 15:55 3-Aug 17:55 42 / 464 2 30 2.0 60
3-Aug 17:40 3-Aug 18:37 73 / 73 2 2 0.9 2
7-Aug 16:15 7-Aug 17:45 4833 / 1 11 12 1.5 18
9-Aug 14:30 9-Aug 15:00 4X62 / 44 3 20 0.5 10
11-Aug 10:45 11-Aug 11:20 6 / 36 1 6 0.6 3
11-Aug 11:30 11-Aug 12:31 4 / 27 1 200 1.0 203
11-Aug 22:00 12-Aug 0:05 483 / 4 11 25 2.1 52
12-Aug 1:17 12-Aug 3:32 42 / 464 1 20 2.3 45
14-Aug 9:30 14-Aug 10:32 1288 / 23 1 1 1.0 1
16-Aug 23:30 17-Aug 6:58 11 / 2 6 30 7.5 224
17-Aug 2:00 17-Aug 3:00 IPSUB / B24 6 300 1.0 300
18-Aug 5:30 18-Aug 7:00 3 / 51 11 10 1.5 15
18-Aug 15:05 18-Aug 18:00 42 / 262 1 17 2.9 50
18-Aug 15:30 18-Aug 17:00 42 / 214 1 30 1.5 45

Lyndonville Electric DepartmentRecord of Outages -- PSB Rule 4.900 Codes for type of outage:
Company Lyndonville Electric Department 1 Trees 6 Accidents
Calendar year 2015 2 Weather 7 Animals
Contact person Bill Humphrey 3 Company initiated outage 8 Power supplier
Phone number 802-626-9252 4 Equipment failure 9 Non-utility power supplier
Customers served 5,620 5 Operator error 10 Other
11 UnknownExamples:
10-Jan 14:10 11-Jan 13:30 3G2 2 50 23.3 1,166.7
10-Jan 12:30 09-Jan 2:00 bad data 3G2 2 50
If indicated, System (if system outage) Calculated columns
Outage Start Outage end Illegal date or time Substation ID (if substation outage) Outage Customers Outage CustomerDay-month Hour:minute Day-month e Please reenter data Circuit ID (if circuit outage) Code Out Duration Hours Out
20-Aug 9:50 20-Aug 13:18 424 / 67 1 12 3.5 42
20-Aug 10:00 20-Aug 11:25 424 / 14 1 12 1.4 17
20-Aug 13:45 20-Aug 16:10 6 / 149 1 35 2.4 85
20-Aug 16:57 20-Aug 18:15 128 / 60 1 1 1.3 1
21-Aug 12:10 21-Aug 13:20 483 / 4 1 20 1.2 23
21-Aug 17:46 21-Aug 19:15 1288 / 23 1 1 1.5 1
24-Aug 8:30 24-Aug 9:33 15 / 1 6 30 1.1 32
25-Aug 10:00 25-Aug 11:20 HBT5 / 4 2 4 1.3 5
25-Aug 10:28 25-Aug 11:10 65 / 34 2 2 0.7 1
25-Aug 10:28 25-Aug 11:21 609 / 26 2 3 0.9 3
25-Aug 10:28 25-Aug 12:07 6 / 147 1 37 1.6 61
27-Aug 12:30 27-Aug 13:36 HBT / 38 2 1 1.1 1
3-Sep 13:32 3-Sep 13:58 6 / 32 1 6 0.4 3
9-Sep 7:00 9-Sep 10:15 420 / 6 1 25 3.3 81
9-Sep 14:05 9-Sep 14:29 4X62 / 44 1 20 0.4 8
9-Sep 14:05 9-Sep 14:43 4X62 / 55 1 1 0.6 1
9-Sep 17:07 9-Sep 19:31 402 / 3 1 100 2.4 240
14-Sep 18:55 14-Sep 20:35 402 / 70 1 12 1.7 20
15-Sep 2:00 15-Sep 4:00 12 / 18 1 250 2.0 500
18-Sep 4:00 18-Sep 7:00 75 / 59-1 4 1 3.0 3
18-Sep 12:35 18-Sep 13:25 12 / 101 1 20 0.8 17
19-Sep 14:00 19-Sep 16:30 12121 / 1 1 15 2.5 37
19-Sep 14:00 19-Sep 17:50 42 / 472 1 8 3.8 31
19-Sep 14:30 19-Sep 15:50 73 / 86X 1 2 1.3 3
23-Sep 15:30 23-Sep 16:12 2 / 139 8 20 0.7 14
25-Sep 10:15 25-Sep 11:35 4191 / 31 7 8 1.3 11
26-Sep 9:30 26-Sep 11:10 128 / 59 11 9 1.7 15
28-Sep 11:30 28-Sep 12:30 42 / 35 7 1 1.0 1
30-Sep 15:15 30-Sep 16:45 42 / 214 1 75 1.5 113
30-Sep 16:30 30-Sep 19:40 3346 / 7 1 15 3.2 48
30-Sep 16:44 30-Sep 19:55 128 / 18 1 7 3.2 22
30-Sep 17:00 30-Sep 18:30 42 / 214 2 75 1.5 113

Lyndonville Electric DepartmentRecord of Outages -- PSB Rule 4.900 Codes for type of outage:
Company Lyndonville Electric Department 1 Trees 6 Accidents
Calendar year 2015 2 Weather 7 Animals
Contact person Bill Humphrey 3 Company initiated outage 8 Power supplier
Phone number 802-626-9252 4 Equipment failure 9 Non-utility power supplier
Customers served 5,620 5 Operator error 10 Other
11 UnknownExamples:
10-Jan 14:10 11-Jan 13:30 3G2 2 50 23.3 1,166.7
10-Jan 12:30 09-Jan 2:00 bad data 3G2 2 50
If indicated, System (if system outage) Calculated columns
Outage Start Outage end Illegal date or time Substation ID (if substation outage) Outage Customers Outage CustomerDay-month Hour:minute Day-month e Please reenter data Circuit ID (if circuit outage) Code Out Duration Hours Out
1-Oct 11:00 1-Oct 11:50 121 / 20 1 40 0.8 33
2-Oct 5:15 2-Oct 6:55 673 / 1 1 10 1.7 17
2-Oct 13:10 2-Oct 14:40 407 / 263 1 8 1.5 12
3-Oct 10:16 3-Oct 13:45 42 / 588 1 1 3.5 3
3-Oct 11:15 3-Oct 11:40 33 / 23 11 1 0.4 0
4-Oct 16:15 4-Oct 18:05 121 / 63 1 16 1.8 29
7-Oct 17:03 7-Oct 17:52 28 / 21 11 4 0.8 3
10-Oct 3:42 10-Oct 5:00 6 / 150 11 10 1.3 13
12-Oct 16:14 12-Oct 17:30 334 / 9 1 6 1.3 8
13-Oct 10:30 13-Oct 11:35 402 / 70 11 15 1.1 16
15-Oct 9:40 15-Oct 10:45 X61 / 2-7 4 8 1.1 9
22-Oct 20:11 22-Oct 23:11 4 / 277 1 6 3.0 18
22-Oct 20:11 22-Oct 23:11 405 / 5 1 2 3.0 6
24-Oct 22:45 25-Oct 0:50 75 / 48 11 12 2.1 25
24-Oct 22:45 25-Oct 0:50 751 / 5 11 1 2.1 2
25-Oct 8:17 25-Oct 9:28 3 / 38 7 35 1.2 41
26-Oct 8:10 26-Oct 8:42 4X6 / 57 5 60 0.5 32
27-Oct 9:00 27-Oct 12:01 15 / X16 11 20 3.0 60
27-Oct 9:20 27-Oct 9:35 6 / 75 3 10 0.2 2
27-Oct 15:30 27-Oct 15:45 12 / 190 1 60 0.2 15
28-Oct 10:00 28-Oct 11:30 12 / 79 5 30 1.5 45
28-Oct 17:00 28-Oct 17:30 7 / 78 1 5 0.5 2
28-Oct 20:00 29-Oct 9:18 6051 / 30 1 5 13.3 66
28-Oct 20:30 29-Oct 0:50 6 / 124 1 6 4.3 26
28-Oct 20:30 29-Oct 8:20 609 / 6 1 20 11.8 237
28-Oct 20:30 29-Oct 10:29 602 / 19 1 10 14.0 140
28-Oct 20:30 29-Oct 11:05 6 / 50 1 25 14.6 365
28-Oct 20:55 28-Oct 22:45 120 / 1 1 20 1.8 37
28-Oct 20:55 28-Oct 23:00 120 / 8 1 3 2.1 6
28-Oct 21:00 29-Oct 0:40 4833 / 1 1 7 3.7 26
28-Oct 21:10 29-Oct 12:15 609 / 6 1 15 15.1 226
28-Oct 21:10 29-Oct 13:15 6 / 124-5 4 1 16.1 16

Lyndonville Electric DepartmentRecord of Outages -- PSB Rule 4.900 Codes for type of outage:
Company Lyndonville Electric Department 1 Trees 6 Accidents
Calendar year 2015 2 Weather 7 Animals
Contact person Bill Humphrey 3 Company initiated outage 8 Power supplier
Phone number 802-626-9252 4 Equipment failure 9 Non-utility power supplier
Customers served 5,620 5 Operator error 10 Other
11 UnknownExamples:
10-Jan 14:10 11-Jan 13:30 3G2 2 50 23.3 1,166.7
10-Jan 12:30 09-Jan 2:00 bad data 3G2 2 50
If indicated, System (if system outage) Calculated columns
Outage Start Outage end Illegal date or time Substation ID (if substation outage) Outage Customers Outage CustomerDay-month Hour:minute Day-month e Please reenter data Circuit ID (if circuit outage) Code Out Duration Hours Out
28-Oct 22:00 29-Oct 3:30 642 / 1 1 20 5.5 110
29-Oct 7:20 29-Oct 15:00 64 / 80 1 1 7.7 8
29-Oct 16:30 29-Oct 19:30 4 / 298 1 1 3.0 3
29-Oct 16:30 29-Oct 21:55 4 / 232 1 2 5.4 11
30-Oct 8:00 30-Oct 10:55 424 / 67 11 50 2.9 146
30-Oct 14:00 30-Oct 15:07 73 / 30 11 15 1.1 17
31-Oct 11:20 31-Oct 13:00 128 / 59 11 10 1.7 17
2-Nov 13:30 2-Nov 15:10 121 / 63 11 16 1.7 27
6-Nov 13:15 6-Nov 14:00 64 / 119 1 13 0.8 10
7-Nov 8:37 7-Nov 10:28 12 / 247 11 12 1.9 22
14-Nov 6:02 14-Nov 6:49 75 / 48 1 12 0.8 9
14-Nov 7:50 14-Nov 8:21 12 / 270 1 5 0.5 3
18-Nov 7:30 18-Nov 9:20 4X62 / 38 7 1 1.8 2
26-Nov 8:50 26-Nov 10:30 605 / 24 1 20 1.7 33
28-Nov 9:00 28-Nov 10:00 3 / 51 7 10 1.0 10
29-Nov 8:15 29-Nov 10:00 12 / 190 11 42 1.7 73
1-Dec 12:30 1-Dec 13:25 4 / 129 7 1 0.9 1
1-Dec 20:41 1-Dec 23:59 4062 / 1 1 6 3.3 20
7-Dec 7:30 7-Dec 8:30 84 / 9 11 1 1.0 1
13-Dec 14:38 13-Dec 15:15 4191 / 14 11 2 0.6 1
17-Dec 20:36 17-Dec 22:45 42 / 274 11 6 2.2 13
18-Dec 7:45 18-Dec 10:25 121 / 20 1 40 2.7 107
18-Dec 15:00 18-Dec 16:03 28 / 21 11 3 1.0 3
24-Dec 0:01 24-Dec 1:30 7 / 8 1 50 1.5 74
27-Dec 4:45 27-Dec 6:15 7 / 8 1 100 1.5 150
27-Dec 6:45 27-Dec 8:30 42 / 75 1 30 1.7 52
31-Dec 16:51 31-Dec 18:30 22 / 1 11 23 1.7 38

Lyndonville Electric Department 2015
This report is pursuant to PSB Rule 4.903B. It is to be submitted to the Public Service Board and
the Department of Public Service no later than 30 days after the end of the calendar year.
Electricity Outage Report -- PSB Rule 4.900Name of company Lyndonville Electric Department
Calendar year report covers 2015
Contact person Bill Humphrey
Phone number 802-626-9252
Number of customers 5,620
System average interruption frequency index (SAIFI) = 2.0Customers Out / Customers Served
Customer average interruption duration index (CAIDI) = 2.2Customer Hours Out / Customers Out
Outage cause Number of Total customer Note: Per PSB Rule 4.903(B)(3), this
Outages hours out report must be accompanied by an
1 Trees 143 12,906 overall assessment of system
2 Weather 33 4,199 reliability that addresses the areas
3 Company initiated outage 6 183 where most outages occur and the
4 Equipment failure 24 3,859 causes underlying most outages.
5 Operator error 7 523 Based on this assessment, the
6 Accidents 7 939 utility should describe, for both the long
7 Animals 19 579 and the short terms, appropriate and
8 Power supplier 1 14 necessary activities, action plans, and
9 Non-utility power supplier 0 0 implementation schedules for correcting
10 Other 1 1 any problems identified in the above
11 Unknown 42 1,560 assessment.
Total 283 24,762

12 Municipals’ Integrated Resource Plan
Barton Village Inc. Electric Department;
Village of Enosburg Falls Water & Light Department; Town of Hardwick Electric Department;
Village of Hyde Park Electric Department; Village of Jacksonville Electric Company;
Village of Johnson Water and Light Department; Village of Ludlow Electric Light Department; Village of Lyndonville Electric Department;
Village of Morrisville Water & Light Department; Northfield Electric Department;
Village of Orleans Electric Department; Swanton Village, Inc. Electric Department;
Integrated Resource Plan 2015-2034
Part 3 - Resource Model & Results
Presented to the Vermont Public Service Board July 17, 2015
Submitted by: Vermont Public Power Supply Authority

ii
Table of Contents
1. Introduction and Approach ..................................................................................................... 1 2. Existing Resources .................................................................................................................. 2 3. Model Overview ..................................................................................................................... 5 4. Model Input Description (Resources and Variables) .............................................................. 6
4.1 Energy Efficiency ................................................................................................................................ 8 4.2 Net Metering ........................................................................................................................................ 9 4.3 Vermont Renewable Energy Standard ................................................................................................10 4.4 Rate Design and Advanced Metering Infrastructure ...........................................................................11 4.5 Key Variables .....................................................................................................................................11 4.6 Load Forecast......................................................................................................................................13
5. Model Output Description .................................................................................................... 20 5.1. Scenarios and Portfolio Attributes .....................................................................................................20 5.2. SensIt .................................................................................................................................................23 5.3. Expected Value Calculations .............................................................................................................25 5.4. Results ................................................................................................................................................26
6. Action Plan ........................................................................................................................... 33 7. Conclusion ............................................................................................................................ 34 Appendix 1: Resource and Variable Assumptions ........................................................................ 36 Appendix 2: Model Directions ...................................................................................................... 76 Appendix 3: Resource Scenario Results ........................................................................................ 91

iii
List of Figures Figure 2-1: VPPSA Systems’ 2014 Power Supply by Fuel Type ................................................... 3 Figure 2-2: 12 Municipals’ Energy Obligation vs. Current Resources ........................................... 4 Figure 2-3: 12 Municipals’ Capacity Obligation vs. Existing Resources ....................................... 4 Figure 4-1: Supply Resources ......................................................................................................... 6 Figure 4-2: Key Variable Ranges .................................................................................................. 12 Figure 4-3: Key Variable Values in 2017 ...................................................................................... 13 Figure 5-1: Supply Scenarios ........................................................................................................ 21 Figure 5-2: Tornado Chart Example .............................................................................................. 24 Figure 5-3: Probability Weightings Used for Expected Value Calculation .................................. 26 Figure 5-4: Summary of Results .................................................................................................... 27 Figure 5-5: Weighting Values for Ranking Purposes .................................................................... 28 Figure 5-7: Scenario 17- In-State Solar, Out-of-State Solar, and Market Contract Results .......... 31 Figure 5-8: Scenario 17- In-State Solar, Out-of-State Solar, and Market Contract Tornado Chart ....................................................................................................................................................... 31

1
1. Introduction and Approach
This section of the Integrated Resource Plan (“IRP”) describes the municipal systems’ resource analytical process that is used to evaluate and assess power portfolios. While the municipal systems seek approval of the IRP, the approval is not being sought for the actual results contained herein or for any explicit resource decision at this time. Rather, the Municipals seek approval of the analytic framework rather than approval of a particular power project or portfolio. The Municipals’ IRP results in a plan for meeting future resource needs, but it does not map out with precision what exact action the 12 municipal systems will ultimately take or what single resource mix is best over the course of the next 20 years.
The objective of the integrated resource planning process is to assure consumers are provided with safe and reliable service balanced with the costs and benefits of providing this service. This Integrated Resource Plan outlines the process by which VPPSA equitably considers supply options (electric generation plants or wholesale contracts) when developing strategies to meet its customers’ long-term energy and capacity needs. VPPSA’s intent is to develop a flexible, cost-effective strategy to serve future power needs for its municipal systems and their customers, recognizing the complex interaction among total resource costs, revenue requirements, reliability, electric rate and environmental impacts, flexibility, diversity and industry restructuring.
To this end, the IRP is a combination of analytics and policy level considerations. For example, the IRP model will produce some specific quantitative numbers, but it does not intend to resolve all resource procurement questions mathematically. Judgment and policy level influences will lead to decisions that are aligned with the consumers of the individual municipal utility systems’ desires to the greatest extent possible. For purposes of this IRP analysis and consistent with past IRPs, all 12 systems were aggregated and treated as one system. It is important to note that the analysis and model, when used in aggregate, does not represent any individual systems’ future resource mix. Instead, the IRP provides information on how power supply portfolios will be evaluated and compared in aggregate. Individual resource decisions will be made at the local system level as resource options are presented to the municipal systems. The IRP analysis and associated files have the capability to analyze resources at the individual system level and this will be done as specific power projects are reviewed and assessed. In this way, each utility will have specific information on the impact a project and resource mix will have on their individual system. It provides information that facilitates each utility's determination whether or not a project or resource mix fits with the municipal’s goals and customers’ preferences.

2
As part of the IRP process communication and review has been ongoing with the municipal systems. VPPSA staff worked with its member systems to describe the process, seek input, survey utility groups, and develop a power supply tool. VPPSA and the municipal utilities have held substantive discussions on numerous occasions to consider resource options and potential future supply scenarios to meet consumers’ needs. VPPSA held regular meetings on future resources at the VPPSA Board level. Resource discussions have been, and will continue to be, an agenda item at all VPPSA Board meetings. Based on direction from the VPPSA Board, resources and combinations of resources are evaluated based their mix of attributes desirable to the members, including diversity, duration, achievability, reliability, credit risk, flexibility, and volatility. These attributes are discussed further in Section 5.1 of Part 3. The municipal systems and VPPSA view the IRP planning process as dynamic rather than static; conditions change and planning projections must be updated as necessary to reflect important developments. Therefore, the municipal systems’ IRP is just that; a plan that will require continual evolution and further analysis of investment decision paths. This model is the engine driving the analytic framework and is used on a regular basis to help assess and evaluate power project opportunities. The IRP is written with the goal of ensuring the decision making framework described is understandable and accessible. The IRP model described is provided with the IRP to allow the reader the ability to have an in depth understanding of the impact of key variables on the resource mix. The remainder of this section of the IRP describes VPPSA's existing resources (Section 2), provides an overview of the model (Section 3) and describes key inputs (Section 4) and outputs (Section 5). Section 6 and 7 wrap up with an Action Plan and Conclusion. Appendices include resource and variable assumptions, a detailed description of the operation of the model, and results of the model.
2. Existing Resources The municipal systems’ current power supply portfolio is a combination of long-term contracts, short-term contracts, and generation. The portfolio acts as a diversified means to financially hedge the cost of serving load at the Vermont Zone. The VPPSA systems’ current supply mix meets existing energy and demand needs. Figure 2.1 displays the VPPSA utility mix, in aggregate, by fuel type, prior to the sale of any renewable energy attributes. The figure illustrates the diversity of existing fuel sources.

3
Figure 2-1: VPPSA Systems’ 2014 Power Supply by Fuel Type
While current market obligations are being met by existing resources, significant changes to the mix are expected to occur in the near future. Figures 2-2 and 2-3 summarize the position of VPPSA systems (in aggregate) on an energy and capacity basis contrasted to a base-case load forecast for energy and peak demand over a 20-year horizon. It provides an assessment of secured resources as contrasted to load requirements. As shown in the charts, a growing gap in both energy and capacity supply occurs in the near future, especially after 2022.
* Prior to sale of any renewable attributes. Residual Mix are market contracts without a known fuel source.

4
Figure 2-2: 12 Municipals’ Energy Obligation vs. Current Resources
Figure 2-3: 12 Municipals’ Capacity Obligation vs. Existing Resources
0%
20%
40%
60%
80%
100%
120%
2015 2016 2017 2018 2019 2020 2021 2022 2023 2024 2025 2026 2027 2028 2029 2030 2031 2032 2033 2034
Capacity Resources as a Percent of Forecast Need
Fossil Fuel Hydro Biomass Solar Landfill Gas Nuclear Market Purchases

5
Major milestones for the supply mix can be summarized as follows: • Energy Market Contracts expiring in the first one to five years • Current HQ Contract expirations 2012 through 2016 – 16.4 MW • Substantial five year energy only contract beginning in 2018 • Capacity resources are expected to be level through 2024 after an initial drop
in 2016 • Utility owned hydro facilities will need to undergo FERC relicenseing
Facility Name Utility Owner FERC License Expiration Date
Barton Village Hydro Barton Village 10/1/2043 Enosburg Falls Hydro Village of Enosburg 04/30/2023 Great Falls Hydro Village of Lyndonville 5/31/2019 Highgate Falls Hydro Village of Swanton 04/30/2024 Morrisville Hydro Village of Morrisville 04/30/2015 Vail Hydro Village of Lyndonville 02/28/2034
Detail on each municipal system’s existing power portfolio and detail on each resource is described in Appendix 1 and included in the individual systems' portions of the IRP.
3. Model Overview The analytic model that provides the framework for resource decisions is Microsoft Excel based. It consists of three Excel workbooks and a required Microsoft Excel “Add-In”. The list below summarizes the primary source files, which are provided with the IRP.
1. “CapEgyCalc5.xlsm” 2. “IRPResults4.xls” 3. “IRP_Run_Assumptions.xlsm” 4. “Sens131s.xla”
“CapEgyCalc5.xlsm” is an input file. All resources in the current supply mix are entered into this file as well as the assumptions of how the resource is to be modeled (costs, capacity factor, on-peak, etc.). Each resource is able to be assigned to member system utilities in full or partial units, in order to model impacts to individuals. The loads that need to be served by multiple utilities are also characterized. Results are generated based upon the chosen inputs in the file and limitations on each resource. Resource and key variable inputs are discussed further in Section 4. “IRPResults4.xls” captures the output from “CapEgyCalc5.xlsm” and calculates the results, including sensitivity analysis. Variables used to stress test and calculate portfolio Net Present Values (NPV) are included in the “IRPResults4.xls” file and are easily adjusted by the user. This file provides annual summaries, by resource, for the projected

6
output of those resources in capacity, energy, REC, and ancillary product terms as well as projected total power costs and market revenues for resources by year. “IRP_Run_Assumptions.xlsm” allows for multiple iterations of the model to take place automatically. Up to 25 separate user-defined resource mixes to be run through the model are identified; the file is intended to be the primary user interface for deriving output from the IRP model after all user inputs have been finalized in “CapEgyCalc5.xlsm” and “IRPResults4.xls.” The user can define purchase years, capacity factors, and resource lifetimes that will flow into the model. As currently designed, this file allows combinations of hypothetical/generic resources that will meet future load needs to be characterized and makes final modifications to the CapEgyCalc5.xlsm spreadsheet before generating a results file for the case. “Sens131s.xla” is a required “Add In” for Excel. It needs to be installed as an available “Add In” in order for the model to run correctly. This portion of the model stresses the high, low, and base case of all variables. The file enables the model to produce “tornado” charts outputs after stressing low, base and high case variables and their affects on NPV. Detailed directions on how to utilize the files above to collectively run the model are provided in Appendix 2.
4. Model Input Description (Resources and Variables) The model aggregates all 12 VPPSA utility systems’ load and resources and treats them as one in order to produce one supply-side resource mix for all 12 systems in aggregate. All resources and supply assumptions are input into the model on a resource-by-resource basis. Existing generation and contract resources were input into the model including costs, capacity value, energy allotment, and end dates. Figure 4-1 is a list of all resources currently modeled in the IRP analysis and included in the current version of the file “CapEgyCalc5.xlsm”. A detailed description of the current supply resources, including the "planned purchase" program (signified below by "PP") is found in each individual member systems' resource inventory.
Figure 4-1: Supply Resources
67 Resources Defined in Spreadsheet's Database Supplier ID Name Type Code
NYPA NYPA Niagara Project Contract Hydro NYPA NYPA St. Lawrence Project Contract Hydro VEPP VEPP Inc: Ryegate BioMass VEPP Vt Elect Pow Prod Inc: Hydro Contract Hydro MUNI Enosburg Falls Hydroelectric Internal Hydro

7
MUNI Wolcott Hydro Internal Hydro MUNI Vail & Great Falls Internal Hydro MUNI Barton Hydroelectric Internal Hydro MUNI Morrisville Plant #2 Internal Hydro MUNI Cadys Falls Internal Hydro MUNI H.K. Sanders Internal Hydro MUNI Highgate Falls Internal Hydro MUNI Unit 5 Internal Hydro
HQUEB Hydro-Quebec Sch. B Contract Hydro HQUEB Hydro-Quebec Sch. C3 Contract Hydro HQUEB Hydro-Quebec Sch. C4A Contract Hydro HQUEB Hydro-Quebec Sch. C4B Contract Hydro HQUEB Hydro-Quebec ICC Contract Hydro MUNI Stonybrook CC Unit 1A OIL/GAS MUNI Stonybrook CC Unit 1B OIL/GAS MUNI Stonybrook CC Unit 1C OIL/GAS MUNI J.C. McNeil BioMass MUNI Yarmouth (Wyman) Unit 4 OIL/GAS MUNI Barton Diesel OIL/GAS VPPSA Project 10 OIL/GAS VPPSA Fitchburg Landfill Gas Landfill Gas
SO Standard Offer Standard Offer HQUS HQUS1 Contract Hydro HQUS HQUS2 Contract Hydro HQUS HQUS3 Contract Hydro HQUS HQUS4 Contract Hydro HQUS HQUS5 Contract Hydro HQUS HQUS6 Contract Hydro VPPSA Seabrook_1 Nuclear VPPSA Chester Solar Solar VPPSA Hardwick Solar Solar VPPSA PP6-OnPeak-2015 Firm System Contract VPPSA PP6-OffPeak-2015 Firm System Contract VPPSA PP6-OnPeak-15Q4 Firm System Contract VPPSA PP6-OffPeak-15Q4 Firm System Contract VPPSA PP7OnPeak2015 Firm System Contract VPPSA PP7OffPeak2015 Firm System Contract VPPSA Merr2016OnPeak Firm System Contract VPPSA Merr2016OffPeak Firm System Contract VPPSA PP8OnPeak2015 Firm System Contract VPPSA PP8OffPeak2015 Firm System Contract VPPSA PP8OnPeak2016 Firm System Contract VPPSA PP8OffPeak2016 Firm System Contract VPPSA PP8OnPeak2017 Firm System Contract VPPSA PP8OffPeak2017 Firm System Contract VPPSA 2018-2022 Peak Nuclear VPPSA 2018-2022 Off Peak Nuclear VPPSA Orleans 2014-2016 Peak Firm System Contract VPPSA Orleans 2014-2016 Off Peak Firm System Contract VPPSA PP10 Peak Firm System Contract VPPSA PP10 Off Peak Firm System Contract VPPSA Generic OutState Solar Solar
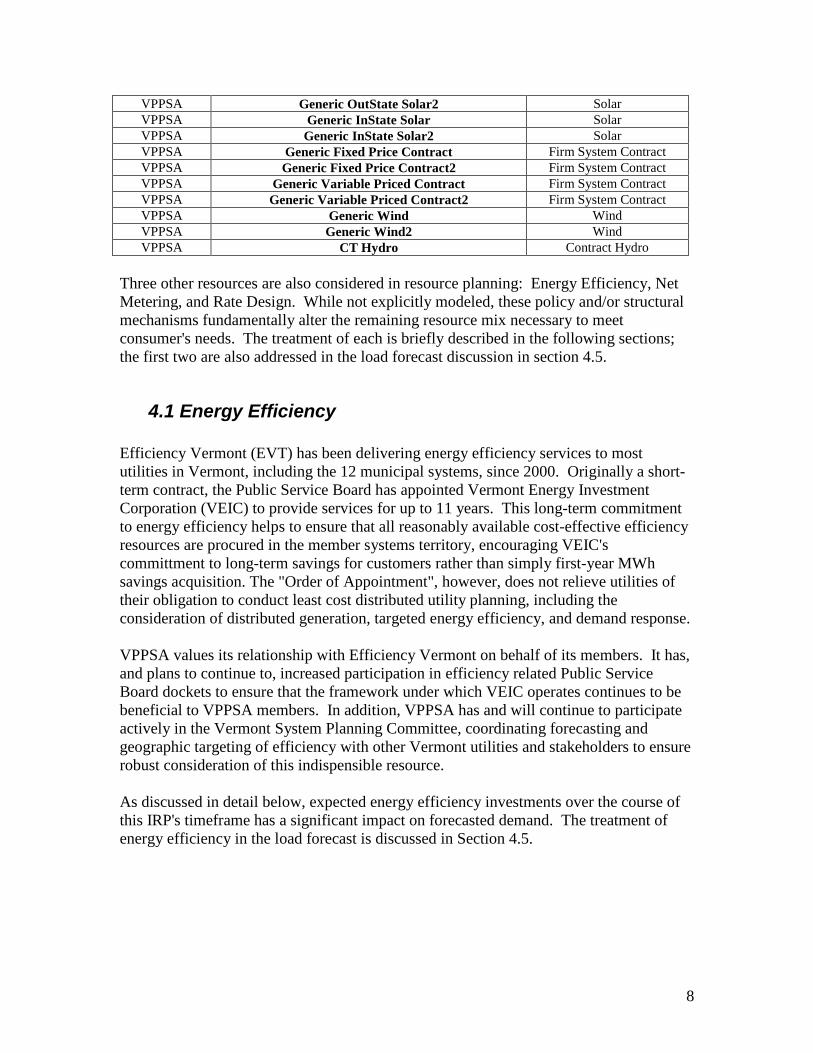
8
VPPSA Generic OutState Solar2 Solar VPPSA Generic InState Solar Solar VPPSA Generic InState Solar2 Solar VPPSA Generic Fixed Price Contract Firm System Contract VPPSA Generic Fixed Price Contract2 Firm System Contract VPPSA Generic Variable Priced Contract Firm System Contract VPPSA Generic Variable Priced Contract2 Firm System Contract VPPSA Generic Wind Wind VPPSA Generic Wind2 Wind VPPSA CT Hydro Contract Hydro
Three other resources are also considered in resource planning: Energy Efficiency, Net Metering, and Rate Design. While not explicitly modeled, these policy and/or structural mechanisms fundamentally alter the remaining resource mix necessary to meet consumer's needs. The treatment of each is briefly described in the following sections; the first two are also addressed in the load forecast discussion in section 4.5.
4.1 Energy Efficiency Efficiency Vermont (EVT) has been delivering energy efficiency services to most utilities in Vermont, including the 12 municipal systems, since 2000. Originally a short-term contract, the Public Service Board has appointed Vermont Energy Investment Corporation (VEIC) to provide services for up to 11 years. This long-term commitment to energy efficiency helps to ensure that all reasonably available cost-effective efficiency resources are procured in the member systems territory, encouraging VEIC's committment to long-term savings for customers rather than simply first-year MWh savings acquisition. The "Order of Appointment", however, does not relieve utilities of their obligation to conduct least cost distributed utility planning, including the consideration of distributed generation, targeted energy efficiency, and demand response. VPPSA values its relationship with Efficiency Vermont on behalf of its members. It has, and plans to continue to, increased participation in efficiency related Public Service Board dockets to ensure that the framework under which VEIC operates continues to be beneficial to VPPSA members. In addition, VPPSA has and will continue to participate actively in the Vermont System Planning Committee, coordinating forecasting and geographic targeting of efficiency with other Vermont utilities and stakeholders to ensure robust consideration of this indispensible resource. As discussed in detail below, expected energy efficiency investments over the course of this IRP's timeframe has a significant impact on forecasted demand. The treatment of energy efficiency in the load forecast is discussed in Section 4.5.
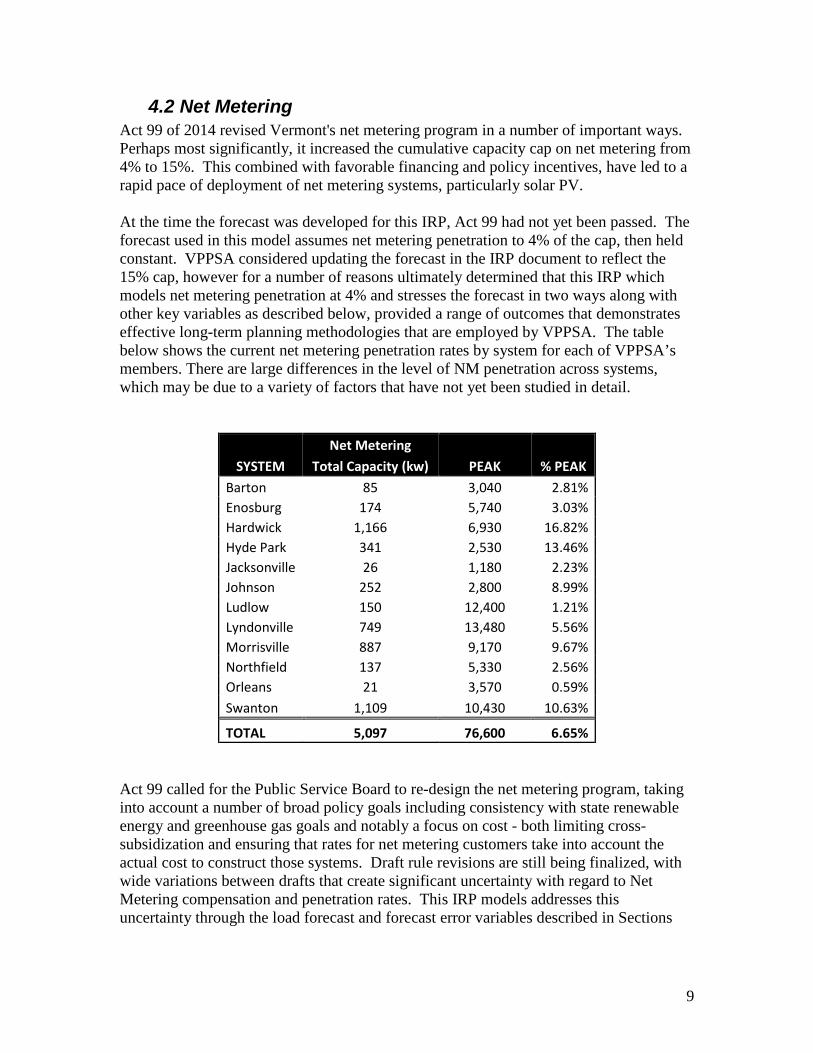
9
4.2 Net Metering Act 99 of 2014 revised Vermont's net metering program in a number of important ways. Perhaps most significantly, it increased the cumulative capacity cap on net metering from 4% to 15%. This combined with favorable financing and policy incentives, have led to a rapid pace of deployment of net metering systems, particularly solar PV. At the time the forecast was developed for this IRP, Act 99 had not yet been passed. The forecast used in this model assumes net metering penetration to 4% of the cap, then held constant. VPPSA considered updating the forecast in the IRP document to reflect the 15% cap, however for a number of reasons ultimately determined that this IRP which models net metering penetration at 4% and stresses the forecast in two ways along with other key variables as described below, provided a range of outcomes that demonstrates effective long-term planning methodologies that are employed by VPPSA. The table below shows the current net metering penetration rates by system for each of VPPSA’s members. There are large differences in the level of NM penetration across systems, which may be due to a variety of factors that have not yet been studied in detail.
Net Metering SYSTEM Total Capacity (kw) PEAK % PEAK
Barton 85 3,040 2.81% Enosburg 174 5,740 3.03% Hardwick 1,166 6,930 16.82% Hyde Park 341 2,530 13.46% Jacksonville 26 1,180 2.23% Johnson 252 2,800 8.99% Ludlow 150 12,400 1.21% Lyndonville 749 13,480 5.56% Morrisville 887 9,170 9.67% Northfield 137 5,330 2.56% Orleans 21 3,570 0.59% Swanton 1,109 10,430 10.63%
TOTAL 5,097 76,600 6.65% Act 99 called for the Public Service Board to re-design the net metering program, taking into account a number of broad policy goals including consistency with state renewable energy and greenhouse gas goals and notably a focus on cost - both limiting cross-subsidization and ensuring that rates for net metering customers take into account the actual cost to construct those systems. Draft rule revisions are still being finalized, with wide variations between drafts that create significant uncertainty with regard to Net Metering compensation and penetration rates. This IRP models addresses this uncertainty through the load forecast and forecast error variables described in Sections

10
4.5 and 4.6. Resource decisions will use best available and most current infomration to estimate Net Metering generation and costs, and continue to stress those variables to understand the impacts of variances from the base case. Future IRP’s will take into account known Net Metering rules at the time of development for this rapidly evolving State program. VPPSA supports the continued development of net metering consistent with Vermont statute and Public Service Board rules, and will continue to reflect current understanding of net metering and impacts on its systems in resource planning decisions.
4.3 Vermont Renewable Energy Standard Act 56 of 2015 established a Renewable Energy Standard (RES) that requires VPPSA utilities to:
• Meet 55% of its retail sales with renewable resource in 2017, increasing to 75% by 2032;
• Meet 1% of its retail sales with in-State "distributed generation" in 2017, increasing to 10% by 2032;
• Meet 2% of its retail sales with as-yet undefined "Energy Transformation Projects" in 2019, increasing to 10.67% by 2032.
Notably, Act 56 gave VPPSA utilities the option of complying with the statute in aggregate or meeting the requirements individually. At the time of filing of this IRP, the RES had just been passed, and proceedings had not yet started to define the parameters within which the goals would need to be met. Given uncertainty surrounding RES, the Vermont Renewable Energy Standard was included as a key variable to be stressed. This variable was stressed at three levels - the base case assuming that resources were acquired that meet the requirements above, at 0%, assuming a political removal of the RES requirements, and at 175%, representing RES requirements 75% above base case. VPPSA plans to meet the obligations of the RES, and has modeled each scenario as meeting the requirements of RES. Given the timing of Act 56's passage, this modeling was done on an economic basis only -- estimating the cost of compliance through the use of estimated Renewable Energy Credit (REC) value. These varied between Tier I and Tiers II/III. Tier I compliance is based on the cost associated with out-of-state existing facility RECs. Tier II and III compliance rates were based on an estimate of future Massachusetts Class I REC prices. This was used as a proxy under the assumption that in-state developers could have the option of either selling RECs to Vermont utilities and/or selling them out-of-state, effectively making their market price the same. Tier III compliance costs are set to the same as Tier II, becasue Tier II resources are eligible to meet those requirements, and because of the significant uncertainty around the Tier III design at the time of writing. The values are then stressed in two ways, both with regard to the price estimate and with regard to the amount of requirement as described above --
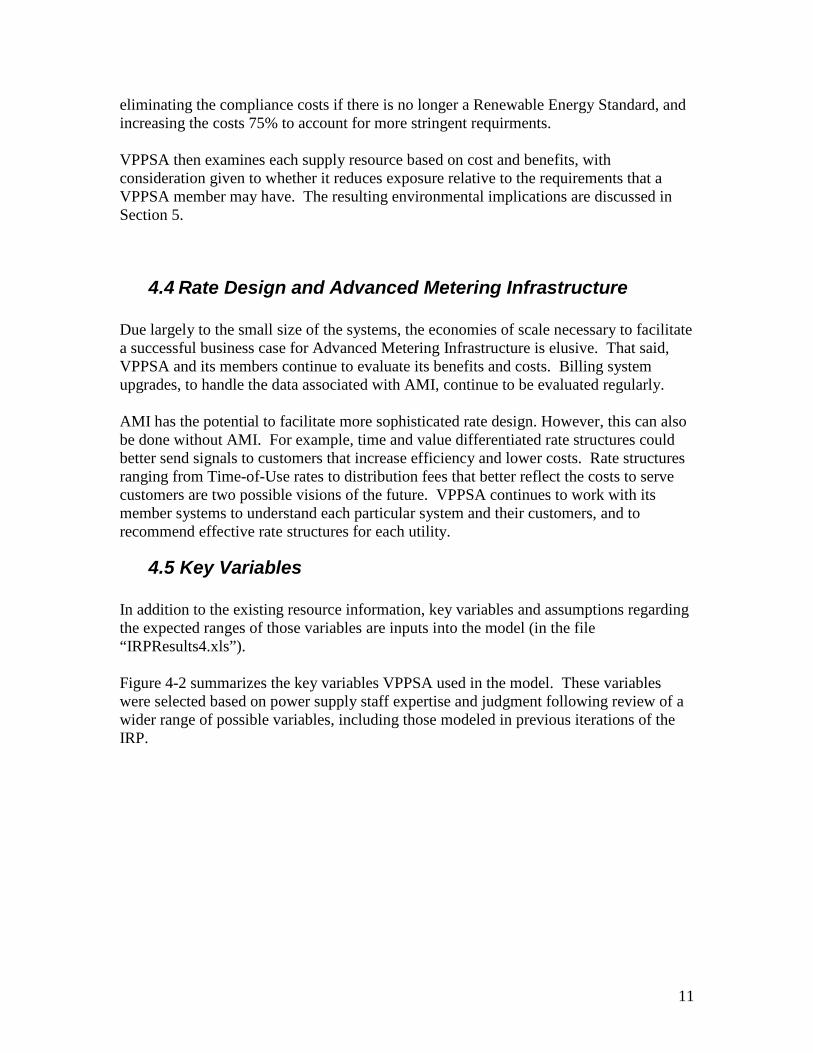
11
eliminating the compliance costs if there is no longer a Renewable Energy Standard, and increasing the costs 75% to account for more stringent requirments. VPPSA then examines each supply resource based on cost and benefits, with consideration given to whether it reduces exposure relative to the requirements that a VPPSA member may have. The resulting environmental implications are discussed in Section 5.
4.4 Rate Design and Advanced Metering Infrastructure
Due largely to the small size of the systems, the economies of scale necessary to facilitate a successful business case for Advanced Metering Infrastructure is elusive. That said, VPPSA and its members continue to evaluate its benefits and costs. Billing system upgrades, to handle the data associated with AMI, continue to be evaluated regularly. AMI has the potential to facilitate more sophisticated rate design. However, this can also be done without AMI. For example, time and value differentiated rate structures could better send signals to customers that increase efficiency and lower costs. Rate structures ranging from Time-of-Use rates to distribution fees that better reflect the costs to serve customers are two possible visions of the future. VPPSA continues to work with its member systems to understand each particular system and their customers, and to recommend effective rate structures for each utility.
4.5 Key Variables In addition to the existing resource information, key variables and assumptions regarding the expected ranges of those variables are inputs into the model (in the file “IRPResults4.xls”). Figure 4-2 summarizes the key variables VPPSA used in the model. These variables were selected based on power supply staff expertise and judgment following review of a wider range of possible variables, including those modeled in previous iterations of the IRP.

12
Figure 4-2: Key Variable Ranges
Input Variables Low
NPV $ Base NPV $
High NPV $
Std Dev
Delivered Natural Gas Prices 29.2% 100.0% 170.8% 35.4% Implied Heat Rate 63.0% 100.0% 137.0% 18.5% LMP Basis to HUB 97.9% 100.0% 102.1% 1.1%
VT Renewable Energy Standard 0.0% 100.0% 175.0% Electric Vehicles 50.0% 100.0% 140.0% Regional Network Service Rates 82.3% 100.0% 117.7% 8.9%
Capacity Load Obligation 94.8% 100.0% 110.5% 5.2% Monthly Peak (Trans) 90.0% 100.0% 110.0%
FCA Clearing Prices 25.9% 100.0% 211.2% 37.1% FRM Clearing Prices 42.2% 100.0% 157.8% 28.9%
Renewable Energy Credits 10.0% 100.0% 120.0% Load Forecast -3.7% 0.0% 3.7% Load Forecast Error Percentage -3.0% 0.0% 3.0% Inflation 49.3% 100.0% 150.7% 50.7%
Discount rate 84.6% 100.0% 115.4% 0.50% Each variable has a base-case value which represents current market conditions or the best information available for that variable today. Each variable also has corresponding high and low values which are used to provide sensitivity analysis related to that variable, based on one or two standard deviations away from the base case, depending on the variable. The determination of the standard deviation is based on an examination of fit within the confines of historical data taking into account changes that are not reflected in that data. This allows the cost for the resource mix to be stress tested for the low to high ranges of each variable, providing a range of potential results. The above table shows the degree to which the high and low cases vary from the base case. A complete description of inputs and key variables is provided in the Appendix. Figure 4-3 depicts the first year values of each variable.

13
Figure 4-3: Key Variable Values in 2017
Input Variables Low NPV $ Base NPV $ High NPV $ Delivered Natural Gas Prices $ 1.67 $ 5.73 $ 9.79
Implied Heat Rate 5.26 8.34 11.43 LMP Basis to HUB -1.18% -1.20% -1.23%
VT Renewable Portfolio Standard $ - $ 34.04 $ 59.56
Electric Vehicles 56 111 156 Regional Network Service Rates $ 7.54 $ 9.17 $ 10.79
Capacity Load Obligation 76,808 81,062 89,572 Monthly Peak (Trans) 56,507 62,785 69,064 FCA Clearing Prices $ 2.14 $ 8.29 $ 17.50 FRM Clearing Prices $ 1.49 $3.54 $ 5.58
Renewable Energy Credits $ 5.39 $ 53.89 $ 64.66 Load Forecast 364,637 378,647 392,657
Load Forecast Error Percentage 367,287 378,647 390,006 Inflation 1.06% 2.14% 3.23%
Discount rate 2.8% 3.3% 3.8%
As can be seen in the above figure, the base case estimation for natural gas fuel price is estimated to be $5.73/MMBtu in 2017. The low case is calculated by taking 29.2% (two standard deviations) of the base case, or $1.67/MMBtu. The high case is calculated by taking 170.8% of the base case value (two standard deviations), for a value of $9.79/MMbtu. Each variable is adjusted up and down around the base case value using the percentages identified in figure 4-2. In this way sensitivity to each variable can be calculated in the analysis. A detailed list of all variables and resource inputs are summarized in the appendix.
4.6 Load Forecast A critical component of ongoing evaluation of resources relative to need is the load forecast. VPPSA maintains long term energy (monthly resolution) and peak (daily resolution) regression models as an integral part of its strategy of continually reviewing its member system's position, facilitating effective procurement of energy resources to fit projected requirements. These models, originally based on logic from the previously filed IRP, have been substantially revamped in the past few years to better account for emerging trends and fundamental changes to system load. Due to significant progress from statewide energy programs as Energy Efficiency implementation through Efficiency Vermont, Net Metering, and the Standard Offer program, as well as the changing economic climate across Vermont (and nationwide), the models are limited to the use of historical data from the last 10 years. While many member systems are experiencing

14
relatively little annual load variation, a few have seen more significant changes. For these systems, the historical data was limited to a shorter window than 10 years. Key Drivers: Part of the strategy to develop a set of sustainable, effective models has been to keep them as simple as possible while still including all measures that significantly impact, or are expected to significantly impact load. This involves evaluating a number of potential key drivers and only including those that produce the most significance in a sensible manner. VPPSA has classified three types of variables included in the models to better distinguish their usefulness in this report. Default variables that can be found in all models, system specific long term drivers and system specific fundamental change variables. Each type of variable is discussed, in turn, below. Default variables include weather drivers (heating and cooling degree days) as well as variables to allow the model to decipher from month to month and, in the case of the peak model, variables to enable the model identify holidays. In the case of weather, a ten year average of normal weather is used moving forward in the energy models and the rank-and-average method1 has been used in the demand model to better capture the extreme weather conditions that often induce peak demand. These weather variables are transformed to degree days before being utilized in the regression. While these default variables carry significant weight and are able provide a shape to the projected load on a monthly (daily for demand) basis, they do nothing to account for any overall upward or downward trend looking forward. System specific long term drivers are utilized to accomplish this goal. System specific long term drivers are used to drive the model’s long term trend, and are based on economic and legislative energy initiatives. VPPSA uses a pool of variables from various sources as described in the table below to provide the model with this long-term vision. Among many systems, the most notable driver of long term load tends to be energy efficiency. The second most significant is generally some type of economic indicator such as unemployment or construction earnings. Energy efficiency appears to be the most significant because loads have historically been fairly flat across member systems, regardless of the health of the economy. Meanwhile, efficiency measures appear to continue to result in a sustained meaningful effect on load. A projection of the impacts of net metering was initially included in the load forecasts, however it had, at best, a minimal impact on the forecast and in many cases the models were unable to latch onto it as a driver. It is believed this is due to the relatively recent uptick in net metering and as more time goes by, the models will find this information increasingly more significant. System specific fundamental change variables are used to indicate to the model when a fundamental change occurred in a specific utility’s energy usage. They are used to indicate an exception to the general trend. This is often due to the addition or removal of 1 A description of the rank-and-average method can be found at https://www.itron.com/PublishedContent/Defining%20Normal%20Weather%20for%20Energy%20and%20Peak%20Normalization.pdf

15
a major customer, such as a manufacturing plant, but can also be due to a variety of other reasons including distribution system upgrades/changes. A handful of these exceptions can be found throughout VPPSA member territories. Even after these variables are included, there may still be a reduction to the model’s accuracy as a result of the fundamental change; however these variables significantly reduce this impact. All variables added to the model are tested for their effectiveness. We evaluate the t-stat and coefficient that the model assigns to variables to determine: 1) if the variable is significant/useful and 2) if the variable is significant, is it acting appropriately (e.g. as energy efficiency increases, a reduction in load would be expected. A modeled increase in load would indicate that the variable is not acting appropriately and is not useful). In the case of heating and cooling degree days, the relationship between load and temperature is evaluated to choose the threshold heating/cooling values that capture each individual system’s unique relationship to weather. This means that while the model of one system may use, for example, 60°F as a starting point for heating degree days, another may use 50°F. The same goes for cooling degree days. Data sources: VPPSA uses a several different suppliers to provide much of the data that is ingested by the models and used to predict load. On the next page is a table outlining our main data sources. System specific drivers are then described in more detail.
Figure 4-4: Load Forecast Data Sources Data Type Variable(s) Source How We Handle Future Historical Loads
Historical Load – increased by Standard Offer allotment
VELCO Model Predicted
Net Metering Net Metering Certificate of Public Good approval MWs
Public Service Department Set to increase to 4% in 2014 then hold steady.
Electric Cars Electric Car Saturation Forecasts
Vermont Energy Investment Corporation (Drive Electric Vermont) – VTrans EV Charging Plan (7/11/2013)
Carry trend forward
Weather Temperature National Weather Service Energy Models: 10-year average Demand Models: Rank-and-Average
Energy Efficiency
Accumulated Efficiency Vermont Savings Claims*
Vermont Energy Investment Corporation (Efficiency Vermont)
Use forecast through 2031 then hold savings steady. Accumulated savings used*
Economic Indicators
Construction Earnings Wealth Index Population
Woods and Poole Economics Inc.
Woods and Poole forecast
Economic Indicators
Vermont Unemployment Modeled from a blend Woods and Poole and Forecast.org data
Regression model using Bureau of Labor Statistics for historical national and Vermont data. Forecasts.org for National Unemployment forecast. Beyond Forecasts.org forecast, national unemployment gradually reverts to the last 10 year average over the following 10 years. Woods and Poole forecast for Vermont Employment (historical and future)
*Note: EVT Savings claims in the models are not allowed to decrease if savings expirations result in a year-over-year decrease in cumulative savings.

16
System Specific Drivers ContructionEarnings: Data for this variable is derived from the 2013 Woods and Poole State Profile dataset for Vermont. It represents total statewide construction earnings historically and forecasted forward. This had been used as a long term driver, where it fits, for many of the VPPSA utilities as it is a good indicator of both economic activity and population. WealthIndex: Data for this variable is derived from the 2013 Woods and Poole State Profile dataset for Vermont. It represents statewide wealth in relation to the remainder of the country. This had been used as a long term driver, where it fits, as it can be used to show how Vermont’s economy is performing relative to the rest of the country. The logic is that if Vermont’s economy is thriving faster than the rest of the country, it would spur more rapid development. The contrary is a true as well. VermontUnemployment: Data for this variable is derived from the 2013 Woods and Poole State Profile dataset for Vermont as well as a national unemployment rate. The Woods and Poole dataset used is the statewide employment per person determined by dividing total unemployment by population. This, along with a national unemployment rate is placed into a regression model to come up with a predicted Vermont unemployment rate, which is then used in some load models. The Vermont unemployment rate is considered a reasonable indicator of economic activity in the state. Population: Data for this variable is derived from the 2013 Woods and Poole State Profile dataset for Vermont. It represents statewide wealth in relation to the remainder of the country. This had been used as a long term driver, where it fits, as it can be used to show how Vermont’s population has fluctuated over time and how it is forecast to change in the future. While nearly all of the forecast models use one of the drivers discussed above, they also almost nearly all use an Energy Efficiency variable called EVT filled. This variable is intended to describe energy efficiency contributions to load reduction and is explained further in the next section. Due to the rapid adoption of energy efficient measures over the years, in some cases this variable in itself becomes the sole long term driver of load for an individual utility. In these instances, drivers mentioned above become insignificant and are not included in the final model. Energy Efficiency: As energy efficiency (EE) efforts continue to impact the load of utilities across the state, VPPSA revamped the method it uses to incorporate EE into its load forecast. Historically, a simple trending variable was used to “capture” general load trends, including those due to EE programs. VPPSA now examines EE savings data provided by Efficiency Vermont and incorporates both past and expected future savings into nearly all of its energy models. The method involves first looking at claimed EVT savings, per system. This number is divided out by the expected lifetime savings to get a “lifetime” of the savings (typically around 10 or 11 years, but this varies).
17
Further considerations: While some emerging technologies, such as net metering systems, have historical data to feed into the regression models, there are some where this data is scarce or not yet available due to the newness of the technology. In these cases, the effects of these technologies are not captured directly in the regression models. Forecasts, where available, are used to adjust the modeled load looking forward. VPPSA has recently considered two of these technologies that have the potential to significantly impact energy requirements looking forward: cold climate heat pumps and electric cars. It is expected that over the next 10-20 years, heat pumps will continue to be installed offsetting the need for resistance and fossil area heat sources. Efficiency Vermont provided information about what it expects to be able to claim as savings for this measure, but this data does not provide a clear picture as to what the total effect on load would be. We have been unable to discover a source for forecast information that we feel comfortable with, however it appears any significant impact to load is still years away. VPPSA expects to include more on this in the future IRP filings. In addition, VPPSA will be watching for further information on the conversion of domestic water heaters, and clothes dryers to heat pump technology as well. Electric vehicle and plug-in/plug-in hybrid electric (collectively referred to as “EV”) vehicle saturation forecasts are starting to become more widely available. VPPSA has obtained some of these forecasts and some information regarding the average impact each electric vehicle has on load. When predicting the effects electric cars would have on load, VPPSA considered three saturation forecasts, all provided in the VTrans EV Charging Plan (7/1//13), one adjusted for Vermont specific conditions from the Energy Information Administration (EIA), another from the Center for Automotive Research (CAR) and one from the Vermont Air Pollution Control Division. The EIA forecast appears inappropriate in this context as the derivation was substantially underestimating EV ownership in 2013 thus VPPSA focused on the CAR and Vermont Air Pollution Control Division forecasts.. The CAR forecast is an annual forecast that predicts saturation from 2013-2015 and a simple trend was used to continue forward. The Air Pollution Control Division forecast provided a range of ownership projections of 10,000-23,000 by 2023. This is based on legislative regulations requiring manufacturers to produce additional Zero-Emission Vehicles in the future. VPPSA split this forecast into a low forecast (10,000) and high forecast (23,000) case and interpolated each backwards based on the expected ownership counts for 2013 in the CAR forecast. This was done because the CAR projection for the year looks reasonable based on current 2013 trends. This trend was then carried forward for each the high and low cases beyond 2023. These three forecasts were then examined annually through 2034 and averaged to get a saturation that is used in the load forecast. After the saturation was developed, VPPSA determined the weighted average battery size based on current EV registrations to be 12.5 kWh. It was assumed that each car would be charged fully once per day and that 80% of the battery is available to the user, meaning

18
the battery is not allowed to drop below a 20% charge by the manufacturer due to decreased service life at full discharges. With these assumptions, the average load for each car, on an annual basis, is 365*0.8*12.5 or 3650kWh/year. It can be reasonably expected that battery capacity will increase over time as well as their ability to be depleted lower than 20%, increasing the impact each car will have and thus assuming a 12.5kWh battery is likely a conservative projection of load from electric vehicles. In addition, the forecasts used were trended forward beyond their last forecast year. As with all successful new technologies, adoption is expected to be more exponential in nature and thus more aggressive than we are assuming in this forecast. At the same time, we assumed each EV would be charged daily, a potentially optimistic assumption in the forecast. Considering all of these caveats, we believe the effect on load portrayed by our analysis are likely more conservative than what will actually occur and will need to be reexamined for the 2018 filing as more accurate longer range forecasts hopefully become available. It should also be noted that the impacts of rate design were not considered for this analysis - while rate designs may not affect overall annual consumption appropriately designed rates could impact the shape of the load. It is important to note that while electric vehicles, net metering, and energy efficiency will continue to have significant impacts on consumption, the framework under which the forecast is developed -- its treatment as a key variable -- allows VPPSA to stress the impacts of changes in load on the resource needs. This stressing (discussed further in the Appendix) ensures that VPPSA and its member utilities will be prepared in the event that any of its forecasts for these emerging technologies are incorrect. As noted in Figure 4-4, 10 year average historical weather is used to predict energy consumption, while a rank and average method is used for peak demand models. Historical and predicted weather patterns are a key data source in developing the energy forecast. It is important to stress the forecast for this key variable to ensure that the analysis of resources is based upon a robust forecast that encompasses a range of possible futures. The variable range for the Load Forecast is presented in Figure 4-2, while the methodology used to develop this range is presented in Appendix 1. The demand forecast (Capacity Load Obligation or "CLO") is stressed by two standard deviations of the average historical CLO, representing a reasonably wide range of potential outcomes given that the CLO in a given year is based on the utility's load in one hour of the year - a value that could vary widely depending on particular circumstances of the hour. Figure 4-5 shows the base, high, and low energy forecast. The high and low forecasts are the result of the combination of the Load Forecast and Load Forecast Error key variable ranges. Figure 4-6 presents the high, low, and base forecasts for VPPSA's Capacity Load Obligation.

19
Figure 4-5: Base, High, and Low Energy Forecast at VT Zone
Figure 4-6: Base, High, and Low Capacity Load Obligation
320
330
340
350
360
370
380
390
400
410
420
2015
2016
2017
2018
2019
2020
2021
2022
2023
2024
2025
2026
2027
2028
2029
2030
2031
2032
2033
2034
GW
h
High Base Low
60
65
70
75
80
85
90
95
100
MW
High Base Low

20
5. Model Output Description The resource model calculates power costs over a long-term (25-year) future planning period, summarizing results on a net present value ("NPV") basis for each resource mix. The NPV calculation represents the costs or value associated with each resource mix over the 25 year period taking into account inflation and the utility's Weighted Average Cost of Capital (WACC), applied as a discount rate. The lower the NPV value the lower the cost of the portfolio. If all other aspects of an evaluated portfolio (flexibility, diversity, etc.) are equal to alternative resource mixes, then the lower the cost of the portfolio, the more desirable it is. It is important to note that for VPPSA member municipal utilities, the WACC is low, relative to an investor owned utility. At approximately 3.25%, the WACC is commensurate with that of a societal discount rate of 3% - the general benchmark utilized in Vermont at this time (based on an estimate of the rate long-term federal Treasury bonds). This reflects that the time value of money for municipal utilities is approximately equal to that of society's. Thus, it is not necessary to analyze results from both a societal time value of money perspective and a ratepayer time value of money perspective, as they are effectively the same. The discount rate (the WACC) is still stressed as a key variable and as shown below, and it has a relatively high impact on results.
5.1. Scenarios and Portfolio Attributes VPPSA prepared 25 hypothetical supply scenarios as a reasonable set of options to serve future load needs. By evaluating these various power supply mixes using the IRP model, VPPSA was able to calculate a dollar net present value (“NPV”) for the various scenarios. Figure 5-1 describes the scenarios evaluated in this IRP.

21
Figure 5-1: Supply Scenarios
Supply Scenarios All Out-of-State Solar ("SolarOut") All Variable Contracts ("MktCon") All In-State Solar ("SolarIn") All Wind ("Wind") All Fixed Contracts ("FixCon") All Spot Market ("Spot")
Combinations of the Above (19 additional sets) SolarIn/FixCon SolarOut/SolarIn/MktCon SolarOut/SolarIn SolarOut/SolarIn/Wind SolarIn/MktCon SolarIn/MktCon/Wind SolarIn/Wind SolarOut/FixCon/MktCon SolarOut/FixCon FixCon/MktCon/Wind FixCon/MktCon SolarOut/MktCon/Wind FixCon/Wind SolarOut/SolarIn/FixCon/MktCon SolarOut/SolarIn/FixCon SolarOut/SolarIn/MktCon/Wind SolarIn/FixCon/MktCon SolarOut/SolarIn/FixCon/MktCon/Wind SolarIn/FixCon/Wind
The list of resources was constructed with a number of resource attributes in mind. Direction from the VPPSA Board of Directors influences greatly the attributes that impact policy selection. Portfolios were designed to evaluate the following attributes (not necessarily listed in order of importance):
Diversity. Increasing fuel diversity, resource diversity, and supplier diversity is considered desirable in a power supply mix, as it reduces risk of being over-reliant on one power source or counterparty. Diversity is especially important given the continued dominance of natural gas a fuel source in New England. In 2013, natural gas accounted for 43% percent of the total electric capacity in the region (and a greater amount of electric energy consumed) in New England. The result of this dependence on natural gas is that wholesale prices are volatile and reliability concerns have developed, especially in winter months when natural gas electric generators compete with space heating for limited natural gas supplies. Diversity in a resource mix mitigates concerns that arise when over-reliant on one fuel source.
Duration. The municipal systems’ power portfolio has historically provided stable cost power through long-term contracts and resource decisions. As resources expire, acquiring new resources with staggered end dates is an important priority. The goal is to have smaller blocks of resources expiring at regular intervals, rather than large blocks of power ending all at the same time. Duration can also be thought of as diversity in terms of timing of replacement of resources.

22
Achievability. The resource mix must be considered likely or able to be developed. For example, building a coal power plant was not considered in the analysis due to low likelihood of that option being pursued in Vermont or New England. There may also be practical maximum amounts of some resources if it is determined that those resources should be located in Vermont. This has been done for the solar resources with the annual utility-scale build for VPPSA systems limited to 10 MW. Reliability. Reliability refers to delivery and availability of the resource. A number of municipal systems have hydro-based power that is considered intermittent. It is important to value how the intermittent source of power delivers energy in relation to consumer energy needs (monthly shapes in particular). Power contracts, even when they have known delivery times and quantities, can be unreliable in the event of default or lack of delivery (see below under Credit Risk). Reliability can also impact owned units in the form of forced outages or fuel availability problems. Credit Risk. Counterparty credit risk is a very important aspect of doing business in today’s power markets. With bankruptcies of major entities such as Enron, Mirant, PGET, and Calpine, understanding credit risk is an essential function in any utility power planning group. The amounts of power provided by any one entity in the power portfolio should be balanced in order to protect against the event of a credit default or bankruptcy. Price alone cannot be used to judge the value of a contract. If the counterparty to a contract does not deliver due to a credit issue, utilities can be left with an unplanned purchase event and be at the mercy of prevailing market conditions. In those cases, the certainty and stability that was sought through contracts may not be realized. Flexibility. Flexibility in a power portfolio is important in order to take advantage of favorable changes in market conditions. As an example, generation that is dispatchable can be turned off to take advantage of times when the spot market is cheaper. Conversely, by having generation or contracts that are able to turn on when power prices spike, the power portfolio is insulated from significant market price volatility. VPPSA’s Peaker Project is a good example of a resource that can insulate a utility against high cost market conditions. In the event of extreme hot or cold temperatures, load levels generally increase dramatically. A peaking unit can ramp up quickly to cover those comparatively few hours of load and insulate a utility from extreme energy price spikes. At the same time, it provides flexibility to the region as reserve capacity available at times of need, in return for this availability the region compensates the facility even when it isn't running.
Another dimension of flexibility to be considered is the flexibility of physical generating assets to respond to market changes. In the example of capacity

23
requirements, VPPSA’s Peaker Project can be contrasted to a market contract for the purchase of capacity. A contract for capacity is limited to the product selected and does not adapt readily to changing market rules, and would have little to no additional value in the hypothetical scenario with prevailing high energy prices. However, a generator like the Peaker Project is available if market rules change to realize these high energy values (offsetting charges for consumption). Volatility – Understanding and mitigating volatility is an important attribute for any power resource portfolio, and a primary focus of VPPSA's member systems. Absent action to remove volatility, the municipal systems’ power portfolios are primarily exposed to natural gas and resulting power price volatility due to changing conditions in the wholesale markets. This exposure will increase as existing resources whose price is not natural gas or oil based expire. Future power resources are evaluated for their potential to dampen the effect of volatility.
5.2. SensIt Rather than rely on a simple dollar NPV calculation of base, high, and low forecasts of variable impacts to draw conclusions, the IRP model conducts a sensitivity analysis, using a software package known as “SensIt”, a sensitivity analysis add-in for Microsoft Excel. It performs sensitivity analysis on a worksheet based on changes in certain inputs and a specified output value (i.e. many inputs – one output) and allows VPPSA to perform "what-if" modeling. Sensitivity analysis allows VPPSA to determine which inputs or variables are significant (or even critical) cost drivers, thereby leading to a more thorough analysis of scenarios or resource options. This allows VPPSA to identify critical sources of uncertainty and risk associated with a power portfolio, which ultimately become risks to the 12 member utilities and their consumers. Understanding cost drivers allows for a deeper understanding of the amount of volatility or variation they impart to the portfolio. As described above this is an important factor in determining whether or not the portfolio is desirable. For example, assume portfolio A has a 1% lower NPV cost value than portfolio B. On the surface, both portfolios are perceived as roughly equal, with portfolio A being preferred because of its lower price. However, a the sensitivity analysis shows that portfolio A is more likely to fluctuate with changes in the price for natural gas than portfolio B. A risk averse decision maker would opt for portfolio B over A due to portfolio B being less volatile, despite its higher price SensIt creates "tornado charts" which allow visual identification of the swing or impact a variable has on the end result. For a decision maker trying to understand risk this is a very helpful tool. A tornado chart displays the results of single-factor sensitivity analysis for a specified end result. The chart technique shows how much a variable can change the specified results and therefore provides a measurement of uncertainty for each variable

24
tested. The larger the black rectangle the more sensitive the outcome is to the particular variable (the percentage values for each variable indicate the variable range relative to baseline while the bars indicate the impact on the NPV power supply cost of service).
Figure 5-2: Tornado Chart Example
In the above tornado chart the cost of power over 20 years is most sensitive to changes to the price of natural gas. The largest black rectangle represents the largest dollar change from the low case to high case. In this example, natural gas caused the NPV of the cost of power to be as low as $579 million and as high as $713 million - a potential swing of $134 million. The next largest swing in this example was the variable associated with the value of the implied heat rate of the portfolio. This variable caused the NPV power supply cost to be as low as $611 million and as high as $681 million, a potential swing of $70 million. The smaller the delta between the low case and high case, the smaller the black rectangle area is. Therefore, in this scenario it can be seen that variables such as penetration of electric vehicles and LMP Basis to Hub had very little financial impact on the cost of power.
29.2%
63.0%
115.4%
82.3%
94.8%
120.0%
90.0%
0.0%
25.9%
157.8%
-3.7%
-3.0%
49.3%
50.0%
97.9%
170.8%
137.0%
84.6%
117.7%
110.5%
10.0%
110.0%
175.0%
211.2%
42.2%
3.7%
3.0%
150.7%
140.0%
102.1%
$550,000,000 $600,000,000 $650,000,000 $700,000,000 $750,000,000
Delivered Natural Gas Prices
Implied Heat Rate
Discount rate
Regional Network Service Rates
Capacity Load Obligation
Renewable Energy Credits
Monthly Peak (Trans)
VT Renewable Portfolio Standard
FCA Clearing Prices
FRM Clearing Prices
Load Forecast
Load Forecast Error Percentage
Inflation
Electric Vehicles
LMP Basis to HUB
20 YR NPV POWER COSTS
Example Scenario

25
5.3. Expected Value Calculations VPPSA has included a process in its IRP that gives probability weightings to variables and calculates an expected NPV value. This aspect of the analysis allows decision makers to see the predicted change in costs assuming various probabilities of the variables. This tests the cost conclusions for each scenario by factoring in probability assignments. The probability weightings were used to calculate the expected NPV value of each resource mix. They were developed by the VPPSA power supply team. Each team member individually, without other's knowledge, assigned a probability weighting to the base, high, and low cases based on their individual expertise and projections of the future. Each of these probability weightings were then averaged to determine the probability weighting actually applied to each input variable. For example, collectively, the power supply team believed there would be only a 5% likelihood that the low electric vehicle penetration forecast would occur, with a 60% chance the base case projection was correct, and a 35% chance the high penetration coming to fruition. Figure 5-3 lists the final probability weightings used for each Sensit adjusted input variable used in preparing this filing.

26
Figure 5-3: Probability Weightings Used for Expected Value Calculation
Probability of Low
Probability of Base
Probability of High
Delivered Natural Gas Prices 25.00% 55.00% 20.00% Implied Heat Rate 30.00% 50.00% 20.00% LMP Basis to HUB 20.00% 40.00% 40.00%
VT Renewable Portfolio Standard 27.50% 55.00% 17.50%
Electric Vehicles 5.00% 60.00% 35.00% Regional Network Service Rates 10.00% 45.00% 45.00%
Capacity Load Obligation 10.00% 75.00% 15.00% Monthly Peak (Trans) 15.00% 57.50% 27.50% FCA Clearing Prices 5.00% 70.00% 25.00% FRM Clearing Prices 40.00% 41.67% 18.33%
Renewable Energy Credits 36.67% 48.33% 15.00% Load Forecast 25.00% 50.00% 25.00%
Load Forecast Error Percentage 25.00% 50.00% 25.00% Inflation 25.00% 35.00% 40.00%
Discount rate 25.00% 35.00% 40.00%
Comparing both NPV and Expected NPV numbers to similar results for other scenarios gives a picture of the variability (around the simple NPV) for all scenarios based on the same key variables and key variable probabilities. As shown in the results, the Expected NPV of every scenario was higher than the NPV - this shows that the power supply team at the time believed there was a greater likelihood of higher costs relative to the base case than lower costs. In this instance, the Expected NPV and NPV differed by roughly the same across scenarios. However, if a scenario's largest variable swing was related to FRM prices (where the VPPSA power supply team expected a higher likelihood of low prices than high), this may have shown a greater difference between Expected NPV and NPV between scenarios. This allows the decision maker to pick a resource portfolio based on more information than would be possible based on just a simple NPV calculation.
5.4. Results By using sensitivity techniques the output of each resource scenario is compared to other scenarios. This allows VPPSA to narrow in on the least cost scenario, and will also allow VPPSA to assess other resource characteristics such as volatility and uncertainty. Once all of the variables and resources input into the model, all 25 scenarios are characterized, and the model is run. The output from all 25 runs is summarized in Figure 5-4:

27
Figure 5-4: Summary of Results
Scenario Scenario NPV ($)Expected NPV
Value ($) Largest VariableLargest Variable
Swing ($)Largest Variable
Swing (%) Second Largest VariableSecond Largest
Variable Swing ($)Second Largest
Variable Swing (%)Probabilistic Departure
From Base ($)1 Spot $646,302,451 $675,381,657 Delivered Natural Gas Prices $133,966,938 42% Implied Heat Rate $69,949,222 11% $29,079,2072 SolarOut $637,875,357 $668,388,045 Delivered Natural Gas Prices $113,727,870 36% Regional Network Service Rates $65,635,847 12% $30,512,6893 SolarIn $622,557,113 $654,132,624 Delivered Natural Gas Prices $100,698,133 31% Regional Network Service Rates $65,635,847 13% $31,575,5124 FixCon $651,829,603 $680,451,996 Discount rate $66,376,732 21% Regional Network Service Rates $65,635,847 20% $28,622,3935 Mkt Cont $634,800,132 $661,056,589 Regional Network Service Rates $65,635,847 23% Discount rate $64,185,668 22% $26,256,4576 Wind $644,672,738 $677,677,374 Delivered Natural Gas Prices $100,322,738 30% Discount rate $65,778,281 13% $33,004,6367 SolarIn/FixCon $625,091,159 $657,321,596 Regional Network Service Rates $65,635,847 19% Discount rate $63,280,848 17% $32,230,4378 SolarOut/SolarIn $614,130,019 $643,661,791 Delivered Natural Gas Prices $80,459,065 23% Regional Network Service Rates $65,635,847 15% $29,531,7739 SolarIn/Mkt Cont $617,088,712 $646,956,630 Regional Network Service Rates $65,635,847 19% Discount rate $62,253,297 17% $29,867,917
10 SolarIn/Wind $620,927,400 $652,211,465 Renewable Energy Credits $77,201,347 21% Delivered Natural Gas Prices $67,053,933 16% $31,284,06611 SolarOut/FixCon $640,409,403 $668,069,305 Regional Network Service Rates $65,635,847 18% Discount rate $65,066,175 17% $27,659,90212 FixCon/Mkt Cont $643,368,097 $671,690,221 Regional Network Service Rates $65,635,847 22% Discount rate $65,295,611 22% $28,322,12413 FixCon/Wind $647,206,784 $681,302,906 Discount rate $66,041,716 18% Regional Network Service Rates $65,635,847 18% $34,096,12114 SolarOut/SolarIn/FixCon $615,819,383 $646,735,844 Regional Network Service Rates $65,635,847 19% Discount rate $62,199,484 17% $30,916,46115 SolarIn/FixCon/Mkt Cont $620,600,877 $650,945,325 Regional Network Service Rates $65,635,847 20% Discount rate $62,683,625 19% $30,344,44816 SolarIn/FixCon/Wind $622,616,764 $653,312,075 Renewable Energy Credits $77,201,347 25% Regional Network Service Rates $65,635,847 18% $30,695,31117 SolarOut/SolarIn/Mkt Cont $610,484,419 $640,031,835 Regional Network Service Rates $65,635,847 19% Discount rate $61,514,451 17% $29,547,41618 SolarOut/SolarIn/Wind $612,500,306 $642,397,153 Renewable Energy Credits $77,201,347 23% Regional Network Service Rates $65,635,847 17% $29,896,84719 SolarIn/Mkt Cont/Wind $617,281,799 $647,614,439 Renewable Energy Credits $77,201,347 25% Regional Network Service Rates $65,635,847 18% $30,332,64020 SolarOut/FixCon/Mkt Cont $635,919,121 $663,210,801 Regional Network Service Rates $65,635,847 21% Discount rate $64,468,953 20% $27,291,68021 FixCon/Mkt Cont/Wind $642,716,502 $675,764,863 Regional Network Service Rates $65,635,847 20% Discount rate $65,444,494 20% $33,048,36122 SolarOut/Mkt Cont/Wind $632,600,044 $663,951,190 Regional Network Service Rates $65,635,847 19% Discount rate $64,275,319 18% $31,351,14623 SolarOut/SolarIn/FixCon/Mkt Cont $612,280,241 $642,293,914 Regional Network Service Rates $65,635,847 21% Discount rate $61,718,896 18% $30,013,67224 SolarOut/SolarIn/Mkt Cont/Wind $609,420,223 $638,052,989 Renewable Energy Credits $77,201,347 25% Regional Network Service Rates $65,635,847 18% $28,632,76625 SolarOut/SolarIn/FixCon/Mkt Cont/Wind $611,415,730 $642,206,625 Renewable Energy Credits $77,201,347 25% Regional Network Service Rates $65,635,847 18% $30,790,896

28
Figure 5-4 does not rank in order of preference at this stage. In the appendix section, details of cost and each scenario’s tornado chart are provided for a more detailed review of each resource mix. In interpreting these results, the key values used to evaluate the resource scenarios were:
NPV Calculation Expected NPV Calculation Largest Variable Swing (in terms of $) Second Largest Variable Swing (in terms of $)
To allow a comparison of multiple variable results, weightings were assigned to each the values as follows:
Figure 5-5: Weighting Values for Ranking Purposes
Value Weighting NPV 40% Expected NPV 45% Largest Variable Swing ($) 10% Second Largest Variable Swing ($) 5%
The expected value was given the highest ranking of 45%, followed by the NPV calculation which was given a ranking of 40%. Consistent with least cost planning, these two attributes were weighted the highest as they drive the actual costs for the scenario. The Expected NPV value is weighted slighly more because as described above, it takes into account the expertise of the power supply team, allowing for a more nuanced estimate of cost. The difference, however, is kept minor, recognizing that unpredicatable events could change the course of projections. Volatility and variability are important considerations as well, as they affect the likelihood of achieving the anticipated results. Providing weight to this volatility accounts for each portfolio's risk associated with swings in any one or two variables. These values were given a combined 15% rating in the ranking calculation. While volatility is important, selecting the lowest expected cost resource mix is deemed a higher priority for the municipal systems customers. Figure 5-6 shows the scenarios ranked in order of the weighting values.

29
Figure 5-6: Scenarios ranked on the basis of NPV, Expected NPV, and Largest Two Variable Swings
Scenario Scenario NPV ($)Expected NPV
($) Largest VariableLargest Variable
Swing ($)Largest Variable
Swing (%) Second Largest VariableSecond Largest
Variable Swing ($)Second Largest
Variable Swing (%)
Probabilistic Departure From
Base ($) Ranking Value 24 SolarOut/SolarIn/Mkt Cont/Wind $609,420,223 $638,052,989 Renewable Energy Credits $77,201,347 25% Regional Network Service Rates $65,635,847 18% $28,632,766 $541,893,86117 SolarOut/SolarIn/Mkt Cont $610,484,419 $640,031,835 Regional Network Service Rates $65,635,847 19% Discount rate $61,514,451 17% $29,547,416 $541,847,40025 SolarOut/SolarIn/FixCon/Mkt Cont/Wind $611,415,730 $642,206,625 Renewable Energy Credits $77,201,347 25% Regional Network Service Rates $65,635,847 18% $30,790,896 $544,561,20023 SolarOut/SolarIn/FixCon/Mkt Cont $612,280,241 $642,293,914 Regional Network Service Rates $65,635,847 21% Discount rate $61,718,896 18% $30,013,672 $543,593,88718 SolarOut/SolarIn/Wind $612,500,306 $642,397,153 Renewable Energy Credits $77,201,347 23% Regional Network Service Rates $65,635,847 17% $29,896,847 $545,080,7688 SolarOut/SolarIn $614,130,019 $643,661,791 Delivered Natural Gas Prices $80,459,065 23% Regional Network Service Rates $65,635,847 15% $29,531,773 $546,627,512
14 SolarOut/SolarIn/FixCon $615,819,383 $646,735,844 Regional Network Service Rates $65,635,847 19% Discount rate $62,199,484 17% $30,916,461 $547,032,4429 SolarIn/Mkt Cont $617,088,712 $646,956,630 Regional Network Service Rates $65,635,847 19% Discount rate $62,253,297 17% $29,867,917 $547,642,218
19 SolarIn/Mkt Cont/Wind $617,281,799 $647,614,439 Renewable Energy Credits $77,201,347 25% Regional Network Service Rates $65,635,847 18% $30,332,640 $549,341,14415 SolarIn/FixCon/Mkt Cont $620,600,877 $650,945,325 Regional Network Service Rates $65,635,847 20% Discount rate $62,683,625 19% $30,344,448 $550,863,51310 SolarIn/Wind $620,927,400 $652,211,465 Renewable Energy Credits $77,201,347 21% Delivered Natural Gas Prices $67,053,933 16% $31,284,066 $552,938,95116 SolarIn/FixCon/Wind $622,616,764 $653,312,075 Renewable Energy Credits $77,201,347 25% Regional Network Service Rates $65,635,847 18% $30,695,311 $554,039,0663 SolarIn $622,557,113 $654,132,624 Delivered Natural Gas Prices $100,698,133 31% Regional Network Service Rates $65,635,847 13% $31,575,512 $556,734,1327 SolarIn/FixCon $625,091,159 $657,321,596 Regional Network Service Rates $65,635,847 19% Discount rate $63,280,848 17% $32,230,437 $555,558,8095 Mkt Cont $634,800,132 $661,056,589 Regional Network Service Rates $65,635,847 23% Discount rate $64,185,668 22% $26,256,457 $561,168,386
20 SolarOut/FixCon/Mkt Cont $635,919,121 $663,210,801 Regional Network Service Rates $65,635,847 21% Discount rate $64,468,953 20% $27,291,680 $562,599,54122 SolarOut/Mkt Cont/Wind $632,600,044 $663,951,190 Regional Network Service Rates $65,635,847 19% Discount rate $64,275,319 18% $31,351,146 $561,595,40311 SolarOut/FixCon $640,409,403 $668,069,305 Regional Network Service Rates $65,635,847 18% Discount rate $65,066,175 17% $27,659,902 $566,611,8422 SolarOut $637,875,357 $668,388,045 Delivered Natural Gas Prices $113,727,870 36% Regional Network Service Rates $65,635,847 12% $30,512,689 $570,579,342
12 FixCon/Mkt Cont $643,368,097 $671,690,221 Regional Network Service Rates $65,635,847 22% Discount rate $65,295,611 22% $28,322,124 $569,436,2031 Spot $646,302,451 $675,381,657 Delivered Natural Gas Prices $133,966,938 42% Implied Heat Rate $69,949,222 11% $29,079,207 $579,336,881
21 FixCon/Mkt Cont/Wind $642,716,502 $675,764,863 Regional Network Service Rates $65,635,847 20% Discount rate $65,444,494 20% $33,048,361 $571,016,5986 Wind $644,672,738 $677,677,374 Delivered Natural Gas Prices $100,322,738 30% Discount rate $65,778,281 13% $33,004,636 $576,145,1014 FixCon $651,829,603 $680,451,996 Discount rate $66,376,732 21% Regional Network Service Rates $65,635,847 20% $28,622,393 $576,854,705
13 FixCon/Wind $647,206,784 $681,302,906 Discount rate $66,041,716 18% Regional Network Service Rates $65,635,847 18% $34,096,121 $575,354,985Weighted Value 40% 45% NA 10% NA NA 5% NA 0% 100%
Please note that the default sort option for this sheet is on the "Expected NPV ($)" column. When the sheet is opened all values have been sorted by the "Expected NPV ($)."
NPV Sort E-NPV Sort LVS Sort LVS% Sort SLVS Sort SLVS% Sort PDFB Sort Ranking Sort
30
As shown in Figure 5-6, portfolios with combinations of solar (both in and out of state) along with market contracts rise to the top of the list with the lowest NPV costs and the least amount of variability. A number of observations are worth noting:
• The six lowest cost scenarios differ on a net present value by less than one percent over twenty years, however the volatility of the largest variables differs between these scenarios.
• Each of the seven lowest cost scenarios have a combination of in- and out-of- state utility scale solar as major components of the portfolio going forward. In addition, the next seven lowest cost scenarios also had in-state solar.
• The value of Renewable Energy Credits (RECs)was the variable with the largest amount of uncertainty for 6 out of the first 12 lowest cost options. Regional Network Service (RNS) charges was the variable with the largest amount of uncertainty for 5 of the first 12 lowest cost options. It was the variable with the first or second largest amount of uncertainty for 22 of the 25 scenarios.
• The addition of wind to the portfolio increased the amount of volatility associated with the portfolio significantly. For example, Scenario 17 with in and out of state solar and Market contracts resulted in RNS rates creating a potential $65 million swing as the largest variable, while Scenario 24 with the same resoruces plus wind generation created a potential $77 million swing in RECs as the largest variable.
• The Spot Market scenario (not locking in any resource and instead riding prevailing market conditions) was the most expensive resource option and had the largest variability (based on potential natural gas price volatility) of all 25 cases.
• Significantly modifying the weighting described in Figure 5-5 would emphasize a need for stability over lowest NPV by reducing the desirability of portfolios with large swings. For example, in this IRP placing a combined 85% weight on the variable swings and 15% combined weight on NPV rather than the original opposite ratios lowers the ranking of those scenarios that rely on wind resources. This highlights that portfolios that depend on the sale of Renewable Energy Credits have the largest first and second variable swings out of all portfolios, and indicates a volatility risk that must be carefully considered.
It is important to evaluate all of the possible scenarios going forward, but more emphasis should be placed on those scenarios that have the characteristics that are desirable to the member systems. It should also be noted that the results above are not dispositive -- updated market, resource cost, capital, and other information is crucial to evaluating resources at the time of availability. With that in mind, figure 5-7 and 5-8 present the results from the second lowest cost scenario (by 0.175%), Scenario 17 - in and out of state solar with market contracts. Scenario 17 also has relatively low key resource variability. Figure 5-7 is a detailed summary of the resulting NPV calculations for Scenario 17. It shows how much each variable fluctuated relative the base case of $555 million. As described above, The assumed Renewable Energy Credit value is the most significant variable. This variable has a range of $60 million from the low cost case to the high cost case based on the assumptions used in model. The next most significant variable was

31
changes to the expected Regional Network Service rates, followed by changes to the assumed discount rate. Figure 5-8 provides a summary of the key variables in order of relative importance in the form of a “tornado” chart to show the effect of variables on the cost of power for the scenario. Figure 5-7: Scenario 17- In-State Solar, Out-of-State Solar, and Market Contract Results
Figure 5-8: Scenario 17- In-State Solar, Out-of-State Solar, and Market Contract Tornado Chart
20 YR NPV POWER COSTSCorresponding Input Value Output Value Percent
Input Variable Low Output Base Case High Output Low Base High Swing Swing 2̂Regional Network Service Rates 82.3% 100.0% 117.7% $577,666,499 $610,484,419 $643,302,345 $65,635,847 19.0%
Discount rate 115.4% 100.0% 84.6% $580,822,128 $610,484,419 $642,336,579 $61,514,451 16.7%Renewable Energy Credits 120.0% 100.0% 10.0% $599,717,873 $610,484,419 $658,933,872 $59,215,998 15.5%Capacity Load Obligation 94.8% 100.0% 110.5% $593,845,256 $610,484,419 $646,453,367 $52,608,111 12.2%
Monthly Peak (Trans) 90.0% 100.0% 110.0% $590,293,087 $610,484,419 $632,126,785 $41,833,698 7.7%Delivered Natural Gas Prices 29.2% 100.0% 170.8% $589,756,749 $610,484,419 $631,212,088 $41,455,339 7.6%
VT Renewable Portfolio Standard 0.0% 100.0% 175.0% $595,506,447 $610,484,419 $633,728,911 $38,222,464 6.4%FCA Clearing Prices 211.2% 100.0% 25.9% $592,205,484 $610,484,419 $622,670,375 $30,464,892 4.1%FRM Clearing Prices 157.8% 100.0% 42.2% $595,529,874 $610,484,419 $625,438,963 $29,909,088 3.9%
Load Forecast -3.7% 0.0% 3.7% $598,785,835 $610,484,419 $622,183,002 $23,397,166 2.4%Implied Heat Rate 63.0% 100.0% 137.0% $599,661,716 $610,484,419 $621,307,121 $21,645,406 2.1%
Load Forecast Error Percentage -3.0% 0.0% 3.0% $600,999,081 $610,484,419 $619,969,756 $18,970,675 1.6%Inflation 49.3% 100.0% 150.7% $603,871,860 $610,484,419 $618,035,758 $14,163,897 0.9%
Electric Vehicles 50.0% 100.0% 140.0% $610,381,777 $610,484,419 $610,566,531 $184,754 0.0%LMP Basis to HUB 97.9% 100.0% 102.1% $610,484,419 $610,484,419 $610,484,419 $0 0.0%
82.3%
115.4%
120.0%
94.8%
90.0%
29.2%
0.0%
211.2%
157.8%
-3.7%
63.0%
-3.0%
49.3%
50.0%
97.9%
117.7%
84.6%
10.0%
110.5%
110.0%
170.8%
175.0%
25.9%
42.2%
3.7%
137.0%
3.0%
150.7%
140.0%
102.1%
$500,000,000 $550,000,000 $600,000,000 $650,000,000 $700,000,000 $750,000,000
Regional Network Service Rates
Discount rate
Renewable Energy Credits
Capacity Load Obligation
Monthly Peak (Trans)
Delivered Natural Gas Prices
VT Renewable Portfolio Standard
FCA Clearing Prices
FRM Clearing Prices
Load Forecast
Implied Heat Rate
Load Forecast Error Percentage
Inflation
Electric Vehicles
LMP Basis to HUB
20 YR NPV POWER COSTS
SensIt 1.31

32
30 V.S.A. §218c requires a least cost integrated plan to include “environmental” costs when calculating a “lowest present value life cycle cost.” The statute is not clear on how to address these costs. VPPSA has indirectly included costs associated with compliance of certain emissions in the region such as CO2, NOx and SO2 and costs associated with noise pollution, aesthetics, and other quality of life elements are met through the IRP process in a more qualitative way during discussion of the benefits of a particular resource mix. Direct costs associated with CO2 (carbon dioxide) emissions are incorporated into forecasts of electricity prices because emissions of the pollutant are regulated by the Regional Greenhouse Gas Initiative (RGGI). RGGI is a cooperative effort to help reduce greenhouse gas emissions among nine eastern states, with the state of Vermont a founding member. Most electric generators in the RGGI region with a nameplate capacity greater than 25MW are subject to RGGI compliance, which places an annual cap on the amount of collective carbon emissions from these power plants. As such, when the demand for allowances exceeds the supply, carbon emissions from the RGGI states are unlikely to reduce unless the RGGI cap (amount of pollution) is lowered or the CO2 allowances (right to pollute) are not offered into the auction (retired). VPPSA assumes that those plants that are required to purchase the right to emit CO2 pollution have included those costs into their energy supply offers to the market, influencing the expected costs of energy in the future and is reflected in the forward energy price curve. VPPSA has not assumed an additional cost for carbon should the cost of compliance with RGGI not be reflective of the overall cost to society for the same amount of pollution emitted in the region. Similarly, VPPSA has not included a variable for additional societal costs of carbon for resources that do not use renewable fuels. The net effect of regional carbon emissions from resources that generate electricity from renewable fuel sources and those that generate electricity from fossil fuels is expected to be equal as the total amount of pollution that the region will emit is capped by RGGI. If a renewable resource were to be built in the region, the same amount of carbon allowances would be sold in auctions as would have been sold had a fossil fuel generator been built. The costs for compliance with other regulated emissions such as NOx and SO2 are addressed in a similar way. The costs associated with compliance of the newly passed Vermont Renewable Energy Standard (Act 56, RES) is also not considered a carbon emissions cost in this Integrated Resource Plan given that such emissions are regulated through RGGI. As discussed in Section 4.3, much of the compliance will be or can be met through the retirement of Renewable Energy Credits (RECs.) VPPSA’s understanding is that the RECs associated with the generation used to comply with the VT RES should not be directly associated with carbon reduction for the state of Vermont. It is expected that in the future, the collective efforts of states with an RPS or RES will make it easier for the Governors of
33
the RGGI states to agree to reduce the annual emissions cap as the demand for emissions allowances is expected to be lower as RPS and RES compliance amounts increase.2
6. Action Plan The optimal resource choice from a least cost basis on the current data set was scenario 24 (In-State Solar, Out-of-State Solar, Market Contract, Wind), closely followed by Scenario 17 (In-State Solar, Out-of-State Solar, Market Contract). A number of scenarios containing both In- and Out-of-State solar had similar overall resource costs and volatility. The municipal systems’ current portfolio is a mix of long-term contracts, generation, and short-term contracts. VPPSA’s overarching strategy, as directed by its members, is to maintain diversity in the municipal systems’ power supply portfolios while securing stably priced resources in a cost-effective and environmentally conscious manner. Scenario 17 and Scenario 24 both fit well with the strategy, but as with any resource choice, it is important to use reasonable judgment, updated data, and consider the need to mitigate risk. From a financial standpoint, understanding risks and potential cost variables is critical. The IRP model, as illustrated in the preceding Sections, is a rigorous planning tool that allows for least cost integrated planning through a robust decision making framework. The analysis undergone for this IRP and for every resource choice provides valuable insight into the impacts of future resource decisions. In particular, the analysis has led us to the following next steps:
• Identify possible solar plant opportunities for partnership and/or development, both In-State and Out-of-State;
• Monitor and pursue regulatory efforts to retire necessary RECs and/or take other necessary actions to meet state targets in the Renewable Energy Standard while preserving the value of REC credits for member systems.
• Keep existing portfolio strengths in mind (diversity, flexibility, stability) when undertaking new purchases
• Pursue resources and actions that lower exposure to Regional Network Service charge rates.
• In the short term, continue to implement the Planned Purchase program. In order to make its members’ power costs more predictable, VPPSA implemented a plan to purchase power for future periods using a systematic price hedging technique. The municipal systems participate in planned purchasing in order to avoid uncertainty and volatile swings of spot market purchases. Under this Planned Purchase concept, VPPSA reviews future market exposure (defined as forecasted
2 This view is not unique. In a discussion about RECs and emissions, Richard Sedano for the Regulatory Assistance Project stated that “Vermont is part of the Regional Greenhouse Gas Initiative and that determines how much carbon the whole region, including Vermont, is going to actually produce. You can only produce a carbon unit if you buy an allowance to do that.” Electric Utility Regulation 101, Sedano, Richard, Lindholm, Jane January 21, 2015 (at minute 29:00) http://digital.vpr.net/post/electric-utility-regulation-101#stream/0

34
need for power, less amounts available through previously secured long-term contracts and generation) every six months.
Twice a year, in the spring and fall, utilities have the opportunity to purchase one quarter of future market energy needs for a two year period. For example, in the spring of 2007, utilities purchased approximately one-fourth of their projected need for market energy for the period January 2009 to December 2010. In the fall of 2007, approximately another one-fourth of the need for the period July 2009 to June 2011 was purchased. By staggering the purchases, at any given time the market needs of a utility are met by contracts purchased at four different price points resulting in less volatile power market prices. This is very similar to the concept of dollar cost averaging which is used in financial investing. The implementation of Planned Purchasing is structured and systematic, but it does not remove the need for continual market monitoring and judgment. The goal is to use market monitoring and judgment to give the municipal systems the benefit of more favorable resource prices. In the event that market prices are below prices that will cause rates to be stable, additional or longer purchase may be made instead of the normal two year duration. In the event that unusually high prices prevail at the time of a planned purchase, that purchase may be delayed. In general the intent is to avoid trying to “time the market” and so the pre-disposition will be to make each bi-annual purchase unless the prices depart noticeably from expected ranges.
In addition to the above specific actions, VPPSA intends to continue to monitor the penetration of electric vehicles, heat pumps, battery storage, and net metering to understand impacts on energy consumption, load shapes, and rates. VPPSA and its member systems will seek to actively and creatively meet the targets of Vermont's new Renewable Energy Standard. Finally, VPPSA will continue to monitor and consider the impacts of rate design options on resource planning.
7. Conclusion The municipal systems’ IRP is intended to act as a plan for meeting future power needs, but it does not map out with precision what action will be taken or an explicit outcome. VPPSA continually updates data and re-evaluates supply alternatives (particularly when considering investment in or contracting for a specific long-term resource). The results of this IRP indicate to VPPSA and its members the areas in which there is more work to be done and what critical paths are necessary to reach a least-cost outcome. The IRP is a planning process and is a dynamic, rather than a static, one. As conditions change, planning assumptions, and even the model itself, will need to be updated to reflect important developments.

35
Any specific resource option will generally be evaluated in the same way as the planning or generic resources in the IRP model. When considering a specific proposed resource, updating all assumptions and probability estimates with the best available information at that time will be necessary. Also, if a specific proposal is of the same type as a planning or generic resource (e.g. an in-state solar resource) it will be important to consider differences between the characteristics of the specific proposal and the generic assumptions for that resource type in order to insure that the planning assumptions are still relevant (e.g. the tilt and azimuth of a solar resource could affect its value). As indicated earlier, the decision-making framework illustrated by this IRP is applied at the individual system level; this is done as specific power projects are reviewed and assessed in the future. In this way each utility has specific information on the impact a project and resource mix will have on their individual system. Each utility can then determine if a project or resource mix fits with the municipal’s goals and customers’ preferences.

36
Appendix 1: Resource and Variable Assumptions RESOURCES Resource Name NYPA - Niagara Expiration: The Niagara contract is modeled as being renewed for the duration
of the IRP analysis. Dispatch: Cap+Niag. The percent of energy on and off peak was determined
based on average values. The contract provides market capacity. EforD: No longer used with new Forward Capacity Market rules Type: NH000. NYPA hydro with no REC properties. Black Start? No Forward Reserve? No Nominal kW: 4,050 kW. The historical Niagara entitlement was used Capacity Cost: The contract is subject to cost-of-service treatment and so changes
are not known. For IRP modeling purposes historical capacity costs (and related cost net of NYPA re-bills) were escalated by inflation to derive forecasted capacity costs.
Market Cap kW: The nominal kW are adjusted by the ISO-NE Pool Reserve Margin
rate to arrive at UCAP kW for the contract. The historical monthly reserve margins were used as a proxy for future years and combined with the nominal kW assumptions to arrive at market capacity kW.
Capacity Factor: A historical average monthly capacity factor was used for future
months. Energy Price: The contract is subject to cost-of-service treatment and so changes
are not known. For IRP modeling purposes assumed energy costs were escalated by inflation to derive forecasted energy costs per MWh.

37
Resource Name NYPA – St Lawrence Expiration: The St Lawrence contract is modeled as being renewed for the
duration of the IRP analysis. Dispatch: Cap+StLa. The percent of energy on and off peak was determined
based on average values. The contract provides market capacity. EforD: No longer used with new Forward Capacity Market rules Type: NH000. NYPA hydro with no REC properties. Black Start? No Forward Reserve? No Nominal kW: 87 kW The historical St Lawrence entitlement was used. Capacity Cost: The contract is subject to cost-of-service treatment and so changes
are not known. For IRP modeling purposes historical capacity costs (and related cost net of NYPA re-bills) were escalated by inflation to derive forecasted capacity costs.
Market Cap kW: No change from historical market capacity values was assumed. Capacity Factor: A historical average monthly capacity factor was used for future
months. Energy Price: The contract is subject to cost-of-service treatment and so changes
are not known. For IRP modeling purposes historical energy costs were escalated by inflation to derive forecasted energy costs per MWh.

38
Resource Name Hydro Quebec ICC Expiration: VPPSA’s members have an ownership (life of asset) interest in the
Phase I / II transmission path. For the purposes of this draft of the IRP model, and given the long lifespan of such assets, this resource has not been treated as expiring.
Dispatch: Not applicable EforD: No longer used with new Forward Capacity Market rules Type: HQ000 Black Start? No Forward Reserve? No Nominal kW: Based on market capacity value given the nature of the use of the
asset. Capacity Cost: Currently included in the IRP model is a two year average actual
average cost per market kW, escalated by inflation. Market Cap kW: The asset generally receives a market capacity credit during the
months of March to November. Capacity Factor: Not applicable Energy Price: Not applicable

39
Resource Name VEPP Inc. BIOMASS (RYEGATE) Expiration: October 2021 Dispatch: Cap+7x24. The unit operates as base load. The unit provides
market capacity. EforD: No longer used with new Forward Capacity Market rules Type: VB000 Black Start? No Forward Reserve? No Nominal kW: The unit is rated at 20,500 kW and the current allocation for the
utilities included in VPPSA’s ISO-NE asset ID is 8.08% for an entitlement of 1,6579 kW.
Capacity Cost: The unit is modeled with no capacity cost. Market Cap kW: An average of 17,686 kW was used based on FCM obligations. Capacity Factor: The monthly CF% in the model is based on assumptions from
Engie Energy Price: Energy price assumptions (by year) are from the statewide contract
document. .

40
Resource Name VEPP Inc. Hydro Units Expiration: Varies. Unit contract expirations are calculated via a schedule and
reflected in declining VEPP Inc. hydro nominal kW. Dispatch: Cap+MorHyd Morrisville’s multiple hydros were used as a proxy
for the on and off peak hour proportions for the VEPP Inc. units. The units all provide market capacity.
EforD: No longer used with new Forward Capacity Market rules Type: VH000 Black Start? No Forward Reserve? No Nominal kW: VPPSA has used the nominal ratings for the VEPP Inc. hydro
ratings posted on the VEPP inc. web site. VPPSA’s current share is 7.59%. VPPSA entitlement share of 40,652 kW is assumed as continuing and decreases as contracts retire.
Capacity Cost: The VEPP Inc. hydro units are not modeled as having a capacity
cost. Market Cap kW: The market capacity provided by the VEPP Inc. hydro units is
based the intermittent hydro ratings registered for the VEPP Inc. hydro units in the Forward Capacity Market. All market capacity has been calculated through the use of a table to reflect VEPP Inc. contract expirations over time.
Capacity Factor: The monthly VEPP Inc. capacity factor was provided by the VEPP
Inc Energy Price: The energy price by month was calculated based on information
provided by VEPP Inc.

41
Resource Name McNeil Expiration: Life of unit Dispatch: Monthly capacity factor based on past 3 year average actual run
pattern for plant by month. Assumed dispatch would model historic run pattern. Dispatch tied to variable energy costs (wood. ash, rail, etc) and compared to projected LMP. McNeil also provides market capacity.
EforD: No longer used with new Forward Capacity Market rules Type: BM100 – 100% of REC values due to CT Class I qualification. Black Start? No Forward Reserve? No Nominal kW: 50,000 kW VPPSA’s 16% entitlement is 8,000 kW Capacity Cost: Demand value consists of debt service schedule and fixed demand
charges for the plant. Debt service ends June 2015. Fixed costs based on 5 year budget of operations, maintenance, transmission, A&G, insurance, taxes, and other fixed costs.
Market Cap kW: The McNeil plant has a summer claimed capability of 52,000 kW
and a winter rating of 54,000 kW. VPPSA has an entitlement of 16% or 8,640 kW.
Capacity Factor: Monthly average capacity factors are based on a 3 year monthly
average. If sensitivity to assumption changes are being tested, McNeil’s
capacity factor is adjusted by the same adjustment as is used for natural gas (up to a maximum capacity factor of 75%). This adjustment is made under the assumptions that natural gas (vs. heat rate) changes have the largest effect on market prices and McNeil’s fuel is not equally volatile. Significant changes in market energy prices should result in increase in McNeil operations up to limitations imposed by fuel delivery restrictions.
Energy Price: Assumed based on existing variable costs.
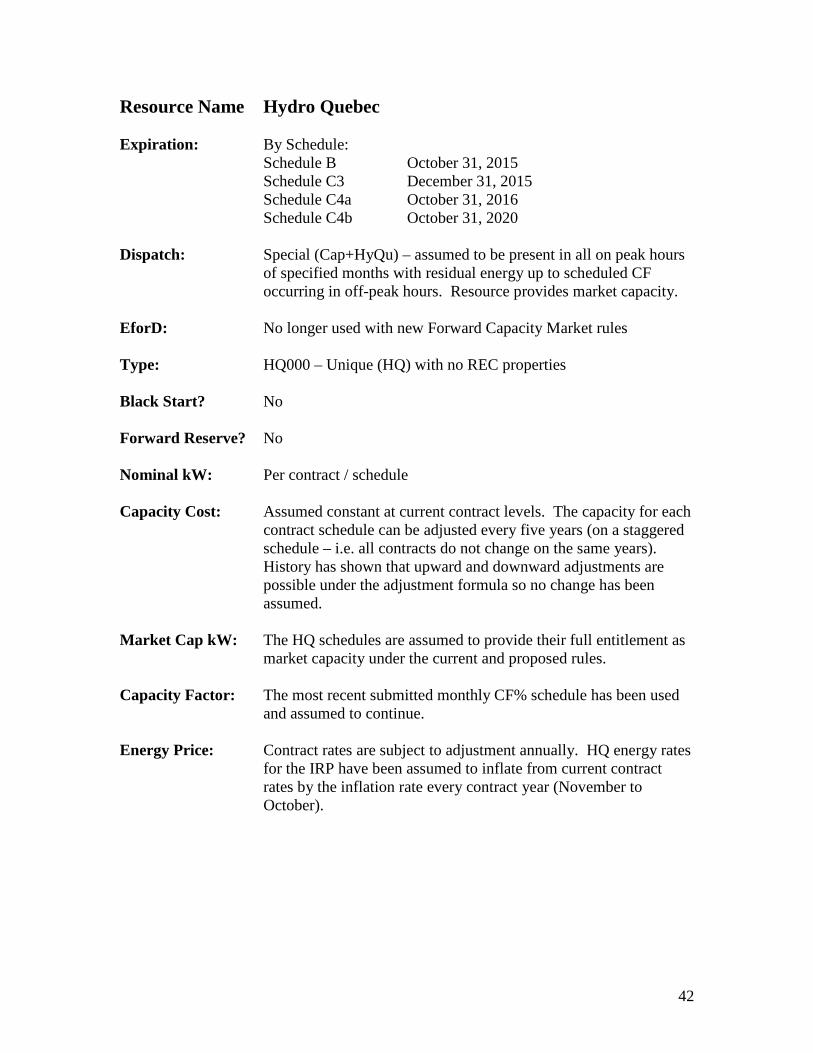
42
Resource Name Hydro Quebec Expiration: By Schedule: Schedule B October 31, 2015 Schedule C3 December 31, 2015 Schedule C4a October 31, 2016 Schedule C4b October 31, 2020 Dispatch: Special (Cap+HyQu) – assumed to be present in all on peak hours
of specified months with residual energy up to scheduled CF occurring in off-peak hours. Resource provides market capacity.
EforD: No longer used with new Forward Capacity Market rules Type: HQ000 – Unique (HQ) with no REC properties Black Start? No Forward Reserve? No Nominal kW: Per contract / schedule Capacity Cost: Assumed constant at current contract levels. The capacity for each
contract schedule can be adjusted every five years (on a staggered schedule – i.e. all contracts do not change on the same years). History has shown that upward and downward adjustments are possible under the adjustment formula so no change has been assumed.
Market Cap kW: The HQ schedules are assumed to provide their full entitlement as
market capacity under the current and proposed rules. Capacity Factor: The most recent submitted monthly CF% schedule has been used
and assumed to continue. Energy Price: Contract rates are subject to adjustment annually. HQ energy rates
for the IRP have been assumed to inflate from current contract rates by the inflation rate every contract year (November to October).

43
Resource Name Stony Brook Intermediate Units 1A, 1B, 1C Expiration: The contracts are life of unit. Dispatch: Cap+5x16. Stony Brook is assumed to generate energy only
during on-peak periods. Stony Brook provides market capacity. EforD: No longer used with new Forward Capacity Market rules Type: OG000 Black Start? Yes Forward Reserve? No Nominal kW: The combined rating of the three identical units is approximately
350 MW nominal. VPPSA’s members hold entitlement to 2.201% of each unit through a combination of purchase power agreements and ownership interest. Accordingly a nominal kW (VPPSA) of approximately 2,600 kW per unit was used in the IRP model.
Capacity Cost: VPPSA has used an average (post bond retirement) capacity cost
increased annually for inflation from MMWEC’s most recent budget for the IRP model.
Market Cap kW: The average claimed capability for each of the three units has been
normalized to average monthly values. Capacity Factor: A historical average capacity factor for the units was used. The
period selected for the average was all monthly values after March 2003. The extreme minimum and maximum values for each month were excluded from the averages.
Energy Price: The energy price included in the IRP model for Stony Brook is that
used in the 2015-19 VPPSA budget. It was derived using the CME Groups natural gas price forecast and Stony Brook’s planning heat rate of 8,800. These monthly price forecasts for natural gas were multiplied by the assumed heat rate of 8,800 to derive a base case energy price forecast (monthly) for Stony Brook.

44
Resource Name Yarmouth (Wyman) Expiration: The contract is life of unit. Dispatch: Cap+5x16. Yarmouth is assumed to generate energy only during
on-peak periods. Yarmouth provides market capacity. EforD: No longer used with new Forward Capacity Market rules Type: OG000 Black Start? No Forward Reserve? No Nominal kW: 618 MW. VPPSA's entitlement of the total capacity is 0.033%. Capacity Cost: No capacity costs were assumed. Unit is modeled on its energy
rate due to limited information contained in FPL invoices detailing variable vs. non-variable costs. This information is being researched to obtain greater detail on this resource.
Market Cap kW: The Claimed Capability for the unit runs very close to its nominal
rating so the same value is used Capacity Factor: The unit was modeled as having a similar capacity factor to the
Stony Brook unit due to limited information and its similar nature as a marginal unit in the pool. The capacity factor for Stony Brook is very similar to planning capacity factors for Yarmouth.
Energy Price: Historical pricing was used inflated each year by the inflation rate
in the model.

45
Resource Name: Swanton Hydro (Highgate) Expiration: Life of unit Dispatch: Cap+SwaH The percent of energy on and off peak was determined
based on average values. The units provide market capacity. EforD: No longer used with new Forward Capacity Market rules Type: IH100 – 100% of Hydro Class II REC value. Note: At this time,
VPPSA is assigning low-value Class II REC’s to all existing hydros. In the event that a new hydro became available, or an existing unit needed to model increased output that would qualify for Class I REC status, the forecast price for REC’s would be set to Class I values and the amount of output qualifying for REC treatment from existing resources would be modeled in a manner similar to that used in McNeil.
FERC licence Expiration: 4/30/2024 Black Start? No Forward Reserve? No Nominal kW: 11,392 kW Capacity Cost: Not modeled in IRP Market Cap kW: Under the Forward Capacity Market, the unit’s winter and summer
FCM intermittent values are used. Capacity Factor: Monthly average capacity factors based on 10 year average
monthly generation and the nominal unit kW. Energy Price: Not modeled in IRP

46
Resource Name Morrisville Hydro Units HK Sanders (Green River) Cady’s Falls Morrisville Plant #2 Expiration: Life of units Dispatch: Cap+MorH The percent of energy on and off peak was determined
based on average values for the units. The units provide market capacity.
EforD: No longer used with new Forward Capacity Market rules Type: IH100 FERC licence Expiration: Black Start? No Forward Reserve? No Nominal kW: HK Sanders 1,800 kW Cady’s Falls 1,400 kW Morrisville Plant #2 1,800 kW Capacity Cost: Not modeled in IRP Market Cap kW: The units' value is based on their Forward Capacity Market
obligation through 2018. The June 2017-May2018 values are carried forward into the future.
Capacity Factor: Monthly average capacity factors based on 5-10 year averages,
depending on plant, of monthly generation and the nominal unit kW.
Energy Price: Not modeled in IRP

47
Resource Name: Barton Hydro Expiration: Life of unit Dispatch: Cap+BarH The percent of energy on and off peak was based on
average values for the unit. The units provide market capacity. EforD: No longer used with new Forward Capacity Market rules Type: IH100 FERC licence Expiration: 10/1/2043 Black Start? No Forward Reserve? No Nominal kW: 1,400 kW Capacity Cost: Not modeled in IRP Market Cap kW: The unit’s winter and summer FCM intermittent values are based
on FCM obligation through 2018, carried forward throughout the life of the unit.
Capacity Factor: Monthly average capacity factors based on 10 year average
monthly generation and the nominal unit kW. Energy Price: Not modeled in IRP

48
Resource Name: Lyndonville Hydro (Vail & Great Falls) Expiration: Life of unit Dispatch: Cap+LynH The percent of energy on and off peak was determined
based on average values for the unit. The unit provides market capacity.
EforD: No longer used with new Forward Capacity Market rules Type: IH100 FERC licence Expiration: 02/28/2034 and 05/31/2019 Black Start? No Forward Reserve? No Nominal kW: 2,400 kW Capacity Cost: Not modeled in IRP Market Cap kW: The unit’s winter and summer FCM intermittent values are based
on FCM obligation through 2018, carried forward throughout the life of the unit.
Capacity Factor: Monthly average capacity factors based on 10 year average
monthly generation and the nominal unit kW. Energy Price: Not modeled in IRP

49
Resource Name: Wolcott Hydro (Hardwick) Expiration: Life of unit Dispatch: Cap+HarH The percent of energy on and off peak was determined
based on average values for the units. The units provide market capacity.
EforD: No longer used with new Forward Capacity Market rules Type: IH100 Black Start? No Forward Reserve? No Nominal kW: 815 kW Capacity Cost: Not modeled in IRP Market Cap kW: The unit’s winter and summer FCM intermittent values are based
on FCM obligation through 2018, carried forward throughout the life of the unit.
Capacity Factor: Monthly average capacity factors based on 10 year average
monthly generation and the nominal unit kW. Energy Price: Not modeled in IRP
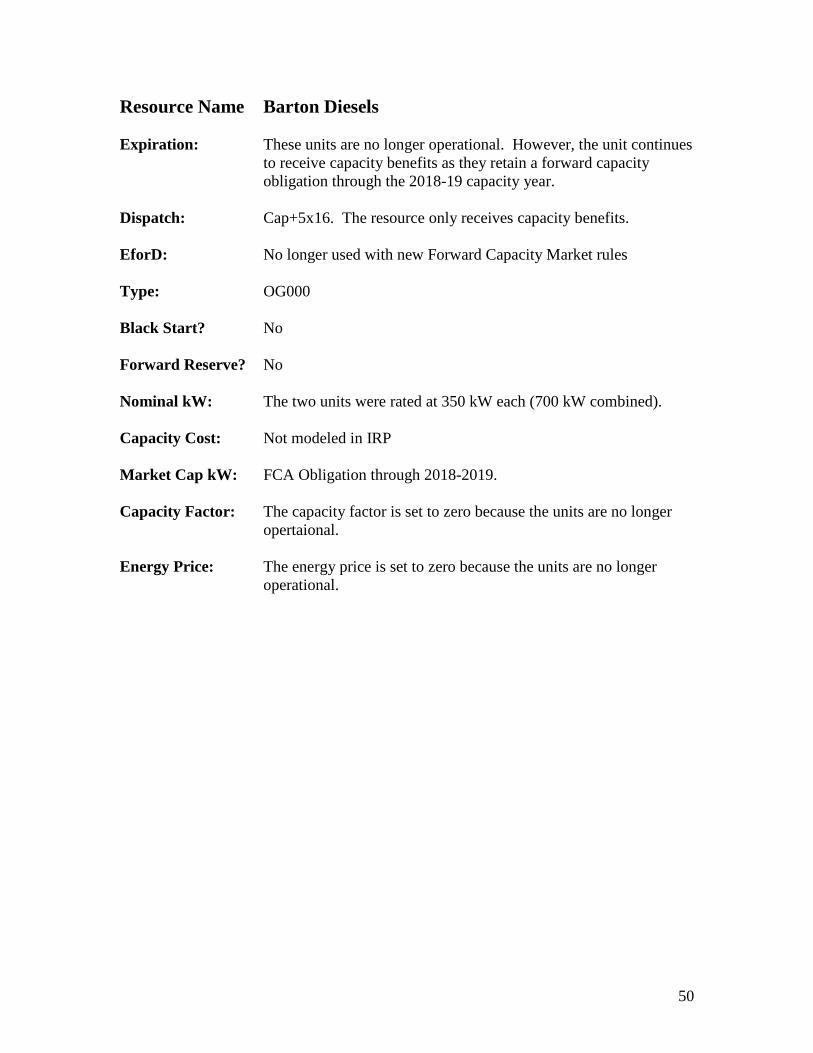
50
Resource Name Barton Diesels Expiration: These units are no longer operational. However, the unit continues
to receive capacity benefits as they retain a forward capacity obligation through the 2018-19 capacity year.
Dispatch: Cap+5x16. The resource only receives capacity benefits. EforD: No longer used with new Forward Capacity Market rules Type: OG000 Black Start? No Forward Reserve? No Nominal kW: The two units were rated at 350 kW each (700 kW combined). Capacity Cost: Not modeled in IRP Market Cap kW: FCA Obligation through 2018-2019. Capacity Factor: The capacity factor is set to zero because the units are no longer
opertaional. Energy Price: The energy price is set to zero because the units are no longer
operational.

51
Resource Name: Enosburg Falls Hydro Expiration: Life of unit Dispatch: Cap+EnoH The percent of energy on and off peak was determined
based on average values for the unit. The units provide market capacity.
EforD: No longer used with new Forward Capacity Market rules Type: IH100 FERC licence Expiration: 04/30/2023 Black Start? No Forward Reserve? No Nominal kW: 975 kW (600 kW Village Plant#1, 375 kW Kendall) Capacity Cost: Not modeled in IRP Market Cap kW: The unit’s winter and summer FCM intermittent values are based
on FCM obligation through 2018, carried forward throughout the life of the unit.
Capacity Factor: Monthly average capacity factors based on 10 year average
monthly generation and the nominal unit kW. Energy Price: Not modeled in IRP

52
Resource Name MARKET ENERGY CONTRACTS Expiration: By contract terms. Dispatch: By contract terms. EforD: No longer used with new Forward Capacity Market rules Type: FS000 Black Start? No Forward Reserve? No Nominal kW: By contract terms. Capacity Cost: By contract terms. Market Cap kW: Market energy contracts do not provide market capacity. Capacity Factor: By contract terms. Energy Price: By contract terms.

53
Resource Name Project 10 Expiration: Life of unit and runs through the modeling period. Dispatch: Cap+5x16 The unit is assumed to operate only during on peak
hours. The unit provides market capacity. EforD: No longer used with new Forward Capacity Market rules Type: OG000 Black Start? Yes Forward Reserve? Yes Nominal kW: 40,000 kW. Capacity Cost: $7.00 kW-mo beginning in 2015. Market Cap kW: 39,163 kW, based on FCM obligation through 2017-18, then held
constant. Capacity Factor: Assumed nearly zero CF thereby limiting contribution to energy
outlook. Energy Price: Limited dispatch, only at very high energy prices.

54
Resource Name HQUS Expiration: 6 different MW expirations. Contract runs from November 1,
2012 – October 31, 2018. Total contract (prior to VPPSA allocation model as): • 25,000 kW from November 1, 2012 to October 31, 2015 • 187,000 kW from November 1, 2015 to October 31, 2016 • 212,000 kW from November 1, 2016 to October 31, 2020 • 218,000 kW from November 1, 2020 to October 31, 2030 • 218,000 kW from November 1, 2030 to October 31, 2035 • 56,000 kW from November 1, 2035 to October 31, 2038
Dispatch: 7X16. The contract does not provide market capacity. EforD: No longer used with new Forward Capacity Market rules Type: FS000 Black Start? Yes Forward Reserve? Yes Nominal kW: Variable. Capacity Cost: Not applicable. Market Cap kW: Not Applicable Capacity Factor: 66.67%. Energy Price: This is a market following contract with a variable energy price.

55
Resource Name Chester Solar Expiration: This contract is life of unit (2039) Dispatch: Cap+Solar. EforD: No longer used with new Forward Capacity Market rules Type: SL000 Black Start? No Forward Reserve? No Nominal kW: 4.408 Capacity Cost: Not applicable. Market Cap kW: Beginning in 2018, 1,904 kW based on FCA obligation, summer
only. Declines by .5% per year for assumed panel degradation. Capacity Factor: Varies by month based on estimated production. Energy Price: Beginning in 2015, $76.66/MWh, declining in 2024 to
$72.62/MWh
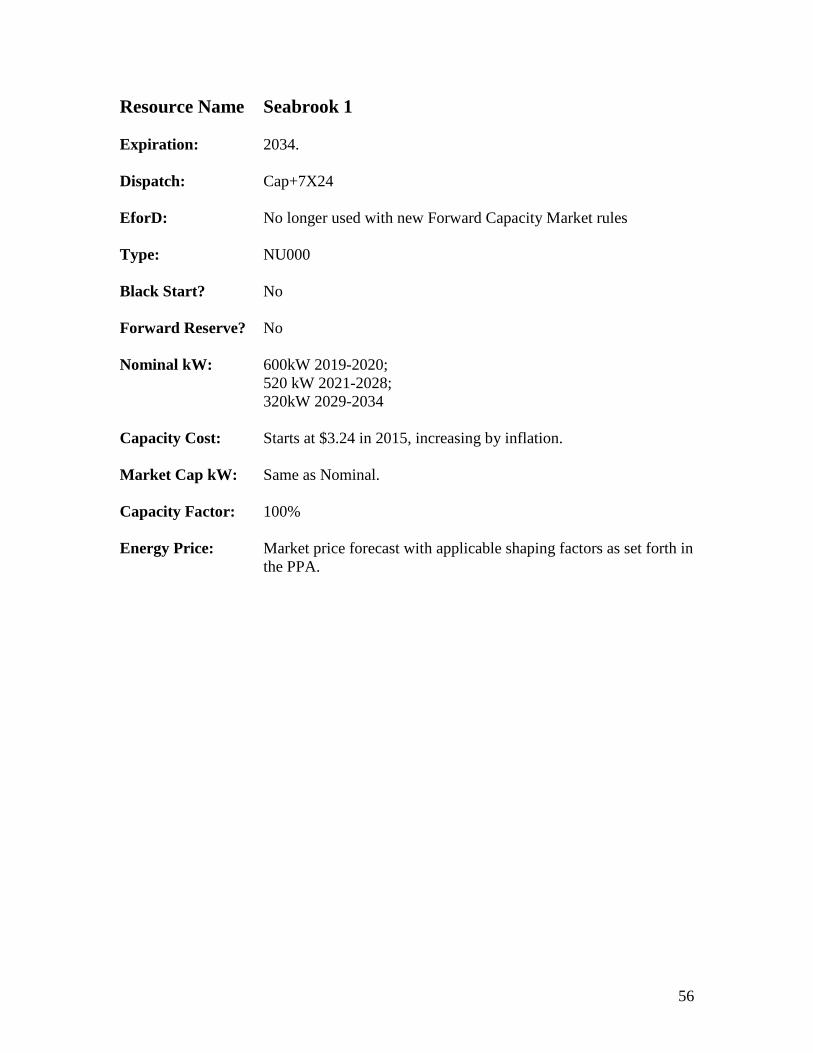
56
Resource Name Seabrook 1 Expiration: 2034. Dispatch: Cap+7X24 EforD: No longer used with new Forward Capacity Market rules Type: NU000 Black Start? No Forward Reserve? No Nominal kW: 600kW 2019-2020; 520 kW 2021-2028; 320kW 2029-2034 Capacity Cost: Starts at $3.24 in 2015, increasing by inflation. Market Cap kW: Same as Nominal. Capacity Factor: 100% Energy Price: Market price forecast with applicable shaping factors as set forth in
the PPA.

57
Resource Name Fitchburg Landfill Gas Expiration: 2031 Dispatch: Cap+7x24 EforD: No longer used with new Forward Capacity Market rules Type: LG000 Black Start? No Forward Reserve? No Nominal kW: 3,000kW through 2016, then 4.5MW Capacity Cost: Not applicable. Market Cap kW: Uses FCA obligation through CP 2017-18, then holds capacity
value constant through the 10th year of the contract (2021). Starting 2022 this value reflects the most recent Qualified Capacity
Capacity Factor: Declines starting in 2017 on assumption of reduced output. Energy Price: $90/MWh through 2021, $85/MWh 2022-2026, $95/MWh 2027-
2031
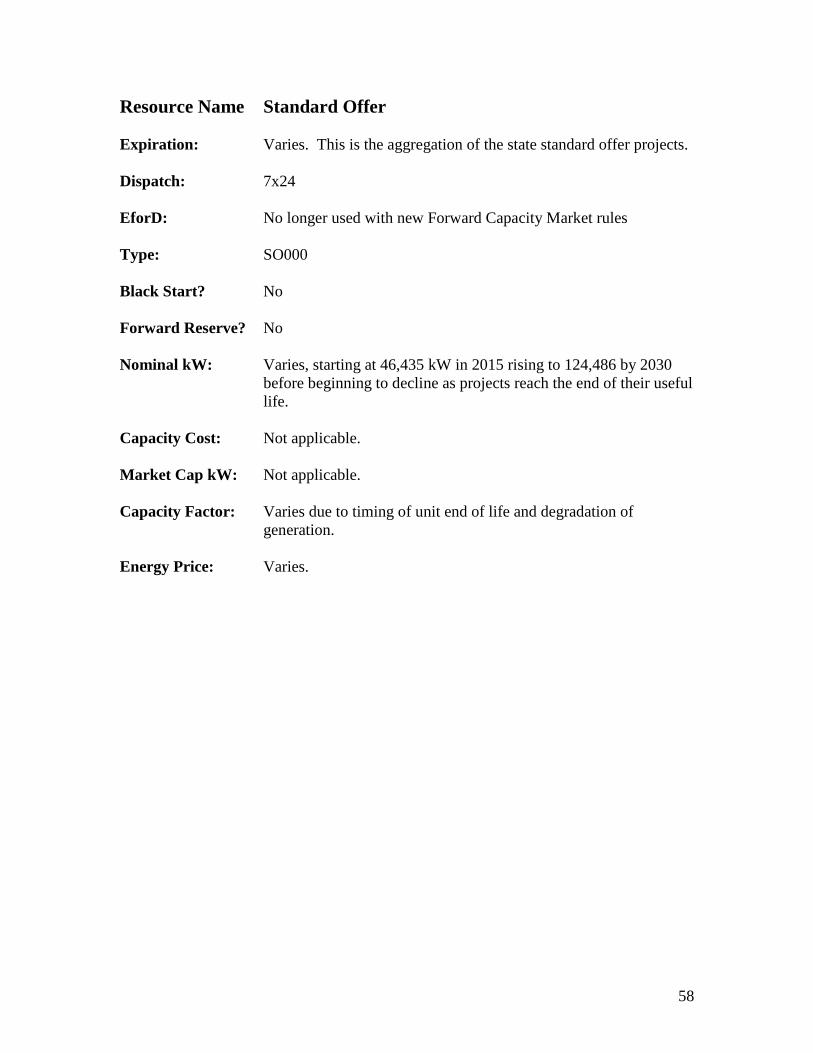
58
Resource Name Standard Offer Expiration: Varies. This is the aggregation of the state standard offer projects. Dispatch: 7x24 EforD: No longer used with new Forward Capacity Market rules Type: SO000 Black Start? No Forward Reserve? No Nominal kW: Varies, starting at 46,435 kW in 2015 rising to 124,486 by 2030 before beginning to decline as projects reach the end of their useful life. Capacity Cost: Not applicable. Market Cap kW: Not applicable. Capacity Factor: Varies due to timing of unit end of life and degradation of
generation. Energy Price: Varies.

59
KEY VARIABLE ASSUMPTIONS This section describes the base case sources for key variables examined, along with the assumed value, description of the justification for sensitivity parameters, and provides any appropriate discussion. The method for estimating the probability of a sensitivity occurring was described in Section 5.3.

60
Variable Name: Natural Gas – New England Base Case Source: CME Group NYMEX market published market prices. Assumed Value: Ranging from $4.22 per MMbtu in 2015 to $6.69 per MMbtu in
2024. After 2024 the forecast of natural gas was held constant (in terms of 2014 dollars). VPPSA has inflated the nominal gas prices for 2022 on by the inflation index in use in the IRP model to mirror this treatment.
Entry Area: “Price Forecast” Sheet of IRPResults4 spreadsheet. Sensitivity: Assumed ± two standard deviations. Discussion: The relationship between spot market electricity prices in New
England and wholesale natural gas prices is strong. In addition price volatility has been a major concern in the wholesale power markets as well. Therefore, relying on wholesale power markets to replace significant portions of expiring resources can be seen as problematic.

61
Variable Name: Pool Implied Heat Rate Base Case Source: Calculated from JP Morgan historical Mass hub energy prices and
historical Algonquin City-gates energy prices Assumed Value: Ranging from 8.68 in 2015 to 6.67 in 2024 Entry Area: “Price Forecast” Sheet of IRPResults4 spreadsheet. Sensitivity: Assumed ± two standard deviations.

62
Variable Name: VT Renewable Energy Standard Base Case Source: Vermont Renewable Energy Standard Total Energy, Distributed
Generation, and Energy Transformation requirements (referred to in the model as Class I, II, and III) have a base case equivalent to that included in Act 56 of 2015.
Assumed Value: Class I assumes 55% in 2017 increasing to 75% requirement in
2032. Class II assumes 1% in 2017 increasing to 10% in 2032, with Class II being a subset of Class I. Class III assumes 2% in 2019 increasing to 12% in 2034.
Entry Area: “Load Forecast” Sheet of IRPResults4 spreadsheet. Sensitivity: The sensitivity applied was a political removal of the Renewable
Energy Standard (0% requirement) and a stiffening of the requirement by 75%.
Discussion: Given the political nature of a Renewable Energy Standard, it is prudent to examine a wide range of potential changes to the requirements.

63
Variable Name: Electric Vehicles Base Case Source: Vermont Energy Investment Corporation (Drive Electric Vermont)
- VTrans EV Charging Plan (7/11/2013) Assumed Value: Forecast load begins at 63MWh in 2015, increasing dramatically
for the first 10 years as electric vehicle penetration increases. The load from electric vehicles levels off as the market becomes more saturated and battery technology is assumed to improve.
Entry Area: “Load Forecast” Sheet of IRPResults4 spreadsheet. Sensitivity: Low sensitivity set to 50% of expected load, high set at 140% of
expected load from electric vehicles.

64
Variable Name: RNS Rates Base Case Source: Published ISO-NE estimated RNS rates from 2015-18, escalated
by the average rate of increase from 2015-2018. (5.84%) Assumed Value: $8.08 per kW-month increasing to $23.77 per kW-month in 2034. Entry Area: “Price Forecast” Sheet of IRPResults4 spreadsheet. Sensitivity: +/- 2 standard deviations from historical 2000-2014 RNS Rates
linear line of best fit.
Discussion: The past 5-10 years have seen significant regional investments in transmission infrastructure in New England. According to the ISO-NE 2014 Regional System Plan, there was $6 billion of transmission investment since 2002, with another $4.5 billion planned in the near future, a near doubling of in-service value of regional transmission. Instead of having a significant jump in rate followed by a small increase, the forecast smoothed the increase in RNS charges based on the average annual rate of increase over a number of years.
In order to determine the high and low cases, RNS rates were
graphed relative to a linear line of best fit. The standard deviation was calcluated bsed on the annual difference between this line of best fits and the actual RNS rate. The below chart shows the resulting base, high, and low cases. While the high case appears to be extreme in this analysis, it was determined that it was a reasonable outcome considering that the RNS rate has increased by a multiple of 7 since 2000. With the potential for RNS rate to cover non-electric infrastructure (such as gas pipelines) and/or "public policy" transmission along with traditional load growth and asset condition related investments, another 7x increase within 20 years is within the realm of possibility.
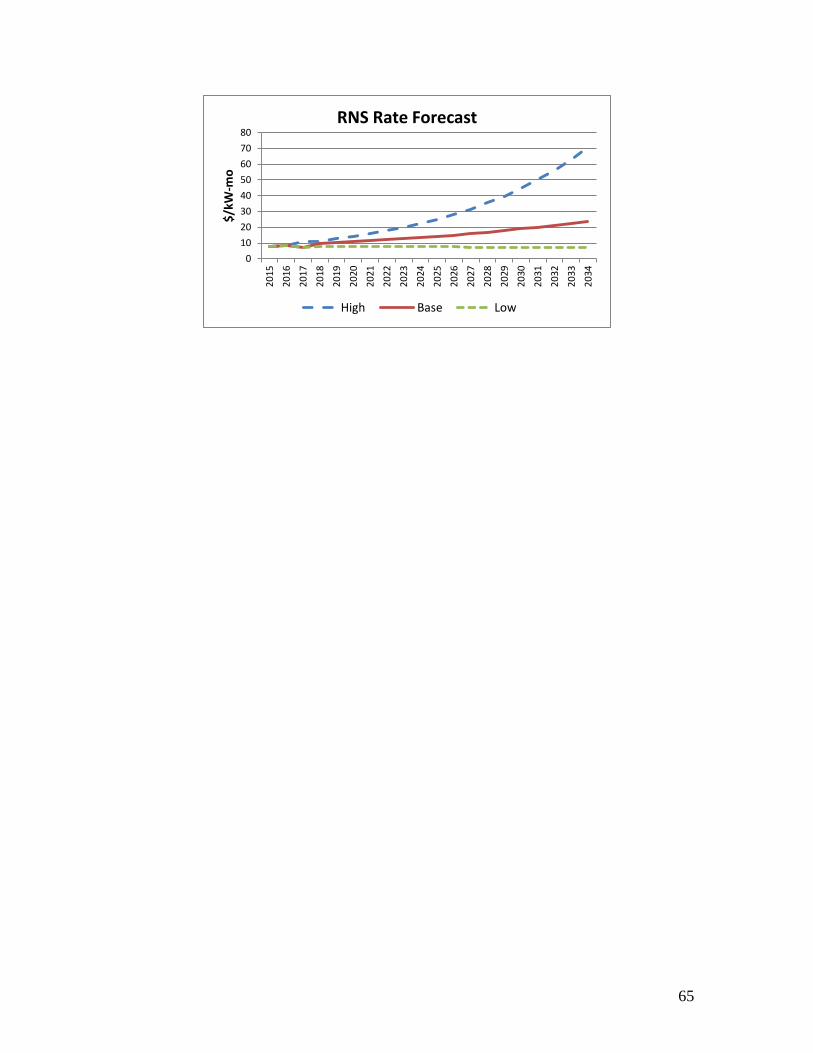
65
01020304050607080
2015
2016
2017
2018
2019
2020
2021
2022
2023
2024
2025
2026
2027
2028
2029
2030
2031
2032
2033
2034
$/kW
-mo
RNS Rate Forecast
High Base Low

66
Variable Name: Capacity Load Obligation Base Case Source: Load forecast (see forecast description for details on its creation)
increased by the objective capability adjustment of 29.11%. This is the basis on which ISO-NE issues capacity charges for load.
Assumed Value: Just over 80MW increasing to 82.5MW in 2034. Entry Area: “Load Forecast” Sheet of IRPResults4 spreadsheet. Sensitivity: +/- 2 standard deviations

67
Variable Name: Monthly Peak (Trans.) Base Case Source: The monthly peak value is developed in the forecast as described
in Section 4.5. This value is multiplied by the assumed Transmission, Regional Network Service Charge, and other appropriate rates to create a value for these Non-Energy Charges.
Assumed Value: Varies by month. Entry Area: “Load Forecast” Sheet of IRPResults4 spreadsheet. Sensitivity: +/- 10%
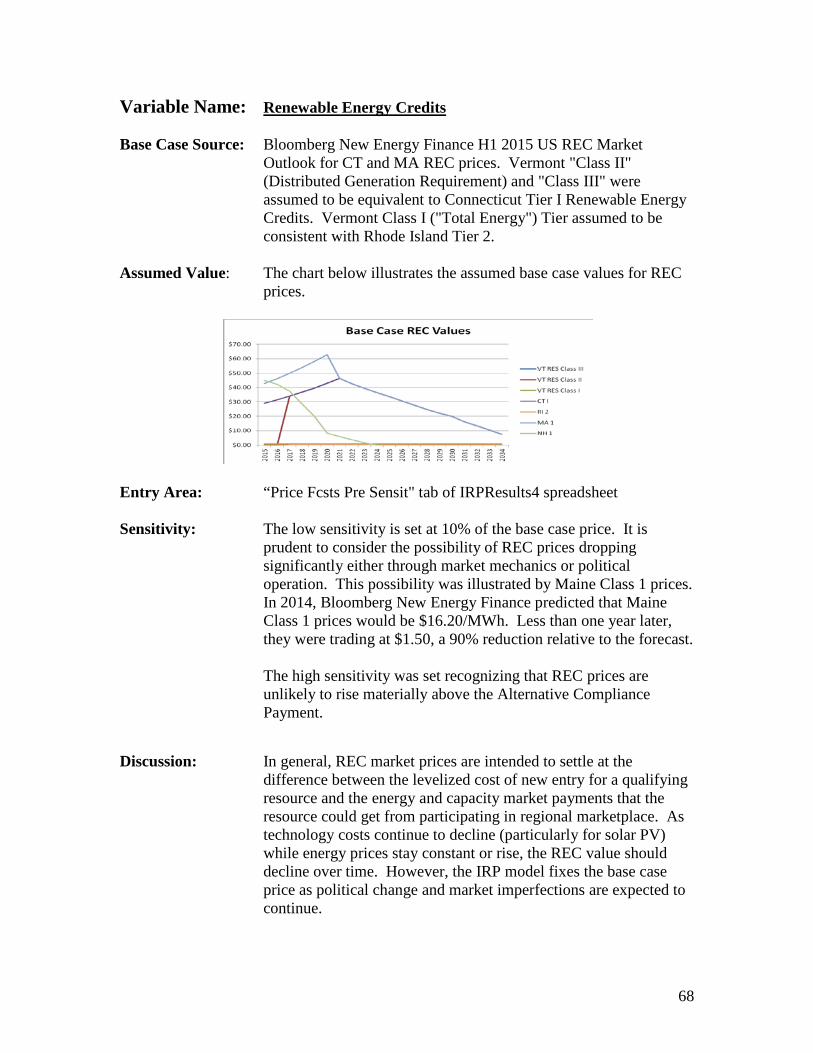
68
Variable Name: Renewable Energy Credits Base Case Source: Bloomberg New Energy Finance H1 2015 US REC Market
Outlook for CT and MA REC prices. Vermont "Class II" (Distributed Generation Requirement) and "Class III" were assumed to be equivalent to Connecticut Tier I Renewable Energy Credits. Vermont Class I ("Total Energy") Tier assumed to be consistent with Rhode Island Tier 2.
Assumed Value: The chart below illustrates the assumed base case values for REC
prices.
Entry Area: “Price Fcsts Pre Sensit" tab of IRPResults4 spreadsheet Sensitivity: The low sensitivity is set at 10% of the base case price. It is
prudent to consider the possibility of REC prices dropping significantly either through market mechanics or political operation. This possibility was illustrated by Maine Class 1 prices. In 2014, Bloomberg New Energy Finance predicted that Maine Class 1 prices would be $16.20/MWh. Less than one year later, they were trading at $1.50, a 90% reduction relative to the forecast.
The high sensitivity was set recognizing that REC prices are
unlikely to rise materially above the Alternative Compliance Payment.
Discussion: In general, REC market prices are intended to settle at the difference between the levelized cost of new entry for a qualifying resource and the energy and capacity market payments that the resource could get from participating in regional marketplace. As technology costs continue to decline (particularly for solar PV) while energy prices stay constant or rise, the REC value should decline over time. However, the IRP model fixes the base case price as political change and market imperfections are expected to continue.

69
Variable Name: LMP Basis to Hub Base Case Source: Jan 2010-May 2015 historical Hub price data relative to relevant
nodes, by month. Assumed Value: Varies by node. Entry Area: “Basis Variance” Sheet of IRPResults4 spreadsheet. Sensitivity: +/- two standard deviations of the difference between the Hub
(4000) and VT zones (4003). Discussion: Rates associated with energy resources adjusted depending on appropriate node where unit is located.
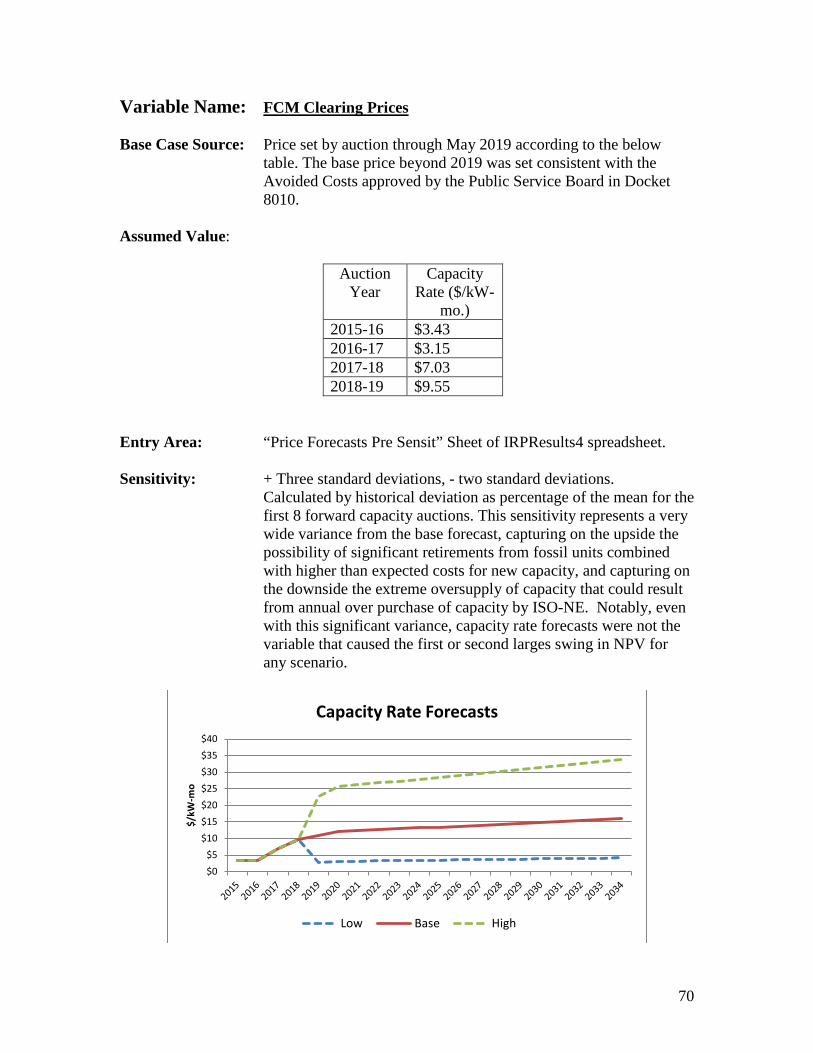
70
Variable Name: FCM Clearing Prices Base Case Source: Price set by auction through May 2019 according to the below
table. The base price beyond 2019 was set consistent with the Avoided Costs approved by the Public Service Board in Docket 8010.
Assumed Value:
Auction
Year Capacity
Rate ($/kW-mo.)
2015-16 $3.43 2016-17 $3.15 2017-18 $7.03 2018-19 $9.55
Entry Area: “Price Forecasts Pre Sensit” Sheet of IRPResults4 spreadsheet. Sensitivity: + Three standard deviations, - two standard deviations.
Calculated by historical deviation as percentage of the mean for the first 8 forward capacity auctions. This sensitivity represents a very wide variance from the base forecast, capturing on the upside the possibility of significant retirements from fossil units combined with higher than expected costs for new capacity, and capturing on the downside the extreme oversupply of capacity that could result from annual over purchase of capacity by ISO-NE. Notably, even with this significant variance, capacity rate forecasts were not the variable that caused the first or second larges swing in NPV for any scenario.
$0$5
$10$15$20$25$30$35$40
$/kW
-mo
Capacity Rate Forecasts
Low Base High

71
Variable Name: Forward Reserve Market Projection Base Case Source: Expected FRM prices for 2015 and 2016, increased by inflation. Assumed Value: $4.34/kW-month declining to $3.39/kW-month in 2016, then
increasing by inflation. Entry Area: “Price Fcsts Pre Sensit” Sheet of IRPResults4 spreadsheet. Sensitivity: +/- two standard deviations, using historic standard deviation as a
percentage of the mean for FRM auction clearing prices starting winter of 2006-7.

72
Variable Name: Load Forecast Base Case Source: Base case forecasts are prepared by VPPSA. Assumed Value: See Load Forecast section of this IRP. Entry Area: “Load Forecast” Sheet of IRPResults4 spreadsheet. Sensitivity: The Load Forecast variable is structured to stress the reaction of
the load forecast to extreme weather conditions that may result from Climate Change. This variable is independent from the "Load Forecast Error" variable, which is distinguished in that the latter is intended to address structural changes in load due to the changing nature of customer's relationship with electricity and energy choices in general.
To develop the high Load Forecast case, the base case forecast models were modified by increasing the temperature 5° during the warmer 6 months of the year and decreasing the temperature 5° during the cooler 6 months of the year. We then determined the average annual percent increase in load that this resulted in among all systems (currently 3.7%). Because the model treats increases in CDDs/HDDs the same as decreases in CDDs/HDDs, theoretically a low case should have nearly the same percent departure as the high case, just in the opposite direction. Therefore we used that same percentage to stress the model to a low case as well (currently -3.7%).

73
Variable Name: Load Forecast Error Base Case Source: Base case forecasts are prepared by VPPSA. Assumed Value: See Load Forecast section of this IRP. Entry Area: "Load Forecast” Sheet of IRPResults4 spreadsheet. Sensitivity: A variance of 3% on both sides of the base case values were used
for variance / sensitivity testing. Discussion: The Load Forecast Error variable is intended to stress the forecast
due to possible changes in the fundamental drivers in demand. As described in Section 4.6, continued energy efficiency programs, rapid net metering deployment, and the standard offer program have significantly changed the trajetory of consumption. As those transformations continue to materialize, other near term technologies and load management tools such as heat pumps or advanced rate design could further change the fundamental drivers of the load forecast. The load forecast is stressed to account for these potential changes that would affect load. See system descriptions for discussions on individual load forecasts.

74
Variable Name: Discount Rate Base Case Source: Current cost of capital for VPPSA members. Assumed Value: 3.25% Entry Area: “Sensit Input Table” of IRPResults4 spreadsheet. Sensitivity: +- .5%. This is within the expected range that VPPSA members
may pay for capital. Discussion: Testing variance on discount rate is intended to reveal if any
potential resource configurations are more sensitive to discount rate assumptions (due to timing of benefits and costs) than others. The theory is that a large variance would indicate a plan where resource configuration’s benefits (or costs) are heavily front end weighted.
75
Variable Name: Inflation Base Case Source: Fifteen year average from January 2000 to Dec 2014. Assumed Value: 2.145% Entry Area: “Inflation” Sheet of IRPResults4 spreadsheet. Sensitivity: The sensitivity was developed by using the standard deviation of
inflation 1983 to 2014, divided by the mean. The range is set such that the low case assumes 1.06% inflation, while the high case assumes 3.23% inflation.
Discussion: Inflation is generally used in the VPPSA IRP model to provide
future forecasts of variables that do not have specific projections but are expected to increase over time.

76
Appendix 2: Model Directions CapEgyCalc5.xlsm – INPUT TEMPLATE Preliminary Steps / Setup 1. Save the CapEgyCalc5.xlsm Spreadsheet and the IRPResults4.xls Spreadsheet
into the same directory as each other. Global Information (Sheet “Initial”)
1. Select the Utility to be evaluated using the command button labeled “Select Utility”. The model’s default value is “VT Public Power Supply Authority.”
2. Define the first and last years to be evaluated. 2015 is currently being used as the
lead year.
3. Enter allowable types (generally fuel based) into the types table in cells J20:L30 of the “Initial” sheet.
4. Enter allowable suppliers into the suppliers table in cells J59:P89 of the “Initial”
sheet. A supplier may provide multiple resources but totals by supplier will be provided in the output spreadsheet.
Resource Data Inputs (Sheets “ResDef1” and “ResDef2”) Supplier: Textual – must match a choice entered into the supplier list on cells
J59:P89 of the “Initial” sheet. Resource Name: Textual / Descriptive ID(#): A short unique textual identifier for each resource. Dispatch: Resource output must be characterized in terms of whether or not the
resource provides capacity deliveries and how its energy deliveries are distributed on to off peak. This is done by selecting one (or a combination of) the following identifiers:
Cap: For capacity only 5x16 Energy deliveries weekdays HE8-HE23 7x16 Energy deliveries all days HE8-HE23 7x24 Energy delivery all days – all hours OfPk Energy deliveries not included in 5x16

77
7x08 Energy deliveries all days HE1-HE7 and HE23 2x16 Energy deliveries weekends HE8-HE23 5x08 Energy deliveries weekdays HE1-HE7 and HE23 6733 Energy deliveries 2/3 on peak – balance off peak 6040 Energy deliveries 60% on peak – balance off peak 7030 Energy deliveries 70% on peak – balance off peak BarH Energy deliveries based on historical Barton hydro data EnoH Energy deliveries based on historical Enosburg hydro data HarH Energy deliveries based on historical Hardwick hydro data LynH Energy deliveries based on historical Lyndonville hydro data MorH Energy deliveries based on historical Morrisville hydro data SwaH Energy deliveries based on historical Swanton hydro data HyQu Maximizes on peak deliveries – balance (to contract CF) to off
peak McNe Maximizes on peak deliveries – balance (to normal CF) to off peak Niag Energy deliveries based on historical Niagara hydro data StLa Energy deliveries based on historical St Lawrence hydro data Pkr Energy deliveries weekdays HE8-HE23
Sola Energy deliveries based on a solar profile using PV watts Wind Energy deliveries based on a past wind project contemplated for East Mountain
For units providing both capacity and energy the identifier would be combined as shown
in the following example: Cap+5x16 For a unit providing capacity and energy during the ISO-NE peak period EforD: The Equivalent Forced Outage Rate “EforD” is used to de-rate the market
capacity value for a unit. This is no longer used. Type: Textual – must match a choice entered into the types listed in cells
J20:L30 of the “Initial” sheet. As part of the type a three numeral designation indicating the percent of Renewable Energy Credits “RECS” should be indicated. For example:
BM050 Would indicate a biomass facility with 50% of its output
qualifying for REC treatment. Black Start? Yes/No depending on whether or not the unit is expected to be
accepted into, to receive payments from, the ISO-NE system restoration tariff.

78
Forward Reserve? Yes/No depending on whether or not the unit is expected to participate in and receive payments from the ISO-NE Forward Reserve auction process.
Nominal kW: The nominal capacity by month/year should be entered. It is this
capacity that will be used in combination with the capacity charge per kW to determine capacity costs by resource, and in combination with the capacity factor by month to determine energy deliveries.
Capacity Cost: Should be in nominal dollars by year (as opposed to constant year
costs) and is used in combination with the Nominal kW to determine annual capacity costs.
Market Cap kW: The units market capacity value. Under the Forward Capacity
Market “FCM”, the ratings are the summer and winter qualified capacity by month.
Capacity Factor: The expected monthly capacity factor the unit will provide in terms of energy delivered in proportion to its Nominal kW rating and the hours in the month.
Energy Price: Should be in nominal dollars by year (as opposed to constant year
costs) and is used in combination with the Nominal kW and Capacity Factor to determine annual energy costs.
Resource Data Inputs (Sheet “UAP”) This table allows the aggregate results for any scenario to be recreated for a specific utility as long as all resources have been allocated to utilities. For each resource enter the following information: ID(#) Must match (exactly) the same information for one of the resources on
either sheets ResDef1 or ResDef2. Utility Identifier: A unique 3 letter code for each utility Utility Name: A detailed name for each utility. At this time, generic (or
planning) resources are treated as belonging to a fictional VPPSA utility (PLA) with this fictional utility possessing 100% of the entitlement to these resources. This allows planning resources to be quickly “turned on” or “turned off” by entering 0% allocation to PLA.
Utility Number: A unique numeric identifier for each utility. Currently these are set
to the VELCO utility ID’s.

79
VPPSA: Each utility can be identified as belonging to VPPSA or not. In the block below the utility name, enter “VPPSA” or leave the field blank.
Allocation percent: For each resource – utility – month combination an entitlement (in
percent) should be entered. Allocations should total to 100% on the rows labeled “All” (Rows 10-21). The combined VPPSA entitlement (Rows 22-33) need not total to 100% if there are non-VPPSA utilities entered in the model as there are now.
Energy Delivery / Dispatch (Sheet “OnOffHr”) Seven standard dispatch shapes (allocations of energy to on and off peak hours) are
provided and fifteen more custom shapes may be defined. Each dispatch shape must have a unique identifier that is the entered on the ResDef1 and ResDef2 sheets for appropriate resources.
Other Purchased Power Expenses (Sheet “NonEgyChgs”) In order to provide as complete a picture as possible of purchase power expenses and the
relative effects of decisions, costs for non-modeled items such as: Ancillary Markets Transmission Charges Other Charges The projected costs for these items are entered from VPPSA’s most recent detailed
budgets. This information will be exported to the results spreadsheet where it is converted into average costs per kWh of load and increased by inflation to extended it into the future.
Load Forecasts (Sheet “Load”) For each utility the following information is entered: Utility Name: Must match a utility name from the “UAP” sheet. Utility ID: Must match a 3 letter code from the “UAP” sheet. Demand: Annual peak demand at the system inlet. Energy: Annual total system load at the system inlet (this includes loads served by
generating resources internal to the system). Sub-transmission Losses: Losses between the system inlet and the VELCO
transmission system in percent. Generally defined in the transmission providers applicable tariff. Sub-transmission losses are utility specific.
80
On Pk Energy: The percent of the forecast load expected to occur in the ISO-NE
defined on peak hours. Percent of load on peak is utility specific. VELCO Losses: VELCO transmission losses (TNL) are entered as a percent. Due
to somewhat unusual accounting for low voltage PTF losses these can be negative. These losses are applied to all utilities.
Other Losses: Two other entry areas are allowed for transmission losses but are
not currently in use. These losses would be applied to all utilities. Objective Capability Adjustment: This is used to convert forecast system peak to
UCAP obligation. . Exporting Data To The Results Spreadsheet 1. Check that all of the user input data (shown in blue) on the Initial Worksheet as
well as the other worksheets is as you wish. Make any necessary changes.
2. Select the desired utility (or group) you wish to calculate. Use the command button at Cell "I7" to provide a list of candidates for selection. The utility identification information is entered via the user's selection from this list.
3. Push the “Resources Defined” command button to populate the list and the “Get
Resource Data" command button on the Initial Worksheet to initiate the calculation of the IRP Results Spreadsheet. The results, based on the data in the CapEgyCalc5 Spreadsheet, the user's selections, and the minimal data recorded on the blue tab worksheets of the IRP Results Spreadsheet, will be automatically presented to the user for review.
REMINDERS:
a. The IRPResults4.xls Spreadsheet must be an existing file. The
CapEgyCalc5.xlsm Spreadsheet will not create, from scratch, a results spreadsheet. Make the information changes you require on the blue tab worksheets of the IRPResults4.xls Spreadsheet, which is of a generic nature (i.e., REC values, inflation information, projected market capacity and energy prices), before you run the CapEgyCalc5 Spreadsheet. Note, all of the results contained on the IRPResults4.xls Spreadsheet are calculated from the user defined data/choices selected on the CapEgyCalc5.xlsm Spreadsheet each time the spreadsheet is run. An existing IRPResults4.xls Spreadsheet is required as it is used in formatting the results and certain calculations are based on spreadsheet formulas rather than code calculations. (An expedient to keep programming costs down.)

81
b. Before running the CapEgyCalc5.xlsm Spreadsheet (i.e., "pushing" the
"Get Resource Data" button), make sure that the IRPResults4.xls Spreadsheet that will be calculated (i.e., that indicated in Cell "E10") is closed. An error will occur otherwise.

82
IRPRESULTS4.xls– OUTPUT TEMPLATE This spreadsheet does not possess macros. Once the data is input from the
CapEgyCalc5 spreadsheet, the base case results are available. Performing Sensitivity analysis requires an inexpensive add-in called SensIt that tests the base case results for sensitivity to changes in identified key variables.
General Notes: SensIt (an inexpensive Excel add-in) is required to perform sensitivity analysis but is not
required for interim results and base case power costs by year.
1. Table of Contents Sheet This sheet lists the sheets (tabs) of the IRPResults4 spreadsheet in the order that they
appear. Command buttons allowing quick navigation to important sheets (and sheets “buried” deep in the workbook) are provided and if clicked will take the user directly to the sheet in question.
2. Inflation Estimate (Based on Consumer Price Index) This sheet only requires periodic update. Currently inflation is set at 2.145% and based
on the average change annually between January 2000 and January 2014. 2. SensIt Variable Ranges If SensIt (an Excel add-in) is installed, this table allows the user to input sensitivity
ranges around the base case for each variable and to output the “swings” or changes in base case results from increasing and decreasing the key variable from base case to each extreme.
3. Price Forecasts Pre SensIt Adjustment This page contains the inputs prior to any adjustments from the SensIt add-in and requires
extensive data entry in the form of forecasts for:
• Natural Gas Prices • New England Effective Heat Rates • Forecasts of market capacity prices, • Forecasts of Forward Reserves auction values • Forecasts of Transmission Benefit payments (Blackstart) • REC credit values by type • Forecasts of Regional Network Service rates

83
4. Price Forecasts This page is in an identical format to the Price Forecasts Pre SensIt Adjustment but
incorporates any SensIt driven changes to the cells highlighted in olive green.
5. Load Forecast Imports (and SensIt adjusts) the energy forecast for the system identified in the
CapEgyCalc5 spreadsheet. Also converts the peak demand forecast to a UCAP obligation forecast using the Objective Capability Adjustment. This tab also includes the new Vermont Renewable Energy Standard Assumptions
6. Basis Variance This sheet shows the average difference in prices between nodes where resources are
credited and the Massachusetts Hub price. This allows for different pricing for resources while using a single forecasted price provided by CME Group and modified by VPPSA for outer years.
7. Resource Entitlements (kW) This sheet shows, by resource and year, the entitlement in each resource for energy
purposes only. This is used in combination with the CF% to arrive at energy by resource and year. The kW entitlements shown here do NOT represent market capacity. For example, an energy-only market contract would show a nominal entitlement on this spreadsheet while a market capacity-only contract would not.
8. Annual Energy Availability/Capacity Factor (%) This sheet is used to derive annual energy from each resource. 9. Energy Availability Adjustments Allows wholesale changes to the availability of a resource by turning it off (0%). The
default is 100%. 10. Energy Rates ($/MWh ) This sheet is used to derive annual energy costs by resource by year. 11. Energy Rate Adjustments

84
Identifies and incorporates any SensIt based adjustments to Energy Charges. Cells
currently subject to such changes are shaded in olive green. A value of 100% represents no change from base case assumptions.
12. Capacity Rates ($/kW-Year ) This sheet is used to derive annual capacity costs by resource by year. 13. Capacity Rate Adjustments Identifies and incorporates any SensIt based adjustments to Energy Charges. Cells
currently subject to such changes are shaded in olive green. A value of 100% represents no change from base case assumptions.
14. Market Capacity (kW) This sheet shows the gross (before EforD) market capacity entitlement for the peak
month (currently August) by resource by year. 15. Capacity eFOR'D UCAP Value Factor (%) This sheet summarizes the EforD (which serves to reduce available capacity from
resources) for each resource and is no longer relevant 16. Capacity Entitlement/UCAP (kW) This sheet shows the market capacity entitlement by resource by year as reduced to
account for EforD. 17. Forward Reserve Entitlement (kW) This sheet shows the kW value of any resource identified as providing Forward Reserve
service. 18. Black Start Entitlement (kW) This sheet shows the kW value of any resource identified as providing System
Restoration (Black Start) service. 19. Energy Entitlements (kWh) This sheet shows the summary of the on and off peak deliveries from the next sheet 20. Allocation of Energy Entitlements to On/Off-Peak Periods (kWh)

85
This sheet shows the deliveries by resource and year into the on and off peak periods
(based on the ISO-NE definition of these periods). 21. Energy Charges ($) This sheet shows the cost for energy by resource and year. 22. Energy Credits ($) This sheet shows the payments for energy deliveries (at LMP) by resource by year. 23. Capacity Charges ($) This sheet shows the cost for capacity by resource and year. 24. Capacity Credits ($) This sheet shows the payments for deliveries of capacity (at the forecast market capacity
price) by resource by year. 25. Forward Reserve Credits ($) This sheet shows any forecasted resource payments for participation in the Forward
Reserve markets. 26. Trans Credits) ($) This sheet shows any projected payments for resources providing system restoration
service. 27. Renewable Credits by Category (REC ) This sheet shows any projected resource revenues for sales of REC’s. 28. Non-Energy Costs ($ or $/kWh) This sheet shows the estimated non-resource purchase power costs (such as transmission,
ancillary markets etc.) 29. Power Costs ($)

86
This is the main output for the model and provides total forecast of Purchase Power costs. Note that costs for units owned and operated by the VPPSA utilities do not appear in the Purchase Power FERC account and are not modeled here.
30. Energy t by Category (kWh & %) This sheet provides an annual summary of energy by type (generally fuel) and assumed
spot market energy purchases. This sheet is useful for monitoring fuel diversity.
31. Energy by Supplier (kWh & %) This sheet provides an annual summary of energy by supplier and is useful for
monitoring supplier diversity. 32. Resources by Category Chart of this data. 33. UCAP by Source / Capacity Obligations vs. Resources Chart of this data. 34. SensIt 1.31 Probabilistic Results This is an output of the SensIt analysis and a conversion of that output to probabilistic
results.

87
IRP_Run_Assumptions.xlsm – OUTPUT AUTOMATION TEMPLATE This workbook was created to allow for the user to perform multiple iterations of
resource mixes with summarization worksheets created to quickly view the results. This workbook is intended to be the starting point for a user wishing to obtain output from the IRP model once all adjustments have been made to the source files “CapEgyCalc5.xlsm” and “IRPResults4.xls.” The details of the workbook are described below on a sheet by sheet basis.
General Notes: • This workbook requires that the locations of the files “CapEgyCalc5.xlsm” and
“IRPReults4.xls” are in the same directory as IRP_Run_Assumptions.xlsm.
1. Assumptions This worksheet is the main worksheet for this workbook. The large button titled “Run
Scenarios and Summarize” is what is used to create up to 25 different scenarios. The user must change only the box directly to the left of the button (Cell “H18”) with the desired number of scenarios. The routine will create a file titled “IRP_Run_Assumptions_MM_DD_YYYY.xls” in the scenarios output folder. This file will contain summary information on all the runs as well as their corresponding tornado charts. In addition to this summary file, A full scenario detail file will be saved in the same “Scenarios” directory as “IRPResults4_Scenario_ MM_DD_YYYY _X.xls” for every scenario, where “X” stands for the Scenario number. This process will take on average 1 - 2 minutes for every scenario chosen, so for large runs of 25 scenarios be prepared to wait while the routine chugs along. The following descriptions explain the worksheet in more detail. Cell ranges that do not require user input have been put in italics.
a. CapEgyCalc5 and IRPResults4 must be in the same folder as this file b. The output will be in a Scenarios folder within the folder this file is in. This folder will
be created if it does not exist. c. Cell range “A3:U12” are values that are the current forecasted resource needs for
VPPSA. These values come from cell range “C68:AZ68” in the “Energy by Category” tab of “IRPResults4.xls.” The values are titled “Market energy Purchases.”
d. If the user changes the capacity factors for each resource in the cell range “C16:C21” then the required megawatts needed to fulfill the chosen years resource shortage will change accordingly and update the resource definition located on tab “ResDef1” and “ResDef2” in “CapEgyCalc5.xls.”
e. Cell range “D16:D21” can be adjusted to represent the assumed lifetime of a particular resource type. These cells are linked to "CapEgyCalc5.xls", under the "ResDef1" and "ResDef2" tab.
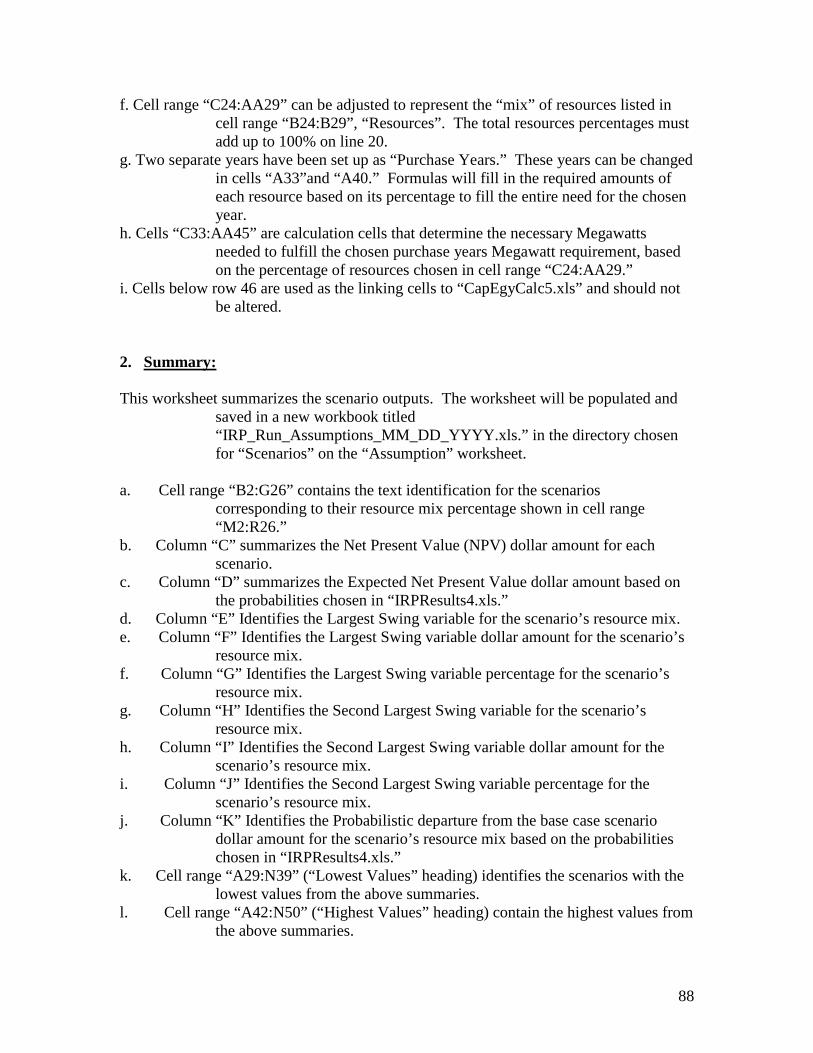
88
f. Cell range “C24:AA29” can be adjusted to represent the “mix” of resources listed in cell range “B24:B29”, “Resources”. The total resources percentages must add up to 100% on line 20.
g. Two separate years have been set up as “Purchase Years.” These years can be changed in cells “A33”and “A40.” Formulas will fill in the required amounts of each resource based on its percentage to fill the entire need for the chosen year.
h. Cells “C33:AA45” are calculation cells that determine the necessary Megawatts needed to fulfill the chosen purchase years Megawatt requirement, based on the percentage of resources chosen in cell range “C24:AA29.”
i. Cells below row 46 are used as the linking cells to “CapEgyCalc5.xls” and should not be altered.
2. Summary: This worksheet summarizes the scenario outputs. The worksheet will be populated and
saved in a new workbook titled “IRP_Run_Assumptions_MM_DD_YYYY.xls.” in the directory chosen for “Scenarios” on the “Assumption” worksheet.
a. Cell range “B2:G26” contains the text identification for the scenarios
corresponding to their resource mix percentage shown in cell range “M2:R26.”
b. Column “C” summarizes the Net Present Value (NPV) dollar amount for each scenario.
c. Column “D” summarizes the Expected Net Present Value dollar amount based on the probabilities chosen in “IRPResults4.xls.”
d. Column “E” Identifies the Largest Swing variable for the scenario’s resource mix. e. Column “F” Identifies the Largest Swing variable dollar amount for the scenario’s
resource mix. f. Column “G” Identifies the Largest Swing variable percentage for the scenario’s
resource mix. g. Column “H” Identifies the Second Largest Swing variable for the scenario’s
resource mix. h. Column “I” Identifies the Second Largest Swing variable dollar amount for the
scenario’s resource mix. i. Column “J” Identifies the Second Largest Swing variable percentage for the
scenario’s resource mix. j. Column “K” Identifies the Probabilistic departure from the base case scenario
dollar amount for the scenario’s resource mix based on the probabilities chosen in “IRPResults4.xls.”
k. Cell range “A29:N39” (“Lowest Values” heading) identifies the scenarios with the lowest values from the above summaries.
l. Cell range “A42:N50” (“Highest Values” heading) contain the highest values from the above summaries.

89
3. Summary Sorted: This worksheet has the exact same format as the “Summary” worksheet with the
exception of an additional column titled “Ranking Value.”. The main difference is that the summarized data from the “Summary” worksheet is sorted by default on the “Expected NPV ($)” from lowest value to highest value. The user can press any of the buttons above the various column headings to resort the data based on the chosen column. For example if the button “LVS Sort” was pressed the information would be re-sorted from lowest to highest value based on the “Largest Variable Swing ($).” In addition to the “Summary” worksheet a “Ranking Value” column has been added to aid in “weighting” the outputs to help identify top performing scenarios. The ranking percentage for each output is located within row 27 and can be changed by the user. A “Ranking Sort” button allows for a sort from lowest to highest value and will need to be activated if ranking values are altered.
4. Generation This tab is used for data manipulation only. The purpose is to format resource generation
needs into monthly values. 5. Expiration_1 This tab is used for data manipulation only. The purpose is to calculate the length in
months of a resources lifetime and to stop the benefit of that resource once the lifetime has been met. This worksheet is concerned with the first year of purchases.
6. Expiration_2 This tab is used for data manipulation only. The purpose is to calculate the length in
months of a resources lifetime and to stop the benefit of that resource once the lifetime has been met. This worksheet is concerned with the second year of purchases.
7. Expiration_3 This tab is used for data manipulation only. The purpose is to calculate the length in
months of a resources lifetime and to stop the benefit of that resource once the lifetime has been met. This worksheet is concerned with the third year of purchases if applicable.
8. Resource Total

90
This tab is used for data manipulation only. The purpose is to calculate the length in months of a resources lifetime and to stop the benefit of that resource once the lifetime has been met. This worksheet is concerned with the total value for all purchase years.
9. LMP This tab is used for data manipulation only. The purpose is to format LMP information
into monthly values. The result was used to forecast LMP’s monthly for the “GenCont” and “Generic VY” resources formerly in the “ResDef2” worksheet in “CapEgyCalc5.xls”
Sens131s.xla – SensIt 1.31 Sensitivity Analysis ADD IN REQUIREMENT The “VPPSA IRP Model” requires the inclusion of the “SensIt 1.31 Sensitivity Analysis”
add-in in order to function properly. This add-in has been included in the portable model files, but the user must still install the add-in so that Microsoft Excel knows where to find the module when called in the automation routine if the add-in has not already installed. The step by step instructions on how to do this are below.
How To
1. Open up the file “IRP_Run_Assumptions.xls” 2. Select File/Options 3. Click Add-Ins 4. Click the Go button next to Manage Add-Ins 5. Browse the file finder to the directory where “Sens131s.xla” is located. By default, it is
in the same directory as this document. 6. All Done! The user should notice that the “SensIt 1.31 Sensitivity Analysis” add-in is
now listed in the “Add-Ins available” list box with a check mark next to it. If it is not checked then be sure to place a check mark next to it.

91
Appendix 3: Resource Scenario Results The following tables and charts illustrate the results of each of the 25 scenarios examined.

92
SensIt 1.31 Scenario 1: SpotMany Inputs, One OutputSingle-Factor Sensitivity Analysis
Date 15-Jul-15 Workbook IRPResults4.xlsTime 5:08 PM Output Cell 'Sensit Input Table'!$C$25
20 YR NPV POWER COSTSCorresponding Input Value Output Value Percent
Input Variable Low Output Base Case High Output Low Base High Swing Swing 2̂Delivered Natural Gas Prices 29.2% 100.0% 170.8% $579,318,982 $646,302,451 $713,285,919 $133,966,938 42.0%
Implied Heat Rate 63.0% 100.0% 137.0% $611,327,840 $646,302,451 $681,277,061 $69,949,222 11.5%Discount rate 115.4% 100.0% 84.6% $614,577,736 $646,302,451 $680,374,027 $65,796,292 10.1%
Regional Network Service Rates 82.3% 100.0% 117.7% $613,484,531 $646,302,451 $679,120,377 $65,635,847 10.1%Capacity Load Obligation 94.8% 100.0% 110.5% $629,663,288 $646,302,451 $682,271,399 $52,608,111 6.5%
Renewable Energy Credits 120.0% 100.0% 10.0% $638,054,906 $646,302,451 $683,416,401 $45,361,495 4.8%Monthly Peak (Trans) 90.0% 100.0% 110.0% $626,111,119 $646,302,451 $667,944,817 $41,833,698 4.1%
VT Renewable Portfolio Standard 0.0% 100.0% 175.0% $631,324,479 $646,302,451 $669,546,943 $38,222,464 3.4%FCA Clearing Prices 25.9% 100.0% 211.2% $632,608,759 $646,302,451 $666,842,988 $34,234,229 2.7%FRM Clearing Prices 157.8% 100.0% 42.2% $631,347,906 $646,302,451 $661,256,995 $29,909,088 2.1%
Load Forecast -3.7% 0.0% 3.7% $634,603,867 $646,302,451 $658,001,034 $23,397,166 1.3%Load Forecast Error Percentage -3.0% 0.0% 3.0% $636,817,113 $646,302,451 $655,787,788 $18,970,675 0.8%
Inflation 49.3% 100.0% 150.7% $639,689,892 $646,302,451 $653,853,789 $14,163,897 0.5%Electric Vehicles 50.0% 100.0% 140.0% $646,199,809 $646,302,451 $646,384,563 $184,754 0.0%
LMP Basis to HUB 97.9% 100.0% 102.1% $646,302,451 $646,302,451 $646,302,451 $0 0.0%
29.2%
63.0%
115.4%
82.3%
94.8%
120.0%
90.0%
0.0%
25.9%
157.8%
-3.7%
-3.0%
49.3%
50.0%
97.9%
170.8%
137.0%
84.6%
117.7%
110.5%
10.0%
110.0%
175.0%
211.2%
42.2%
3.7%
3.0%
150.7%
140.0%
102.1%
$550,000,000 $650,000,000 $750,000,000
Delivered Natural Gas Prices
Implied Heat Rate
Discount rate
Regional Network Service Rates
Capacity Load Obligation
Renewable Energy Credits
Monthly Peak (Trans)
VT Renewable Portfolio Standard
FCA Clearing Prices
FRM Clearing Prices
Load Forecast
Load Forecast Error Percentage
Inflation
Electric Vehicles
LMP Basis to HUB
20 YR NPV POWER COSTS
Sensit 1.31
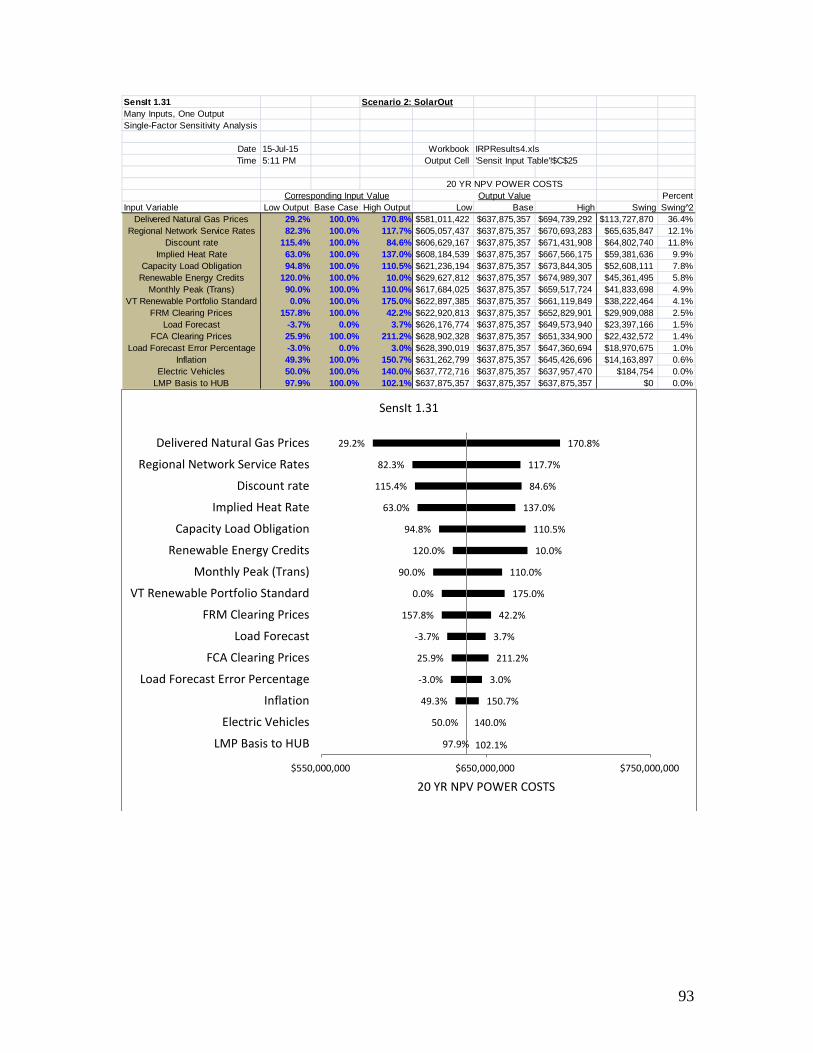
93
SensIt 1.31 Scenario 2: SolarOutMany Inputs, One OutputSingle-Factor Sensitivity Analysis
Date 15-Jul-15 Workbook IRPResults4.xlsTime 5:11 PM Output Cell 'Sensit Input Table'!$C$25
20 YR NPV POWER COSTSCorresponding Input Value Output Value Percent
Input Variable Low Output Base Case High Output Low Base High Swing Swing 2̂Delivered Natural Gas Prices 29.2% 100.0% 170.8% $581,011,422 $637,875,357 $694,739,292 $113,727,870 36.4%
Regional Network Service Rates 82.3% 100.0% 117.7% $605,057,437 $637,875,357 $670,693,283 $65,635,847 12.1%Discount rate 115.4% 100.0% 84.6% $606,629,167 $637,875,357 $671,431,908 $64,802,740 11.8%
Implied Heat Rate 63.0% 100.0% 137.0% $608,184,539 $637,875,357 $667,566,175 $59,381,636 9.9%Capacity Load Obligation 94.8% 100.0% 110.5% $621,236,194 $637,875,357 $673,844,305 $52,608,111 7.8%
Renewable Energy Credits 120.0% 100.0% 10.0% $629,627,812 $637,875,357 $674,989,307 $45,361,495 5.8%Monthly Peak (Trans) 90.0% 100.0% 110.0% $617,684,025 $637,875,357 $659,517,724 $41,833,698 4.9%
VT Renewable Portfolio Standard 0.0% 100.0% 175.0% $622,897,385 $637,875,357 $661,119,849 $38,222,464 4.1%FRM Clearing Prices 157.8% 100.0% 42.2% $622,920,813 $637,875,357 $652,829,901 $29,909,088 2.5%
Load Forecast -3.7% 0.0% 3.7% $626,176,774 $637,875,357 $649,573,940 $23,397,166 1.5%FCA Clearing Prices 25.9% 100.0% 211.2% $628,902,328 $637,875,357 $651,334,900 $22,432,572 1.4%
Load Forecast Error Percentage -3.0% 0.0% 3.0% $628,390,019 $637,875,357 $647,360,694 $18,970,675 1.0%Inflation 49.3% 100.0% 150.7% $631,262,799 $637,875,357 $645,426,696 $14,163,897 0.6%
Electric Vehicles 50.0% 100.0% 140.0% $637,772,716 $637,875,357 $637,957,470 $184,754 0.0%LMP Basis to HUB 97.9% 100.0% 102.1% $637,875,357 $637,875,357 $637,875,357 $0 0.0%
29.2%
82.3%
115.4%
63.0%
94.8%
120.0%
90.0%
0.0%
157.8%
-3.7%
25.9%
-3.0%
49.3%
50.0%
97.9%
170.8%
117.7%
84.6%
137.0%
110.5%
10.0%
110.0%
175.0%
42.2%
3.7%
211.2%
3.0%
150.7%
140.0%
102.1%
$550,000,000 $650,000,000 $750,000,000
Delivered Natural Gas Prices
Regional Network Service Rates
Discount rate
Implied Heat Rate
Capacity Load Obligation
Renewable Energy Credits
Monthly Peak (Trans)
VT Renewable Portfolio Standard
FRM Clearing Prices
Load Forecast
FCA Clearing Prices
Load Forecast Error Percentage
Inflation
Electric Vehicles
LMP Basis to HUB
20 YR NPV POWER COSTS
SensIt 1.31

94
SensIt 1.31 Scenario 3: SolarInMany Inputs, One OutputSingle-Factor Sensitivity Analysis
Date 15-Jul-15 Workbook IRPResults4.xlsTime 5:13 PM Output Cell 'Sensit Input Table'!$C$25
20 YR NPV POWER COSTSCorresponding Input Value Output Value Percent
Input Variable Low Output Base Case High Output Low Base High Swing Swing 2̂Delivered Natural Gas Prices 29.2% 100.0% 170.8% $572,208,046 $622,557,113 $672,906,179 $100,698,133 31.0%
Regional Network Service Rates 82.3% 100.0% 117.7% $589,739,193 $622,557,113 $655,375,039 $65,635,847 13.2%Discount rate 115.4% 100.0% 84.6% $592,171,769 $622,557,113 $655,189,181 $63,017,412 12.2%
Renewable Energy Credits 120.0% 100.0% 10.0% $611,790,567 $622,557,113 $671,006,566 $59,215,998 10.7%Capacity Load Obligation 94.8% 100.0% 110.5% $605,917,950 $622,557,113 $658,526,061 $52,608,111 8.5%
Implied Heat Rate 63.0% 100.0% 137.0% $596,267,954 $622,557,113 $648,846,271 $52,578,316 8.5%Monthly Peak (Trans) 90.0% 100.0% 110.0% $602,365,781 $622,557,113 $644,199,479 $41,833,698 5.4%
VT Renewable Portfolio Standard 0.0% 100.0% 175.0% $607,579,141 $622,557,113 $645,801,605 $38,222,464 4.5%FRM Clearing Prices 157.8% 100.0% 42.2% $607,602,568 $622,557,113 $637,511,657 $29,909,088 2.7%
Load Forecast -3.7% 0.0% 3.7% $610,858,529 $622,557,113 $634,255,696 $23,397,166 1.7%Load Forecast Error Percentage -3.0% 0.0% 3.0% $613,071,775 $622,557,113 $632,042,450 $18,970,675 1.1%
Inflation 49.3% 100.0% 150.7% $615,944,554 $622,557,113 $630,108,452 $14,163,897 0.6%FCA Clearing Prices 211.2% 100.0% 25.9% $621,441,865 $622,557,113 $623,300,611 $1,858,746 0.0%
Electric Vehicles 50.0% 100.0% 140.0% $622,454,471 $622,557,113 $622,639,225 $184,754 0.0%LMP Basis to HUB 97.9% 100.0% 102.1% $622,557,113 $622,557,113 $622,557,113 $0 0.0%
29.2%
82.3%
115.4%
120.0%
94.8%
63.0%
90.0%
0.0%
157.8%
-3.7%
-3.0%
49.3%
211.2%
50.0%
97.9%
170.8%
117.7%
84.6%
10.0%
110.5%
137.0%
110.0%
175.0%
42.2%
3.7%
3.0%
150.7%
25.9%
140.0%
102.1%
$550,000,000 $650,000,000 $750,000,000
Delivered Natural Gas Prices
Regional Network Service Rates
Discount rate
Renewable Energy Credits
Capacity Load Obligation
Implied Heat Rate
Monthly Peak (Trans)
VT Renewable Portfolio Standard
FRM Clearing Prices
Load Forecast
Load Forecast Error Percentage
Inflation
FCA Clearing Prices
Electric Vehicles
LMP Basis to HUB
20 YR NPV POWER COSTS
SensIt 1.31

95
SensIt 1.31 Scenario 4: FixConMany Inputs, One OutputSingle-Factor Sensitivity Analysis
Date 15-Jul-15 Workbook IRPResults4.xlsTime 5:16 PM Output Cell 'Sensit Input Table'!$C$25
20 YR NPV POWER COSTSCorresponding Input Value Output Value Percent
Input Variable Low Output Base Case High Output Low Base High Swing Swing 2̂Discount rate 115.4% 100.0% 84.6% $619,822,908 $651,829,603 $686,199,640 $66,376,732 20.9%
Regional Network Service Rates 82.3% 100.0% 117.7% $619,011,683 $651,829,603 $684,647,529 $65,635,847 20.5%Capacity Load Obligation 94.8% 100.0% 110.5% $635,190,440 $651,829,603 $687,798,551 $52,608,111 13.1%
Renewable Energy Credits 120.0% 100.0% 10.0% $643,582,058 $651,829,603 $688,943,553 $45,361,495 9.8%Monthly Peak (Trans) 90.0% 100.0% 110.0% $631,638,271 $651,829,603 $673,471,970 $41,833,698 8.3%
VT Renewable Portfolio Standard 0.0% 100.0% 175.0% $636,851,631 $651,829,603 $675,074,095 $38,222,464 6.9%FCA Clearing Prices 25.9% 100.0% 211.2% $638,135,911 $651,829,603 $672,370,140 $34,234,229 5.6%FRM Clearing Prices 157.8% 100.0% 42.2% $636,875,059 $651,829,603 $666,784,147 $29,909,088 4.2%
Delivered Natural Gas Prices 29.2% 100.0% 170.8% $636,906,149 $651,829,603 $666,753,056 $29,846,907 4.2%Load Forecast -3.7% 0.0% 3.7% $640,131,020 $651,829,603 $663,528,186 $23,397,166 2.6%
Load Forecast Error Percentage -3.0% 0.0% 3.0% $642,344,265 $651,829,603 $661,314,940 $18,970,675 1.7%Implied Heat Rate 63.0% 100.0% 137.0% $644,037,501 $651,829,603 $659,621,704 $15,584,203 1.2%
Inflation 49.3% 100.0% 150.7% $645,217,044 $651,829,603 $659,380,942 $14,163,897 1.0%Electric Vehicles 50.0% 100.0% 140.0% $651,726,962 $651,829,603 $651,911,716 $184,754 0.0%
LMP Basis to HUB 97.9% 100.0% 102.1% $651,829,603 $651,829,603 $651,829,603 $0 0.0%
115.4%
82.3%
94.8%
120.0%
90.0%
0.0%
25.9%
157.8%
29.2%
-3.7%
-3.0%
63.0%
49.3%
50.0%
97.9%
84.6%
117.7%
110.5%
10.0%
110.0%
175.0%
211.2%
42.2%
170.8%
3.7%
3.0%
137.0%
150.7%
140.0%
102.1%
$550,000,000 $650,000,000 $750,000,000
Discount rate
Regional Network Service Rates
Capacity Load Obligation
Renewable Energy Credits
Monthly Peak (Trans)
VT Renewable Portfolio Standard
FCA Clearing Prices
FRM Clearing Prices
Delivered Natural Gas Prices
Load Forecast
Load Forecast Error Percentage
Implied Heat Rate
Inflation
Electric Vehicles
LMP Basis to HUB
20 YR NPV POWER COSTS
SensIt 1.31

96
SensIt 1.31 Scenario 5: Mkt ContMany Inputs, One OutputSingle-Factor Sensitivity Analysis
Date 15-Jul-15 Workbook IRPResults4.xlsTime 5:19 PM Output Cell 'Sensit Input Table'!$C$25
20 YR NPV POWER COSTSCorresponding Input Value Output Value Percent
Input Variable Low Output Base Case High Output Low Base High Swing Swing 2̂Regional Network Service Rates 82.3% 100.0% 117.7% $601,982,212 $634,800,132 $667,618,059 $65,635,847 22.7%
Discount rate 115.4% 100.0% 84.6% $603,848,526 $634,800,132 $668,034,194 $64,185,668 21.7%Capacity Load Obligation 94.8% 100.0% 110.5% $618,160,970 $634,800,132 $670,769,080 $52,608,111 14.6%
Renewable Energy Credits 120.0% 100.0% 10.0% $626,552,588 $634,800,132 $671,914,083 $45,361,495 10.8%Monthly Peak (Trans) 90.0% 100.0% 110.0% $614,608,801 $634,800,132 $656,442,499 $41,833,698 9.2%
VT Renewable Portfolio Standard 0.0% 100.0% 175.0% $619,822,161 $634,800,132 $658,044,625 $38,222,464 7.7%FRM Clearing Prices 157.8% 100.0% 42.2% $619,845,588 $634,800,132 $649,754,676 $29,909,088 4.7%
Load Forecast -3.7% 0.0% 3.7% $623,101,549 $634,800,132 $646,498,715 $23,397,166 2.9%Load Forecast Error Percentage -3.0% 0.0% 3.0% $625,314,795 $634,800,132 $644,285,470 $18,970,675 1.9%
FCA Clearing Prices 211.2% 100.0% 25.9% $623,638,416 $634,800,132 $642,241,277 $18,602,861 1.8%Inflation 49.3% 100.0% 150.7% $628,187,574 $634,800,132 $642,351,471 $14,163,897 1.1%
Delivered Natural Gas Prices 29.2% 100.0% 170.8% $629,062,253 $634,800,132 $640,538,012 $11,475,759 0.7%Implied Heat Rate 63.0% 100.0% 137.0% $631,804,168 $634,800,132 $637,796,097 $5,991,929 0.2%Electric Vehicles 50.0% 100.0% 140.0% $634,697,491 $634,800,132 $634,882,245 $184,754 0.0%
LMP Basis to HUB 97.9% 100.0% 102.1% $634,800,132 $634,800,132 $634,800,132 $0 0.0%
82.3%
115.4%
94.8%
120.0%
90.0%
0.0%
157.8%
-3.7%
-3.0%
211.2%
49.3%
29.2%
63.0%
50.0%
97.9%
117.7%
84.6%
110.5%
10.0%
110.0%
175.0%
42.2%
3.7%
3.0%
25.9%
150.7%
170.8%
137.0%
140.0%
102.1%
$550,000,000 $650,000,000 $750,000,000
Regional Network Service Rates
Discount rate
Capacity Load Obligation
Renewable Energy Credits
Monthly Peak (Trans)
VT Renewable Portfolio Standard
FRM Clearing Prices
Load Forecast
Load Forecast Error Percentage
FCA Clearing Prices
Inflation
Delivered Natural Gas Prices
Implied Heat Rate
Electric Vehicles
LMP Basis to HUB
20 YR NPV POWER COSTS
SensIt 1.31

97
SensIt 1.31 Scenario 6: WindMany Inputs, One OutputSingle-Factor Sensitivity Analysis
Date 15-Jul-15 Workbook IRPResults4.xlsTime 5:22 PM Output Cell 'Sensit Input Table'!$C$25
20 YR NPV POWER COSTSCorresponding Input Value Output Value Percent
Input Variable Low Output Base Case High Output Low Base High Swing Swing 2̂Delivered Natural Gas Prices 29.2% 100.0% 170.8% $594,511,369 $644,672,738 $694,834,107 $100,322,738 29.7%
Discount rate 115.4% 100.0% 84.6% $612,958,816 $644,672,738 $678,737,097 $65,778,281 12.8%Regional Network Service Rates 82.3% 100.0% 117.7% $611,854,818 $644,672,738 $677,490,664 $65,635,847 12.7%
Renewable Energy Credits 120.0% 100.0% 10.0% $633,155,130 $644,672,738 $696,501,973 $63,346,844 11.8%Capacity Load Obligation 94.8% 100.0% 110.5% $628,033,575 $644,672,738 $680,641,686 $52,608,111 8.2%
Implied Heat Rate 63.0% 100.0% 137.0% $618,481,584 $644,672,738 $670,863,892 $52,382,308 8.1%Monthly Peak (Trans) 90.0% 100.0% 110.0% $624,481,406 $644,672,738 $666,315,105 $41,833,698 5.2%
VT Renewable Portfolio Standard 0.0% 100.0% 175.0% $629,694,766 $644,672,738 $667,917,230 $38,222,464 4.3%FRM Clearing Prices 157.8% 100.0% 42.2% $629,718,194 $644,672,738 $659,627,282 $29,909,088 2.6%
Load Forecast -3.7% 0.0% 3.7% $632,974,155 $644,672,738 $656,371,321 $23,397,166 1.6%FCA Clearing Prices 25.9% 100.0% 211.2% $635,868,361 $644,672,738 $657,879,303 $22,010,942 1.4%
Load Forecast Error Percentage -3.0% 0.0% 3.0% $635,187,400 $644,672,738 $654,158,075 $18,970,675 1.1%Inflation 49.3% 100.0% 150.7% $638,060,180 $644,672,738 $652,224,077 $14,163,897 0.6%
Electric Vehicles 50.0% 100.0% 140.0% $644,570,097 $644,672,738 $644,754,851 $184,754 0.0%LMP Basis to HUB 97.9% 100.0% 102.1% $644,672,738 $644,672,738 $644,672,738 $0 0.0%
29.2%
115.4%
82.3%
120.0%
94.8%
63.0%
90.0%
0.0%
157.8%
-3.7%
25.9%
-3.0%
49.3%
50.0%
97.9%
170.8%
84.6%
117.7%
10.0%
110.5%
137.0%
110.0%
175.0%
42.2%
3.7%
211.2%
3.0%
150.7%
140.0%
102.1%
$550,000,000 $650,000,000 $750,000,000
Delivered Natural Gas Prices
Discount rate
Regional Network Service Rates
Renewable Energy Credits
Capacity Load Obligation
Implied Heat Rate
Monthly Peak (Trans)
VT Renewable Portfolio Standard
FRM Clearing Prices
Load Forecast
FCA Clearing Prices
Load Forecast Error Percentage
Inflation
Electric Vehicles
LMP Basis to HUB
20 YR NPV POWER COSTS
SensIt 1.31

98
SensIt 1.31 Scenario 7: SolarIn/FixConMany Inputs, One OutputSingle-Factor Sensitivity Analysis
Date 15-Jul-15 Workbook IRPResults4.xlsTime 5:25 PM Output Cell 'Sensit Input Table'!$C$25
20 YR NPV POWER COSTSCorresponding Input Value Output Value Percent
Input Variable Low Output Base Case High Output Low Base High Swing Swing 2̂Regional Network Service Rates 82.3% 100.0% 117.7% $592,273,239 $625,091,159 $657,909,086 $65,635,847 18.6%
Discount rate 115.4% 100.0% 84.6% $594,577,779 $625,091,159 $657,858,626 $63,280,848 17.3%Renewable Energy Credits 120.0% 100.0% 10.0% $614,324,614 $625,091,159 $673,540,612 $59,215,998 15.1%Capacity Load Obligation 94.8% 100.0% 110.5% $608,451,997 $625,091,159 $661,060,107 $52,608,111 11.9%
Delivered Natural Gas Prices 29.2% 100.0% 170.8% $599,402,100 $625,091,159 $650,780,218 $51,378,119 11.4%Monthly Peak (Trans) 90.0% 100.0% 110.0% $604,899,828 $625,091,159 $646,733,526 $41,833,698 7.6%
VT Renewable Portfolio Standard 0.0% 100.0% 175.0% $610,113,188 $625,091,159 $648,335,652 $38,222,464 6.3%FRM Clearing Prices 157.8% 100.0% 42.2% $610,136,615 $625,091,159 $640,045,703 $29,909,088 3.9%
Implied Heat Rate 63.0% 100.0% 137.0% $611,677,927 $625,091,159 $638,504,392 $26,826,465 3.1%Load Forecast -3.7% 0.0% 3.7% $613,392,576 $625,091,159 $636,789,742 $23,397,166 2.4%
Load Forecast Error Percentage -3.0% 0.0% 3.0% $615,605,822 $625,091,159 $634,576,497 $18,970,675 1.6%Inflation 49.3% 100.0% 150.7% $618,478,601 $625,091,159 $632,642,498 $14,163,897 0.9%
FCA Clearing Prices 211.2% 100.0% 25.9% $623,975,912 $625,091,159 $625,834,657 $1,858,746 0.0%Electric Vehicles 50.0% 100.0% 140.0% $624,988,518 $625,091,159 $625,173,272 $184,754 0.0%
LMP Basis to HUB 97.9% 100.0% 102.1% $625,091,159 $625,091,159 $625,091,159 $0 0.0%
82.3%
115.4%
120.0%
94.8%
29.2%
90.0%
0.0%
157.8%
63.0%
-3.7%
-3.0%
49.3%
211.2%
50.0%
97.9%
117.7%
84.6%
10.0%
110.5%
170.8%
110.0%
175.0%
42.2%
137.0%
3.7%
3.0%
150.7%
25.9%
140.0%
102.1%
$550,000,000 $650,000,000 $750,000,000
Regional Network Service Rates
Discount rate
Renewable Energy Credits
Capacity Load Obligation
Delivered Natural Gas Prices
Monthly Peak (Trans)
VT Renewable Portfolio Standard
FRM Clearing Prices
Implied Heat Rate
Load Forecast
Load Forecast Error Percentage
Inflation
FCA Clearing Prices
Electric Vehicles
LMP Basis to HUB
20 YR NPV POWER COSTS
SensIt 1.31

99
SensIt 1.31 Scenario 8: SolarOut/SolarInMany Inputs, One OutputSingle-Factor Sensitivity Analysis
Date 15-Jul-15 Workbook IRPResults4.xlsTime 5:28 PM Output Cell 'Sensit Input Table'!$C$25
20 YR NPV POWER COSTSCorresponding Input Value Output Value Percent
Input Variable Low Output Base Case High Output Low Base High Swing Swing 2̂Delivered Natural Gas Prices 29.2% 100.0% 170.8% $573,900,486 $614,130,019 $654,359,551 $80,459,065 23.1%
Regional Network Service Rates 82.3% 100.0% 117.7% $581,312,099 $614,130,019 $646,947,945 $65,635,847 15.3%Discount rate 115.4% 100.0% 84.6% $584,223,200 $614,130,019 $646,247,061 $62,023,861 13.7%
Renewable Energy Credits 120.0% 100.0% 10.0% $603,363,474 $614,130,019 $662,579,472 $59,215,998 12.5%Capacity Load Obligation 94.8% 100.0% 110.5% $597,490,856 $614,130,019 $650,098,967 $52,608,111 9.9%
Implied Heat Rate 63.0% 100.0% 137.0% $593,124,653 $614,130,019 $635,135,384 $42,010,731 6.3%Monthly Peak (Trans) 90.0% 100.0% 110.0% $593,938,688 $614,130,019 $635,772,386 $41,833,698 6.2%
VT Renewable Portfolio Standard 0.0% 100.0% 175.0% $599,152,047 $614,130,019 $637,374,511 $38,222,464 5.2%FRM Clearing Prices 157.8% 100.0% 42.2% $599,175,475 $614,130,019 $629,084,563 $29,909,088 3.2%
Load Forecast -3.7% 0.0% 3.7% $602,431,436 $614,130,019 $625,828,602 $23,397,166 2.0%Load Forecast Error Percentage -3.0% 0.0% 3.0% $604,644,681 $614,130,019 $623,615,356 $18,970,675 1.3%
Inflation 49.3% 100.0% 150.7% $607,517,461 $614,130,019 $621,681,358 $14,163,897 0.7%FCA Clearing Prices 211.2% 100.0% 25.9% $605,933,777 $614,130,019 $619,594,180 $13,660,403 0.7%
Electric Vehicles 50.0% 100.0% 140.0% $614,027,378 $614,130,019 $614,212,132 $184,754 0.0%LMP Basis to HUB 97.9% 100.0% 102.1% $614,130,019 $614,130,019 $614,130,019 $0 0.0%
29.2%
82.3%
115.4%
120.0%
94.8%
63.0%
90.0%
0.0%
157.8%
-3.7%
-3.0%
49.3%
211.2%
50.0%
97.9%
170.8%
117.7%
84.6%
10.0%
110.5%
137.0%
110.0%
175.0%
42.2%
3.7%
3.0%
150.7%
25.9%
140.0%
102.1%
$550,000,000 $650,000,000 $750,000,000
Delivered Natural Gas Prices
Regional Network Service Rates
Discount rate
Renewable Energy Credits
Capacity Load Obligation
Implied Heat Rate
Monthly Peak (Trans)
VT Renewable Portfolio Standard
FRM Clearing Prices
Load Forecast
Load Forecast Error Percentage
Inflation
FCA Clearing Prices
Electric Vehicles
LMP Basis to HUB
20 YR NPV POWER COSTS
SensIt 1.31

100
SensIt 1.31 Scenario 9: SolarIn/Mkt ContMany Inputs, One OutputSingle-Factor Sensitivity Analysis
Date 15-Jul-15 Workbook IRPResults4.xlsTime 5:31 PM Output Cell 'Sensit Input Table'!$C$25
20 YR NPV POWER COSTSCorresponding Input Value Output Value Percent
Input Variable Low Output Base Case High Output Low Base High Swing Swing 2̂Regional Network Service Rates 82.3% 100.0% 117.7% $584,270,792 $617,088,712 $649,906,639 $65,635,847 19.0%
Discount rate 115.4% 100.0% 84.6% $587,070,161 $617,088,712 $649,323,457 $62,253,297 17.1%Renewable Energy Credits 120.0% 100.0% 10.0% $606,322,167 $617,088,712 $665,538,165 $59,215,998 15.5%Capacity Load Obligation 94.8% 100.0% 110.5% $600,449,550 $617,088,712 $653,057,660 $52,608,111 12.2%
Delivered Natural Gas Prices 29.2% 100.0% 170.8% $595,992,440 $617,088,712 $638,184,984 $42,192,544 7.9%Monthly Peak (Trans) 90.0% 100.0% 110.0% $596,897,381 $617,088,712 $638,731,079 $41,833,698 7.7%
VT Renewable Portfolio Standard 0.0% 100.0% 175.0% $602,110,741 $617,088,712 $640,333,205 $38,222,464 6.4%FRM Clearing Prices 157.8% 100.0% 42.2% $602,134,168 $617,088,712 $632,043,256 $29,909,088 3.9%FCA Clearing Prices 211.2% 100.0% 25.9% $600,849,425 $617,088,712 $627,914,903 $27,065,478 3.2%
Load Forecast -3.7% 0.0% 3.7% $605,390,129 $617,088,712 $628,787,295 $23,397,166 2.4%Implied Heat Rate 63.0% 100.0% 137.0% $606,073,548 $617,088,712 $628,103,876 $22,030,328 2.1%
Load Forecast Error Percentage -3.0% 0.0% 3.0% $607,603,374 $617,088,712 $626,574,050 $18,970,675 1.6%Inflation 49.3% 100.0% 150.7% $610,476,154 $617,088,712 $624,640,051 $14,163,897 0.9%
Electric Vehicles 50.0% 100.0% 140.0% $616,986,071 $617,088,712 $617,170,825 $184,754 0.0%LMP Basis to HUB 97.9% 100.0% 102.1% $617,088,712 $617,088,712 $617,088,712 $0 0.0%
82.3%
115.4%
120.0%
94.8%
29.2%
90.0%
0.0%
157.8%
211.2%
-3.7%
63.0%
-3.0%
49.3%
50.0%
97.9%
117.7%
84.6%
10.0%
110.5%
170.8%
110.0%
175.0%
42.2%
25.9%
3.7%
137.0%
3.0%
150.7%
140.0%
102.1%
$550,000,000 $650,000,000 $750,000,000
Regional Network Service Rates
Discount rate
Renewable Energy Credits
Capacity Load Obligation
Delivered Natural Gas Prices
Monthly Peak (Trans)
VT Renewable Portfolio Standard
FRM Clearing Prices
FCA Clearing Prices
Load Forecast
Implied Heat Rate
Load Forecast Error Percentage
Inflation
Electric Vehicles
LMP Basis to HUB
20 YR NPV POWER COSTS
SensIt 1.31

101
SensIt 1.31 Scenario 10: SolarIn/WindMany Inputs, One OutputSingle-Factor Sensitivity Analysis
Date 15-Jul-15 Workbook IRPResults4.xlsTime 5:34 PM Output Cell 'Sensit Input Table'!$C$25
20 YR NPV POWER COSTSCorresponding Input Value Output Value Percent
Input Variable Low Output Base Case High Output Low Base High Swing Swing 2̂Renewable Energy Credits 120.0% 100.0% 10.0% $606,890,791 $620,927,400 $684,092,138 $77,201,347 21.2%
Delivered Natural Gas Prices 29.2% 100.0% 170.8% $587,400,433 $620,927,400 $654,454,366 $67,053,933 16.0%Regional Network Service Rates 82.3% 100.0% 117.7% $588,109,480 $620,927,400 $653,745,326 $65,635,847 15.3%
Discount rate 115.4% 100.0% 84.6% $590,552,848 $620,927,400 $653,552,250 $62,999,402 14.1%Capacity Load Obligation 94.8% 100.0% 110.5% $604,288,237 $620,927,400 $656,896,348 $52,608,111 9.8%
Monthly Peak (Trans) 90.0% 100.0% 110.0% $600,736,068 $620,927,400 $642,569,767 $41,833,698 6.2%VT Renewable Portfolio Standard 0.0% 100.0% 175.0% $605,949,428 $620,927,400 $644,171,892 $38,222,464 5.2%
Implied Heat Rate 63.0% 100.0% 137.0% $603,421,698 $620,927,400 $638,433,101 $35,011,403 4.4%FRM Clearing Prices 157.8% 100.0% 42.2% $605,972,856 $620,927,400 $635,881,944 $29,909,088 3.2%
Load Forecast -3.7% 0.0% 3.7% $609,228,817 $620,927,400 $632,625,983 $23,397,166 1.9%Load Forecast Error Percentage -3.0% 0.0% 3.0% $611,442,062 $620,927,400 $630,412,737 $18,970,675 1.3%
Inflation 49.3% 100.0% 150.7% $614,314,842 $620,927,400 $628,478,739 $14,163,897 0.7%FCA Clearing Prices 211.2% 100.0% 25.9% $612,478,180 $620,927,400 $626,560,213 $14,082,033 0.7%
Electric Vehicles 50.0% 100.0% 140.0% $620,824,759 $620,927,400 $621,009,513 $184,754 0.0%LMP Basis to HUB 97.9% 100.0% 102.1% $620,927,400 $620,927,400 $620,927,400 $0 0.0%
120.0%
29.2%
82.3%
115.4%
94.8%
90.0%
0.0%
63.0%
157.8%
-3.7%
-3.0%
49.3%
211.2%
50.0%
97.9%
10.0%
170.8%
117.7%
84.6%
110.5%
110.0%
175.0%
137.0%
42.2%
3.7%
3.0%
150.7%
25.9%
140.0%
102.1%
$550,000,000 $650,000,000 $750,000,000
Renewable Energy Credits
Delivered Natural Gas Prices
Regional Network Service Rates
Discount rate
Capacity Load Obligation
Monthly Peak (Trans)
VT Renewable Portfolio Standard
Implied Heat Rate
FRM Clearing Prices
Load Forecast
Load Forecast Error Percentage
Inflation
FCA Clearing Prices
Electric Vehicles
LMP Basis to HUB
20 YR NPV POWER COSTS
SensIt 1.31

102
SensIt 1.31 Scenario 11: SolarOut/FixConMany Inputs, One OutputSingle-Factor Sensitivity Analysis
Date 15-Jul-15 Workbook IRPResults4.xlsTime 5:36 PM Output Cell 'Sensit Input Table'!$C$25
20 YR NPV POWER COSTSCorresponding Input Value Output Value Percent
Input Variable Low Output Base Case High Output Low Base High Swing Swing 2̂Regional Network Service Rates 82.3% 100.0% 117.7% $607,591,483 $640,409,403 $673,227,330 $65,635,847 17.7%
Discount rate 115.4% 100.0% 84.6% $609,035,177 $640,409,403 $674,101,353 $65,066,175 17.4%Delivered Natural Gas Prices 29.2% 100.0% 170.8% $608,205,476 $640,409,403 $672,613,331 $64,407,855 17.0%
Capacity Load Obligation 94.8% 100.0% 110.5% $623,770,241 $640,409,403 $676,378,351 $52,608,111 11.4%Renewable Energy Credits 120.0% 100.0% 10.0% $632,161,859 $640,409,403 $677,523,354 $45,361,495 8.4%
Monthly Peak (Trans) 90.0% 100.0% 110.0% $620,218,072 $640,409,403 $662,051,770 $41,833,698 7.2%VT Renewable Portfolio Standard 0.0% 100.0% 175.0% $625,431,432 $640,409,403 $663,653,896 $38,222,464 6.0%
Implied Heat Rate 63.0% 100.0% 137.0% $623,594,511 $640,409,403 $657,224,296 $33,629,785 4.6%FRM Clearing Prices 157.8% 100.0% 42.2% $625,454,859 $640,409,403 $655,363,948 $29,909,088 3.7%
Load Forecast -3.7% 0.0% 3.7% $628,710,820 $640,409,403 $652,107,987 $23,397,166 2.2%FCA Clearing Prices 25.9% 100.0% 211.2% $631,436,375 $640,409,403 $653,868,946 $22,432,572 2.1%
Load Forecast Error Percentage -3.0% 0.0% 3.0% $630,924,066 $640,409,403 $649,894,741 $18,970,675 1.5%Inflation 49.3% 100.0% 150.7% $633,796,845 $640,409,403 $647,960,742 $14,163,897 0.8%
Electric Vehicles 50.0% 100.0% 140.0% $640,306,762 $640,409,403 $640,491,516 $184,754 0.0%LMP Basis to HUB 97.9% 100.0% 102.1% $640,409,403 $640,409,403 $640,409,403 $0 0.0%
82.3%
115.4%
29.2%
94.8%
120.0%
90.0%
0.0%
63.0%
157.8%
-3.7%
25.9%
-3.0%
49.3%
50.0%
97.9%
117.7%
84.6%
170.8%
110.5%
10.0%
110.0%
175.0%
137.0%
42.2%
3.7%
211.2%
3.0%
150.7%
140.0%
102.1%
$550,000,000 $650,000,000 $750,000,000
Regional Network Service Rates
Discount rate
Delivered Natural Gas Prices
Capacity Load Obligation
Renewable Energy Credits
Monthly Peak (Trans)
VT Renewable Portfolio Standard
Implied Heat Rate
FRM Clearing Prices
Load Forecast
FCA Clearing Prices
Load Forecast Error Percentage
Inflation
Electric Vehicles
LMP Basis to HUB
20 YR NPV POWER COSTS
SensIt 1.31

103
SensIt 1.31 Scenario 12: FixCon/Mkt ContMany Inputs, One OutputSingle-Factor Sensitivity Analysis
Date 15-Jul-15 Workbook IRPResults4.xlsTime 5:39 PM Output Cell 'Sensit Input Table'!$C$25
20 YR NPV POWER COSTSCorresponding Input Value Output Value Percent
Input Variable Low Output Base Case High Output Low Base High Swing Swing 2̂Regional Network Service Rates 82.3% 100.0% 117.7% $610,550,177 $643,368,097 $676,186,023 $65,635,847 22.0%
Discount rate 115.4% 100.0% 84.6% $611,882,138 $643,368,097 $677,177,749 $65,295,611 21.8%Capacity Load Obligation 94.8% 100.0% 110.5% $626,728,934 $643,368,097 $679,337,045 $52,608,111 14.1%
Renewable Energy Credits 120.0% 100.0% 10.0% $635,120,552 $643,368,097 $680,482,047 $45,361,495 10.5%Monthly Peak (Trans) 90.0% 100.0% 110.0% $623,176,765 $643,368,097 $665,010,464 $41,833,698 8.9%
VT Renewable Portfolio Standard 0.0% 100.0% 175.0% $628,390,125 $643,368,097 $666,612,589 $38,222,464 7.5%FRM Clearing Prices 157.8% 100.0% 42.2% $628,413,553 $643,368,097 $658,322,641 $29,909,088 4.6%
Delivered Natural Gas Prices 29.2% 100.0% 170.8% $630,297,429 $643,368,097 $656,438,764 $26,141,335 3.5%Load Forecast -3.7% 0.0% 3.7% $631,669,514 $643,368,097 $655,066,680 $23,397,166 2.8%
Load Forecast Error Percentage -3.0% 0.0% 3.0% $633,882,759 $643,368,097 $652,853,434 $18,970,675 1.8%Inflation 49.3% 100.0% 150.7% $636,755,539 $643,368,097 $650,919,436 $14,163,897 1.0%
Implied Heat Rate 63.0% 100.0% 137.0% $636,543,405 $643,368,097 $650,192,788 $13,649,383 1.0%FCA Clearing Prices 25.9% 100.0% 211.2% $639,757,098 $643,368,097 $648,784,595 $9,027,497 0.4%
Electric Vehicles 50.0% 100.0% 140.0% $643,265,456 $643,368,097 $643,450,210 $184,754 0.0%LMP Basis to HUB 97.9% 100.0% 102.1% $643,368,097 $643,368,097 $643,368,097 $0 0.0%
82.3%
115.4%
94.8%
120.0%
90.0%
0.0%
157.8%
29.2%
-3.7%
-3.0%
49.3%
63.0%
25.9%
50.0%
97.9%
117.7%
84.6%
110.5%
10.0%
110.0%
175.0%
42.2%
170.8%
3.7%
3.0%
150.7%
137.0%
211.2%
140.0%
102.1%
$550,000,000 $650,000,000 $750,000,000
Regional Network Service Rates
Discount rate
Capacity Load Obligation
Renewable Energy Credits
Monthly Peak (Trans)
VT Renewable Portfolio Standard
FRM Clearing Prices
Delivered Natural Gas Prices
Load Forecast
Load Forecast Error Percentage
Inflation
Implied Heat Rate
FCA Clearing Prices
Electric Vehicles
LMP Basis to HUB
20 YR NPV POWER COSTS
SensIt 1.31

104
SensIt 1.31 Scenario 13: FixCon/WindMany Inputs, One OutputSingle-Factor Sensitivity Analysis
Date 15-Jul-15 Workbook IRPResults4.xlsTime 5:42 PM Output Cell 'Sensit Input Table'!$C$25
20 YR NPV POWER COSTSCorresponding Input Value Output Value Percent
Input Variable Low Output Base Case High Output Low Base High Swing Swing 2̂Discount rate 115.4% 100.0% 84.6% $615,364,826 $647,206,784 $681,406,542 $66,041,716 17.8%
Regional Network Service Rates 82.3% 100.0% 117.7% $614,388,864 $647,206,784 $680,024,711 $65,635,847 17.6%Renewable Energy Credits 120.0% 100.0% 10.0% $635,689,176 $647,206,784 $699,036,020 $63,346,844 16.4%Capacity Load Obligation 94.8% 100.0% 110.5% $630,567,622 $647,206,784 $683,175,732 $52,608,111 11.3%
Delivered Natural Gas Prices 29.2% 100.0% 170.8% $621,705,423 $647,206,784 $672,708,146 $51,002,724 10.6%Monthly Peak (Trans) 90.0% 100.0% 110.0% $627,015,453 $647,206,784 $668,849,151 $41,833,698 7.2%
VT Renewable Portfolio Standard 0.0% 100.0% 175.0% $632,228,813 $647,206,784 $670,451,277 $38,222,464 6.0%FRM Clearing Prices 157.8% 100.0% 42.2% $632,252,240 $647,206,784 $662,161,329 $29,909,088 3.7%
Implied Heat Rate 63.0% 100.0% 137.0% $633,891,556 $647,206,784 $660,522,013 $26,630,457 2.9%Load Forecast -3.7% 0.0% 3.7% $635,508,201 $647,206,784 $658,905,368 $23,397,166 2.2%
FCA Clearing Prices 25.9% 100.0% 211.2% $638,402,408 $647,206,784 $660,413,350 $22,010,942 2.0%Load Forecast Error Percentage -3.0% 0.0% 3.0% $637,721,447 $647,206,784 $656,692,122 $18,970,675 1.5%
Inflation 49.3% 100.0% 150.7% $640,594,226 $647,206,784 $654,758,123 $14,163,897 0.8%Electric Vehicles 50.0% 100.0% 140.0% $647,104,143 $647,206,784 $647,288,897 $184,754 0.0%
LMP Basis to HUB 97.9% 100.0% 102.1% $647,206,784 $647,206,784 $647,206,784 $0 0.0%
115.4%
82.3%
120.0%
94.8%
29.2%
90.0%
0.0%
157.8%
63.0%
-3.7%
25.9%
-3.0%
49.3%
50.0%
97.9%
84.6%
117.7%
10.0%
110.5%
170.8%
110.0%
175.0%
42.2%
137.0%
3.7%
211.2%
3.0%
150.7%
140.0%
102.1%
$550,000,000 $650,000,000 $750,000,000
Discount rate
Regional Network Service Rates
Renewable Energy Credits
Capacity Load Obligation
Delivered Natural Gas Prices
Monthly Peak (Trans)
VT Renewable Portfolio Standard
FRM Clearing Prices
Implied Heat Rate
Load Forecast
FCA Clearing Prices
Load Forecast Error Percentage
Inflation
Electric Vehicles
LMP Basis to HUB
20 YR NPV POWER COSTS
SensIt 1.31

105
SensIt 1.31 Scenario 14: SolarOut/SolarIn/FixConMany Inputs, One OutputSingle-Factor Sensitivity Analysis
Date 15-Jul-15 Workbook IRPResults4.xlsTime 5:45 PM Output Cell 'Sensit Input Table'!$C$25
20 YR NPV POWER COSTSCorresponding Input Value Output Value Percent
Input Variable Low Output Base Case High Output Low Base High Swing Swing 2̂Regional Network Service Rates 82.3% 100.0% 117.7% $583,001,463 $615,819,383 $648,637,310 $65,635,847 19.0%
Discount rate 115.4% 100.0% 84.6% $585,827,207 $615,819,383 $648,026,691 $62,199,484 17.0%Renewable Energy Credits 120.0% 100.0% 10.0% $605,052,838 $615,819,383 $664,268,836 $59,215,998 15.4%Capacity Load Obligation 94.8% 100.0% 110.5% $599,180,221 $615,819,383 $651,788,331 $52,608,111 12.2%
Delivered Natural Gas Prices 29.2% 100.0% 170.8% $592,029,856 $615,819,383 $639,608,911 $47,579,055 10.0%Monthly Peak (Trans) 90.0% 100.0% 110.0% $595,628,052 $615,819,383 $637,461,750 $41,833,698 7.7%
VT Renewable Portfolio Standard 0.0% 100.0% 175.0% $600,841,412 $615,819,383 $639,063,876 $38,222,464 6.4%FRM Clearing Prices 157.8% 100.0% 42.2% $600,864,839 $615,819,383 $630,773,927 $29,909,088 3.9%
Implied Heat Rate 63.0% 100.0% 137.0% $603,397,968 $615,819,383 $628,240,798 $24,842,830 2.7%Load Forecast -3.7% 0.0% 3.7% $604,120,800 $615,819,383 $627,517,966 $23,397,166 2.4%
Load Forecast Error Percentage -3.0% 0.0% 3.0% $606,334,046 $615,819,383 $625,304,721 $18,970,675 1.6%Inflation 49.3% 100.0% 150.7% $609,206,825 $615,819,383 $623,370,722 $14,163,897 0.9%
FCA Clearing Prices 211.2% 100.0% 25.9% $607,623,141 $615,819,383 $621,283,545 $13,660,403 0.8%Electric Vehicles 50.0% 100.0% 140.0% $615,716,742 $615,819,383 $615,901,496 $184,754 0.0%
LMP Basis to HUB 97.9% 100.0% 102.1% $615,819,383 $615,819,383 $615,819,383 $0 0.0%
82.3%
115.4%
120.0%
94.8%
29.2%
90.0%
0.0%
157.8%
63.0%
-3.7%
-3.0%
49.3%
211.2%
50.0%
97.9%
117.7%
84.6%
10.0%
110.5%
170.8%
110.0%
175.0%
42.2%
137.0%
3.7%
3.0%
150.7%
25.9%
140.0%
102.1%
$550,000,000 $650,000,000 $750,000,000
Regional Network Service Rates
Discount rate
Renewable Energy Credits
Capacity Load Obligation
Delivered Natural Gas Prices
Monthly Peak (Trans)
VT Renewable Portfolio Standard
FRM Clearing Prices
Implied Heat Rate
Load Forecast
Load Forecast Error Percentage
Inflation
FCA Clearing Prices
Electric Vehicles
LMP Basis to HUB
20 YR NPV POWER COSTS
SensIt 1.31
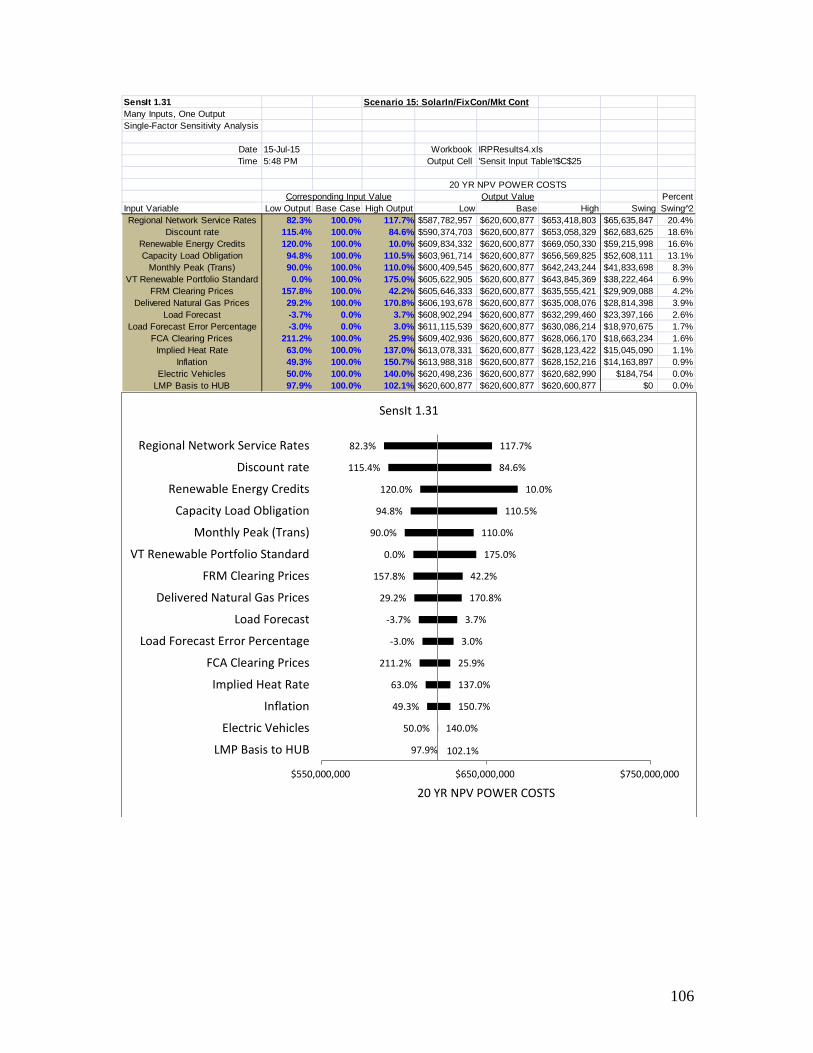
106
SensIt 1.31 Scenario 15: SolarIn/FixCon/Mkt ContMany Inputs, One OutputSingle-Factor Sensitivity Analysis
Date 15-Jul-15 Workbook IRPResults4.xlsTime 5:48 PM Output Cell 'Sensit Input Table'!$C$25
20 YR NPV POWER COSTSCorresponding Input Value Output Value Percent
Input Variable Low Output Base Case High Output Low Base High Swing Swing 2̂Regional Network Service Rates 82.3% 100.0% 117.7% $587,782,957 $620,600,877 $653,418,803 $65,635,847 20.4%
Discount rate 115.4% 100.0% 84.6% $590,374,703 $620,600,877 $653,058,329 $62,683,625 18.6%Renewable Energy Credits 120.0% 100.0% 10.0% $609,834,332 $620,600,877 $669,050,330 $59,215,998 16.6%Capacity Load Obligation 94.8% 100.0% 110.5% $603,961,714 $620,600,877 $656,569,825 $52,608,111 13.1%
Monthly Peak (Trans) 90.0% 100.0% 110.0% $600,409,545 $620,600,877 $642,243,244 $41,833,698 8.3%VT Renewable Portfolio Standard 0.0% 100.0% 175.0% $605,622,905 $620,600,877 $643,845,369 $38,222,464 6.9%
FRM Clearing Prices 157.8% 100.0% 42.2% $605,646,333 $620,600,877 $635,555,421 $29,909,088 4.2%Delivered Natural Gas Prices 29.2% 100.0% 170.8% $606,193,678 $620,600,877 $635,008,076 $28,814,398 3.9%
Load Forecast -3.7% 0.0% 3.7% $608,902,294 $620,600,877 $632,299,460 $23,397,166 2.6%Load Forecast Error Percentage -3.0% 0.0% 3.0% $611,115,539 $620,600,877 $630,086,214 $18,970,675 1.7%
FCA Clearing Prices 211.2% 100.0% 25.9% $609,402,936 $620,600,877 $628,066,170 $18,663,234 1.6%Implied Heat Rate 63.0% 100.0% 137.0% $613,078,331 $620,600,877 $628,123,422 $15,045,090 1.1%
Inflation 49.3% 100.0% 150.7% $613,988,318 $620,600,877 $628,152,216 $14,163,897 0.9%Electric Vehicles 50.0% 100.0% 140.0% $620,498,236 $620,600,877 $620,682,990 $184,754 0.0%
LMP Basis to HUB 97.9% 100.0% 102.1% $620,600,877 $620,600,877 $620,600,877 $0 0.0%
82.3%
115.4%
120.0%
94.8%
90.0%
0.0%
157.8%
29.2%
-3.7%
-3.0%
211.2%
63.0%
49.3%
50.0%
97.9%
117.7%
84.6%
10.0%
110.5%
110.0%
175.0%
42.2%
170.8%
3.7%
3.0%
25.9%
137.0%
150.7%
140.0%
102.1%
$550,000,000 $650,000,000 $750,000,000
Regional Network Service Rates
Discount rate
Renewable Energy Credits
Capacity Load Obligation
Monthly Peak (Trans)
VT Renewable Portfolio Standard
FRM Clearing Prices
Delivered Natural Gas Prices
Load Forecast
Load Forecast Error Percentage
FCA Clearing Prices
Implied Heat Rate
Inflation
Electric Vehicles
LMP Basis to HUB
20 YR NPV POWER COSTS
SensIt 1.31
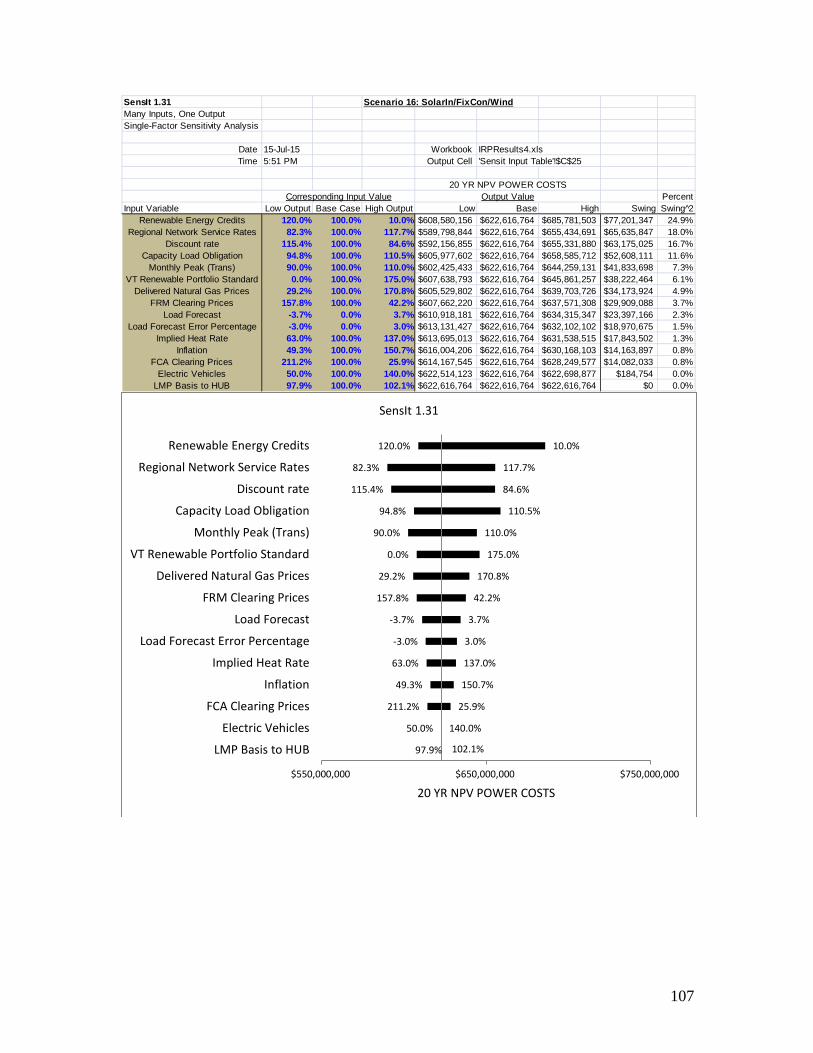
107
SensIt 1.31 Scenario 16: SolarIn/FixCon/WindMany Inputs, One OutputSingle-Factor Sensitivity Analysis
Date 15-Jul-15 Workbook IRPResults4.xlsTime 5:51 PM Output Cell 'Sensit Input Table'!$C$25
20 YR NPV POWER COSTSCorresponding Input Value Output Value Percent
Input Variable Low Output Base Case High Output Low Base High Swing Swing 2̂Renewable Energy Credits 120.0% 100.0% 10.0% $608,580,156 $622,616,764 $685,781,503 $77,201,347 24.9%
Regional Network Service Rates 82.3% 100.0% 117.7% $589,798,844 $622,616,764 $655,434,691 $65,635,847 18.0%Discount rate 115.4% 100.0% 84.6% $592,156,855 $622,616,764 $655,331,880 $63,175,025 16.7%
Capacity Load Obligation 94.8% 100.0% 110.5% $605,977,602 $622,616,764 $658,585,712 $52,608,111 11.6%Monthly Peak (Trans) 90.0% 100.0% 110.0% $602,425,433 $622,616,764 $644,259,131 $41,833,698 7.3%
VT Renewable Portfolio Standard 0.0% 100.0% 175.0% $607,638,793 $622,616,764 $645,861,257 $38,222,464 6.1%Delivered Natural Gas Prices 29.2% 100.0% 170.8% $605,529,802 $622,616,764 $639,703,726 $34,173,924 4.9%
FRM Clearing Prices 157.8% 100.0% 42.2% $607,662,220 $622,616,764 $637,571,308 $29,909,088 3.7%Load Forecast -3.7% 0.0% 3.7% $610,918,181 $622,616,764 $634,315,347 $23,397,166 2.3%
Load Forecast Error Percentage -3.0% 0.0% 3.0% $613,131,427 $622,616,764 $632,102,102 $18,970,675 1.5%Implied Heat Rate 63.0% 100.0% 137.0% $613,695,013 $622,616,764 $631,538,515 $17,843,502 1.3%
Inflation 49.3% 100.0% 150.7% $616,004,206 $622,616,764 $630,168,103 $14,163,897 0.8%FCA Clearing Prices 211.2% 100.0% 25.9% $614,167,545 $622,616,764 $628,249,577 $14,082,033 0.8%
Electric Vehicles 50.0% 100.0% 140.0% $622,514,123 $622,616,764 $622,698,877 $184,754 0.0%LMP Basis to HUB 97.9% 100.0% 102.1% $622,616,764 $622,616,764 $622,616,764 $0 0.0%
120.0%
82.3%
115.4%
94.8%
90.0%
0.0%
29.2%
157.8%
-3.7%
-3.0%
63.0%
49.3%
211.2%
50.0%
97.9%
10.0%
117.7%
84.6%
110.5%
110.0%
175.0%
170.8%
42.2%
3.7%
3.0%
137.0%
150.7%
25.9%
140.0%
102.1%
$550,000,000 $650,000,000 $750,000,000
Renewable Energy Credits
Regional Network Service Rates
Discount rate
Capacity Load Obligation
Monthly Peak (Trans)
VT Renewable Portfolio Standard
Delivered Natural Gas Prices
FRM Clearing Prices
Load Forecast
Load Forecast Error Percentage
Implied Heat Rate
Inflation
FCA Clearing Prices
Electric Vehicles
LMP Basis to HUB
20 YR NPV POWER COSTS
SensIt 1.31

108
SensIt 1.31 Scenario 17: SolarOut/SolarIn/Mkt ContMany Inputs, One OutputSingle-Factor Sensitivity Analysis
Date 15-Jul-15 Workbook IRPResults4.xlsTime 5:53 PM Output Cell 'Sensit Input Table'!$C$25
20 YR NPV POWER COSTSCorresponding Input Value Output Value Percent
Input Variable Low Output Base Case High Output Low Base High Swing Swing 2̂Regional Network Service Rates 82.3% 100.0% 117.7% $577,666,499 $610,484,419 $643,302,345 $65,635,847 19.0%
Discount rate 115.4% 100.0% 84.6% $580,822,128 $610,484,419 $642,336,579 $61,514,451 16.7%Renewable Energy Credits 120.0% 100.0% 10.0% $599,717,873 $610,484,419 $658,933,872 $59,215,998 15.5%Capacity Load Obligation 94.8% 100.0% 110.5% $593,845,256 $610,484,419 $646,453,367 $52,608,111 12.2%
Monthly Peak (Trans) 90.0% 100.0% 110.0% $590,293,087 $610,484,419 $632,126,785 $41,833,698 7.7%Delivered Natural Gas Prices 29.2% 100.0% 170.8% $589,756,749 $610,484,419 $631,212,088 $41,455,339 7.6%
VT Renewable Portfolio Standard 0.0% 100.0% 175.0% $595,506,447 $610,484,419 $633,728,911 $38,222,464 6.4%FCA Clearing Prices 211.2% 100.0% 25.9% $592,205,484 $610,484,419 $622,670,375 $30,464,892 4.1%FRM Clearing Prices 157.8% 100.0% 42.2% $595,529,874 $610,484,419 $625,438,963 $29,909,088 3.9%
Load Forecast -3.7% 0.0% 3.7% $598,785,835 $610,484,419 $622,183,002 $23,397,166 2.4%Implied Heat Rate 63.0% 100.0% 137.0% $599,661,716 $610,484,419 $621,307,121 $21,645,406 2.1%
Load Forecast Error Percentage -3.0% 0.0% 3.0% $600,999,081 $610,484,419 $619,969,756 $18,970,675 1.6%Inflation 49.3% 100.0% 150.7% $603,871,860 $610,484,419 $618,035,758 $14,163,897 0.9%
Electric Vehicles 50.0% 100.0% 140.0% $610,381,777 $610,484,419 $610,566,531 $184,754 0.0%LMP Basis to HUB 97.9% 100.0% 102.1% $610,484,419 $610,484,419 $610,484,419 $0 0.0%
82.3%
115.4%
120.0%
94.8%
90.0%
29.2%
0.0%
211.2%
157.8%
-3.7%
63.0%
-3.0%
49.3%
50.0%
97.9%
117.7%
84.6%
10.0%
110.5%
110.0%
170.8%
175.0%
25.9%
42.2%
3.7%
137.0%
3.0%
150.7%
140.0%
102.1%
$550,000,000 $650,000,000 $750,000,000
Regional Network Service Rates
Discount rate
Renewable Energy Credits
Capacity Load Obligation
Monthly Peak (Trans)
Delivered Natural Gas Prices
VT Renewable Portfolio Standard
FCA Clearing Prices
FRM Clearing Prices
Load Forecast
Implied Heat Rate
Load Forecast Error Percentage
Inflation
Electric Vehicles
LMP Basis to HUB
20 YR NPV POWER COSTS
SensIt 1.31

109
SensIt 1.31 Scenario 18: SolarOut/SolarIn/WindMany Inputs, One OutputSingle-Factor Sensitivity Analysis
Date 15-Jul-15 Workbook IRPResults4.xlsTime 5:56 PM Output Cell 'Sensit Input Table'!$C$25
20 YR NPV POWER COSTSCorresponding Input Value Output Value Percent
Input Variable Low Output Base Case High Output Low Base High Swing Swing 2̂Renewable Energy Credits 120.0% 100.0% 10.0% $598,463,697 $612,500,306 $675,665,045 $77,201,347 23.3%
Regional Network Service Rates 82.3% 100.0% 117.7% $579,682,386 $612,500,306 $645,318,233 $65,635,847 16.9%Discount rate 115.4% 100.0% 84.6% $582,604,280 $612,500,306 $644,610,130 $62,005,850 15.0%
Capacity Load Obligation 94.8% 100.0% 110.5% $595,861,143 $612,500,306 $648,469,254 $52,608,111 10.8%Delivered Natural Gas Prices 29.2% 100.0% 170.8% $589,092,873 $612,500,306 $635,907,739 $46,814,865 8.6%
Monthly Peak (Trans) 90.0% 100.0% 110.0% $592,308,975 $612,500,306 $634,142,673 $41,833,698 6.8%VT Renewable Portfolio Standard 0.0% 100.0% 175.0% $597,522,335 $612,500,306 $635,744,798 $38,222,464 5.7%
FRM Clearing Prices 157.8% 100.0% 42.2% $597,545,762 $612,500,306 $627,454,850 $29,909,088 3.5%FCA Clearing Prices 211.2% 100.0% 25.9% $596,970,092 $612,500,306 $622,853,782 $25,883,690 2.6%
Implied Heat Rate 63.0% 100.0% 137.0% $600,278,397 $612,500,306 $624,722,215 $24,443,818 2.3%Load Forecast -3.7% 0.0% 3.7% $600,801,723 $612,500,306 $624,198,889 $23,397,166 2.1%
Load Forecast Error Percentage -3.0% 0.0% 3.0% $603,014,968 $612,500,306 $621,985,644 $18,970,675 1.4%Inflation 49.3% 100.0% 150.7% $605,887,748 $612,500,306 $620,051,645 $14,163,897 0.8%
Electric Vehicles 50.0% 100.0% 140.0% $612,397,665 $612,500,306 $612,582,419 $184,754 0.0%LMP Basis to HUB 97.9% 100.0% 102.1% $612,500,306 $612,500,306 $612,500,306 $0 0.0%
120.0%
82.3%
115.4%
94.8%
29.2%
90.0%
0.0%
157.8%
211.2%
63.0%
-3.7%
-3.0%
49.3%
50.0%
97.9%
10.0%
117.7%
84.6%
110.5%
170.8%
110.0%
175.0%
42.2%
25.9%
137.0%
3.7%
3.0%
150.7%
140.0%
102.1%
$550,000,000 $650,000,000 $750,000,000
Renewable Energy Credits
Regional Network Service Rates
Discount rate
Capacity Load Obligation
Delivered Natural Gas Prices
Monthly Peak (Trans)
VT Renewable Portfolio Standard
FRM Clearing Prices
FCA Clearing Prices
Implied Heat Rate
Load Forecast
Load Forecast Error Percentage
Inflation
Electric Vehicles
LMP Basis to HUB
20 YR NPV POWER COSTS
SensIt 1.31

110
SensIt 1.31 Scenario 19: SolarIn/Mkt Cont/WindMany Inputs, One OutputSingle-Factor Sensitivity Analysis
Date 15-Jul-15 Workbook IRPResults4.xlsTime 5:59 PM Output Cell 'Sensit Input Table'!$C$25
20 YR NPV POWER COSTSCorresponding Input Value Output Value Percent
Input Variable Low Output Base Case High Output Low Base High Swing Swing 2̂Renewable Energy Credits 120.0% 100.0% 10.0% $603,245,191 $617,281,799 $680,446,538 $77,201,347 24.7%
Regional Network Service Rates 82.3% 100.0% 117.7% $584,463,880 $617,281,799 $650,099,726 $65,635,847 17.9%Discount rate 115.4% 100.0% 84.6% $587,151,777 $617,281,799 $649,641,768 $62,489,991 16.2%
Capacity Load Obligation 94.8% 100.0% 110.5% $600,642,637 $617,281,799 $653,250,748 $52,608,111 11.5%Monthly Peak (Trans) 90.0% 100.0% 110.0% $597,090,468 $617,281,799 $638,924,166 $41,833,698 7.3%
VT Renewable Portfolio Standard 0.0% 100.0% 175.0% $602,303,828 $617,281,799 $640,526,292 $38,222,464 6.1%FCA Clearing Prices 211.2% 100.0% 25.9% $598,749,887 $617,281,799 $629,636,408 $30,886,521 4.0%FRM Clearing Prices 157.8% 100.0% 42.2% $602,327,255 $617,281,799 $632,236,344 $29,909,088 3.7%
Delivered Natural Gas Prices 29.2% 100.0% 170.8% $603,256,696 $617,281,799 $631,306,903 $28,050,208 3.3%Load Forecast -3.7% 0.0% 3.7% $605,583,216 $617,281,799 $628,980,383 $23,397,166 2.3%
Load Forecast Error Percentage -3.0% 0.0% 3.0% $607,796,462 $617,281,799 $626,767,137 $18,970,675 1.5%Implied Heat Rate 63.0% 100.0% 137.0% $609,958,761 $617,281,799 $624,604,838 $14,646,078 0.9%
Inflation 49.3% 100.0% 150.7% $610,669,241 $617,281,799 $624,833,138 $14,163,897 0.8%Electric Vehicles 50.0% 100.0% 140.0% $617,179,158 $617,281,799 $617,363,912 $184,754 0.0%
LMP Basis to HUB 97.9% 100.0% 102.1% $617,281,799 $617,281,799 $617,281,799 $0 0.0%
120.0%
82.3%
115.4%
94.8%
90.0%
0.0%
211.2%
157.8%
29.2%
-3.7%
-3.0%
63.0%
49.3%
50.0%
97.9%
10.0%
117.7%
84.6%
110.5%
110.0%
175.0%
25.9%
42.2%
170.8%
3.7%
3.0%
137.0%
150.7%
140.0%
102.1%
$550,000,000 $650,000,000 $750,000,000
Renewable Energy Credits
Regional Network Service Rates
Discount rate
Capacity Load Obligation
Monthly Peak (Trans)
VT Renewable Portfolio Standard
FCA Clearing Prices
FRM Clearing Prices
Delivered Natural Gas Prices
Load Forecast
Load Forecast Error Percentage
Implied Heat Rate
Inflation
Electric Vehicles
LMP Basis to HUB
20 YR NPV POWER COSTS
SensIt 1.31

111
SensIt 1.31 Scenario 20: SolarOut/FixCon/Mkt ContMany Inputs, One OutputSingle-Factor Sensitivity Analysis
Date 15-Jul-15 Workbook IRPResults4.xlsTime 6:02 PM Output Cell 'Sensit Input Table'!$C$25
20 YR NPV POWER COSTSCorresponding Input Value Output Value Percent
Input Variable Low Output Base Case High Output Low Base High Swing Swing 2̂Regional Network Service Rates 82.3% 100.0% 117.7% $603,101,201 $635,919,121 $668,737,048 $65,635,847 20.7%
Discount rate 115.4% 100.0% 84.6% $604,832,102 $635,919,121 $669,301,055 $64,468,953 20.0%Capacity Load Obligation 94.8% 100.0% 110.5% $619,279,958 $635,919,121 $671,888,069 $52,608,111 13.3%
Renewable Energy Credits 120.0% 100.0% 10.0% $627,671,576 $635,919,121 $673,033,071 $45,361,495 9.9%Delivered Natural Gas Prices 29.2% 100.0% 170.8% $614,997,054 $635,919,121 $656,841,188 $41,844,134 8.4%
Monthly Peak (Trans) 90.0% 100.0% 110.0% $615,727,790 $635,919,121 $657,561,488 $41,833,698 8.4%VT Renewable Portfolio Standard 0.0% 100.0% 175.0% $620,941,150 $635,919,121 $659,163,613 $38,222,464 7.0%
FRM Clearing Prices 157.8% 100.0% 42.2% $620,964,577 $635,919,121 $650,873,665 $29,909,088 4.3%Load Forecast -3.7% 0.0% 3.7% $624,220,538 $635,919,121 $647,617,704 $23,397,166 2.6%
Implied Heat Rate 63.0% 100.0% 137.0% $624,994,916 $635,919,121 $646,843,326 $21,848,410 2.3%Load Forecast Error Percentage -3.0% 0.0% 3.0% $626,433,783 $635,919,121 $645,404,459 $18,970,675 1.7%
Inflation 49.3% 100.0% 150.7% $629,306,563 $635,919,121 $643,470,460 $14,163,897 1.0%FCA Clearing Prices 25.9% 100.0% 211.2% $633,667,888 $635,919,121 $639,295,971 $5,628,083 0.2%
Electric Vehicles 50.0% 100.0% 140.0% $635,816,480 $635,919,121 $636,001,234 $184,754 0.0%LMP Basis to HUB 97.9% 100.0% 102.1% $635,919,121 $635,919,121 $635,919,121 $0 0.0%
82.3%
115.4%
94.8%
120.0%
29.2%
90.0%
0.0%
157.8%
-3.7%
63.0%
-3.0%
49.3%
25.9%
50.0%
97.9%
117.7%
84.6%
110.5%
10.0%
170.8%
110.0%
175.0%
42.2%
3.7%
137.0%
3.0%
150.7%
211.2%
140.0%
102.1%
$550,000,000 $650,000,000 $750,000,000
Regional Network Service Rates
Discount rate
Capacity Load Obligation
Renewable Energy Credits
Delivered Natural Gas Prices
Monthly Peak (Trans)
VT Renewable Portfolio Standard
FRM Clearing Prices
Load Forecast
Implied Heat Rate
Load Forecast Error Percentage
Inflation
FCA Clearing Prices
Electric Vehicles
LMP Basis to HUB
20 YR NPV POWER COSTS
SensIt 1.31
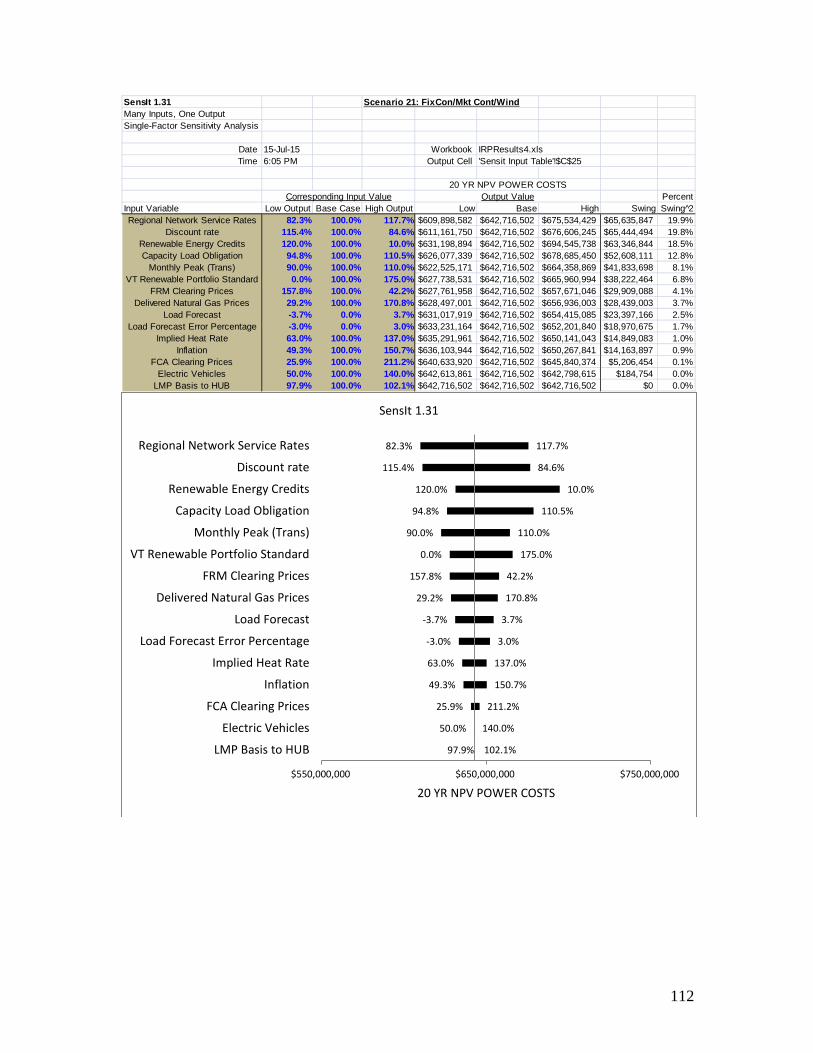
112
SensIt 1.31 Scenario 21: FixCon/Mkt Cont/WindMany Inputs, One OutputSingle-Factor Sensitivity Analysis
Date 15-Jul-15 Workbook IRPResults4.xlsTime 6:05 PM Output Cell 'Sensit Input Table'!$C$25
20 YR NPV POWER COSTSCorresponding Input Value Output Value Percent
Input Variable Low Output Base Case High Output Low Base High Swing Swing 2̂Regional Network Service Rates 82.3% 100.0% 117.7% $609,898,582 $642,716,502 $675,534,429 $65,635,847 19.9%
Discount rate 115.4% 100.0% 84.6% $611,161,750 $642,716,502 $676,606,245 $65,444,494 19.8%Renewable Energy Credits 120.0% 100.0% 10.0% $631,198,894 $642,716,502 $694,545,738 $63,346,844 18.5%Capacity Load Obligation 94.8% 100.0% 110.5% $626,077,339 $642,716,502 $678,685,450 $52,608,111 12.8%
Monthly Peak (Trans) 90.0% 100.0% 110.0% $622,525,171 $642,716,502 $664,358,869 $41,833,698 8.1%VT Renewable Portfolio Standard 0.0% 100.0% 175.0% $627,738,531 $642,716,502 $665,960,994 $38,222,464 6.8%
FRM Clearing Prices 157.8% 100.0% 42.2% $627,761,958 $642,716,502 $657,671,046 $29,909,088 4.1%Delivered Natural Gas Prices 29.2% 100.0% 170.8% $628,497,001 $642,716,502 $656,936,003 $28,439,003 3.7%
Load Forecast -3.7% 0.0% 3.7% $631,017,919 $642,716,502 $654,415,085 $23,397,166 2.5%Load Forecast Error Percentage -3.0% 0.0% 3.0% $633,231,164 $642,716,502 $652,201,840 $18,970,675 1.7%
Implied Heat Rate 63.0% 100.0% 137.0% $635,291,961 $642,716,502 $650,141,043 $14,849,083 1.0%Inflation 49.3% 100.0% 150.7% $636,103,944 $642,716,502 $650,267,841 $14,163,897 0.9%
FCA Clearing Prices 25.9% 100.0% 211.2% $640,633,920 $642,716,502 $645,840,374 $5,206,454 0.1%Electric Vehicles 50.0% 100.0% 140.0% $642,613,861 $642,716,502 $642,798,615 $184,754 0.0%
LMP Basis to HUB 97.9% 100.0% 102.1% $642,716,502 $642,716,502 $642,716,502 $0 0.0%
82.3%
115.4%
120.0%
94.8%
90.0%
0.0%
157.8%
29.2%
-3.7%
-3.0%
63.0%
49.3%
25.9%
50.0%
97.9%
117.7%
84.6%
10.0%
110.5%
110.0%
175.0%
42.2%
170.8%
3.7%
3.0%
137.0%
150.7%
211.2%
140.0%
102.1%
$550,000,000 $650,000,000 $750,000,000
Regional Network Service Rates
Discount rate
Renewable Energy Credits
Capacity Load Obligation
Monthly Peak (Trans)
VT Renewable Portfolio Standard
FRM Clearing Prices
Delivered Natural Gas Prices
Load Forecast
Load Forecast Error Percentage
Implied Heat Rate
Inflation
FCA Clearing Prices
Electric Vehicles
LMP Basis to HUB
20 YR NPV POWER COSTS
SensIt 1.31

113
SensIt 1.31 Scenario 22: SolarOut/Mkt Cont/WindMany Inputs, One OutputSingle-Factor Sensitivity Analysis
Date 15-Jul-15 Workbook IRPResults4.xlsTime 6:08 PM Output Cell 'Sensit Input Table'!$C$25
20 YR NPV POWER COSTSCorresponding Input Value Output Value Percent
Input Variable Low Output Base Case High Output Low Base High Swing Swing 2̂Regional Network Service Rates 82.3% 100.0% 117.7% $599,782,124 $632,600,044 $665,417,970 $65,635,847 19.0%
Discount rate 115.4% 100.0% 84.6% $601,609,175 $632,600,044 $665,884,495 $64,275,319 18.3%Renewable Energy Credits 120.0% 100.0% 10.0% $621,082,436 $632,600,044 $684,429,279 $63,346,844 17.7%Capacity Load Obligation 94.8% 100.0% 110.5% $615,960,881 $632,600,044 $668,568,992 $52,608,111 12.2%
Monthly Peak (Trans) 90.0% 100.0% 110.0% $612,408,712 $632,600,044 $654,242,411 $41,833,698 7.7%Delivered Natural Gas Prices 29.2% 100.0% 170.8% $612,060,072 $632,600,044 $653,140,016 $41,079,944 7.5%
VT Renewable Portfolio Standard 0.0% 100.0% 175.0% $617,622,072 $632,600,044 $655,844,536 $38,222,464 6.5%FRM Clearing Prices 157.8% 100.0% 42.2% $617,645,500 $632,600,044 $647,554,588 $29,909,088 4.0%
Load Forecast -3.7% 0.0% 3.7% $620,901,461 $632,600,044 $644,298,627 $23,397,166 2.4%Implied Heat Rate 63.0% 100.0% 137.0% $621,875,345 $632,600,044 $643,324,743 $21,449,398 2.0%
Load Forecast Error Percentage -3.0% 0.0% 3.0% $623,114,706 $632,600,044 $642,085,381 $18,970,675 1.6%Inflation 49.3% 100.0% 150.7% $625,987,486 $632,600,044 $640,151,383 $14,163,897 0.9%
FCA Clearing Prices 211.2% 100.0% 25.9% $628,642,922 $632,600,044 $635,238,125 $6,595,204 0.2%Electric Vehicles 50.0% 100.0% 140.0% $632,497,403 $632,600,044 $632,682,157 $184,754 0.0%
LMP Basis to HUB 97.9% 100.0% 102.1% $632,600,044 $632,600,044 $632,600,044 $0 0.0%
82.3%
115.4%
120.0%
94.8%
90.0%
29.2%
0.0%
157.8%
-3.7%
63.0%
-3.0%
49.3%
211.2%
50.0%
97.9%
117.7%
84.6%
10.0%
110.5%
110.0%
170.8%
175.0%
42.2%
3.7%
137.0%
3.0%
150.7%
25.9%
140.0%
102.1%
$550,000,000 $650,000,000 $750,000,000
Regional Network Service Rates
Discount rate
Renewable Energy Credits
Capacity Load Obligation
Monthly Peak (Trans)
Delivered Natural Gas Prices
VT Renewable Portfolio Standard
FRM Clearing Prices
Load Forecast
Implied Heat Rate
Load Forecast Error Percentage
Inflation
FCA Clearing Prices
Electric Vehicles
LMP Basis to HUB
20 YR NPV POWER COSTS
SensIt 1.31

114
SensIt 1.31 Scenario 23: SolarOut/SolarIn/FixCon/Mkt ContMany Inputs, One OutputSingle-Factor Sensitivity Analysis
Date 15-Jul-15 Workbook IRPResults4.xlsTime 6:11 PM Output Cell 'Sensit Input Table'!$C$25
20 YR NPV POWER COSTSCorresponding Input Value Output Value Percent
Input Variable Low Output Base Case High Output Low Base High Swing Swing 2̂Regional Network Service Rates 82.3% 100.0% 117.7% $579,462,322 $612,280,241 $645,098,168 $65,635,847 20.6%
Discount rate 115.4% 100.0% 84.6% $582,518,977 $612,280,241 $644,237,874 $61,718,896 18.2%Renewable Energy Credits 120.0% 100.0% 10.0% $601,513,696 $612,280,241 $660,729,695 $59,215,998 16.8%Capacity Load Obligation 94.8% 100.0% 110.5% $595,641,079 $612,280,241 $648,249,190 $52,608,111 13.3%
Monthly Peak (Trans) 90.0% 100.0% 110.0% $592,088,910 $612,280,241 $633,922,608 $41,833,698 8.4%VT Renewable Portfolio Standard 0.0% 100.0% 175.0% $597,302,270 $612,280,241 $635,524,734 $38,222,464 7.0%
FRM Clearing Prices 157.8% 100.0% 42.2% $597,325,697 $612,280,241 $627,234,786 $29,909,088 4.3%FCA Clearing Prices 211.2% 100.0% 25.9% $595,455,482 $612,280,241 $623,496,748 $28,041,267 3.8%
Load Forecast -3.7% 0.0% 3.7% $600,581,658 $612,280,241 $623,978,825 $23,397,166 2.6%Delivered Natural Gas Prices 29.2% 100.0% 170.8% $602,512,575 $612,280,241 $622,047,908 $19,535,333 1.8%
Load Forecast Error Percentage -3.0% 0.0% 3.0% $602,794,904 $612,280,241 $621,765,579 $18,970,675 1.7%Inflation 49.3% 100.0% 150.7% $605,667,683 $612,280,241 $619,831,580 $14,163,897 1.0%
Implied Heat Rate 63.0% 100.0% 137.0% $607,180,172 $612,280,241 $617,380,311 $10,200,138 0.5%Electric Vehicles 50.0% 100.0% 140.0% $612,177,600 $612,280,241 $612,362,354 $184,754 0.0%
LMP Basis to HUB 97.9% 100.0% 102.1% $612,280,242 $612,280,241 $612,280,242 $0 0.0%
82.3%
115.4%
120.0%
94.8%
90.0%
0.0%
157.8%
211.2%
-3.7%
29.2%
-3.0%
49.3%
63.0%
50.0%
97.9%
117.7%
84.6%
10.0%
110.5%
110.0%
175.0%
42.2%
25.9%
3.7%
170.8%
3.0%
150.7%
137.0%
140.0%
102.1%
$550,000,000 $650,000,000 $750,000,000
Regional Network Service Rates
Discount rate
Renewable Energy Credits
Capacity Load Obligation
Monthly Peak (Trans)
VT Renewable Portfolio Standard
FRM Clearing Prices
FCA Clearing Prices
Load Forecast
Delivered Natural Gas Prices
Load Forecast Error Percentage
Inflation
Implied Heat Rate
Electric Vehicles
LMP Basis to HUB
20 YR NPV POWER COSTS
SensIt 1.31

115
SensIt 1.31 Scenario 24: SolarOut/SolarIn/Mkt Cont/WindMany Inputs, One OutputSingle-Factor Sensitivity Analysis
Date 15-Jul-15 Workbook IRPResults4.xlsTime 6:14 PM Output Cell 'Sensit Input Table'!$C$25
20 YR NPV POWER COSTSCorresponding Input Value Output Value Percent
Input Variable Low Output Base Case High Output Low Base High Swing Swing 2̂Renewable Energy Credits 120.0% 100.0% 10.0% $595,383,615 $609,420,223 $672,584,962 $77,201,347 25.0%
Regional Network Service Rates 82.3% 100.0% 117.7% $576,602,303 $609,420,223 $642,238,150 $65,635,847 18.0%Discount rate 115.4% 100.0% 84.6% $579,729,202 $609,420,223 $641,308,035 $61,578,833 15.9%
Capacity Load Obligation 94.8% 100.0% 110.5% $592,781,061 $609,420,223 $645,389,171 $52,608,111 11.6%Monthly Peak (Trans) 90.0% 100.0% 110.0% $589,228,892 $609,420,223 $631,062,590 $41,833,698 7.3%FCA Clearing Prices 211.2% 100.0% 25.9% $585,261,491 $609,420,223 $625,526,045 $40,264,554 6.8%
VT Renewable Portfolio Standard 0.0% 100.0% 175.0% $594,442,252 $609,420,223 $632,664,716 $38,222,464 6.1%FRM Clearing Prices 157.8% 100.0% 42.2% $594,465,679 $609,420,223 $624,374,767 $29,909,088 3.7%
Load Forecast -3.7% 0.0% 3.7% $597,721,640 $609,420,223 $621,118,806 $23,397,166 2.3%Load Forecast Error Percentage -3.0% 0.0% 3.0% $599,934,886 $609,420,223 $618,905,561 $18,970,675 1.5%
Inflation 49.3% 100.0% 150.7% $602,807,665 $609,420,223 $616,971,562 $14,163,897 0.8%Delivered Natural Gas Prices 29.2% 100.0% 170.8% $602,774,653 $609,420,223 $616,065,794 $13,291,141 0.7%
Implied Heat Rate 63.0% 100.0% 137.0% $605,950,319 $609,420,223 $612,890,128 $6,939,809 0.2%Electric Vehicles 50.0% 100.0% 140.0% $609,317,582 $609,420,223 $609,502,336 $184,754 0.0%
LMP Basis to HUB 97.9% 100.0% 102.1% $609,420,223 $609,420,223 $609,420,223 $0 0.0%
120.0%
82.3%
115.4%
94.8%
90.0%
211.2%
0.0%
157.8%
-3.7%
-3.0%
49.3%
29.2%
63.0%
50.0%
97.9%
10.0%
117.7%
84.6%
110.5%
110.0%
25.9%
175.0%
42.2%
3.7%
3.0%
150.7%
170.8%
137.0%
140.0%
102.1%
$550,000,000 $650,000,000 $750,000,000
Renewable Energy Credits
Regional Network Service Rates
Discount rate
Capacity Load Obligation
Monthly Peak (Trans)
FCA Clearing Prices
VT Renewable Portfolio Standard
FRM Clearing Prices
Load Forecast
Load Forecast Error Percentage
Inflation
Delivered Natural Gas Prices
Implied Heat Rate
Electric Vehicles
LMP Basis to HUB
20 YR NPV POWER COSTS
SensIt 1.31
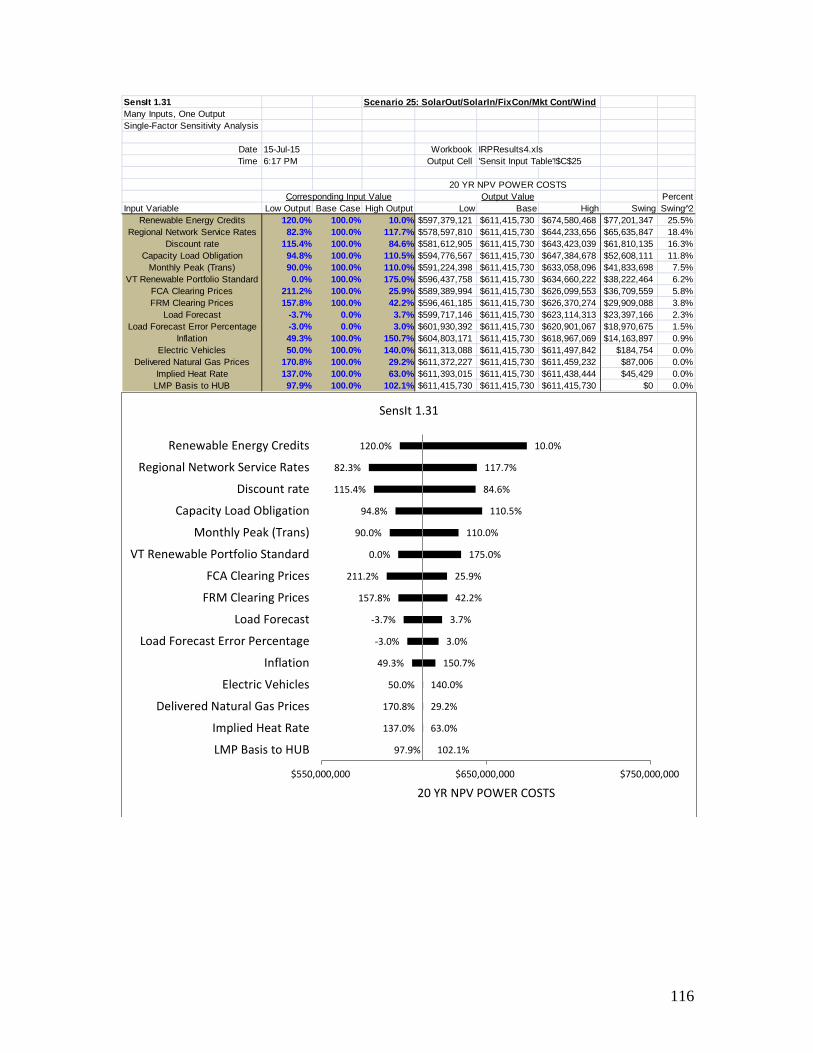
116
SensIt 1.31 Scenario 25: SolarOut/SolarIn/FixCon/Mkt Cont/WindMany Inputs, One OutputSingle-Factor Sensitivity Analysis
Date 15-Jul-15 Workbook IRPResults4.xlsTime 6:17 PM Output Cell 'Sensit Input Table'!$C$25
20 YR NPV POWER COSTSCorresponding Input Value Output Value Percent
Input Variable Low Output Base Case High Output Low Base High Swing Swing 2̂Renewable Energy Credits 120.0% 100.0% 10.0% $597,379,121 $611,415,730 $674,580,468 $77,201,347 25.5%
Regional Network Service Rates 82.3% 100.0% 117.7% $578,597,810 $611,415,730 $644,233,656 $65,635,847 18.4%Discount rate 115.4% 100.0% 84.6% $581,612,905 $611,415,730 $643,423,039 $61,810,135 16.3%
Capacity Load Obligation 94.8% 100.0% 110.5% $594,776,567 $611,415,730 $647,384,678 $52,608,111 11.8%Monthly Peak (Trans) 90.0% 100.0% 110.0% $591,224,398 $611,415,730 $633,058,096 $41,833,698 7.5%
VT Renewable Portfolio Standard 0.0% 100.0% 175.0% $596,437,758 $611,415,730 $634,660,222 $38,222,464 6.2%FCA Clearing Prices 211.2% 100.0% 25.9% $589,389,994 $611,415,730 $626,099,553 $36,709,559 5.8%FRM Clearing Prices 157.8% 100.0% 42.2% $596,461,185 $611,415,730 $626,370,274 $29,909,088 3.8%
Load Forecast -3.7% 0.0% 3.7% $599,717,146 $611,415,730 $623,114,313 $23,397,166 2.3%Load Forecast Error Percentage -3.0% 0.0% 3.0% $601,930,392 $611,415,730 $620,901,067 $18,970,675 1.5%
Inflation 49.3% 100.0% 150.7% $604,803,171 $611,415,730 $618,967,069 $14,163,897 0.9%Electric Vehicles 50.0% 100.0% 140.0% $611,313,088 $611,415,730 $611,497,842 $184,754 0.0%
Delivered Natural Gas Prices 170.8% 100.0% 29.2% $611,372,227 $611,415,730 $611,459,232 $87,006 0.0%Implied Heat Rate 137.0% 100.0% 63.0% $611,393,015 $611,415,730 $611,438,444 $45,429 0.0%
LMP Basis to HUB 97.9% 100.0% 102.1% $611,415,730 $611,415,730 $611,415,730 $0 0.0%
120.0%
82.3%
115.4%
94.8%
90.0%
0.0%
211.2%
157.8%
-3.7%
-3.0%
49.3%
50.0%
170.8%
137.0%
97.9%
10.0%
117.7%
84.6%
110.5%
110.0%
175.0%
25.9%
42.2%
3.7%
3.0%
150.7%
140.0%
29.2%
63.0%
102.1%
$550,000,000 $650,000,000 $750,000,000
Renewable Energy Credits
Regional Network Service Rates
Discount rate
Capacity Load Obligation
Monthly Peak (Trans)
VT Renewable Portfolio Standard
FCA Clearing Prices
FRM Clearing Prices
Load Forecast
Load Forecast Error Percentage
Inflation
Electric Vehicles
Delivered Natural Gas Prices
Implied Heat Rate
LMP Basis to HUB
20 YR NPV POWER COSTS
SensIt 1.31