violent victimization committed by strangers, 1993-2010...rate of violent victimization committed by...
TRANSCRIPT
U.S. Department of Justice Office of Justice Programs Bureau of Justice Statistics
BJS
Special ReportDECEMBER 2012 NCJ 239424
In 2010, about 1.8 million nonfatal violent victimizations were committed by strangers, which was a 77% decline from 7.9 million
victimizations in 1993. Violent victimizations committed by strangers accounted for about 38% of all nonfatal violence in 2010. Simple assault made up the majority (60%) of victimizations committed by strangers during the year, followed by aggravated assault (20%), robbery (17%), and rape or sexual assault (2%). From 1993 to 2008, among homicides reported to the FBI for which the victim-offender relationship was known, between 21% and 27% of homicides were committed by strangers and between 73% and 79% were committed by offenders known to the victims.
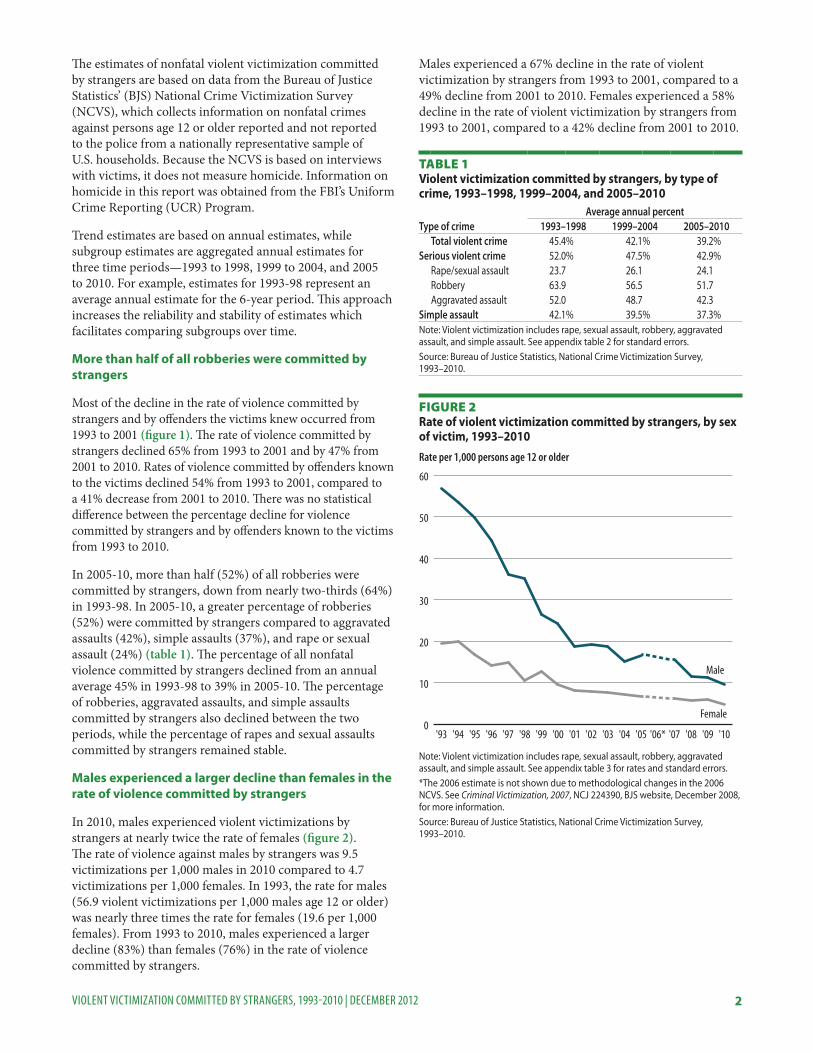
From 1993 to 2010, the rate of nonfatal violent victimization committed by strangers declined 81%, from 37.7 victimizations per 1,000 persons age 12 or older to 7.1 per 1,000 (figure 1). Similarly, during the 18-year period the rate of violence committed by offenders known to their victims dropped 73%, from 39.4 victimizations per 1,000 persons age 12 or older to 10.5 per 1,000. The percentage decline in the rate of violence committed by strangers and the rate committed by offenders known to the victim from 1993 to 2010 was not statistically different.
Erika Harrell, Ph.D., BJS Statistician
HIGHLIGHTS � In 2010, strangers committed about 38% of nonfatal violent crimes, including rape/sexual assault, robbery, aggravated assault, and simple assault.
� There was no statistical difference between the percentage decline for violence by strangers (81%) and by offenders known to the victims (73%) from 1993 to 2010.
� In 2005-10, more than half (52%) of all robberies were committed by strangers, down from nearly two-thirds (64%) in 1993-98.
� In 2005-10, strangers committed 62% of violent victimizations occurring in public places.
� In 2005-10, about 9% of violent victimizations that occurred in victims’ homes were committed by strangers.
� In 2005-10, about 10% of violent victimizations committed by strangers involved a firearm, compared to 5% committed by offenders known to the victim.
� In 2005-10, about 22% of victims of violence committed by strangers were injured, compared to 31% of victims who
knew the offender.
� In 2010, more than half (55%) of violent victimizations by strangers were reported to police, although the percentage fluctuated from 1993 to 2010.
� From 2005 to 2008, about 43% of homicides known to have been committed by a stranger occurred during a robbery or argument.
Violent Victimization Committed by Strangers, 1993-2010
0
10
20
30
40
50
Strangers
O�enders knowna
'10'09'08'07'06b'05'04'03'02'01'00'99'98'97'96'95'94'93
Rate per 1,000 persons age 12 or older
Figure 1Rate of violent victimization committed by strangers and offenders known to victims, 1993–2010
Note: Violent victimization includes rape, sexual assault, robbery, aggravated assault, and simple assault. See appendix table 1 for rates and standard errors.aIncludes intimate partners, relatives, friends, neighbors, and acquaintances.bThe 2006 estimate is not shown due to methodological changes in the 2006 NCVS. See Criminal Victimization, 2007, NCJ 224390, BJS website, December 2008, for more information.Source: Bureau of Justice Statistics, National Crime Victimization Survey, 1993–2010.
2VIOLENT VICTIMIZATION COMMITTED BY STRANGERS, 1993-2010 | DECEMBER 2012
The estimates of nonfatal violent victimization committed by strangers are based on data from the Bureau of Justice Statistics’ (BJS) National Crime Victimization Survey (NCVS), which collects information on nonfatal crimes against persons age 12 or older reported and not reported to the police from a nationally representative sample of U.S. households. Because the NCVS is based on interviews with victims, it does not measure homicide. Information on homicide in this report was obtained from the FBI’s Uniform Crime Reporting (UCR) Program.
Trend estimates are based on annual estimates, while subgroup estimates are aggregated annual estimates for three time periods—1993 to 1998, 1999 to 2004, and 2005 to 2010. For example, estimates for 1993-98 represent an average annual estimate for the 6-year period. This approach increases the reliability and stability of estimates which facilitates comparing subgroups over time.
More than half of all robberies were committed by strangers
Most of the decline in the rate of violence committed by strangers and by offenders the victims knew occurred from 1993 to 2001 (figure 1). The rate of violence committed by strangers declined 65% from 1993 to 2001 and by 47% from 2001 to 2010. Rates of violence committed by offenders known to the victims declined 54% from 1993 to 2001, compared to a 41% decrease from 2001 to 2010. There was no statistical difference between the percentage decline for violence committed by strangers and by offenders known to the victims from 1993 to 2010.
In 2005-10, more than half (52%) of all robberies were committed by strangers, down from nearly two-thirds (64%) in 1993-98. In 2005-10, a greater percentage of robberies (52%) were committed by strangers compared to aggravated assaults (42%), simple assaults (37%), and rape or sexual assault (24%) (table 1). The percentage of all nonfatal violence committed by strangers declined from an annual average 45% in 1993-98 to 39% in 2005-10. The percentage of robberies, aggravated assaults, and simple assaults committed by strangers also declined between the two periods, while the percentage of rapes and sexual assaults committed by strangers remained stable.
Males experienced a larger decline than females in the rate of violence committed by strangers
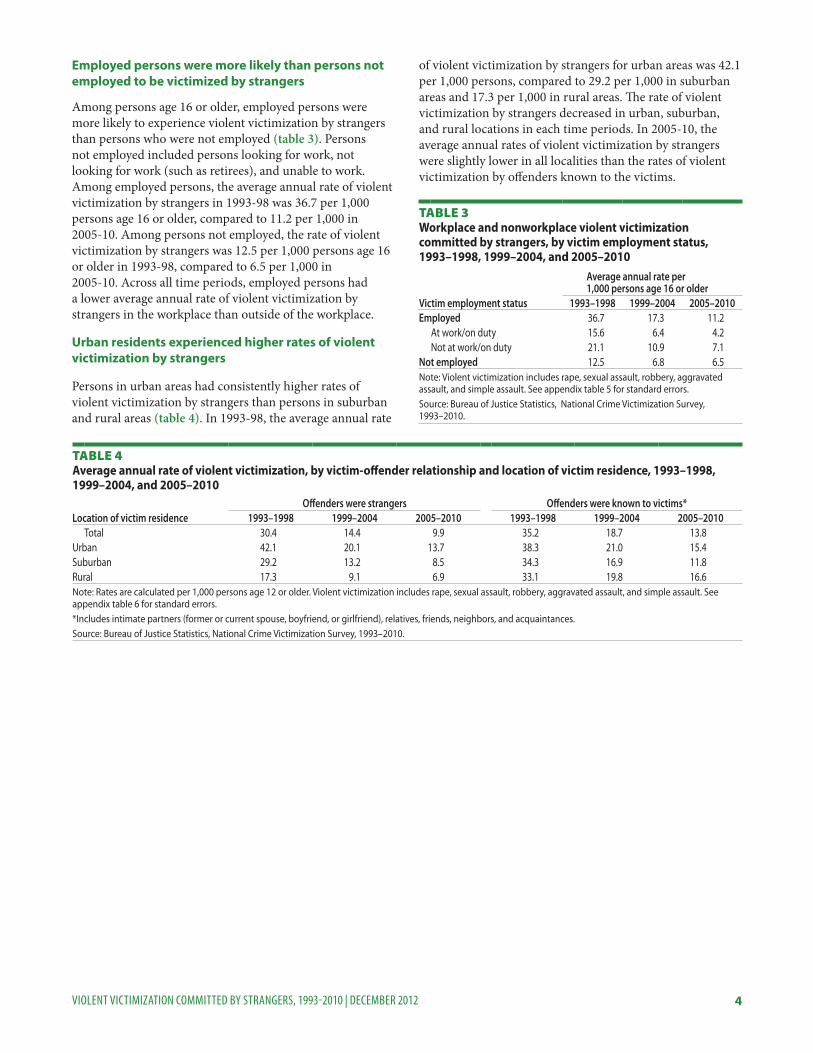
In 2010, males experienced violent victimizations by strangers at nearly twice the rate of females (figure 2). The rate of violence against males by strangers was 9.5 victimizations per 1,000 males in 2010 compared to 4.7 victimizations per 1,000 females. In 1993, the rate for males (56.9 violent victimizations per 1,000 males age 12 or older) was nearly three times the rate for females (19.6 per 1,000 females). From 1993 to 2010, males experienced a larger decline (83%) than females (76%) in the rate of violence committed by strangers.
Males experienced a 67% decline in the rate of violent victimization by strangers from 1993 to 2001, compared to a 49% decline from 2001 to 2010. Females experienced a 58% decline in the rate of violent victimization by strangers from 1993 to 2001, compared to a 42% decline from 2001 to 2010.
0
10
20
30
40
50
60
Female
Male
'10'09'08'07'06*'05'04'03'02'01'00'99'98'97'96'95'94'93
Rate per 1,000 persons age 12 or older
Figure 2 Rate of violent victimization committed by strangers, by sex of victim, 1993–2010
Note: Violent victimization includes rape, sexual assault, robbery, aggravated assault, and simple assault. See appendix table 3 for rates and standard errors.*The 2006 estimate is not shown due to methodological changes in the 2006 NCVS. See Criminal Victimization, 2007, NCJ 224390, BJS website, December 2008, for more information.Source: Bureau of Justice Statistics, National Crime Victimization Survey, 1993–2010.
Table 1Violent victimization committed by strangers, by type of crime, 1993–1998, 1999–2004, and 2005–2010
Type of crimeAverage annual percent
1993–1998 1999–2004 2005–2010Total violent crime 45.4% 42.1% 39.2%
Serious violent crime 52.0% 47.5% 42.9%Rape/sexual assault 23.7 26.1 24.1Robbery 63.9 56.5 51.7Aggravated assault 52.0 48.7 42.3
Simple assault 42.1% 39.5% 37.3%Note: Violent victimization includes rape, sexual assault, robbery, aggravated assault, and simple assault. See appendix table 2 for standard errors. Source: Bureau of Justice Statistics, National Crime Victimization Survey, 1993–2010.

3VIOLENT VICTIMIZATION COMMITTED BY STRANGERS, 1993-2010 | DECEMBER 2012
Young adults ages 18 to 24 were most likely to experience violent victimization by a stranger
American Indians and Alaska Natives had the highest rate of violent victimization by strangers among all racial and ethnic groups in each time period (table 2). In 1999-04, white, black, and Hispanic victims had similar average annual rates of violent victimization by strangers. Between 1999-04 and 2005-10, the annual average rate of violence by strangers declined 37% for Hispanics, 35% for whites, and 15% for blacks. In 2005-10, the lowest rates of violent victimization by strangers were observed among Asians and Pacific Islanders (5.9 per 1,000), whites (9.2 per 1,000), and Hispanics (9.8 per 1,000).
Persons ages 18 to 24 had the highest rate of violent victimization by strangers among all age groups in each time period. In 2005-10, the average annual rate of violent victimization committed by strangers against persons ages 12 to 17 was 15.5 per 1,000, slightly lower than the rate of 18.3 per 1,000 for persons ages 18 to 24. Persons age 65 or older experienced the lowest rate of violence by strangers (1.6 per 1,000). From 1993-98 to 2005-10, the rate of violent victimization by strangers declined for each age group.
In 2005-10, persons in households with average annual incomes of less than $7,500 had a higher average annual rate of violent victimization by strangers (20.2 per 1,000) than any other income category.* The rate of violent victimization by strangers decreased for each income category across the three time periods.
In each time period, persons who were never married experienced the highest rates of violent victimization by strangers. In 2005-10, persons who were never married experienced 16.7 violent victimizations by strangers per 1,000 persons, compared to 13.0 per 1,000 for persons who were divorced or separated, 5.7 for married persons, and 2.2 for persons who were widowed. Over the three time periods, the average annual rate of violent victimization by strangers fell for each marital status.
The rate of violent victimization by strangers decreased for persons in each educational level measured from 1993-98 to 2005-10. In 1993-98, the average annual rates of violent victimization by strangers against persons who had not completed high school (29.4 per 1,000) and those who were high school graduates (29.3 per 1,000) were lower than the rate for persons who had at least some college education (32.6 per 1,000). In 2005-10, the average annual rate of violent victimization by strangers did not differ statistically from one educational level to another (about 10 per 1,000).
Table 2Violent victimization committed by strangers, by victim characteristics, 1993–1998, 1999–2004, and 2005–2010
Average annual rate Victim characteristic 1993–1998 1999–2004 2005–2010
Total 30.4 14.4 9.9Race/Hispanic origin
White* 29.9 14.2 9.2Black/African American* 31.8 15.6 13.3Hispanic/Latino 33.4 15.5 9.8American Indian/ Alaska Native* 60.0 41.3 28.2Asian/Pacific Islander* 25.3 8.3 5.9Two or more races* : : 27.6
Age 12–17 52.2 21.7 15.518–24 61.0 31.5 18.325–34 41.1 19.4 14.335–49 26.7 12.2 9.550–64 12.9 8.5 5.665 or older 3.1 1.6 1.6
Annual household incomeLess than $7,500 39.4 25.0 20.2$7,500 to $14,999 31.3 16.5 13.7$15,000 to $24,999 29.9 15.1 12.4$25,000 to $34,999 31.6 16.0 11.0$35,000 to $49,999 30.3 14.3 8.9$50,000 to $74,999 33.0 14.8 10.7$75,000 or more 29.6 14.2 8.7Unknown 22.3 10.4 8.0
Marital statusNever married 52.6 25.3 16.7Married 18.9 8.3 5.7Widowed 5.1 3.4 2.2Divorced or separated 38.9 17.7 13.0
Educational levelLess than high school 29.4 14.2 10.3High school graduate 29.3 14.3 9.6At least some college 32.6 14.9 10.2
Note: Rates are calculated per 1,000 persons age 12 or older. Violent victimization includes rape, sexual assault, robbery, aggravated assault, and simple assault. See appendix table 4 for standard errors.: Not calculated because the National Crime Victimization Survey race categories did not include “two or more races” until 2003.*Excludes persons of Hispanic or Latino origin. Source: Bureau of Justice Statistics, National Crime Victimization Survey, 1993–2010.
*Rate calculated per 1,000 persons age 12 or older living in households with annual income of less than $7,500.
4VIOLENT VICTIMIZATION COMMITTED BY STRANGERS, 1993-2010 | DECEMBER 2012
Employed persons were more likely than persons not employed to be victimized by strangers
Among persons age 16 or older, employed persons were more likely to experience violent victimization by strangers than persons who were not employed (table 3). Persons not employed included persons looking for work, not looking for work (such as retirees), and unable to work. Among employed persons, the average annual rate of violent victimization by strangers in 1993-98 was 36.7 per 1,000 persons age 16 or older, compared to 11.2 per 1,000 in 2005-10. Among persons not employed, the rate of violent victimization by strangers was 12.5 per 1,000 persons age 16 or older in 1993-98, compared to 6.5 per 1,000 in 2005-10. Across all time periods, employed persons had a lower average annual rate of violent victimization by strangers in the workplace than outside of the workplace.
Urban residents experienced higher rates of violent victimization by strangers
Persons in urban areas had consistently higher rates of violent victimization by strangers than persons in suburban and rural areas (table 4). In 1993-98, the average annual rate
of violent victimization by strangers for urban areas was 42.1 per 1,000 persons, compared to 29.2 per 1,000 in suburban areas and 17.3 per 1,000 in rural areas. The rate of violent victimization by strangers decreased in urban, suburban, and rural locations in each time periods. In 2005-10, the average annual rates of violent victimization by strangers were slightly lower in all localities than the rates of violent victimization by offenders known to the victims.
Table 3Workplace and nonworkplace violent victimization committed by strangers, by victim employment status, 1993–1998, 1999–2004, and 2005–2010
Victim employment status
Average annual rate per 1,000 persons age 16 or older
1993–1998 1999–2004 2005–2010Employed 36.7 17.3 11.2
At work/on duty 15.6 6.4 4.2Not at work/on duty 21.1 10.9 7.1
Not employed 12.5 6.8 6.5Note: Violent victimization includes rape, sexual assault, robbery, aggravated assault, and simple assault. See appendix table 5 for standard errors.Source: Bureau of Justice Statistics, National Crime Victimization Survey, 1993–2010.
Table 4Average annual rate of violent victimization, by victim-offender relationship and location of victim residence, 1993–1998, 1999–2004, and 2005–2010
Location of victim residence Offenders were strangers Offenders were known to victims*
1993–1998 1999–2004 2005–2010 1993–1998 1999–2004 2005–2010Total 30.4 14.4 9.9 35.2 18.7 13.8
Urban 42.1 20.1 13.7 38.3 21.0 15.4Suburban 29.2 13.2 8.5 34.3 16.9 11.8Rural 17.3 9.1 6.9 33.1 19.8 16.6Note: Rates are calculated per 1,000 persons age 12 or older. Violent victimization includes rape, sexual assault, robbery, aggravated assault, and simple assault. See appendix table 6 for standard errors.*Includes intimate partners (former or current spouse, boyfriend, or girlfriend), relatives, friends, neighbors, and acquaintances.Source: Bureau of Justice Statistics, National Crime Victimization Survey, 1993–2010.

5VIOLENT VICTIMIZATION COMMITTED BY STRANGERS, 1993-2010 | DECEMBER 2012
Persons residing in places with larger populations had higher rates of violent victimization by strangers
In 2005-10, places with populations of less than 50,000 had the lowest rate of violence by strangers (7.9 per 1,000) (table 5). Places with populations of 250,000 or more had similar rates of violence by strangers, ranging from 12.9 to 16.2 victimizations per 1,000. From 1999-04 to 2005-10, for every population size, the rate of violent victimization by strangers declined.
In 2005-10, in places with populations of 249,999 or less, the rate of violence by strangers was lower than the rate of violence by persons known to the victims. In places with populations of 500,000 or more, the rate of violence by strangers was higher than the rate of violence by persons known to the victims in 2005-10.
A higher proportion of violent victimization by strangers occurred in public places than in private places
In 2005-10, among violence committed by strangers more than half (51%) of the victimizations occurred in public places, including in commercial locations (14%), parking lots or garages (9%), and on streets, public transportation and other open areas (such as public parks) (27%) (table 6). About a quarter of violent victimization by strangers occurred in private places, such as the victim’s or neighbor’s home. The average annual percentage of violent victimization by strangers occurring in private places increased from about 17% in 1993-98 to 26% in 2005-10.
Table 5Average annual rate of violent victimization, by victim-offender relationship and population where victim lived, 1999–2004 and 2005–2010
Population sizeOffenders were strangers Offenders were known to victims*
1999–2004 2005–2010 1999–2004 2005–2010Less than 50,000 11.8 7.9 18.2 13.850,000 to 249,999 18.0 12.9 19.6 14.8250,000 to 499,999 21.7 14.4 19.6 17.4500,000 to 999,999 24.2 16.2 30.5 12.61,000,000 or more 20.1 13.2 14.0 9.2Note: Rates are calculated per 1,000 persons age 12 or older. Violent victimization includes rape, sexual assault, robbery, aggravated assault, and simple assault. Study period starts with 1999, because earlier population data would not be comparable. (See Methodology for more detail.) See appendix table 7 for standard errors. *Includes intimate partners (former or current spouse, boyfriend, or girlfriend), relatives, friends, neighbors, and acquaintances.Source: Bureau of Justice Statistics, National Crime Victimization Survey, 1999–2010.
Table 6 Average annual percent and number of violent victimizations, by victim-offender relationship and location of crime, 1993–1998, 1999–2004, and 2005–2010
Location of crimeOffenders were strangers Offenders were known to victimsa
1993–1998 1999–2004 2005–2010 1993–1998 1999–2004 2005–2010Total 100% 100% 100% 100% 100% 100%
Private places 17.2% 21.7% 25.9% 51.8% 51.9% 60.1%Victim’s home or lodging 2.1 3.4 4.8 28.2 27.1 35.9Near victim’s home 9.6 13.5 15.9 13.5 14.1 15.0In/at/near friend’s/neighbor’s/relative’s home 5.5 4.8 5.2 10.1 10.8 9.2
Public places 58.2% 57.5% 50.8% 21.2% 19.9% 17.6%Commercial place 16.7 18.4 14.3 9.4 9.2 8.3Parking lot/garage 10.0 10.3 9.3 3.5 3.4 2.6Open area/on street/public transportationb 31.5 28.8 27.2 8.3 7.3 6.7
School 9.2% 8.2% 9.4% 18.9% 20.0% 14.5%Otherc 15.4% 12.6% 13.9% 8.1% 8.3% 7.8%
Average annual number 6,585,670 3,349,520 2,475,450 7,618,640 4,332,830 3,450,060Note: Violent victimization includes rape, sexual assault, robbery, aggravated assault, and simple assault. See appendix table 8 for standard errors.aIncludes intimate partners (former or current spouse, boyfriend, or girlfriend), relatives, friends, neighbors, and acquaintances. bIncludes locations such as an apartment yard; park, field, playground, other than on school property; a location on the street other than that immediately adjacent to victim’s home or home of a friend, relative, or neighbor; on public transportation or in a station or depot for bus or train; on a plane; or in an airport. cIncludes any other location not otherwise classified.Source: Bureau of Justice Statistics, National Crime Victimization Survey, 1993–2010.
6VIOLENT VICTIMIZATION COMMITTED BY STRANGERS, 1993-2010 | DECEMBER 2012
A larger percentage of violent crime in public places was committed by strangers than in private places. In 2005-10, strangers committed 62% of violent victimizations that occurred in public places (table 7). In private places, about 23% of violent victimizations were committed by strangers, including about 9% of violent victimizations that occurred in the victim’s home.
Between 1993-98 and 1999-04, the percentage of violence in private places committed by strangers increased slightly, while the percentage occurring in public places decreased slightly. Between 1999-04 and 2005-10, the percentage of violent victimization occurring in private places that was committed by strangers remained stable, the percentage occurring in public places decreased, and the percentage occurring in school increased.
In 2005-10, about half of violent victimizations by strangers occurred while the victims were away from home traveling, shopping or doing leisure activities
During the three time periods, between 47% and 49% of victimizations committed by strangers occurred while the victim was traveling, shopping, or participating in leisure activities away from home. The average annual percentage of violent victimization committed by strangers while the victim was doing activities at home increased slightly over the three periods, as it did for victimizations by offenders known to their victims (table 8). In both cases, the average annual number of victimizations declined over time (not shown in table). In 1993-98, the percentage of violent victimizations by strangers that occurred while the victim
was doing activities at home (about 8%) was lower than the percentage of violent victimizations by strangers occurring at work (about 33%). By comparison, in 2005-10, 14% of violent victimizations by strangers occurred while the victim was sleeping or doing other activities at home, while about 26% occurred while the victim was working.
Table 7 Percent of violent victimization occurring in various locations that were committed by strangers, 1993–1998, 1999–2004, and 2005–2010Location of crime 1993–1998 1999–2004 2005–2010Private places 21.8% 23.7% 22.5%
Victim’s home or lodging 6.1 8.7 8.6Near victim’s home 36.9 41.0 40.4In/at/near friend’s/neighbor’s/ relative’s home 31.3 24.7 26.5
Public places 68.7% 66.4% 61.9%Commercial place 59.1 59.1 51.2Parking lot/garage 69.2 67.4 65.7Open area/on street/ public transportationa 75.0 71.7 68.1
School 29.2% 23.4% 29.2%Otherb 60.8 52.3 54.4Note: Violent victimization includes rape, sexual assault, robbery, aggravated assault, and simple assault. See appendix table 9 for standard errors.aIncludes locations such as an apartment yard; park, field, playground, other than on school property; a location on the street other than that immediately adjacent to victim’s home or home of a friend, relative, or neighbor; on public transportation or in a station or depot for bus or train; on a plane; or in an airport.bIncludes any location not otherwise classified.Source: Bureau of Justice Statistics, National Crime Victimization Survey, 1993–2010.
Table 8 Average annual percent and number of violent victimizations, by victim-offender relationship and victim activity when crime occurred, 1993–1998, 1999–2004, and 2005–2010
Victim activityOffenders were strangers Offenders were known to victimsa
1993–1998 1999–2004 2005–2010 1993–1998 1999–2004 2005–2010Total 100% 100% 100% 100% 100% 100%
Working 32.7 28.2 25.5 17.0 16.1 14.3Traveling, shopping, and leisure activitiesb 47.1 48.2 49.4 26.5 25.5 25.6Attending school 5.6 4.6 6.7 12.4 13.6 10.6Sleeping and other activities at home 8.3 12.4 14.2 35.7 37.7 43.6Other 6.1 6.4 4.1 7.5 6.4 4.4Do not know 0.2 0.3 ! 0.1 ! 0.9 0.6 1.6
Average annual number 6,585,670 3,349,520 2,475,450 7,618,640 4,332,830 3,450,060Note: Violent victimization includes rape, sexual assault, robbery, aggravated assault, and simple assault. See appendix table 10 for standard errors.! Interpret with caution; estimate based on 10 or fewer cases or coefficient of variation is greater than 50%.aIncludes intimate partners (former or current spouse, boyfriend, or girlfriend), relatives, friends, neighbors, and acquaintances.bIncludes traveling to and from work, school, or other places; shopping or running errands; and leisure activities away from home.Source: Bureau of Justice Statistics, National Crime Victimization Survey, 1993–2010
7VIOLENT VICTIMIZATION COMMITTED BY STRANGERS, 1993-2010 | DECEMBER 2012
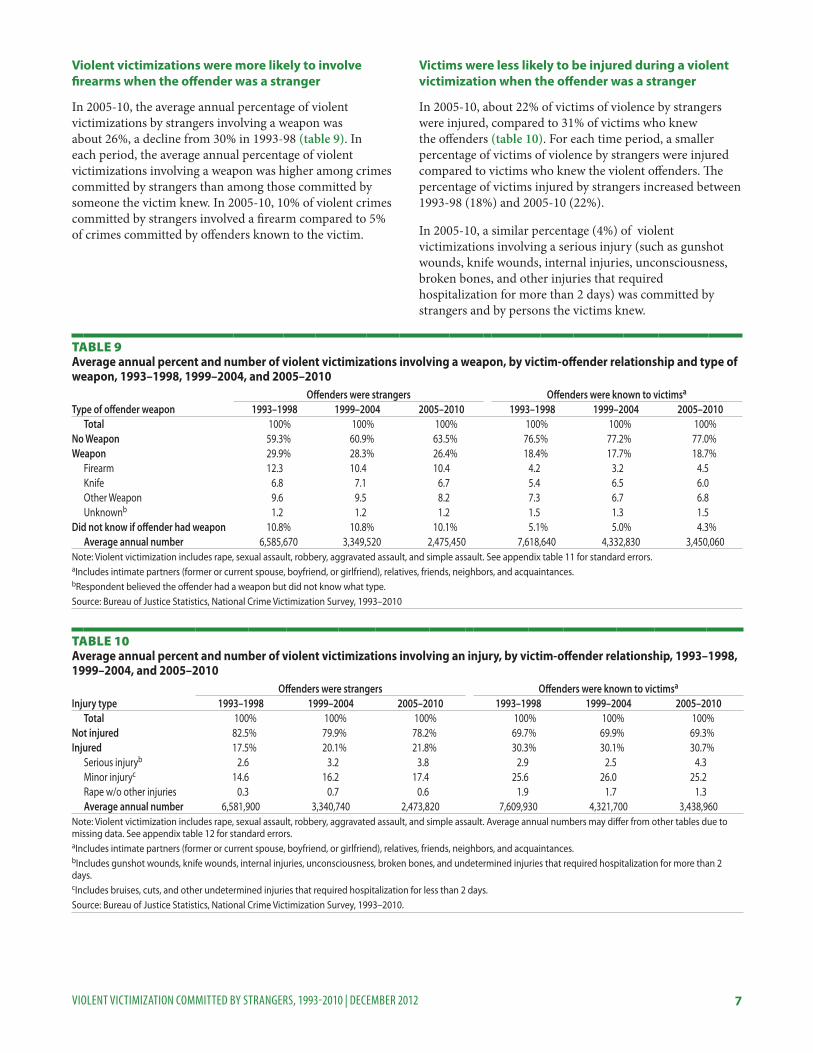
Violent victimizations were more likely to involve firearms when the offender was a stranger
In 2005-10, the average annual percentage of violent victimizations by strangers involving a weapon was about 26%, a decline from 30% in 1993-98 (table 9). In each period, the average annual percentage of violent victimizations involving a weapon was higher among crimes committed by strangers than among those committed by someone the victim knew. In 2005-10, 10% of violent crimes committed by strangers involved a firearm compared to 5% of crimes committed by offenders known to the victim.
Victims were less likely to be injured during a violent victimization when the offender was a stranger
In 2005-10, about 22% of victims of violence by strangers were injured, compared to 31% of victims who knew the offenders (table 10). For each time period, a smaller percentage of victims of violence by strangers were injured compared to victims who knew the violent offenders. The percentage of victims injured by strangers increased between 1993-98 (18%) and 2005-10 (22%).
In 2005-10, a similar percentage (4%) of violent victimizations involving a serious injury (such as gunshot wounds, knife wounds, internal injuries, unconsciousness, broken bones, and other injuries that required hospitalization for more than 2 days) was committed by strangers and by persons the victims knew.
Table 9 Average annual percent and number of violent victimizations involving a weapon, by victim-offender relationship and type of weapon, 1993–1998, 1999–2004, and 2005–2010
Type of offender weapon Offenders were strangers Offenders were known to victimsa
1993–1998 1999–2004 2005–2010 1993–1998 1999–2004 2005–2010Total 100% 100% 100% 100% 100% 100%
No Weapon 59.3% 60.9% 63.5% 76.5% 77.2% 77.0%Weapon 29.9% 28.3% 26.4% 18.4% 17.7% 18.7%
Firearm 12.3 10.4 10.4 4.2 3.2 4.5Knife 6.8 7.1 6.7 5.4 6.5 6.0Other Weapon 9.6 9.5 8.2 7.3 6.7 6.8Unknownb 1.2 1.2 1.2 1.5 1.3 1.5
Did not know if offender had weapon 10.8% 10.8% 10.1% 5.1% 5.0% 4.3%Average annual number 6,585,670 3,349,520 2,475,450 7,618,640 4,332,830 3,450,060
Note: Violent victimization includes rape, sexual assault, robbery, aggravated assault, and simple assault. See appendix table 11 for standard errors.aIncludes intimate partners (former or current spouse, boyfriend, or girlfriend), relatives, friends, neighbors, and acquaintances.bRespondent believed the offender had a weapon but did not know what type.Source: Bureau of Justice Statistics, National Crime Victimization Survey, 1993–2010
Table 10 Average annual percent and number of violent victimizations involving an injury, by victim-offender relationship, 1993–1998, 1999–2004, and 2005–2010
Offenders were strangers Offenders were known to victimsa
Injury type 1993–1998 1999–2004 2005–2010 1993–1998 1999–2004 2005–2010Total 100% 100% 100% 100% 100% 100%
Not injured 82.5% 79.9% 78.2% 69.7% 69.9% 69.3%Injured 17.5% 20.1% 21.8% 30.3% 30.1% 30.7%
Serious injuryb 2.6 3.2 3.8 2.9 2.5 4.3Minor injuryc 14.6 16.2 17.4 25.6 26.0 25.2Rape w/o other injuries 0.3 0.7 0.6 1.9 1.7 1.3Average annual number 6,581,900 3,340,740 2,473,820 7,609,930 4,321,700 3,438,960
Note: Violent victimization includes rape, sexual assault, robbery, aggravated assault, and simple assault. Average annual numbers may differ from other tables due to missing data. See appendix table 12 for standard errors. aIncludes intimate partners (former or current spouse, boyfriend, or girlfriend), relatives, friends, neighbors, and acquaintances.bIncludes gunshot wounds, knife wounds, internal injuries, unconsciousness, broken bones, and undetermined injuries that required hospitalization for more than 2 days.cIncludes bruises, cuts, and other undetermined injuries that required hospitalization for less than 2 days.Source: Bureau of Justice Statistics, National Crime Victimization Survey, 1993–2010.
8VIOLENT VICTIMIZATION COMMITTED BY STRANGERS, 1993-2010 | DECEMBER 2012
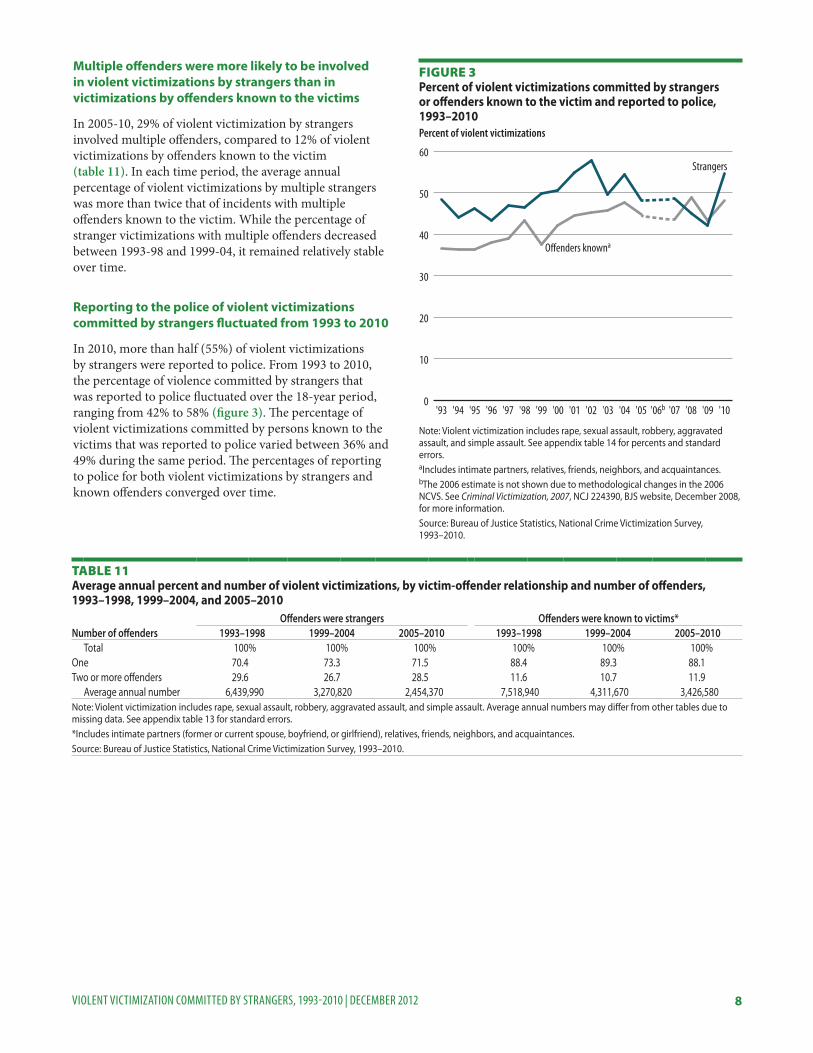
Multiple offenders were more likely to be involved in violent victimizations by strangers than in victimizations by offenders known to the victims
In 2005-10, 29% of violent victimization by strangers involved multiple offenders, compared to 12% of violent victimizations by offenders known to the victim (table 11). In each time period, the average annual percentage of violent victimizations by multiple strangers was more than twice that of incidents with multiple offenders known to the victim. While the percentage of stranger victimizations with multiple offenders decreased between 1993-98 and 1999-04, it remained relatively stable over time.
Reporting to the police of violent victimizations committed by strangers fluctuated from 1993 to 2010
In 2010, more than half (55%) of violent victimizations by strangers were reported to police. From 1993 to 2010, the percentage of violence committed by strangers that was reported to police fluctuated over the 18-year period, ranging from 42% to 58% (figure 3). The percentage of violent victimizations committed by persons known to the victims that was reported to police varied between 36% and 49% during the same period. The percentages of reporting to police for both violent victimizations by strangers and known offenders converged over time.
Table 11Average annual percent and number of violent victimizations, by victim-offender relationship and number of offenders, 1993–1998, 1999–2004, and 2005–2010
Offenders were strangers Offenders were known to victims*Number of offenders 1993–1998 1999–2004 2005–2010 1993–1998 1999–2004 2005–2010
Total 100% 100% 100% 100% 100% 100%One 70.4 73.3 71.5 88.4 89.3 88.1Two or more offenders 29.6 26.7 28.5 11.6 10.7 11.9
Average annual number 6,439,990 3,270,820 2,454,370 7,518,940 4,311,670 3,426,580Note: Violent victimization includes rape, sexual assault, robbery, aggravated assault, and simple assault. Average annual numbers may differ from other tables due to missing data. See appendix table 13 for standard errors.*Includes intimate partners (former or current spouse, boyfriend, or girlfriend), relatives, friends, neighbors, and acquaintances.Source: Bureau of Justice Statistics, National Crime Victimization Survey, 1993–2010.
0
10
20
30
40
50
60
O�enders knowna
Strangers
'10'09'08'07'06b'05'04'03'02'01'00'99'98'97'96'95'94'93
Percent of violent victimizations
Figure 3Percent of violent victimizations committed by strangers or offenders known to the victim and reported to police, 1993–2010
Note: Violent victimization includes rape, sexual assault, robbery, aggravated assault, and simple assault. See appendix table 14 for percents and standard errors. aIncludes intimate partners, relatives, friends, neighbors, and acquaintances.bThe 2006 estimate is not shown due to methodological changes in the 2006 NCVS. See Criminal Victimization, 2007, NCJ 224390, BJS website, December 2008, for more information. Source: Bureau of Justice Statistics, National Crime Victimization Survey, 1993–2010.

9VIOLENT VICTIMIZATION COMMITTED BY STRANGERS, 1993-2010 | DECEMBER 2012
About a third of violent victimization by strangers was dealt with in some way other than reporting to the police
The average annual percentage of violent victimization by strangers that was dealt with in some way other than reporting to the police remained stable from 1993-98 to 2005-10 (table 12). The percentage of victimizations by strangers not reported to police because the respondent thought it was not important enough increased from 30% in 1993-98 to 34% in 2005-10. In each time period, the percentage of violent victimization by strangers that was dealt with in another way was lower than that for violent victimization by an offender known to the victim.
From 2005 to 2008, at least 43% of homicides by strangers occurred during a robbery or argument
From 1993 to 2008, the annual percentage of homicides for which the relationship between the victim and offender was known varied between 53% and 62%, according to the FBI’s Supplementary Homicide Reports (figure 4). Among homicides in which the relationship could be determined, between 21% and 27% of homicides were committed by strangers and between 73% and 79% were committed by offenders known to the victims (not shown in table). If the victim-offender relationship was known for all homicides, it is likely the percentage of stranger homicides would increase slightly.
Table 12 Average annual percent and number of violent victimizations not reported to police, by victim-offender relationship and reason for not reporting, 1993–1998, 1999–2004, and 2005–2010
Reason incident was not reported to policeOffenders were strangers Offenders were known to victimsa
1993–1998 1999–2004 2005–2010 1993–1998 1999–2004 2005–2010Total 100% 100% 100% 100% 100% 100%
Dealt with another wayb 33.6 34.8 31.0 47.5 53.6 46.2Not important enough to respondentc 30.3 33.3 34.1 20.6 18.4 17.8Police couldn’t do anythingd 7.9 7.6 7.8 0.7 1.2 1.4Police wouldn’t helpe 14.4 12.1 18.5 11.3 10.0 17.4Other reasonf 31.8 32.4 28.4 36.7 36.4 39.1Do not know why it was not reported 1.4 1.4 1.4 1.8 0.8 1.1
Average annual number 3,451,440 1,510,100 1,243,920 4,652,780 2,390,640 1,870,180Note: Percentages sum to more than 100% due to allowance of more than one reason. Violent victimization includes rape, sexual assault, robbery, aggravated assault, and simple assault. See appendix table 15 for standard errors.aIncludes intimate partners (former or current spouse, boyfriend, or girlfriend), relatives, friends, neighbors, and acquaintances.bIncludes cases reported to another official and cases in which the victims did not report a crime to police because they considered the event a private or personal matter.cIncludes cases victims did not report to police because they considered it a minor crime, the crime was committed by a child, or the victim was not certain a crime had occurred.dIncludes cases in which victims did report to police because they did not find out until too late, thought they could not recover or identify property, or lacked proof.eIncludes cases in which victims believed police wouldn’t think it was important enough, police would be inefficient, police would be biased, or offender was a police officer.fIncludes cases in which victims were protecting the offender, were advised not to report to police, feared reprisal, considered reporting too inconvenient, thought insurance would not cover loss, and other reasons.Source: Bureau of Justice Statistics, National Crime Victimization Survey, 1993–2010.
0
10
20
30
40
50
60
O�enders known*
Unknown relationships
Strangers
'08'07'06'05'04'03'02'01'00'99'98'97'96'95'94'93
Percent of homicides
Figure 4 Victim-offender relationship in homicides, 1993–2008
Note: See appendix table 16 for percents.*Includes intimate partners, relatives, friends, neighbors, and acquaintances. Source: Federal Bureau of Investigation, Supplementary Homicide Reports, Uniform Crime Reports, 1993–2008.

10VIOLENT VICTIMIZATION COMMITTED BY STRANGERS, 1993-2010 | DECEMBER 2012
Robbery and arguments over something other than money were the most common circumstances of homicide by a stranger (table 13). From 2005 to 2008, 19% of all stranger homicides were committed during a robbery, while about 24% of stranger homicides were committed during arguments over something other than money. About 21% of stranger homicides were committed under circumstances unknown to the police.
Table 13Circumstances of stranger homicide, 1993–1998, 1999–2004, and 2005–2008
Average annual percentage of stranger homicidesCircumstance 1993–1998 1999–2004 2005–2008
Total 100% 100% 100%Rape 0.7 0.6 0.4Robbery 28.0 21.5 19.3Burglary 1.7 1.6 1.3Larceny 0.4 0.4 0.2Auto theft 0.7 0.4 0.3Arson 0.4 0.3 0.1Prostitution 0.1 0.2 0.1Other sex offense 0.2 0.1 0.1Narcotics laws 4.7 3.8 3.5Gambling 0.1 0.1 0.0!Other felony 1.9 3.1 3.9Lovers triangle 0.8 0.6 0.5Brawl under alcohol 1.9 1.9 1.5Brawl under drugs 0.8 0.5 0.5Argument over money 1.0 0.9 1.1Other arguments 24.3 26.7 23.8Gangland killing 0.9 0.9 1.0Youth gang killing 7.8 8.3 8.4Other* 11.3 11.6 13.0Suspected felony 0.7 0.2 0.3Unknown 11.8 16.5 20.7
Average annual number 2,796 2,014 2,118*Includes institutional killings, sniper attacks, and homicides that occurred under undefined circumstances.Source: Federal Bureau of Investigation, Supplementary Homicide Reports, Uniform Crime Reporting Program, 1993-2008.

11VIOLENT VICTIMIZATION COMMITTED BY STRANGERS, 1993-2010 | DECEMBER 2012
MethodologyThe National Crime Victimization Survey (NCVS) is an annual data collection conducted by the U.S. Census Bureau for the Bureau of Justice Statistics (BJS). The NCVS is a self-report survey in which interviewed persons are asked about the number and characteristics of victimizations experienced during the prior six months. The NCVS collects information on nonfatal personal crimes (rape or sexual assault, robbery, aggravated assault, and simple assault, and personal larceny) and property crimes (burglary, motor vehicle theft, and other theft) both reported and not reported to police. In addition to providing annual level and change estimates on criminal victimization, the NCVS is the primary source of information on the nature of criminal victimization incidents. Survey respondents provide information about themselves (such as age, sex, race and ethnicity, marital status, education level, and income) and whether they experienced victimization. Information are collected for each victimization incident about the offender (such as age, race and ethnicity, sex, and victim-offender relationship), characteristics of the crime (including time and place of occurrence, use of weapons, nature of injury, and economic consequences), whether the crime was reported to police, reasons why the crime was or was not reported, and experiences with the criminal justice system.
The NCVS is administered to persons age 12 or older from a nationally representative sample of households in the United States. The NCVS defines a household as a group of members who all reside at a sampled address. Persons are considered household members when the sampled address is their usual place of residence at the time of the interview and when they have no usual place of residence elsewhere. Once selected, households remain in the sample for three years, and eligible persons in these households are interviewed every six months for a total of seven interviews. New households rotate into the sample on an ongoing basis to replace outgoing households that have been in the sample for the three-year period. The sample includes persons living in group quarters, such as dormitories, rooming houses, and religious group dwellings, and excludes persons living in military barracks and institutional settings, such as correctional or hospital facilities, and the homeless. (For more detail, see the Survey Methodology in Criminal Victimization in the United States, 2008, NCJ 231173, BJS website, May 2011.)
From 2005 to 2010, a total of 835,000 persons from about 472,000 households were interviewed. This equates to an annual average of 139,000 persons age 12 or older in 76,000 households interviewed each year from 2005 to 2010. In 2010, about 41,000 households and 73,300 persons age 12 or older were interviewed for the NCVS. Each household was interviewed twice during the year. The response rate was 92.3% of households and 87.5% of eligible individuals.
Victimizations that occurred outside of the United States were excluded from this report. From 1993 to 2010, about 1% of about 42,000 unweighted nonfatal violent victimizations occurred outside of the United States and was excluded from the analysis.
Weighting adjustments for estimating personal victimization
Estimates in this report use data from the 1993 to 2010 NCVS data files. These files are weighted to produce annual estimates of victimization for persons age 12 or older living in U.S. households. Because the NCVS relies on a sample rather than a census of the entire U.S. population, weights are designed to inflate sample point estimates to known population totals and to compensate for survey nonresponse and other aspects of the sample design.
The NCVS data files include both person and household weights. Person weights provide an estimate of the population represented by each person in the sample. Household weights provide an estimate of the total U.S. household population. Person weights are most frequently used to compute estimates of criminal victimizations of persons in the total population. Both household and person weights, after proper adjustment, are also used to form the denominator in calculations of crime rates.
Victimization weights used in this analysis account for the number of persons present during an incident and for repeat victims of series incidents. The weight counts series incidents as the actual number of incidents reported by the victim, up to a maximum of 10 incidents. Series victimizations are similar in type but occur with such frequency that a victim is unable to recall the details of each individual event. Survey procedures allow NCVS interviewers to identify and classify these similar victimizations as series victimizations and to collect detailed information on only the most recent incident in the series.
In 2010, about 3% of all victimizations were series incidents. Weighting series incidents as the number of incidents up to a maximum of 10 incidents produces more reliable estimates of crime levels, while the cap at 10 minimizes the effect of extreme outliers on the rates. Additional information on the series enumeration is detailed in the report Methods for Counting High Frequency Repeat Victimizations in the National Crime Victimization Survey, NCJ 237308, BJS website, April 2012.
Standard error computations
When national estimates are derived from a sample, as is the case with the NCVS, caution must be taken when comparing one estimate to another estimate or when comparing estimates over time. Although one estimate may be larger than another, estimates based on a sample have some degree of sampling error. The sampling error of an
12VIOLENT VICTIMIZATION COMMITTED BY STRANGERS, 1993-2010 | DECEMBER 2012
estimate depends on several factors, including the amount of variation in the responses, the size of the sample, and the size of the subgroup for which the estimate is computed. When the sampling error around the estimates is taken into consideration, the estimates that appear different may, in fact, not be statistically different.
One measure of the sampling error associated with an estimate is the standard error. The standard error can vary from one estimate to the next. In general, for a given metric, an estimate with a smaller standard error provides a more reliable approximation of the true value than an estimate with a larger standard error. Estimates with relatively large standard errors are associated with less precision and reliability and should be interpreted with caution.
In order to generate standard errors around estimates from the NCVS, the Census Bureau produces generalized variance function (GVF) parameters for BJS. The GVFs take into account aspects of the NCVS complex sample design and represent the curve fitted to a selection of individual standard errors based on the Jackknife Repeated Replication technique. The GVF parameters were used to generate standard errors for each point estimate (such as counts, percentages, and rates) in the report. For average annual estimates, standard errors were based on the ratio of the sums of victimizations and respondents across years.
In this report, BJS conducted tests to determine whether differences in estimated numbers and percentages were statistically significant once sampling error was taken into account. Using statistical programs developed specifically for the NCVS, all comparisons in the text were tested for significance. The primary test procedure used was Student’s t-statistic, which tests the difference between two sample estimates. To ensure that the observed differences between estimates were larger than might be expected due to sampling variation, the significance level was set at the 95% confidence level.
Data users can use the estimates and the standard errors of the estimates provided in this report to generate a confidence interval around the estimate as a measure of the margin of error. The following example illustrates how standard errors can be used to generate confidence intervals:
According to the NCVS, from 2005 to 2010, 10.4% of violent victimization by strangers involved an offender armed with a firearm (see table 9). Using the GVFs, BJS determined that the estimate has a standard error of 0.8% (see appendix table 11). A confidence interval around the estimate was generated by multiplying the standard errors by ±1.96 (the t-score of a normal, two-tailed distribution that excludes 2.5% at either end of the distribution). Thus, the confidence interval around the 10.4% estimate from 2005 to 2010 is 10.4% ± 1.57% (0.8% X 1.96) or (8.83% to 11.97%). In others
words, if different samples using the same procedures were taken from the U.S. population in from 2005 to 2010, 95% of the time the percentage of violent victimization by strangers involving an offender armed with a firearm would fall between 8.83 and 11.97%.
In this report, BJS also calculated a coefficient of variation (CV) for all estimates, representing the ratio of the standard error to the estimate. CVs provide a measure of reliability and a means to compare the precision of estimates across measures with differing levels or metrics. If it was the case that the CV was greater than 50%, or the unweighted sample had 10 or fewer cases, the estimate would have been noted with a “!” symbol (interpret data with caution; estimate is based on 10 or fewer sample cases, or the coefficient of variation exceeds 50%).
Many of the variables examined in this report may be related to one another and to other variables not included in the analyses. Complex relationships among variables were not fully explored in this report and warrant more extensive analysis. Readers are cautioned not to draw causal inferences based on the results presented.
Methodological changes to the NCVS in 2006
Methodological changes implemented in 2006 may have affected the crime estimates for that year to such an extent that they are not comparable to estimates from other years. Evaluation of 2007 and later data from the NCVS conducted by BJS and the Census Bureau found a high degree of confidence that estimates for 2007, 2008, 2009, and 2010 are consistent with and comparable to estimates for 2005 and previous years. The reports, Criminal Victimization, 2006, NCJ 219413, December 2007; Criminal Victimization, 2007, NCJ 224390, December 2008; Criminal Victimization, 2008, NCJ 227777, September 2009; Criminal Victimization, 2009, NCJ 231327, October 2010; and Criminal Victimization, 2010, NCJ 235508, September 2011, are available on the BJS website.
FBI’s Supplementary Homicide Reports (SHR)
The homicide data in this report are from the FBI’s Supplementary Homicide Reports (SHR), which is a part of the Uniform Crime Reporting (UCR) program. Supplemental data about homicide incidents are submitted monthly with details on location, victim, and offender characteristics. These reports include information on the reporting agency and its residential population, county and Metropolitan Statistical Area (MSA) codes, geographic division, and population group; on the age, race, and sex of victims and offenders; and on the victim-offender relationship, weapon use, and circumstance of the crime. From 1980 to 2008, contributing agencies provided supplemental data for 508,568 of the estimated 565,636 homicides.
13VIOLENT VICTIMIZATION COMMITTED BY STRANGERS, 1993-2010 | DECEMBER 2012
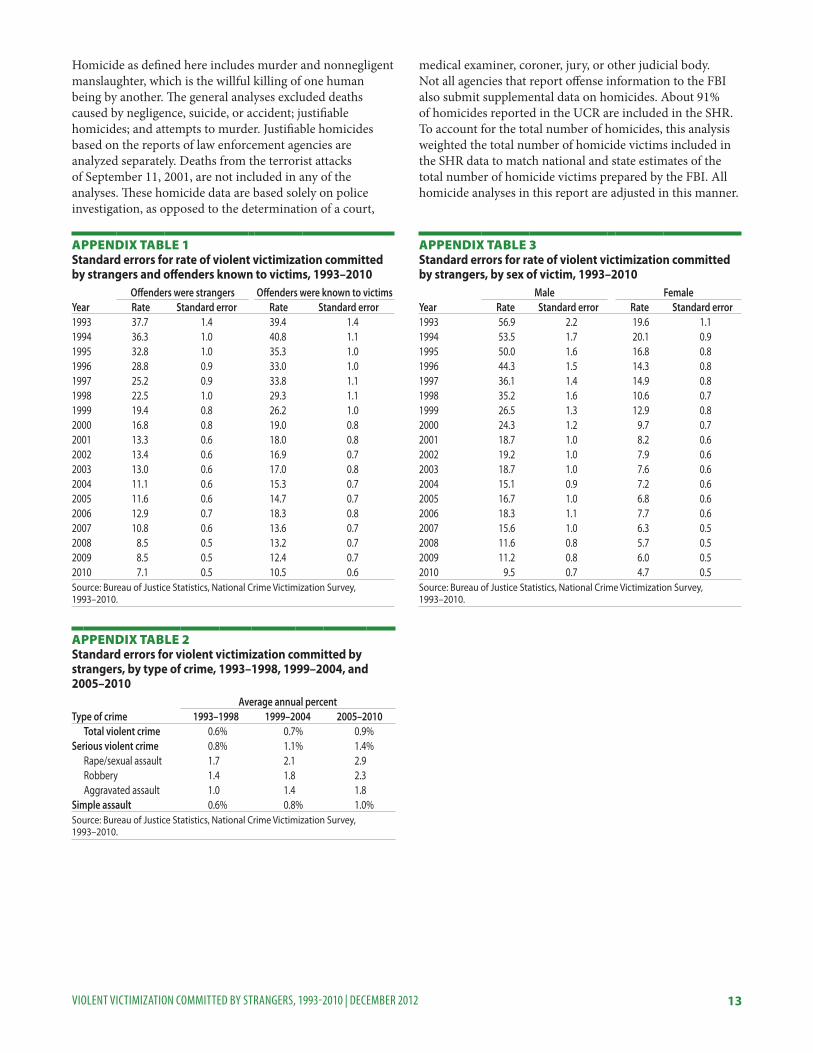
appendix Table 1 Standard errors for rate of violent victimization committed by strangers and offenders known to victims, 1993–2010
Offenders were strangers Offenders were known to victimsYear Rate Standard error Rate Standard error 1993 37.7 1.4 39.4 1.41994 36.3 1.0 40.8 1.11995 32.8 1.0 35.3 1.01996 28.8 0.9 33.0 1.01997 25.2 0.9 33.8 1.11998 22.5 1.0 29.3 1.11999 19.4 0.8 26.2 1.02000 16.8 0.8 19.0 0.82001 13.3 0.6 18.0 0.82002 13.4 0.6 16.9 0.72003 13.0 0.6 17.0 0.82004 11.1 0.6 15.3 0.72005 11.6 0.6 14.7 0.72006 12.9 0.7 18.3 0.82007 10.8 0.6 13.6 0.72008 8.5 0.5 13.2 0.72009 8.5 0.5 12.4 0.72010 7.1 0.5 10.5 0.6Source: Bureau of Justice Statistics, National Crime Victimization Survey, 1993–2010.
appendix Table 2Standard errors for violent victimization committed by strangers, by type of crime, 1993–1998, 1999–2004, and 2005–2010
Type of crimeAverage annual percent
1993–1998 1999–2004 2005–2010Total violent crime 0.6% 0.7% 0.9%
Serious violent crime 0.8% 1.1% 1.4%Rape/sexual assault 1.7 2.1 2.9Robbery 1.4 1.8 2.3Aggravated assault 1.0 1.4 1.8
Simple assault 0.6% 0.8% 1.0%Source: Bureau of Justice Statistics, National Crime Victimization Survey, 1993–2010.
appendix Table 3 Standard errors for rate of violent victimization committed by strangers, by sex of victim, 1993–2010
Male FemaleYear Rate Standard error Rate Standard error1993 56.9 2.2 19.6 1.11994 53.5 1.7 20.1 0.91995 50.0 1.6 16.8 0.81996 44.3 1.5 14.3 0.81997 36.1 1.4 14.9 0.81998 35.2 1.6 10.6 0.71999 26.5 1.3 12.9 0.82000 24.3 1.2 9.7 0.72001 18.7 1.0 8.2 0.62002 19.2 1.0 7.9 0.62003 18.7 1.0 7.6 0.62004 15.1 0.9 7.2 0.62005 16.7 1.0 6.8 0.62006 18.3 1.1 7.7 0.62007 15.6 1.0 6.3 0.52008 11.6 0.8 5.7 0.52009 11.2 0.8 6.0 0.52010 9.5 0.7 4.7 0.5Source: Bureau of Justice Statistics, National Crime Victimization Survey, 1993–2010.
Homicide as defined here includes murder and nonnegligent manslaughter, which is the willful killing of one human being by another. The general analyses excluded deaths caused by negligence, suicide, or accident; justifiable homicides; and attempts to murder. Justifiable homicides based on the reports of law enforcement agencies are analyzed separately. Deaths from the terrorist attacks of September 11, 2001, are not included in any of the analyses. These homicide data are based solely on police investigation, as opposed to the determination of a court,
medical examiner, coroner, jury, or other judicial body. Not all agencies that report offense information to the FBI also submit supplemental data on homicides. About 91% of homicides reported in the UCR are included in the SHR. To account for the total number of homicides, this analysis weighted the total number of homicide victims included in the SHR data to match national and state estimates of the total number of homicide victims prepared by the FBI. All homicide analyses in this report are adjusted in this manner.
14VIOLENT VICTIMIZATION COMMITTED BY STRANGERS, 1993-2010 | DECEMBER 2012
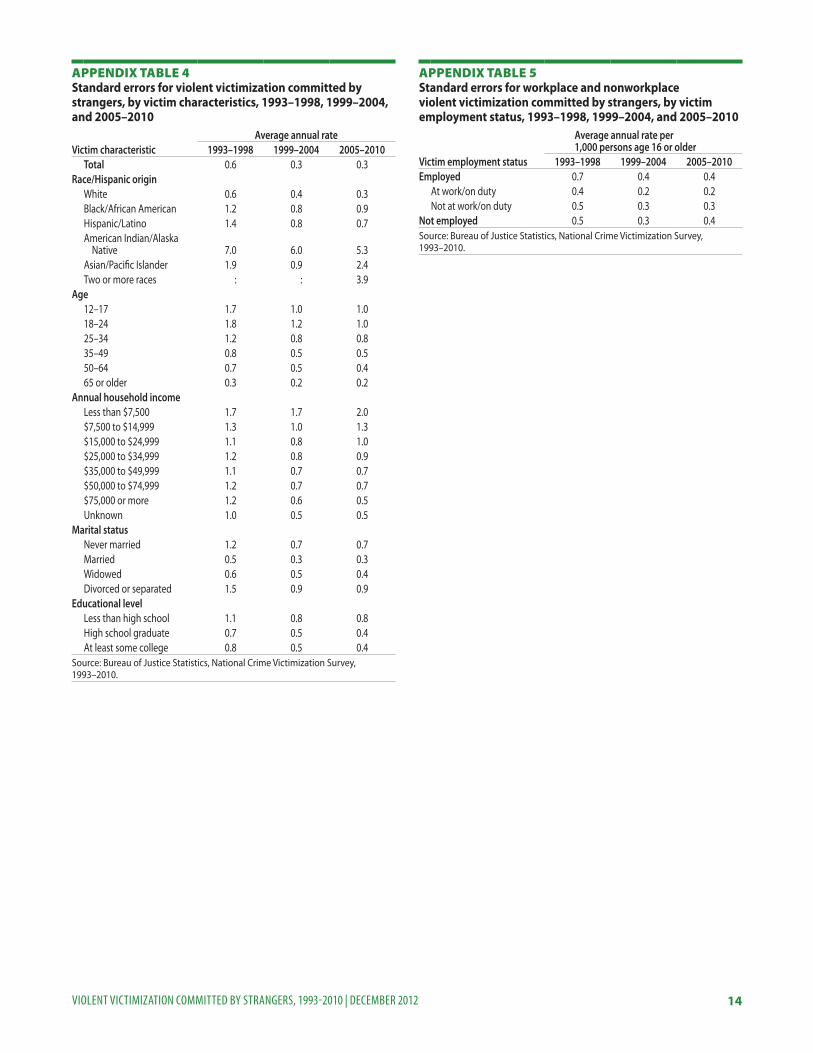
appendix Table 4Standard errors for violent victimization committed by strangers, by victim characteristics, 1993–1998, 1999–2004, and 2005–2010
Victim characteristicAverage annual rate
1993–1998 1999–2004 2005–2010Total 0.6 0.3 0.3
Race/Hispanic originWhite 0.6 0.4 0.3Black/African American 1.2 0.8 0.9Hispanic/Latino 1.4 0.8 0.7American Indian/Alaska Native 7.0 6.0 5.3Asian/Pacific Islander 1.9 0.9 2.4Two or more races : : 3.9
Age 12–17 1.7 1.0 1.018–24 1.8 1.2 1.025–34 1.2 0.8 0.835–49 0.8 0.5 0.550–64 0.7 0.5 0.465 or older 0.3 0.2 0.2
Annual household incomeLess than $7,500 1.7 1.7 2.0$7,500 to $14,999 1.3 1.0 1.3$15,000 to $24,999 1.1 0.8 1.0$25,000 to $34,999 1.2 0.8 0.9$35,000 to $49,999 1.1 0.7 0.7$50,000 to $74,999 1.2 0.7 0.7$75,000 or more 1.2 0.6 0.5Unknown 1.0 0.5 0.5
Marital statusNever married 1.2 0.7 0.7Married 0.5 0.3 0.3Widowed 0.6 0.5 0.4Divorced or separated 1.5 0.9 0.9
Educational levelLess than high school 1.1 0.8 0.8High school graduate 0.7 0.5 0.4At least some college 0.8 0.5 0.4
Source: Bureau of Justice Statistics, National Crime Victimization Survey, 1993–2010.
appendix Table 5Standard errors for workplace and nonworkplace violent victimization committed by strangers, by victim employment status, 1993–1998, 1999–2004, and 2005–2010
Average annual rate per 1,000 persons age 16 or older
Victim employment status 1993–1998 1999–2004 2005–2010Employed 0.7 0.4 0.4
At work/on duty 0.4 0.2 0.2Not at work/on duty 0.5 0.3 0.3
Not employed 0.5 0.3 0.4Source: Bureau of Justice Statistics, National Crime Victimization Survey, 1993–2010.
15VIOLENT VICTIMIZATION COMMITTED BY STRANGERS, 1993-2010 | DECEMBER 2012
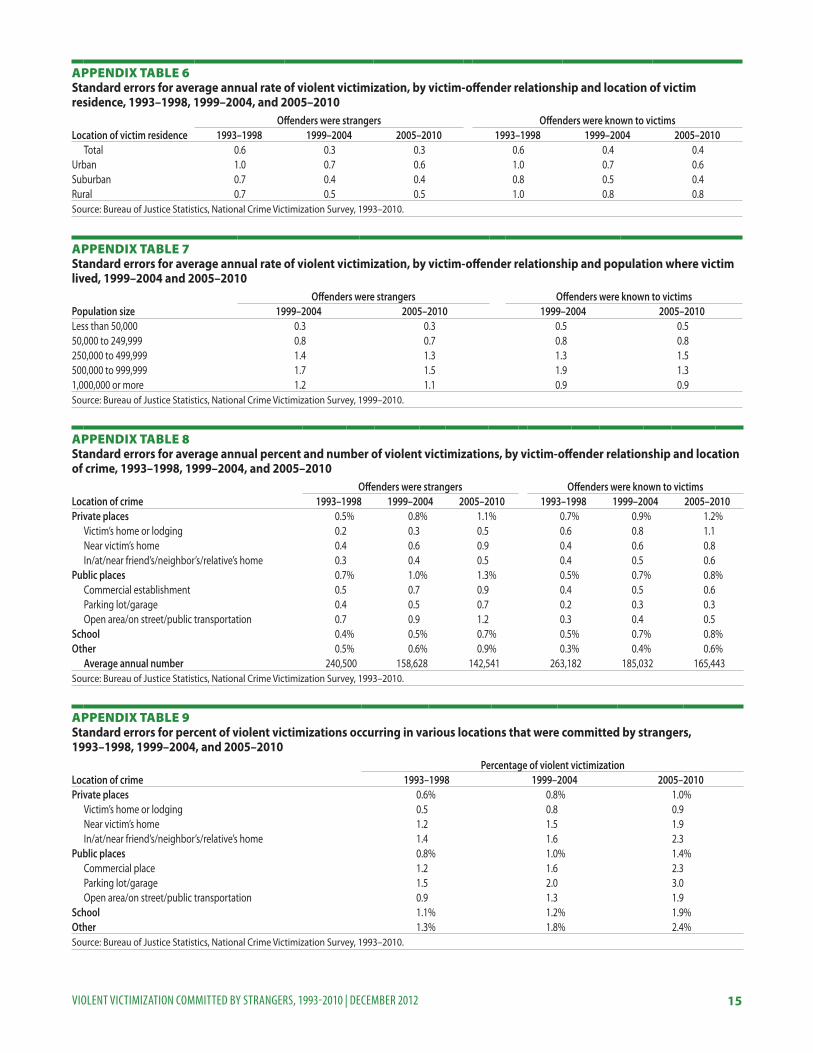
appendix Table 6 Standard errors for average annual rate of violent victimization, by victim-offender relationship and location of victim residence, 1993–1998, 1999–2004, and 2005–2010
Offenders were strangers Offenders were known to victimsLocation of victim residence 1993–1998 1999–2004 2005–2010 1993–1998 1999–2004 2005–2010
Total 0.6 0.3 0.3 0.6 0.4 0.4Urban 1.0 0.7 0.6 1.0 0.7 0.6Suburban 0.7 0.4 0.4 0.8 0.5 0.4Rural 0.7 0.5 0.5 1.0 0.8 0.8Source: Bureau of Justice Statistics, National Crime Victimization Survey, 1993–2010.
appendix Table 7 Standard errors for average annual rate of violent victimization, by victim-offender relationship and population where victim lived, 1999–2004 and 2005–2010
Offenders were strangers Offenders were known to victimsPopulation size 1999–2004 2005–2010 1999–2004 2005–2010Less than 50,000 0.3 0.3 0.5 0.550,000 to 249,999 0.8 0.7 0.8 0.8250,000 to 499,999 1.4 1.3 1.3 1.5500,000 to 999,999 1.7 1.5 1.9 1.31,000,000 or more 1.2 1.1 0.9 0.9Source: Bureau of Justice Statistics, National Crime Victimization Survey, 1999–2010.
appendix Table 8 Standard errors for average annual percent and number of violent victimizations, by victim-offender relationship and location of crime, 1993–1998, 1999–2004, and 2005–2010
Location of crimeOffenders were strangers Offenders were known to victims
1993–1998 1999–2004 2005–2010 1993–1998 1999–2004 2005–2010Private places 0.5% 0.8% 1.1% 0.7% 0.9% 1.2%
Victim’s home or lodging 0.2 0.3 0.5 0.6 0.8 1.1Near victim’s home 0.4 0.6 0.9 0.4 0.6 0.8In/at/near friend’s/neighbor’s/relative’s home 0.3 0.4 0.5 0.4 0.5 0.6
Public places 0.7% 1.0% 1.3% 0.5% 0.7% 0.8%Commercial establishment 0.5 0.7 0.9 0.4 0.5 0.6Parking lot/garage 0.4 0.5 0.7 0.2 0.3 0.3Open area/on street/public transportation 0.7 0.9 1.2 0.3 0.4 0.5
School 0.4% 0.5% 0.7% 0.5% 0.7% 0.8%Other 0.5% 0.6% 0.9% 0.3% 0.4% 0.6%
Average annual number 240,500 158,628 142,541 263,182 185,032 165,443Source: Bureau of Justice Statistics, National Crime Victimization Survey, 1993–2010.
appendix Table 9 Standard errors for percent of violent victimizations occurring in various locations that were committed by strangers, 1993–1998, 1999–2004, and 2005–2010
Percentage of violent victimizationLocation of crime 1993–1998 1999–2004 2005–2010Private places 0.6% 0.8% 1.0%
Victim’s home or lodging 0.5 0.8 0.9Near victim’s home 1.2 1.5 1.9In/at/near friend’s/neighbor’s/relative’s home 1.4 1.6 2.3
Public places 0.8% 1.0% 1.4%Commercial place 1.2 1.6 2.3Parking lot/garage 1.5 2.0 3.0Open area/on street/public transportation 0.9 1.3 1.9
School 1.1% 1.2% 1.9%Other 1.3% 1.8% 2.4%Source: Bureau of Justice Statistics, National Crime Victimization Survey, 1993–2010.

16VIOLENT VICTIMIZATION COMMITTED BY STRANGERS, 1993-2010 | DECEMBER 2012
appendix Table 10Standard errors for average annual percent and number of violent victimizations, by victim-offender relationship and victim activity when crime occurred, 1993–1998, 1999–2004, and 2005–2010
Victim activityOffenders were strangers Offenders were known to victims
1993–1998 1999–2004 2005–2010 1993–1998 1999–2004 2005–2010Working 0.7% 0.9% 1.1% 0.5% 0.6% 0.8%Traveling, shopping, and leisure activities away from home 0.7 1.0 1.3 0.6 0.7 1.0Attending school 0.3 0.4 0.6 0.4 0.6 0.7Sleeping and other activities at home 0.4 0.6 0.9 0.7 0.8 1.2Other 0.3 0.4 0.5 0.3 0.4 0.4Do not know 0.1 0.1 0.1 0.1 0.1 0.2
Average annual number 240,500 158,628 142,541 263,182 185,032 165,443Source: Bureau of Justice Statistics, National Crime Victimization Survey, 1993–2010.
appendix Table 11Standard errors for average annual percent and number of violent victimizations involving a weapon, by victim-offender relationship and type of offender weapon, 1993–1998, 1999–2004, and 2005–2010
Type of offender weapon Offenders were strangers Offenders were known to victims
1993–1998 1999–2004 2005–2010 1993–1998 1999–2004 2005–2010No weapon 0.7% 1.0% 1.3% 0.6% 0.8% 1.0%Weapon 0.7% 0.9% 1.1% 0.5% 0.6% 0.9%
Firearm 0.4 0.5 0.8 0.2 0.3 0.4Knife 0.3 0.4 0.6 0.3 0.4 0.5Other Weapon 0.4 0.5 0.7 0.3 0.4 0.5Unknown 0.4 0.2 0.8 0.1 0.2 0.2
Did not know if offender had weapon 0.4% 0.6% 0.7% 0.3% 0.3% 0.4%Average annual number 240,500 158,628 142,541 263,182 185,032 165,443
Source: Bureau of Justice Statistics, National Crime Victimization Survey, 1993–2010.
appendix Table 12 Standard errors for average annual percent of violent victimizations involving an injury, by victim-offender relationship, 1993–1998, 1999–2004, and 2005–2010
Injury typeOffenders were strangers Offenders were known to victims
1993–1998 1999–2004 2005–2010 1993–1998 1999–2004 2005–2010Not injured 0.6% 0.8% 1.1% 0.7% 0.8% 1.1%Injured 0.5% 0.7% 1.1% 0.6% 0.8% 1.1%
Serious injury 0.2 0.3 0.5 0.2 0.2 0.4Minor injury 0.5 0.7 1.0 0.6 0.7 1.0Rape w/o other injuries 0.1 0.1 0.2 0.2 0.2 0.2Average annual number 240,415 158,380 142,497 262,996 184,747 165,216
Source: Bureau of Justice Statistics, National Crime Victimization Survey, 1993–2010.
appendix Table 13 Standard errors for average annual percent and number of violent victimizations, by victim-offender relationship and number of offenders, 1993–1998, 1999–2004, and 2005–2010
Offenders were strangers Offenders were known to victimsNumber of offenders 1993–1998 1999–2004 2005–2010 1993–1998 1999–2004 2005–2010One 0.7% 0.9% 1.2% 0.5% 0.6% 0.8%Two or more 0.7 0.8 1.2 0.4 0.5 0.7
Average annual number 237,209 156,400 141,973 261,040 184,489 164,961Source: Bureau of Justice Statistics, National Crime Victimization Survey, 1993–2010.
17VIOLENT VICTIMIZATION COMMITTED BY STRANGERS, 1993-2010 | DECEMBER 2012
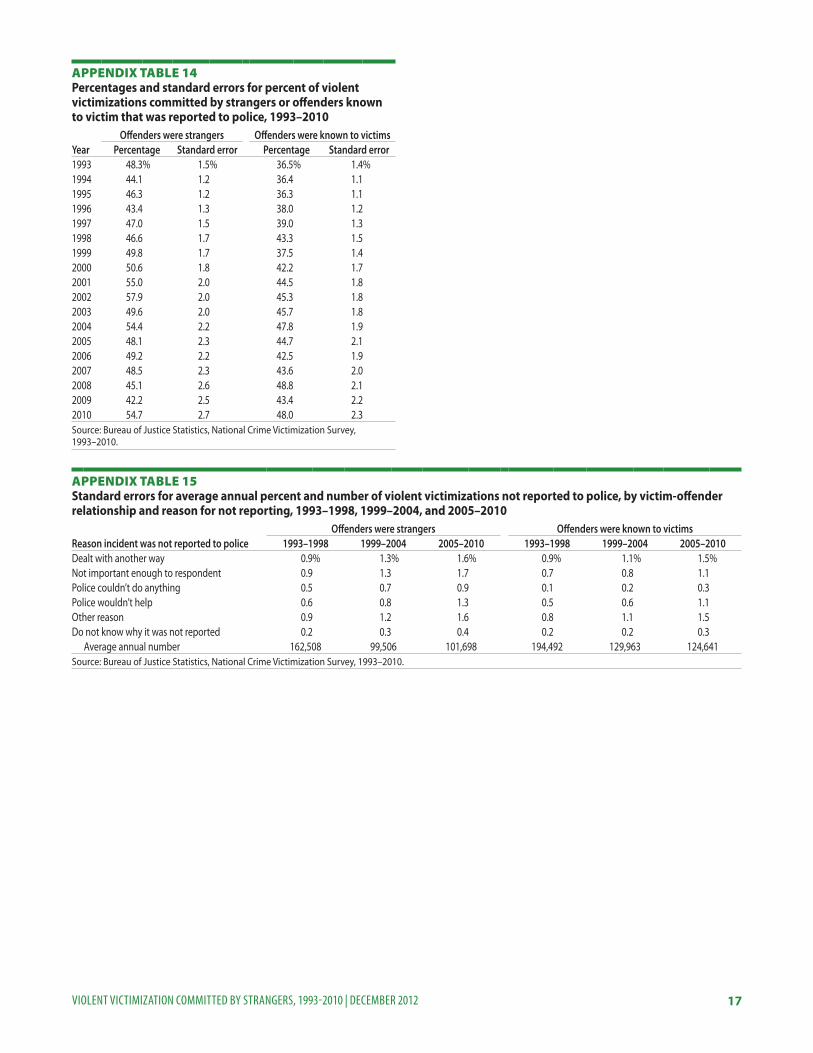
appendix Table 14 Percentages and standard errors for percent of violent victimizations committed by strangers or offenders known to victim that was reported to police, 1993–2010
Offenders were strangers Offenders were known to victimsYear Percentage Standard error Percentage Standard error1993 48.3% 1.5% 36.5% 1.4%1994 44.1 1.2 36.4 1.11995 46.3 1.2 36.3 1.11996 43.4 1.3 38.0 1.21997 47.0 1.5 39.0 1.31998 46.6 1.7 43.3 1.51999 49.8 1.7 37.5 1.42000 50.6 1.8 42.2 1.72001 55.0 2.0 44.5 1.82002 57.9 2.0 45.3 1.82003 49.6 2.0 45.7 1.82004 54.4 2.2 47.8 1.92005 48.1 2.3 44.7 2.12006 49.2 2.2 42.5 1.92007 48.5 2.3 43.6 2.02008 45.1 2.6 48.8 2.12009 42.2 2.5 43.4 2.22010 54.7 2.7 48.0 2.3Source: Bureau of Justice Statistics, National Crime Victimization Survey, 1993–2010.
appendix Table 15 Standard errors for average annual percent and number of violent victimizations not reported to police, by victim-offender relationship and reason for not reporting, 1993–1998, 1999–2004, and 2005–2010
Offenders were strangers Offenders were known to victimsReason incident was not reported to police 1993–1998 1999–2004 2005–2010 1993–1998 1999–2004 2005–2010Dealt with another way 0.9% 1.3% 1.6% 0.9% 1.1% 1.5%Not important enough to respondent 0.9 1.3 1.7 0.7 0.8 1.1Police couldn’t do anything 0.5 0.7 0.9 0.1 0.2 0.3Police wouldn’t help 0.6 0.8 1.3 0.5 0.6 1.1Other reason 0.9 1.2 1.6 0.8 1.1 1.5Do not know why it was not reported 0.2 0.3 0.4 0.2 0.2 0.3
Average annual number 162,508 99,506 101,698 194,492 129,963 124,641Source: Bureau of Justice Statistics, National Crime Victimization Survey, 1993–2010.

18VIOLENT VICTIMIZATION COMMITTED BY STRANGERS, 1993-2010 | DECEMBER 2012
appendix Table 16Percents for victim/offender relationship in homicides, 1993–2008
Total Offenders known Unknown relationships Strangers1993 100% 45.8% 39.7% 14.5%1994 100% 46.3 40.1 13.61995 100% 44.4 40.0 15.71996 100% 47.2 38.1 14.71997 100% 45.9 40.3 13.81998 100% 47.5 38.7 13.81999 100% 46.7 40.9 12.42000 100% 43.2 43.0 13.82001 100% 40.8 45.5 13.72002 100% 41.6 43.8 14.62003 100% 41.5 45.6 13.02004 100% 41.3 45.2 13.52005 100% 39.2 46.3 14.52006 100% 40.8 46.0 13.22007 100% 39.3 47.2 13.52008 100% 41.7 45.4 12.8Source: Federal Bureau of Investigation, Supplementary Homicides Reports, Uniform Crime Reports, 1993–2008.

Office of Justice ProgramsInnovation • Partnerships • Safer Neighborhoods
www.ojp.usdoj.gov
NCJ239424
The Bureau of Justice Statistics is the statistical agency of the U.S. Department of Justice. James P. Lynch is the director.
This report was written by Erika Harrell. Lynn Langton verified the report.
Catherine Bird and Jill Thomas edited the report, and Barbara Quinn produced the report under the supervision of Doris J. James.
December 2012, NCJ 239424