viral marketing: a study of drivers of viral marketing and ... · pratima nishant dabholkar . 6 | p...
TRANSCRIPT
1 | P a g e
Viral Marketing: A Study of drivers of Viral Marketing and factors that influence the receipt and forwarding of viral messages
Dissertation Submitted to the
Padmashree Dr. D.Y. Patil University, Navi Mumbai,
Department of Business Management
in partial fulfillment of the requirements for the award of the Degree of
Master in Philosophy (M.Phil) in (Business Management)
Submitted by:
PRATIMA NISHANT DABHOLKAR Roll No.: DYP-M.Phil-09008
Research Guide:
Dr. PRADIP MANJREKAR
Professor in Management,
Padmashree Dr. D.Y. Patil University
Department of Business Management
Sector 4, Plot No-10, CBD Belapur, Navi Mumbai- 400 614
July, 2011

2 | P a g e
DECLARATION
I hereby declare that the Study titled “Viral Marketing: A Study of drivers of
Viral Marketing and factors that influence the receipt and forwarding of
viral messages” submitted for the M.Phil. Degree at Padmashree Dr. D.Y.
Patil University, Navi Mumbai, Department of Business Management is my
original work and the dissertation has not formed the basis for the award of
any degree, associateship, fellowship or any other similar titles.
Place: Navi Mumbai
Date: July, 2011
Signature of the Student
Pratima Nishant Dabholkar

3 | P a g e
CERTIFICATE
This is to certify that the dissertation titled ―Viral Marketing: A Study of drivers
of Viral Marketing and factors that influence the receipt and forwarding of
viral messages‖ is the bona-fide research work carried out by Pratima Nishant
Dabholkar, student of M.Phil., at Padmashree Dr. D.Y. Patil University, Navi
Mumbai, Department of Business Management, in partial fulfillment of the
requirements for the award of the Degree of M. Phil. and that the dissertation has
not formed the basis for the award previously of any degree, diploma,
associateship, fellowship or any other similar title.
Place: Navi Mumbai
Date: July, 2011
Signature Signature of the Guide Prof.Dr. R. Gopal Prof. Dr. Pradip Manjrekar Director Dean & Head of the Department
4 | P a g e
ACKNOWLEDGEMENTS
I am grateful to Padmashree Dr. D.Y. Patil University, Navi Mumbai, Department of Business
Management for giving me an opportunity to pursue M.Phil. I wish to thank Professor Dr. R.
Gopal, Director, Dean & Head of the Department, Padmashree Dr. D.Y. Patil University, Navi
Mumbai, Department of Business Management who has been a perpetual source of inspiration
and offered valuable suggestions to improve my M.Phil work.
I am beholden to my Research Guide Dr. Pradip Manjrekar, Professor, Padmashree Dr. D.Y. Patil
University, Navi Mumbai, Department of Business Management for abundant guidance, support,
and encouragement throughout my M. Phil Work. I sincerely thank Dr. Pradip Manjrekar for given
me his valuable guidance for the project. Without his guidance, it would have never been possible
for me to complete this project.
I would also like to thank people from different organizations and the students, who have helped
me and participated in collection of data for this project, without which this project could have
never been completed. I wish to express my gratitude to my colleagues for providing me valuable
information and help during my research work.
I would be failing in my duty if I do not acknowledge, with a deep sense of gratitude, the sacrifices
made by my husband Nishant and daughters Shweta and Nikita for allowing and supporting me
to spend my free time on this project work and thus have helped me in completing the project
work successfully.
Place: Navi Mumbai Date: July, 2011
Signature of the student
Pratima Nishant Dabholkar

5 | P a g e
PREFACE
Viral marketing is a powerful marketing tool with untapped potential. Viral
Marketing Communication can bring about benefits to marketers with its
advantages such as low cost, high reach, high credibility, accountability, fast
speed, ease of usage and ability to reach a global audience.
With the increased usage of broadband and internet services like YouTube,
Hotmail and Facebook, there will be an increasing trend for Viral Marketing to be
adopted by companies as part of their promotional mix in the future, thus fuelling
my interest in this topic.
For the success of the viral marketing strategy, viral marketing techniques
applied from diverse platforms needs to be studied. In this study main focus is on
viral marketing via email. This study aims to understand the drivers of viral
marketing and investigates various attributes which influence user to receive and
forward messages.
Limited research has been done on viral marketing and response to such
marketing techniques.
Signature of the Student
Pratima Nishant Dabholkar

6 | P a g e
Executive Summary
Viral marketing, viral advertising, or marketing buzz are buzzwords referring
to marketing techniques that use pre-existing social networks to produce
increases in brand awareness or to achieve other marketing objectives (such as
product sales) through self-replicating viral processes, analogous to the spread
of viruses or computer viruses. It can be delivered by word of mouth or enhanced
by the network effects of the Internet. Viral marketing may take the form of video
clips, interactive Flash games, advergames, ebooks, brandable software,
images, or text messages.
The goal of marketers interested in creating successful viral marketing programs
is to create viral messages that appeal to individuals with high social networking
potential (SNP) and that have a high probability of being presented and spread
by these individuals and their competitors in their communications with others in
a short period of time.
The term "viral marketing" has also been used pejoratively to refer to stealth
marketing campaigns—the unscrupulous use of astroturfing online combined
with undermarket advertising in shopping centers to create the impression of
spontaneous word of mouth enthusiasm (Ref. Wikipedia)
One of the most alluring facets of social media marketing is the potential for sales
and branding messages to ―turn viral,‖ meaning that people start passing them

7 | P a g e
on to friends just because they find it amusing, entertaining, or valuable. But in
order for this to happen, you need to really have an idea of what people in your
market segments are interested in. You also have to have some good ideas
about how to get them to pass your message along. This study aimed to study
drivers of viral marketing and factors which influence user to receive and forward
viral messages.
A lot of research work is done in the field of viral marketing. Key drivers of Viral
Marketing is awareness(Arnaud De Bruyn, Gary L. Lilien, 2008), interest((Arnaud
De Bruyn, Gary L. Lilien, 2008), Access to use this marketing techniques and
experience which decides their final decision((Arnaud De Bruyn, Gary L. Lilien,
2008). The consumer has now taken an observable action, a purchase of a good
or service or the sustained adoption of an innovation. One factor added to this
chain of drivers of viral marketing is access to see whether regular access to
internet has any significant impact on user to get experience of viral marketing.
Due to advancements in computer technology and internet people all over the
world can now interact and communicate with virtually anyone else who has
access to a computer and the internet (Abed Abedniya, 2010).
Drivers of viral marketing give user understanding about viral marketing
phenomena and built their interest in getting information about product or brand
through their social network via internet. This curiosity about getting information
leads them to receive viral messages. User likes to receive message if it is from

8 | P a g e
a trusted source, message is having relevance and user is getting perceived
benefits. These three factors are influencing user to receive messages. One
messages are received it is likely to be forwarded
From the existing research it has been observed that tie strength, sender‘s
benefit, customer satisfaction and altruism are the factors which influence user to
forward viral messages. Tie strength was measured in terms of how often user
saw the contact person over the network. Senders benefit is related to benefit
user will receive in terms of incentives, bonus, free services, and prizes etc.
Customer satisfaction in terms of product or service user used and satisfied.
Ease in forwarding messages in his/her network and having good opinion about
the product. Altruism is the term relates to the users kindness or is the
renunciation of the self, and an exclusive concern for the welfare of others.
These factors are revealed through the prior literature which influence user to
receive and forward viral messages.
It has been found from the earlier research that factors to receive as well as
forward viral messages are not studied together in Indian context. This is one of
the research gap found through literature review. Most of the study is done where
data collected from the college students. Opinion of the working professional is
not taken into consideration. Working professionals are required to study as they
are having purchasing power. There has been little research into finding out the
drivers of viral marketing.

9 | P a g e
Motivation stems primarily in this study because viral marketing is a powerful
marketing tool with untapped potential. Viral Marketing Communication can bring
about benefits to marketers with its advantages such as low cost, high reach,
high credibility, accountability, fast speed, ease of usage and ability to reach a
global audience.
Therefore, our objective for this research is see the influence of factors which are
identified through literature review as well influence of demographic factors to
receive and forward viral messages. Objective for the research are as follows:
1. To understand viral marketing through social network.
2. To identify drivers for viral marketing.
3. To reveal and validate factors which influence user to receive and forward
messages.
4. To understand the impact of demographic factors of user on receiving and
forwarding messages.
Drivers of viral marketing are needed to validate and for that it has hypothesized
that access, awareness and interest have significant impact on the experience of
viral marketing.
Factors which are revealed are needed to validate and for that it has
hypothesized that trusted source, relevance and perceived benefit have
significant impact on user to receive viral messages. To see the impact of

10 | P a g e
demographic factors which are gender and occupation is it also hypothesized
that trusted source, relevance and perceived benefit have significant impact on
user to receive viral messages with respect to gender an occupation. Similarly for
the factors tie strength, sender‘s benefit, customer satisfaction and altruism it has
hypothesized that tie strength, sender‘s benefit, customer satisfaction and
altruism have significant impact on user to forward viral messages. To see the
impact of demographic factors which are gender and occupation is it also
hypothesized that tie strength, sender‘s benefit, customer satisfaction and
altruism have significant impact on user to forward viral messages with respect to
gender an occupation.
Data is collected from the students of the various colleges of various streams like
degree colleges, management colleges and engineering colleges including
undergraduate, graduate and post graduate students. Working professional from
IT sector and non-IT sector included in this study. Data collected from Mumbai
region only.
For data analysis SPSS-12 statistical package is used. Various statistical tests
like descriptive statistics, regression, correlation and independent sample t-test is
performed to validate the hypotheses. After statistical analysis it has been found
that access does not have any significant impact on the experience of viral
marketing. For user access in not a contributing factor whereas awareness and
interest having significant impact on the experience of viral marketing. This

11 | P a g e
shows that whether user get continuous access to internet or not it does not
make any difference but the awareness of viral marketing and interest in getting
information of the products or services over internet makes the significant impact
on experience of viral marketing.
To receive viral messages trusted source, source from where user get
information, relevance i.e. messages of his interest or messages containing
information he is looking for and the perceived benefits have significant impact
on user to receive viral messages. Demographic factor occupation is also
contributes to the message relevance to receive messages but gender does not
contribute any role to receive viral messages.
To forward viral messages tie strength, senders‘ benefits has significant impact
on user to forward viral messages. Customer satisfaction and altruism does not
have significant impact on user to forward viral messages. Demographic factor
occupation is also contributes to the tie strength to forward messages but gender
does not contribute any role to forward viral messages. Customer satisfaction
and altruism is not proven significant may for the user satisfaction form product
or service is not important to forward viral messages. While forwarding messages
user considered only tie strength and senders benefit. User normally forward
messages to his close acquaintances and to get benefit like incentives, prizes,
discount or free services after forwarding messages.

12 | P a g e
To find out the correlation between the drivers of viral marketing which are
access, awareness, interest and experience a Pearson product-moment
correlation was run across the variables to determine the relationship between
the sequences of drivers of viral marketing. It is observed that there is a strong
and positive correlation between access and interest which was statistically
significant (r = 0.252, n = 491, value of P = 0.000 where P < .0005). Whereas
there is negative correlation between access and awareness which was
statistically not significant (r = -0.065, n = 491, value of P = 0.153 where P >
.0005). It is also proved that there is negative relationship between awareness
and access and awareness and interest which was statistically not significant ((r
= -0.065, n = 491, value of P = 0.153, where P < .0005), (r = -0.051, n = 491,
value of P = 0.262 where P > .0005). There is negative correlation between
interest and awareness which was statistically not significant (r = -0.051, n = 491,
value of P = 0.262 where P > .0005) but there is strong and positive correlation
between interest and access which was statistically significant (r = 0.252, n =
491, value of P = 0.000 where P < .0005).
To find out the association between the intention to receive viral messages and
influencing factors which are trusted source, relevance, perceived benefits a
Pearson correlation test is carried out. It is observed that there is strong and
positive correlation between these variables with the intention to receive viral
messages. Similarly To find out the association between the intention to forward
viral messages and influencing factors which are tie strength, sender‘s benefit,
13 | P a g e
customer satisfaction, and altruism a Pearson correlation test is carried out. It is
observed that there is strong and positive correlation between these variables
with the intention to forward viral messages.
Only platform of viral marketing considered in the research study is email. Other
platform of viral marketing like company website, online review, blogs, social
network, online communities, newsgroups, chat rooms, hate sites, needs to be
considered and compare different levels of impact on these eWOM forms on
consumer behavior.
This study may not have identified all the factors which influence user to receive
and forward messages. Therefore, another limitations lies in the limited number
of variables examined in relation to receive and forward messages.

14 | P a g e
CONTENTS
Chapter
No. Title Page Number
From To
Chapter-0 Executive summary
Chapter-1 Introduction
Chapter-2 Literature Review
Chapter-3 Purpose of the Study
Chapter-4 Objectives of the Study
Chapter-5 Hypothesis
Chapter-6 Research Methodology
Chapter-7 Data Analysis and Hypothesis Testing
Chapter-8 Limitations and Future Scope of the Study
Appendices
Appendix-1 Bibliography
Appendix-2 Questionnaire

15 | P a g e
List of Tables and Annexure
Table/
Annexure Title Page Number
Tables From To
Table-1 Demographic Analysis of Sample
Table-2 Table of Responses
Table-3 Major Constructs and sub variables of the
Study
Table-4
Table-5 Frequency Table
Table-6 Summary of Hypotheses
Table-7 Summary of Objectives and outcomes
Annexure
Annexure-1 Reliability Statistics
Annexure-2 KMO and Bartlett‘s Test
Annexure-3 Item-total Statistics
Annexure-4 Descriptive statistics - Sequence of Drivers
of Viral Marketing
Annexure-5 Descriptive statistics – factors influence user
to receive viral messages
Annexure-6 Descriptive statistics - factors influence user
to forward viral messages
Annexure-7 Correlation between Access and Experience

16 | P a g e
List of Tables and Annexure
Table/
Annexure Title Page Number
From To
Annexure-10 Correlation between sequence of drivers of
viral marketing
Annexure-11 Regression – factors influence user to
receive viral messages
Annexure-12 Group statistics between trust and gender
Annexure-13 Independent sample test between trust and
gender
Annexure-14 Group statistics between trust and
occupation
Annexure-15 Independent sample test between trust and
occupation
Annexure-16 Group statistics between relevance and
gender
Annexure-17 Independent sample test between relevance
and gender
Annexure-18 Group statistics between relevance and
occupation
Annexure-19 Independent sample test between relevance
and occupation
Annexure-20 Group statistics between perceived benefits
and gender
Annexure-21 Independent sample test between perceived
benefits and gender
Annexure-22 Group statistics between perceived benefits
and occupation

17 | P a g e
List of Tables and Annexure
Table/
Annexure Title Page Number
From To
Annexure-23 Independent sample test between perceived
benefits and occupation
Annexure-24 Regression – factors influence user to
forward viral messages
Annexure-25 Group statistics between tie strength and
gender
Annexure-26 Independent sample test between tie
strength and gender
Annexure-27 Group statistics between tie strength and
occupation
Annexure-28 Independent sample test between tie
strength and occupation
Annexure-29 Group statistics between sender‘s benefit
and gender
Annexure-30 Independent sample test between sender‘s
benefit and gender
Annexure-31 Group statistics between sender‘s benefit
and occupation
Annexure-32 Independent sample test between sender‘s
benefit and occupation
Annexure-33 Group statistics between customer
satisfaction and gender
Annexure-34 Independent sample test between customer
satisfaction and gender

18 | P a g e
List of Tables and Annexure
Table/
Annexure Title Page Number
From To
Annexure-35 Group statistics between customer
satisfaction and occupation
Annexure-36 Independent sample test between customer
satisfaction and occupation
Annexure-37 Group statistics between altruism and gender
Annexure-38 Independent sample test between altruism
and gender
Annexure-39 Group statistics between altruism and
occupation
Annexure-40 Independent sample test between altruism
and occupation
Annexure-41 Correlation between intention to receive
messages and influencing factors
Annexure-42 Correlation between intention to forward
messages and influencing factors

19 | P a g e
List of Abbreviations
CMC Computer Mediated Communication
ERM Electronic Referral Marketing
eWOM Electronic Word-of-mouth
VM Viral Marketing
VMC Viral Marketing Communication
WOM Word-of-mouth

20 | P a g e
Chapter-1
Introduction
This research project attempts to understand viral marketing strategy adopted by
the marketer and find out drivers of viral marketing. There is evolution of new
marketing tactic which is called viral marketing. Why this new marketing tactic
has been evolved? The reason behind is that there are dynamics or transitions in
marketing. This transition is because changes in marketing techniques and these
changes of marketing techniques are because customer is changing. Why
customer is changing? Because of the advancement of communication
technology and internet technology made his life very simple. Information of the
product is available on internet. Today‘s customer is well informed. Before going
for purchase he likes to know about the product. This knowledge he may get it
from the internet or through his social network. There is lot of ease also in
purchasing product. At any time, from anywhere he can purchased product
online.
As information technology has occupied most of the life of human being. At
workplace, at home he is using this technology for his day to day activity. At
office he is using computer for his official work. At home he is using it for
educational purpose, for entertainment, or for his personal use. Today‘s
customer is spending most of the time on virtual world rather than in real world.
Marketer has to find out a technique to reach to the customer in his virtual world.
This reach is possible with the advancement in communication technology there
21 | P a g e
is evolution of new electronic word of mouth (eWOM) which is called as a viral
marketing.
Viral marketing is a techniques where individual is encouraged to spread
marketing message over internet. It is called as a viral marketing because it
spreads like a virus. Message about the product and its brands or services is
send to a potential buyer over internet. This potential buyer sends this
information to another potential buyer in a way a large network is created swiftly.
What does a virus have to do with marketing? Viral marketing describes any
strategy that encourages individuals to pass on a marketing message to
others, creating the potential for exponential growth in the message's
exposure and influence. Like viruses, such strategies take advantage of rapid
multiplication to explode the message to thousands, to millions (Dr. Ralph F.
Wilson, 2005).
Viral Marketing comprises of diverse platforms and can spread in many forms,
including e-mails, blogs, chat rooms, adver-games, user forums, company
websites, social networks, and viral videos. Through all these platform marketing
messages are send to the user either by the marketer or by the user or potential
buyer to another user. The eWOM is a electronic communication, specifically
using the e-mail medium, emphasizes the direct person-to-person transmission
of the messages.

22 | P a g e
This study mainly comprises of understanding how viral marketing platform such
as email works. It also tries to understand user perception and drives of viral
marketing. As there are various platforms for viral marketing available.
Transmission of marketing messages has been done through email. It has been
decided to focus on this platform. There is a need to investigate the various
factors influencing user to receive and forward message. Further it is noted that
no research on viral marketing in the Indian context is known to exist.
This study attempts to explore various attributes which forms the user‘s
perception about viral marketing and also tries to find out drivers of viral
marketing. Marketing messages are transmitted to user with the help of email.
For the successful of viral marketing strategy user needs to accept message as
well as it is equally important that these messages needs to be forward.
Therefore attempt is made to find of various attributes which influence user to
receive marketing messages and also there is need to find of the attributes which
influence user to forward theses messages.
Motivation stems for viral marketing study primarily from the opinion that viral
marketing is a powerful marketing tool with untapped potential. Viral Marketing
Communication (VMC) can bring about benefits to marketers with its advantages
such as low cost, high reach, high credibility, accountability, fast speed, ease of
usage and ability to reach a global audience. With the increased usage of
broadband and internet services like YouTube, Hotmail and Facebook, there will
23 | P a g e
be an increasing trend for Viral Marketing tactic to be adopted by companies as
part of their promotional mix in the future, thus fuelling interest in this topic. This
study will help marketer to understand the user perception and which factors
needs to address while sending messages so that these messages will get
propagated or forwarded.
Viral marketing and viral advertising refer to marketing techniques that use pre-
existing social networks to increases brand and product awareness. Viral
marketing is analogous to the spread of pathological and computer viruses. It can
be word-of-mouth delivered or enhanced by the network effects of the internet.
Viral marketing is a marketing phenomenon that encourages people to pass
along a marketing message voluntarily (Steve Anderson, 2008).
Purpose of this study is to understand viral marketing concept and how it is
successfully implemented by the marketers‘ right from its inception. Finding out
the drivers of viral marketing and factors which influence user to receive and
forward messages. Success of the viral marketing is largely dependent on the
acceptance and adoption of the viral marketing strategy by the user which is
adopted by the marketer.

24 | P a g e
Chapter-2
Literature Review
What is Viral Marketing1?
Viral marketing is a mix of marketing techniques that use pre-existing social
networks to increases brand awareness or to achieve other marketing objectives
of a business. Viral marketing helps to increase product sales with help of
various processes and modules that resemble viruses.
Video clips, interactive Flash games, advergames, ebooks, brandable software,
images, or even text messages are some of the forms of viral marketing services
to add to the promotion of a website/business. Sometimes, word-of-mouth
communication and network effects of the Internet also work as a tool of viral
marketing.
Viral Marketing is any marketing technique that encourages web site, Internet,
email or wireless users to pass on a message to other sites or users, creating a
potentially exponential growth in the message's visibility and effect. Viral
Marketing is extremely attractive to businesses because it can deliver astounding
results in a relatively short period of time. Advertising and marketing budgets no
1 Viral Internet Marketing, Available at http://www.viralbuzz.com/viral_marketing.html, Accessed
01st January, 2011.

25 | P a g e
longer stretch as far as they used to, and the iperceived savings by using viral
web promotion techniques are too attractive to ignore.
Viral Marketing methods include email marketing, "refer-a-friend", "pass-it-on",
"send-an-article", ecards, ebook distribution, video email, and many more.
Internet experts at ViralBuzz can implement web promotion strategy to virtually
any web site or promotional campaign.
A well known example of of successful viral email marketing is Hotmail, a
company, now owned by Microsoft that promotes its email service and its own
advertisers' messages at the end of every Hotmail user's e-mail notes.
Justin Kirby and Paul Mardsen, September 9, 2005, in his book titled ―Connected
Marketing, the viral, buzz and Word of mouth revolution.‖ explains that people no
longer use the internet only for practical purposes such as research and
shopping. New technologies and and the increase of the bandwidth have made
that people want more and more to be entertained on the web. Besides of that,
people have learned to tune out a lot of marketing communications. These two
points have participated to a big part of the explosion of viral marketing. This type
of marketing focuses on personal experience of the brand and taps into the
power of consumers and their connections to other consumers. It can both
improve brand advocacy and increase brand awareness, but also help generate
26 | P a g e
sales. Contrary to what wrong ideas let think : it is possible to track such
campaigns and viral marketing is also needed by innovative products.
Why go viral?
As the name suggests, Viral marketing works on the principal of a virus and
speedily spreads it influence just within a short period of time. Viral marketing
helps a website to swiftly reach throughout the world with multiplied networking
chain. And once a business maintains the speed and reaches to the target with a
brisk pace, it surely gains lots of advantages over other business.
One example of Viral Marketing is encouraging current and potential customers
to tell others about the company's products and services, and in turn encouraging
those others to tell even more others.
Types of Viral Marketing2
There are different ways to apply viral marketing strategy.
Pass-Along a message
Pass-along is a message which encourages the user to forward it to others. The
crudest form of this is chain letters where a message at the bottom of the e-mail
prompts the reader to forward it to his contacts by highlighting suitable
rewards/punishments for acting upon/inaction.
Incentivized Viral Marketing
2. What is Viral Marketing, Available at: http://www.squidoo.com/what-is-viral-marketing.
Accessed 1st December, 2010.

27 | P a g e
In this a reward or incentive is offered for either passing a message along or
providing someone else's address. This can dramatically increase referrals.
However, this can be effective only when the offer requires another person to
take action.
Undercover Marketing
A viral message is presented as a cool or unusual page, activity, or piece of
news, without obvious incitement to pass along. In this form of viral marketing, it
is not immediately apparent that anything is being marketed.
Edgy Gossip/Buzz Marketing
In which Buzz about the product or services is created. This makes use of
advertisements or messages that create controversy by challenging the readers‘
taste or appropriateness of usage. Discussion of the resulting controversy can
generate enormous buzz and consequent WOM publicity. For instance prior to
the release of a blockbuster, some Hollywood movie stars get married, get
divorced, or get arrested, or become involved in some controversy that directs
conversational attention towards them and the movie.
PepsiCo former CMO and eBay COO Brian Swette says, ―‖Buzzmarketing works.
It‘s not just a nice-to-have, it‘s a must-have!‖ Steve Forbes, Forbes Magazine‘s
Editor-in-Chief calls it, ―…a business book that‘s both entertaining and useful for
big brands and start-ups alike.‖

28 | P a g e
User-Managed Database
Here users themselves create and manage their list of contacts using a database
provided by an online service provider by sending add-a-friend request. By
inviting other members to their community, users create a viral, self-propagating
chain of contacts that naturally grows and encourages others to sign up as well.
A major benefit of viral marketing is that it is very powerful advertising tool and
reaches a large number of people in a short amount of time.
Viral Marketing in India
Like everywhere, people in India pass on and share interesting and entertaining
content online. Viral marketing is popular in India for its ease of execution of
marketing campaign and relative low-cost. It ensures good targeting, and the
high and rapid response rate. Thus, for its speed and effective penetration ability,
viral marketing leaves you with no choice but to go for it. Viral Marketing helps a
business to get a large number of interested people at a low cost. Hotmail's offer
was a free email account. It was special for receiver to get this message. If you
do not add value to receiver, your message will be not speeded from first entry
itself. In India, Monster India or Naukri (a job site) made their presence through
viral marketing only. Latter on they used Television or print advertising3.
3 Viral Marketing : Recommend it, available at http://www.buzzle.com/editorials/3-19-2004-51871.asp
Accessed 20th March, 2011.

29 | P a g e
How to Merge Viral Marketing with Email4?
Viral marketing is a promotion phenomenon that encourages people to pass
along a marketing message voluntarily. The dynamic viral message may arrive in
the form of amusing video clips, interactive Flash games, adver-games, images
or even text messages. The successful viral marketer aims to identify individuals
with high Social Networking potential and create viral messages that appeal to
this audience and have a positive probability of being passed along to friends.
―Viral marketing is one of the most powerful forms of online marketing today, due
to the potential it has to spread your brand‘s message like wild fire across the
Internet,‖ says Grant Fleming, COO of Fontera, leading South African mobile
software development company, that has designed a number of Facebook
applications. ―Viral marketing is an influential tool and if well implemented it can
propel a brand from insignificance to global fame.‖
Some of the examples of Viral Marketing in last decades5:
A look back at the history of online marketing efforts must include Hotmail. In
1996, Hotmail was a particularly unique email service in that it was free, could be
accessed anywhere, and would allow the user to have multiple accounts. One of
the interesting things Hotmail did was it would attach the message "Get your free
4How to merge Viral marketing with email, available at
http://www.ehow.com/how_2132947_merge-viral-marketing-email.html, Accessed 2nd
January, 2011.
5 47 Outrageous Viral Marketing Examples over the Last Decade, available at
http://www.ignitesocialmedia.com/viral-marketing-examples/ , Accessed 2nd
January, 2011

30 | P a g e
email at Hotmail" at the bottom of every email sent by a Hotmail user. Once the
receiving user clicked on the word "Hotmail" they were taken to Hotmail's
homepage where the free email service was further explained. The plan, original
at the time, worked. By 1998, Hotmail had accumulated 12 million subscribers.
Hotmail eventually sold to Microsoft for a cool $400 million.
1999
The Blair Witch Project was released on July 14, 1999. The film cost a about
$350,000 to produce and went on to gross nearly $250 million worldwide, giving
it the highest profit-to-cost ratio of any film in history. The incredible success of
the film could be attributed to its unique website that effectively blurred the lines
between fact and fiction. The website, that still exists today, spoke convincingly
of the mythology behind the Blair Witch, contained a realistic photo of the three
filmmakers/stars with a caption that the photo was taken "less than a week
before their disappearance," along with a sideshow of other rather generic, yet
real photos that made many believe that this site was actually authentic. The
gimmick worked!
2000
John West Salmon ―Bear Fight‖ advertisement, this was one of a series of ads by
John West Salmon that appeared on the Internet in late 2000. Since their
groundbreaking debut, the "Bear Fight" videos have gone on to attract an
astonishing 300 million Internet views according to the BBC, and it is not difficult
to see why. It's hand-held, low budget, realistic feel would become synonymous
with the term "viral" for years to come.

31 | P a g e
2001
BMW launched a series of eight high-cost, high-production short films released
on BMW's website. The films were produced and directed by such acclaimed
filmmakers as David Fincher and Guy Richie and starred actors such as Don
Cheadle, Clive Owen, and even Madonna. Within the first four months of release,
the films attracted over 11 million views and sent BMW sells up 12% in 2001
alone. The success of the BMW series has prompted many other car
manufacturers such as Nissan to adopt a similar internet-based strategy.
2002
Microsoft Xbox - Champagne
Microsoft promoted the XBox launch in Europe with a viral campaign,
―Champagne‖, in the lead up to the console‘s release in March 2002. The
campaign introduced potential gamers to the philosophy of XBox gaming, ―Life is
short. Play More‖.
XBox's shocking and provocative 2002 ad raised eyebrows across Europe when
it appeared on the web. The ad has been described as "graphic," "disturbing,"
and even "morbid" by some; "interesting" and "innovative" by others. Whatever
the proper description, Microsoft continues to generate buzz around the world for
this pithy advertisement.

32 | P a g e
20036
Deloitte Consulting, a US$ 3.5 billion global consulting firm with more than
14,000 employees. The company has long struggled for name awareness in the
consulting field. In June 2003, Deloitte set out to change all that by launching a
viral marketing campaign around a free software program called Bullfighter.
Bullfighter searches electronic documents for business jargon and suggests
plainspoken alternatives. Deloitte devised a public relations campaign around
Bullfighter based on a perceived need for the business community to
communicate more clearly.
2004
The Subservient Chicken for Burger King was introduced in 2004. The branded
micro site consisted of an interactive web cam that filmed a person dressed in a
chicken costume who would perform certain acts the user typed into the site.
Users flocked to the site in droves, accumulating more than 15 million visits in the
first 5 days. Today, the site has attracted over 450 million hits.
2005
The Australian beer company, Carlton Draught, wanted to produce an ad that
would grab the attention of the world. The result: "The Big Ad." The ad went
viral, forcing the beer company to scale back its broadcast television ambitions
due to risk of over-exposure. Within 24 hours of its release, the ad attracted more
than 162,000 views, and after two weeks it had garnered over one million views.
6 Viral Marketing: it‘s infectious!, available at
http://www.brandchannel.com/features_effect.asp?pf_id=173, accessed 25th January, 2010

33 | P a g e
2006
Nike has become a master of viral marketing over the years, but 2006 ad staring
Brazilian soccer superstar Ronaldinho has emerged as one of the greatest viral
ads of all time. The "is it real, or is it doctored" quality of the ad caused many
viewers to send the clip to friends to get a second opinion on whether the feat
was real or computer generated. As of today, the amateur-looking clip has
generated more than 30 million views on YouTube and positioned itself as one of
the most successful and acclaimed viral ads of all time.
2007
The Diet Coke and Mentos Experiment was a viral sensation produced
completely independent of either the Coke or Mentos brands. Though "the
exploding Cokes" had already been an online phenomenon well before 2007, the
release of the "Diet Coke and Mentos Experiment" helped to generate more than
10 million YouTube views and raise the profile of the experiment beyond just a
passing fad and into the annals of Internet lore. Both Coke and Mentos gained a
considerable amount of brand awareness from the clip that has emerged as one
of the most iconic viral sensations of the past decade.
2008
Honda produced the first ever live commercial on British television. In more than
three-minute commercial showed 19 skydivers jumping out of two planes more
than 14,000 feet above the ground. The skydivers linked up to spell H-O-N-D-A
in the sky. The British ad was a traditional television ad in Europe, but became a
YouTube hit in the United States, generating over 400,000 views. Though the

34 | P a g e
effectiveness of this commercial has been debated, it must be noted that the
Accord became the bestselling vehicle in America in April 2009 for the first time
in its history.
Vodafone's ad campaigns featuring the Zoozoo creatures have become an
international sensation. Developed in India, the playful commercials have made
their way to the internet and become viral hits. The campaign, "Make the Most of
Now," has become truly global as a result. The videos have collected millions of
online views worldwide and firmly positioned the Zoozoo creatures as loveable
global icons. This is one of the successful advertising campaigns from Vodafone.
2009
Samsung's clip of LED-illuminated sheep running around the Welsh countryside
continues to generate interest throughout the Internet. The clip has attracted
nearly 8.5 million views on YouTube and continues to be the topic of discussion
on blogs across the web. The "is it real or not" quality proves once again to be
YouTube gold.
20107
Toy Story 3 — which grossed has grossed more than $1 billion worldwide and is
the highest grossing film of 2010 — had a unique viral video campaign this year
that was composed of fake vintage ‘80s commercials for one of the toys
introduced in the movie,
7 The Best Viral Marketing Campaigns of 2010, available at http://www.flowtown.com/blog/the-best-
viral-marketing-campaigns-of-2010, Accessed 25th
January, 2011.

35 | P a g e
When the environmentalist organization Greenpeace wanted Nestle to stop using
palm oil, a kind of vegetable oil used in processed foods, because they claimed it
was fueling deforestation and removing the orangutan from its natural home, they
went viral. Activists teamed up with producers to create a video parodying
Nestle‘s ―Need a Break?‖ catchphrase by showing a stressed office worker
chewing off the finger of an orangutan instead of a Kit Kat. The video is fairly
graphic (it shows blood spewing from the finger) but certainly gets the message
across — it won ―Best Viral Video 2010″ at the Berlin International Short Film
Festival.
One of the most successful viral marketing strategy is viral marketing is through
email. This study is mainly focused on finding drivers of viral marketing and
investigating various attributes which motivates users to receive viral messages
via email and influence them to forward viral messages to another user.
Drivers of Viral Marketing:
This study makes three principal contributions; first, the study generates a
grounded understanding about the drivers of viral marketing. A sequence of
drivers of viral marketing is also found out in previous research on viral marketing
but this sequence is modified with an additional factor. Second, a theoretical
framework is developed that illustrates the factors which influenced user to
receive viral messages.

36 | P a g e
Thus, the proposed framework helps researchers and marketers better
understand the important attributes which influences user to receive viral
messages. The success of viral marketing is depends upon if the viral messages
are propagated. Therefore, efforts have been taken into this study to understand
the factors which influenced user to forward messages. Third, this study
integrates a specific grounded theory with the more formal insights available from
information systems research and marketing literature, developing a more
general framework that will allow researchers and practitioners to explain,
anticipate, and evaluate viral marketing strategies.
Traditional word-of-mouth marketing technique has proven to play a significant
role in consumer buying behavior or decision. Past research also shows that
WOM is more effective than traditional marketing tools of persona; selling and
promotion through convention advertising media like print, Television etc.
Electronic word-of-mouth communication refers to any positive or negative
statement made by potential, actual, or former customers about a product or
company, which is made available to a multitude of people and institutions via
the Internet. It can also be considered as the extension of traditional
interpersonal communication into the new generation of cyberspace.
With the growth and evolution of the internet, electronic peer-to-peer referrals
have become an important phenomenon, and marketers have tried to harvest
37 | P a g e
their potential through electronic referral marketing (ERM) campaigns. At the
same time, spam, email-based viruses and the like have cluttered electronic
communications, making ERM campaigns problematic and challenging to deploy.
The key driver in ERM is the effectiveness of unsolicited, electronic referrals to
create awareness, trigger interest and generate sales or adoption (Arnaud De
Bruy, Gary L. Lilien, 2004).
For the success of viral marketing internet user should be aware of this
marketing technique. The decision to purchase a good or service or to adopt an
innovation, for instance, can be viewed as the end result of electronic word of
mouse, a viral marketing strategy. It has been observed that marketing role
has been changed and Information Technology is promoting that change.
Earlier marketing was one-to-one basis but because of Information
Technology whole scenario has changed.
Key drivers of Viral Marketing is awareness(Arnaud De Bruyn, Gary L. Lilien,
2008), interest((Arnaud De Bruyn, Gary L. Lilien, 2008), Access to use this
marketing techniques and experience which decides their final decision((Arnaud
De Bruyn, Gary L. Lilien, 2008). The consumer has now taken an observable
action, a purchase of a good or service or the sustained adoption of an
innovation. The key driver in viral marketing is the effectiveness of unsolicited,
electronic referrals to create awareness, trigger interest, and generate sales or
product adoption.
38 | P a g e
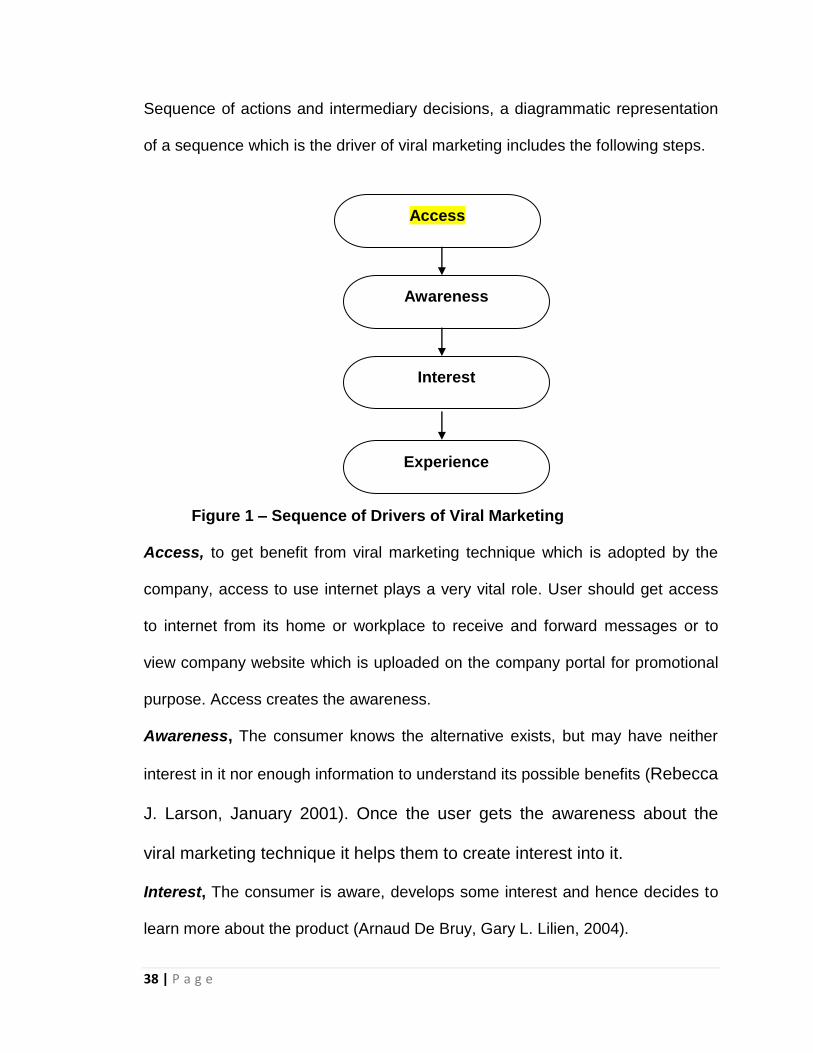
Sequence of actions and intermediary decisions, a diagrammatic representation
of a sequence which is the driver of viral marketing includes the following steps.
Figure 1 – Sequence of Drivers of Viral Marketing
Access, to get benefit from viral marketing technique which is adopted by the
company, access to use internet plays a very vital role. User should get access
to internet from its home or workplace to receive and forward messages or to
view company website which is uploaded on the company portal for promotional
purpose. Access creates the awareness.
Awareness, The consumer knows the alternative exists, but may have neither
interest in it nor enough information to understand its possible benefits (Rebecca
J. Larson, January 2001). Once the user gets the awareness about the
viral marketing technique it helps them to create interest into it.
Interest, The consumer is aware, develops some interest and hence decides to
learn more about the product (Arnaud De Bruy, Gary L. Lilien, 2004).
Access
Awareness
Interest
Experience

39 | P a g e
The success of viral marketing campaigns depends on how well they are
promoted within the target users, and also the increased usage of internet and
mobile phones by the Indian consumers provides a very good platform for the
retail chains to promote their business by using viral marketing as an effective
and cost efficient tool for marketing (Shailendra Dasari* and B Anandakrishna,
2010).
Once the interest is build user depends upon the internet to get information about
the product which creates their experiences about the viral marketing technique.
Experience: The consumer‘s demands for a personal, interactive and relational
experience have arisen from the opportunity to demand and experience this type
of interaction made possible through improved technology (Rebecca J. Larson,
January 2001).
All above process i.e access, awareness, interest and experience is hierarchical
in the sense that each step is conditional on the positive or favorable outcome of
the previous one. The original sequence in which access was not mentioned
proposed by Rogers (1962) included an evaluation stage and a trial stage that
may not be relevant in all contexts. Other variations of this sequence exist
(Hauser & Urban,1977; Rogers, 1995). For instance, if a consumer becomes
aware through exposure to a very persuasive source (e.g., a very effective ad or
an enthusiastic peer), awareness and interest may occur concurrently (Van den

40 | P a g e
Bulte & Lilien, 2003). Alternatively, interest and evaluation may be combined.
Nevertheless, most models rely on the above three-stage decision-making
framework in one form or another (Arnaud De Bruy, Gary L. Lilien, 2004).
User experienced innovation in viral marketing strategy. Scholarly research
concerning social and communication networks, opinion leadership, source
credibility, uses and gratifications, and diffusion of innovations can provide
insights into viral marketing processes and participants' motivations. Research in
these and other areas has long demonstrated that consumers influence other
consumers (Joseph E. Phelps et. al., 2004)
In a book ―Marketing Moves: A New Approach to Profits, Growth, and Renewal
by Philip Kotler et. al., 2002 mentioned that ―Markets are changing faster than
our marketing. The classic marketing model needs to be future-fitted. Marketing
must be deconstructed, redefined and stretched. Marketing is not going to work,
if its only charge is to pump up sales of existing goods.‖
The rapid growth of internet and other communication channels has opened up a
new arena for WOM communication. Viral marketing is based on WOM and can
be understood as a communication and distribution concept. The term ‗viral‘
describes a type of marketing that infects customers with an advertising message
which passes from one customer to the next ‗like a rampant flu virus‘ (Wolfgang
Palka et. al., 2009).

41 | P a g e
Models on Viral Marketing – from literature review.
The number of people online around the world will grow more than 45 percent to
2.2 billion users over the next five years, according to a new report by Forrester
Research, Inc titled "Global Online Population Forecast, 2008 To 2013".India will
be the third largest Internet user base by 2013 - with China and the US taking the
first two spots, respectively. Forrester estimates number of Internet users in India
currently to be 52 million and expects India to have an average growth rate of 10-
20 % respectively.
According to Forrester While per capita online spending is likely to remain
highest in North America, Western Europe, and the developed markets of Asia
throughout the next five years, the shifting online population and growing
spending power among Asian consumers means that Asian markets will
represent a far greater percentage of the total in 2013 than they do today,‖ said
Forrester Research Senior Analyst Zia Daniell Wigder. ―Multinational
organizations must understand the dynamics of the shifting global online
population to ensure that they are positioned to take advantage of emerging
international opportunities.‖
The first purpose of this study was to study drivers of viral marketing. The second
purpose of this research is to identify factors that impact the willingness to
receive and forward viral messages. Form the extensive literature review two
models on viral marketing have been identified. For the research study these two

42 | P a g e
models have been studied extensively and attributes are identified, having most
significant impact on user to receive and forward messages.
Wolfgang Palka et. al., 2009 developed a basic model of mobile viral marketing
processes. In this model three main conditions which influenced user to receive,
use, and forward messages are identified. These conditions are 1)receive
(intention to open), 2)use (intention to use), and 3)forward (intention to forward).
These conditions are influenced by other factors which are as follows:
The first stage concerns the recipient‘s response to the receipt of a mobile vector
and the decision to open or delete. The receipt of the mobile vector is seen as
the causal condition of the model. As the category intention to open was the
primary issue in the first stage, it was chosen as the core category. The intention
has an impact on the actual behavior (receipt), that is, the action/interaction
strategy. Three types of intervening conditions lead to the intention to open:
security-related conditions dealing with the risk perception of the recipient, social
conditions dealing with his or her relationship to the communicator of the content,
and resource-based conditions dealing with the recipient‘s perceived control of
the receipt. Action and interaction (taken in response to a phenomenon) have
certain outcomes or consequences.
If opened, the second stage concerns the circumstances under what recipients
rely on recommendations and use the mobile viral content. The core category

43 | P a g e
intention to use impacts the actual behavior (action/interaction strategy). Three
types of intervening conditions lead to the phenomenon: social conditions
describe interpersonal influences, attitudinal conditions arise from the personal
assessment of the content, resource-based conditions refer to the recipients‘
perceived behavioral control of its usage. Depending on the action/interaction
strategy one consequence can be the intention to forward the mobile viral
content,
The third stage deals with the decision whether to forward the content to others.
Similar to the previous stages, the core category, that is, intention to forward is
related to the actual behavior (action/interaction strategy). The intention is
influenced by social, attitudinal, resourced based, consumption based, and
personal conditions (intervening conditions). In case of forwarding, the
consequence is the receipt of the mobile vector by a further recipient. Otherwise
the mobile viral process ends.
1) Intention to Open is influenced by following factors: a. Security-related conditions
i. Trust ii. Perceived risk
b. Social conditions i. Sender Recognition ii. Perceptual Affinity
c. Resource based conditions i. Self Efficacy ii. Perceived Cost
2) Intention to use is influenced by following factors: a. Attitudinal conditions
i. Perceived usefulness ii. Perceived ease of use iii. Perceived enjoyment
b. Social conditions

44 | P a g e
i. Perceptual affinity ii. Expertise of communicator iii. Subjective norm iv. expressiveness
c. Resource based conditions i. Self efficacy ii. Perceived cost
3) Intention to forward is influenced by following factors: a. Attitudinal conditions
i. Perceived usefulness of communicator ii. Perceived user friendliness iii. Perceived enjoyment iv. Attitude towards forwarding
b. Social conditions i. Adherence of recipient‘s interests ii. Tie strength iii. Subjective norm iv. expressiveness
c. Resource based conditions i. Perceived cost
d. Personal Conditions i. Altruism ii. Market mavenism
e. Consumption-based conditions i. Customer satisfaction ii. Involvement of communicator

45 | P a g e
Figure 2: Basic model of a mobile viral marketing process.
Source: Journal of Information Technology (2009) 24, 172–185

46 | P a g e
The second model was based on the information adoption model which is
developed by Sussman and Siegal, 2003. This research model was built upon
the information adoption model (Sussman and Siegal, 2003). It examines
individual relationships between argument quality, source credibility, information
usefulness, and information adoption (Christy M.K. Cheung et. al., 2008).
Figure 3- Information Adoption Model
Source: Internet Research Vol. 18 No. 3, 2008 pp. 229-247
Further analysis of the Information Adoption Model regarding the components of
argument quality and source credibility done and a Research Model is
developed. This research model explores the motivations behind adoption of
online opinions. The research model is built on the theoretical model of
information adoption by Sussman and Siegal (2003). In this model there is a
resulting relationship between Information adoption, Information usefulness,
Relevance, Comprehensiveness, Accuracy, Timeliness, Source expertise, and
Source trustworthiness. Information adoption is a process in which people
purposefully engage in using information. Information adoption behavior is one of

47 | P a g e
the principal activities that users seek to conduct in virtual communities (Christy
M.K. Cheung et. al., 2008).
Figure 4 - Research Model for Social Network Site influence on Viral Marketing: Source: Internet Research Vol. 18 No. 3, 2008 pp. 229-247 From the above two models and extensive literature review it has been observed
that trust and relevance is the most significant factor which influenced user to
receive messages. Source credibility and Source Trustworthiness are combined
together from Research model into Trust. Content of the message,
comprehensiveness and sender recognition combined together in relevance of
the message. There are some factors which are described in Basic model of

48 | P a g e
mobile viral marketing such as perceived usefulness, perceived ease of use,
perceived ease of use, perceived enjoyment are combined together in perceived
benefits as these all factors gives perceived benefits like usefulness, enjoyment,
reward/incentive to user.
Following diagram illustrates the factors which influences user to receive viral
messages.
Indicate prerequisite
Indicate relationship
Figure 5: Diagrammatic representation of factors influencing user to
receive messages
Drivers of viral marketing as identified in this study are access to use internet.
Awareness of viral marketing strategy adopted by the marketer, Interest in
getting online information about the product and experience of viral marketing in
Intention to
Receive Viral
Messages
Trust (Source) Relevance
Perceived Benefits
Drivers of Viral
Marketing

49 | P a g e
which user receive and forward (send) messages within their social network as
well as getting information about the products directly from the marketer.
Interest and experience together built up user‘s understanding about viral
marketing. Once they are into social network over the internet they start receiving
viral messages. The first stage concerns the recipient‘s response to the receipt of
a viral messages and the decision to open or delete. As the category intention to
receive (open) was the primary issue in the first stage, it was chosen as the core
category. The intention has an impact on the actual behavior (receipt), that is, the
action/interaction strategy. Three types of intervening conditions lead to the
intention to open: Trust related conditions dealing with the risk perception of the
recipient, Relevance related conditions dealing with his or her relevance to the
content, and perceived benefit related conditions dealing with the user‘s
measurable interest in receiving viral messages (Wolfgang Palka et. al., 2009).
A consumer's expectations and subsequent satisfaction level are often shaped
by marketing communications. Marketing communications, such as advertising,
serve as a source of information and motivation for the consumer before the
purchase is made, and continue to inform prospective, current, and past
customers even while a product is in use. As such, marketing communications
present the focal product or service in the best light (David Aron, 2006). In viral
marketing strategy Marketers has to use effective communication strategy to by
way of sending effective promotional messages to target potential customer.

50 | P a g e
Companies have made use of websites and e-mail to try to reach customers.
However, over the years, people have become more critical towards e-mail
generated by companies, especially when companies send these e-mails without
asking permission of the (potential) customer. Often these e-mails are deleted
without opening them first. This had lead marketers to find new strategies.
In viral marketing strategy marketer communicate with customer with the help of
email messages. Success of viral marketing is not only in receiving viral
messages these messages needs to be forwarded by the user to another
potential user. This research is investigating factors which influence user to
receive and forward viral messages.
Factors influence user to receive viral messages.
Trusted Source
The importance of and source credibility has also been highlighted and strongly
validated in prior research on receiving messages. From the past literature it has
been observed that there is the positive relationship between trust and
acceptance of new technologies (e.g., Gefen et al., 2003). In general, the more
the trust there is, the lower the perceived risk is, the more willing people are to
adopt new technologies. Trust can reduce complexity especially when
innovations are being considered (Gefen, 2002). Trust is the most important and
most influential factor for user to receive viral messages.
51 | P a g e
User normally receives viral messages if it is from a trusted source. Word of
mouth (WOM) marketing is such a successful marketing strategy because it
breeds ―familiarity, personal connection, care and trust‖ between the consumer
and the translator of the information (Datta, et al., 2005). Consumers often hit the
delete key when they know the message is from a marketer. They are much
more reluctant to delete a message from a person they know this fact is a key
component in understanding the potential power of viral marketing. A deeper
analysis of the category revealed that it is also interwoven with perceived risk. If
the content comes from a ‗trusted source‘ the perceived risk is low or not
existent. For instance, participants did not express reservations regarding data
security and privacy issues when they would receive the content from a friend.
Also, they would open viral messages received from well-established brands
(Wolfgang Palka et. al., 2009).
In the online environment, people have almost unlimited freedom to publish and
express their feelings towards certain products or services without disclosing
his/her real identity. It is therefore left up to users to determine the expertise and
trustworthiness of the contributors in order to either adopt or reject the
information presented. If the consumer thinks that the comments are posted by
high-credibility (high degree of expertise and trustworthiness) individuals, he/she
will then have a higher perception of the usefulness of the comments (Christy
M.K. Cheung, 2008).

52 | P a g e
Emails are here to stay, and there is no doubt that peer-to-peer, email-based
communications will continue to play an informational and influential role on
recipients' behavior. The proliferation of spam (i.e., unsolicited bulk emails) and
email-based electronic viruses, however, have made most unsolicited emails
suspicious. Consumers experience a high level of noise in their day-to-day
electronic communications (Arnaud De Bruyn, 2004). Therefore, source is very
influencing factor for user to receive viral messages.
Protecting users‘ privacy is another measure concern for user‘s point of view.
Gold Robert et. al., 2002 quoted that Today, being secure means protecting
privacy. For the most part, firms argue that keeping customer data secure is the
basis for establishing competitive advantage. Marketer‘s need to constantly
demonstrate commitment to privacy so that customers don't demand their identity
be stripped from this information. Marketer can do this by developing and
distributing privacy-focused messages throughout company channels and
materials, and by working with qualified third parties that can endorse their
privacy commitment. Once users get confidence that their personal information
will be protected by the marketer they are always receptive about receiving viral
messages.
Trust can also be related to tie strength. In real life, people maintain a large
number of relationships with varying tie strength: close friends, family, work

53 | P a g e
colleagues, casual acquaintances, and so on. User normally accept information if
it is from a strong tie.
Relevance
Relevance of messages is important as most Internet users are conscious of
their time. Madu and Madu (2002) urged that Internet users rarely read web
pages in detail but rather scan the pages to find the information they need. Users
want to find the information that they want quickly and with little effort (Nah and
Davis, 2002). It is therefore important to have only the most relevant information
present in the online community. Dunk (2004) also suggested that relevance is
an important element in decision making. Therefore, the more relevant the
messages are, the higher the perceived information usefulness of the message
(Christy M.K. Cheung, 2008). Attitude towards receive and accept messages is
also important. Some users like to receive messages even though they are not
from their acquaintances but they have the attitude to receive information
(Wolfgang Palka, 2009). User is interested in getting information about the
product which he may not be required at that very moment.
When consumers engage in goal-directed decision making and are exposed to
information that may not be diagnostic or relevant in nature and content, they
may elicit the negative emotion of irritation because of their wasted time and the
utility of the cognitive effort in processing the information (Sweta Chaturvedi,
2009). This irritation may lead them into not accepting viral messages.
54 | P a g e
User accepts messages from the acquaintances for giving sender recognition
(Wolfgang Palka, 2009). E-mail messages are described as inherently interactive
(Andrew Paul Williams et. al., 2004). Messages with content which users‘ are
looking are likely to get received by user.
A measure of viral advertising effectiveness that is of particular concern to
advertisers, and ultimately the raison d'être of viral campaigns, is the extent to
which an advertisement is passed from one person to another. Researchers
have begun to investigate why ads are passed on. Phelps et al. (2004) found that
messages that spark emotion are more likely to be forwarded. A qualitative study
by Dobele et al. (2007) provides additional support of this view, suggesting that
for a viral advertisement to be passed on, it must elicit both the emotion of
surprise and at least one other emotional response such as joy. They argue that
although such combinations of emotions may be prerequisite, they may be
insufficient to motivate an individual to pass on a viral advertisement. A message
must also capture a viewer's attention "in a unique or unforgettable way" (Mark R
Brown et al, 2010). Appearance of viral advertisement posted on website or
social network plays important role in capturing user‘s attention towards them.
Yih Hwai Lee, 1999 quoted in his research paper that Relevancy refers to the
degree to which an item or a piece of information contributes to the identification
of the primary message communicated. Across two studies that examined
immediate response, He found that information expectancy and relevancy

55 | P a g e
interact to produce different levels of attitude favorability. Although ads with
unexpected-relevant information elicited more favorable attitudes than did ads
with expected-relevant information, ads with unexpected-irrelevant information
yielded less favorable attitudes than did ads with expected-relevant information.
User likes to reciprocate on the messages which are relevant as well as
appealing and interactive to them. For some users looks is not that important
than relevance. Similarity of interests and preferences with those of the
communicators is also important to decision to open messages. Therefore
intention to open is positively associated with perceptual affinity (Wolfgang Palka,
2009).
Personalization is one important way to make the Web work harder. In fact, it's
one of the areas where businesses will see the best return on their online
investments. In Internet terms, personalization means the ability to harness
customer knowledge in order to dynamically create, package and deliver
individualized marketing messages. It's also the ability to listen to customers and
learn from them, delivering content and services tailored to their responses and
actions.
Customer data is collected both online and off, for example, when a customer
clicks on a Web banner ad for the first time, reaches a certain number of
frequent-flier miles or purchases a particular item on their credit card. These are

56 | P a g e
events that, until now, have not been lever-aged to deliver more effective
customer communications (Young Troy, 2001).
Perceived Benefits
Messages which give benefits to the user like enjoyment (Wolfgang Palka, 2009),
information, usefulness (Wolfgang Palka, 2009), ease of use ((Wolfgang Palka,
2009), incentive/reward, certain conditions (Daniels, 2002) to get relevant
information are likely to be received by user. Comic strips and video clips grab
the attention of people (Angela Dobele et. al., 2007).Viral marketing relies on
consumers to extend the reach of a campaign. Most Internet marketers count on
a send-to-a-friend option to help make that happen (Daniels, 2002). Here user is
getting benefited by clicking on send-to-a-friend option.
The perception of usefulness clearly influences the acceptance (Wolfgang Palka,
2009). People would carry individual perception of whether these opinions could
be useful to help them to make a better buying decision. Therefore, if others think
that a comment within an online community is useful, they will have greater
intention of adopting the comment (Christy M.K. Cheung, 2008). Usefulness of
information increases the chances of converting user into potential buyer or
potential customer.
Especially in the starting phase of viral marketing, marketers tried to promote
forwarding messages by giving financial incentives to people that spread the
message. One example of a company that uses this strategy is Amazon.com.
Especially in the starting phase of viral marketing, marketers tried to promote
57 | P a g e
forwarding messages by giving financial incentives to people that spread the
message (Jurvetson & Draper, 1997). User accept viral messages to get benefits
like incentive, free subscription (Jeffrey Boase et. al., 2001), reward, bonus
points etc.
Email viral marketing is a permission marketing strategy used by American
Airlines sends e-mails to registered customers informing them of discount flights
on a weekly basis. Customers first asked the airline for notification of low fares
and receive them regularly. Permission marketing means the supplier has the
consent of the customer to mail him advertisements. It is a means of increasing
the customer base, promotes customer loyalty and trust. Internet users get in
return for this permission a credit entry or a free service such as e-mail service.
Online surveys as well as observing target groups can help to determine what
incentives motivate customers to spread a message. Without a doubt, offering
something that helps the users in their daily life, as was the case with Hotmail, is
a good start. (Skrob, J.-R., 2005).
Marketers needs to provide a steady stream of relevant news, entertainment,
knowledge, free of charge information means viral contents should be offered for
free (Wolfgang Palka, 2009) to encourage user to receive messages. Once the
message is accepted or recived by user, for the success of Viral marketing
strategy, messages needs to be forwarded or ropogated.

58 | P a g e
Factors influence user to forward viral messages.
This type of marketing encourages individuals to pass on information that they
receive in a hypermedia environment to friends and acquaintances. Before a
user makes a purchase they‘ll seek peer reviews and product recommendations.
After the purchase they will experience the product and form their own opinions
upon which they will cycle back comments for new consumers to review.
Viral marketing has been described as ―the process of getting customers to pass
along a company's marketing message to friends, family, and colleagues‖
(Laudon & Traver, 2001, p. 381). Like a virus, information about the company
and its brand message, goods, or services is spread to potential buyers, who
then pass the information along to other potential buyers such that a huge
network is created rapidly (Dobele, Toleman, & Beverland,2005; Lindgreen &
Vanhamme, 2005).
However, the emergence of the Internet along with broadband capabilities have
opened the door to the emergence of a new WOM advertising platform in which
individuals communicate about a brand, product or service in a non oral manner
but rather through a computer-mediated communication (CMC) environment
(Guy J. Golan, et.al, 2008)
From the literature review and basic model of mobile viral marketing it has been
observed that Tie strength ((Wolfgang Palka, 2009, Arnaud De Bruyn, 2008),
59 | P a g e
Sender benefits, Conditions to forward, Customer Satisfaction, and Altruism
(intention to benefit others) (Wolfgang Palka, 2009) are the most influential
factors for user to forward messages. Following diagrammatic representation
shows the prerequisites and relationship of factors which influence user to
forward viral messages.
Jonker, MJ, in his master thesis ―What drives people to forward viral messages?
Message aspects and motivations‖, (2008), mentioned that ―Many people forward
messages to each other that they on their turn have also received from other
people. Some examples are poems, jokes, chain letters and feel good e-mails.
These messages are called pass-along-emails or viral messages. These
messages are forwarded to other people in one‘s own network, often without
altering the message. This has offered opportunities for marketers to spread
messages by using the network of other people. The use of this strategy is called
viral marketing‖. Influencing factors which motivates user to forward viral
messages are as follows:

60 | P a g e
Indicate Prerequisite
Indicate Relationship
Figure 6: Diagrammatic representation of factors influencing user to
forward messages
In this section, we discuss the categories and their conceptual relationships
within the forwarding model that is depicted in Figure 6. As shown in the above
diagram drivers of viral marketing is pre-requisite for the user to receive viral
messages. Drivers of viral marketing give user understanding about viral
marketing phenomena and built their interest in getting information about product
or brand through their social network via internet. This curiosity about getting
information leads them to receive viral messages.
Intention to Receive
Viral Messages
Drivers of Viral
Marketing
Intention to
Forward Viral
Messages
Tie Strength
Sender
Benefit
Customer
Satisfaction
Altruism

61 | P a g e
User likes to receive message if it is from a trusted source, message is having
relevance and user is getting perceived benefits. These three factors are
influencing user to receive messages. One messages are received it is likely to
be forwarded. To forward viral messages receiving of messages is a pre-
requisite. In this study attempt is made to study what motivates or influence
people to forward viral messages.
Tie Strength
Wolfgang Palka, (2009) stated in his research paper that tie strength is a
category was motivated by respondents‘ descriptions of potential recipients.
Strong ties include family members, friends, or neighbors. When the recipient is
identified as merely an acquaintance, colleague, or neighbor, but primarily an
acquaintance, the tie is classified as weak (Brown and Reingen, 1987). The
category tie strength describes the combination of the amount of time, degree of
emotional intensity, level of intimacy, and degree of reciprocity between two
individuals (Granovetter, 1973). Tie strength has been found to be one of the
most significant factors to explain the influence of WOM communications (Arnaud
De Bruyn, 2004).
For viral marketers it is important to know if a message is sent only to people with
whom one remains a strong tie, or if a message is also forwarded to people with
whom one remains a weak tie. By forwarding messages to weak ties social
62 | P a g e
networks are crossed and this makes it more likely that the message reaches a
large audience.
However, as discussed, people interact on a more regular basis with their strong
ties than with their weak ties. It can be argued that this is also true for e-mail
communication. In this paper, the author argues that to whom the message is
forwarded is closely linked to interpersonal motivations for forwarding a
message.
Antti Vilpponen etl al, 2006 quoted in his research paper that, Frenzen and
Nakamoto (1993) have found that individuals tend to allow valued information
that has the potential to provide limited positive benefits to flow through strong
ties only. As information becomes inexpensive and benefits are permitted to
become common, weak ties are developed. As the information and
communication is basically free in electronic online environments (Dellarocas,
2003).
Janghyuk Lee et. al., 2009 in his research paper on viral marketing mentioned
that the tie strength includes closeness, intimacy, support, and association
(Frenzen and Davis, 1990). Strong ties are characterized by the degree of
intimacy and special meaning through a voluntary investment, which have
frequent interactions in multiple contexts under a sense of mutuality of the
relationship [Walker et al. 1994]. Previous studies on viral marketing and social

63 | P a g e
networks mostly focus on the network structure and how it affects the diffusion
process of information.
For example, Watts and Strogatz (1998) explained how a random link can
substantially improve the connectivity of networks by reducing the average length
among network participants. Using mobile telecommunications data, Onnela et
al. (2007) showed the role of weak ties to connect remote communities as well as
that of strong ties to maintain local communities, and simulation results
demonstrated that Information diffusion can be slowed down in a network which
has unevenly weighted links. Because marketing messages have to be timely
and interesting to consumers, the total volume and speed of the viral generated
within a given period time is a critical indicator to gauge the performance of a
viral marketing campaign (Leskovec et al.2007).
For decades, social science has measured relationships between individuals in
the currency of tie strength. Weak ties (loose acquaintances) can help to
disseminate ideas and/or innovations between different groups, help to find a job
or new information; while strong ties (family, trusted friends) hold together
organizations and social groups and can affect emotional health. However, since
information transmission and human communication are concurrent, the temporal
structure of communication must influence the properties of information
spreading (Giovanna Miritello, 2010)

64 | P a g e
Whether it is a weak tie or strong tie, tie strength is having significant impact on
user in forwarding viral messages. Where shopping motives were hedonic in
nature, tie-strength was more important than expertise, but when utilitarian
motives were dominant, both tie-strength and expertise were important.
Moreover, trust mediated the impact of the peer recommender's characteristics
on their perceived influence, propensity to search for product information, and
willingness to recommend the opinions of the peer (Ronald E. Goldsmith et. al.,
2006).
In a book ―Advances in electronic marketing‖ by Irvine Clarke et. al, (2005)
mentioned that Consumers engage in word-of-mouth when they are highly
satisfied or dissatisfied, when they feel committed to a company, or when a
product or service is novel. Further, word-of-mouth is more likely to be at play if
consumers know little about a product category, or if they are deeply involved in
a purchase decision. Lastly, the influence of personal source of information is
higher than that of other sources because of source expertise, tie strength,
demographic similarity, and perceptual affinity.
Message credibility (Wolfgang Palka, 2009) is having significant influence on
user to forward messages. However, people will not just forward any message.
As Porter (2006) outlines, the content of the message is important to provoke the
receiver to forward the information: ―Viral advertising is unpaid peer to peer
communication of provocative content originating from an identified sponsor

65 | P a g e
using the internet to persuade or influence an audience to pass along the content
to others‖ (L. Porter & Golan, 2006). A consumer who thinks he/she is an expert
in a product domain (higher subjective product knowledge) may have a different
motivation from that of a novice consumer when communicating product
information to others (Dongyoung Sohn et. al., 2005).
The hypermedia context might facilitate the spread of the message, it is still the
sender who decides to forward the message or not. Therefore, the message has
to be compelling. Often it is mentioned that the content has to be provocative. It
has to evoke an emotion with the receiver that motivates the receiver to forward
the message to other people. There has to be a persuasive aspect in the
message. Porter and Golan (2006) argued that those messages that are
forwarded are fun and intriguing, emotional, and provoking curiosity (Dongyoung
Sohn et. al., 2005). People in a strong tie always shared information which they
received.
Message developers should note that messages that spark strong emotion—
humor, fear, sadness, or inspiration—are likely to be forwarded. They should
consider crafting messages consistent with those particularly viral strains that are
most appropriate to their cause (Joseph E. Phelps, 2004).
Often in a tie strength user tend to forward messages if he/she received it from a
trusted source. Strong-tie sources are perceived as more credible and

66 | P a g e
trustworthy than weak-tie sources. In other words, strong-tie sources are more
likely to reduce the potential risks of the e-mails they send; hence, opening an e-
mail from a strong tie should be perceived as less risky than opening an e-mail
from a weak tie (Arnaud De Bruyn, 2008).
Sender’s Benefit.
This factor is not studied in a research widely. Messages through which sender is
benefited is most likely to be forwarded. People are interested in doing things
that gives benefit to them. Without a reward they will likely to ignore forward
request. Marketers who offer reward for spreading the message and services to
friends, family, and coworkers who might benefit are forwarded by the user.
There are some messages or services which require user to provide their friends
contact details to get complete benefit of the message or service e.g.
subscription, additional information etc. These messages are called as
incentivized messages.
Jason Y.C., 2010, quoted in his research paper that despite the increasing
popularity of viral marketing, factors critical to such a new communication
medium remain largely unknown. This paper examines one of the critical factors,
namely Internet users' motivations to pass along online content. Conceptualizing
the act of forwarding online content as a special case of a more general
communication behavior, we identify four potential motivations: (1) the need to be
part of a group, (2) the need to be individualistic, (3) the need to be altruistic, and

67 | P a g e
(4) the need for personal growth. Personal growth can be reward or incentive
from marketer, be in the network as a well informed member, availing free
services from the marketer, earning bonus points, etc.
Wilson (2000) explained that while the idea of giving away rewards results in a
loss of profit for a company in the short-term, however, the spread of a message
generates general interest which in the long-term leads to interest in other
desirable things the company is selling. This type of viral sheds some innuendo
on the marketing maxim, "give away something, sell something" (Wilson, 2000).
One of the most common examples of financially incentivized word of mouth
techniques is an affiliate or online referral programme, such as that run by online
retailer Amazon. The system is simple and straightforward: anyone who runs a
website, or who is active on the Web, can recommend products from the
company via the affiliate programme. The recommendations are made in the
form of referrer-personalized weblinks. The referrer can publish them on his or
her website, send them in an email, or post them in Internet forums. When
someone clicks on such a link, the system logs the referrer, and once the
referred visitor completes a purchase, the referrer will get a reward for the
purchase made8. Stefan Wuyts, Marnik G. Dekimpe, Els Gijsbrechts (2010) in his
8 Martin Oetting, How to manage connected Marketing, ESCP–EAP European School of Management/MemeticMinds.com, available at http://www.download-it.org/free_files/filePages%20from%20Chapter%2015%20%20How%20to%20manage%20connected%20marketing.pdf, Accessed on 21st March, 2011.

68 | P a g e
book ―The connected customer: that changing nature of consumer and business
markets‖ mentioned that Many viral marketing campaigns provide incentives,
such as sweepstakes, to motivate consumers to forward messages to friend.
Sender‘s benefit is also a one of the influencing factor for user to forward viral
messages.
Customer Satisfaction
Messages which give user usefulness(Wolfgang Palka et. al., 2009), enjoyment
(Wolfgang Palka et. al., 2009) and personal satisfaction (Wolfgang Palka et. al.,
2009) are more likely to be forwarded. Perceived usefulness includes the
concepts perceived ease of use. Perceived enjoyment where user finds this as
an enjoyable activity. Therefore, customer satisfaction is defined as a
pleasurable level of consumption-related fulfillment (Oliver, 1997). The nature of
satisfaction is defined as ―happiness, ―good feeling‖, or ―pleasure‖. Therefore,
customer satisfaction is defined as a pleasurable level of consumption-related
fulfillment (Oliver, 1997). Higher the customer satisfaction, which derives from
mobile viral content, the higher is the intention to forward this content (Wolfgang
Palka et. al., 2009).
Furthermore, marketers nowadays develop websites containing videos and
games that attract customer attention and interests. These websites usually
facilitate the viral process by providing tools to easily forward emails to friends,

69 | P a g e
such as ‗Tell a Friend‘ or ‗Share Video‘ buttons. Examples of extrinsic
motivations to forward marketing messages are prizes and other monetary
incentives (Biyalogorsky, Gerstner, and Libai 2001). E-mail is a convenient and
efficient way for people to exchange messages through mutually connected
computer networks as well to be connected with the people.
Some of the customer having a behavior that is information-seeking behaviors, or
more specifically, they rely of word-of-mouth communication to make purchase
decision. They seek to take opinion on their purchase decision as they perceive
high risk in decision making on purchase (Arnaud De Bruyn, 2008).
In 2001, Honda UK appointed Wieden and Kenney, an advertising agency
strongly focused on developing innovative and interesting ways to express an
idea (often referred to as the ―creative‖), to find a way to communicate the
intricacy and excellence of its automotive products. However, it was not enough
to have a ―wow‖ factor in the advertisements; Honda sought a unique way to
transmit the message to potential consumers, influencers, and those who would
aspire to the brand, making consumers the instruments of advocacy (Angela
Dobele, 2005).
Customer satisfaction with respect to product or service is a key factor in
forwarding viral messages. Customer who is satisfied with the product would like
to advocate the product on his own pay positing positive review or forwarding
70 | P a g e
messages about the product within his network. We tried to found out in this
study also that whether customer would like to advocate or forward messages of
the product or service even he/she is not using it but having a good knowledge or
opinion about it. Satisfied experts generate the most WOM, but only when they
had choice. Consumer experts may be motivated to self-enhance by talking
about their positive (satisfying) experiences (Andrea C., 2006). (Rebecca, 2009)
quoted in her paper that Popcorn (2005), who confirms that current trends have
―led consumers to reject artificial, highly scripted, top-down marketing‖ and are
instead seeking a personal, conversational experience Not only do consumers‘
opinions about their care experience shared online influence other people‘s
perceptions about a business, they truly impact purchase intent‖ (Barnes, et al.,
2008).
Altruism
Wolfgang Polka, 2009 quoted in his research paper that respondents indicated
that they would forward mobile viral content to give something to or help others.
This resulted in the category altruism that is referred to as the intention to benefit
others as an expression of internal values, regardless of social or motivational
reinforcement (Feick et al., 1995). Desire to help others may be a motivation for
forwarding mobile viral content. Sundaram et al. (1998) have suggested altruism
as a motivation for positive and negative WOM communication. Analyzing WOM
on Web-based opinion platforms Hennig-Thurau et al. (2004) identified a group

71 | P a g e
they referred to as true altruists, as they appear to be both strongly motivated by
helping other consumers and companies.
Those that pass on the information and have influence among the consumers
can be considered online market mavens or ―viral mavens‖ (Phelps, Lewis,
Mobilio, Perry, & Raman, 2004). The researchers discovered that Internet users‘
who are more altruistic and/or more individualistic, tend to share more online
content than others. According to Dempsey (2010) ―While e-mavens want to help
someone by forwarding online content that may interest them, at the same time,
they want to be recognized as an expert,‖ says Dempsey (2010). ―So although e-
mavens carefully choose what will be forwarded, they are also trying to manage
their self-image. E-mavens want to be unique.‖ Viral Mavens and Infrequent
Senders attributed largely positive motivations to the senders.
A desire to connect and share with others was mentioned most frequently.
Consumers may share such practically useful content for altruistic reasons (e.g.,
to help others) or for self-enhancement purposes (e.g., to appear knowledgeable)
(Wojnicki and Godes 2008). Altruism and self interest may have the same
impetus: concern for well-being.
The researchers also found that participants who spend more time online tend to
share more information with others in their social network. Pending more time
surfing the Web also may allow individuals to feel a sense of inclusion. All of

72 | P a g e
these results, according to Dempsey (2010), may help viral marketing campaigns
achieve more success. Viral marketing is here to stay. The tools, technologies,
and support are available to embrace and profit from the incorporation of viral
marketing and social media into an integrated marketing and communications
strategy.
The vast majority of consumers who post online reviewers are overwhelmingly
motivated by goodwill and positive sentiment, according to a Bazaarvoice survey
conducted by the Keller Fay Group, available on
http://www.marketingcharts.com/interactive/online-reviewers-driven-mostly-by-
altruism-cmos-need-not-fear-wom-2527/ which surveyed some 1,300 online
reviewers. Fully 90% of respondents say they write reviews to help others make
better buying decisions, and more than 70% want to help companies improve the
products they build and carry.
The study also found that 79% write reviews in order to reward a company, and
87% of the reviews are generally positive in tone.
Among other findings of the new survey:
Reviewers are active online participants who post reviews as a way
of giving back to the review community (79%).
Reviewers purchase products online (85%), send more than 10
emails a day (77%), and engage in social networks (25%).
73 | P a g e
20% of reviewers post messages on other people‘s blogs or chat
rooms; 19% post on independent product-review sites such as
ePinions or CNET; and significantly more post directly on a
retailer‘s own website.
Highlighting the prevalence of multichannel shopping, the survey
also found that over 65% of reviewers have returned to the
retailer‘s site to leave an online review about an offline purchase.
Nearly 60% of reviewers have told friends and family about their
product experience.
This study attempts to extend the existing research about viral marketing.
Through extensive literature review in the first part of the research it has been
observed that sequence of drivers of viral marketing is access, awareness,
interest and experience.
In the second part of the research it has been examined which type of factors
influence user to receive viral messages of product/service and they are trust,
relevance and perceived benefits. For the success of the viral marketing in the
third part of research it is imperative to study factors which influence user to
forward viral messages of product/service. Factors which are identified as tie
strength, senders benefit, customer satisfaction, and altruism.
74 | P a g e
Concluding the literature review, it is noted that:
1. Not much study of viral marketing known to exists in Indian context.
2. There has been little research into finding out the drivers of viral
marketing.
3. No combine research has been done to investigate the factors which
influence user to receive and forward messages.
75 | P a g e
Chapter-3
Purpose of the Study
Motivation stems primarily in this study because viral marketing is a powerful
marketing tool with untapped potential. Viral Marketing Communication can bring
about benefits to marketers with its advantages such as low cost, high reach,
high credibility, accountability, fast speed, ease of usage and ability to reach a
global audience.
With the increased usage of broadband and internet services like YouTube,
Hotmail and Facebook, we think that there will be an increasing trend for Viral
Marketing to be adopted by companies as part of their promotional mix in the
future, thus fuelling interest in this topic. Limited research has been done on
drivers of viral marketing and response to such marketing techniques.
For the purpose of viral marketing successes, intention to read is of great
importance. Most researchers discussed receive and forward separately (Hsi-
Pen, 2007). . Except while going through prior literature it has been found that
study on mobile viral marketing has been done which identifies the factors which
influence user to receive, use and forward mobile messages. To make sure that
every email is meaningful to receivers, and is transmitted by viral marketing, this
study focuses on viral messages itself, understanding what meaningful viral
messages to users is, being willing to read and exploring the factors of
forwarding viral messages as well.

76 | P a g e
This study also investigates the drivers of viral marketing. It is very essential for
user to know about the viral marketing strategy adopted by the marketer. Only by
understanding what people think, will businesses achieve marketing goals. In
sum purpose of this study are to investigate receiver‘s determinants of reading
viral messages and to explore the factors that affect receivers to read viral
messages and forward after reading.
77 | P a g e
Chapter-4
Objectives of the Study
The current study is attempted to understand viral marketing strategy adopted by
the marketer. Viral marketing strategy on the other hand, is a specifically
coordinate set of activities that are designed to take advantage of potential word-
of-mouth accelerators. Viral marketing consists of a set of tactics designed to
grow attention and increase usage at exponential rates. A successful viral
marketing program should have a massive result in regards to awareness and its
adoption.
In order to achieve virality, one of the platforms of viral marketing is sending viral
messages through email by the marketer or from one user to another. Messages
must have a message that resonates due to strong entertainment or
informational value. This message must, of course, be resident in electronic or
online form so that it can be passed along in an exponential fashion via social
networks or email. It‘s not so easy to activate people‘s desire to share humorous,
entertaining or useful information.
First Objective of the study is to understand viral marketing and how this viral
marketing is taking place through social network? On the basis of research study
which is conducted in 2007 it has been observed that social networking sites
visitors are increasing.

78 | P a g e
Therefore it is very essential to see the response of internet users to this viral
marketing strategy. Accordingly, second objective is to find out the drivers of viral
marketing which drives user to get information about product/service.
During the study it has been observed that internet users are increasing day by
day. A study conducted by Fabernovel consulting in 2007 depicted in following
graph 1, shows the frequency of visitation: on social networking sites.
Graph 1
Source : Ipsos 2007, faberNovel Consulting 2007, Research paper 2007, Social Network websites: best practices from leading services
In India penetration of internet is low as compared to the rest of the world. Mostly
the penetration is mainly in urban area than the rural area. Study in 2010 is

79 | P a g e
conducted by Internet World Stats to see the highest number of users in Internet
top 20 countries which shows in India there is 81.0 millions of user using internet.
China is having highest number of internet user which is 420.0 millions, followed
by Unites States with 239.9 millions of user. Least is a Argentina with 26.6
millions of users followed by Canada with 26.2 millions of user. Graph 2 shows
the diagrammatic presentation of number of users (in millions) in Internet top 20
countries.
Graph 2

80 | P a g e
Some Statistics about Internet Users in India9
A Study of the Indian Telecommunications Industry which is conducted at 2008
shows number of Internet users in Asia is 5,29,701,704. Though Asia has only
16% of populations of the world, 37.6% of total internet users are Asian which is
great. Of them around 60 million are from India. India is 3rd in Asia (1st is China
(220 million) and 2nd is Japan (87.5 million)) and 4th in world ((1st is China (220
million), 2nd is USA (216 million) and 3rd is Japan (87.5 million)) as per as
internet users are concerned. As per the recent study of Internet world Stats
which is conducted at 2010 the Indian users has increased from 60 million to 81
million.
India has 13% of internet users in Asia and 7.36% that of the world. But the
sorrowful fact is only 5.3% of people in India use internet. The reason of this is
most of the people in India don‘t know computer. 70% of people who know
computer have used internet which is a healthy sign.
This study also investigates mainly which age group and which type people use
internet in India. 19-40 years age group is major section (85%) using internet in
India. 85% of internet users in India are male which not a very good sign is.
Among working women, only 11% use internet. The ratio is almost half (6%)
in case of non-working women and even worst in case of house-wives (2%). The
scenario is much better in case of young men (33%). Also 15% older men, 14% 9Available at http://www.indiabroadband.net/india-broadband-telecom-news/11169-
some-statistics-about-internet-users-india.html, Accessed on 15-04-2011.

81 | P a g e
school going kids and 21% college students use internet in India. 46% of net
users are graduate, 26% are post-graduate. Among these, 2/3 rd of user use
internet 2-3 times a week. 62% uses internet from office as in most of the offices,
it‘s free.
Next, this study is carried on to see from which cities most users come. Mumbai
has the maximum number of internet users (3.24 million) in India followed by
Delhi (2.66 million). The top ten cities where people use internets are Mumbai,
Delhi, Bangalore, Kolkata, Chennai, Pune, Hydrabad, Ahmedabad, Surat and
Nagpur. The total numbers of internet users of those 10 cities are 37% of the
total numbers of internet users in India.
Further it also take a look which types of sites majority of users browse. Most of
the users use net for emailing (95%) which is obvious. Next is job searching
(73%) showing crisis of getting job in India followed by chatting sites (62%),
social networking sites (51%) and quite interestingly mathematical sites (48%).
The top ten sites internet users browse in India are the following:
1. Yahoo 6. Youtube
2. Google India 7. Blogger.com
3. Google 8. Windows Live
4. Orkut 9. Rapid Share
5. Rediff 10. Wikipedia

82 | P a g e
So, briefly this is the situation of internet users in India. Though internet
ownership has seen growth of 32% compare to last year which is a delighting
fact, there are some concerning factors too. Those are
Only 5.3% people use internet in India which is very low.
Most of the users are male (85%). The female percentage should
increase.
Maximum number of users is from top 10 cities (37%). So, the internet
usage in urban areas is very less.
Most of the users are male (85%):
A study conducted in 2009, by Internet & Mobile Association of India (IAMAI) and
Indian Market Research Bureau (IMRB) found that there are over 54million users
who are active on internet only in India. However, it was claimed that there were
about 71 million users who used the internet. The number seemed to cross 52
million in September last year from 42 million at the same point of the previous
year i.e September 2008. This means an increase in 19 percent of users in India.
These active users access internet at least once every month to stay in touch
with their online activities. The number of internet users worldwide is expected to
touch 2.2 billion by 2013 and India is projected to have the third largest online
population during the same time, says a report. "The number of people online
around the world will grow more than 45 per cent to 2.2 billion users by 2013 and
Asia will continue to be the biggest Internet growth engine."... India will be the
third largest internet user base by 2013 with China and the US taking the first two
spots, respectively," technology and market research firm Forrester Research
83 | P a g e
said in a report. Globally, there were about 1.5 billion Internet users in the year
2008.
From the above statistical data it has been found that most of internet users are
male compared to female. Therefore, third objective is to find out the factors
which influence user to receive and forward messages with respect to gender.
In viral marketing most of the study is carried on teenagers or college going
students as they are the frequent user of internet. For the success of the viral
marketing it is very essential to know the responses of working professionals also
as they are having money power. It is very essential to know whether viral
marketing strategy influences them to know about the product or service.
Fourth objective is to investigate the factors which influence user to receive and
forward messages with respect to occupation. In this study two occupations are
considered which are student and working professionals.
Therefore, the objectives of the current study are as follows:
1. To understand viral marketing through social network.
2. To identify drivers for viral marketing.
3. To reveal and validate factors which influence user to receive and forward
messages.
4. To understand impact of demographic factors of user on receiving and
forwarding messages.
84 | P a g e
Chapter-5
Hypothesis
Prior research in viral marketing suggests that it is a very effective viral
marketing strategy with lots of benefits for the marketer as well as to the
customers. This study has made an attempt to understand viral marketing
and its communication through viral messages via email over the internet.
This study is divided into three parts. In first part, attempt is made to know
about viral marketing. Social networks make viral marketing and word-of-
mouth marketing much easier than before. The best use out of social
networks is not to make money ‗directly‘ off them, but to harness their
marketing potential and to use them to market your own business. Success of
the viral marketing is dependent on the awareness of the marketing strategy
and benefits user gets from this strategy. Viral marketing is very innovative
technique where user can get information about product/service at anytime,
anywhere over the internet. User‘s like to take benefit of this technology. Viral
Marketing is consumer-to-consumer or business-to-consumer strategy. In this
business sends the information to the user and user share their experiences
with other user.
Communication in this marketing strategy is very convenient and interesting
for the user. Being a member of social network and regular visit on the social
networking sites generates interest of user into knowing about viral marketing.

85 | P a g e
User may be not be aware of the term ―viral marketing‖ but he likes to view or
share information of product of services with his acquaintances. Sequence of
drivers of viral marketing through literature review is identified as access,
awareness, interest and experience. That means regular access on the
internet creates awareness about the viral marketing. Once the user starts
getting benefit it creates interest in it which in turn generates their experience.
To know whether the access, awareness and interest gives experience of
viral marketing to user and drives them to receive and forward information of
product, the null and alternative hypotheses for drivers of viral marketing are
as follows:
Hypothesis - 1:
H01 : Access does not have significant impact on experiences of viral
marketing.
H11 : Access has significant impact on experiences of viral marketing.
Hypothesis - 2:
H02 : Awareness does not have significant impact on experiences of viral
marketing.
H12 : Awareness has significant impact on experiences of viral
marketing.
Hypothesis - 3:
H03 : Interest does not have significant impact on experiences of viral
marketing.
H13 : Interest has significant impact on experiences of viral marketing.
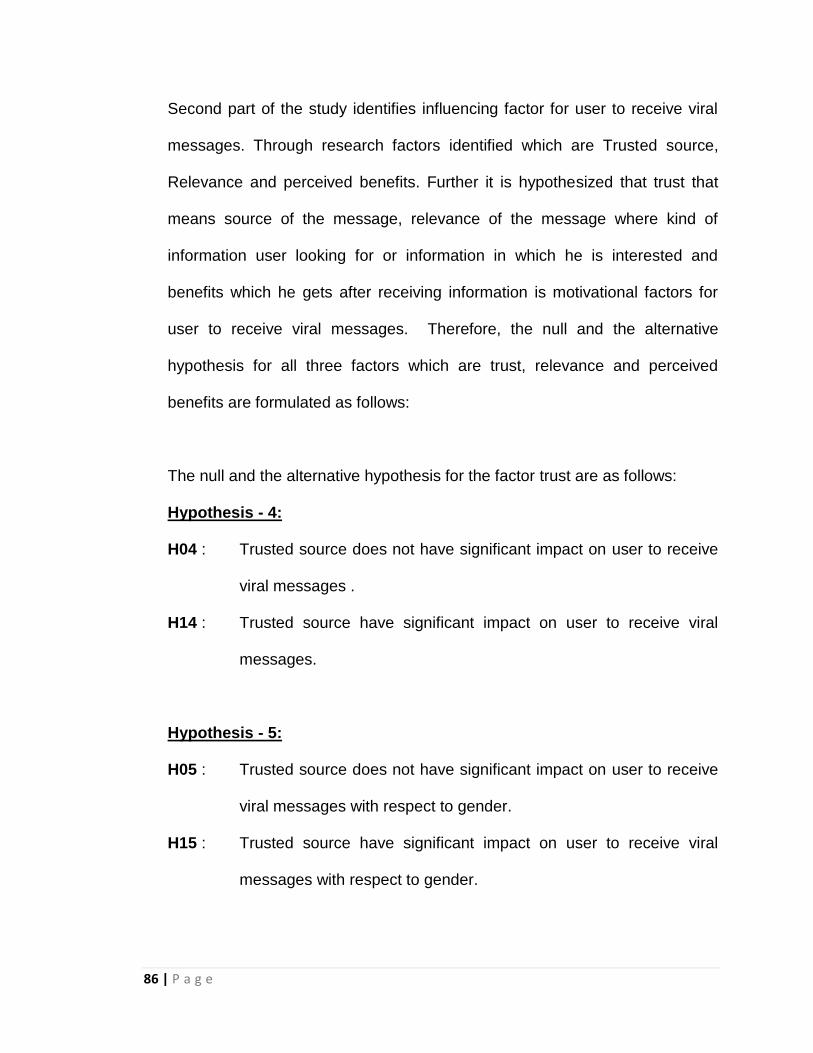
86 | P a g e
Second part of the study identifies influencing factor for user to receive viral
messages. Through research factors identified which are Trusted source,
Relevance and perceived benefits. Further it is hypothesized that trust that
means source of the message, relevance of the message where kind of
information user looking for or information in which he is interested and
benefits which he gets after receiving information is motivational factors for
user to receive viral messages. Therefore, the null and the alternative
hypothesis for all three factors which are trust, relevance and perceived
benefits are formulated as follows:
The null and the alternative hypothesis for the factor trust are as follows:
Hypothesis - 4:
H04 : Trusted source does not have significant impact on user to receive
viral messages .
H14 : Trusted source have significant impact on user to receive viral
messages.
Hypothesis - 5:
H05 : Trusted source does not have significant impact on user to receive
viral messages with respect to gender.
H15 : Trusted source have significant impact on user to receive viral
messages with respect to gender.

87 | P a g e
Hypothesis - 6:
H06 : Trusted source does not have significant impact on user to receive
viral messages with respect to occupation.
H16 : Trusted source have significant impact on user to receive viral
messages with respect to occupation.
The null and the alternative hypothesis for the factor relevance are as follows:
Hypothesis - 7:
H07 : Message relevance does not have significant impact on receiving
viral messages.
H17 : Message relevance has significant impact on receiving viral
messages.
Hypothesis - 8:
H08 : Message relevance does not have significant impact on receiving
viral messages with respect to gender.
H18 : Message relevance has significant impact on receiving viral
messages with respect to gender.
Hypothesis - 9:
H09 : Message relevance does not have significant impact on receiving
viral messages with respect to occupation.
H19 : Message relevance has significant impact on receiving viral
messages with respect to occupation.

88 | P a g e
The null and the alternative hypothesis for the factor perceived benefits are as
follows:
Hypothesis - 10:
H010 : Perceived benefits to user does not have significant impact on
receiving viral messages.
H110 : Perceived benefits to user have significant impact on receiving viral
messages.
Hypothesis - 11:
H011 : Perceived benefits to user does not have significant impact on
receiving viral messages with respect to gender.
H111 : Perceived benefits to user have significant impact on receiving viral
messages with respect to gender.
Hypothesis - 12:
H012 : Perceived benefits to user does not have significant impact on
receiving viral messages with respect to occupation.
H112 : Perceived benefits to user have significant impact on receiving viral
messages with respect to occupation.
Third part of the study is to identify factors which influence used to forward
messages. For the success of viral marketing it is very essential to identify
factors which influence user to forward messages. Through research factors
identified are Tie Strength, senders benefit, customer satisfaction and
altruism Further it is hypothesized Ties strength is the influential factor to
forward messages because, it helps you to be connected with your

89 | P a g e
acquaintances. It gives him the identity as a knowledgeable person. Sender‘s
benefit is another influential factor which gives him incentives or rewards and
enjoyment to forward messages. Altruism is a influencing factor where user
forward messages to benefit other user. Therefore the null and the alternative
hypothesis formulated for these factors are as follows:
The null and the alternative hypothesis for the factor tie strength are as
follows:
Hypothesis - 13:
H013 : Tie strength does not have significant impact on user to forward
viral messages.
H113 : Tie strength has significant impact on user to forward viral
messages.
Hypothesis - 14:
H014 : Tie strength does not have significant impact on user to forward
viral messages with respect to gender.
H114 : Tie strength has significant impact on user to forward viral
messages with respect to gender.
Hypothesis - 15:
H015 : Tie strength does not have significant impact on user to forward
viral messages with respect to occupation.
H115 : Tie strength has significant impact on user to forward viral
messages with respect to occupation.

90 | P a g e
The null and the alternative hypothesis for the factor Sender‘s benefit are as
follows:
Hypothesis - 16:
H016 : Sender‘s benefit does not have significant impact on user to
forward viral messages.
H116 : Sender‘s benefit has significant impact on user to forward viral
message.
Hypothesis - 17:
H017 : Sender‘s benefit does not have significant impact on user to
forward viral messages with respect to gender.
H117 : Sender‘s benefit has significant impact on user to forward viral
messages with respect to gender.
Hypothesis - 18:
H018 : Sender‘s benefit does not have significant impact on user to
forward viral messages with respect to occupation.
H118 : Sender‘s benefit has significant impact on user to forward viral
messages with respect to occupation.
The null and the alternative hypothesis for the factor Customer Satisfaction
are as follows:
Hypothesis – 19:
H019 : Customer Satisfaction does not have significant impact on user to
forward viral messages.

91 | P a g e
H119 : Customer Satisfaction has significant impact on user to forward
viral messages with respect to gender.
Hypothesis – 20:
H020 : Customer Satisfaction does not have significant impact on user to
forward viral messages with respect to gender.
H120 : Customer Satisfaction has significant impact on user to forward
viral messages with respect to gender.
Hypothesis – 21:
H021 : Customer Satisfaction does not have significant impact on user to
forward viral messages with respect to occupation.
H121 : Customer Satisfaction has significant impact on user to forward
viral messages with respect to occupation.
The null and the alternative hypothesis for the factor Altruism are as follows:
Hypothesis – 22:
H022 : Altruism does not have significant impact on user to forward viral
messages.
H122 : Altruism has significant impact on user to forward viral messages .
Hypothesis – 23:
H023 : Altruism does not have significant impact on user to forward viral
messages with respect to gender.
H123 : Altruism has significant impact on user to forward viral messages
with respect to gender.

92 | P a g e
Hypothesis – 24:
H024 : Altruism does not have significant impact on user to forward viral
messages with respect to occupation.
H124 : Altruism has significant impact on user to forward viral messages
with respect to occupation.

93 | P a g e
Various hypotheses (null as well as alternative) are tabulated in TABLE – 7.1
TABLE 7.1 - Research Hypotheses
Sr.No. Null Hypothesis Alternative Hypothesis
H1 Access does not have significant
impact on experiences of viral
marketing.
Access has significant impact on
experiences of viral marketing.
H2 Awareness does not have
significant impact on experiences
of viral marketing.
Awareness has significant impact
on experiences of viral marketing.
H3 Interest does not have significant
impact on experiences of viral
marketing.
Interest has significant impact on
experiences of viral marketing.
H4 Trusted source does not have
significant impact on user to
receive viral messages.
Trusted source have significant
impact on user to receive viral
messages.
H5 Trusted source does not have
significant impact on user to
receive viral messages with
respect to gender.
Trusted source have significant
impact on user to receive viral
messages with respect to gender.
H6 Trusted source does not have
significant impact on user to
receive viral messages with
respect to occupation.
Trusted source have significant
impact on user to receive viral
messages with respect to
occupation.

94 | P a g e
Sr.No. Null Hypothesis Alternative Hypothesis
H7 Message relevance does not have
significant impact on receiving viral
messages.
Message relevance has significant
impact on receiving viral
messages.
H8 Message relevance does not have
significant impact on receiving viral
messages with respect to gender.
Message relevance has significant
impact on receiving viral messages
with respect to gender.
H9 Message relevance does not have
significant impact on receiving viral
messages with respect to
occupation.
Message relevance has significant
impact on receiving viral messages
with respect to occupation.
H10 A perceived benefit does not have
significant impact on user to
receive viral messages.
A perceived benefit has significant
impact on user to receive viral
messages.
H11 A perceived benefit does not have
significant impact on user to
receive viral messages with
respect to gender.
A perceived benefit has significant
impact on user to receive viral
messages with respect to gender.
H12 A perceived benefit does not have
significant impact on user to
receive viral messages with
respect to occupation.
A perceived benefit has significant
impact on user to receive viral
messages with respect to
occupation.

95 | P a g e
Sr.No. Null Hypothesis Alternative Hypothesis
H13 Tie strength does not have
significant impact on user to
forward viral messages.
Tie strength has significant impact
on user to forward viral messages.
H14 Tie strength does not have
significant impact on user to
forward viral messages with
respect to gender.
Tie strength has significant impact
on user to forward viral messages
with respect to gender.
H15 Tie strength does not have
significant impact on user to
forward viral messages with
respect to occupation.
Tie strength has significant impact
on user to forward viral messages
with respect to occupation.
H16 Sender‘s benefit does not have
significant impact on user to
forward viral messages.
Sender‘s benefit has significant
impact on user to forward viral
messages.
H17 Sender‘s benefit does not have
significant impact on user to
forward viral messages with
respect to gender.
Sender‘s benefit has significant
impact on user to forward viral
messages with respect to gender.
H18 Sender‘s benefit does not have
significant impact on user to
forward viral messages with
respect to occupation.
Sender‘s benefit has significant
impact on user to forward viral
messages with respect to
occupation.
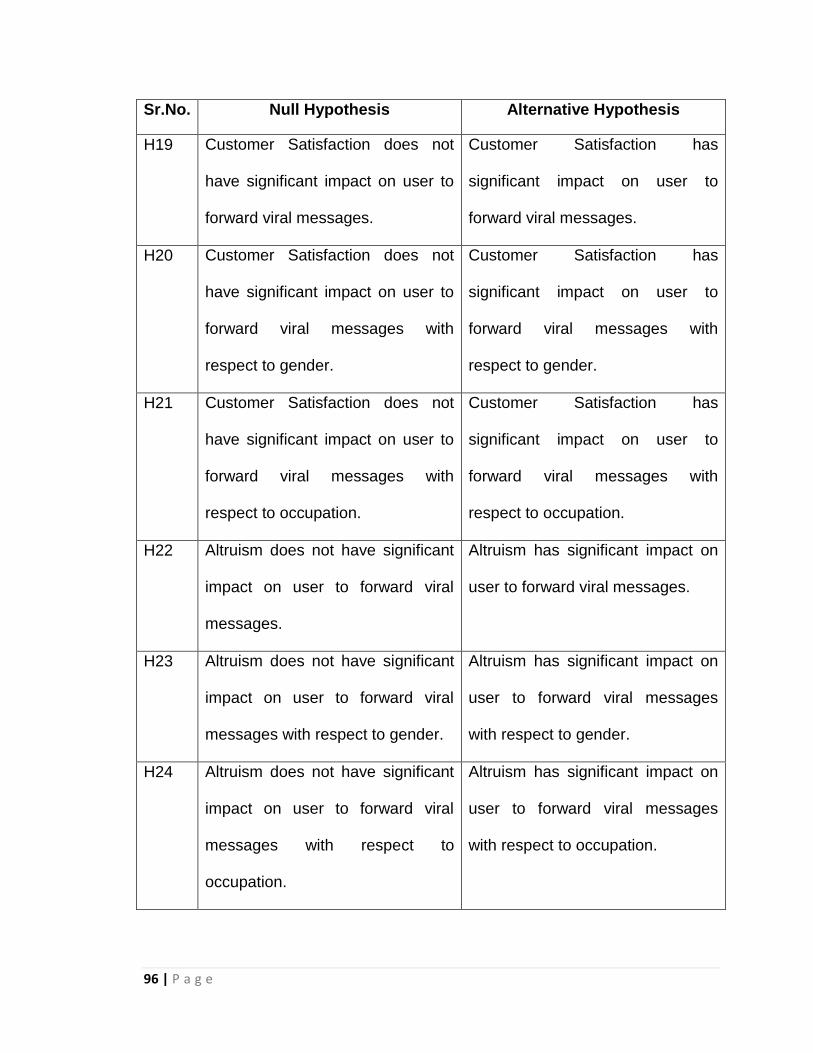
96 | P a g e
Sr.No. Null Hypothesis Alternative Hypothesis
H19 Customer Satisfaction does not
have significant impact on user to
forward viral messages.
Customer Satisfaction has
significant impact on user to
forward viral messages.
H20 Customer Satisfaction does not
have significant impact on user to
forward viral messages with
respect to gender.
Customer Satisfaction has
significant impact on user to
forward viral messages with
respect to gender.
H21 Customer Satisfaction does not
have significant impact on user to
forward viral messages with
respect to occupation.
Customer Satisfaction has
significant impact on user to
forward viral messages with
respect to occupation.
H22 Altruism does not have significant
impact on user to forward viral
messages.
Altruism has significant impact on
user to forward viral messages.
H23 Altruism does not have significant
impact on user to forward viral
messages with respect to gender.
Altruism has significant impact on
user to forward viral messages
with respect to gender.
H24 Altruism does not have significant
impact on user to forward viral
messages with respect to
occupation.
Altruism has significant impact on
user to forward viral messages
with respect to occupation.
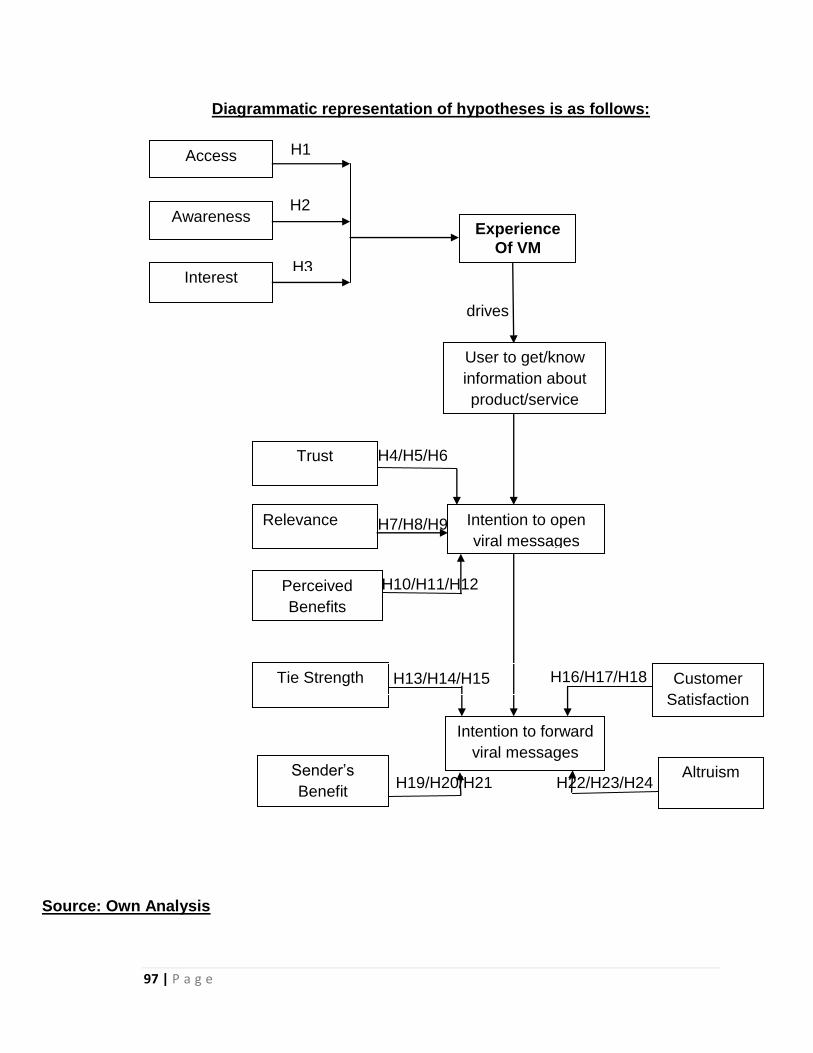
97 | P a g e
Diagrammatic representation of hypotheses is as follows:
Access
Awareness
Interest
Experience
Of VM
User to get/know
information about
product/service
drives
H2
Intention to open
viral messages
Trust
Relevance
Perceived
Benefits
H4/H5/H6
H7/H8/H9
H10/H11/H12
Intention to forward
viral messages
Tie Strength
Sender‘s
Benefit
H13/H14/H15
H19/H20/H21
Customer
Satisfaction
Altruism
H16/H17/H18
H22/H23/H24
H1
H3
Source: Own Analysis

98 | P a g e
Chapter-6
Research Methodology
The current research attempts to find in first part of the research study the
sequence of drivers of viral marketing and to find out whether this sequence
gives them the experience of viral marketing and drives them to get the
information about products or services through viral messages over the internet.
Second part of research study attempts to find out if there is any relationship
between influencing factors such as trust, relevance and perceived benefits with
intention to open viral messages.
Third part of research study attempts to find out if there is any relationship
between influencing factors such as tie strength, sender‘s benefit, customer
satisfaction and altruism with intention to forward viral messages.
The research process followed in this study is depicted in FIGURE– 6.1. As
already discussed, the diagnostic research design is adopted for this research
study. Under this design, attention has been paid on following aspects:
a) Selection of Sample
b) Method of data collection
c) Data collection
d) Data processing and analysis
e) Interpretation

99 | P a g e
FIGURE 6.1 Diagrammatic representation of Research Process
Define Research Problem
Review the literature
Review Concepts
and Theories
Review previous
research findings
Formulate Research
Objectives and
Hypothesis
Design Research
(including sample
design)
Data Collection
Data Analysis and
Hypothesis Testing
Interpretation of result

100 | P a g e
Design, Instrument Selection or Development, Sampling
Sample Design:
The target population covered under this project is the internet user from the age
group more than 16. To ensure wide cross section of the sample, students as
well as professionals are considered. To further diversify students from diverse
streams like Degree College, engineering college and Management College
selected. Initially, professional data collected by online mode by sharing Google
doc link on facebook and Gmail account. Online response was very low and time
consuming so that data collection shifted to offline mode by distributing
questionnaire to the professionals.
Sampling:
Sampling method used in this study is best described as random sampling. To
ensure a true representative sample, data collected from the internet users.
Demographic data collected from professional whose occupation is service and
non-professional without any occupation i.e. students. Students from various
colleges of Mumbai of different stream lime degree, engineering and
management are selected. Then samples were drawn at random from these
demographics keeping convenience in mind to ensure cross section
representation of each.
.
Demographic analysis of sample for this study and its diagrammatic
representation is depicted in the following tables and graphs.

101 | P a g e
Table 1 (Demographic Analysis of Sample)
Students Professional Total
Male 215 139 354
Female 058 079 137
Total 273 218 491
Research questionnaires were sent to different colleges of Mumbai to collect
data from students. Colleges selected were Degree College, Engineering College
and Management College. For professional data collected from the part-time
MBA students and from their acquaintances from the management college.
Prospective respondents were requested to fill up questionnaire and return the
same. The filled up questionnaire received from each respondents and number
of valid responses are indicated in Table 2 The response rate for valid responses
is 81% which is considered to be excellent.
Table 2
No. of questionnaire
sent
No. of questionnaire
received No. of Invalid questionnaire
No. of valid questionnaire
Student 300 283 10 273
Professional 300 223 5 218
600 506 15 491
Sample Size:
491 persons participated in this study. The technique of data analysis used in this
study are examination of differences between independent samples (e.g.

102 | P a g e
between male and female/students and professional), and as well as association
between variables. The total sample size used in this study is 491(n=491). The
demographic analysis of sample is shown in Table 1 and is depicted graphically
in Graph 3 and Graph 4.
Data Collection Method Primary data collected for which the method used for data collection is self-report
questionnaires. The merits of this method are:
i) This method is economical as compared to other methods like interview.
ii) It is free from interviewer‘s bias.
iii) Respondents get adequate time to give well thought out answers.
v) Large samples can be used.
Instrument Development
The objective of the study is to study drivers of viral marketing and to reveal and
validate factors which influence user to receive and forward viral messages. This
study also focuses on to validate the influence of demographic factors on user to
receive and forward messages. The survey questionnaire for this study purpose
is enclosed herewith in with the information of the viral marketing. It is in four
sections, as described below. Ordinal 5 point likert scale is used where
1.Strongly Disagree, 2.Disagree, 3.Neither Disagree Nor Agree, 4.Agree,
5.Strongly Agree.

103 | P a g e
1 Strongly Disagree
2 Disagree
3 Neither Disagree Nor Agree
4 Agree
5 Strongly Agree
Questionnaire is distributed with little information about viral marketing.
Questionnaire is divided into four parts. First part of the questionnaire consists of
questions related to drivers of viral marketing. Drivers which are revealed through
earlier study are access, interest, access and experience.
Second part of the questionnaire consists of questions related to the factors
which are revealed through earlier study are trust, relevance and perceived
benefits and these factors are require to validate to see whether these factors
having any impact or association with intention to open viral messages.
Third part of the questionnaire consists of questions related to the factors which
are revealed through earlier study are tie strength, senders benefit, customer
satisfaction and altruism and these factors are require to validate to see whether
these factors having any impact or association with intention to forward viral
messages.
Fourth part consists of demographic information like name, age, occupation etc.

104 | P a g e
During extensive literature review sequence of attributes have been identified
which are the sequence of drivers of viral marketing. These attributes are
Awareness, Interest and experience. To this sequence one extra attribute is
added that is access to see that whether regular access to internet has
significant impact on user to get experience of viral marketing. Accordingly
questions were asked by considering these four factors which are access,
awareness and interest and experience.
Part I
Questions Factors
Do you get internet access at home, college, workplace? * Access
Are you a member of any Social Networking site like facebook, twitter, linkedin etc.?
Access
Are you aware of the term ―viral marketing‖? * Awareness
Do you visit Social Networking Sites regularly? * Interest
Are You interested in online purchase? * Interest
I always send messages of product/services over social network. *
Interest
I am interested in receiving email or messages from a friend containing a link of product/service which is relevant to me. *
Interest
I found information regarding product/service available on social network is very useful. *
Experience
My decision to purchase product/service is based on the reviews on social network. *
Experience
I gather information about product/service before going for purchase. *
Experience
I always share information over social network which is not related to marketing. *
Experience
Viral marketing technique is very interesting as there is no middle man required to get information about product. *
Experience
Information about product/service can be viewed on internet as per my convenient time. *
Experience
Second part of the study is to reveal and validate factors which influences user to
receive viral messages of product and service. Factors which identified through

105 | P a g e
literature review are trust, relevance and perceived benefits. To check whether
these three factors have significant impact on intention to open/receive viral
messages, questions are developed for each of the factor which is as follows.
Part II Questions Factors
I don‘t open promotional messages which I get because often it is just a spam which I delete without reading.
trust
I don‘t click on product/service link which I get because of security reason.
trust
I open promotional messages of product/service if it is from the social networking group. (e.g. facebook, linkedin, Twitter etc.)
trust
I open promotional messages of product if it is from relatives or friend.
trust
I open promotional messages of product/service if it is from the reputed organization like Sunsilk, Tata Docomo, Idea, FMCG products etc.)
trust
I open promotional messages of product/service if it is from trusted third party.
trust
I open all messages from my acquaintances trust
If I received a message of product/service from someone who is known to me, l surely give it a try.
trust
I open promotional messages of product/service of my interest and relevant to me.
relevance
I don‘t read message of product/service which is not appealing to me
relevance
While reading message of product/service, look of the message is not important to me
relevance
I read messages of service/product of my interest. relevance
If a message of product/service from third party but of my interest I‘ll surely give it a try.
relevance
I read message of product/services which is read by many users.
perceived benefits
I don‘t read message of product/service which is taking too much time for video & text to display.
perceived benefits
I read message of product/service which gives me incentives/reward.
perceived benefits
I don‘t read messages of product/services which required lot of information from user.
perceived benefits

106 | P a g e
Questions Factors
I read all messages which I received. intention to open
I read messages of product/service which I am looking for. intention to open
I read messages of product/services which is simple and easy to use.
intention to open
Third part of the study is to reveal and validate factors which influences user to
forward viral messages of product and service. Factors which identified through
literature review are tie strength, senders benefit, customer satisfaction and
altruism. To check whether these four factors have significant impact on intention
to forward viral messages, questions are developed for each of the factor which
is as follows.
Part II
Questions Factors
I forward message of product/service to only my close associates.
tie strength
I forward message of product/service to get connected with people.
tie strength
I forward message of product/service to all my contacts. senders benefit
I forward message of product/service to get benefit from company
senders benefit
I forward message of service/product which are conditional to provide contact list in order to get information about product/service.
senders benefit
I forward message of service/product which are conditional to get reward from company.
senders benefit
I forward message of product/service just for a fun. customer satisfaction
I forward message of product/service because I am using and satisfied with product/service.
customer satisfaction
I forward message of product/service because I am not using but having good opinion about it.
customer satisfaction

107 | P a g e
Questions Factors
I forward message of product/service just for the receiver‘s benefits.
altruism
I tend to pass along my contacts ‗positive reviews‘ of product/service.
altruism
I tend to pass along my contacts ‗negative reviews‘ of product/service.
altruism
I forward all messages of product/service which I received. intention to forward
I forward only those messages of product/service which is from trusted source.
intention to forward
I forward only those messages of product/service in which receiver is interested.
intention to forward
Following questions are designed for demographic information of user. Part IV
Gender Male Female
Age (years) 16-20 21-30 31-40
41-50 51 and above
Qualification Graduate Post Graduate Others
Profession Student Working
There are certain pitfalls also of this method, as detailed under:
i. Can be used only with educated respondents.
ii. There is a possibility of ambiguous reply or omission of replies altogether
to certain questions.
iii. It is difficult to know whether willing respondents are truly representatives.

108 | P a g e
However, merits of the self-report questionnaire as method of data collection
outweigh its pitfalls. Therefore, the current study employed this method for data
collection using self-report questionnaire.
Tables 3 of Major Constructs and sub variables of the study: Table 3
Drivers of Viral Marketing
Access
Awareness
Interest
Experience
Intention to Open
Trust
Relevance
Perceived Benefits
Intention to Forward
Tie Strength
Senders Benefit
Customer Satisfaction
Altruism
Frequency Table
Table 4
Demographic Characteristics Frequency Percent Valid Percent
Cumulative Percent
Valid Male 354 71.7 72.1 72.1
Female 137 27.7 27.9 100.0
Total 491 99.4 100.0
Missing System 3 .6
Total 494 100.0

109 | P a g e
Graph 3: Gender Distribution of sample
Table 5
Demographic Characteristics Frequency Percent Valid Percent
Cumulative Percent
Valid Student 273 55.3 55.6 55.6
working 218 44.1 44.4 100.0
Total 491 99.4 100.0
Missing System 3 .6
Total 494 100.0
Graph 4: Occupation distribution of Sample
Data processing and analysis, and interpretation of results are presented in
subsequent chapters.

110 | P a g e
Chapter-7
Data Analysis and Hypothesis Testing
Data Analysis:
Data were collected over a six months period and 491internet user, students and
professional, participated in the study. Of these, 354 were males and 137 were
females. Out of 491, 273 were students and 218 were professionals. Thus the
samples represented a broad cross section of gender and occupation profile
which is required for this study.
The data analysis and hypothesis testing were carried out using computer
software package SPSS ver-12. The relevant result outputs of SPSS are
enclosed under various annexure to this chapter.
Reliability of Scale:
Mainly, reliability is a measure of how a scale can be relied on to produce similar
measurements every time we use the scale. Alpha value is depicted in
Annexure-1. Reliability analysis of a scale is performed on the 13 variables
shown in Table 3. Reliability was assessed by calculating Cronbach‘s Alpha, a
measure of internal consistency, for each measured scale. The internal reliability
of these measures was proven to be acceptable.

111 | P a g e
Annexure-1
Reliability Statistics
Cronbach's Alpha N of Items
.878 13
Alpha value shown in Annexure-1 is 0.828 which is considered a “good scale”.
The KMO statistic assesses one of the assumptions of Principle Components
and Factor Analysis – namely whether there appears to be some underlying
(latent) structure in the data (technically referred to as the Factorability of R). This
is also referred to as Sampling Adequacy, or even lack of Sphericity. The KMO
should be .6 or greater, otherwise any results you get may be unreliable (mere
mathematical illusions). KMO value is depicted in Aneexure-2.
Annexure-2
KMO and Bartlett's Test
Kaiser-Meyer-Olkin Measure of Sampling Adequacy. .875
Bartlett's Test of Sphericity Approx. Chi-Square 1986.004
df 78
Sig. .000
KMO value is 0.875 which is considered as ―Meritorious and great‖ and data are
likely to factor well based on correlation and partial correlation.
Bartlett‘s measure tests the null hypothesis that the original correlation matrix is
an identity matrix. For factor analysis to work we need some relationship
between variables and if the R-matrix were an identity matrix then all correlation

112 | P a g e
coefficient would be zero. Therefore, we want this test to be significant (i.e. have
a significance value less than 0.05). A significance test tells us that the R-matrix
is not an identity matrix; therefore, there are some relationships between the
variables we hope to include in the analysis. Fort these data, Bartlett‘s test is
highly significant (p < 0.001) and therefore factor analysis is appropriate.
Construct Validity:
As seen in Annexure-3, the alphas of the total 13 variables ranging from 0.799 to
0.848) which is considered as ―good‖ and Cronbach‘s alpha for the whole section
measures came out to 0.875. Overall analyses suggested instrument of the
research study used for data collection is a reliable instrument.
Annexure-3
Item-Total Statistics
Variables
Scale Mean if
Item Deleted
Scale Variance if
Item Deleted
Corrected Item-Total Correlation
Cronbach's Alpha if
Item Deleted
awareness 34.2844 28.847 -.140 .848
access 34.7498 28.036 .077 .834
interest 33.7467 26.049 .455 .820
experience 32.4511 26.213 .293 .828
trust 32.5922 24.755 .552 .812
relevance 32.4950 24.835 .498 .815
perceived_benefits 32.5570 24.588 .527 .813
intention_to_open 32.6130 24.518 .490 .815
tie_strength 32.9433 21.408 .668 .799
senders_benefit 33.1917 21.946 .639 .802
customer_satisfaction 32.9646 22.213 .672 .799
altruism 32.8438 22.671 .572 .808
intention_to_forward 33.0190 22.422 .588 .807

113 | P a g e
Descriptive Analysis:
Drivers of Viral Marketing
Analysis of Scores of Drivers of Viral Marketing scale (Part-I of Research
Questionnaire): The scores on four variable which are drivers of viral marketing t
was calculated by taking average of individual items on a 5-point scale with 5
representing the strongly agree and 1 representing strongly disagree. The
analysis output of SPSS on these scales is enclosed in Annexure-4.
As can be seen from below SPSS output, the maximum score is on ‗experience‘
(Mean = 3.4199 and standard deviation = 0.59422), and the minimum score is on
‗access‘ (Mean = 1.1212 and standard deviation 0.28226), as summarized below:
Annexure-4
Descriptive Statistics
N Minimum Maximum Mean Std.
Deviation
access 491 1.00 2.00 1.1212 .28226
awareness 491 1.00 2.00 1.5866 .49295
interest 491 1.00 3.25 2.1242 .45101
experience 491 1.67 5.00 3.4199 .59422
Valid N (listwise)
491
Annexure-4 shows, for each of the four variables, the number (N) of participants
with no missing data on that variable. The Valid N (listwise) is the number (491)
who has no missing data on any variable. The table also shows the Minimum and
Maximum score that any participants had on that variable. The table also
provides the Mean or average score for each variable.

114 | P a g e
Factors which influence user to receive viral messages
Analysis of Scores of factors which influence user to receive viral messages
(Part-II of Research Questionnaire): The scores on three variable which are the
factors which influence user to receive viral messages was calculated by taking
average of individual items on a 5-point scale with 5 representing the strongly
agree and 1 representing strongly disagree. The analysis output of SPSS on
these scales is enclosed in Annexure-5.
As can be seen from below SPSS output, the maximum score is on ‗relevance‘
(Mean = 3.3760 and standard deviation = 0.62857), and the minimum score is on
‗trust‘ (Mean = 3.2788 and standard deviation = 0.59050), as summarized below:
Annexure-5
Descriptive Statistics
N Minimum Maximum Mean Std.
Deviation
trust 491 1.25 4.88 3.2788 .59050
relevance 491 1.00 5.00 3.3760 .62857
perceived_benefits 491 1.00 4.83 3.3140 .64040
Valid N (listwise) 491
Annexure-5 shows, for each of the four variables, the number (N) of participants
with no missing data on that variable. The Valid N (listwise) is the number (491)
who has no missing data on any variable. The table also shows the Minimum and
Maximum score that any participants had on that variable. The table also
provides the Mean or average score for each variable.

115 | P a g e
Factors which influence user to forward viral messages
Analysis of Scores of factors which influence user to forward viral messages
(Part-III of Research Questionnaire): The scores on four variable which are the
factors which influence user to forward viral messages was calculated by taking
average of individual items on a 5-point scale with 5 representing the strongly
agree and 1 representing strongly disagree. The analysis output of SPSS on
these scales is enclosed in Annexure-6.
As can be seen from below SPSS output, the maximum score is on ‗altruism‘
(Mean = 3.0272 and standard deviation = 0.89503), and the minimum score is on
‗senders benefit‘ (Mean = 2.6792 and standard deviation = 0.92635), as
summarized below:
Annexure-6
Descriptive Statistics
N Minimum Maximum Mean Std.
Deviation
tie_strength 492 1.00 5.00 2.9277 .96969
senders_benefit 491 1.00 5.00 2.6792 .92635
customer_satisfaction 491 1.00 5.00 2.9063 .85306
altruism 491 1.00 5.00 3.0272 .89503
Valid N (listwise) 491
Annexure-6 shows, for each of the four variables, the number (N) of participants
with no missing data on that variable. The Valid N (listwise) is the number (491)
who has no missing data on any variable. The table also shows the Minimum and
Maximum score that any participants had on that variable. The table also
provides the Mean or average score for each variable.

116 | P a g e
Hypothesis Testing:
Hypothesis testing is carried out with the help of SPSS package. For each
hypothesis, the detailed discussion is as under.
Hypothesis 1: Access has significant impact on experiences of viral marketing.
A Pearson product-moment correlation was run to determine the relationship
between access and experience of viral marketing. The data showed in
annexure-7 no violation of normality, linearity or homoscedasticity. There is a
negative correlation between access and experience which is statistically not
significant (r = -0.082, n = 491, value of P = 0.070 where P > .0005).
Annexure-7 Correlations between Access and Experiences of viral Marketing
access
experience
Pearson Correlation -.082
Sig. (2-tailed) .070
N 491
Hypothesis 1 is rejected as there is no significant impact on experiences of viral
marketing.
Hypothesis 2: Awareness has significant impact on experiences of viral
marketing.
A Pearson product-moment correlation was run to determine the relationship
between awareness and experiences of viral marketing. The data showed in
Annexure-8 no violation of normality, linearity or homoscedasticity. There was a

117 | P a g e
strong, positive correlation between awareness and experiences of viral
marketing which was statistically significant (r = -0.161, n = 491, value of P =
0.000 where P < .0005).
Annexure-8 Correlations between Awareness and Experiences of Viral Marketing
Awareness
experience
Pearson Correlation -.161(**)
Sig. (2-tailed) .000
N 491
** Correlation is significant at the 0.01 level (2-tailed).
From above data It is summarized that Hypothesis 2 is accepted that awareness
does have significant impact on experiences of viral marketing.
Hypothesis 3: Interest has significant impact on experiences of viral marketing.
A Pearson product-moment correlation was run to determine the relationship
between awareness and experiences of viral marketing. The data showed in
Annexure-9 no violation of normality, linearity or homoscedasticity. There was a
strong, positive correlation between awareness and experiences of viral
marketing which was statistically significant (r = 0.289, n = 491, value of P =
0.000 where P < .0005).
Annexure-9 Correlations between Interest and Experiences of Viral Marketing
Interest
Experience
Pearson Correlation .289(**)
Sig. (2-tailed) .000
N 491
** Correlation is significant at the 0.01 level (2-tailed).
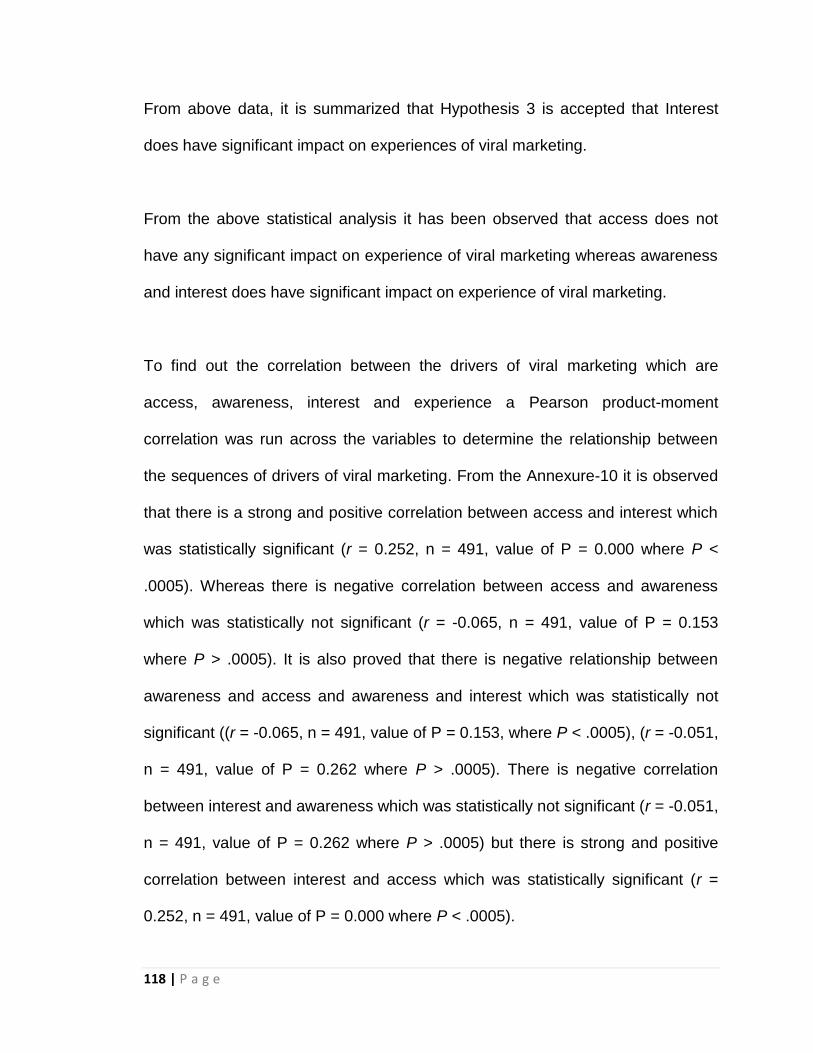
118 | P a g e
From above data, it is summarized that Hypothesis 3 is accepted that Interest
does have significant impact on experiences of viral marketing.
From the above statistical analysis it has been observed that access does not
have any significant impact on experience of viral marketing whereas awareness
and interest does have significant impact on experience of viral marketing.
To find out the correlation between the drivers of viral marketing which are
access, awareness, interest and experience a Pearson product-moment
correlation was run across the variables to determine the relationship between
the sequences of drivers of viral marketing. From the Annexure-10 it is observed
that there is a strong and positive correlation between access and interest which
was statistically significant (r = 0.252, n = 491, value of P = 0.000 where P <
.0005). Whereas there is negative correlation between access and awareness
which was statistically not significant (r = -0.065, n = 491, value of P = 0.153
where P > .0005). It is also proved that there is negative relationship between
awareness and access and awareness and interest which was statistically not
significant ((r = -0.065, n = 491, value of P = 0.153, where P < .0005), (r = -0.051,
n = 491, value of P = 0.262 where P > .0005). There is negative correlation
between interest and awareness which was statistically not significant (r = -0.051,
n = 491, value of P = 0.262 where P > .0005) but there is strong and positive
correlation between interest and access which was statistically significant (r =
0.252, n = 491, value of P = 0.000 where P < .0005).

119 | P a g e
Annexure-10
Access Awareness Interest experience
Access
Pearson Correlation 1 -.065 .252(**) -.082
Sig. (2-tailed) . .153 .000 .070
N 491 491 491 491
Awareness
Pearson Correlation -.065 1 -.051 -.161(**)
Sig. (2-tailed) .153 . .262 .000
N 491 491 491 491
Interest
Pearson Correlation .252(**) -.051 1 .289(**)
Sig. (2-tailed) .000 .262 . .000
N 491 491 491 491
Experience
Pearson Correlation -.082 -.161(**) .289(**) 1
Sig. (2-tailed) .070 .000 .000 .
N 491 491 491 491
** Correlation is significant at the 0.01 level (2-tailed).
Hypothesis 4: Trusted source has significant impact on user to receive viral
messages.
The overall multiple regression model which is depicted in Annexure-11 was
found to be significant (2
.AdjR . = .244), F (3, 491) = 53.729, p < .001. Trusted
source (β = 0.149, t = 2.552, p < .05) were found to be having significant impact
on user to receive viral messages. Therefore Hypothesis 4 is accepted that
trusted source has significant impact on user to receive viral messages.
Hypothesis 5: Trusted source has significant impact on user to receive viral
messages with respect to gender.
The independent sample t-test is carried out to see the impact of independent
variable which is trusted source on the intention to open/receive viral messages
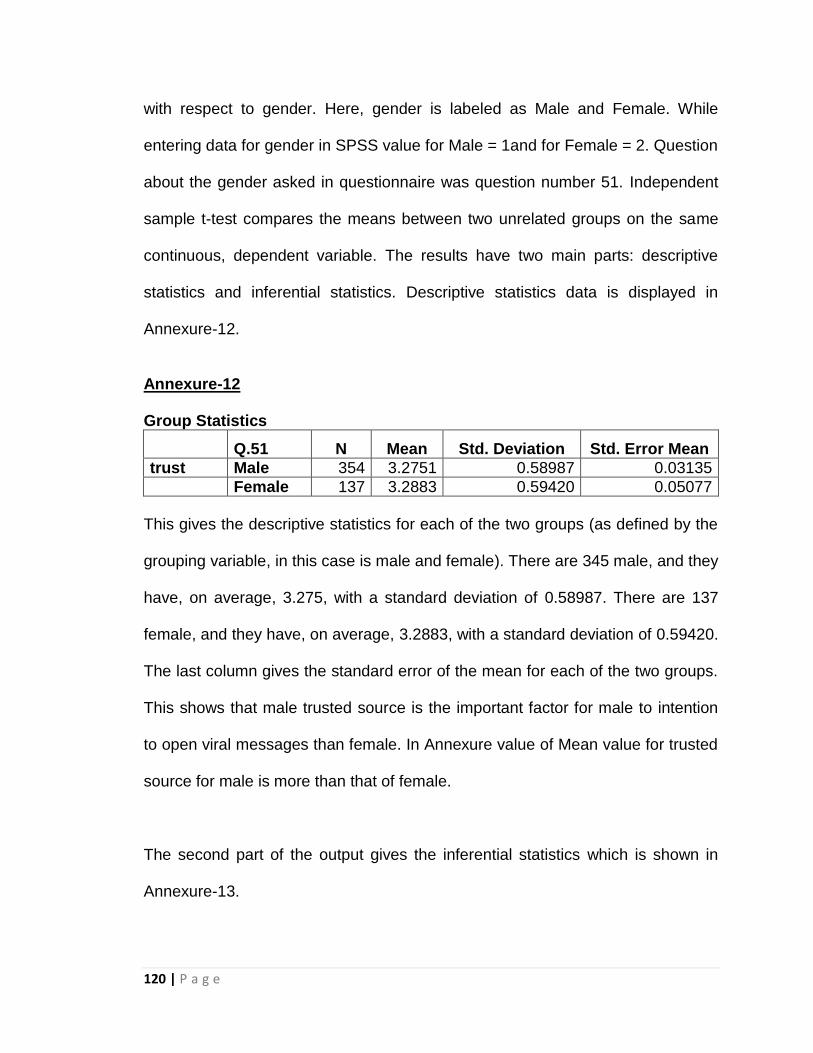
120 | P a g e
with respect to gender. Here, gender is labeled as Male and Female. While
entering data for gender in SPSS value for Male = 1and for Female = 2. Question
about the gender asked in questionnaire was question number 51. Independent
sample t-test compares the means between two unrelated groups on the same
continuous, dependent variable. The results have two main parts: descriptive
statistics and inferential statistics. Descriptive statistics data is displayed in
Annexure-12.
Annexure-12 Group Statistics
Q.51 N Mean Std. Deviation Std. Error Mean
trust Male 354 3.2751 0.58987 0.03135
Female 137 3.2883 0.59420 0.05077
This gives the descriptive statistics for each of the two groups (as defined by the
grouping variable, in this case is male and female). There are 345 male, and they
have, on average, 3.275, with a standard deviation of 0.58987. There are 137
female, and they have, on average, 3.2883, with a standard deviation of 0.59420.
The last column gives the standard error of the mean for each of the two groups.
This shows that male trusted source is the important factor for male to intention
to open viral messages than female. In Annexure value of Mean value for trusted
source for male is more than that of female.
The second part of the output gives the inferential statistics which is shown in
Annexure-13.

121 | P a g e
Annexure-13
Independent Samples Test
Trusted Source
Equal variance assumed
Equal variance not
assumed
Levene‘s Test for Equality of Variances
F Sig.
0.166
0.684
t-test for Equality of Means
T -0.233 -0.222
Df 489 245.748
Sig. (2-tailed) 0.824 0.824
Mean Difference -0.01325 -0.01325
Std. Error Difference 0.05947 0.05967
95% Confidence Interval Lower of the Difference Upper
-0.13011 -0.13077
-0.10360 -0.10427
From the Annexure-13 it is assumed that Sig. (2-tailed) value is 0.824 is not less
than or equal to .05, so we fail to reject null hypothesis. This implies that we
failed to observe impact of independent variable trusted source on intention to
open/receive viral messages with respect to gender. A t test failed to reveal a
statistically reliable difference between the mean of trusted source that male has
(M = 3.2751, s = 0. .58987) and that the female has (M = 3.2883, s = 0. .59420),
t(489) = 0.233, p = 0.824, α = .05. It proves that independent variable trusted
source does not have any impact on dependent variable i.e. intention to open
viral messages with respect to gender. Gender was not considered as a
contributing factor in further examinations of intention to receive viral messages.
Therefore hypothesis 5 is rejected as there is no significant impact of trusted
source on intention to open/receive viral messages with respect to gender.

122 | P a g e
Hypothesis 6: Trusted source has significant impact on user to receive viral
messages with respect to occupation.
The independent sample t-test is carried out to see the impact of independent
variable which is trusted source on the intention to open/receive viral messages
with respect to occupation. Here, occupation is labeled as student and working
professional. While entering data for occupation in SPSS value for student =
1and for working professional = 2. Question about the occupation asked in
questionnaire was question number 54. Independent sample t-test compares the
means between two unrelated groups on the same continuous, dependent
variable. The results have two main parts: descriptive statistics and inferential
statistics. Descriptive statistics data is displayed in Annexure-14.
Annexure-14 Group Statistics
Q.51 N Mean Std. Deviation Std. Error Mean
trust Student 273 3.2376 0.60370 0.03654
Working 218 3.3303 0.57075 0.03866
This gives the descriptive statistics for each of the two groups (as defined by the
grouping variable, in this case is male and female). There are 273 students, and
they have, on average, 3.2376, with a standard deviation of 0.60370. There are
218 working professional, and they have, on average, 3.3303, with a standard
deviation of 0.57075. The last column gives the standard error of the mean for
each of the two groups. Above table shows that trusted source to viral messages
is important factor for working professionals that the students.
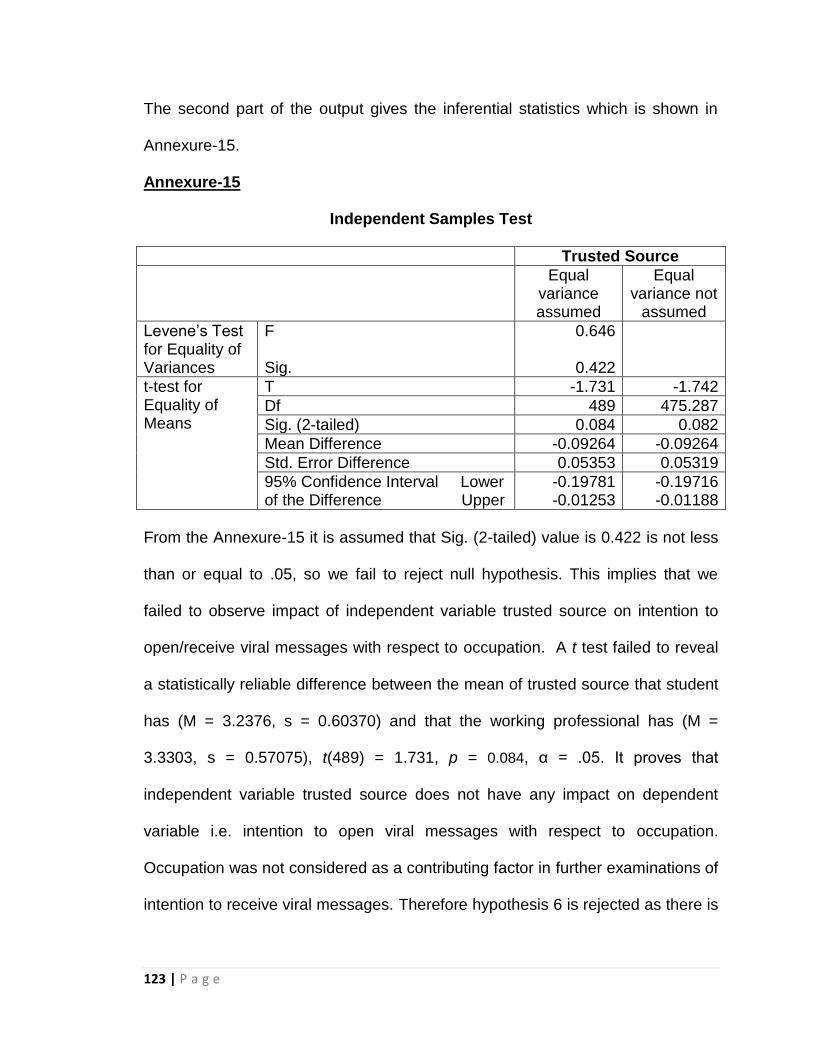
123 | P a g e
The second part of the output gives the inferential statistics which is shown in
Annexure-15.
Annexure-15
Independent Samples Test
Trusted Source
Equal variance assumed
Equal variance not
assumed
Levene‘s Test for Equality of Variances
F Sig.
0.646
0.422
t-test for Equality of Means
T -1.731 -1.742
Df 489 475.287
Sig. (2-tailed) 0.084 0.082
Mean Difference -0.09264 -0.09264
Std. Error Difference 0.05353 0.05319
95% Confidence Interval Lower of the Difference Upper
-0.19781 -0.01253
-0.19716 -0.01188
From the Annexure-15 it is assumed that Sig. (2-tailed) value is 0.422 is not less
than or equal to .05, so we fail to reject null hypothesis. This implies that we
failed to observe impact of independent variable trusted source on intention to
open/receive viral messages with respect to occupation. A t test failed to reveal
a statistically reliable difference between the mean of trusted source that student
has (M = 3.2376, s = 0.60370) and that the working professional has (M =
3.3303, s = 0.57075), t(489) = 1.731, p = 0.084, α = .05. It proves that
independent variable trusted source does not have any impact on dependent
variable i.e. intention to open viral messages with respect to occupation.
Occupation was not considered as a contributing factor in further examinations of
intention to receive viral messages. Therefore hypothesis 6 is rejected as there is

124 | P a g e
no significant impact of trusted source on intention to open/receive viral
messages with respect to occupation.
Hypothesis 7: Message relevance has significant impact on receiving viral
messages.
The overall multiple regression model which is depicted in Annexure-11 was
found to be significant (2
.AdjR = .244), F (3, 491) = 53.729, p < .001. Trusted
source (β = 0.219, t = 4.036, p < .05) were found to be having significant impact
on user to receive viral messages. Therefore Hypothesis 7 is accepted that
message relevance has significant impact on user to receive viral messages.
Hypothesis 8: Message relevance has significant impact on receiving viral
messages with respect to gender.
The independent sample t-test is carried out to see the impact of independent
variable which is message relevance on the intention to open/receive viral
messages with respect to gender. The results have two main parts: descriptive
statistics and inferential statistics. Descriptive statistics data is displayed in
Annexure-16.
Annexure-16 Group Statistics
Q.51 N Mean Std. Deviation Std. Error Mean
Relevance Male 354 3.3870 0.63205 0.03359
Female 137 3.3474 0.62085 0.05304

125 | P a g e
This gives the descriptive statistics for each of the two groups (as defined by the
grouping variable, in this case is male and female). There are 354 male, and they
have, on average, 3.3870, with a standard deviation of 0.63205. There are 137
female, and they have, on average3.3474, with a standard deviation of 0.62085.
The last column gives the standard error of the mean for each of the two groups.
This shows that message relevance is important factor for male to open viral
messages than female.
The second part of the output gives the inferential statistics which is shown in
Annexure-17.
Annexure-17
Independent Samples Test
Message relevance
Equal variance assumed
Equal variance not
assumed
Levene‘s Test for Equality of Variances
F Sig.
0.335
0.563
t-test for Equality of Means
t 0.625 0.630
df 489 251.397
Sig. (2-tailed) 0.532 0.529
Mean Difference 0.03956 0.03956
Std. Error Difference 0.06328 0.06279
95% Confidence Interval Lower of the Difference Upper
-0.08478 0.16390
-0.08409 0.06321
From the Annexure-17 it is assumed that Sig. (2-tailed) value is 0.532 is not less
than or equal to .05, so we fail to reject null hypothesis. This implies that we
failed to observe impact of independent variable message relevance on intention
to open/receive viral messages with respect to gender. A t test failed to reveal a

126 | P a g e
statistically reliable difference between the mean of message relevance that male
has (M = 3.3870, s 0.63205) and that the female has (M = 3.3474, s = 0.57075),
t(489) = 0.625, p = 0.532, α = .05. It proves that independent variable message
relevance does not have any impact on dependent variable i.e. intention to open
viral messages with respect to gender. Gender was not considered as a
contributing factor in further examinations of intention to receive viral messages.
Therefore hypothesis 8 is rejected as there is no significant impact of message
relevance on intention to open/receive viral messages with respect to gender.
Hypothesis 9: Message relevance has significant impact on receiving viral
messages with respect to occupation.
The independent sample t-test is carried out to see the impact of independent
variable which is message relevance on the intention to open/receive viral
messages with respect to occupation. The results have two main parts:
descriptive statistics and inferential statistics. Descriptive statistics data is
displayed in Annexure-18.
Annexure-16 Group Statistics
Q.51 N Mean Std. Deviation Std. Error Mean
Relevance Student 273 3.3084 0.62353 0.03774
Working 218 3.4606 0.62601 0.04240
This gives the descriptive statistics for each of the two groups (as defined by the
grouping variable, in this case is student and working professional). There are

127 | P a g e
273 students, and they have, on average, 3.3084, with a standard deviation of
0.62353. There are 218 working professionals, and they have, on average 3.4606
with a standard deviation of 0.62601. The last column gives the standard error of
the mean for each of the two groups. This shows that message relevance is
important factor for working professionals open viral messages than students.
The second part of the output gives the inferential statistics which is shown in
Annexure-19.
Annexure-19
Independent Samples Test
Message relevance
Equal variance assumed
Equal variance not
assumed
Levene‘s Test for Equality of Variances
F Sig.
0.932
0.335
t-test for Equality of Means
t -2.681 -2.680
df 489 464.457
Sig. (2-tailed) 0.008 0.005
Mean Difference -0.15213 -0.15213
Std. Error Difference 0.05674 0.05676
95% Confidence Interval Lower of the Difference Upper
-0.26360 -0.04065
-0.26367 -0.04059
From the Annexure-19 it is assumed that Sig. (2-tailed) value is 0.008 is less
than, so we fail to accept null hypothesis. This implies that independent variable
message relevance has significant impact on intention to open/receive viral
messages with respect to occupation. A t test reveal a statistically reliable
difference between the mean of message relevance that student has (M =
3.3084, s 0.62353) and that the working professional has (M = 3.4606, s =

128 | P a g e
0.62601), t(489) = -2.681, p = 0.008, α = .05. It proves that independent variable
message relevance have impact on dependent variable i.e. intention to open viral
messages with respect to occupation. Occupation was considered as a
contributing factor in further examinations of intention to receive viral messages.
Therefore hypothesis 9 is accepted as there is significant impact of message
relevance on intention to open/receive viral messages with respect to occupation.
Hypothesis 10: Perceived Benefits has significant impact on user to receive viral
messages.
The overall multiple regression model which is depicted in Annexure-11 was
found to be significant (2
.AdjR . = .244), F (3, 491) = 53.729, p < .001. Perceived
benefits (β = 0.303, t = 6.069, p < .05) were found to be having significant impact
on user to receive viral messages. Therefore Hypothesis 10 is accepted that
perceived benefits has significant impact on user to receive viral messages.
Hypothesis 11: Perceived benefit has significant impact on user to receive viral
messages with respect to gender.
The independent sample t-test is carried out to see the impact of independent
variable which is perceived benefits on the intention to open/receive viral
messages with respect to gender. Independent sample t-test compares the
means between two unrelated groups on the same continuous, dependent
variables. The results have two main parts: descriptive statistics and inferential
statistics. Descriptive statistics data is displayed in Annexure-20.

129 | P a g e
Annexure-20 Group Statistics
Q.51 N Mean Std. Deviation Std. Error Mean
Perceived benefit
Male 354 3.3239 0.63541 0.03377
Female 137 3.2883 0.65477 0.05594
This gives the descriptive statistics for each of the two groups (as defined by the
grouping variable, in this case is male and female). There are 345 male, and they
have, on average, 3.3239, with a standard deviation of 0.63541. There are 137
female, and they have, on average, 3.2883, with a standard deviation of 0.65477.
The last column gives the standard error of the mean for each of the two groups.
This shows that for male perceived benefits is the important factor to intention to
open viral messages than female. The second part of the output gives the
inferential statistics which is shown in Annexure-21
Annexure-21 Independent Samples Test
Perceived Benefits
Equal variance assumed
Equal variance not
assumed
Levene‘s Test for Equality of Variances
F Sig.
0.361
0.549
t-test for Equality of Means
t 0.552 0.549
df 489 245.748
Sig. (2-tailed) 0.581 0.586
Mean Difference 0.03560 0.03560
Std. Error Difference 0.06448 0.06534
95% Confidence Interval Lower of the Difference Upper
-0.09110 -0.09312
0.16229 0.16432

130 | P a g e
From the Annexure-21 it is assumed that Sig. (2-tailed) value is 0.581 is not less
than or equal to .05, so we fail to reject null hypothesis. This implies that we
failed to observe impact of independent variable trusted source on intention to
open/receive viral messages with respect to gender. A t test failed to reveal a
statistically reliable difference between the mean of perceived benefit that male
has (M = 3.3239, s = 0.63541) and that the female has (M = 3.2883, s =
0.65477), t(489) = 0.552, p = 0.581, α = .05. It proves that independent variable
perceived benefit does not have any impact on dependent variable i.e. intention
to open viral messages with respect to gender. Gender was not considered as a
contributing factor in further examinations of intention to receive viral messages.
Therefore hypothesis 11 is rejected as there is no significant impact of trusted
source on intention to open/receive viral messages with respect to gender.
Hypothesis 12: perceived benefit has significant impact on user to receive viral
messages with respect to occupation.
The independent sample t-test is carried out to see the impact of independent
variable which is perceived benefit on the intention to open/receive viral
messages with respect to occupation. Independent sample t-test compares the
means between two unrelated groups on the same continuous, dependent
variable. The results have two main parts: descriptive statistics and inferential
statistics. Descriptive statistics data is displayed in Annexure-22.

131 | P a g e
Annexure-22 Group Statistics
Q.51 N Mean Std.
Deviation Std. Error Mean
Perceived benefit
Student 273 3.2845 0.64062 0.03877
Working 218 3.3509 0.63968 0.04332
There are 273 students, and they have, on average, 3.2845, with a standard
deviation of 0.64062. There are 218 working professional, and they have, on
average, 3.3509, with a standard deviation of 0.63968. The last column gives the
standard error of the mean for each of the two groups. Above table shows that
perceived benefits is important factor for working professionals that the students.
The second part of the output gives the inferential statistics which is shown in
Annexure-23
Annexure-23
Independent Samples Test
Perceived Benefits
Equal variance assumed
Equal variance not
assumed
Levene‘s Test for Equality of Variances
F Sig.
0.001
0.979
t-test for Equality of Means
t -1.142 -1.142
df 489 465.544
Sig. (2-tailed) 0.254 0.254
Mean Difference -0.06642 -0.06642
Std. Error Difference 0.05815 0.05814
95% Confidence Interval Lower of the Difference Upper
-0.18068 -0.18067
0.04783 0.04783
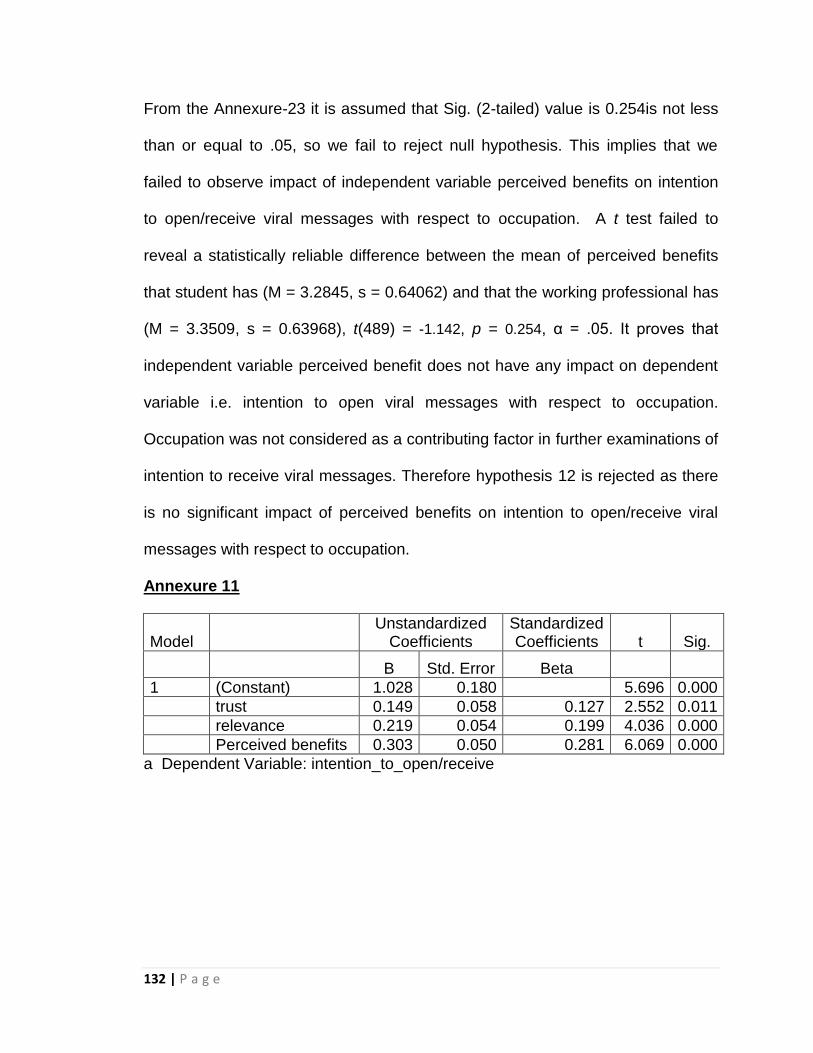
132 | P a g e
From the Annexure-23 it is assumed that Sig. (2-tailed) value is 0.254is not less
than or equal to .05, so we fail to reject null hypothesis. This implies that we
failed to observe impact of independent variable perceived benefits on intention
to open/receive viral messages with respect to occupation. A t test failed to
reveal a statistically reliable difference between the mean of perceived benefits
that student has (M = 3.2845, s = 0.64062) and that the working professional has
(M = 3.3509, s = 0.63968), t(489) = -1.142, p = 0.254, α = .05. It proves that
independent variable perceived benefit does not have any impact on dependent
variable i.e. intention to open viral messages with respect to occupation.
Occupation was not considered as a contributing factor in further examinations of
intention to receive viral messages. Therefore hypothesis 12 is rejected as there
is no significant impact of perceived benefits on intention to open/receive viral
messages with respect to occupation.
Annexure 11
Model Unstandardized
Coefficients Standardized Coefficients t Sig.
B Std. Error Beta
1 (Constant) 1.028 0.180 5.696 0.000
trust 0.149 0.058 0.127 2.552 0.011
relevance 0.219 0.054 0.199 4.036 0.000
Perceived benefits 0.303 0.050 0.281 6.069 0.000
a Dependent Variable: intention_to_open/receive

133 | P a g e
Hypothesis 13: Tie strength has significant impact on user to forward viral
messages.
The overall multiple regression model which is depicted in Annexure-24 was
found to be significant (2
.AdjR . = 0.423), F (4, 490) = 90.742, p < .001. Tie
strength (β = 0.312, t = 6.983, p < .05) were found to be having significant impact
on user to forward viral messages. Therefore Hypothesis 13 is accepted that tie
strength has significant impact on user to forward viral messages.
Annexure 24
Unstandardized
Coefficients Standardized Coefficients t Sig.
B Std. Error Beta
(Constant) 0.755 0.129 5.842 0.000
tie_strength 0.312 0.045 0.331 6.983 0.000
senders_benefit 0.304 0.046 0.308 6.563 0.000
customer_satisfaction 0.100 0.052 0.093 1.909 0.057
altruism 0.026 0.042 0.025 0.613 0.540
a Dependent Variable: intention_to_forward
Hypothesis 14: Tie strength has significant impact on user to forward viral
messages with respect to gender.
The independent sample t-test is carried out to see the impact of independent
variable which is tie strength on the intention to forward viral messages with
respect to gender. Independent sample t-test compares the means between two
unrelated groups on the same continuous, dependent variables. The results have
two main parts: descriptive statistics and inferential statistics. Descriptive
statistics data is displayed in Annexure-25.

134 | P a g e
Annexure-25
Group Statistics
Q.51 N Mean Std. Deviation Std. Error Mean
Tie Strength Male 354 2.9689 0.97513 0.05183
Female 137 2.8212 0.95436 0.08154
This gives the descriptive statistics for each of the two groups (as defined by the
grouping variable, in this case is male and female). There are 345 male, and they
have, on average, 2.9689, with a standard deviation of 0.97513. There are 137
female, and they have, on average, 2.8212, with a standard deviation of 0.95436.
The last column gives the standard error of the mean for each of the two groups.
This shows that for male tie strength is the important factor to intention to forward
viral messages than female. The second part of the output gives the inferential
statistics which is shown in Annexure-26
Annexure-26
Independent Samples Test
Tie Strength
Equal variance assumed
Equal variance not
assumed
Levene‘s Test for Equality of Variances
F Sig.
0.366
0.545
t-test for Equality of Means
t 1.515 1.529
df 489 252.235
Sig. (2-tailed) 0.130 0.127
Mean Difference 0.14776 0.14776
Std. Error Difference 0.09754 0.09661
95% Confidence Interval Lower of the Difference Upper
-0.04389 -0.04251
0.33941 0.33803
From the Annexure-26 it is assumed that Sig. (2-tailed) value is 0.130 is not less

135 | P a g e
than or equal to .05, so we fail to reject null hypothesis. This implies that we
failed to observe impact of independent variable tie strength on intention to
forward viral messages with respect to gender. A t test failed to reveal a
statistically reliable difference between the mean of tie strength that male has (M
= 2.9689, s = 0.97513) and that the female has (M = 2.8212, s = 0.95436), t(489)
= 1.515, p = 0.130, α = .05. It proves that independent variable tie strength does
not have any impact on dependent variable i.e. intention to forward viral
messages with respect to gender. Gender was not considered as a contributing
factor in further examinations of intention to forward viral messages. Therefore
hypothesis 14 is rejected as there is no significant impact of tie strength on
intention to forward viral messages with respect to gender.
Hypothesis 15: Tie strength has significant impact on user to receive viral
messages with respect to occupation.
The independent sample t-test is carried out to see the impact of independent
variable which is tie strength on the intention to forward viral messages with
respect to occupation. Independent sample t-test compares the means between
two unrelated groups on the same continuous, dependent variable. The results
have two main parts: descriptive statistics and inferential statistics. Descriptive
statistics data is displayed in Annexure-27.
Annexure-27 Group Statistics
Q.54 N Mean Std. Deviation Std. Error Mean
Tie strength student 273 2.8388 0.96140 0.05819
working 218 3.0390 0.97295 0.06590
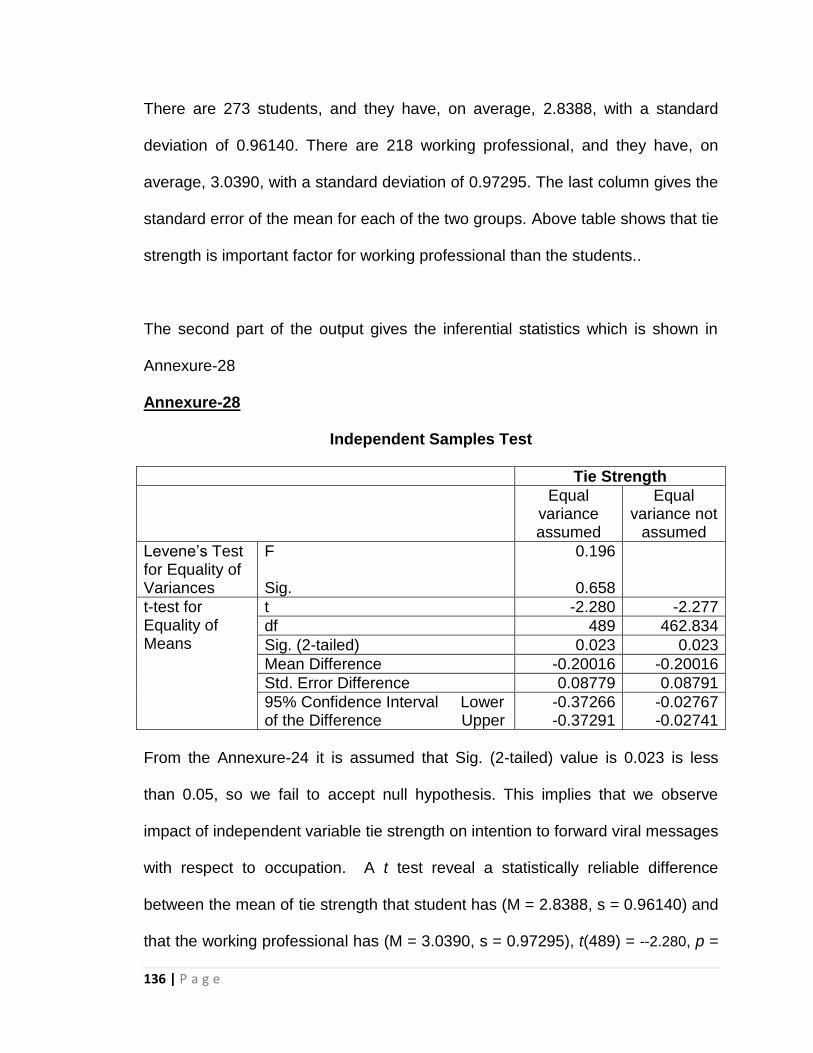
136 | P a g e
There are 273 students, and they have, on average, 2.8388, with a standard
deviation of 0.96140. There are 218 working professional, and they have, on
average, 3.0390, with a standard deviation of 0.97295. The last column gives the
standard error of the mean for each of the two groups. Above table shows that tie
strength is important factor for working professional than the students..
The second part of the output gives the inferential statistics which is shown in
Annexure-28
Annexure-28
Independent Samples Test
Tie Strength
Equal variance assumed
Equal variance not
assumed
Levene‘s Test for Equality of Variances
F Sig.
0.196
0.658
t-test for Equality of Means
t -2.280 -2.277
df 489 462.834
Sig. (2-tailed) 0.023 0.023
Mean Difference -0.20016 -0.20016
Std. Error Difference 0.08779 0.08791
95% Confidence Interval Lower of the Difference Upper
-0.37266 -0.37291
-0.02767 -0.02741
From the Annexure-24 it is assumed that Sig. (2-tailed) value is 0.023 is less
than 0.05, so we fail to accept null hypothesis. This implies that we observe
impact of independent variable tie strength on intention to forward viral messages
with respect to occupation. A t test reveal a statistically reliable difference
between the mean of tie strength that student has (M = 2.8388, s = 0.96140) and
that the working professional has (M = 3.0390, s = 0.97295), t(489) = --2.280, p =

137 | P a g e
0.023, α = .05. It proves that independent variable tie strength has impact on
dependent variable i.e. intention to forward viral messages with respect to
occupation. Occupation was considered as a contributing factor in further
examinations of intention to forward viral messages. Therefore hypothesis 15 is
accepted as there is significant impact of tie strength on intention to forward viral
messages with respect to occupation.
Hypothesis 16: Sender‘s benefit has significant impact on user to forward viral
messages.
The overall multiple regression model which is depicted in Annexure-24 was
found to be significant (2
.AdjR . = 0.423), F (4, 490) = 90.742, p < .001. Sender‘s
Benefit (β = 0.304, t = 6.563, p < .05) were found to be having significant impact
on user to forward viral messages. Therefore Hypothesis 16 is accepted that
Sender‘s benefit has significant impact on user to forward viral messages.
Hypothesis 17: Sender‘s benefit has significant impact on user to forward viral
messages with respect to gender.
The independent sample t-test is carried out to see the impact of independent
variable which is sender‘s benefit on the intention to forward viral messages with
respect to gender. Independent sample t-test compares the means between two
unrelated groups on the same continuous, dependent variables. The results have
two main parts: descriptive statistics and inferential statistics. Descriptive
statistics data is displayed in Annexure-29.

138 | P a g e
Annexure-29 Group Statistics
Q.51 N Mean Std. Deviation Std. Error Mean
senders_benefit Male 354 2.6850 0.90932 0.04833
Female 137 2.6642 0.97224 0.08306
This gives the descriptive statistics for each of the two groups (as defined by the
grouping variable, in this case is male and female). There are 345 male, and they
have, on average, 2.6850, with a standard deviation of 0.90932. There are 137
female, and they have, on average, 2.6642, with a standard deviation of 0.97224.
The last column gives the standard error of the mean for each of the two groups.
This shows that for male sender‘s benefit is the important factor to intention to
forward viral messages than female. The second part of the output gives the
inferential statistics which is shown in Annexure-30.
Annexure-30
Independent Samples Test
Sender’s Benefit
Equal variance assumed
Equal variance not
assumed
Levene‘s Test for Equality of Variances
F Sig.
0.632
0.427
t-test for Equality of Means
t 0.223 0.216
df 489 233.363
Sig. (2-tailed) 0.824 0.829
Mean Difference 0.02079 0.02079
Std. Error Difference 0.09330 0.09610
95% Confidence Interval Lower of the Difference Upper
-0.16252 0.20411
-0.16854 0.21013
From the Annexure-30 it is assumed that Sig. (2-tailed) value is 0.824 is not less
than or equal to .05, so we fail to reject null hypothesis. This implies that we

139 | P a g e
failed to observe impact of independent variable sender‘s benefit on intention to
forward viral messages with respect to gender. A t test failed to reveal a
statistically reliable difference between the mean of sender‘s benefit that male
has (M = 2.6850, s = 0.90932) and that the female has (M = 2.6642, s =
0.97224), t(489) = 0.223, p = 0.824, α = .05. It proves that independent variable
sender‘s benefit does not have any impact on dependent variable i.e. intention to
forward viral messages with respect to gender. Gender was not considered as a
contributing factor in further examinations of intention to forward viral messages.
Therefore hypothesis 17 is rejected as there is no significant impact of sender‘s
benefit on intention to forward viral messages with respect to gender.
Hypothesis 18: Sender‘s benefit has significant impact on user to forward viral
messages with respect to occupation.
The independent sample t-test is carried out to see the impact of independent
variable which is sender‘s benefit on the intention to forward viral messages with
respect to occupation. Independent sample t-test compares the means between
two unrelated groups on the same continuous, dependent variable. The results
have two main parts: descriptive statistics and inferential statistics. Descriptive
statistics data is displayed in Annexure-31.
Annexure-31 Group Statistics
Q.54 N Mean Std.
Deviation
Std. Error Mean
Sender‘s Benefit student 273 2.6593 0.91242 0.05522
working 218 2.7041 0.94501 0.06400

140 | P a g e
There are 273 students, and they have, on average, 2.6593, with a standard
deviation of 0.91242. There are 218 working professional, and they have, on
average, 2.7041, with a standard deviation of 0.94501. Above table shows that
sender‘s benefit is important factor for working professional than students.
The second part of the output gives the inferential statistics which is shown in
Annexure-32
Annexure-32
Independent Samples Test
Sender’s Benefit
Equal variance assumed
Equal variance not
assumed
Levene‘s Test for Equality of Variances
F Sig.
0.012
0.912
t-test for Equality of Means
t -0.532 -0.530
df 489 457.892
Sig. (2-tailed) 0.595 0.596
Mean Difference -0.04479 -0.04479
Std. Error Difference 0.08420 0.08453
95% Confidence Interval Lower of the Difference Upper
-0.21023 0.12065
-0.21091 0.12134
From the Annexure-32 it is assumed that Sig. (2-tailed) value is 0.595 is not less
than 0.05, so we fail to reject null hypothesis. This implies that we observe no
impact of independent variable sender‘s benefit on intention to forward viral
messages with respect to occupation. A t test reveal a statistically reliable
difference between the mean of sender‘s benefit that student has (M = 2.6593, s
= 0.91242) and that the working professional has (M = 2.7041, s = 0.94501),
t(489) = -0.532, p = 0.595, α = .05. It proves that independent variable sender‘s

141 | P a g e
benefit has no impact on dependent variable i.e. intention to forward viral
messages with respect to occupation. Occupation was not considered as a
contributing factor in further examinations of intention to forward viral messages.
Therefore hypothesis 18 is rejected as there is no significant impact of sender‘s
benefit on intention to forward viral messages with respect to occupation.
Hypothesis 19: Customer Satisfaction has significant impact on user to forward
viral messages.
The overall multiple regression model which is depicted in Annexure-24 was
found to be significant (2
.AdjR . = 0.423), F (4, 490) = 90.742, p > .001. Customer
satisfaction (β = 0.100, t = 1.909, p > .05) were found to be having significant no
impact on user to forward viral messages. Therefore Hypothesis 19 is rejected
that customer satisfaction has no significant impact on user to forward viral
messages.
Hypothesis 20: Customer Satisfaction has significant impact on user to forward
viral messages with respect to gender.
The independent sample t-test is carried out to see the impact of independent
variable which is customer satisfaction on the intention to forward viral messages
with respect to gender. Independent sample t-test compares the means between
two unrelated groups on the same continuous, dependent variables. The results
have two main parts: descriptive statistics and inferential statistics. Descriptive
statistics data is displayed in Annexure-33.

142 | P a g e
Annexure-33 Group Statistics
Q.51 N Mean Std. Deviation Std. Error
Mean
Customer Satisfaction Male 354 2.9360 0.86606 0.04603
Female 137 2.8297 0.81661 0.06977
This gives the descriptive statistics for each of the two groups (as defined by the
grouping variable, in this case is male and female). There are 345 male, and they
have, on average, 2.9360, with a standard deviation of 0.86606. There are 137
female, and they have, on average, 2.8297, with a standard deviation of 0.81661.
The last column gives the standard error of the mean for each of the two groups.
This shows that for male customer satisfaction is the important factor to intention
to forward viral messages than female. The second part of the output gives the
inferential statistics which is shown in Annexure-34.
Annexure-34
Independent Samples Test
Customer Satisfaction
Equal variance assumed
Equal variance not
assumed
Levene‘s Test for Equality of Variances
F Sig.
1.655
0.199
t-test for Equality of Means
t 1.239 1.272
df 489 261.107
Sig. (2-tailed) 0.216 0.205
Mean Difference 0.10629 0.10629
Std. Error Difference 0.08579 0.08358
95% Confidence Interval Lower of the Difference Upper
-0.06227 0.27484
-0.05830 0.27087
From the Annexure-34 it is assumed that Sig. (2-tailed) value is 0.216 is not less
143 | P a g e
than or equal to .05, so we fail to reject null hypothesis. This implies that we
failed to observe impact of independent variable customer satisfaction on
intention to forward viral messages with respect to gender. A t test failed to
reveal a statistically reliable difference between the mean of customer
satisfaction that male has (M = 2.9360, s = 0.86606) and that the female has (M
= 2.8297, s = 0.81661), t(489) = 1.239, p = 0.216, α = .05. It proves that
independent variable customer satisfaction does not have any impact on
dependent variable i.e. intention to forward viral messages with respect to
gender. Gender was not considered as a contributing factor in further
examinations of intention to forward viral messages. Therefore hypothesis 20 is
rejected as there is no significant impact of customer satisfaction on intention to
forward viral messages with respect to gender.
Hypothesis 21: Customer Satisfaction has significant impact on user to forward
viral messages with respect to occupation.
The independent sample t-test is carried out to see the impact of independent
variable which is customer satisfaction on the intention to forward viral messages
with respect to occupation. Independent sample t-test compares the means
between two unrelated groups on the same continuous, dependent variable. The
results have two main parts: descriptive statistics and inferential statistics.
Descriptive statistics data is displayed in Annexure-35.

144 | P a g e
Annexure-35 Group Statistics
Q.54 N Mean Std. Deviation Std. Error
Mean
Customer Satisfaction student 273 2.8596 0.84370 0.05106
working 218 2.9648 0.86301 0.05845
There are 273 students, and they have, on average, 2.8596, with a standard
deviation of 0.84370. There are 218 working professional, and they have, on
average, 2.9648, with a standard deviation of 2.9648. Above table shows that
customer satisfaction is important factor for working professional than students.
The second part of the output gives the inferential statistics which is shown in
Annexure-36
Annexure-36
Independent Samples Test
Customer Satisfaction
Equal variance assumed
Equal variance not
assumed
Levene‘s Test for Equality of Variances
F Sig.
0.219
0.640
t-test for Equality of Means
t -1.359 -1.356
df 489 460.591
Sig. (2-tailed) 0.175 0.176
Mean Difference -0.10525 -0.10525
Std. Error Difference 0.07742 0.07761
95% Confidence Interval Lower of the Difference Upper
-0.25736 0.04686
-0.25777 0.04727
From the Annexure-36 it is assumed that Sig. (2-tailed) value is 0.175 is not less
than 0.05, so we fail to reject null hypothesis. This implies that we observe no
impact of independent variable customer satisfaction on intention to forward viral
messages with respect to occupation. A t test reveal a statistically reliable

145 | P a g e
difference between the mean of customer satisfaction that student has (M =
2.8596, s = 0.84370) and that the working professional has (M = 2.9648, s =
0.86301), t(489) = -1.359, p = 0.175, α = .05. It proves that independent variable
customer satisfaction has no impact on dependent variable i.e. intention to
forward viral messages with respect to occupation. Occupation was not
considered as a contributing factor in further examinations of intention to forward
viral messages. Therefore hypothesis 21 is rejected as there is no significant
impact of sender‘s benefit on intention to forward viral messages with respect to
occupation.
Hypothesis 22: Altruism has significant impact on user to forward viral
messages.
The overall multiple regression model which is depicted in Annexure-24 was
found to be significant (2
.AdjR . = 0.423), F (4, 490) = 90.742, p > .001. Altruism (β
= 0.303, t = 6.069, p > .05) were found to be having no significant impact on user
to forward viral messages. Therefore Hypothesis 22 is rejected that altruism has
no significant impact on user to forward viral messages.
Hypothesis 23: Altruism has significant impact on user to forward viral
messages with respect to gender.
The independent sample t-test is carried out to see the impact of independent
variable which is altruism on the intention to forward viral messages with respect
to gender. Independent sample t-test compares the means between two

146 | P a g e
unrelated groups on the same continuous, dependent variables. The results have
two main parts: descriptive statistics and inferential statistics. Descriptive
statistics data is displayed in Annexure-37.
Annexure-37 Group Statistics
Q.51 N Mean Std. Deviation Std. Error Mean
altruism Male 354 3.0377 0.90803 0.04826
Female 137 3.0000 0.86319 0.07375
This gives the descriptive statistics for each of the two groups (as defined by the
grouping variable, in this case is male and female). There are 345 male, and they
have, on average, 3.0377, with a standard deviation of 0.90803. There are 137
female, and they have, on average, 3.0000, with a standard deviation of 0.86319.
The last column gives the standard error of the mean for each of the two groups.
This shows that for male altrism is the important factor to intention to forward viral
messages than female. The second part of the output gives the inferential
statistics which is shown in Annexure-38.
Annexure-38
Independent Samples Test Altruism
Equal variance assumed
Equal variance not
assumed
Levene‘s Test for Equality of Variances
F Sig.
1.063
0.303
t-test for Equality of Means
t 0.418 0.427
df 489 259.119
Sig. (2-tailed) 0.676 0.669
Mean Difference 0.03766 0.03766
Std. Error Difference 0.09013 0.08814
95% Confidence Interval Lower of the Difference Upper
-0.13943 0.21476
-0.13589 0.21122

147 | P a g e
From the Annexure-38 it is assumed that Sig. (2-tailed) value is 0.418 is not less
than or equal to .05, so we fail to reject null hypothesis. This implies that we
failed to observe impact of independent variable altruism on intention to forward
viral messages with respect to gender. A t test failed to reveal a statistically
reliable difference between the mean of altruism that male has (M = 3.0377, s =
0.90803) and that the female has (M = 3.0000, s = 0.86319), t(489) = 0.418, p =
0.676, α = .05. It proves that independent variable altruism does not have any
impact on dependent variable i.e. intention to forward viral messages with
respect to gender. Gender was not considered as a contributing factor in further
examinations of intention to forward viral messages. Therefore hypothesis 23 is
rejected as there is no significant impact of customer satisfaction on intention to
forward viral messages with respect to gender.
Hypothesis 24: Altruism has significant impact on user to forward viral
messages with respect to occupation.
The independent sample t-test is carried out to see the impact of independent
variable which is altruism on the intention to forward viral messages with respect
to occupation. Independent sample t-test compares the means between two
unrelated groups on the same continuous, dependent variable. The results have
two main parts: descriptive statistics and inferential statistics. Descriptive
statistics data is displayed in Annexure-39.

148 | P a g e
Annexure-39 Group Statistics
Q.54 N Mean Std. Deviation Std. Error Mean
altruism student 273 3.0061 0.89226 0.05400
working 218 3.0535 0.89984 0.06095
There are 273 students, and they have, on average, 3.0061, with a standard
deviation of 0.89226. There are 218 working professional, and they have, on
average, 3.0535, with a standard deviation of 0.89984. Above table shows that
altruism is important factor for working professional than students. The second
part of the output gives the inferential statistics which is shown in Annexure-40
Annexure-40
Independent Samples Test
Altruism
Equal variance assumed
Equal variance not
assumed
Levene‘s Test for Equality of Variances
F Sig.
0.109
0.741
t-test for Equality of Means
t -0.583 -0.582
df 489 463.546
Sig. (2-tailed) 0.560 0.561
Mean Difference -0.04741 -0.04741
Std. Error Difference 0.08135 0.08143
95% Confidence Interval Lower of the Difference Upper
-0.20725 0.11243
-0.20743 0.11260
From the Annexure-40 it is assumed that Sig. (2-tailed) value is 0.560 is not less
than 0.05, so we fail to reject null hypothesis. This implies that we observe no
impact of independent variable altruism on intention to forward viral messages
with respect to occupation. A t test reveal a statistically reliable difference
between the mean of altruism that student has (M = 3.0061, s = 0.89226) and

149 | P a g e
that the working professional has (M = 3.0535, s = 0.89984), t(489) = --0.583, p =
0.560, α = .05. It proves that independent variable altruism has no impact on
dependent variable i.e. intention to forward viral messages with respect to
occupation. Occupation was not considered as a contributing factor in further
examinations of intention to forward viral messages. Therefore hypothesis 24 is
rejected as there is no significant impact of altruism on intention to forward viral
messages with respect to occupation.
The results of hypotheses testing have been summarized into Table 6.
Table 6
Alternative Hypothesis Variable
Statistical Test
Hypothesis Accepted/ Rejected
Independent Dependent
Access has significant impact on experiences of viral marketing.
Access Experience Correlation Rejected Null-Accepted
Awareness has significant impact on experiences of viral marketing.
Awareness Experience Correlation Accepted Null- Rejected
Interest has significant impact on experiences of viral marketing.
Interest Experience Correlation Accepted Null- Rejected
Trusted source does not have significant impact on user to receive viral messages.
Trusted Source Receive viral messages
Regression Accepted Null- Rejected
Trusted source does not have significant impact on user to receive viral messages with respect to gender.
Trusted Source Receive viral messages
Independent sample t-test
Rejected Null-Accepted

150 | P a g e
Hypothesis Variable
Statistical Test
Hypothesis Accepted/ Rejected
Independent Dependent
Trusted source does not have significant impact on user to receive viral messages with respect to occupation.
Trusted Source Receive viral messages
Independent sample t-test
Rejected Null-Accepted
Message relevance does not have significant impact on receiving viral messages.
Relevance Receive viral messages
Regression Accepted Null- Rejected
Message relevance does not have significant impact on receiving viral messages with respect to gender.
Relevance Receive viral messages
Independent sample t-test
Rejected Null-Accepted
Message relevance does not have significant impact on receiving viral messages with respect to occupation.
Relevance Receive viral messages
Independent sample t-test
Accepted Null- Rejected
A perceived benefit does not have significant impact on user to receive viral messages.
Perceived benefits
Receive viral messages
Regression Accepted Null- Rejected
A perceived benefit does not have significant impact on user to receive viral messages with respect to gender.
Perceived benefits
Receive viral messages
Independent sample t-test
Rejected Null-Accepted

151 | P a g e
Hypothesis Variable
Statistical Test
Hypothesis Accepted/ Rejected
Independent Dependent
A perceived benefit does not have significant impact on user to receive viral messages with respect to occupation.
Perceived benefits
Receive viral messages
Independent sample t-test
Rejected Null-Accepted
Tie strength does not have significant impact on user to forward viral messages.
Tie strength Forward message
Regression Accepted Null- Rejected
Tie strength does not have significant impact on user to forward viral messages with respect to gender.
Tie strength Forward message
Independent sample t-test
Rejected Null-Accepted
Tie strength does not have significant impact on user to forward viral messages with respect to occupation.
Tie strength Forward message
Independent sample t-test
Accepted Null- Rejected
Sender‘s benefit does not have significant impact on user to forward viral messages.
Sender‘s benefit Forward message
Regression Accepted Null- Rejected
Sender‘s benefit does not have significant impact on user to forward viral messages with respect to gender.
Sender‘s benefit Forward message
Independent sample t-test
Rejected Null-Accepted

152 | P a g e
Hypothesis Variable
Statistical Test
Hypothesis Accepted /Rejected
Independent Dependent
Sender‘s benefit does not have significant impact on user to forward viral messages with respect to occupation.
Sender‘s benefit Forward message
Independent sample t-test
Rejected Null-Accepted
Customer Satisfaction does not have significant impact on user to forward viral messages.
Customer Satisfaction
Forward
message
Regression Rejected Null-Accepted
Customer Satisfaction does not have significant impact on user to forward viral messages with respect to gender.
Customer Satisfaction
Forward
message
Independent
sample t test
Rejected Null-Accepted
Customer Satisfaction does not have significant impact on user to forward viral messages with respect to occupation.
Customer Satisfaction
Forward
message
Independent
sample t test
Rejected Null-Accepted
Altruism does not have significant impact on user to forward viral messages.
Altruism Forward message
Regression Rejected Null-Accepted
Altruism does not have significant impact on user to forward viral messages with respect to gender.
Altruism Forward message
Independent sample t-test
Rejected Null-Accepted
Altruism does not have significant
Altruism Forward message
Independent sample t-test
Rejected

153 | P a g e
impact on user to forward viral messages with respect to occupation.
Null-Accepted
To find out the correlation between the intention to receive viral messages with
the factors which influence users which are trusted source, relevance and
perceived benefits a Pearson product-moment correlation was run across the
variables to determine the relationship between the influencing factors to receive
viral messages. From the Annexure-41 it is observed that there is a strong and
positive correlation between intention to receive viral messages and trusted
source which was statistically significant (r = 0.373, n = 491, value of P = 0.000
where P < .0005). There is a strong and positive correlation between intention to
receive viral messages and relevance which are statistically significant (r = 0.400,
n = 491, value of P = 0.000 where P < .0005) as well. It is also proved that there
is strong and positive correlation between intention to receive viral messages and
perceived benefits which are statistically significant (r = 0.433, n = 491, value of
P = 0.000 where P < .0005).
Annexure-41
Correlations
Trusted Source Relevance Perceived benefits
Intention to receive
Pearson Correlation
0.373(**) 0.400(**) 0.433(**)
Sig. (2-tailed) 0.000 0.000 0.000
N 491 491 491
** Correlation is significant at the 0.01 level (2-tailed).

154 | P a g e
To find out the correlation between the intention to forward viral messages with
the factors which influence users which are tie strength, sender‘s benefit,
customer satisfaction and altruism a Pearson product-moment correlation was
run across the variables to determine the relationship between the influencing
factors to receive viral messages. From the Annexure-42 it is observed that there
is a strong and positive correlation between intention to forward viral messages
and tie strength which was statistically significant (r = 0.586, n = 491, value of P =
0.000 where P < .0005). There is a strong and positive correlation between
intention to forward viral messages and sender‘s benefit which are statistically
significant (r = 0.576, n = 491, value of P = 0.000 where P < .0005) as well. It is
also proved that there is strong and positive correlation between intention to
forward viral messages and customer satisfaction which are statistically
significant (r = -0.499, n = 491, value of P = 0.000 where P < .0005) and strong
and positive correlation between intention to forward messages and altruism as
well which are statistically significant (r = 0.371, n = 491, value of P = 0.000
where P < .0005).
Annexure-42
Correlations
Tie
Strength Sender‘s Benefit
Customer Satisfaction Altruism
Intention to forward
Pearson Correlation
0.586(**) 0.576(**) 0.499(**) 0.371(**)
Sig. (2-tailed) 0.000 0.000 0.000 0.000
N 491 491 491 491
** Correlation is significant at the 0.01 level (2-tailed).

155 | P a g e
Chapter 8
Conclusion, Limitation and Future Scope
Conclusion This study was designed to study drivers of viral marketing and to reveal and
validate factors which influence user to receive and forward viral messages. In
the first part of the study sequence of drivers of viral marketing is identified.
Existing literature in the area of viral marketing suggest the sequence of drivers
of viral marketing. This sequence is awareness, interest and experience of viral
marketing. Last chain of this sequence is experience. Awareness about the viral
marketing creates interest in product about which user gets information through
viral marketing. Therefore, awareness and interest leads to the experience of the
viral marketing strategy adopted by the business. On top of this sequence extra
attribute is added which is access to identify whether access have any significant
impact on the experience or not.
Analysis was conducted to see the impact of awareness which was not there in
the earlier literature and other attributes which are available in the existing
literature are awareness and interest have any significant impact on the
experiences of viral marketing. After analysis it has been found that access does
not have any significant impact on the experiences of viral marketing. But,
awareness and interest do have significant impact on experiences of viral
marketing. Analysis was done to see the association between these variables. It
has been found that there is strong and positive correlation between awareness

156 | P a g e
and interest with the experience of viral marketing and there is negative
correlation between access and experience of viral marketing.
Descriptive statistic shows that score of experience is interest was higher which
is followed by experience. Reason behind it may be data collected from the
internet user and for them access is not the important criteria to get the
experiences of viral marketing. As internet user do get access regularly on the
internet. But the awareness of the viral marketing they get by having account on
the social networking and other internet portal, search engine creates interest in
getting information about the product which gives them total experience of viral
marketing. This shows that, access is not a contributing factor for the
experiences of viral marketing.
To find out the correlation between the drivers of viral marketing which are
access, awareness, interest and experience a Pearson product-moment
correlation was run across the variables to determine the relationship between
the sequences of drivers of viral marketing. It is observed that there is a strong
and positive correlation between access and interest. There is negative
correlation between access and awareness. It is also proved that there is
negative relationship between awareness and access and awareness and
interest. There is negative correlation between interest and awareness but there
is strong and positive correlation between interest and access. This proves that

157 | P a g e
access does not have any correlation with other attributes of sequence of viral
marketing.
The second part of the study is carried out to reveal and validate the factors
which influenced user to receive viral messages. The success of the viral
marketing lies in the propagation of viral messages. Therefore it was very
essential to identify the factors and validate them. Existing literature in the area of
viral marketing suggests information adoption model and research model. From
these two models three significant factors are identified which are trusted source,
relevance and perceived benefits. According it was hypothesizes that the trusted
source, relevance, perceived benefits have significant impact on user to receive
viral messages. Existing literature also revealed and validates these factors as
influencing factors for user to receive viral messages.
Descriptive statistics shows that the score of relevance is higher that the
perceived benefits and the least score of trusted sources. Regression analysis is
done to see each of these factors have significant on user to receive viral
messages. It shows that trusted source, relevance and perceived benefits have
significant impact on user to receive viral messages. Reason behind it security is
the main concern for the user as most of the promotional mails are considered as
spam. But, users surely give it a try if it is from a trusted source. Message
relevance is also another important factor. If message is what he is looking for
and of his interest it influences user to receive those messages. Another factor

158 | P a g e
which validated was perceived benefits. Perceived benefits in terms of bonus
point, discount, prize, free service influenced user to receive viral messages.
Comparison of influencing factors to receive viral messages of Male &
Female:
Since the gender is a natural variable around which social world is organized, it is
natural to compare persons belonging to these two group viz. males and
females. Literature review and numerous previous studies have revealed that no
Significant difference has been noticed in the behavior & attitude of males and
females in the context of viral marketing. The same conclusion is drawn in the
current study also. Analysis was conducted to compare the mean score of male
and female on various types of influencing factors, and this yielded that there is
no significant difference of the influencing factors on receiving messages by
males and female. Descriptive statistics shows that female are more concerned
with the trusted source that the males as the mean score of female for trusted
score was higher that the male. It also shows that working professional are more
concerned with the trusted source while receiving viral messages that the
students. For male message relevance is important that the female while
receiving messages. For male mean score of perceived benefits is more than the
female shows that perceived benefit is an important factor for male that the
female. This proves that trusted source is important factor for females whereas
relevance, perceived benefits are important factors for male to receive viral
messages.

159 | P a g e
Comparison of influencing factors to receive viral messages of student and
professional:
There was no previous study found in earlier literature whether occupation is
contributing factor for intention to receive viral messages. Therefore it was
decided to see whether occupation has any impact on receiving viral messages.
For this study occupation which is considered was student and working
professional. Like gender independent sample t-test is conducted and the result
shows that occupation is not a contributing factor in receiving viral messages. For
working professional trusted source is important factor that the students as it
shows higher mean value. Whereas working professional are more concerned
with the message relevance that the students. Working professional mean value
shows that to receive viral messages perceived benefits is an influencing factor
as the mean score is higher than the students. This proves that the trusted
source, message relevance and perceived benefits are important factors for
working profession to receive viral messages that the students.
To find out the association between the trusted source, relevance, perceived
benefits with the intention to receive viral messages a regression analysis is
done. Result of the regression analysis shows that all these factors shows the
significant impact on intention to open viral messages where p value is less than
0.005. This proves that trusted source, relevance, perceived benefits are the
factors which influence user to receive viral messages. Gender and occupation
does not contribute any role while receiving viral messages.
160 | P a g e
Third part of the study concentrates on to reveal and validates factors which
influence user to forward messages. In existing literature no combine study of
factors which influence user to receive as well forward message is carried out.
For the success of viral marketing it is very essential to reveal factors which are
responsible to forward messages. Therefore combine study is taken for this
research. From the previous literature factors which are identified as a
influencing factors for forwarding messages are tie strength, sender‘s benefit,
customer satisfaction and altruism. Accordingly it is hypothesizes that the tie
strength, sender‘s benefit, customer satisfaction and altruism have significant
impact on user to forward viral messages. In Descriptive statistics it has been
observed that mean score of altruism is highest score which was preceded by tie
strength, customer satisfaction and sender‘s benefit.
Regression analysis is proved that tie strength is influencing factor to forward
messages. Tie strength is an acquaintance with user is connected. If the tie
strength is strong likelihood of message forwarding increases than the weak tie
strength. Further study is required to see the result between strong
acquaintances and weak acquaintances. This study also proves that sender‘s
benefit also has significant impact on user to forward viral messages. Sender‘s
benefit like incentives, rewards, free services etc. Customer satisfaction and
altruism does not have any impact on user to forward messages. From this
analysis it is concluded that, tie strength and senders‘ benefit are the factors

161 | P a g e
which impact user to forward viral messages whereas customer satisfaction and
altruism does not impact user to forward viral messages.
Comparison of influencing factors to receive viral messages of Male &
Female:
For this study also comparison between male and female is studied to see
whether gender play any role while forwarding viral messages. For this
independent sample t-test is carried out and it has been observed that tie
strength is important factor for male than the female but there is no significant
impact of tie strength on intention to forward viral messages with respect to
gender. Sender‘s benefit is a important factor for male than the female to forward
viral messages. But gender was not considered as a contributing factor in further
examinations of intention to forward viral messages. Therefore hypothesis is
rejected as there is no significant impact of sender‘s benefit on intention to
forward viral messages with respect to gender. Customer satisfaction and
altruism is considered to be most important factor for male than female but it
does not have any significant impact on user to forward viral messages with
respect to gender.
Comparison of influencing factors to forward viral messages of student
and professional:
Tie strength is important factor for working professional that the student. Reason
behind it may working professional have purchasing power therefore they like

162 | P a g e
recommend product in his/her network if he/she is satisfy with the product.
Therefore hypothesis is accepted as there is significant impact of tie strength on
intention to forward viral messages with respect to occupation. Analysis shows
that sender‘s benefit is important factor for working professional than students.
Occupation was not considered as a contributing factor in further examinations of
intention to forward viral messages. Therefore hypothesis rejected as there is no
significant impact of sender‘s benefit on intention to forward viral messages with
respect to occupation. Customer satisfaction and altruism are the important
factor for the working professional that the students to forward viral messages nt
but research study doesn‘t support that customer satisfaction and altruism are
the influencing factor to forward viral messages with respect to occupation.
To find out the association between the intention to receive viral messages and
influencing factors which are trusted source, relevance, perceived benefits a
Pearson correlation test is carried out. It is observed that there is strong and
positive correlation between these variables with the intention to receive viral
messages. Similarly To find out the association between the intention to forward
viral messages and influencing factors which are tie strength, sender‘s benefit,
customer satisfaction, and altruism a Pearson correlation test is carried out. It is
observed that there is strong and positive correlation between these variables
with the intention to forward viral messages.
The summary of objectives and outcomes are illustrated in Table-7.

163 | P a g e
Table-7
Summary of objectives and outcomes
Sr. No.
Objectives Outcomes
1. To understand viral marketing through social network.
Viral marketing is electronic word of mouth technique adopted by the business where message about the product and its brands or services is send to a potential buyer over internet. This potential buyer sends this information to another potential buyer in a way a large network is created swiftly. Viral Marketing Communication can bring about benefits to marketers with its advantages such as low cost, high reach, high credibility, accountability, fast speed, ease of usage and ability to reach a global audience.
2. To identify drivers for viral marketing.
To understand viral marketing, it is very essential to understand the drivers of viral marketing and these drivers are access, awareness, interest and experience. Research study proves that awareness and interest are the major factor which gives the experience of viral marketing whereas access does contribute to the experience of viral marketing
3. To reveal and validate factors which influence user to receive and forward messages.
For the success of viral marketing it is imperative to reveal and validate the factors which influence user to receive and forward viral messages. No combine study known in exists in Indian context. This study is helpful for the marketer while designing their viral marketing strategy.

164 | P a g e
Factors which are revealed to receive viral messages are trusted source, relevance and perceived benefits. These factors are validates by using statistical test and it is observed that trusted source, relevance and perceived benefits have significant impact on user to receive viral messages. Factors which are revealed to forward viral messages are tie strength, sender‘s benefit, customer satisfaction and altruism. These factors are validates by using statistical test and it is observed that tie strength, sender‘s benefit have significant impact on user to receive viral messages whereas customer satisfaction and altruism does not contribute for forwarding messages.
4. To understand impact of demographic factors of user on receiving and forwarding messages.
Demographic factors considered for this study are gender and occupation. No study on this demographic factor known to exists in Indian context. Data is validated with the help of statistical test and it has been observed that: Influencing factor to receive viral messages are trusted source, relevance and perceived benefits. Trusted source does not have any significant impact on user to receive viral messages with respect to gender and occupation. Relevance does not have any significant impact on user to receive

165 | P a g e
viral messages with respect to gender but it has significant impact on user to receive viral messages with respect to occupation. A perceived benefit does not have any significant impact on user to receive viral messages with respect to gender and occupation. Tie strength does not have any significant impact on user to forward viral messages with respect to gender but it has significant impact on user to forward viral messages with respect to occupation. Senders‘ benefit does not have any significant impact on user to forward viral messages with respect to gender and occupation. Customer satisfaction does not have any significant impact on user to forward viral messages with respect to gender and occupation. Altruism does not have any significant impact on user to forward viral messages with respect to gender and occupation. It is proved that demographic factor occupation plays significant role in receiving (relevance) and forwarding (tie strength) viral messages.

166 | P a g e
Chapter-8
Limitations and Future Scope of the Study Current research study examines the drivers of viral marketing and reveal and
validate influencing factors to receive and forward messages. For the current
study factors were identified form earlier study in the area of viral marketing.
These factors were validated by collecting primary data and for that respondents
identified were the internet users.
Data collected through Mumbai only which not a true representation of pan India.
If a different demographic group were used, it is possible that the results could
have been different. Since this the first combine study of identifying factors which
influence user to receive and forward messages, replication of this study would
be essential.
Only platform of viral marketing considered in the research study is email. Other
platform of viral marketing like company website, online review, blogs, social
network, online communities, newsgroups, chat rooms, hate sites, needs to be
considered and compare different levels of impact on these eWOM forms on
consumer behavior.
This study may not have identified all the factors which influence user to receive
and forward messages. Therefore, another limitations lies in the limited number
of variables examined in relation to receive and forward messages.

167 | P a g e
Appendix-1
Bibliography
1. A.Dobele, Why pass on viral messages? Because they connect
emotionally. 2007. Business Horizons, Vol. 50, Iss. 4; 291-304
2. Abed Abedniya, Sahar Sabbaghi Mahmouei, The Impact of Social
Networking Websites to Facilitate the Effectiveness of Viral Marketing,
December 2010, International Journal of Advanced Computer Science
and Applications, Vol. 1, No.6
3. Andrea C. Wojnicki,, Word-of-Mouth and Word-of-Web: Talking About
Products, Talking About Me, 2006, Advances in Consumer Research,
Volume 33,
4. Andrew Paul Williams, Kaye D Trammell, Candidate Campaign E-Mail
Messages in the Presidential Election, 2004, The American Behavioral
Scientist. Thousand Oaks: Dec 2005. Vol. 49, Iss. 4; pg. 560, 15 pgs
5. Angela Dobelea,David Tolemanb, Michael Beverland, Controlled infection!
Spreading the brand message through viral marketing, 2005, Business
Horizons, 48, 143—149
6. Angela Dobele, Adam Lindgreen, Michael Beverland, Joëlle Vanhamme,
Robert van Wijk, Why pass on viral messages? Because they connect
emotionally, 2007, Business Horizons, 50, 291–304
7. Antti Vilpponen, Susanna Winter, and Sanna Sundqvist , Electronic Word-
of-Mouth in Online Environments: Exploring Referral Network Structure

168 | P a g e
and Adoption Behavior, 2006, Journal of Interactive Advertising, Vol.6, No.
2, pp. 63‐77.
8. Arnaud De Bruy, Gary L. Lilien, A Multi-Stage Model of Word of Mouth
Through Electronic Referrals, February, 2004, eBusiness Research
Center, Working Paper
9. Arnaud De Bruyn, Gary L. Lilien, A multi-stage model of word-of-mouth
influence through viral marketing, 2008, International Journal of Research
in Marketing 25, 151-163
10. Arnaud De Bruyn, Gary L. Lilien, February, A Multi-Stage Model of Word
of Mouth Through Electronic Referrals, 2008, International Journal of
Research in Marketing, pp 151-163
11. Barnes, N., & Mattson, E., (2008), Social media in the Inc. 500: The first
longitudinal study [Electronic version]. University of Massachusetts
Dartmouth Center for Marketing Research. Retrieved from:
http://www.umassd.edu/cmr/studiesresearch/blogstudy5.pdf
12. Biyalogorsky, E., E. Gerstner, and B. Libai, Customer Referral
Management: Optimal Reward Programs, 2001, Marketing Science, 20
(1), 82-95.
13. Brown, J. and Reingen, P. Social Ties and Word-of-Mouth Referral
Behavior, 1987, Journal of Consumer Research 14(3): 350–362.
14. Christy M.K. Cheung, M. K., The impact of electronic word-of-mouth The
adoption of online opinions in online customer communities, 2008,
Emerald Internet Research , Vol. 18 No. 3, pp. 229-247.

169 | P a g e
15. Daniels, Chris, I am viral: how Molson successfully spreads its online
marketing message without opting for send-to-a-friend buttons, Jul 2002,
Digital Marketing, pg. 7
16. David Aron, The Effect of Counter-Experiential Marketing Communication
on Satisfaction and Repurchase Intention, 2006, Journal of Consumer
Satisfaction, Dissatisfaction and Complaining Behavior, Vol. 19 pg. 1,
17. Datta, P., Chowdhury, D., & Chakraborty, B., Viral marketing: New form of
wordof-mouth through internet [Electronic version]. 2005, The Business
Review, Cambridge, 3(2), 69-75.
18. Dellarocas, Chrysanthos, The Digitalization of Word of Mouth: Promise
and Challenges of Online Feedback Mechanisms, 2003,Management
Science, 49 (10), 1407-1424.
19. Dobele, A., Toleman, D., & Beverland, M., Controlled infection! Spreading
the brand message through viral marketing. 2005, Business Horizons,
48(2), 143−149.
20. Dongyoung Sohn; John D Leckenby, Product Class Knowledge as a
Moderator of Consumer‘s Electronic Word-of-Mouth…,2005, American
Academy of Advertising. Conference. Proceedings; ABI/INFORM Global
pg. 20
21. Dr. Ralph F. Wilson, The Six simple Principles of Viral Marketing, Web
Marketing Today, February 1, 2005. Originally published 2/1/2000.

170 | P a g e
22. Dunk, A.S, Product life cycle cost analysis: the impact of customer
profiling, competitive advantage, and quality of IS information, 2004,
Management Accounting Research, Vol. 15 No. 4, pp. 401-14.
23. Feick, L.F., Guskey, A. and Price, L., Everyday Market Helping Behavior,
1995, Journal of Public Policy & Marketing 14(2): 255–266.
24. Frenzen, J. K. and H. L. Davis, Purchasing Behavior in Embedded
Markets, 1990, Journal of Consumer Research 17(1), pp. 1-12.
25. Frenzen, Jonathan and Kent Nakamoto, Structure, Cooperation, and the
Flow of Market Information, 1993, Journal of Consumer Research, 20
(December), 360-375.
26. Gefen, D., Customer Loyalty in E-Commerce, 2002, Journal of the
Association for Information Systems 3(2): 27–51.
27. Gefen, D., Karahanna, E. and Straub, D.W., Inexperience and Experience
with Online Stores: The importance of TAM and trust, 2003, IEEE
Transactions on Engineering Management 50(3): 307–321.
28. Giovanna Miritello, Esteban Moro, and Rub_en Lara, The dynamical
strength of social ties in information spreading , November 2010,
arXiv:1011.5367v1 [physics.soc-ph].
29. Gold, Robert, Brown, Andrew Z, Building trust in an increasingly private
world, May 2002, Digital Marketing, pg. 18
30. Granovetter, M.S., The Strength of Weak Ties, American Journal of
Sociology, 1973, 78: 1360–1380.

171 | P a g e
31. Guy J. Golan, Lior Zaidner, Creative Strategies in Viral Advertising: An
Application of Taylor‘s Six-Segment Message Strategy Wheel, 2008,
Journal of Computer-Mediated Communication, 13, 959–972
32. Hennig-Thurau, T., Gwinner, K.P., Walsh, G. and Gremler, D.D.,
Electronic Word-of-Mouth via Consumer-Opinion Platforms: What
motivates consumers to articulate themselves on the internet, 2004,
Journal of Interactive Marketing 18(1): 38–52.
33. Hsi-Pen, Hsin-Chiau Fu, Chia-Hui Yen, A Study of E-mail Marketing: Why
do People Read and Forward E-mail, 2007, Advances in Information
Systems Development, 239-249
34. Irvine Clarke, Theresa Flaherty, 2005, ―Advances in electronic marketing‖
35. Janghyuk Lee, Jong-Ho Lee, Dongwon Lee, Impacts of Tie Characteristics
on Online Viral Diffusion, January 2009, Communications of the
Association for Information Systems: Vol. 24, Article 32.
36. Jason Y.C. Ho, Melanie Dempsey, Viral Marketing: Motivations to forward
online content, 2010, Journal of Business Research, Vol. 63, Issue: 9-10
37. Jeffrey Boase and Barry Wellman, A Plague of Viruses: Biological,
Computer and Marketing, September 2001, Current Sociology
38. Jonker, MJ, ―What drives people to forward viral messages? Message
aspects and motivations‖, August 2008, Master thesis, Universiteit
Maastricht, Faculty of Economics and Business Administration.
39. Joseph E. Phelps, Regina Lewis, Lynne Mobilio, David Perry, Niranjan
Raman, Viral Marketing or Electronic Word-of-Mouth Advertising:
172 | P a g e
Examining Consumer Responses and Motivations to Pass Along Email,
December 2004, Journal of Advertising Research, 333.
40. Jurvetosn & Draper, 1997, ―Viral Marketing – Viral Marketing Phenomeno
explained‖, Available at: http://www.dfj.com/news/article_26.shtml,
Accesses 18 March, 2011.
41. Justin Kirby and Paul Mardsen, September 9, 2005, in his book titled
―Connected Marketing, the viral, buzz and Word of mouth revolution.‖
42. Laudon, K. C., & Traver, C. G. (2001). E-commerce: Business,
technology, Society. Boston: Addison-Wesley.
43. Leskovec, J., L. A. Adamic, and B. A. Huberman. (2007). ―The Dynamics
of Viral Marketing,‖ ACM Transactions on the Web 1(1) Article 5, pp. 1-39.
44. Madu, C.N. and Madu, A.A., Dimensions of e-quality. 2002, International
Journal of Quality and Reliability Management, Vol. 19 No. 3, pp. 246-58.
45. Mark R Brown, Roop K Bhadury, Nigel K Ll Pope, The Impact of Comedic
Violence on Viral Advertising effectiveness, 2010, . Journal of Advertising..
Vol. 39, Iss. 1; pg. 49, 17 pgs
46. Nah, F.F.-H. and Davis, S., HCI research issues in e-commerce, 2002,
Journal of Electronic Commerce Research, Vol. 3 No. 3, pp. 98-113.
47. Oliver, R.L. (1997). Satisfaction: A behavioral perspective on the
consumer, New York: Irwin/McGraw-Hill.
48. Onnela, J. P., J. Saramaki, J. Hyvonen, G. Szabo, D. Lazer, K. Kaski, J.
Kertesz, and A. L. Barabasi, Structure and Tie Strengths in Mobile
173 | P a g e
Communication Networks, 2007, in Proceedings of National Academy of
Science USA 104(18), pp. 7332-7336.
49. Philip Kotler, Dipak C. Jain, Suvit Maesincee, ―Marketing moves: A New
Approach to Profits, Growth, and Renewal‖, 2002, Harvard Business
School Press, Boston, - A Book
50. Phelps, Joseph E., Regina Lewis, Lynne Mobilio, David Perry, and
Niranjan Raman, Viral Marketing or Electronic Word-of-Mouth Advertising:
Examining Consumer Responses and Motivations to Pass Along Email,
2004, Journal of Advertising Research, 44 (4), 333-348.
51. Popcorn, F. (2005). Cultural relevance [Electronic version]. Chief
Executive, 214, 35-37.
52. Porter, L., & Golan, G. J., From Subservient Chickens to Brawny Men: A
Comparison of Viral Advertising to Television Advertising, 2006, Journal of
Interactive Advertising, 6(2), 30-38.
53. Rebecca J. Larson, The Rise of Viral Marketing through the New Media of
Social Media, January 2009, Faculty Publications and Presentations.
Paper 6. http://digitalcommons.liberty.edu/busi_fac_pubs/6.
54. 2 Ralph F Wilson (2005), ―The Six Simple Principles of Viral Marketing‖,
available at www.wilsonweb.com
55. Rebecca J. Larson,The Rise of Viral Marketing through the New Media of
Social Media, January, 2001, Liberty University, available at
http://digitalcommons.liberty.edu/busi_fac_pubs/6/

174 | P a g e
56. Ronald E. Goldsmith and David Horowitz, Measuring Motivations for
Online Opinion Seeking, 2006, Journal of Interactive Advertising, Vol 6 No
2, pp. 3‐14. ISSN 1525‐2019
57. Shailendra Dasari and B Anandakrishna, Viral Marketing of Retail
Products: A Study on the Influence of Attributes of Web Portals and
Incentives Offered on User Registrations, 2010, IUP
58. Skrob, J.-R. (August 2005). Open Source and Viral Marketing. Vienna,
Austria: University of Applied Science Kufstein.
59. Stefan Wuyts, Marnik G. Dekimpe, Els Gijsbrechts (2010), The connected
customer: that changing nature of consumer and business markets
60. Steve Anderson, Using Social Network to Market, Feb 2008, Rough
Notes, 151, 2; ABI/INFORM Global pg. 114
61. Steve Juvetson (2000), ―What is Viral Marketing‖, Red Herring, May 1,
available at http:// www.dfj.com
62. Sundaram,D.S.,Mitra,K. and Webster,C., Word-of-Mouth ommunications:
A motivational analysis, 1998, Advances in Consumer Research 25: 527–
531.
63. Sweta Chaturvedi Thota, Abhijit Biswas, I Want to Buy the Advertised
Product Only!, 2009, Journal of Advertising.. Vol. 38, Iss. 1; pg. 123.
64. Walker, J., S. Wasserman, and B. Wellman, Statistical Models for Social
Support Networks, in Wasserman, S. and J. Galaskiewicz (eds.), 1994,
Advances in Social Network Analysis, Thousand Oaks, CA: Sage., pp. 53-
78.

175 | P a g e
65. Watts, D. J. and S. H. Strogatz, Collective Dynamics of „Small-World‟
Networks, 1998, Nature 393, pp. 440-442.
66. What is Viral Marketing, Available at: http://www.squidoo.com/what-is-
viral-marketing. Accessed 1st December, 2010.
67. Wilson, R. (2000) ―The Six Simple Principles of Viral Marketing? retrieved
October 3, 2005, from http://www.wilsonweb.com/wmt5/viral-
principles.htm
68. Wojnicki, Andrea C. and Dave Godes (2008), ―Word-of-Mouth as Self-
Enhancement,‖ University of Toronto Working Paper.
69. Wolfgang Palka, Key Pousttchi, Dietmar G Wiedemann, Mobile word-of-
mouth – A grounded theory of mobile viral marketing, 2009, Journal of
Information Technology (2009) 24, 172–185
70. Yih Hwai Lee, Charlotte Mason, Responses to information incongruency in
advertising: The role of expectancy, relevancy, and humor, September
1999, Journal of Consumer Research.. Vol. 26, Iss. 2; p. 156.
71. Young, Troy, Providing a personal touch, September 2001, Digital
Marketing, pg. 25

176 | P a g e
Appendix-2
Questionnaire
Viral Marketing Survey
Dear Respondent, This is a survey for a research project on viral marketing i.e. electronic Word of Mouth (eWOM) marketing technique, in which user passes product and its brand
messages to another user which they received from a marketer or through their social network over the internet. This survey is conducted by M.Phil student. The purpose of this study is to examine the drivers of viral marketing and find out the factors which influences user to receive and forward messages. With only a few minutes of your time, you can help me to gather information which would be helpful for a marketer and consumer to send and
receive information about product/service in an effective way by using viral marketing technique. Please begin the survey now by filling one page survey report. And, thank you
for your complete and candid responses to all questions.
1 Are you aware of the term “viral marketing”? * Yes No
2 Do you get internet access at home, college, workplace? * Yes No
3 Are you a member of any Social Networking site like facebook, twitter, linkedin etc.? *Yes No
4 Do you visit Social Networking Sites regularly? * Yes No
5 Are You interested in online purchase? * Yes No
1.Strongly Disagree, 2.Disagree, 3.Neither Disagree Nor Agree, 4.Agree, 5.Strongly Agree
Please tick appropriate option: 1 2 3 4 5
6 I gather information about product/service before going for purchase. *
7 I am interested in receiving email or messages from a friend containing a link of product/service which is relevant to me. *
8 I found information regarding product/service available on social network is very useful. *
9 My decision to purchase product/service is based on the reviews on social network. *
10 I always send messages of product/services over social network. *
11 I always share information over social network which is not related to marketing. *
12 Viral marketing technique is very interesting as there is no middle man required to get information about product. *
13 Information about product/service can be viewed on internet as per my convenient time. *
14 I don’t open promotional messages which I get because often it is just a spam which I delete without reading. *
15 I don’t click on product/service link which I get because of security reason. *
16 I open promotional messages of product/service if it is from the social networking group. (e.g. facebook, linkedin, Twitter etc.) *

177 | P a g e
17 I open promotional messages of product if it is from relatives or friend. *
18 I open promotional messages of product/service if it is from the reputed organization like Sunsilk, Tata Docomo, Idea, FMCG products etc.) *
19 I open promotional messages of product/service of my interest and relevant to me. *
20 I open promotional messages of product/service if it is from trusted third party. *
21 I open all messages from my acquaintances *
22 I read messages of product/service which contain videos, animation and flashy texts or which is entertaining. *
23 I read messages of product/service which gives detailed understanding of product/services. *
24 I don’t read message of product/service which is not appealing to me
25 While reading message of product/service, look of the message is not important to me*
1.Strongly Disagree, 2.Disagree, 3.Neither Disagree Nor Agree, 4.Agree, 5.Strongly Agree
Please tick appropriate option: 1 2 3 4 5
26 I read messages of service/product of my interest. *
27 If I received a message of product/service from someone who is known to me, l surely give it a try. *
28 If a message of product/service from third party but of my interest I’ll surely give it a try. *
29 I read all messages which I received. *
30 I read messages of product/service which I am looking for. *
31 I read message of product/services which is read by many users. *
32 I don’t read message of produc/service which is taking too much time for video & text to display.
33 I don’t read messages of product/services which required lot of information from user. *
34 I read messages of product/services which is simple and easy to use. *
35 I read message of product/service which gives me incentives/reward. *
36 I forward all messages of product/service which I received. *
37 I forward only those messages of product/service which is from trusted source. *
38 I forward only those messages of product/service in which receiver is interested. *
39 I forward message of product/service to only my close associates. *
40 I forward message of product/service to all my contacts. *

178 | P a g e
41 I forward message of product/service to get benefit from company *
42 I forward message of service/product which are conditional to provide contact list in order to get information about product/service. *
43 I forward message of service/product which are conditional to get reward from company. *
44 I forward message of product/service to get connected with people. *
45 I forward message of product/service just for a fun. *
46 I forward message of product/service because I am using and satisfied with product/service. *
47 I forward message of product/service because I am not using but having good opinion about it. *
48 I forward message of product/service just for the receiver’s benefits. *
49 I tend to pass along my contacts ‘positive reviews’ of product/service. *
50 I tend to pass along my contacts ‘negative reviews’ of product/service. *
Please tick appropriate option:
51 Gender * Male Female
52 Age (years) * 16-20 21-30 31-40
41-50 50 and above
53 Qualification * Graduate Post Graduate Others
54 Profession * Student Working
55 If working, specify sector * IT Non-IT
56 Location * Within Maharashtra Outside Maharashtra