virgin technic institute and state...
TRANSCRIPT

OUT-MOV
OF-PLAVEMEN
ANE WEBNT OF HY
P
G
Cr
R
VIRGIN AND ST
The Cha of Civil Blacksb
Structu
B DEFORYBRID-CPHOTOG
Margret Graduate R
ristopher DPrincip
Report No.
Ju
NIA POLYTATE UNI
arles E. Vl and Envburg, VA
ural En
RMATIOCOMPOGRAMM
by
Grace MaResearch A
D. Moen, Phal Investig
CE/VPI-S
une 2012
YTECHNIIVERSITY
Via, Jr. Devironment
A 24061
gineerin
ON ANDSITE BE
METRY
ascaro Assistant
h.D., P.E.gator
ST-12/08
IC INSTITY
epartmental Engin
ng and M
D RELATEAMS BA
TUTE
nt neering
Materia
TIVE ARASED O
als
CH N

Out-of-Plane Web Deformation and
Relative Arch Movement of Hybrid-Composite
Beams Based on Photogrammetry
By
Margret Grace Mascaro
Report submitted to the Faculty of the Virginia Polytechnic Institute and State University in
partial fulfillment of the requirements for the degree of
Masters of Science
In
Civil Engineering
Dr. Thomas E. Cousins, Committee Chair
Dr. Carin L. Roberts-Wollmann, Member Dr. Cristopher D. Moen, Member

i
Out-of-Plane Web Deformation and
Relative Arch Movement of Hybrid-Composite
Beams Based on Photogrammetry
Margret Mascaro
Recently invented by John R. Hillman, Hybrid-Composite Beams (HCBs) are a new
approach to structural design that incorporate four materials in such a way as to maximize the
efficiency of each material. A concrete arch serves as the main compression reinforcement, with
steel strands tying the arch and carrying tension forces. The space between the arch and the steel
is filled with stiff, lightweight foam. A Fiber Reinforced Plastic (FRP) box encases the system
and adds shear reinforcement. The Virginia Department of Transportation is interested in using
HCBs in bridges and funded a project at Virginia Tech to better understand the behavior of the
beams.
Close-range photogrammetry was incorporated into the project to detect out-of-plane
movement of the FRP web and movement of the arch within the FRP shell due to applied loads.
The individual beam underwent two phases of testing, the first of which occurred prior to the
concrete arch being placed in the beam. The second phase took place after the arch cured. A
total of 22 photosets were taken of the beam, four during Phase I and 18 during Phase II.
The results of the FRP web study indicate that beam is flexible laterally and prone to lateral
displacement when not connected to a larger bridge system. Significant movement of the arch
within the FRP shell was detected demonstrating sinusoidal behavior along the edge of the arch
and restrained movement at the center of the arch.
ABSTRACT

ii
I would like to thank Dr. Cristopher Moen, Dr. Tommy Cousins, and Dr. Carin Roberts-
Wollmann for their support and guidance throughout this research. Your comments and
direction kept me motivated and focused while pushing me to grow professionally. To John
Hillman, thank you for inventing the Hybrid-Composite Beam, and to Mike Zicko for coming to
the lab to help us along the way. To the Virginia Department of Transportation (VDOT), thank
you for choosing to incorporate them in bridges in Virginia and for funding Virginia Tech to
perform the research. Thank you to Shainur Ahsan, Sasha Bajzek, and Stephen Van Nosdall, my
fellow research assistants on this project. Working with the three of you has been a pleasure and
it definitely made working long hours in the lab more enjoyable. A special thank you is
extended to Dave Mokarem, Dennis Huffman, and Brett Farmer for all your help and guidance in
the structures lab. Thank you to all the other SEM graduate students who helped us with the
concrete pours and to Bobby Orsa for passing on his photogrammetry knowledge to me.
I’d like to thank my family for always supporting me and encouraging me to put forth my
best effort in all I say and do. Most importantly, I need to thank my Savior, Jesus Christ, for
blessing me with the opportunity to work with an incredibly knowledgeable and supportive
group of people at Virginia Tech on such an exciting project.
ACKNOWLEDGEMENTS

iii
Abstract ................................................................................................................................................... 1
Acknowledgements ................................................................................................................................. 2
Table of Contents .................................................................................................................................... 3
List of Figures ......................................................................................................................................... 5
List of Tables .......................................................................................................................................... 8
Chapter 1: Introduction ...................................................................................................................... 1
1.1 Research Motivation ................................................................................................................ 1
1.2 Introduction to Hybrid-Composite Beams and Test Program .................................................... 1
1.2.1 Concept ............................................................................................................................ 1
1.2.2 Test Procedures ................................................................................................................ 4
1.3 Introduction to Photogrammetry ............................................................................................... 9
Chapter 2: Photogrammetry Procedure............................................................................................. 12
2.1 RAD Target Instrumentation .................................................................................................. 12
2.2 Defining the photosets ............................................................................................................ 13
2.3 Creating 3D models in PhotoModeler ..................................................................................... 15
2.4 Adjusting the coordinate system ............................................................................................. 16
Chapter 3: HCB Fiber Reinforced Plastic Web Study ....................................................................... 19
3.1 Phase I Results and Discussion ............................................................................................... 19
3.1.1 Initial Conditions ............................................................................................................ 19
3.1.2 Uniform Load Test ......................................................................................................... 23
3.1.3 Midspan Point Load Test ................................................................................................ 24
3.1.4 Post Concrete Pour of the Arch ....................................................................................... 25
3.2 Phase II Results and Discussion ............................................................................................. 26
3.2.1 Midspan Point Load Test 1 ............................................................................................. 27
3.2.2 Midspan Point Load Test 2 ............................................................................................. 30
3.2.3 Quarter Point Load Test 1 ............................................................................................... 31
3.3 FRP Web Study Summary ...................................................................................................... 35
Chapter 4: HCB Relative Arch Movement ....................................................................................... 37
4.1 Instrumentation ...................................................................................................................... 37
TABLE OF CONTENTS

iv
4.2 Photogrammetry Results and Discussion ................................................................................ 39
4.2.1 Midspan Point Load Test 1 ............................................................................................. 39
4.2.2 Midspan Point Load Test 2 ............................................................................................. 41
4.2.3 Quarter Point Load Test 1 ............................................................................................... 42
4.3 LVDT Results and Discussion ................................................................................................ 44
4.3.1 Midspan Point Load Test 1 ............................................................................................. 44
4.3.2 Midspan Point Load Test 2 ............................................................................................. 47
4.3.3 Quarter Point Load Test 1 ............................................................................................... 48
4.3.4 Quarter Point Load Test 2 and Test 3 .............................................................................. 50
4.4 Relative Arch Movement Summary ........................................................................................ 53
Chapter 5: Summary, Conclusions, & Recommendations ................................................................. 57
5.1 Summary ............................................................................................................................... 57
5.2 Conclusions ........................................................................................................................... 58
5.3 Recommendations .................................................................................................................. 59
References............................................................................................................................................. 61

v
Figure 1-1: Hybrid-Composite Beam components (Hillman) .......................................................2
Figure 1-2: Cross-section of a Hybrid-Composite Beam ..............................................................3
Figure 1-3: A hybrid-composite beam without the lid or concrete arch ........................................4
Figure 1-4: Support Conditions ...................................................................................................5
Figure 1-5: Phase I distributed load test in progress .....................................................................6
Figure 1-6: Screw, washer and string prior to being embedded inside the beam ...........................7
Figure 1-7: LVDT attached to metal frame ..................................................................................7
Figure 1-8: Phase II midspan point load test setup .......................................................................8
Figure 1-9: Phase II quarter point load test setup .........................................................................9
Figure 1-10: PhotoModeler RAD target ..................................................................................... 10
Figure 2-1: Elevation view of the HCB with the RAD target staggered grid .............................. 12
Figure 2-2: RAD target spacing ................................................................................................. 12
Figure 2-3: One of the RAD targets embedded in the concrete arch ........................................... 13
Figure 2-4: Scale and axes established in PhotoModeler ............................................................ 15
Figure 2-5: Dial gauges set up at the pin support to measure horizontal movement .................... 16
Figure 2-6: Adjusting the x-y coordinate plane .......................................................................... 17
Figure 3-1: Elevation view and cross-sections of the FRP web initial conditions ....................... 19
Figure 3-2: Cross-section of the beam identifying horizontal cross-section locations ................. 20
Figure 3-3: Cross-section of the beam at the quarter point identifying initial web imperfections 20
Figure 3-4: Cross-section of the possible bottom corner of the FRP web initial conditions ........ 21
Figure 3-5: Possible imperfections in the HCB initial cross-section at midspan ......................... 22
Figure 3-6: Cross-sections of the absolute FRP web surface due to the Uniform Load Test ....... 23
Figure 3-7: Cross-sections of the absolute FRP web surface due to the Midspan Point Load Test
................................................................................................................................................. 24
Figure 3-8: Cross-sections of the relative movement of the FRP web surface due to the concrete
pour .......................................................................................................................................... 25
Figure 3-9: Cross-section of FRP web deformation due to concrete pressure ............................. 26
LIST OF FIGURES

vi
Figure 3-10: Cross-sections of the absolute FRP web initial conditions for Phase II .................. 26
Figure 3-11: Cross-sections of the FRP web at y = 0 in. comparing various initial conditions .... 27
Figure 3-12: Cross-sections of the relative FRP web movement at y = 0 in. at 5 kip load
increments for Midspan Point Load Test 1 ................................................................................ 28
Figure 3-13: Test set-up for both Midspan Point Load Tests ...................................................... 29
Figure 3-14: Lateral, vertical, and rotational displacement due to a skewed applied load ........... 29
Figure 3-15: Cross-sections of the FRP web at y = 0 in. comparing Midspan Point Load Test 1
and Test 2 ................................................................................................................................. 30
Figure 3-16: Cross-sections of the relative FRP web movement due to 15 kips for Midspan Point
Load Test 2 ............................................................................................................................... 31
Figure 3-17: Cross-sections of the FRP web at y = 0 in. comparing Phase I and Quarter Point
Load Test 1 initial conditions .................................................................................................... 32
Figure 3-18: Test set-up for Quarter Point Load Test 1 .............................................................. 32
Figure 3-19: Cross-sections of the relative FRP web movement at y = 0 in. at 5 kip load
increments for Quarter Point Load Test 1 .................................................................................. 33
Figure 3-20: Cross-sections of the relative FRP web movement comparing local displacement
due to 10 kips and 15 kips ......................................................................................................... 34
Figure 3-21: Cross-sections of the relative FRP web movement at y = 0 in. at 5 kip unloading
increments for Quarter Point Load Test 1 .................................................................................. 35
Figure 3-22: Cross-sections of FRP web surface summary ........................................................ 36
Figure 4-1: Elevation view of the HCB with RAD targets related to relative arch movement
identified ................................................................................................................................... 37
Figure 4-2: Elevation view of HCB with LVDT locations identified.......................................... 38
Figure 4-3: Cross-section of LVDT instrumentation at the quarter point .................................... 38
Figure 4-4: Additional reinforcing FRP sheet located at the midspan ......................................... 39
Figure 4-5: Photogrammetry relative arch movement due to Midspan Point Load Test 1 ........... 40
Figure 4-6: Photogrammetry relative arch movement comparing Midspan Point Load Test 1 and
Test 2 ........................................................................................................................................ 42
Figure 4-7: Photogrammetry relative arch movement due to Quarter Point Load Test 1 ............. 43
Figure 4-8: Photogrammetry relative arch movement due to Quarter Point Load Test 1 at
maximum load and unloaded ..................................................................................................... 44

vii
Figure 4-9: LVDT relative arch movement for Midspan Point Load Test 1 during loading ........ 45
Figure 4-10: LVDT relative arch movement for Midspan Point Load Test 1 during unloading .. 46
Figure 4-11: Load vs. relative arch movement for Midspan Point Load Test 1 ........................... 46
Figure 4-12: LVDT relative arch movement for Midspan Point Load Test 2 during loading ...... 47
Figure 4-13: LVDT relative arch movement for Midspan Point Load Test 2 during unloading .. 48
Figure 4-14: LVDT relative arch movement for Quarter Point Load Test 1 during loading ........ 49
Figure 4-15: LVDT relative arch movement due to maximum loads for Midspan Point Load Test
1 and Quarter Point Load Test 1 ................................................................................................ 49
Figure 4-16: LVDT relative arch movement for Quarter Point Load Test 1 during unloading .... 50
Figure 4-17: LVDT relative arch movement for all Quarter Point Load Tests due to 25 kips ..... 51
Figure 4-18: LVDT plastic deformation for all Quarter Point Load Tests .................................. 52
Figure 4-19: Cross-section at the quarter point with RAD target and LVDT .............................. 53
Figure 4-20: Hypothesized cross-section of the relative arch movement at the quarter point ...... 54
Figure 4-21: Relative arch movement comparing photogrammetry and LVDT data at the
maximum and unloaded conditions for Quarter Point Load Test 1 ............................................. 55

viii
Table 2-1: Photosets with corresponding descriptions ................................................................ 14
Table 2-2: Comparison of quarter point and midspan deflections using raw and adjusted x-y
plane ......................................................................................................................................... 18
Table 4-1: Photogrammetry plastic deformation of the foam due to Midspan Point Load Test 1 41
Table 4-2: Photogrammetry relative arch movement due to 15 kips in Midspan Point Load Test 1
and Test 2 ................................................................................................................................. 41
Table 4-3: Photogrammetry and LVDT comparison at quarter point for Quarter Point Load Test
1................................................................................................................................................ 55
LIST OF TABLES

1
1.1 Research Motivation
There were two main purposes in using photogrammetry as part of the Hybrid-Composite
Beam research at Virginia Tech funded by the Virginia Department of Transportation. The first
purpose was to detect out-of-plane movement of the web of the Fiber Reinforced Plastic (FRP)
shell before, during, and after various loads were applied. The goal was to identify initial
imperfections in the beam, as well as movement such as shear buckling and other out-of-plane
deformations of the web.
The second purpose was to detect vertical displacement of the concrete arch within the FRP
shell. If the arch was moving within the shell, the assumptions for the distribution of the loads
among the various structural components may change. In addition, the impact this arch
movement may have on the supporting foam must be considered. The implications associated
with these results will not be fully discussed in this report, but the results will be used for
additional analysis made by the Virginia Tech team of researchers working on the project.
1.2 Introduction to Hybrid-Composite Beams and Test Program
1.2.1 Concept
Invented by John R. Hillman, Hybrid-Composite Beams (HCBs) combine typical structural
materials in a way that maximizes efficiency (Hillman 2012). A ¼ in. thick FRP shell forms a
box to enclose the other materials and provide shear strength for the member. Self-consolidating
concrete forms an arch spanning the length of the beam to serve as the main structural element
carrying compression forces, and steel prestressing strands embedded in resin lay along the
bottom of the box, tying the arch ends together and creating resistance to tension in the bottom of
the beam during bending. All the remaining empty space is filled with lightweight foam.
Typical shear reinforcement embedded in the concrete arch extends out of the FRP shell into a
concrete deck. Figure 1-1 provides a three-dimensional perspective of the beam components.
CHAPTER 1: INTRODUCTION

2
Figure 1-1: Hybrid-Composite Beam components (Hillman)
Hybrid-Composite Beams are being implemented in bridges around the country for a variety
of reasons. Using HCBs lowers construction costs and lends itself towards a popular method of
construction known as Accelerated Bridge Construction. Before the concrete is placed into the
arch, a typical HCB weighs approximately 10% of an equivalent concrete beam and 33% of an
equivalent steel beam. As a result, multiple beams can be transported on the back of a tractor
trailer to a job site, as opposed to one or two prestressed concrete or steel beams. In addition to
this, smaller cranes can be used to unload the beams and move them into place on site. This
saves the contractor transportation costs and equipment costs, in addition to minimizing traffic
delays due to construction (Hillman).
Bridges using HCBs have been built around the country in states including New Jersey,
Colorado, Illinois, and Maine (Hillman). In 2009, the University of Maine conducted a series of

3
tests on an HCB for the Maine Department of Transportation prior to the installation of HCBs for
the Knickerbocker Bridge. Many important observations and conclusions were made during
these tests (Snape and Lindyberg 2009). Similarly, the Virginia Department of Transportation
(VDOT) has begun to investigate using HCBs for short span bridges. VDOT funded research at
Virginia Tech to test the beams in various ways in the hopes of confirming that the beams can be
implemented across the state. The Tide Mill Bridge in the Fredericksburg District is the first site
at which VDOT is planning to use hybrid-composite beams. Virginia Tech simulated the Tide
Mill Bridge in the lab in order to generate results comparable to what will be expected in the
field. The specific test set-up and procedures are discussed in Section 1.2.2 of this report.
Hybrid-Composite Beams can be designed to any combination of shape and size depending
on the needs of the particular site. For the purposes of this research at Virginia Tech, three 44 ft
long beams were tested. At either end of the beams, the flanges were at a 45 degree skew to
mimic the Tide Mill Bridge plans and analyze HCB behavior in a skewed condition. The cross-
section of the FRP shell was approximately 2 ft wide and 1 ft 9 in. deep with flanges made of
FRP and foam extending out 1 ft on either side. Twenty-two, ½ in. diameter steel strands were
placed in resin along the bottom of the FRP box. Figure 1-2 is a cross-section of a typical beam.
Figure 1-2: Cross-section of a Hybrid-Composite Beam

4
1.2.2 Test Procedures
Three main test phases were conducted, each phase with its own unique purpose. The first
two phases tested each beam individually whereas the third phase involved all three beams with
a concrete deck on top to simulate the Tide Mill Bridge. This report only discusses results from
the first two phases of testing.
1.2.2.1. Instrumentation and Support Conditions
When the three HCBs arrived at the lab, the FRP lids were unattached and the concrete
arches had not yet been placed (Figure 1-3). Wire pots were attached to the bottom of the FRP at
the midspan and both quarter points to monitor deflection. Two dial gauges were set up at the
face of one of the supports to detect lateral movement of the top and bottom of beam. Linear
Variable Differential Transformers (LVDTs) were used to detect relative vertical arch movement
at the midspan and one quarter point. Among other purposes, it was hoped that these additional
sources of instrumentation would provide data to cross-check and confirm the validity of the
results found using photogrammetry.
Figure 1-3: A hybrid-composite beam without the lid or concrete arch

5
The support conditions of the beams were simplified by using a pin connection on one end
and a roller connection on the other (Figure 1-4). This created a determinate system for the
individual HCB tests and allowed the support reactions to be calculated using simple statics
principles. The pin and roller supports for each beam were placed perpendicular to the length of
the beam.
Figure 1-4: Support Conditions
1.2.2.2. Phase I: Individual beam without the concrete arch
The first phase of testing was done after the FRP lids were adhered to the beam but before
the self-consolidating concrete was placed in the arch. The general purpose of testing each beam
at this phase was to confirm the properties of and produce a deeper understanding of the behavior
of the FRP shell. For this report, the photogrammetry data from Phase I was used to determine
initial imperfections in the beam web and detect any out-of-plane deformation during tests. Two
test configurations were used, and each test was conducted twice, to make a total of four tests for
each beam. To ensure known end conditions, each beam was placed on a steel pin at one support
and a steel roller on the other support.
The first test simulated a distributed load similar to the anticipated weight of the wet
concrete that would later be placed inside the arch. A total of 85 steel angles, each weighing 25

6
lbs, were used to create a distributed load of approximately 50 plf. As shown in Figure 1-5, the
angles were placed adjacent to one another along the length of the beam. The second test
configuration consisted of a single 250 lb. point load at the midspan of the beam. To achieve this
load, ten of the angles used in the previous test were stacked on top of one another at the
midspan.
Figure 1-5: Phase I distributed load test in progress
1.2.2.3. Phase II: Individual beam after the concrete arch pour
Upon completion of Phase I, the shear reinforcement for the deck was placed and tied. In
addition, a ¼ in. diameter hole was drilled from the bottom of the arch downward through the
bottom of the FRP shell at the midspan and at one of the quarter points. At each location, a
string was tied to a 3 in. long screw and fed through the hole. The screw had a washer on one
end that plugged the hole in the foam to prevent concrete from entering the hole. Figure 1-6
shows the screw, washer, and string before being placed inside the beam.

7
Figure 1-6: Screw, washer and string prior to being embedded inside the beam
Self-consolidating concrete was then pumped into the arches and allowed to cure for six
weeks before Phase II testing commenced. The screws remained embedded in the concrete arch
after the pour with the strings hanging out of the bottom of the beam. The exposed end of the
string was attached to an LVDT, which was secured to a metal frame attached to the sides of the
FRP shell, as seen in Figure 1-7.
Figure 1-7: LVDT attached to metal frame

8
Similar to Phase I, the beams were tested individually for Phase II and were subjected to two
different load scenarios. The purpose of Phase II was to validate assumed HCB behavior
mechanisms. Because of the complex nature of a hybrid-composite beam, it is relatively difficult
to determine which structural elements carry the different aspects of the forces applied to the
beam. By testing the beams individually, it was hoped that a greater understanding of individual
beam behavior will be acquired, and that the results would be similar to the data from the
Knickerbocker Bridge tests in Maine.
For all tests done in Phase II, a hydraulic static actuator was used to apply the load in 5 kip
increments. The same pin and roller connections that were used in Phase I were used at the
supports for Phase II. For the first load scenario, the static actuator was centered at the midspan
and the beam was loaded to a maximum load of 15 kips. The test setup is shown in Figure 1-8.
As in Phase I, each test was repeated to ensure consistency and quality of the results.
Figure 1-8: Phase II midspan point load test setup

9
The second load scenario in Phase II was composed of two equivalent loads at the quarter
points. To achieve this, the same setup was used from the first scenario; however an additional
steel beam reaching to the two quarter points was placed underneath the load actuator to spread
the load into two equal loads applied at the quarter points. Figure 1-9 displays the setup for the
second load scenario. The beam was loaded to a total of 25 kips at maximum load, resulting in
each quarter point experiencing a 12.5 kip load simultaneously. This test was also performed
twice for each beam.
Figure 1-9: Phase II quarter point load test setup
1.3 Introduction to Photogrammetry
Photogrammetry is the use of photographs to determine geometric properties of an object.
The two main types of photogrammetry in practice today are aerial photogrammetry and close-
range photogrammetry. Aerial photogrammetry involves using a camera mounted to an aircraft
which takes photos as the plane flies along a specific flight path, and it is used most commonly

10
to create topographical maps. For close-range photogrammetry, the camera is typically hand-
held or attached to a tripod. This type of photogrammetry is used when creating models of
objects such as cars, buildings, or other engineering structures (Jiang et al. 2008). Therefore,
close-range photogrammetry was chosen for this research.
There is a number of different software programs used in practice for close-range
photogrammetry projects. Eos Systems PhotoModeler, the software used for this research, was
created in the early 1990’s and has developed into a highly capable three-dimensional modeling
system that can be used for a variety of purposes including architecture, archeology, engineering,
forensics, and geology (2011). When creating a project in PhotoModeler, a “.cam” file specific
to the type of camera being used for all photos is chosen. That file allows the software to
automatically take distortion from the camera lenses into account when generating a three-
dimensional model from the images. For this project, a Nikon D7000 camera with a NIKKOR
20 mm, f/2.8 lens was used.
There are multiple ways to create three-dimensional point clouds in PhotoModeler, one
of which is to use Ringed Automatically Detected (RAD) targets. Each RAD target has a unique
code, similar to a barcode, which is recognized by PhotoModeler and associated with an
identification number. Figure 1-10 is an example of a RAD target.
Figure 1-10: PhotoModeler RAD target
In 2011, a research project at Virginia Tech determined the accuracy and precision of
PhotoModeler in close-range settings (Orsa 2011). These findings were summarized into five
simple recommendations to ensure an accurate 3D point cloud. These recommendations were:

11
1) To obtain a 45 degree angle of separation between photos
2) To ensure 10 or more points are overlapping in adjacent photos
3) To place approximately 4ft between the camera and the points of interest
4) To use field calibration
5) To use high residual removal
If these parameters are followed, 1/1000 in. accuracy can be expected from the results (Orsa
2011). In the HCB research, these five recommendations were followed as closely as possible to
ensure precision and accuracy. The specific procedures of how the RAD targets were positioned,
how the photos were taken, and the frequency of photo sets during testing are discussed in
Chapter 2.

12
2.1 RAD Target Instrumentation
For the purposes of this research, it was assumed that when a single HCB is subjected to a
symmetric load, the response of the beam will also be symmetric. Therefore, RAD targets were
placed in a staggered grid on one side of an HCB from one support to the midspan as seen in
Figure 2-1. The targets were spaced approximately 4 in. center-to-center vertically, and each
column was 4 in. apart. Every-other column was staggered down 2 in. The first column of
targets was placed 12 in. from the edge of the beam, and the bottom row of targets was 2.5 in.
from the bottom (Figure 2-2).
Figure 2-1: Elevation view of the HCB with the RAD target staggered grid
Figure 2-2: RAD target spacing
CHAPTER 2: PHOTOGRAMMETRY PROCEDURE

13
A total of 231 RAD targets were printed on adhesive paper and attached to the side of the
FRP shell in the aforementioned grid before the first test of Phase I. After the concrete arch was
placed and cured, ¼ in. holes were drilled through the FRP web at five locations spaced
approximately 3 ft apart along the arch profile. Five additional targets were printed and attached
to screws that were embedded into the concrete arch through the holes as seen in Figure 2-3.
The purpose of embedding these five targets in the arch was to detect if the arch would move
vertically relative to the FRP shell during the various test scenarios.
Figure 2-3: One of the RAD targets embedded in the concrete arch
2.2 Defining the photosets
For the purposes of this research, a photoset is defined as the 60 or more photos that were
taken of the RAD targets on the beam at a specific time during the testing process.
Approximately five minutes were needed to take each photoset. During this time, the hydraulic
actuator was closely monitored to maintain a consistent applied load. Table 2-1 lists the
photosets that were taken during Phase I and Phase II of testing. The photos for each photoset
were taken from approximately the same locations to provide consistency in the models.

14
An initial photoset was taken prior to any load being applied to the beam. The information
gathered from this initial condition was critical because it indicated initial imperfections and
deformations of the beam web. Due to the low magnitude of the applied loads in Phase I,
photosets were only taken at the maximum load for each test scenario. Within hours after the
self-consolidating concrete was pumped into the arch, a photoset was taken to detect how the
beam responded to the weight and pressure of the concrete. Three weeks later, after installing
the five additional targets in the arch, a photoset defining the initial conditions of Phase II was
recorded.
Table 2-1: Photosets with corresponding descriptions
Phase Photoset Name Description
Phase I
Phase1_Initial Before any loadings were applied to the beam
Phase1_UniformLoad At maximum uniformly distributed load (approx. 50 plf)
Phase1_MSPointLoad At maximum midspan point load (250 lbs.)
Phase1_PostConcretePour Immediately after the concrete pour
Phase2_Initial Immediately after installing the 5 targets in the arch
Phase II
Phase2_MS_T1_I Initial Phase II Midspan Point Load Test 1
Phase2_MS_T1_05 05 kips during Phase II Midspan Point Load Test 1
Phase2_MS_T1_10 10 kips during Phase II Midspan Point Load Test 1
Phase2_MS_T1_15 15 kips during Phase II Midspan Point Load Test 1
Phase2_MS_T2_I Initial Phase II Midspan Point Load Test 2
Phase2_MS_T2_15 15 kips during Phase II Midspan Point Load Test 2
Phase2_QTR_I Initial Phase II Quarter Point Test 1
Phase2_QTR_05 05 kips during Phase II Quarter Point Test 1
Phase2_QTR_10 10 kips during Phase II Quarter Point Test 1
Phase2_QTR_15 15 kips during Phase II Quarter Point Test 1
Phase2_QTR_20 20 kips during Phase II Quarter Point Test 1
Phase2_QTR_25 25 kips during Phase II Quarter Point Test 1
Phase2_QTR_20U 20 kips (unloading) during Phase II Quarter Point Test 1
Phase2_QTR_15U 15 kips (unloading) during Phase II Quarter Point Test 1
Phase2_QTR_10U 10 kips (unloading) during Phase II Quarter Point Test 1
Phase2_QTR_05U 05 kips (unloading) during Phase II Quarter Point Test 1
Phase2_QTR_U Unloaded Phase II Quarter Point Test 1

15
For both midspan point load tests and the first quarter point load test, an additional initial
photoset was taken immediately before testing began. Photosets were taken at 5 kip load
increments up to the maximum load of 15 kips for the first midspan point load test and just at the
maximum load for the second midspan point load test. During the first quarter point load test,
photosets were taken at 5 kip increments during loading and unloading to achieve a total of 11
photosets.
2.3 Creating 3D models in PhotoModeler
After a test, the corresponding photosets were imported into PhotoModeler as separate
project files and a three dimensional model was created for each photoset. The distance between
the first and fifth RAD targets on the top row was measured in the lab to be 31.7 in., and this
distance was used as the scale for each photoset. To determine the out-of-plane deformation, the
origin for each model was established at the RAD target in the bottom left corner, with the
positive x-axis extending horizontally to the right and the positive y-axis extending vertically
upward. Therefore, positive dimensions in the z-direction extend out of the page. Figure 2-4
shows the scale and axes established in PhotoModeler. Once a three dimensional model was
scaled and an origin was established, the model was exported as a text file with the x, y, and z
coordinates for each target. These coordinates were then imported into Microsoft Excel, where
they were sorted and adjusted as necessary.
Figure 2-4: Scale and axes established in PhotoModeler

16
2.4 Adjusting the coordinate system
For each photoset during a particular test, the z-coordinates generated by PhotoModeler were
subtracted from the z-coordinates generated for the initial condition of that test. By doing this,
the out-of-plane deformation due to the specific loads applied during the test could be
determined. Both the relative and raw out-of-plane deformations were analyzed and are
discussed in depth in Chapter 3:Chapter 3:.
In addition to this, the x and y-coordinates were adjusted to take the rotation of the beam
during testing into account. Because the coordinate system for each model was on the beam, the
x-y plane rotated with the beam. Therefore, the raw coordinates could not be compared
accurately between photosets. Two dial gauges that measured the horizontal movement of the
end of the beam were used to determine how much the beam rotated at each 5 kip increment
during the tests. Figure 2-5 shows the locations of the two dial gauges at the pin support.
Additional instrumentation was not installed to monitor the out-of-plane movement of the origin.
Therefore it is unknown if the x-y plane was also moving in the z-direction during testing, and
the results could not be adjusted to take any such movement into account.
Figure 2-5: Dial gauges set up at the pin support to measure horizontal movement

17
The raw Cartesian data coordinates were converted into polar coordinates using Equation 2-1
and 2-2. After that, they were “un-rotated” based on the angle of rotation found using the dial
gauges, δ (Equation 2-3). Then the adjusted polar coordinates were converted back into
Cartesian coordinates using Equations 2-4 and 2-5. Figure 2-6 provides a visual of this
adjustment.
√
Equation 2-1
Equation 2-2
Equation 2-3
Equation 2-4
Equation 2-5
Figure 2-6: Adjusting the x-y coordinate plane
Although this method does not take into account the changing curvature of the beam, it was
found that it produced results that were comparable to the deflections recorded by the wire pots.
The deflection at the quarter point that was calculated by adjusting the photogrammetry results

18
overestimated the wire pot readings by 0.1 in. on average. The midspan results were less
accurate, which was anticipated due to the unaccounted change in curvature. On average, the
midspan deflections were overestimated by 0.3 in. Table 2-2 provides the actual deflections
recorded by the wire pots and compares them to the deflections found using the raw
photogrammetry data and the adjusted photogrammetry data. Adjusting the x-y plane was a
critical step when calculating relative arch movement in 0. The inaccuracy at the midspan did
not have a significant impact on the results of the relative arch movement because the furthest of
the five embedded RAD targets was only 3ft past the quarter point.
Table 2-2: Comparison of quarter point and midspan deflections using raw and adjusted x-y plane
Photogrammetry Deflection (in.)
Actual Deflection (in.) Raw Adjusted
Test Load
(kips)
at Quarter
Point
at
Midspan
at Quarter
Point
at
Midspan
at Quarter
Point
at
Midspan
Midspan Point
Load
Test 1
5 -0.331 -0.489 -0.063 -0.087 -0.382 -0.729
10 -0.680 -1.000 -0.038 0.155 -0.728 -1.232
15 -1.050 -1.539 -0.010 0.361 -1.049 -1.726
Test 2 15 -1.044 -1.524 -0.004 0.585 -1.044 -1.505
Quarter
Point Load
Test 1
5 -0.246 -0.318 0.099 0.333 -0.154 -0.174
10 -0.527 -0.658 -0.001 0.322 -0.551 -0.797
15 -0.803 -1.001 0.021 0.556 -0.825 -1.144
20 -1.089 -1.356 0.066 0.882 -1.084 -1.431
25 -1.378 -1.720 0.059 1.027 -1.522 -2.150
20 -1.137 -1.406 -0.006 0.747 -1.327 -1.908
15 -0.902 -1.101 0.099 0.789 -1.022 -1.464
10 -0.621 -0.748 -0.008 0.437 -0.840 -1.233
5 -0.362 -0.431 -0.009 0.166 -0.603 -1.026
Unloaded -0.062 -0.047 -0.027 0.037 -0.435 -0.784

19
3.1 Phase I Results and Discussion
3.1.1 Initial Conditions
As discussed in 0, three photosets were taken during Phase I of testing, and three-
dimensional models with corresponding contour plots were created in MATLAB for each
photoset. Figure 3-1 provides the beam elevation view and cross-sections at three different
vertical locations along the surface from the initial conditions for Phase I. For this figure and all
other similar figures in Chapter 3, the horizontal cross-sections are presented for the bottom (y =
0 in.), middle (y = 6 in.), and top (y = 12 in.) rows of RAD targets. The beam cross-section in
Figure 3-2 clarifies the location of each horizontal cross-section. This model of the initial
conditions indicates that the FRP web was originally pushed out-of-plane in the positive z-
direction near the quarter point but then gradually caved into the page almost half an inch as it
approached midspan.
Figure 3-1: Elevation view and cross-sections of the FRP web initial conditions
CHAPTER 3: HCB FIBER REINFORCED PLASTIC WEB STUDY

20
Figure 3-2: Cross-section of the beam identifying horizontal cross-section locations
The horizontal cross-sections in Figure 3-1 provide valuable information in determining
where the bottom of the FRP web surface was located relative to the middle and top of the web.
From the support to the quarter point, the top and bottom of the web were flush with each other,
whereas the middle of the web pushed out of plane beyond the top and bottom to create a bulge
at the quarter point in the middle of the web. The vertical surfaces of the other HCBs were
examined visually with a hand level to determine if similar imperfections existed. All three
HCBs contain the same gradual bulge at both quarter points and on both vertical surfaces of the
FRP shell. Figure 3-3 displays a cross-section of the beam at the quarter point with the initial
imperfections identified.
Figure 3-3: Cross-section of the beam at the quarter point identifying initial web imperfections

21
Just past the quarter point, the entire surface began to sink back into the page and continued
to do so to the midspan (Figure 3-1). The bottom row of RAD targets was only 2.5 in. from the
bottom of the beam. Therefore it is probable that the bottom of the FRP shell at the midspan was
out of line with the support. Figure 3-4 provides a cross-section of the bottom corner of the
beam with the possible initial positions of the bottom of the shell. If the bottom of the shell was
perfectly straight, and all out-of-plane deformation was in the web, than a significant curved
edge would have existed along the bottom of the FRP shell. This edge was not observed when
the initial photoset was taken. Because the bottom of the FRP shell is a constant 24.5 in. wide, it
can be concluded that the beam was initially displaced laterally half an inch at the midspan.
Figure 3-4: Cross-section of the possible bottom corner of the FRP web initial conditions
Within this lateral transition from the quarter point to the midspan, the bottom of the web
surface pulled back more than the middle and top of the surface. This indicates that the top of
the vertical surface slanted out of plane in the positive z-direction relative to the bottom of the
surface. Because the other side of the beam cross-section was not instrumented, it is unknown
how the other FRP web surface was oriented. Figure 3-5 presents three possible initial beam
cross-sections at midspan, which include rotation, translation in the same direction, and

22
translation in opposite directions. It is unlikely that the beam was rotated because both ends of
the beam sat level on the supports, indicating that this rotation would have been isolated at the
midspan. Both translation scenarios are viable possibilities. Upon closer examination, it was
seen that the gap between the flange and the web was 3/16 inch on both sides of the web at the
quarter point, but only 1/8 inch on either side at the midspan, proving that the both web surfaces
tilted away from the center of the beam at the midspan (Figure 3-5c).
Figure 3-5: Possible imperfections in the HCB initial cross-section at midspan
Understanding the initial imperfections is critical for analyzing the results of the following
tests. The models of the surface generated from specific increments in the upcoming Phase I
tests were compared to this initial model to determine the relative movement of the web.

23
3.1.2 Uniform Load Test
As the beam was loaded with 100 steel angles (test set-up described in Section 1.2.2.2), the
web surface moved out-of-plane in the positive z-direction. The out-of-plane deformation
increased gradually along the length of the beam, as shown in Figure 3-6. The z-coordinates
shown in the figure are the raw, absolute values. Even though the entire vertical surface (top to
bottom) deformed evenly from the support to just past the quarter point, the surface of the web
still maintained the bulge at the quarter point.
The overall movement in the positive z-direction indicates that the applied load caused the
web surface to deform in the opposite direction as the initial imperfection. This seems counter-
intuitive initially. Typically initial imperfections are increased under applied load, not reversed.
One possible explanation for this behavior of the web is load eccentricity. As discussed in
Chapter 1:, the steel angles were applied manually to the top of the FRP lid, which introduces
human error to the experiment. Although the steel angles were centered as well as possible over
the cross-section of the beam, it is conceivable that they were not exactly centered, resulting in a
load eccentricity that would cause web movement in the opposite direction.
Figure 3-6: Cross-sections of the absolute FRP web surface due to the Uniform Load Test

24
3.1.3 Midspan Point Load Test
The cross-sections of the absolute position of the FRP web due to the Midspan Point Load
Test are provided in Figure 3-7. From the support to the quarter point, the beam behaved similar
to the Uniform Load Test. The web surface gradually and uniformly pushed out-of-plane in the
positive z-direction. However, from the quarter point to the midspan, the FRP web pushed out in
the positive z-direction twice as much as it did during the Uniform Load Test. The FRP web, as
a whole, deformed out-of-plane to such an extent at the midspan that it negated the initial
imperfection. The load was applied directly to the midspan, so it is logical that the behavior at
the midspan was more severe due to this test than the Uniform Load Test. Unintentional load
eccentricity is the assumed cause of the FRP web deformation opposing the initial imperfection
for the Midspan Point Load Test.
Figure 3-7: Cross-sections of the absolute FRP web surface due to the Midspan Point Load Test

25
3.1.4 Post Concrete Pour of the Arch
Within hours after the concrete arch was placed, another set of photos was taken. Figure 3-8
shows the cross-sections generated from the post concrete pour photoset with z-coordinates
relative to the initial condition. There was a slow and steady increase in out-of-plane
deformation from the support to the midspan. Assuming the same logic as before, that the beam
width along the bottom of the shell does not change, and that the deformation of the bottom row
of RAD targets is representative of the movement of the bottom of the FRP shell, it is
hypothesized that the entire beam laterally displaced out-of-plane in the positive z-direction. It is
unknown why the self-weight of the concrete would cause the beam to laterally displace more
than an inch relative to the initial conditions. The top of the FRP web surface was consistently
further out-of-plane than the middle and bottom of the surface due to the additional pressure
within the arch and the vertical fin that the concrete exerted on the inside of the beam (see Figure
3-9).
Figure 3-8: Cross-sections of the relative movement of the FRP web surface due to the concrete pour

26
Figure 3-9: Cross-section of FRP web deformation due to concrete pressure
3.2 Phase II Results and Discussion
As mentioned in Chapter 2, five additional RAD targets were anchored into the concrete arch
three weeks after the arch was placed, at which point an initial photoset for Phase II was taken.
The cross-sections of the FRP web are provided in Figure 3-10. Former local behaviors, such as
the bulge in the middle of the surface at the quarter point and the vertical slant in the positive z-
direction at the midspan, were both still apparent. Another local surface behavior, the vertical
slant in the first 5ft past the support, was first seen after the concrete pour and remained in the
Phase II initial conditions. In addition to this, the global behavior of the surface changed
significantly compared to immediately after the concrete pour. The entire surface had moved in
the negative z-direction towards the raw initial conditions. This trend is discussed further in the
next section.
Figure 3-10: Cross-sections of the absolute FRP web initial conditions for Phase II

27
3.2.1 Midspan Point Load Test 1
The midspan point load tests began three weeks after the five additional RAD targets were
installed. The initial conditions of Midspan Point Load Test 1 contained the same local
imperfections seen in previous states. Globally however, the FRP web surface from the quarter
point to the midspan continued to move in the negative z-direction. Figure 3-11 provides cross-
sections at the bottom row of RAD targets (y = 0 in.) at the Phase I initial conditions,
immediately after the concrete pour, Phase II initial conditions, and Midspan Point Load Test 1
initial conditions. This figure demonstrates a trend in the global movement of the FRP web over
time. As mentioned previously in this chapter, when the concrete was pumped into the beams, it
caused the entire beam to push out-of-plane in the positive z-direction. Three weeks after the
pour, when the Phase II initial conditions were recorded, the surface had moved substantially
back towards the Phase I initial condition. After another three weeks, when Midspan Point Load
Test 1 was conducted, the bottom row of RAD targets (and therefore the entire beam) had
continued to pull back towards the Phase I initial condition.
Figure 3-11: Cross-sections of the FRP web at y = 0 in. comparing various initial conditions
Deformation of the web surface was documented at 5 kip load increments as the beam was
loaded during Midspan Point Load Test 1. Figure 3-12 provides the cross-sections at the bottom
row of RAD targets corresponding with each load increment of the test. These cross-sections are
all relative to the initial conditions for the test. At 5 kips, the FRP web surface did not

28
experience any significant local deformation. Once the load increased to 10 kips, the top of the
surface displaced more in the positive z-direction than bottom of the surface. This indicates that
either the initial vertical slant in the web at that location was enhanced by the applied load or that
the beam rotated. The degree of relative displacement between the top and bottom of the FRP
web decreased as the load increased to 15 kips. If the vertical slant is accounted for by assuming
the initial imperfection was enhanced under an applied load, than it can be assumed that the slant
would increase as the load increased. Because the surface responded in the opposite direction as
the load increased to 15 kips, it is hypothesized that the beam rotated.
Similar to the tests in Phase I, the FRP web laterally displaced in the positive z-direction
under an applied load. However, more lateral displacement was detected due to 10 kips than due
to 15 kips (Figure 3-12). The manner in which the beam was loaded is an expected contributor
to this effect. The hydraulic load actuator applied a load to a stiffened steel W-shape that rested
on top of another steel member, which sat on a pad placed on top of the beam. Figure 3-13
displays the load set-up. The actuator was level; however it is probable that the load was not
transferred perfectly straight into the center of the cross-section of the beam due to the number of
components of the set-up. It is hypothesized that the applied load was not plumb, causing the
beam to not only deflect downward but laterally as well. Applied to the top of the cross-section,
the horizontal component of the load accounts for the minor rotation in the beam seen in the
local behavior mentioned previously (Figure 3-14). The decrease in lateral deflection from 10
kips to 15 kips can also be explained using the same hypothesis. It is possible that as the applied
load increased from 10 kips to 15 kips, a part of the set-up shifted just enough to decrease the
angle of the applied load to the beam. A decrease in the applied load angle would decrease the
lateral component of the force, resulting in less lateral displacement and less rotation.
Figure 3-12: Cross-sections of the relative FRP web movement at y = 0 in. at 5 kip load increments for Midspan Point
Load Test 1

29
Figure 3-13: Test set-up for both Midspan Point Load Tests
Figure 3-14: Lateral, vertical, and rotational displacement due to a skewed applied load

30
The movement of the FRP web surface was not documented during the unloading process of
Midspan Point Load Test 1, therefore it is unknown if deformation of the surface or lateral
displacement remained upon completion of the first test.
3.2.2 Midspan Point Load Test 2
The initial conditions of Midspan Point Load Test 2 were recorded approximately 6 hours
after the first test was completed, and indicated that the bulge of the surface at the quarter point
and the vertical slant near the support and midspan remained along the surface of the FRP web.
The magnitude of these initial imperfections did not change, indicating that no permanent
deformation of the surface occurred during the unloading process of Test 1. Globally, the
surface remained out-of-plane in the positive z-direction. It is hypothesized that after the beam
was unloaded from the first test, it did not immediately return to the initial condition of that test,
but rather was in the process of gradually shifting back to its original position. Figure 3-15
demonstrates the position of the bottom row of RAD targets at the initial conditions and
maximum load of Test 1, as well as the initial conditions of Test 2.
Figure 3-15: Cross-sections of the FRP web at y = 0 in. comparing Midspan Point Load Test 1 and Test 2
The state of the surface was only recorded at the maximum load, 15 kips, for Midspan Point
Load Test 2. No local deformation occurred during the test, as seen by the bottom, middle, and
top of the surface acting together in Figure 3-16. Similar to previous tests, the dominant change

31
in the beam surface was lateral displacement. The major difference between this test and any
previous tests is that the beam displaced in the negative z-direction under applied load.
Continuing with the same hypothesis regarding skewed loading, it is assumed that the applied
load was skewed in the opposite direction as it was for Midspan Point Load Test 1, causing
lateral displacement in the opposite direction. The behavior of the web upon completion of the
test was not documented for Midspan Point Load Test 2, therefore it is unknown if any residual
lateral displacement existed.
Figure 3-16: Cross-sections of the relative FRP web movement due to 15 kips for Midspan Point Load Test 2
3.2.3 Quarter Point Load Test 1
After completion of the midspan point load tests, the beam remained unloaded for three days
before the quarter point load tests began. Immediately before Quarter Point Load Test 1
commenced, the initial condition of the beam was documented. As in all previous tests, the same
local imperfections existed in the FRP web surface. Figure 3-17 shows the position of the
bottom row of RAD targets for the initial conditions of the quarter point test as well as the initial
conditions of Phase I. The position of the beam was not recorded immediately after Midspan
Point Load Test 2. However, the initial conditions for Quarter Point Load Test 1 indicate the
web surface returned to its initial condition before the concrete was placed. This supports the
hypothesis that when the beam remained unaffected, its natural tendency was to return to its
initial condition.

32
Figure 3-17: Cross-sections of the FRP web at y = 0 in. comparing Phase I and Quarter Point Load Test 1 initial conditions
Section 1.2.2.3 of this report outlines the test set-up for the quarter point load tests. Similar
to the midspan point load tests, the hydraulic load actuator did not apply the load directly to the
beam. In order to apply two equivalent loads simultaneously to the quarter points of the beam, a
steel W-shape was placed on top of two supporting steel members at the quarter points. The
actuator applied the load to the center of the steel beam, as shown in Figure 1-9. A closer view
of the specific set-up at the examined quarter point is provided in Figure 3-18. Due to the load
set-up, it is probable that the applied load was not transmitted perfectly plumb into the center of
the cross-section of the beam.
Figure 3-18: Test set-up for Quarter Point Load Test 1

33
As seen in the midspan tests, the overriding behavior of the FRP web during the quarter point
load test was the lateral displacement, which supports the hypothesis of a skewed applied load.
Figure 3-19 provides the deformation of the bottom row of RAD targets on the FRP web at five
kip load increments during the loading process of Quarter Point Load Test 1. The beam did not
move laterally due to 5 kips, but by the time the total applied load reached 10 kips, the midspan
had deflected substantially out-of-plane. As in Midspan Point Load Test 1, the lateral
deformation decreased as the load increased from 10 kips to 15 kips. However, after this point,
the displacement steadily increased with applied load until the maximum total load of 25 kips
was achieved. It is hypothesized that in the early stages of loading, the test set-up shifted twice
to cause this dramatic increase in lateral deformation at 10 kips and following reduction due to
15 kips. It appears as though the degree of the skew of the applied load decreased from 10 kips
to 15 kips and then remained constant for the rest of the loading process. The continual increase
in lateral displacement from 15 kips to 25 kips can be explained by the increase in the horizontal
component of the applied load.
Figure 3-19: Cross-sections of the relative FRP web movement at y = 0 in. at 5 kip load increments for Quarter Point
Load Test 1
The local behavior of the FRP web during Quarter Point Load Test 1 can also be accounted
for with the skewed load hypothesis. Only at 10 kips, the load assumed to have the greatest
angle to the applied load, did the top of the FRP web displace more than the middle and the
bottom. This demonstrated the same rotation tendency that was seen in Midspan Point Load Test
1. Figure 3-20 displays the bottom, middle, and top rows of RAD targets due to 10 kips and 15
kips. The local behavior due to the other load increments resembles that of 15 kips.

34
Figure 3-20: Cross-sections of the relative FRP web movement comparing local displacement due to 10 kips and 15 kips
The behavior of the FRP web was recorded at five kip load increments during the unloading
process of Quarter Point Load Test 1 as well. The movement of the bottom of the FRP web
surface during unloading, relative to the initial condition for the test, is shown in Figure 3-21. As
the load decreased from 25 kips to 15 kips, the magnitude of lateral deformation decreased
correspondingly. However, the lateral displacement increased as the load dropped to 10 kips,
mirroring the behavior at 10 kips during loading. Assuming that an increased load from 10 kips
to 15 kips would cause the test set-up to shift in such a way that would decrease the angle of the
applied load, then it is reasonable to assume that as the beam was unloaded from 15 kips to 10
kips this shift would be undone, causing the angle of the applied load to increase. As mentioned
previously in the chapter, an increase in the angle of the applied load would increase the
horizontal component of the load, resulting in a greater lateral and rotational displacement of the
beam. The same local rotational displacement of the web surface seen at this point in the loading
process (Figure 3-20) was also detected in the unloading process.
After this, the lateral displacement decreased as the load decreased to 5 kips, but instead of
returning to its original position upon completion of the test, the surface deflected out-of-plane in
the positive z-direction more than it had under the maximum load. While the behavior of the
web surface during testing can be explained with the skewed applied load hypothesis, the sudden
deflection out-of-plane when the beam was unloaded seems inconsistent. Because this was the
last photoset taken in Phase II, it is unknown if the surface withdrew back towards its initial
position over time.

35
Figure 3-21: Cross-sections of the relative FRP web movement at y = 0 in. at 5 kip unloading increments for Quarter
Point Load Test 1
3.3 FRP Web Study Summary
Through the FRP web study using photogrammetry, a number of trends in the behavior
surface were detected. The bulge in the middle of the FRP surface at the quarter point and the
slant of the surface in the positive z-direction from the quarter point to the midspan were the two
major local imperfections in the web that were found in the initial conditions of Phase I and
remained for every model, regardless of the magnitude of the applied load. Beyond these initial
imperfections, no local deformations in the FRP web occurred during the tests. Shear half-waves
and other forms of local buckling were not detected in the surface due to the relatively low
magnitude of the applied loads. Because the beams were used for a third phase of testing (not
discussed in this report), the range of all applied loads was intentionally kept substantially below
strength limits to avoid permanent damage to the beams. It is anticipated that local deformations
in the web would be detected under loads approaching strength limit states.
A hypothesis was formed to account for lateral and rotational displacement of the beam. If
the applied load was not perfectly plumb in relation to the cross-section of the beam, then a
lateral component to the force would have formed. Depending on the magnitude and skew of the
applied load, this lateral force was great enough to displace the beam laterally and rotationally.
The web surface from the quarter point to the midspan proved to be considerably more flexible

36
in this regard than the surface extending from the support to the quarter point. This is not
surprising considering the center of any un-braced length will be more flexible than the supports.
Another important trend that was detected during the study was the tendency of the surface to
gravitate towards its most basic initial condition when left undisturbed. Figure 3-22 summarizes
location of the bottom of the FRP web at the initial condition of Phase I and at the initial
condition for each test. Although the concrete pour caused the web to displace laterally
significantly more than any other scenario, the position of the web after 3 weeks (Phase II Initial)
and 6 weeks (Midspan Test 1 Initial) display the tendency of the surface to retreat back to its
original position. It is hypothesized that the lateral displacement of the beam did not rebound to
its pre-test condition immediately after the test was completed but rather that it did so gradually.
This theory accounts for the initial conditions of Midspan Point Load Test 2, recorded just six
hours after Test 1, being further displaced than those of Test 1. After three days of inactivity, the
initial conditions of Quarter Point Load Test 1 were documented, demonstrating that the surface
returned to its most basic initial condition.
Figure 3-22: Cross-sections of FRP web surface summary

37
4.1 Instrumentation
During Phase I, the concrete arch had not yet been placed. Therefore, an analysis of relative
arch movement is not applicable. All instrumentation related to relative arch movement was
finalized after Phase I had been completed. Everything discussed from this point forward in the
chapter is related to Phase II.
The relative movement of the concrete arch within the FRP shell was measured in two ways.
In the first method, movement of the additional five RAD targets embedded in the concrete arch
was compared to the movement of the nearest corresponding FRP RAD target. The arch RAD
targets begin approximately 3 ft from the end of the beam and are spaced at approximately 3 ft
increments along the arch profile. The spacing of these five targets is not an exact increment
because they were installed after the FRP RAD target grid was established. Therefore, the arch
targets were placed around the existing FRP targets with as close to 3 ft spacing as possible.
Using this pattern, the fifth target was embedded approximately 3 ft to the inside of the quarter
point. Additional targets were not installed beyond this point because the arch profile was too
high in the cross-section of the beam and was blocked by the beam flange. Consequently, it was
physically impossible to embed a target in the arch. Figure 4-1 provides an elevation view of the
beam from the support to the midspan with the arch profile outlined. The blue stars represent the
five RAD targets embedded in the concrete arch and the green circles represent the RAD targets
on the FRP that were used to determine the relative movement of the arch at each designated
location.
Figure 4-1: Elevation view of the HCB with RAD targets related to relative arch movement identified
CHAPTER 4: HCB RELATIVE ARCH MOVEMENT

38
The second method of detecting relative arch movement used two Linear Variable
Differential Transformers (LVDTs), one near the midspan and one near the quarter point. The
exact locations of the LVDTs are shown in Figure 4-2. Section 1.2.2.3 of this report discusses
the specific setup of the LVDT instrumentation. A cross-section of the beam at the quarter point
is provided in Figure 4-3. This cross-section displays the screw embedded in the concrete arch
with an attached string extending downward through a hole in the foam and FRP shell to the
LVDT. The LVDT is connected to a metal frame that is anchored into the sides of the FRP shell.
The same set-up was used at the midspan.
Figure 4-2: Elevation view of HCB with LVDT locations identified
Figure 4-3: Cross-section of LVDT instrumentation at the quarter point

39
A sheet of additional FRP supported the arch at the midspan of the beam. The sheet was 8ft
4 in. long and was installed during the beam’s fabrication to provide additional stability for the
beam during transit before the concrete was placed. Figure 4-4 shows the FRP sheet that
separated the arch from the foam at midspan. The implications that the FRP sheet had on the
behavior of the arch are discussed as applicable for each test.
Figure 4-4: Additional reinforcing FRP sheet located at the midspan
4.2 Photogrammetry Results and Discussion
4.2.1 Midspan Point Load Test 1
The results from the midspan point load tests depict relative movement of the arch that
increased as the applied load increased. Figure 4-5 provides an elevation view of the
instrumented half of the beam along with plots of the arch movement at five kip increments. For
the following figure and all similar figures in this chapter, negative values indicate that the arch
deflected downward relative to the shell, whereas positive values indicate upward motion of the
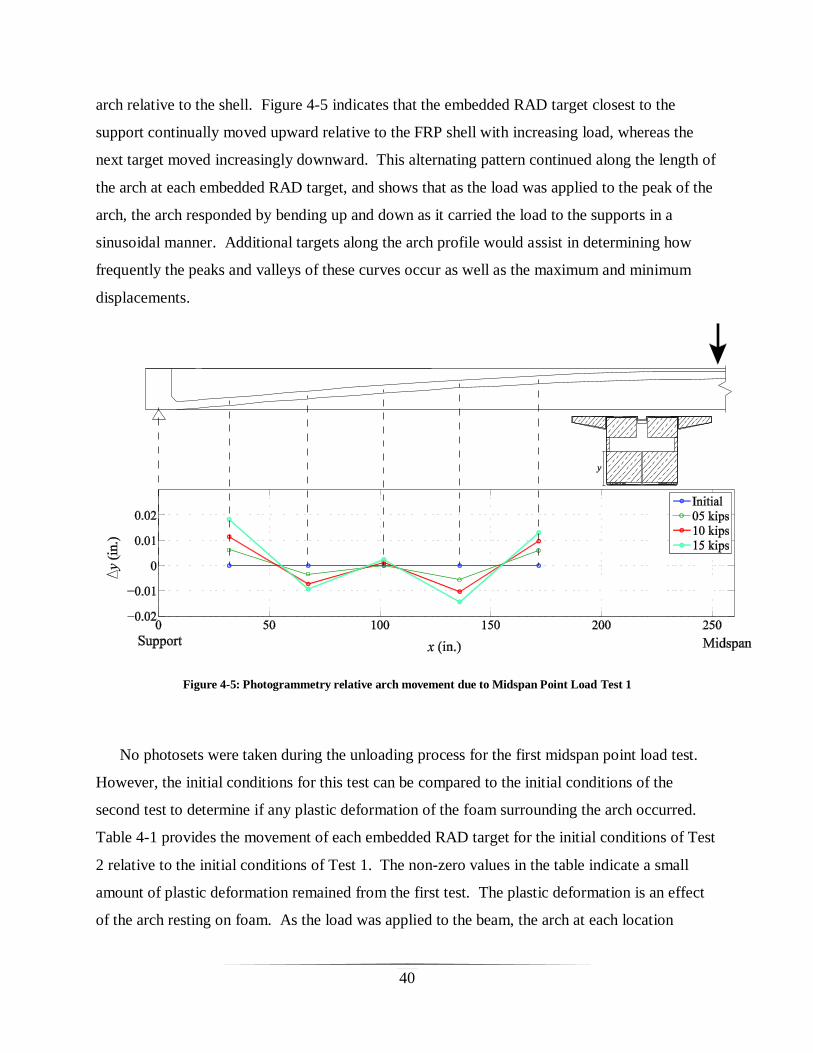
40
arch relative to the shell. Figure 4-5 indicates that the embedded RAD target closest to the
support continually moved upward relative to the FRP shell with increasing load, whereas the
next target moved increasingly downward. This alternating pattern continued along the length of
the arch at each embedded RAD target, and shows that as the load was applied to the peak of the
arch, the arch responded by bending up and down as it carried the load to the supports in a
sinusoidal manner. Additional targets along the arch profile would assist in determining how
frequently the peaks and valleys of these curves occur as well as the maximum and minimum
displacements.
Figure 4-5: Photogrammetry relative arch movement due to Midspan Point Load Test 1
No photosets were taken during the unloading process for the first midspan point load test.
However, the initial conditions for this test can be compared to the initial conditions of the
second test to determine if any plastic deformation of the foam surrounding the arch occurred.
Table 4-1 provides the movement of each embedded RAD target for the initial conditions of Test
2 relative to the initial conditions of Test 1. The non-zero values in the table indicate a small
amount of plastic deformation remained from the first test. The plastic deformation is an effect
of the arch resting on foam. As the load was applied to the beam, the arch at each location

41
deflected within the FRP shell, causing the foam immediately above or below the arch to
compress. If the foam simply compressed but was not damaged when the load was applied, then
when the load was removed, the foam and the arch would be expected to return to their initial
positions. However, some of the walls within the foam began to crush under the applied load,
resulting in the foam and, therefore, the arch not fully returning to the original position. The
impact of the minor plastic deformation on the behavior of the arch during the second midspan
point load test is discussed in the next section.
Table 4-1: Photogrammetry plastic deformation of the foam due to Midspan Point Load Test 1
Distance from the support, x (in.)
32 68 102 136 172
Δy (in.) -0.002 0.001 0.000 -0.001 0.001
4.2.2 Midspan Point Load Test 2
As mentioned in previous chapters, photosets were only taken prior to testing and at the
maximum load for the second midspan point load test. The relative movement at each of the five
embedded RAD target locations for both midspan tests due to 15 kips is provided in Table 4-2.
These values are relative to the initial conditions of the respective test (e.g. Δy for Test 2 is the
arch movement resulting from 15 kips of applied load during Test 2 relative to the initial
conditions for Test 2). The values in the table demonstrate that the deflection trends along the
length of the beam were similar for Test 1 and Test 2.
Table 4-2: Photogrammetry relative arch movement due to 15 kips in Midspan Point Load Test 1 and Test 2
Δy due to
15 kips (in.)
Distance from the support, x (in.)
32 68 102 136 172
Test 1 0.018 -0.009 0.002 -0.014 0.013
Test 2 0.021 -0.010 0.002 -0.012 0.010

42
A trend relating the plastic deformation from Test 1 to the behavior of the arch during Test 2
was determined. By combining the relative arch movement from the 15 kip load during Test 2
(found in Table 4-2) with the relative arch movement from Test 1 plastic deformation (found in
Table 4-1), the arch movement due to the 15 kip load during Test 2 relative to the initial
conditions for Test 1 can be determined. Figure 4-6 displays the arch movement relative to the
Test 1 initial conditions for both tests under 15 kips. The behavior of the arch during the second
test was consistent with the behavior of the first test. This repetition between test results further
supports the hypothesis of sinusoidal arch behavior under an applied load.
Figure 4-6: Photogrammetry relative arch movement comparing Midspan Point Load Test 1 and Test 2
4.2.3 Quarter Point Load Test 1
Similar to the midspan point load tests, the arch alternated between greater and lesser relative
movement at each RAD target along the arch during the quarter point load test, and the
magnitude of the relative arch movement increased as the applied load increased. The most
significant difference between the two test set-ups was the behavior of the arch at the RAD target
closest to the quarter point. The significant amount of local bending seen directly under the load
during this test dominates the overall behavior of the arch, but traces of sinusoidal behavior were

43
still detected. Figure 4-7 plots the relative arch movement during the loading process of the
quarter point test.
Figure 4-7: Photogrammetry relative arch movement due to Quarter Point Load Test 1
As mentioned in previous chapters, photosets were taken during the unloading portion of the
first quarter point load test as well. The magnitude of relative arch movement during unloading
decreased with the load, but it did not completely return to the initial conditions, as seen in
Figure 4-8. Similar to the first midspan point load test, plastic deformation occurred in the foam
surrounding the arch. However, for the quarter point test, the amount of plastic deformation was
up to 10% greater than the midspan tests. This is a result of the load being applied directly above
one of the embedded RAD targets.
Photosets were not taken during the second quarter point load test. Therefore,
photogrammetry cannot be used to determine how the permanent deformation of the foam
impacted the behavior of the arch during the second test. The LVDTs at the quarter point and
midspan collected data from both tests and the results are discussed in the next section.

44
Figure 4-8: Photogrammetry relative arch movement due to Quarter Point Load Test 1 at maximum load and unloaded
4.3 LVDT Results and Discussion
4.3.1 Midspan Point Load Test 1
Unlike the photogrammetry data, the LVDTs recorded relative arch movement throughout
the entire loading and unloading process of each test. This allowed further analysis of the
behavior of the arch during unloading for the midspan tests, as well as during the time in
between load increments. A clear pattern of relative arch movement at the quarter point and
midspan was detected by the LVDTs during the first midspan point load test. The magnitude of
the relative deflection of the arch at the midspan increased as the applied load increased, whereas
the LVDT located at the quarter point detected minimal relative arch movement. Figure 4-9
provides a visual presentation of these results at each 5 kip increment as the beam was loaded.

45
Figure 4-9: LVDT relative arch movement for Midspan Point Load Test 1 during loading
The manner in which the beam was unloaded must be taken into account when interpreting
the corresponding results. The hydraulic actuator used for the tests is controlled with two
simple switches. By pressing down on one, the load is slowly and steadily increased. By
pressing down on the other, the applied load is released almost instantaneously. As a result,
extreme caution must be used to unload the beam slowly and systematically. If the control is
held down a fraction of a second too long, the entire beam rapidly moves upward towards the un-
deflected state, only to be abruptly stopped by the new, lower, applied load. It is hypothesized
that the abrupt stop at the new load causes the arch to rebound downward within the FRP shell.
During the first midspan point load test, the arch experienced a significant rebound when
adjusting the load from 15 kips to 10 kips. The remainder of the unloading process was
smoother and the results reflect that with the gradual movement of the midspan towards the
initial condition (Figure 4-10). The quarter point moved due to the initial jolt at 10 kips, but
remained relatively stationary after that, resulting in a small amount of plastic deformation to the
foam under the arch at that location. Figure 4-11 provides the load versus displacement plot for
both LVDTs. Steady, continually increasing displacement at the midspan can be seen as the load
steadily increased. Broken, irregular displacement is apparent during unloading.

46
Figure 4-10: LVDT relative arch movement for Midspan Point Load Test 1 during unloading
Figure 4-11: Load vs. relative arch movement for Midspan Point Load Test 1

47
4.3.2 Midspan Point Load Test 2
The behavior of the arch during second midspan point load test was similar to the behavior
during the first test. Figure 4-12 provides the relative arch movement at the maximum load for
both tests. The displacement due to the second test was 92% of the first test, supporting the
hypothesis that there was a minor amount of plastic deformation from the first test. The
unloading process was more fluid during the second test, and as a result the magnitude of the
arch deflection remained close to zero at the quarter point and steadily decreased at the midspan.
After the completion of the second test, the plastic deformation at the midspan was 75% less than
the plastic deformation at the midspan from the first test as shown in Figure 4-13. Based on
these results, it is hypothesized that the majority of the permanent damage that could be done to
the foam due to a 15 kip load applied at the midspan was achieved during the first test, resulting
in significantly less permanent damage due to the second test.
Figure 4-12: LVDT relative arch movement for Midspan Point Load Test 2 during loading

48
Figure 4-13: LVDT relative arch movement for Midspan Point Load Test 2 during unloading
4.3.3 Quarter Point Load Test 1
The loading of the first quarter point load test showed similar arch behavior to the midspan
tests in that the arch deflected most where the load was applied and the magnitude of relative
arch movement increased as the load increased. The behavior of the arch during the loading
process is shown in Figure 4-14. The midspan remained in its original position during the
entirety of the loading process. Even though only half of the total load was applied directly to
the quarter point examined, the arch at the quarter point deflected significantly more than the
midspan deflected during the midspan point load tests. Figure 4-15 compares the relative arch
movement due to the maximum load of Midspan Point Load Test 1 to the relative arch
movement due to the maximum load of Quarter Point Load Test 1. It is hypothesized that the
magnitude of difference between the response of the arch directly under the applied load from
the midspan test and the quarter point test is due to the fact that there is no additional FRP sheet
beneath the arch at the quarter point. The 8ft 4in. FRP sheet (see Figure 4-4) served as an
additional restraint during transit before the concrete arch was placed. However, the test results
indicate that the FRP sheet also restrained local movement of the arch due to load applied
directly above it. Because this sheet was not present at the quarter point, the quarter point was
able to deflect 80% more during the quarter point load test than the midspan deflected during the
midspan point load tests.

49
Figure 4-14: LVDT relative arch movement for Quarter Point Load Test 1 during loading
Figure 4-15: LVDT relative arch movement due to maximum loads for Midspan Point Load Test 1 and Quarter Point Load Test 1
The unloading process for the quarter point load tests was much smoother than the midspan
point load tests. As a result, the magnitude of the relative displacement of the arch at the quarter
point consistently decreased with the load. It did not, however, return to its original position. As
seen in Figure 4-16, the arch remained lower than its original position at the quarter point,
indicating a significant amount of permanent deformation in the foam immediately below that

50
point. The midspan behaved in a different manner during the unloading process than anticipated.
Instead of remaining stationary as it had as the beam was subjected to increasing load, the arch
deflected inversely to the load. As the load decreased, causing the magnitude of the arch
movement to decrease at the quarter point, the magnitude of the arch movement increased at the
midspan. This resulted in plastic deformation at the midspan upon completion of the test. Based
on these results, it is hypothesized that there is a “seesaw” effect in the arch as the load on the
quarter points is decreased, causing the midspan to move in the opposite direction. It is possible
that this effect existed in the midspan tests but was not seen because the magnitude of deflection
was significantly lower.
Figure 4-16: LVDT relative arch movement for Quarter Point Load Test 1 during unloading
4.3.4 Quarter Point Load Test 2 and Test 3
The second quarter point load test displayed similar arch behavior as the first test, but the
magnitude of the relative arch displacement at the quarter point was significantly less. The beam
was tested a third time for reasons not related to this report. However, the LVDT data from the
test was still analyzed to gain further understanding of the behavior of the arch. Once again, the
arch increasingly deflected more than the FRP shell during the loading process at the quarter
point and moved an insignificant amount at the midspan.

51
The second and third quarter point tests achieved 69% and 61%, respectively, of the
maximum relative arch movement caused by the first test, as shown in Figure 4-17. This is
largely due to the plastic deformation caused by the first test. Because the foam directly under
the arch at the quarter point was permanently affected from the first test, the compressibility of
the foam decreased, resulting in less movement during the subsequent tests. Figure 4-18
compares the position of the arch upon completion of each of the three tests. This figure
demonstrates that during the second and third tests, the foam directly below the quarter point
experienced 22% and 25% respectively of the plastic deformation that it experienced from the
first test. Once the foam permanently compressed due to the first test, running additional tests to
the same maximum load resulted in minimal additional plastic deformation. The arch at the
midspan once again remained stationary as the beam was loaded for both tests (Figure 4-17).
Similar to the first test, the arch deflected downward within the FRP shell at the midspan as the
applied load decreased from 25 kips to 20 kips, as shown in Figure 4-18.
Figure 4-17: LVDT relative arch movement for all Quarter Point Load Tests due to 25 kips

52
Figure 4-18: LVDT plastic deformation for all Quarter Point Load Tests
Based on the combined results from the LVDTs during the quarter point load tests, the foam
under the arch at the quarter point experienced a total of 0.028 in. of plastic deformation.
Surprisingly, the foam at midspan experienced 0.034 in. of plastic deformation, which is more
than the quarter point. The additional FRP sheet supporting the arch at the midspan played a
significant role in this behavior. The foam at the quarter point compressed 68% of its total
deformation due to the first test alone. Contrasted with the midspan, where the permanent
deformation was split almost evenly between all three tests, it is apparent that something is
impacting the behavior of the foam at the midspan. The compression of the foam at the quarter
point is a localized effect due to its position directly underneath the load. The midspan however
was not experiencing any direct load during the quarter point tests and only deflected during
unloading as the quarter points moved in the opposite direction. It is hypothesized that both
quarter points moving upward within the FRP shell caused the center of the arch to deflect
downward. The FRP strip supporting the arch at the midspan caused that entire 8ft 4 in. section
of arch to act as a unit and move together downward.

53
4.4 Relative Arch Movement Summary
Significant movement of the concrete arch relative to the FRP shell was detected by both
photogrammetry and the LVDTs. The only direct comparison that can be made between the two
methods is by examining the behavior of the arch at the quarter point. There are some
differences that must be taken into account when comparing the two methods. The embedded
RAD target at the quarter point was 3 in. further from the support than the LVDT. In addition to
this, the RAD target was located on the edge of the arch, against the FRP web surface, whereas
the LVDT detected movement at the center of the arch. Figure 4-19 provides a cross-section
with the locations of both methods of instrumentation at the quarter point identified.
Figure 4-19: Cross-section at the quarter point with RAD target and LVDT
When comparing quarter point data directly, the RAD target consistently detected more
relative arch movement than the LVDT during loading for both the midspan and quarter point
load tests. As mentioned in Chapter 3:, the current hypothesis to explain the out-of-plane FRP
web deformation trends states that a minor load eccentricity caused the beam to experience

54
minor lateral and rotational displacement during testing. This skewed applied load and resulting
out-of-plane movement of the entire beam could have contributed to an uneven distribution of
the load within the cross-section of the arch, resulting in the edge of the arch deflecting more
than the middle. Figure 4-20 provides a hypothesized cross-section of the relative arch
movement at the quarter point due to a skewed applied load. In addition to this, the presence of
the vertical section of concrete over the center of the arch may have prevented the center of the
arch from responding in a sinusoidal manner like the edges did. This additional concrete section
added vertical stiffness to the arch directly underneath it compared to the edges that were
surrounded by the flexible foam above and below.
Figure 4-20: Hypothesized cross-section of the relative arch movement at the quarter point
As mentioned before, the RAD target embedded near the quarter point consistently detected
greater relative arch movement than the LVDT. There was one exception to this, however.
While the LVDT relative arch movement at most load increments averaged 40% less than the
photogrammetry, the plastic deformation detected at the quarter point after Quarter Point Load

55
Test 1 was only 6% different between the two methods. Figure 4-21 displays the relative arch
movement as recorded by both methods due to the total maximum load applied during Quarter
Point Load Test 1 and the plastic deformation that remained after the beam was unloaded. Table
4-3 compares the relative arch movement of the quarter point using both methods at 5 kip
increments during the entire test. As the applied load decreased, the LVDT and photogrammetry
results became increasingly closer to one another. This behavior suggests that as the beam was
unloaded, the arch became level again within the FRP shell.
Figure 4-21: Relative arch movement comparing photogrammetry and LVDT data at the maximum and unloaded conditions for Quarter Point Load Test 1
Table 4-3: Photogrammetry and LVDT comparison at quarter point for Quarter Point Load Test 1
Applied Load
Δy (in.) Loading Unloading
5 kips 10 kips 15 kips 20 kips 25 kips 20 kips 15 kips 10 kips 5 kips Unloaded
RAD
Target -0.004 -0.019 -0.027 -0.041 -0.057 -0.053 -0.044 -0.036 -0.029 -0.020
LVDT 0.000 -0.007 -0.012 -0.023 -0.038 -0.036 -0.031 -0.025 -0.023 -0.019

56
The major behavior pattern that was detected using photogrammetry was the sinusoidal
behavior of the arch, whereas the most significant observation from the LVDTs was the
“seesaw” effect during unloading of the quarter point tests that caused the midspan to respond
inversely to the load. These results neither contradict nor validate each other. There are many
additional components to the beam, including the 8ft 4 in. FRP sheet at midspan and the vertical
section of concrete over the center of the arch, that appear to impact the behavior of the arch
within the FRP shell. Therefore, a brief, general statement concluding how the arch behaves
under applied load cannot be made.

57
5.1 Summary
Hybrid-Composite Beams (HCBs) are an innovative and increasingly popular approach to
structural beam design. By maximizing the efficiency of materials, HCBs lower construction
costs and compliment the increasingly popular Accelerated Bridge Construction method. These
beams have successfully been used in bridges around the country and are currently being
considered for use in Virginia. The Virginia Department of Transportation (VDOT) plans to
incorporate HCBs in the design and construction of the Tide Mill Bridge in the Fredericksburg
District, and funded Virginia Tech to mimic a portion of the bridge in the lab to confirm the
validity of the system.
Photogrammetry, the process of using photographs to determine geometric properties of an
object, was used specifically in this research to investigate two different aspects of the behavior
of an HCB. Ringed Automatically Detected (RAD) targets were used to detect trends in both
behavior mechanisms. The first behavior monitored was the out-of-plane movement of the FRP
web before, during, and after testing. The RAD targets were adhered to the web in a grid from
the pin support to the midspan to obtain this information. Five additional RAD targets were
embedded in the concrete arch at approximately 3ft increments and used for the second purpose
of photogrammetry, to determine the movement of the concrete arch within the FRP shell. In an
attempt to confirm the results obtained from photogrammetry, Linear Variable Differential
Transformers (LVDTs) were also used to detect relative arch movement at the midspan and the
quarter point.
Testing of the individual HCB was broken up into two phases. Phase I tested the beam prior
to the concrete arch being placed. The beam was subjected to two different load scenarios: a
uniformly distributed load and a point load at the midspan. Photos were taken recording the
behavior of the beam before testing commenced, at the peak uniform load, and at the peak point
load. After the first phase was completed, self-consolidating concrete was pumped into the arch.
CHAPTER 5: SUMMARY, CONCLUSIONS, & RECOMMENDATIONS
58
Immediately after the arch was placed, another photoset was taken to record the effect of the
concrete on the beam.
Phase II of testing commenced after the concrete was allowed to cure. A photoset was taken
after the five additional RAD targets were embedded into the concrete, and immediately prior to
each test during Phase II. The beam underwent two single point load tests where the load was
applied to the midspan of the beam. The condition of the beam was recorded using
photogrammetry at 5 kip load increments up to the maximum load of 15 kips for the first test,
and only at 15 kips for the second test. The final load scenario consisted of two equivalent
simultaneous point loads at the quarter points of the beam. The test was conducted three times,
but photogrammetry data was only documented at 5 kip load increments as the beam was loaded
and unloaded for the first test. LVDT data was recorded and analyzed for both midspan point
load tests and all three quarter point load tests.
5.2 Conclusions
The results of the FRP web study detected two important trends, both of which provide
information about the global behavior of the beam. The first trend was the lateral displacement
of the beam. The initial condition of the beam for Phase I, prior to any applied loading, indicated
that the midspan of the beam was ½ in. out-of-plane from the support. Throughout testing in
both Phase I and Phase II, lateral displacement of the beam was the overriding behavior of the
surface. The magnitude and direction of the displacement are hypothesized to be the result of a
minor, unintentional angle to the applied load. The magnitude of the angle of the applied load
impacted not only the scale of the lateral displacement experienced by the beam, but also the
magnitude of the rotation of the beam. The second trend from the FRP web study was the
tendency of the beam to return back to its original lateral position when left undisturbed for
extended periods of time.
The relative arch movement identified using photogrammetry indicated sinusoidal behavior
of the edge of the arch due to an applied point load at the midspan. The magnitude of this
behavior increased and decreased with the applied load. While the same behavior was still
detected during Quarter Point Load Test 1, the governing behavior mechanism was the

59
displacement of the arch directly beneath the applied load. This resulted in permanent
deformation of the foam supporting the arch at the quarter point.
While the RAD targets recorded the behavior of the edge of the arch, the LVDTs detected the
behavior of the center of the arch at the quarter point and the midspan. The 8ft 4 in. FRP sheet
that supported the concrete arch at the midspan proved to have a significant impact on the arch
behavior. It restrained the local movement of the midspan when the load was applied directly
above it. The arch did not deflect at the midspan as the beam was loaded at the quarter points;
however, unloading the quarter points caused a “see-saw” effect in the arch, resulting in
significant deflection at the midspan and permanent deformation of the foam beneath it. It is
hypothesized that the FRP sheet enhanced this “see-saw” effect by causing the entire 8ft 4 in.
section of the arch to act uniformly.
Although the magnitudes of the relative arch movement from the two different methods vary,
it is assumed that this is due to the difference in location of the instrumentation and the
complexity of the HCB.
5.3 Recommendations
If similar research is conducted on a single HCB using photogrammetry again, there are
multiple recommendations that would be made. For this research it was initially assumed that
the beam would behave symmetrically due to symmetric loading, and therefore only half of the
FRP web surface was instrumented with RAD targets. For the purposes of confirming this
assumption and to detect if the initial imperfections were also symmetric, it is recommended that
the entire FRP surface is instrumented with RAD targets. Additional instrumentation not related
to photogrammetry, such as dial gauges, is recommended at designated locations along the FRP
web surface to confirm the lateral and rotational displacement of the beam due to applied loads.
These recommendations will be applied to Phase III of the related research at Virginia Tech.
In addition to this, it is highly recommended that additional RAD targets are strategically
placed on stationary objects surrounding the beam and that the movement of designated RAD
targets on the beam relative to the stationary targets is documented throughout testing. This will

60
provide confirmation of the accuracy of the model and additional confidence in the
PhotoModeler software.

61
(2011). "PhotoModeler: Measuring & Modeling the Real World." About Us,
<http://photomodeler.com/about_us/default.htm>. (May 16, 2012).
Hillman, J. R. "HC Bridge Company." Product Information, <http://www.hcbridge.com/>.
(January 10, 2012).
Hillman, J. R. "Safe & Sound with Hybrid-Composite Beams." Proc., TEAM Conference.
Jiang, R., Jauregui, D., and White, K. (2008). "Close-Range photogrammetry applications in
bridge measurement: Literature review." Measurement, 41(8), 823-834.
Orsa, R. J. (2011). "Using close-range photogrammetry to characterize initial imperfections of
cold formed steel members." Master of Science, Virginia Polytechnic Institue and State
University, Blacksburg, VA.
Snape, T., and Lindyberg, R. (2009). "Test Results: HC Beam for hte Knickerbocker Bridge."
University of Maine, 1-4.
REFERENCES