virginia corn hybrid and management trials in 2016 · virginia corn hybrid and management trials in...
TRANSCRIPT

2016 Virginia Tech CSES-174NP
VIRGINIA CORN HYBRID AND MANAGEMENT TRIALS IN 2016
Coordinators of Virginia Corn Hybrid Trials in 2016
Wade Thomason, Extension Specialist, Department of Crop and Soil Environmental Sciences, Virginia Tech Harry Behl, Research Specialist Senior, Department of Crop and Soil Environmental Sciences, Virginia Tech
Elizabeth Hokanson, Research Associate, Department of Crop and Soil Environmental Sciences, Virginia Tech
Other contributors: Phillip Browning, Manager, Virginia Crop Improvement Association Foundation Seed Farm
Steve Gulick, Farm Manager, Northern Piedmont Center Doug Horn, Extension Agent, Rockingham County
Karl Jones, Agricultural Manager Senior, Tidewater Agricultural Research and Extension Center Ned Jones, Farm Manager, Southern Piedmont Agricultural Research and Extension Center
Jon Wooge, Agricultural Program Coordinator, College Farm, Virginia Tech
Companies Participating in the 2016 Corn Hybrid Trials
Company Brand Address Augusta Seed Corporation Augusta PO Box 899, Verona, VA 24482 Crop Production Services Dyna-Gro 15277 Richmond Tappahannock Hwy, St. Stephens Church, VA 23148-0409 Doeblers PA Hybrids, Inc. Doeblers® and RPM® 202 Tiadaghton Ave., Jersey Shore, PA 17740 Dupont Pioneer Pioneer 59 Greif Parkway Suite 200, Delaware, OH 43015 Meherrin Agricultural & Chemical Co. Phoenix 413 Main St., Severn, NC 27877 Mid-Atlantic Seeds, Inc. Mid-Atlantic Seeds 204 St. Charles Way #163E, York, PA 17403 Monsanto Channel and Dekalb 800 N Lindbergh Blvd, St Louis, MO 63167 NuTech Seed LLC NuTech\G2 Genetics 2321 North Loop Dr. Suite 230, Ames, IA 50010 Progeny Ag Products Progeny 1529 Hwy 193, Wynne, AR 72396 Seed Consultants, Inc. Seed Consultants 648 Miami Trace Rd., Washington Court House, OH 43160 Syngenta Seeds NK 11055 Wayzata Blvd., Minnetonka, MN 55305 T.A. Seeds LLC T.A. Seeds 39 Seeds Lane, Jersey Shore, PA 17740 Tidewater Seed, LLC AXIS 210 Marlboro Ave Suite 25, Easton, MD 21601
Appreciation is expressed to the Virginia Corn Check-Off Board for financial support of this research and the Virginia Extension corn program

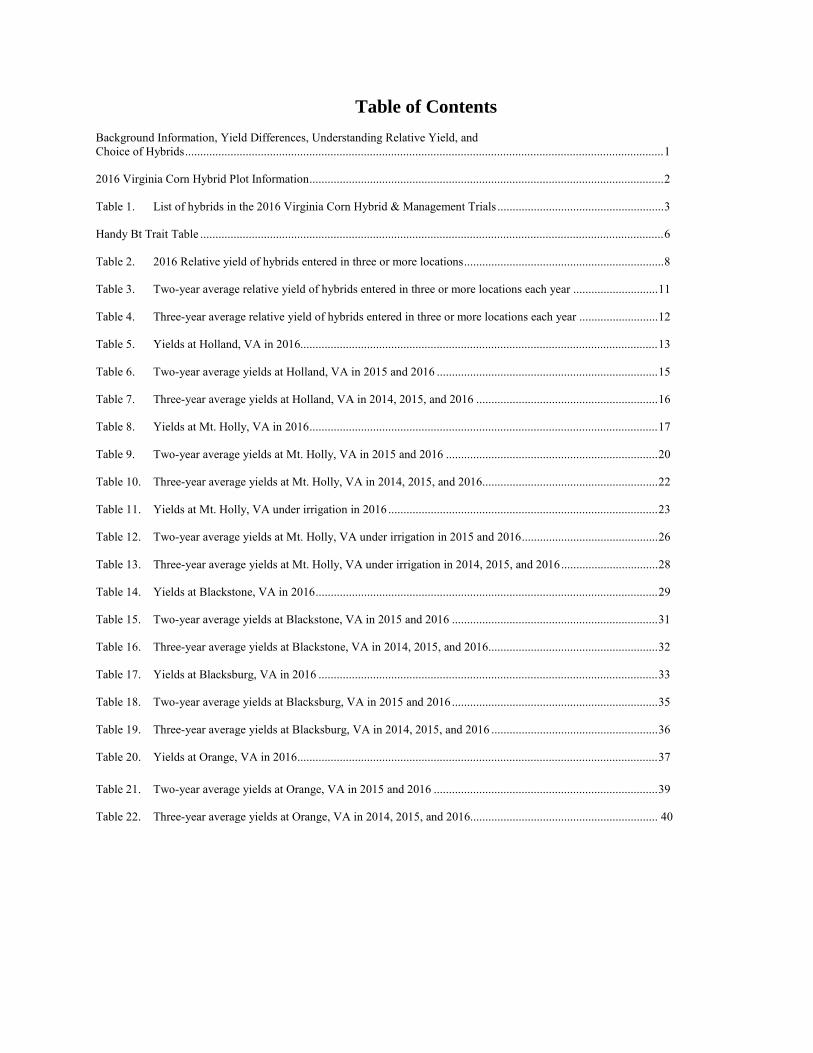
Table of Contents Background Information, Yield Differences, Understanding Relative Yield, and Choice of Hybrids .............................................................................................................................................................. 1 2016 Virginia Corn Hybrid Plot Information ..................................................................................................................... 2 Table 1. List of hybrids in the 2016 Virginia Corn Hybrid & Management Trials ....................................................... 3 Handy Bt Trait Table ......................................................................................................................................................... 6 Table 2. 2016 Relative yield of hybrids entered in three or more locations .................................................................. 8 Table 3. Two-year average relative yield of hybrids entered in three or more locations each year ............................ 11 Table 4. Three-year average relative yield of hybrids entered in three or more locations each year .......................... 12 Table 5. Yields at Holland, VA in 2016...................................................................................................................... 13 Table 6. Two-year average yields at Holland, VA in 2015 and 2016 ......................................................................... 15 Table 7. Three-year average yields at Holland, VA in 2014, 2015, and 2016 ............................................................ 16 Table 8. Yields at Mt. Holly, VA in 2016 ................................................................................................................... 17 Table 9. Two-year average yields at Mt. Holly, VA in 2015 and 2016 ...................................................................... 20 Table 10. Three-year average yields at Mt. Holly, VA in 2014, 2015, and 2016 .......................................................... 22 Table 11. Yields at Mt. Holly, VA under irrigation in 2016 ......................................................................................... 23 Table 12. Two-year average yields at Mt. Holly, VA under irrigation in 2015 and 2016 ............................................. 26 Table 13. Three-year average yields at Mt. Holly, VA under irrigation in 2014, 2015, and 2016 ................................ 28 Table 14. Yields at Blackstone, VA in 2016 ................................................................................................................. 29 Table 15. Two-year average yields at Blackstone, VA in 2015 and 2016 .................................................................... 31 Table 16. Three-year average yields at Blackstone, VA in 2014, 2015, and 2016 ........................................................ 32 Table 17. Yields at Blacksburg, VA in 2016 ................................................................................................................ 33 Table 18. Two-year average yields at Blacksburg, VA in 2015 and 2016 .................................................................... 35 Table 19. Three-year average yields at Blacksburg, VA in 2014, 2015, and 2016 ....................................................... 36 Table 20. Yields at Orange, VA in 2016 ....................................................................................................................... 37 Table 21. Two-year average yields at Orange, VA in 2015 and 2016 .......................................................................... 39 Table 22. Three-year average yields at Orange, VA in 2014, 2015, and 2016.............................................................. 40


Background Information Performance trials of commercial corn hybrids were conducted at six locations in Virginia in 2016. The Mt. Holly location consisted of both an irrigated and non-irrigated test. All locations were planted with a Wintersteiger PlotKing 2600. All locations were harvested with a Massey-Ferguson 8XP plot combine. Yields have been adjusted to 15.5% moisture. Grain test weight, moisture, and plot grain weights were measured with a GrainGauge® manufactured by HarvestMaster. A list of companies participating in the trials is provided before the table of contents. All hybrids entered in the Virginia trials are those submitted by commercial companies. The locations at which particular hybrids were entered were specified by the company. Companies entering hybrids were charged a fee for each hybrid per location to support the Virginia Corn Hybrid and Management Trials.
Yield Differences Experimental plots vary in yield and other measurements due to location in the field and other factors which cannot be controlled. Statistics given in the tables are intended to help the reader make valid comparisons between hybrids. The magnitude of differences which may have been due to uncontrollable variation has been computed for the data and listed at the bottom of columns as the LSD (.05) (least significant difference with 95% confidence). Differences less than the LSD are assumed not to be real differences with 95% confidence. Understanding Relative Yield Companies entering hybrids decide which hybrids are planted at which locations. Combining and comparing absolute yield and other results from multiple sites is inappropriate when not all hybrids are planted at all locations. For example, one hybrid might have an unfair advantage in such a comparison because it was tested only at sites with ideal growing conditions. Another hybrid tested at sites with less-than-ideal growing conditions would have yields that tended to be lower. In this example, it would be difficult to determine whether yield
differences were because of differences in genetic yield potential or simply because of differences in the environmental conditions under which they were tested. The solution is to compare hybrids based on relative yields rather than absolute yields.
To calculate relative yield, the yield for each hybrid at each site is divided by the average yield for all hybrids tested at that same site and multiplied by 100. Once each hybrid at each site has been assigned a relative yield, comparisons can be made between hybrids tested at the same site or different sites. For hybrids tested at multiple sites, we can also calculate a multi-site relative yield average.
Relative yields of 100 indicate hybrids that were average performers. Relative yields greater than 100 indicate yields above-average. Relative yields less than 100 indicate yields below-average. The magnitude of the relative yield numbers indicate how far above or below average a hybrid performed. For example, a hybrid with a relative yield of 110 yielded 10% of above the average yield for all hybrids at that site. Choice of Hybrids When making hybrid selections it is important to realize that hybrids differ in their performance in different environments. Some hybrids are more adapted to a wide range of environments. Hybrid performance may vary with year and location variations in rainfall, temperature, pests and other environmental variables. In these experiments, many hybrids have essentially the same yield, and great care should be taken in interpreting the results of a single year's tests, especially at only one location. For these reasons it is important, whenever possible, to also look at a hybrid's average across locations when making hybrid selections. Multi-year averages give even greater confidence to hybrid performance decisions. The relative yield tables compare the yield of a hybrid to the average yield of all hybrids in the test. These tables are an excellent summary of yield potential compared to other hybrids.
1
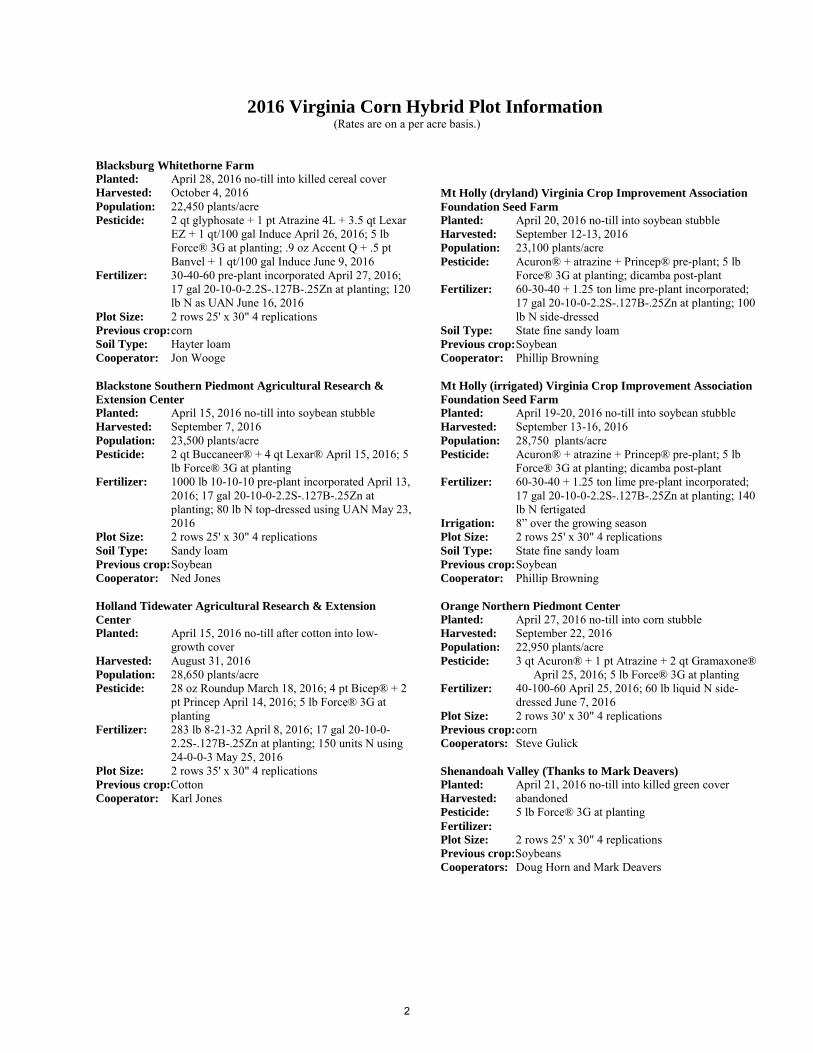
2016 Virginia Corn Hybrid Plot Information (Rates are on a per acre basis.)
Blacksburg Whitethorne Farm Planted: April 28, 2016 no-till into killed cereal cover Harvested: October 4, 2016 Population: 22,450 plants/acre Pesticide: 2 qt glyphosate + 1 pt Atrazine 4L + 3.5 qt Lexar
EZ + 1 qt/100 gal Induce April 26, 2016; 5 lb Force® 3G at planting; .9 oz Accent Q + .5 pt Banvel + 1 qt/100 gal Induce June 9, 2016
Fertilizer: 30-40-60 pre-plant incorporated April 27, 2016; 17 gal 20-10-0-2.2S-.127B-.25Zn at planting; 120 lb N as UAN June 16, 2016
Plot Size: 2 rows 25' x 30" 4 replications Previous crop: corn Soil Type: Hayter loam Cooperator: Jon Wooge Blackstone Southern Piedmont Agricultural Research & Extension Center Planted: April 15, 2016 no-till into soybean stubble Harvested: September 7, 2016 Population: 23,500 plants/acre Pesticide: 2 qt Buccaneer® + 4 qt Lexar® April 15, 2016; 5
lb Force® 3G at planting Fertilizer: 1000 lb 10-10-10 pre-plant incorporated April 13,
2016; 17 gal 20-10-0-2.2S-.127B-.25Zn at planting; 80 lb N top-dressed using UAN May 23, 2016
Plot Size: 2 rows 25' x 30" 4 replications Soil Type: Sandy loam Previous crop: Soybean Cooperator: Ned Jones Holland Tidewater Agricultural Research & Extension Center Planted: April 15, 2016 no-till after cotton into low-
growth cover Harvested: August 31, 2016 Population: 28,650 plants/acre Pesticide: 28 oz Roundup March 18, 2016; 4 pt Bicep® + 2
pt Princep April 14, 2016; 5 lb Force® 3G at planting
Fertilizer: 283 lb 8-21-32 April 8, 2016; 17 gal 20-10-0-2.2S-.127B-.25Zn at planting; 150 units N using 24-0-0-3 May 25, 2016
Plot Size: 2 rows 35' x 30" 4 replications Previous crop:Cotton Cooperator: Karl Jones
Mt Holly (dryland) Virginia Crop Improvement Association Foundation Seed Farm Planted: April 20, 2016 no-till into soybean stubble Harvested: September 12-13, 2016 Population: 23,100 plants/acre Pesticide: Acuron® + atrazine + Princep® pre-plant; 5 lb
Force® 3G at planting; dicamba post-plant Fertilizer: 60-30-40 + 1.25 ton lime pre-plant incorporated;
17 gal 20-10-0-2.2S-.127B-.25Zn at planting; 100 lb N side-dressed
Soil Type: State fine sandy loam Previous crop: Soybean Cooperator: Phillip Browning Mt Holly (irrigated) Virginia Crop Improvement Association Foundation Seed Farm Planted: April 19-20, 2016 no-till into soybean stubble Harvested: September 13-16, 2016 Population: 28,750 plants/acre Pesticide: Acuron® + atrazine + Princep® pre-plant; 5 lb
Force® 3G at planting; dicamba post-plant Fertilizer: 60-30-40 + 1.25 ton lime pre-plant incorporated;
17 gal 20-10-0-2.2S-.127B-.25Zn at planting; 140 lb N fertigated
Irrigation: 8” over the growing season Plot Size: 2 rows 25' x 30" 4 replications Soil Type: State fine sandy loam Previous crop: Soybean Cooperator: Phillip Browning Orange Northern Piedmont Center Planted: April 27, 2016 no-till into corn stubble Harvested: September 22, 2016 Population: 22,950 plants/acre Pesticide: 3 qt Acuron® + 1 pt Atrazine + 2 qt Gramaxone®
April 25, 2016; 5 lb Force® 3G at planting Fertilizer: 40-100-60 April 25, 2016; 60 lb liquid N side-
dressed June 7, 2016 Plot Size: 2 rows 30' x 30" 4 replications Previous crop: corn Cooperators: Steve Gulick Shenandoah Valley (Thanks to Mark Deavers) Planted: April 21, 2016 no-till into killed green cover Harvested: abandoned Pesticide: 5 lb Force® 3G at planting Fertilizer: Plot Size: 2 rows 25' x 30" 4 replications Previous crop:Soybeans Cooperators: Doug Horn and Mark Deavers
2

Table 1. List of hybrids in the 2016 Virginia Corn Hybrid & Management Trials
Company Brand HybridDTM per
Co.1 Insecticide GeneticsAugusta Seed Augusta A2956GT3111 106 CruiserMaxx® 250 Agrisure Viptera 3111Augusta Seed Augusta A5457GT 107 CruiserMaxx® 1250 Agrisure 3000GTAugusta Seed Augusta A1108VT2ProRIB 108 CruiserMaxx® 250 Genuity VT Double PROAugusta Seed Augusta A4959GT3110 109 CruiserMaxx® 1250 Agrisure Viptera 3110Augusta Seed Augusta A5062GT3110 112 Acceleron® 500/VOTiVO® Agrisure Viptera 3110Augusta Seed Augusta A1564GTCBLL 114 Acceleron® 500/VOTiVO® Agrisure GT/CB/LLAugusta Seed Augusta A6664VT2Pro 114 CruiserMaxx® 250 Genuity VT Double PROAugusta Seed Augusta A6465VT2Pro 115 Acceleron® 250 Genuity VT Double PRO DG Augusta Seed Augusta A1565GTCBLL 115 Acceleron® 500/VOTiVO® Agrisure GT/CB/LLAugusta Seed Augusta A7766VT2Pro 116 CruiserMaxx® 250 Genuity VT Double PROAugusta Seed Augusta A7768GT3110 118 CruiserMaxx® 1250 Agrisure Viptera 3110Crop Production Services Dyna-Gro D49VC39 109 Poncho® 500/VOTiVO® Genuity VT Double PRO Crop Production Services Dyna-Gro D52VC91 112 Poncho® 500/VOTiVO® Genuity VT Double PRO Crop Production Services Dyna-Gro D54DC94 114 Poncho® 500/VOTiVO® Genuity VT Double PRO Crop Production Services Dyna-Gro D54VC52 114 Poncho® 500/VOTiVO® Genuity VT Double PRO Crop Production Services Dyna-Gro D57VP51 117 Poncho® 500/VOTiVO® YieldGard VT TripleCrop Production Services Dyna-Gro D58VC37 118 Poncho® 500/VOTiVO® Genuity VT Double PRO Doebler's PA Hybrids Inc Doebler's RPM® 4717AMX™ 107 Poncho® 1250/VOTiVO® Optimum AcreMax XtraDoebler's PA Hybrids Inc Doebler's RPM® 4816AM™ 108 Poncho® 1250/VOTiVO® Optimum AcreMaxDoebler's PA Hybrids Inc Doebler's RPM® 4917AM™ 109 Poncho® 1250/VOTiVO® Optimum AcreMaxDoebler's PA Hybrids Inc Doebler's RPM® 5015AM™ 110 Poncho® 1250/VOTiVO® Optimum AcreMaxDoebler's PA Hybrids Inc Doebler's RPM® 5125AM™ 111 Poncho® 1250/VOTiVO® Optimum AcreMaxDoebler's PA Hybrids Inc Doebler's RPM® 5315AMXT™ 113 Poncho® 1250/VOTiVO® Optimum AcreMax XTremeDoebler's PA Hybrids Inc Doebler's 5615GRQ™ 116 Poncho® 1250/VOTiVO® Agrisure 3000GTDoebler's PA Hybrids Inc Doebler's 5815GRQ™ 118 Poncho® 1250/VOTiVO® Agrisure 3000GTDupont Pioneer Pioneer P0339AM 103 Poncho® 1250/VOTiVO® Optimum AcreMaxDupont Pioneer Pioneer P0843AM 108 Poncho® 1250/VOTiVO® Optimum AcreMaxDupont Pioneer Pioneer P1197AM 111 Poncho® 1250/VOTiVO® Optimum AcreMaxDupont Pioneer Pioneer P1637AM 116 Poncho® 1250/VOTiVO® Optimum AcreMaxMeherrin Phoenix 5352A4 107 Avicta® Complete 500 Agrisure Viptera 3111Meherrin Phoenix 6542A4 116 Avicta® Complete 500 Agrisure Viptera 3111Meherrin Phoenix 7402A3 118 Avicta® Complete 500 Agrisure 3000GTMid-Atlantic Seeds, Inc Mid-Atlantic MAX8006DGVT2PRIB 98 Acceleron® 250 Genuity VT Double PRO Rib Complete DGMid-Atlantic Seeds, Inc Mid-Atlantic MA5001GT3VIP 99 CruiserMaxx® 250 Agrisure Viptera 3111
3

Table 1. List of hybrids in the 2016 Virginia Corn Hybrid & Management Trials
Company Brand HybridDTM per
Co.1 Insecticide GeneticsMid-Atlantic Seeds, Inc Mid-Atlantic MA8065SS 106 Acceleron® 250 Genuity SmartStax RIB CompleteMid-Atlantic Seeds, Inc Mid-Atlantic MA8086VT2P 108 Acceleron® 250 Genuity VT Double PROMid-Atlantic Seeds, Inc Mid-Atlantic MA8107VT2P 110 Acceleron® 250 Genuity VT Double PROMid-Atlantic Seeds, Inc Mid-Atlantic MA8116DGVT2P 111 Acceleron® 250 Genuity VT Double PRO DG Mid-Atlantic Seeds, Inc Mid-Atlantic MA8147SSRIB 114 Acceleron® 250 Genuity SmartStax RIB CompleteMid-Atlantic Seeds, Inc Mid-Atlantic MA8167VT3P 115 Acceleron® 250 Genuity VT Triple PROMid-Atlantic Seeds, Inc Mid-Atlantic MAX8159SS 115 Acceleron® 250 Genuity SmartStax RIB CompleteMid-Atlantic Seeds, Inc Mid-Atlantic MA8152VT2P 115 Acceleron® 250 Genuity VT Double PROMonsanto Channel 206-30STXRIB 106 Acceleron® 500/VOTiVO® Genuity SmartStax RIB CompleteMonsanto Channel 207-27VT2PRIB 107 Acceleron® 500/VOTiVO® Genuity VT Double PRO RIB CompleteMonsanto Channel 208-23VT2PRIB 108 Acceleron® 500/VOTiVO® Genuity VT Double PRO RIB CompleteMonsanto Channel 210-26STXRIB 110 Acceleron® 500/VOTiVO® Genuity SmartStax RIB CompleteMonsanto Channel 211-33VT2PRIB 111 Acceleron® 500/VOTiVO® Genuity VT Double PRO RIB CompleteMonsanto Channel 215-05STXRIB 115 Acceleron® 500/VOTiVO® Genuity SmartStax RIB CompleteMonsanto Channel 216-36STXRIB 116 Acceleron® 500/VOTiVO® Genuity SmartStax RIB CompleteMonsanto Channel 217-41STXRIB 117 Acceleron® 500/VOTiVO® Genuity SmartStax RIB CompleteMonsanto Channel 217-92VT2PRIB 117 Acceleron® 500/VOTiVO® Genuity VT Double PRO RIB CompleteMonsanto DEKALB DKC58-06RIB 108 Acceleron® 500/VOTiVO® Genuity SmartStax RIB CompleteMonsanto DEKALB DKC60-67RIB 110 Acceleron® 500/VOTiVO® Genuity SmartStax RIB CompleteMonsanto DEKALB DKC61-88RIB 111 Acceleron® 500/VOTiVO® Genuity VT Triple PRO RIB CompleteMonsanto DEKALB DKC64-87RIB 114 Acceleron® 500/VOTiVO® Genuity SmartStax RIB CompleteMonsanto DEKALB DKC65-19RIB 115 Acceleron® 500/VOTiVO® Genuity VT Triple PRO RIB CompleteMonsanto DEKALB DKC65-71RIB 115 Acceleron® 500/VOTiVO® Genuity VT Double PRO RIB CompleteMonsanto DEKALB DKC66-40RIB 116 Acceleron® 500/VOTiVO® Genuity SmartStax RIB CompleteMonsanto DEKALB DKC66-59RIB 116 Acceleron® 500/VOTiVO® Genuity VT Double PRO RIB CompleteMonsanto DEKALB DKC67-72RIB 117 Acceleron® 500/VOTiVO® Genuity VT Double PRO RIB CompleteNuTech Seed LLC NuTech/G2 Genetics 5F-709 109 Poncho® 500/VOTiVO® Optimum AcreMaxNuTech Seed LLC NuTech/G2 Genetics 5F-510 110 Poncho® 500/VOTiVO® Optimum AcreMaxNuTech Seed LLC NuTech/G2 Genetics 5F-710 110 Poncho® 500/VOTiVO® Optimum AcreMaxNuTech Seed LLC NuTech/G2 Genetics X5Z-1001 110 Poncho® 1250/VOTiVO® Optimum AcreMaxNuTech Seed LLC NuTech/G2 Genetics 5F-811 111 Poncho® 500/VOTiVO® Optimum AcreMaxNuTech Seed LLC NuTech/G2 Genetics 5F-113 113 Poncho® 500/VOTiVO® Optimum AcreMaxNuTech Seed LLC NuTech/G2 Genetics 5F-713 113 Poncho® 500/VOTiVO® Optimum AcreMaxNuTech Seed LLC NuTech/G2 Genetics 5F-515 115 Poncho® 500/VOTiVO® Optimum AcreMax
4

Table 1. List of hybrids in the 2016 Virginia Corn Hybrid & Management Trials
Company Brand HybridDTM per
Co.1 Insecticide GeneticsNuTech Seed LLC NuTech/G2 Genetics 5F-015 115 Poncho® 500/VOTiVO® Optimum AcreMaxNuTech Seed LLC NuTech/G2 Genetics 5H-216 116 Poncho® 500/VOTiVO® Herculex 1NuTech Seed LLC NuTech/G2 Genetics 5H-418 118 Poncho® 500/VOTiVO® Herculex 1Progeny Ag Products Progeny PGY 4114VT2P 114 Acceleron® 500/VOTiVO® Genuity VT Double PROProgeny Ag Products Progeny PGY 5115VT2P 115 Acceleron® 500/VOTiVO® Genuity VT Double PROProgeny Ag Products Progeny PGY EXP 1615VT2P 115 Acceleron® 500/VOTiVO® Genuity VT Double PROProgeny Ag Products Progeny PGY 6116VT2P 116 Acceleron® 500/VOTiVO® Genuity VT Double PROProgeny Ag Products Progeny PGY 4117VT3P 117 Acceleron® 500/VOTiVO® Genuity VT Triple PROProgeny Ag Products Progeny PGY 6119VT2P 119 Acceleron® 500/VOTiVO® Genuity VT Double PROSeed Consultants Inc Seed Consultants SC 10AGT96™ 108 Poncho®500/VOTIVO® + Raxil® Agrisure GT/CB/LLSeed Consultants Inc Seed Consultants SC 11AQ17™ 110 Avicta® Complete 500 + Vibrance Agrisure 3000GTSeed Consultants Inc Seed Consultants SC 11AQ15™ 111 Poncho® 500/VOTiVO® + Raxil® Agrisure 3000GTSeed Consultants Inc Seed Consultants SCS 1125YHR™ 111 Poncho® 500/VOTiVO® + Raxil® Optimum IntrasectSeed Consultants Inc Seed Consultants SCS 1136YHR™ 112 Poncho® 1250/VOTiVO® + Raxil® Optimum IntrasectSeed Consultants Inc Seed Consultants SCS 11HR63™ 115 CruiserExtreme® 250 Herculex 1Seed Consultants Inc Seed Consultants SC 11AGT74™ 116 Poncho®1250/VOTIVO® Agrisure GT/CB/LLSeed Consultants Inc Seed Consultants SCS 1187YHR™ 118 CruiserExtreme® 250 Optimum IntrasectSyngenta NK N59B-3111A 109 Avicta® Complete 500 + Vibrance Agrisure Viptera 3111Syngenta NK N69D-3000GT 112 Avicta® Complete 500 + Vibrance Agrisure 3000GTSyngenta NK N74L-3010 114 Avicta® Complete 500 + Vibrance Agrisure Viptera 3010Syngenta NK N83D-3000GT 118 Avicta® Complete 500 + Vibrance Agrisure 3000GTT. A. Seeds T. A. Seeds TA667-31 111 CruiserMaxx® 250 Agrisure Viptera 3111T. A. Seeds T. A. Seeds TA736-22DPRIB 113 CruiserMaxx® 250 Genuity VT Double PRO RIB CompleteT. A. Seeds T. A. Seeds TA767-22DPRIB 116 CruiserMaxx® 250 Genuity VT Double PRO RIB CompleteTidewater Seed, LLC AXIS 53A25RIB 103 Acceleron® 250 Genuity VT Double PRO RIB CompleteTidewater Seed, LLC AXIS 56Z50RIB 106 Acceleron® 500/VOTiVO® Genuity SmartStax RIB CompleteTidewater Seed, LLC AXIS 62M25RIB 112 Acceleron® 250 Genuity VT Double PRO RIB CompleteTidewater Seed, LLC AXIS 64K24RIB 114 Acceleron® 250 Genuity VT Double PRO RIB CompleteTidewater Seed, LLC AXIS 64D25RIB 114 Acceleron® 250 Genuity VT Double PRO RIB CompleteTidewater Seed, LLC AXIS 65H25RIB 115 Acceleron® 250 Genuity VT Double PRO RIB CompleteTidewater Seed, LLC AXIS 66A22RIB 116 Acceleron® 250 Genuity VT Double PRO RIB Complete1 Days to maturity provided by company; differences in maturity rating methods may exist between companies.Hybrids are arranged by Company, then days to maturity.
5

Chris DiFonzo, Michigan State University, East Lansing, MI and
Eileen Cullen, University of Wisconsin, Madison, WI
Updated October 29, 2012
Handy Bt Trait Table
Insect targets BCW black cutworm CEW corn earworm CRW corn rootworm ECB European corn borer FAW fall armyworm SB stalk borer WBC western bean cutworm
More corn hybrids contain multiple transgenic traits, and cost of this seed is steadily rising - $300 or more per bag is not uncommon. Meanwhile, refuge requirements are changing for multi-trait corn. Some refuges remain 20% and ‘structured’, planted in a block or series of rows. Others are reduced to 5% or 10%, in a block or ‘in the bag’ mixed with the Bt seed itself.
Different products from different seed companies now have different refuges
Purchasing the right transgenic hybrid for the right pest, and planting it with the correct refuge in the proper location, is critical to maximizing profitability and delaying resistance. But this process is increasingly confusing. The table on the second page of this bulletin summarizes, to the best of our ability, the currently available Bt traits and their spectrum of control. The table also gives refuge percentages and locations. We make every attempt to provide the correct information for each Bt option and update the table promptly as changes occur. However, it is still important for you to take the following steps: *Understand the terminology used by your seed company *Understand the biology of each trait, the expected level of control, and refuge requirements. *Confirm that the seed ordered in late fall is the seed shipped the following spring. *Keep good planting records. *For herbicide applications, Ask Twice-Spray Once, especially if you hire a custom applicator. *Save a representative sample of bag tags = the first thing to check if something goes wrong. *Most important, if you see unexpected damage or poor performance of a trait during the field season, contact your seed dealer or county extension educator promptly so that the field can be visited while the problem is still visible and fresh sampled can be taken.
Herbicide traits GT glyphosate tolerant LL Liberty Link or glufosinate tolerant RR2 Roundup Ready 2 (glyphosate tolerant)
The most up-to-date version of this bulletin is posted at: http://labs.russell.wisc.edu/cullenlab/extension/extension-publications/
Abbreviations used on page 2:
MSU Field Crops Entomology
Program
6

**Current**
October 29, 2012
Bt protein(s)
Insects controlled (bold) or suppressed (italics)
Above-ground ------------ In soil
Herbicide tolerance
Refuge %, location
In the MIDWEST Agrisure products
1-Agrisure CB/LL Cry1Ab ECB CEW FAW SB --- LL 20% within ½ mile 2-Agrisure GT/CB/LL Cry1Ab ECB CEW FAW SB --- GT LL 20% within ½ mile 3-Agrisure RW mCry3A --- CRW -- 20% in field/adjacent 4-Agrisure GT/RW mCry3A --- CRW GT 20% in field/adjacent 5-Agrisure CB/LL/RW Cry1Ab mCry3A ECB CEW FAW SB CRW LL 20% in field/adjacent 6-Agrisure 3000GT Cry1Ab mCry3A ECB CEW FAW SB CRW GT LL 20% in field/adjacent 7-Agrisure Artesian 4011
Cry1Ab mCry3A ECB CEW, FAW, SB CRW GT LL 20% in field/adjacent
8-Agrisure Viptera 3110
Cry1Ab Vip3A BCW CEW ECB FAW WBC SB
--- GT LL 20% within ½ mile
9-Agrisure Viptera 3111
Cry1Ab mCry3A Vip3A
BCW CEW ECB FAW WBC SB
CRW GT LL 20% in field/adjacent
10-Agrisure 3122 E-Z Refuge
Cry1Ab Cry1F mCry3A Cry34/35Ab1
BCW ECB FAW WBC CEW SB
CRW GT 5% in the bag
11-Agrisure Viptera 3220 E-Z Refuge
Cry1Ab Cry1F Vip3A
BCW CEW ECB FAW WBC SB
--- GT 5% in the bag
Herculex products 12-Herculex 1 (HX1) Cry1F BCW ECB FAW WBC
CEW SB --- LL
RR2 (some) 20% within ½ mile
13-Herculex RW (HXRW)
Cry34/35Ab1 --- CRW LL RR2 (some)
20% in field/adjacent
14-Herculex XTRA (HXX)
Cry1F Cry34/35Ab1 BCW ECB FAW WBC CEW SB
CRW LL RR2 (some)
20% in field/adjacent
Optimum products 15-Optimum (AM-R) AcreMax
Cry1F Cry1Ab BCW ECB FAW WBC CEW SB
--- RR2 5% in the bag
16-Optimum (AMRW-R) AcreMax Rootworm
Cry34/35Ab1 --- CRW RR2 10% in the bag
17-Optimum (AM1) AcreMax1
Cry1F Cry34/35Ab1 BCW ECB FAW WBC CEW SB
CRW LL RR2 10% in the bag (CRW) 20% -½ mile (ECB)
18-Optimum (AMX-R) AcreMax Xtra
Cry1F Cry1Ab Cry34/35Ab1
BCW ECB FAW WBC CEW SB
CRW RR2 10% in the bag
19-Optimum (AMXT-R) AcreMax Xtreme
Cry1F Cry1Ab mCry3A Cry34/35Ab1
BCW ECB FAW WBC CEW SB
CRW RR2 5% in the bag
20-Optimum Intrasect Cry1F Cry1Ab BCW ECB FAW WBC CEW SB
--- LL RR2 5% within ½ mile
21-Optimum Intrasect Xtra
Cry1F Cry1Ab Cry34/35Ab1
BCW ECB FAW WBC CEW SB
CRW LL RR2 20% in field/adjacent
22-Optimum Intrasect Xtreme
Cry1F Cry1Ab mCry3A Cry34/35Ab1
BCW ECB FAW WBC CEW SB
CRW LL RR2 5% in field/adjacent
23-Optimum TRIsect
Cry1F mCry3A BCW ECB FAW WBC CEW SB
CRW LL RR2
20% in field/adjacent
YieldGard products 24-YGCB Cry1Ab ECB CEW FAW SB --- RR2 (some) 20% within ½ mile 25-YGRW Cry3Bb1 --- CRW RR2 (some) 20% in field/adjacent 26-YieldGard Plus Cry1Ab Cry3Bb1 ECB CEW FAW SB CRW RR2 (some) 20% in field/adjacent 27-YieldGard VTRW Cry3Bb1 --- CRW RR2 20% in field/adjacent 28-YieldGard VT Triple
Cry1Ab Cry3Bb1 ECB CEW FAW SB CRW RR2 20% in field/adjacent
Genuity / SmartStax products 29-Genuity VT Double PRO
Cry1A.105 Cry2Ab2 CEW ECB FAW --- RR2 5% within ½ mile
30-Genuity VT Double PRO RIB Complete
Cry1A.105 Cry2Ab2 CEW ECB FAW
---
RR2 5% in the bag
31-Genuity VT Triple PRO RIB Complete
Cry1A.105 Cry2Ab2 Cry3Bb1
CEW ECB FAW CRW RR2 10% in the bag
32-SmartStax (Dow) or Genuity SmartStax (Monsanto)
Cry1A.105 Cry2Ab2 Cry1F Cry3Bb1
Cry34/35Ab1
BCW CEW ECB FAW WBC
SB
CRW LL RR2 5% in field/adjacent
33 G it S tSt
S
BCW CEW
CRW LL RR2 5% i th b
7

Table 2. 2016 RELATIVE YIELD* of corn hybrids entered in three or more locations - Virginia Tech Trials.DTM per Black- Mt Holly Mt Holly Black-
Brand/Company Hybrid Co.1 Holland stone Dryland Irrigated burg Orange Mean
Phoenix 5352A4 107 100 103 95 107 108 99 102Pioneer P0339AM 103 100 88 98 99 102 94 97Doebler's RPM® 4717AMX™ 107 92 93 106 100 99 83 95Channel 206-30STXRIB 106 --- --- 111 77 --- 93 94AXIS 53A25RIB 103 103 --- 82 86 --- 92 91Mid-Atlantic MA8065SS 106 --- 91 80 93 --- --- 88AXIS 56Z50RIB 106 100 --- 81 86 --- 85 88Channel 207-27VT2PRIB 107 --- --- 98 84 --- 79 87
Mid-Atlantic MA8107VT2P 110 --- 98 127 103 --- --- 109NuTech/G2 Genetic 5F-811 111 94 --- 123 103 --- --- 107Pioneer P0843AM 108 96 97 123 98 100 110 104Doebler's RPM® 4917AM™ 109 102 104 117 106 95 94 103DEKALB DKC61-88RIB 111 105 105 101 110 88 103 102Mid-Atlantic MA8116DGVT2P 111 --- 101 108 96 --- --- 102NuTech/G2 Genetic X5Z-1001 110 100 107 115 98 96 95 102Channel 211-33VT2PRIB 111 --- 96 114 97 --- 98 101NuTech/G2 Genetic 5F-709 109 96 101 114 101 95 94 100NuTech/G2 Genetic 5F-710 110 88 98 114 100 --- --- 100Seed Consultants SCS 1125YHR™ 111 --- --- 81 112 97 106 99Pioneer P1197AM 111 95 96 83 101 112 107 99Doebler's RPM® 5015AM™ 110 84 90 122 100 89 99 97Channel 208-23VT2PRIB 108 --- --- 101 93 --- 98 97DEKALB DKC60-67RIB 110 96 91 107 95 98 96 97Seed Consultants SC 11AQ15™ 111 --- --- 103 99 92 92 96Seed Consultants SC 10AGT96™ 108 --- --- 104 97 85 --- 95Seed Consultants SC 11AQ17™ 110 --- --- 86 97 100 97 95Doebler's RPM® 4816AM™ 108 101 --- 81 99 --- --- 94Dyna-Gro D49VC39 109 --- --- 84 104 --- 91 93Doebler's RPM® 5125AM™ 111 90 91 109 95 81 93 93
<108 Days Relative Maturity
108-111 Days Relative Maturity
8
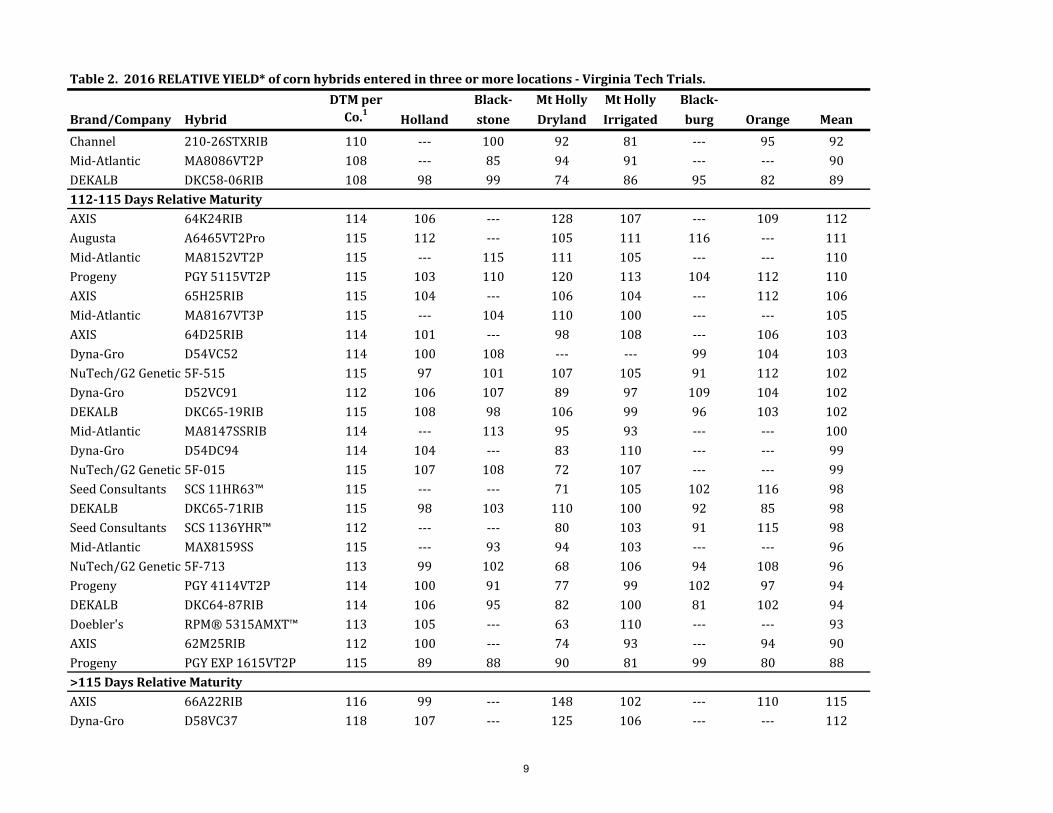
Table 2. 2016 RELATIVE YIELD* of corn hybrids entered in three or more locations - Virginia Tech Trials.DTM per Black- Mt Holly Mt Holly Black-
Brand/Company Hybrid Co.1 Holland stone Dryland Irrigated burg Orange Mean
Channel 210-26STXRIB 110 --- 100 92 81 --- 95 92Mid-Atlantic MA8086VT2P 108 --- 85 94 91 --- --- 90DEKALB DKC58-06RIB 108 98 99 74 86 95 82 89112-115 Days Relative MaturityAXIS 64K24RIB 114 106 --- 128 107 --- 109 112Augusta A6465VT2Pro 115 112 --- 105 111 116 --- 111Mid-Atlantic MA8152VT2P 115 --- 115 111 105 --- --- 110Progeny PGY 5115VT2P 115 103 110 120 113 104 112 110AXIS 65H25RIB 115 104 --- 106 104 --- 112 106Mid-Atlantic MA8167VT3P 115 --- 104 110 100 --- --- 105AXIS 64D25RIB 114 101 --- 98 108 --- 106 103Dyna-Gro D54VC52 114 100 108 --- --- 99 104 103NuTech/G2 Genetic 5F-515 115 97 101 107 105 91 112 102Dyna-Gro D52VC91 112 106 107 89 97 109 104 102DEKALB DKC65-19RIB 115 108 98 106 99 96 103 102Mid-Atlantic MA8147SSRIB 114 --- 113 95 93 --- --- 100Dyna-Gro D54DC94 114 104 --- 83 110 --- --- 99NuTech/G2 Genetic 5F-015 115 107 108 72 107 --- --- 99Seed Consultants SCS 11HR63™ 115 --- --- 71 105 102 116 98DEKALB DKC65-71RIB 115 98 103 110 100 92 85 98Seed Consultants SCS 1136YHR™ 112 --- --- 80 103 91 115 98Mid-Atlantic MAX8159SS 115 --- 93 94 103 --- --- 96NuTech/G2 Genetic 5F-713 113 99 102 68 106 94 108 96Progeny PGY 4114VT2P 114 100 91 77 99 102 97 94DEKALB DKC64-87RIB 114 106 95 82 100 81 102 94Doebler's RPM® 5315AMXT™ 113 105 --- 63 110 --- --- 93AXIS 62M25RIB 112 100 --- 74 93 --- 94 90Progeny PGY EXP 1615VT2P 115 89 88 90 81 99 80 88>115 Days Relative MaturityAXIS 66A22RIB 116 99 --- 148 102 --- 110 115Dyna-Gro D58VC37 118 107 --- 125 106 --- --- 112
9
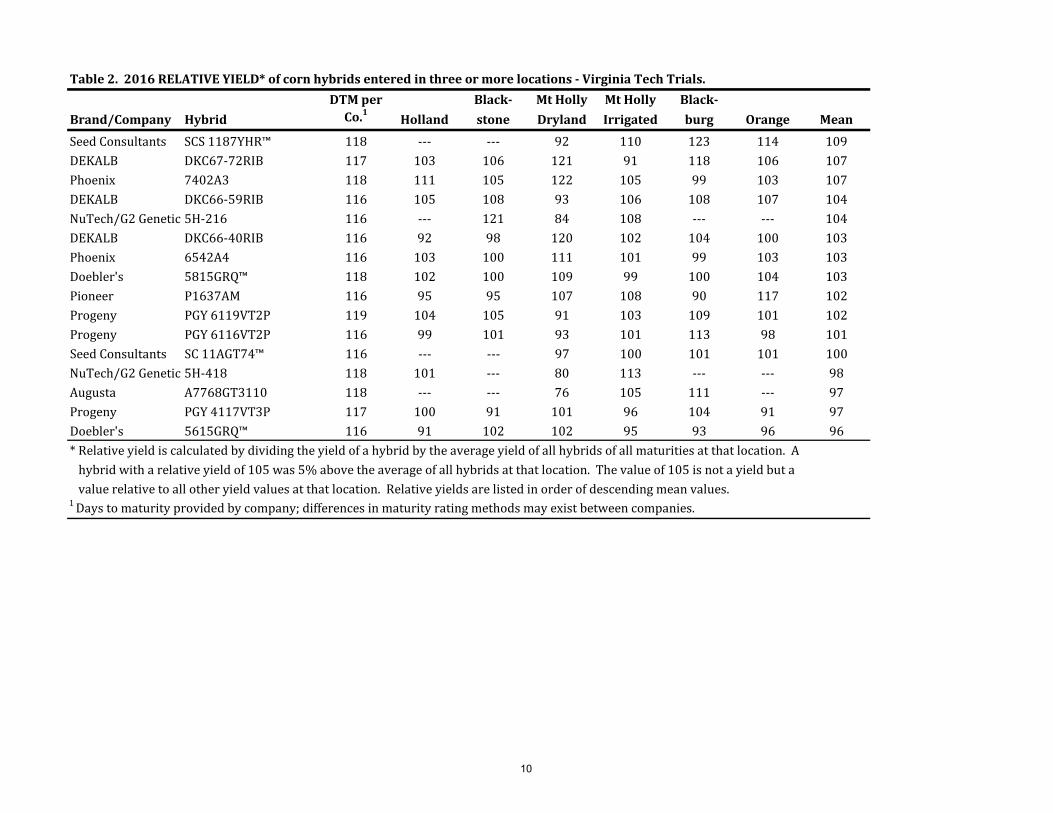
Table 2. 2016 RELATIVE YIELD* of corn hybrids entered in three or more locations - Virginia Tech Trials.DTM per Black- Mt Holly Mt Holly Black-
Brand/Company Hybrid Co.1 Holland stone Dryland Irrigated burg Orange Mean
Seed Consultants SCS 1187YHR™ 118 --- --- 92 110 123 114 109DEKALB DKC67-72RIB 117 103 106 121 91 118 106 107Phoenix 7402A3 118 111 105 122 105 99 103 107DEKALB DKC66-59RIB 116 105 108 93 106 108 107 104NuTech/G2 Genetic 5H-216 116 --- 121 84 108 --- --- 104DEKALB DKC66-40RIB 116 92 98 120 102 104 100 103Phoenix 6542A4 116 103 100 111 101 99 103 103Doebler's 5815GRQ™ 118 102 100 109 99 100 104 103Pioneer P1637AM 116 95 95 107 108 90 117 102Progeny PGY 6119VT2P 119 104 105 91 103 109 101 102Progeny PGY 6116VT2P 116 99 101 93 101 113 98 101Seed Consultants SC 11AGT74™ 116 --- --- 97 100 101 101 100NuTech/G2 Genetic 5H-418 118 101 --- 80 113 --- --- 98Augusta A7768GT3110 118 --- --- 76 105 111 --- 97Progeny PGY 4117VT3P 117 100 91 101 96 104 91 97Doebler's 5615GRQ™ 116 91 102 102 95 93 96 96* Relative yield is calculated by dividing the yield of a hybrid by the average yield of all hybrids of all maturities at that location. A hybrid with a relative yield of 105 was 5% above the average of all hybrids at that location. The value of 105 is not a yield but a value relative to all other yield values at that location. Relative yields are listed in order of descending mean values.1 Days to maturity provided by company; differences in maturity rating methods may exist between companies.
10

Table 3. Two-year Average RELATIVE YIELD* (2015-2016) of corn hybrids entered in three or more locations each year - Virginia Tech Trials.
DTM per RelativeBrand/Company Hybrid Co.1 Yield<108 Days Relative MaturityPioneer P0339AM 103 13 94
DEKALB DKC61-88RIB 111 13 103Doebler's RPM® 5015AM™ 110 13 99Pioneer P1197AM 111 13 99Doebler's RPM® 5125AM™ 111 13 98Seed Consultants SC 11AQ15™ 111 9 97Doebler's RPM® 4816AM™ 108 6 97DEKALB DKC60-67RIB 110 13 94
Augusta A6465VT2Pro 115 8 112AXIS 64K24RIB 114 7 108Progeny PGY 5115VT2P 115 13 106Dyna-Gro D54DC94 114 9 105DEKALB DKC65-19RIB 115 13 104Dyna-Gro D52VC91 112 12 104AXIS 64D25RIB 114 7 103Doebler's RPM® 5315AMXT™ 113 6 100Seed Consultants SCS 11HR63™ 115 9 100Progeny PGY 4114VT2P 114 13 99DEKALB DKC64-87RIB 114 13 98
DEKALB DKC66-40RIB 116 13 107Phoenix 7402A3 118 10 103DEKALB DKC67-72RIB 117 13 103Doebler's 5815GRQ™ 118 13 101Seed Consultants SC 11AGT74™ 116 9 100Phoenix 6542A4 116 10 100Doebler's 5615GRQ™ 116 13 97Progeny PGY 6116VT2P 116 13 96Progeny PGY 4117VT3P 117 13 94* Relative yield is calculated by dividing the yield of a hybrid by the average yield of all hybrids of all maturities at that location. A hybrid with a relative yield of 105 was 5% above the average of all hybrids at that location. The value of 105 is not a yield but a value relative to all other yield values at that location. Relative yields are listed in order of descending mean values. A hybrid does not have to be entered in the same three locations each year.1 Days to maturity provided by company; differences in maturity rating methods may exist between companies.2 A higher number of site/year combinations provides a better estimate of hybrid performance than a single site/year location.
Number of Obs.2
108-111 Days Relative Maturity
112-115 Days Relative Maturity
>115 Days Relative Maturity
11

Table 4. Three-year Average RELATIVE YIELD* (2014-2016) of corn hybrids entered in three or more locations each year - Virginia Tech Trials.
DTM per RelativeBrand/Company Hybrid Co.1 Yield
Doebler's RPM® 5015AM™ 110 20 102Seed Consultants SC 11AQ15™ 111 13 98DEKALB DKC60-67RIB 110 20 95
Dyna-Gro D54DC94 114 16 111DEKALB DKC65-19RIB 115 20 105Seed Consultants SCS 11HR63™ 115 14 101Doebler's RPM® 5315AMXT™ 113 13 95
DEKALB DKC66-40RIB 116 20 107Phoenix 7402A3 118 14 105Doebler's 5815GRQ™ 118 20 101Phoenix 6542A4 116 14 101Seed Consultants SC 11AGT74™ 116 14 101Doebler's 5615GRQ™ 116 20 97* Relative yield is calculated by dividing the yield of a hybrid by the average yield of all hybrids of all maturities at that location. A hybrid with a relative yield of 105 was 5% above the average of all hybrids at that location. The value of 105 is not a yield but a value relative to all other yield values at that location. Relative yields are listed in order of descending mean values. A hybrid does not have to be entered in the same three locations each year.1 Days to maturity provided by company; differences in maturity rating methods may exist between companies.2 A higher number of site/year combinations provides a better estimate of hybrid performance than a single site/year location.
Number of Obs.2
108-111 Days Relative Maturity
112-115 Days Relative Maturity
>115 Days Relative Maturity
12

Table 5. Corn Yields at the Tidewater AREC at HOLLAND, VIRGINIA in 2016 - Virginia Tech Trials.
DTM per Yield2 Moist Test Wt.Brand/Company Hybrid Co.1 bu/A % lb/bu<108 Days Relative MaturityAXIS 53A25RIB 103 191 17.0 56.1Pioneer P0339AM 103 186 16.5 53.1AXIS 56Z50RIB 106 185 17.4 52.9Phoenix 5352A4 107 185 18.5 52.0Doebler's RPM® 4717AMX™ 107 170 17.5 54.2
Maturity Average 184 17.4 53.6L.S.D. (0.05) 13 1.8 1.8C.V. 5 6.8 2.0
108-111 Days Relative MaturityDEKALB DKC61-88RIB 111 195 18.3 53.1Doebler's RPM® 4917AM™ 109 189 18.2 52.0Doebler's RPM® 4816AM™ 108 187 17.6 54.2NuTech/G2 Genetics X5Z-1001 110 185 18.0 53.3DEKALB DKC58-06RIB 108 182 18.0 53.6Pioneer P0843AM 108 179 18.1 54.6DEKALB DKC60-67RIB 110 178 18.0 54.1NuTech/G2 Genetics 5F-709 109 178 17.8 53.8Pioneer P1197AM 111 176 17.9 51.6NuTech/G2 Genetics 5F-811 111 174 19.8 53.4Doebler's RPM® 5125AM™ 111 167 17.2 54.2NuTech/G2 Genetics 5F-710 110 163 15.8 53.7Doebler's RPM® 5015AM™ 110 156 18.1 54.1
Maturity Average 178 17.9 53.5L.S.D. (0.05) 21 2.3 1.8C.V. 8 8.5 2.2
112-115 Days Relative MaturityAugusta A6465VT2Pro 115 208 19.5 52.0DEKALB DKC65-19RIB 115 201 20.5 55.0NuTech/G2 Genetics 5F-113 113 199 18.9 55.4NuTech/G2 Genetics 5F-015 115 198 19.4 53.8AXIS 64K24RIB 114 197 20.7 52.8Dyna-Gro D52VC91 112 196 19.4 55.8DEKALB DKC64-87RIB 114 196 19.8 52.5Doebler's RPM® 5315AMXT™ 113 196 18.8 53.0Dyna-Gro D54DC94 114 194 19.9 51.9AXIS 65H25RIB 115 193 20.6 53.5Progeny PGY 5115VT2P 115 191 20.3 52.6AXIS 64D25RIB 114 188 20.3 51.7AXIS 62M25RIB 112 186 19.1 52.6Dyna-Gro D54VC52 114 185 20.8 53.6Progeny PGY 4114VT2P 114 185 18.2 54.0
13

Table 5. Corn Yields at the Tidewater AREC at HOLLAND, VIRGINIA in 2016 - Virginia Tech Trials.
DTM per Yield2 Moist Test Wt.Brand/Company Hybrid Co.1 bu/A % lb/buNuTech/G2 Genetics 5F-713 113 183 19.6 52.2DEKALB DKC65-71RIB 115 181 19.8 51.4NuTech/G2 Genetics 5F-515 115 180 20.3 52.6Progeny PGY EXP 1615VT2P 115 166 20.8 54.1
Maturity Average 191 19.8 53.2L.S.D. (0.05) 18 1.1 3.2C.V. 6 3.8 3.9
>115 Days Relative MaturityPhoenix 7402A3 118 207 23.8 50.7Dyna-Gro D58VC37 118 198 21.9 53.3DEKALB DKC66-59RIB 116 194 21.1 52.6Progeny PGY 6119VT2P 119 192 23.9 51.8DEKALB DKC67-72RIB 117 192 20.4 52.2Phoenix 6542A4 116 190 21.3 49.8Doebler's 5815GRQ™ 118 190 23.3 52.7NuTech/G2 Genetics 5H-418 118 188 21.4 51.7Progeny PGY 4117VT3P 117 185 20.4 51.5AXIS 66A22RIB 116 183 19.9 52.0Progeny PGY 6116VT2P 116 183 20.5 51.4Pioneer P1637AM 116 177 19.6 53.1DEKALB DKC66-40RIB 116 171 20.2 52.5Doebler's 5615GRQ™ 116 169 21.7 52.2
Maturity Average 187 21.4 52.0L.S.D. (0.05) 20 1.5 2.2C.V. 7 4.7 2.7Location Average 186 19.5 53.0
1 Days to maturity provided by company; differences in maturity rating methods may exist between companies.2 Reported at 15.5% moisture.Planted April 15, 2016. Harvested August 31, 2016. Population was 28,650 plants/acre.
14

Table 6. Two-year Average Corn Yields at the Tidewater AREC at HOLLAND, VIRGINIA in 2015 and 2016 - Virginia Tech Trials.
DTM per Yield2 Moist Test Wt.Brand/Company Hybrid Co.1 bu/A % lb/bu<108 Days Relative MaturityPioneer P0339AM 103 136 16.5 52.8108-111 Days Relative MaturityDEKALB DKC61-88RIB 111 148 18.6 52.6Doebler's RPM® 4816AM™ 108 142 17.6 53.7Pioneer P1197AM 111 134 19.9 52.1Doebler's RPM® 5015AM™ 110 130 19.2 52.6Doebler's RPM® 5125AM™ 111 129 18.9 53.7DEKALB DKC60-67RIB 110 121 18.6 53.1
Maturity Average 134 18.8 53.0L.S.D. (0.05) 18 2.6 1.1C.V. 12 13.0 1.9
112-115 Days Relative MaturityDoebler's RPM® 5315AMXT™ 113 172 21.7 51.9DEKALB DKC65-19RIB 115 170 20.9 53.7Augusta A6465VT2Pro 115 163 23.5 51.0AXIS 64K24RIB 114 161 21.9 51.5Progeny PGY 5115VT2P 115 159 21.7 51.2Dyna-Gro D52VC91 112 151 20.1 53.6Dyna-Gro D54DC94 114 151 23.5 51.0Progeny PGY 4114VT2P 114 149 19.9 53.0DEKALB DKC64-87RIB 114 148 20.0 52.2AXIS 64D25RIB 114 141 21.3 51.6
Maturity Average 156 21.4 52.0L.S.D. (0.05) 20 2.9 2.2C.V. 12 13.3 3.9
>115 Days Relative MaturityDEKALB DKC66-40RIB 116 146 23.9 51.0Doebler's 5815GRQ™ 118 144 25.0 51.2Doebler's 5615GRQ™ 116 142 26.1 50.4DEKALB DKC67-72RIB 117 137 21.2 51.5Progeny PGY 6116VT2P 116 134 22.4 50.9Phoenix 6542A4 116 134 24.1 48.4Phoenix 7402A3 118 133 23.9 49.2Progeny PGY 4117VT3P 117 128 21.6 51.0
Maturity Average 137 23.5 50.4L.S.D. (0.05) 20 3.5 1.4C.V. 13 14.4 2.5Location Average 144 21.3 51.8
1 Days to maturity provided by company; differences in maturity rating methods may exist between companies.2 Reported at 15.5% moisture.
15

Table 7. Three-year Average Corn Yields at the Tidewater AREC at HOLLAND, VIRGINIA, 2014-2016 - Virginia Tech Trials.
DTM per Yield2 Moist Test Wt.Brand/Company Hybrid Co.1 bu/A % lb/bu108-111 Days Relative MaturityDoebler's RPM® 5015AM™ 110 135 19.6 52.4DEKALB DKC60-67RIB 110 129 19.0 53.6
Maturity Average 132 19.3 53.0L.S.D. (0.05) 17 2.5 1.2C.V. 13 13.2 2.3
112-115 Days Relative MaturityDoebler's RPM® 5315AMXT™ 113 171 21.9 51.9DEKALB DKC65-19RIB 115 165 21.0 54.0Dyna-Gro D54DC94 114 163 23.1 51.2AXIS 64K24RIB 114 158 21.8 51.8
Maturity Average 164 22.0 52.2L.S.D. (0.05) 20 2.0 2.2C.V. 14 10.7 4.6
>115 Days Relative MaturityDEKALB DKC66-40RIB 116 150 23.6 51.5Doebler's 5815GRQ™ 118 148 25.0 51.2Phoenix 6542A4 116 142 23.7 48.6Doebler's 5615GRQ™ 116 141 24.8 50.6Phoenix 7402A3 118 133 24.5 50.0
Maturity Average 143 24.3 50.4L.S.D. (0.05) 19 2.5 1.1C.V. 15 12.0 2.5Location Average 149 22.6 51.5
1 Days to maturity provided by company; differences in maturity rating methods may exist between companies.2 Reported at 15.5% moisture.
16

Table 8. Corn Yields under DRYLAND conditions at the Virginia Crop Improvement Foundation Seed Farm at MT HOLLY, VIRGINIA in 2016 - Virginia Tech Trials.
DTM per Yield2 Moist Test Wt.Brand/Company Hybrid Co.1 bu/A % lb/bu<108 Days Relative MaturityChannel 206-30STXRIB 106 98 13.7 54.3Doebler's RPM® 4717AMX™ 107 93 13.9 52.7Channel 207-27VT2PRIB 107 86 15.1 51.0Pioneer P0339AM 103 86 15.7 51.9Augusta A2956GT3111 106 84 18.0 54.8Phoenix 5352A4 107 84 17.7 51.2Augusta A5457GT 107 84 15.2 55.7Mid-Atlantic MA5001GT3VIP 99 79 15.9 51.4Mid-Atlantic MAX8006DGVT2PRIB 98 77 12.9 49.4AXIS 53A25RIB 103 72 18.5 48.3AXIS 56Z50RIB 106 71 15.4 47.8Mid-Atlantic MA8065SS 106 71 15.2 49.0
Maturity Average 82 15.6 51.5L.S.D. (0.05) 14 4.6 2.5C.V. 11 17.6 2.9
108-111 Days Relative MaturityMid-Atlantic MA8107VT2P 110 112 15.9 52.0Pioneer P0843AM 108 109 14.8 54.5NuTech/G2 Genetics 5F-811 111 108 17.5 54.6Doebler's RPM® 5015AM™ 110 107 15.8 56.2Doebler's RPM® 4917AM™ 109 103 15.3 54.4NuTech/G2 Genetics X5Z-1001 110 101 16.3 53.3Channel 211-33VT2PRIB 111 101 15.0 54.3NuTech/G2 Genetics 5F-710 110 100 15.9 52.8NuTech/G2 Genetics 5F-709 109 100 15.7 53.9Doebler's RPM® 5125AM™ 111 96 15.0 53.7Mid-Atlantic MA8116DGVT2P 111 96 15.1 51.9Augusta A4959GT3110 109 95 15.9 53.9DEKALB DKC60-67RIB 110 94 15.3 51.6NK N59B-3111A 109 94 16.6 52.2Seed Consultants SC 10AGT96™ 108 92 15.3 53.2Seed Consultants SC 11AQ15™ 111 91 20.1 51.7Channel 208-23VT2PRIB 108 89 14.4 51.8DEKALB DKC61-88RIB 111 89 15.1 52.6Mid-Atlantic MA8086VT2P 108 83 14.2 49.7Channel 210-26STXRIB 110 81 16.8 51.8NuTech/G2 Genetics 5F-510 110 76 16.6 53.8Seed Consultants SC 11AQ17™ 110 76 16.4 52.2Dyna-Gro D49VC39 109 74 13.9 47.2Pioneer P1197AM 111 73 15.0 53.2Doebler's RPM® 4816AM™ 108 71 16.6 50.3
17

Table 8. Corn Yields under DRYLAND conditions at the Virginia Crop Improvement Foundation Seed Farm at MT HOLLY, VIRGINIA in 2016 - Virginia Tech Trials.
DTM per Yield2 Moist Test Wt.Brand/Company Hybrid Co.1 bu/A % lb/buSeed Consultants SCS 1125YHR™ 111 71 15.3 53.9Augusta A1108VT2ProRIB 108 71 14.1 49.2DEKALB DKC58-06RIB 108 65 14.6 48.3
Maturity Average 90 15.7 52.4L.S.D. (0.05) 20 2.2 2.5C.V. 14 8.7 2.9
112-115 Days Relative MaturityAXIS 64K24RIB 114 113 19.6 52.1Augusta A1564GTCBLL 114 110 17.5 48.9Augusta A6664VT2Pro 114 106 19.0 53.4Progeny PGY 5115VT2P 115 106 16.4 52.8Mid-Atlantic MA8152VT2P 115 98 17.1 54.2Mid-Atlantic MA8167VT3P 115 97 18.7 53.6DEKALB DKC65-71RIB 115 97 17.6 52.3NuTech/G2 Genetics 5F-515 115 94 19.3 54.2DEKALB DKC65-19RIB 115 94 18.3 54.2AXIS 65H25RIB 115 93 17.9 53.5Augusta A6465VT2Pro 115 93 17.9 53.4NK N74L-3010 114 91 16.0 50.6NK N69D-3000GT 112 91 18.8 51.3Augusta A1565GTCBLL 115 91 18.6 52.0AXIS 64D25RIB 114 86 19.0 51.2Mid-Atlantic MA8147SSRIB 114 84 17.3 56.2Mid-Atlantic MAX8159SS 115 83 20.4 47.6Progeny PGY EXP 1615VT2P 115 80 16.5 51.5Dyna-Gro D52VC91 112 78 16.5 51.6Dyna-Gro D54DC94 114 73 18.9 52.5DEKALB DKC64-87RIB 114 72 13.9 52.3Seed Consultants SCS 1136YHR™ 112 71 15.4 55.2Progeny PGY 4114VT2P 114 68 14.0 51.2Augusta A5062GT3110 112 67 16.7 49.8AXIS 62M25RIB 112 66 14.1 48.4NuTech/G2 Genetics 5F-015 115 64 15.8 54.8Seed Consultants SCS 11HR63™ 115 62 17.5 55.3NuTech/G2 Genetics 5F-713 113 60 16.0 50.1Doebler's RPM® 5315AMXT™ 113 56 14.6 51.5
Maturity Average 84 17.2 52.3L.S.D. (0.05) 27 3.1 2.4C.V. 21 12.0 2.9
>115 Days Relative MaturityAXIS 66A22RIB 116 130 19.9 52.6Augusta A7766VT2Pro 116 121 21.0 51.6
18
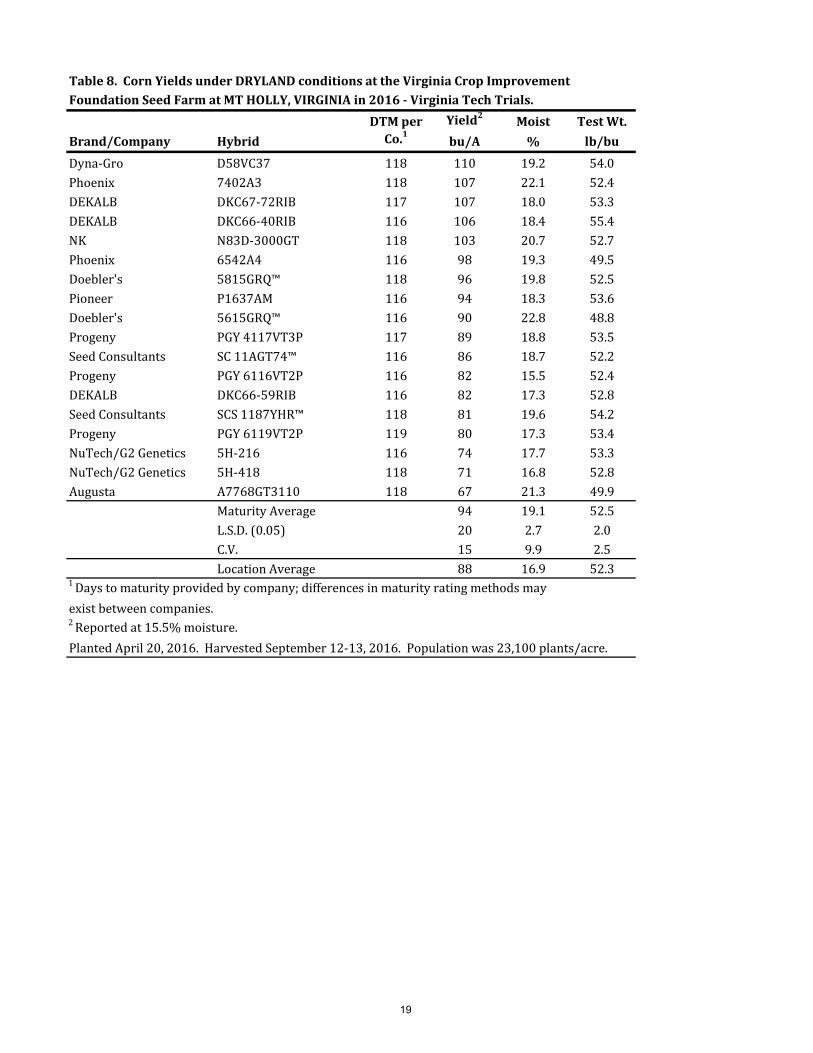
Table 8. Corn Yields under DRYLAND conditions at the Virginia Crop Improvement Foundation Seed Farm at MT HOLLY, VIRGINIA in 2016 - Virginia Tech Trials.
DTM per Yield2 Moist Test Wt.Brand/Company Hybrid Co.1 bu/A % lb/buDyna-Gro D58VC37 118 110 19.2 54.0Phoenix 7402A3 118 107 22.1 52.4DEKALB DKC67-72RIB 117 107 18.0 53.3DEKALB DKC66-40RIB 116 106 18.4 55.4NK N83D-3000GT 118 103 20.7 52.7Phoenix 6542A4 116 98 19.3 49.5Doebler's 5815GRQ™ 118 96 19.8 52.5Pioneer P1637AM 116 94 18.3 53.6Doebler's 5615GRQ™ 116 90 22.8 48.8Progeny PGY 4117VT3P 117 89 18.8 53.5Seed Consultants SC 11AGT74™ 116 86 18.7 52.2Progeny PGY 6116VT2P 116 82 15.5 52.4DEKALB DKC66-59RIB 116 82 17.3 52.8Seed Consultants SCS 1187YHR™ 118 81 19.6 54.2Progeny PGY 6119VT2P 119 80 17.3 53.4NuTech/G2 Genetics 5H-216 116 74 17.7 53.3NuTech/G2 Genetics 5H-418 118 71 16.8 52.8Augusta A7768GT3110 118 67 21.3 49.9
Maturity Average 94 19.1 52.5L.S.D. (0.05) 20 2.7 2.0C.V. 15 9.9 2.5Location Average 88 16.9 52.3
1 Days to maturity provided by company; differences in maturity rating methods may exist between companies.2 Reported at 15.5% moisture.Planted April 20, 2016. Harvested September 12-13, 2016. Population was 23,100 plants/acre.
19

Table 9. Two-year Average Corn Yields under DRYLAND conditions at the Virginia Crop Improvement Foundation Seed Farm at MT HOLLY, VIRGINIA in 2015 and 2016 - VirginiaTech Trials.
DTM perBrand/Company Hybrid Co.1 Yield2
Moist Test Wt.<108 Days Relative Maturity bu/A % lb/buPioneer P0339AM 103 137 15.3 54.7108-111 Days Relative MaturityDoebler's RPM® 5015AM™ 110 159 15.8 56.5DEKALB DKC61-88RIB 111 155 15.5 54.7Doebler's RPM® 5125AM™ 111 152 15.3 55.2Pioneer P1197AM 111 143 15.4 55.2DEKALB DKC60-67RIB 110 142 15.2 54.5NK N59B-3111A 109 141 16.6 53.7Seed Consultants SC 11AQ15™ 111 136 19.3 53.7Doebler's RPM® 4816AM™ 108 134 15.8 54.0
Maturity Average 145 16.1 54.7L.S.D. (0.05) 12 0.8 1.3C.V. 8 4.9 2.2
112-115 Days Relative MaturityDEKALB DKC65-19RIB 115 160 18.1 56.6Augusta A6664VT2Pro 114 159 18.3 55.1Progeny PGY 5115VT2P 115 158 17.1 55.1Augusta A6465VT2Pro 115 157 18.4 53.7AXIS 64K24RIB 114 151 17.9 55.2AXIS 64D25RIB 114 147 18.6 53.4DEKALB DKC64-87RIB 114 142 15.3 54.3Dyna-Gro D52VC91 112 142 16.9 55.4Dyna-Gro D54DC94 114 141 18.5 53.6Doebler's RPM® 5315AMXT™ 113 133 15.8 53.7Seed Consultants SCS 11HR63™ 115 132 17.4 56.2Progeny PGY 4114VT2P 114 121 15.1 54.2
Maturity Average 145 17.3 54.7L.S.D. (0.05) 16 1.1 1.2C.V. 11 6.3 2.0
>115 Days Relative MaturityDEKALB DKC66-40RIB 116 154 18.2 55.6DEKALB DKC67-72RIB 117 152 17.9 54.6DEKALB DKC66-59RIB 116 149 19.4 54.6Phoenix 7402A3 118 148 21.0 53.5Phoenix 6542A4 116 145 18.8 51.5Doebler's 5815GRQ™ 118 145 20.3 53.7NK N83D-3000GT 118 143 20.5 53.9Doebler's 5615GRQ™ 116 139 20.7 51.1Progeny PGY 4117VT3P 117 131 18.6 54.3Progeny PGY 6116VT2P 116 129 17.3 53.7
20

Table 9. Two-year Average Corn Yields under DRYLAND conditions at the Virginia Crop Improvement Foundation Seed Farm at MT HOLLY, VIRGINIA in 2015 and 2016 - VirginiaTech Trials.
DTM perBrand/Company Hybrid Co.1 Yield2
Moist Test Wt.Maturity Average 144 19.3 53.6L.S.D. (0.05) 12 1.4 1.2C.V. 8 7.1 2.1Location Average 144 17.6 54.4
1 Days to maturity provided by company; differences in maturity rating methods may exist between companies.2 Reported at 15.5% moisture.
21

Table 10. Three-year Average Corn Yields under DRYLAND conditions at the Virginia Crop Improvement Foundation Seed Farm at MT HOLLY, VIRGINIA, 2014-2016 - VirginiaTech Trials.
DTM per Yield2 Moist Test Wt.Brand/Company Hybrid Co.1 bu/A % lb/bu108-111 Days Relative MaturityDoebler's RPM® 5015AM™ 110 137 16.4 55.6DEKALB DKC60-67RIB 110 121 16.6 55.3Seed Consultants SC 11AQ15™ 111 118 20.6 53.4
Maturity Average 125 17.9 54.8L.S.D. (0.05) 11 0.8 0.6C.V. 10 4.8 1.2
112-115 Days Relative MaturityDEKALB DKC65-19RIB 115 137 19.3 56.1Dyna-Gro D54DC94 114 136 19.7 53.2Augusta A6664VT2Pro 114 135 19.8 54.2Seed Consultants SCS 11HR63™ 115 104 18.1 54.5Doebler's RPM® 5315AMXT™ 113 99 16.4 52.1
Maturity Average 122 18.7 54.0L.S.D. (0.05) 14 1.2 1.6C.V. 13 7.4 3.4
>115 Days Relative MaturityDEKALB DKC66-40RIB 116 139 19.7 54.8Phoenix 7402A3 118 132 22.2 53.5Seed Consultants SC 11AGT74™ 116 131 21.1 54.1Phoenix 6542A4 116 130 20.6 51.5NK N83D-3000GT 118 129 22.0 53.4Doebler's 5815GRQ™ 118 128 22.0 53.3Doebler's 5615GRQ™ 116 127 21.7 51.8
Maturity Average 131 21.3 53.2L.S.D. (0.05) 11 1.1 0.9C.V. 10 6.3 2.0Location Average 127 19.7 53.8
1 Days to maturity provided by company; differences in maturity rating methods may exist between companies.2 Reported at 15.5% moisture.
22

Table 11. Corn Yields under IRRIGATED conditions at the Virginia Crop Improvement Foundation Seed Farm at MT HOLLY, VIRGINIA in 2016 - Virginia Tech Trials.
DTM per Yield2 Moist Test Wt.Brand/Company Hybrid Co.1 bu/A % lb/bu<108 Days Relative MaturityPhoenix 5352A4 107 241 20.7 52.8Doebler's RPM® 4717AMX™ 107 224 18.5 54.6Pioneer P0339AM 103 222 17.4 55.0Augusta A5457GT 107 217 19.4 57.3Augusta A2956GT3111 106 216 17.4 56.2Mid-Atlantic MAX8006DGVT2PRIB 98 210 16.7 55.0Mid-Atlantic MA8065SS 106 210 17.5 55.4Mid-Atlantic MA5001GT3VIP 99 195 18.8 53.8AXIS 53A25RIB 103 193 18.0 55.9AXIS 56Z50RIB 106 193 17.8 56.1Channel 207-27VT2PRIB 107 190 18.5 54.5Channel 206-30STXRIB 106 173 15.8 57.3
Maturity Average 207 18.0 55.3L.S.D. (0.05) 20 1.8 1.8C.V. 6 6.4 2.0
108-111 Days Relative MaturitySeed Consultants SCS 1125YHR™ 111 252 19.4 53.7DEKALB DKC61-88RIB 111 248 20.4 53.6NK N59B-3111A 109 239 19.7 53.0Doebler's RPM® 4917AM™ 109 239 19.2 55.6Augusta A4959GT3110 109 236 19.9 54.6Dyna-Gro D49VC39 109 235 17.9 53.2NuTech/G2 Genetics 5F-811 111 232 20.3 53.9Mid-Atlantic MA8107VT2P 110 231 20.3 53.3NuTech/G2 Genetics 5F-510 110 228 17.5 57.7NuTech/G2 Genetics 5F-709 109 227 19.3 53.7Pioneer P1197AM 111 226 19.2 55.1NuTech/G2 Genetics 5F-710 110 224 18.1 54.1Doebler's RPM® 5015AM™ 110 224 18.9 53.8Doebler's RPM® 4816AM™ 108 223 18.1 55.2Seed Consultants SC 11AQ15™ 111 222 24.3 52.2NuTech/G2 Genetics X5Z-1001 110 221 19.3 54.8Pioneer P0843AM 108 221 18.3 55.3Seed Consultants SC 10AGT96™ 108 218 17.5 54.7Seed Consultants SC 11AQ17™ 110 217 22.4 52.7Channel 211-33VT2PRIB 111 217 19.4 55.4Augusta A1108VT2ProRIB 108 217 17.5 53.1Mid-Atlantic MA8116DGVT2P 111 216 20.4 52.7Doebler's RPM® 5125AM™ 111 214 17.9 55.5DEKALB DKC60-67RIB 110 213 18.2 55.7Channel 208-23VT2PRIB 108 208 18.9 53.3
23

Table 11. Corn Yields under IRRIGATED conditions at the Virginia Crop Improvement Foundation Seed Farm at MT HOLLY, VIRGINIA in 2016 - Virginia Tech Trials.
DTM per Yield2 Moist Test Wt.Brand/Company Hybrid Co.1 bu/A % lb/buMid-Atlantic MA8086VT2P 108 205 19.3 55.3DEKALB DKC58-06RIB 108 192 18.6 54.9Channel 210-26STXRIB 110 181 21.2 54.1
Maturity Average 222 19.3 54.3L.S.D. (0.05) 23 1.8 1.5C.V. 7 6.5 1.8
112-115 Days Relative MaturityProgeny PGY 5115VT2P 115 253 22.0 51.5Augusta A6465VT2Pro 115 249 22.3 51.6Doebler's RPM® 5315AMXT™ 113 247 19.9 53.8Dyna-Gro D54DC94 114 247 22.2 53.9AXIS 64D25RIB 114 242 21.3 53.2NuTech/G2 Genetics 5F-015 115 241 20.7 54.4AXIS 64K24RIB 114 240 22.3 53.9Augusta A1564GTCBLL 114 239 21.7 50.8Augusta A6664VT2Pro 114 238 22.2 51.8NuTech/G2 Genetics 5F-713 113 238 19.3 53.7NK N69D-3000GT 112 238 22.1 52.3Mid-Atlantic MA8152VT2P 115 237 22.3 53.9NuTech/G2 Genetics 5F-515 115 236 21.3 53.4Seed Consultants SCS 11HR63™ 115 235 19.9 54.2AXIS 65H25RIB 115 233 21.7 55.4Seed Consultants SCS 1136YHR™ 112 232 20.1 55.4Mid-Atlantic MAX8159SS 115 231 20.3 52.8Augusta A1565GTCBLL 115 231 21.4 51.3Mid-Atlantic MA8167VT3P 115 225 21.2 53.9DEKALB DKC65-71RIB 115 225 20.7 54.1DEKALB DKC64-87RIB 114 224 20.6 53.2Progeny PGY 4114VT2P 114 223 20.1 54.4DEKALB DKC65-19RIB 115 222 22.4 54.7NK N74L-3010 114 219 19.2 52.0Dyna-Gro D52VC91 112 219 21.1 56.2Augusta A5062GT3110 112 218 21.9 55.8Mid-Atlantic MA8147SSRIB 114 209 20.7 54.2AXIS 62M25RIB 112 209 19.4 54.3Progeny PGY EXP 1615VT2P 115 183 22.5 54.6
Maturity Average 230 21.1 53.6L.S.D. (0.05) 18 1.3 1.9C.V. 6 4.2 2.3
>115 Days Relative MaturityNuTech/G2 Genetics 5H-418 118 254 23.1 53.0Seed Consultants SCS 1187YHR™ 118 247 24.9 54.9
24

Table 11. Corn Yields under IRRIGATED conditions at the Virginia Crop Improvement Foundation Seed Farm at MT HOLLY, VIRGINIA in 2016 - Virginia Tech Trials.
DTM per Yield2 Moist Test Wt.Brand/Company Hybrid Co.1 bu/A % lb/buPioneer P1637AM 116 243 21.6 55.1NuTech/G2 Genetics 5H-216 116 242 21.9 55.1DEKALB DKC66-59RIB 116 238 23.8 53.8Dyna-Gro D58VC37 118 238 21.7 53.1Augusta A7768GT3110 118 237 24.1 51.6Phoenix 7402A3 118 235 25.6 52.9Progeny PGY 6119VT2P 119 231 22.4 54.3AXIS 66A22RIB 116 230 23.7 51.6Augusta A7766VT2Pro 116 230 23.0 51.8DEKALB DKC66-40RIB 116 229 20.7 53.7NK N83D-3000GT 118 228 24.9 50.9Progeny PGY 6116VT2P 116 228 21.0 52.5Phoenix 6542A4 116 226 22.0 51.6Seed Consultants SC 11AGT74™ 116 225 24.3 53.5Doebler's 5815GRQ™ 118 224 24.3 51.9Progeny PGY 4117VT3P 117 215 20.8 53.4Doebler's 5615GRQ™ 116 215 24.0 51.1DEKALB DKC67-72RIB 117 204 21.1 53.3
Maturity Average 231 22.9 52.9L.S.D. (0.05) 21 1.7 1.9C.V. 6 5.1 2.0Location Average 225 20.5 53.9
1 Days to maturity provided by company; differences in maturity rating methods may exist between companies.2 Reported at 15.5% moisture.Planted April 19-20, 2016. Harvested September 13-16, 2016. Population was 28,750 plants/acre.
25

Table 12. Two-year Average Corn Yields under IRRIGATED conditions at the Virginia Crop Improvement Foundation Seed Farm at MT HOLLY, VIRGINIA in 2015 and 2016 - Virginia Tech Trials.
DTM perBrand/Company Hybrid Co.1 Yield2
Moist Test Wt.<108 Days Relative Maturity bu/A % lb/buPioneer P0339AM 103 213 17.0 55.9108-111 Days Relative MaturityDEKALB DKC61-88RIB 111 242 18.0 55.5NK N59B-3111A 109 236 18.3 54.5Doebler's RPM® 5015AM™ 110 229 17.7 54.5Seed Consultants SC 11AQ15™ 111 229 21.6 53.8Doebler's RPM® 4816AM™ 108 227 17.3 55.6Doebler's RPM® 5125AM™ 111 220 17.0 56.1Pioneer P1197AM 111 218 17.9 55.4DEKALB DKC60-67RIB 110 213 17.0 57.1
Maturity Average 227 18.1 55.3L.S.D. (0.05) 13 0.8 1.3C.V. 6 4.1 2.2
112-115 Days Relative MaturityAXIS 64D25RIB 114 249 19.5 53.9Progeny PGY 5115VT2P 115 246 19.8 53.5Augusta A6465VT2Pro 115 246 20.6 52.7Seed Consultants SCS 11HR63™ 115 242 19.1 55.3Augusta A6664VT2Pro 114 240 19.8 54.5AXIS 64K24RIB 114 240 19.8 54.9Doebler's RPM® 5315AMXT™ 113 239 19.2 54.1Dyna-Gro D54DC94 114 238 20.5 54.6Dyna-Gro D52VC91 112 236 19.2 57.4DEKALB DKC64-87RIB 114 234 19.0 55.5Progeny PGY 4114VT2P 114 226 18.0 56.1DEKALB DKC65-19RIB 115 223 20.3 56.8
Maturity Average 238 19.6 54.9L.S.D. (0.05) 15 0.8 1.3C.V. 6 4.1 2.2
>115 Days Relative MaturityPhoenix 7402A3 118 238 23.0 54.0DEKALB DKC66-40RIB 116 232 19.4 53.9NK N83D-3000GT 118 228 23.0 52.1Doebler's 5815GRQ™ 118 228 22.4 53.4Phoenix 6542A4 116 225 20.7 51.7Progeny PGY 6116VT2P 116 224 19.5 54.5DEKALB DKC66-59RIB 116 222 22.2 54.0Progeny PGY 4117VT3P 117 215 19.4 54.9DEKALB DKC67-72RIB 117 213 19.6 54.6Doebler's 5615GRQ™ 116 211 21.1 53.1
26

Table 12. Two-year Average Corn Yields under IRRIGATED conditions at the Virginia Crop Improvement Foundation Seed Farm at MT HOLLY, VIRGINIA in 2015 and 2016 - Virginia Tech Trials.
DTM perBrand/Company Hybrid Co.1 Yield2
Moist Test Wt.Maturity Average 224 21.0 53.6L.S.D. (0.05) 15 1.0 1.1C.V. 7 4.4 1.9Location Average 230 19.6 54.6
1 Days to maturity provided by company; differences in maturity rating methods may exist between companies.2 Reported at 15.5% moisture.
27

Table 13. Three-year Average Corn Yields under IRRIGATED conditions at the Virginia Crop Improvement Foundation Seed Farm at MT HOLLY, VIRGINIA, 2014-2016 - Virginia Tech Trials.
DTM perBrand/Company Hybrid Co.1 Yield2
Moist Test Wt.<108 Days Relative Maturity bu/A % lb/buDoebler's RPM® 5015AM™ 110 233 17.5 54.4Seed Consultants SC 11AQ15™ 111 227 20.6 53.9DEKALB DKC60-67RIB 110 221 17.1 57.1
Maturity Average 227 18.4 55.2L.S.D. (0.05) 11 0.8 1.3C.V. 5 5.1 2.7
112-115 Days Relative MaturitySeed Consultants SCS 11HR63™ 115 252 18.5 55.1Augusta A6664VT2Pro 114 249 19.1 54.6Doebler's RPM® 5315AMXT™ 113 242 18.9 54.5Dyna-Gro D54DC94 114 241 19.8 54.0DEKALB DKC65-19RIB 115 229 19.7 56.6
Maturity Average 243 19.2 55.0L.S.D. (0.05) 14 0.6 0.9C.V. 7 4.0 1.9
>115 Days Relative MaturityDEKALB DKC66-40RIB 116 242 19.0 54.1Phoenix 7402A3 118 241 22.3 54.0NK N83D-3000GT 118 236 22.2 52.7Phoenix 6542A4 116 234 20.3 52.3Doebler's 5815GRQ™ 118 233 22.1 53.5Seed Consultants SC 11AGT74™ 116 233 21.6 54.3Doebler's 5615GRQ™ 116 212 20.5 53.2
Maturity Average 233 21.1 53.4L.S.D. (0.05) 12 0.8 0.9C.V. 6 4.7 1.9Location Average 235 20.0 54.3
1 Days to maturity provided by company; differences in maturity rating methods may exist between companies.2 Reported at 15.5% moisture.
28

Table 14. Corn Yields at the Southern Piedmont AREC at BLACKSTONE, VIRGINIA in 2016 - Virginia Tech Trials.
DTM per Yield2 Moist Test Wt.Brand/Company Hybrid Co.1 bu/A % lb/bu<108 Days Relative MaturityPhoenix 5352A4 107 144 16.9 54.1Doebler's RPM® 4717AMX™ 107 130 14.2 56.8Mid-Atlantic MA8065SS 106 127 13.6 56.5Pioneer P0339AM 103 123 13.7 55.9
Maturity Average 131 15 56L.S.D. (0.05) 20 0.9 1.5C.V. 9 3.6 1.6
108-111 Days Relative MaturityNuTech/G2 Genetics X5Z-1001 110 149 16.0 56.4DEKALB DKC61-88RIB 111 147 15.3 56.5Doebler's RPM® 4917AM™ 109 145 15.8 56.4Mid-Atlantic MA8116DGVT2P 111 141 15.8 56.8NuTech/G2 Genetics 5F-709 109 141 15.5 56.0Channel 210-26STXRIB 110 139 16.1 55.5DEKALB DKC58-06RIB 108 138 15.1 56.5NuTech/G2 Genetics 5F-710 110 137 14.5 58.1Mid-Atlantic MA8107VT2P 110 137 15.8 55.1Pioneer P0843AM 108 135 14.5 55.9Pioneer P1197AM 111 134 15.1 57.2Channel 211-33VT2PRIB 111 134 14.9 57.4Doebler's RPM® 5125AM™ 111 126 14.0 57.8DEKALB DKC60-67RIB 110 126 15.9 57.2Doebler's RPM® 5015AM™ 110 126 15.3 55.7Mid-Atlantic MA8086VT2P 108 118 14.3 57.7
Maturity Average 136 15 57L.S.D. (0.05) 19 0.9 1.9C.V. 9 4.0 2.2
112-115 Days Relative MaturityMid-Atlantic MA8152VT2P 115 160 18.1 55.1Mid-Atlantic MA8147SSRIB 114 157 17.6 57.1Progeny PGY 5115VT2P 115 152 17.3 56.2Dyna-Gro D54VC52 114 151 17.8 57.7NuTech/G2 Genetics 5F-015 115 151 16.5 58.2Dyna-Gro D52VC91RIB 112 149 16.1 58.5Mid-Atlantic MA8167VT3P 115 145 18.2 55.4DEKALB DKC65-71RIB 115 144 16.9 56.2NuTech/G2 Genetics 5F-713 113 142 16.4 54.3NuTech/G2 Genetics 5F-515 115 141 16.8 55.8DEKALB DKC65-19RIB 115 136 17.0 56.9Channel 215-05STXRIB 115 135 15.8 57.5DEKALB DKC64-87RIB 114 133 15.1 56.8
29

Table 14. Corn Yields at the Southern Piedmont AREC at BLACKSTONE, VIRGINIA in 2016 - Virginia Tech Trials.
DTM per Yield2 Moist Test Wt.Brand/Company Hybrid Co.1 bu/A % lb/buMid-Atlantic MAX8159SS 115 129 17.3 54.3Progeny PGY 4114VT2P 114 127 15.3 58.6Progeny PGY EXP 1615VT2P 115 123 17.3 55.7
Maturity Average 142 16.8 56.5L.S.D. (0.05) 17 0.9 1.8C.V. 8 3.7 2.0
>115 Days Relative MaturityNuTech/G2 Genetics 5H-216 116 168 17.5 56.7DEKALB DKC66-59RIB 116 150 18.7 54.1DEKALB DKC67-72RIB 117 148 17.1 56.7Channel 216-36STXRIB 116 147 17.1 56.6Progeny PGY 6119VT2P 119 146 18.9 56.7Phoenix 7402A3 118 146 19.7 54.0Channel 217-92VT2PRIB 117 145 17.3 56.8Doebler's 5615GRQ™ 116 141 18.8 55.4Progeny PGY 6116VT2P 116 141 17.7 55.9Phoenix 6542A4 116 140 19.0 55.1Doebler's 5815GRQ™ 118 140 19.6 54.3DEKALB DKC66-40RIB 116 137 16.4 55.9Dyna-Gro D57VP51 117 132 16.8 56.8Pioneer P1637AM 116 132 17.6 56.9Channel 217-41STXRIB 117 130 17.5 55.0Progeny PGY 4117VT3P 117 126 18.2 55.5
Maturity Average 142 18.0 55.8L.S.D. (0.05) 20 1.1 2.6C.V. 9 3.9 2.8Location Average 139 16.5 56.3
1 Days to maturity provided by company; differences in maturity rating methods may exist between companies.2 Reported at 15.5% moisture.Planted April 15, 2016. Harvested September 7, 2016. Population was 23,500 plants/acre.
30

Table 15. Two-year Average Corn Yields at the Southern Piedmont AREC at BLACKSTONE, VIRGINIA in 2015 and 2016 - Virginia Tech Trials.
DTM per Yield2 Moist Test Wt.Brand/Company Hybrid Co.1 bu/A % lb/bu<108 Days Relative MaturityPioneer P0339AM 103 168 15.4 55.8108-111 Days Relative MaturityDEKALB DKC61-88RIB 111 180 15.7 56.9Doebler's RPM® 5015AM™ 110 167 15.8 55.6Pioneer P1197AM 111 166 15.5 56.9Doebler's RPM® 5125AM™ 111 164 15.5 56.9DEKALB DKC60-67RIB 110 161 16.7 56.1
Maturity Average 167 15.9 56.5L.S.D. (0.05) 16 1.2 1.5C.V. 9 7.3 2.5
112-115 Days Relative MaturityDyna-Gro D52VC91RIB 112 182 16.2 57.9Progeny PGY 4114VT2P 114 175 16.2 57.7Channel 215-05STXRIB 115 172 16.1 57.1DEKALB DKC65-19RIB 115 171 17.0 57.8Progeny PGY 5115VT2P 115 169 17.2 56.0DEKALB DKC64-87RIB 114 166 16.1 56.3
Maturity Average 173 16.5 57.1L.S.D. (0.05) 16 0.6 1.4C.V. 9 3.6 2.4
>115 Days Relative MaturityDEKALB DKC66-40RIB 116 182 17.3 55.9DEKALB DKC67-72RIB 117 177 17.4 56.3Phoenix 6542A4 116 175 18.6 55.0Phoenix 7402A3 118 175 18.8 55.3Doebler's 5615GRQ™ 116 174 18.8 54.4Progeny PGY 6116VT2P 116 171 18.0 55.6Doebler's 5815GRQ™ 118 169 18.7 55.5Progeny PGY 4117VT3P 117 154 17.5 55.8
Maturity Average 172 18.1 55.5L.S.D. (0.05) 18 1.3 1.7C.V. 10 6.7 2.8Location Average 171 16.9 56.2
1 Days to maturity provided by company; differences in maturity rating methods may exist between companies.2 Reported at 15.5% moisture.
31

Table 16. Three-year Average Corn Yields at the Southern Piedmont AREC at BLACKSTONE, VIRGINIA, 2014-2016 - Virginia Tech Trials.
DTM per Yield2 Moist Test Wt.Brand/Company Hybrid Co.1 bu/A % lb/bu108-111 Days Relative MaturityDoebler's RPM® 5015AM™ 110 173 18.3 54.4DEKALB DKC60-67RIB 110 162 18.5 55.1
Maturity Average 167 18.4 54.8L.S.D. (0.05) 19 1.6 1.3C.V. 13 9.2 2.7
112-115 Days Relative MaturityDEKALB DKC65-19RIB 115 171 18.7 56.6>115 Days Relative MaturityDEKALB DKC66-40RIB 116 188 18.8 55.0Phoenix 6542A4 116 174 20.6 53.6Doebler's 5815GRQ™ 118 171 21.2 54.5Phoenix 7402A3 118 170 21.0 53.9Doebler's 5615GRQ™ 116 167 20.2 53.0
Maturity Average 174 20.3 54.0L.S.D. (0.05) 16 1.1 1.3C.V. 11 6.3 2.8Location Average 172 19.7 54.5
1 Days to maturity provided by company; differences in maturity rating methods may exist between companies.2 Reported at 15.5% moisture.
32

Table 17. Corn Yields at KENTLAND Farm at BLACKSBURG, VA in 2016 - Virginia Tech Trials.DTM per Yield2 Moist Test Wt.
Brand/Company Hybrid Co.1 bu/A % lb/bu<108 Days Relative MaturityPhoenix 5352A4 107 160 19.0 53.4Pioneer P0339AM 103 151 18.6 52.8Doebler's RPM® 4717AMX™ 107 146 18.1 53.3
Maturity Average 152 18.6 53.2L.S.D. (0.05) 40 2.0 12.0C.V. 10 4.2 1.9
108-111 Days Relative MaturityPioneer P1197AM 111 166 18.4 53.7T. A. Seeds TA667-31 111 158 19.6 54.2Seed Consultants SC 11AQ17™ 110 148 19.6 54.9Pioneer P0843AM 108 148 17.4 54.9DEKALB DKC60-67RIB 110 145 18.2 55.3Seed Consultants SCS 1125YHR™ 111 144 19.7 52.6NuTech/G2 Genetics X5Z-1001 110 142 19.2 51.2Doebler's RPM® 4917AM™ 109 141 19.0 50.3NuTech/G2 Genetics 5F-709 109 141 18.6 53.3DEKALB DKC58-06RIB 108 141 19.7 53.0Seed Consultants SC 11AQ15™ 111 137 20.6 53.6Doebler's RPM® 5015AM™ 110 132 17.0 52.4DEKALB DKC61-88RIB 111 130 17.6 52.5Seed Consultants SC 10AGT96™ 108 126 18.7 51.5Doebler's RPM® 5125AM™ 111 120 17.7 54.4
Maturity Average 141 18.7 53.2L.S.D. (0.05) 27 1.3 1.7C.V. 12 4.7 2.1
112-115 Days Relative MaturityAugusta A6465VT2Pro 115 173 19.6 52.6Dyna-Gro D52VC91RIB 112 162 18.7 56.2Progeny PGY 5115VT2P 115 154 18.8 52.7Progeny PGY 4114VT2P 114 152 18.2 54.9Seed Consultants SCS 11HR63™ 115 151 19.5 52.2Progeny PGY EXP 1615VT2P 115 147 20.5 53.1Dyna-Gro D54VC52 114 146 19.7 53.6DEKALB DKC65-19RIB 115 143 19.1 56.0T. A. Seeds TA736-22DPRIB 113 141 18.6 52.9NuTech/G2 Genetics 5F-713 113 139 18.1 51.2DEKALB DKC65-71RIB 115 137 19.1 52.0Seed Consultants SCS 1136YHR™ 112 136 19.5 54.7NuTech/G2 Genetics 5F-515 115 135 19.5 52.8DEKALB DKC64-87RIB 114 119 19.8 50.9
Maturity Average 145 19.2 53.3L.S.D. (0.05) 23 2.1 2.0
33

Table 17. Corn Yields at KENTLAND Farm at BLACKSBURG, VA in 2016 - Virginia Tech Trials.DTM per Yield2 Moist Test Wt.
Brand/Company Hybrid Co.1 bu/A % lb/buC.V. 11 7.4 2.3
>115 Days Relative MaturitySeed Consultants SCS 1187YHR™ 118 182 19.9 55.6DEKALB DKC67-72RIB 117 174 20.1 53.3T. A. Seeds TA767-22DPRIB 116 171 18.8 52.3Progeny PGY 6116VT2P 116 168 20.6 53.3Augusta A7768GT3110 118 164 22.0 51.6Progeny PGY 6119VT2P 119 162 20.6 55.0DEKALB DKC66-59RIB 116 160 19.8 53.8Dyna-Gro D57VP51 117 156 19.1 54.0DEKALB DKC66-40RIB 116 155 19.6 52.3Progeny PGY 4117VT3P 117 154 20.8 53.0Seed Consultants SC 11AGT74™ 116 150 22.3 53.1Doebler's 5815GRQ™ 118 149 22.1 53.8Phoenix 6542A4 116 147 23.4 51.4Phoenix 7402A3 118 146 21.6 52.3Doebler's 5615GRQ™ 116 137 21.0 51.4Pioneer P1637AM 116 134 19.1 55.6
Maturity Average 157 20.7 53.2L.S.D. (0.05) 28 1.2 1.8C.V. 12 3.9 2.0Location Average 148 19.5 53.2
1 Days to maturity provided by company; differences in maturity rating methods may exist between companies.2 Reported at 15.5% moisture.Planted April 28, 2016. Harvested September 28, 2016. Population was 22,450 plants/acre.
34

Table 18. Two-year Average Corn Yields at Kentland Farm at BLACKSBURG, VIRGINIA in 2015 and 2016 - Virginia Tech Trials.
DTM per Yield2 Moist Test Wt.Brand/Company Hybrid Co.1 bu/A % lb/bu<108 Days Relative MaturityPioneer P0339AM 103 184 18.8 54.1108-111 Days Relative MaturityPioneer P1197AM 111 219 19.5 54.2DEKALB DKC61-88RIB 111 192 18.8 53.8Doebler's RPM® 5015AM™ 110 186 18.7 53.5Seed Consultants SC 11AQ15™ 111 185 21.4 53.0Doebler's RPM® 5125AM™ 111 183 18.9 54.8DEKALB DKC60-67RIB 110 174 19.1 55.9
Maturity Average 190 19.4 54.2L.S.D. (0.05) 19 0.9 1.3C.V. 10 4.1 2.1
112-115 Days Relative MaturitySeed Consultants SCS 11HR63™ 115 216 21.4 52.5Dyna-Gro D52VC91RIB 112 208 19.7 56.2Progeny PGY 4114VT2P 114 207 19.9 54.6Progeny PGY 5115VT2P 115 199 19.9 52.9DEKALB DKC65-19RIB 115 197 19.9 56.0T. A. Seeds TA736-22DPRIB 113 194 19.9 53.9DEKALB DKC64-87RIB 114 176 20.7 52.2
Maturity Average 199 20.2 54.0L.S.D. (0.05) 14 0.7 1.3C.V. 6 3.2 1.9
>115 Days Relative MaturityDEKALB DKC66-40RIB 116 210 20.6 52.9DEKALB DKC67-72RIB 117 204 21.2 53.6Doebler's 5815GRQ™ 118 198 24.0 52.6Progeny PGY 6116VT2P 116 195 22.2 52.5DEKALB DKC66-59RIB 116 191 23.3 53.1Doebler's 5615GRQ™ 116 183 22.0 52.6Progeny PGY 4117VT3P 117 183 20.9 53.5
Maturity Average 195 22.0 53.0L.S.D. (0.05) 25 0.8 1.5C.V. 12 3.5 2.3Location Average 194 20.5 53.7
1 Days to maturity provided by company; differences in maturity rating methods may exist between companies.2 Reported at 15.5% moisture.
35

Table 19. Three-year Average Corn Yields at Kentland Farm at BLACKSBURG, VIRGINIA, 2014-2016 - Virginia Tech Trials.
DTM per Yield2 Moist Test Wt.Brand/Company Hybrid Co.1 bu/A % lb/bu108-111 Days Relative MaturitySeed Consultants SC 11AQ15™ 111 185 22.5 52.6Doebler's RPM® 5015AM™ 110 169 19.0 53.1DEKALB DKC60-67RIB 110 165 19.4 55.5
Maturity Average 173 20.3 53.7L.S.D. (0.05) 19 0.8 1.0C.V. 13 4.4 2.1
112-115 Days Relative MaturitySeed Consultants SCS 11HR63™ 115 203 22.0 52.5DEKALB DKC65-19RIB 115 193 21.3 54.9
Maturity Average 198 21.6 53.7L.S.D. (0.05) 21 1.1 2.0C.V. 11 4.8 2.9
>115 Days Relative MaturityDEKALB DKC66-40RIB 116 197 21.9 52.5Doebler's 5815GRQ™ 118 193 25.4 51.6Seed Consultants SC 11AGT74™ 116 188 25.0 52.4Doebler's 5615GRQ™ 116 175 22.7 52.1
Maturity Average 188 23.8 52.2L.S.D. (0.05) 17 0.8 1.2C.V. 10 3.9 2.3Location Average 185 22.1 53.0
1 Days to maturity provided by company; differences in maturity rating methods may exist between companies.2 Reported at 15.5% moisture.
36
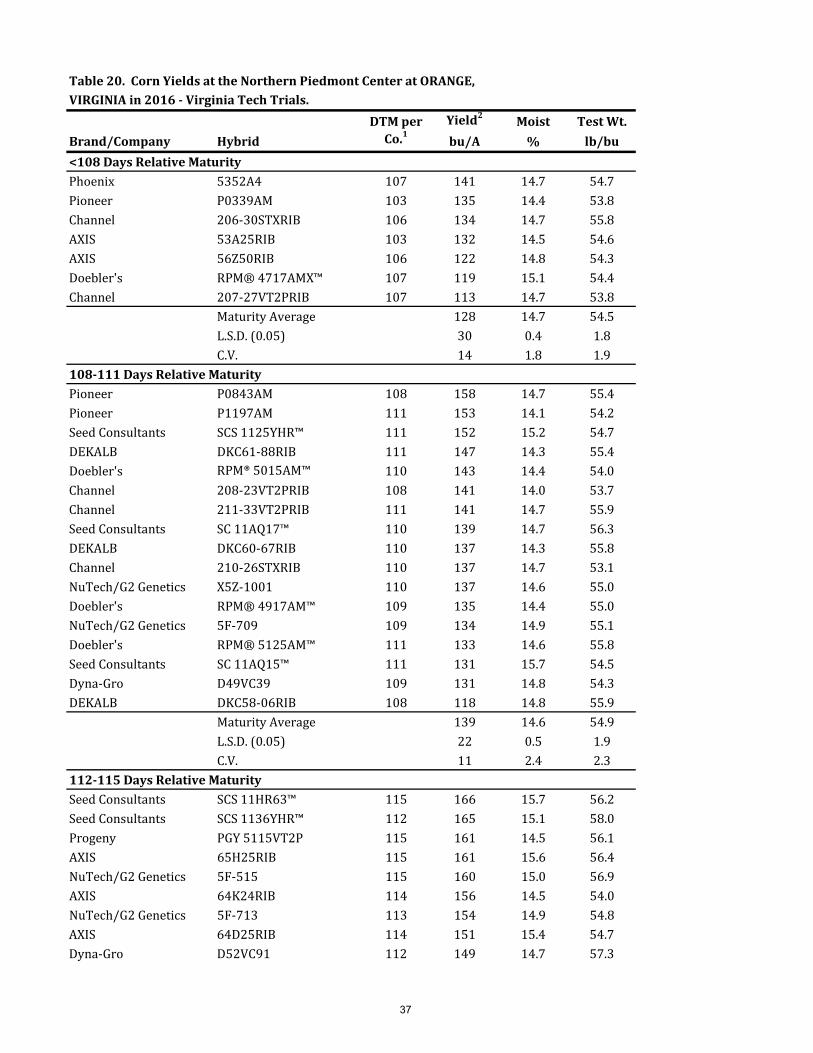
Table 20. Corn Yields at the Northern Piedmont Center at ORANGE, VIRGINIA in 2016 - Virginia Tech Trials.
DTM per Yield2 Moist Test Wt.Brand/Company Hybrid Co.1 bu/A % lb/bu<108 Days Relative MaturityPhoenix 5352A4 107 141 14.7 54.7Pioneer P0339AM 103 135 14.4 53.8Channel 206-30STXRIB 106 134 14.7 55.8AXIS 53A25RIB 103 132 14.5 54.6AXIS 56Z50RIB 106 122 14.8 54.3Doebler's RPM® 4717AMX™ 107 119 15.1 54.4Channel 207-27VT2PRIB 107 113 14.7 53.8
Maturity Average 128 14.7 54.5L.S.D. (0.05) 30 0.4 1.8C.V. 14 1.8 1.9
108-111 Days Relative MaturityPioneer P0843AM 108 158 14.7 55.4Pioneer P1197AM 111 153 14.1 54.2Seed Consultants SCS 1125YHR™ 111 152 15.2 54.7DEKALB DKC61-88RIB 111 147 14.3 55.4Doebler's RPM® 5015AM™ 110 143 14.4 54.0Channel 208-23VT2PRIB 108 141 14.0 53.7Channel 211-33VT2PRIB 111 141 14.7 55.9Seed Consultants SC 11AQ17™ 110 139 14.7 56.3DEKALB DKC60-67RIB 110 137 14.3 55.8Channel 210-26STXRIB 110 137 14.7 53.1NuTech/G2 Genetics X5Z-1001 110 137 14.6 55.0Doebler's RPM® 4917AM™ 109 135 14.4 55.0NuTech/G2 Genetics 5F-709 109 134 14.9 55.1Doebler's RPM® 5125AM™ 111 133 14.6 55.8Seed Consultants SC 11AQ15™ 111 131 15.7 54.5Dyna-Gro D49VC39 109 131 14.8 54.3DEKALB DKC58-06RIB 108 118 14.8 55.9
Maturity Average 139 14.6 54.9L.S.D. (0.05) 22 0.5 1.9C.V. 11 2.4 2.3
112-115 Days Relative MaturitySeed Consultants SCS 11HR63™ 115 166 15.7 56.2Seed Consultants SCS 1136YHR™ 112 165 15.1 58.0Progeny PGY 5115VT2P 115 161 14.5 56.1AXIS 65H25RIB 115 161 15.6 56.4NuTech/G2 Genetics 5F-515 115 160 15.0 56.9AXIS 64K24RIB 114 156 14.5 54.0NuTech/G2 Genetics 5F-713 113 154 14.9 54.8AXIS 64D25RIB 114 151 15.4 54.7Dyna-Gro D52VC91 112 149 14.7 57.3
37

Table 20. Corn Yields at the Northern Piedmont Center at ORANGE, VIRGINIA in 2016 - Virginia Tech Trials.
DTM per Yield2 Moist Test Wt.Brand/Company Hybrid Co.1 bu/A % lb/buDyna-Gro D54VC52 114 149 15.0 55.9DEKALB DKC65-19RIB 115 148 15.1 57.2DEKALB DKC64-87RIB 114 146 15.2 57.2Progeny PGY 4114VT2P 114 139 14.9 57.2Channel 215-05STXRIB 115 137 15.6 57.2AXIS 62M25RIB 112 134 14.3 53.0DEKALB DKC65-71RIB 115 121 14.9 54.3Progeny PGY EXP 1615VT2P 115 115 14.6 56.4
Maturity Average 148 15.0 56.1L.S.D. (0.05) 18 0.8 1.5C.V. 8 3.5 1.8
>115 Days Relative MaturityPioneer P1637AM 116 168 15.2 57.1Seed Consultants SCS 1187YHR™ 118 163 16.8 59.0AXIS 66A22RIB 116 158 15.3 55.8Channel 217-92VT2PRIB 117 153 14.8 56.8DEKALB DKC66-59RIB 116 153 15.7 56.0Channel 216-36STXRIB 116 153 15.0 56.2DEKALB DKC67-72RIB 117 152 15.3 55.4Doebler's 5815GRQ™ 118 149 16.3 55.7Phoenix 6542A4 116 148 14.8 54.4Phoenix 7402A3 118 147 15.9 56.7Progeny PGY 6119VT2P 119 145 15.3 57.0Seed Consultants SC 11AGT74™ 116 144 17.1 58.0DEKALB DKC66-40RIB 116 144 16.4 57.0Channel 217-41STXRIB 117 143 15.5 55.2Progeny PGY 6116VT2P 116 140 15.2 54.1Doebler's 5615GRQ™ 116 138 15.6 55.7Progeny PGY 4117VT3P 117 130 15.1 55.8
Maturity Average 149 15.6 56.2L.S.D. (0.05) 17 0.8 1.7C.V. 8 3.6 2.0Location Average 143 15.0 55.6
1 Days to maturity provided by company; differences in maturity rating methods may exist between companies.2 Reported at 15.5% moisture.Planted April 27, 2016. Harvested September 22, 2016. Population was 22,950 plants/acre.
38
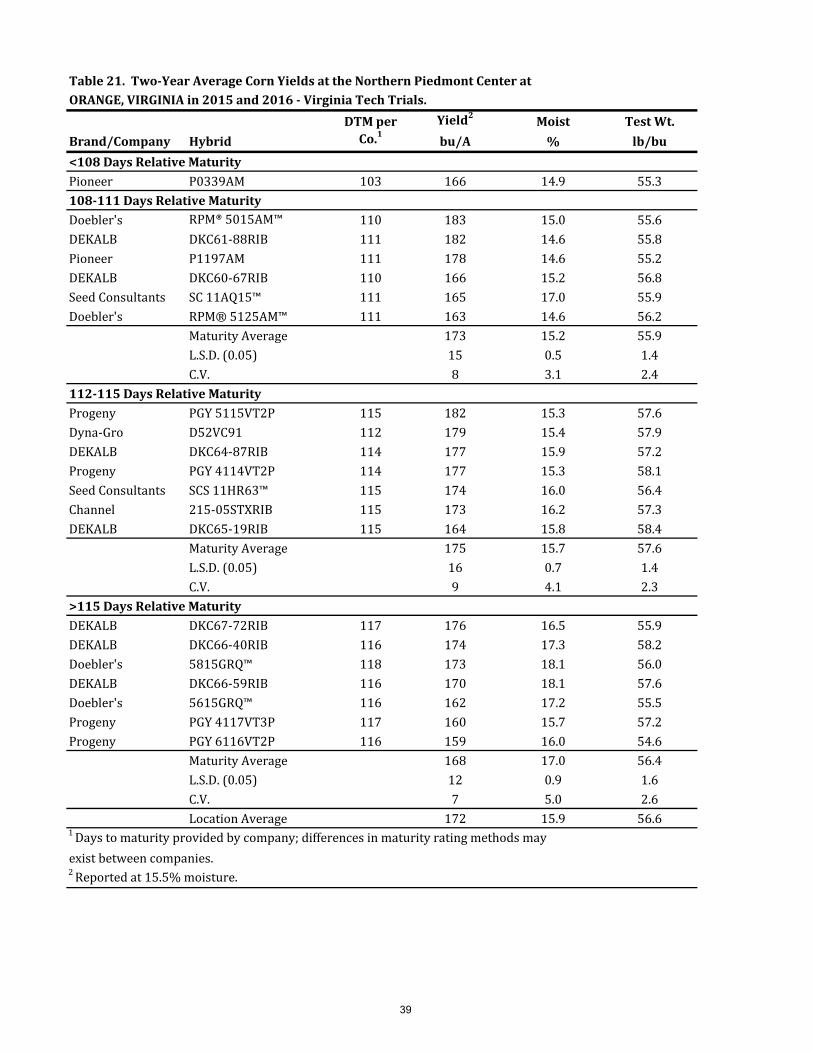
Table 21. Two-Year Average Corn Yields at the Northern Piedmont Center at ORANGE, VIRGINIA in 2015 and 2016 - Virginia Tech Trials.
DTM per Yield2 Moist Test Wt.Brand/Company Hybrid Co.1 bu/A % lb/bu<108 Days Relative MaturityPioneer P0339AM 103 166 14.9 55.3108-111 Days Relative MaturityDoebler's RPM® 5015AM™ 110 183 15.0 55.6DEKALB DKC61-88RIB 111 182 14.6 55.8Pioneer P1197AM 111 178 14.6 55.2DEKALB DKC60-67RIB 110 166 15.2 56.8Seed Consultants SC 11AQ15™ 111 165 17.0 55.9Doebler's RPM® 5125AM™ 111 163 14.6 56.2
Maturity Average 173 15.2 55.9L.S.D. (0.05) 15 0.5 1.4C.V. 8 3.1 2.4
112-115 Days Relative MaturityProgeny PGY 5115VT2P 115 182 15.3 57.6Dyna-Gro D52VC91 112 179 15.4 57.9DEKALB DKC64-87RIB 114 177 15.9 57.2Progeny PGY 4114VT2P 114 177 15.3 58.1Seed Consultants SCS 11HR63™ 115 174 16.0 56.4Channel 215-05STXRIB 115 173 16.2 57.3DEKALB DKC65-19RIB 115 164 15.8 58.4
Maturity Average 175 15.7 57.6L.S.D. (0.05) 16 0.7 1.4C.V. 9 4.1 2.3
>115 Days Relative MaturityDEKALB DKC67-72RIB 117 176 16.5 55.9DEKALB DKC66-40RIB 116 174 17.3 58.2Doebler's 5815GRQ™ 118 173 18.1 56.0DEKALB DKC66-59RIB 116 170 18.1 57.6Doebler's 5615GRQ™ 116 162 17.2 55.5Progeny PGY 4117VT3P 117 160 15.7 57.2Progeny PGY 6116VT2P 116 159 16.0 54.6
Maturity Average 168 17.0 56.4L.S.D. (0.05) 12 0.9 1.6C.V. 7 5.0 2.6Location Average 172 15.9 56.6
1 Days to maturity provided by company; differences in maturity rating methods may exist between companies.2 Reported at 15.5% moisture.
39

Table 22. Three-Year Average Corn Yields at the Northern Piedmont Center at ORANGE, VIRGINIA, 2014-2016 - Virginia Tech Trials.
DTM per Yield2 Moist Test Wt.Brand/Company Hybrid Co.1 bu/A % lb/bu108-111 Days Relative MaturityDoebler's RPM® 5015AM™ 110 169 15.8 55.7DEKALB DKC60-67RIB 110 151 16.0 56.8
Maturity Average 160 15.9 56.2L.S.D. (0.05) 14 1.0 1.2C.V. 9 6.1 2.2
112-115 Days Relative MaturitySeed Consultants SCS 11HR63™ 115 165 17.1 55.9DEKALB DKC65-19RIB 115 156 17.2 58.1
Maturity Average 160 17.1 57.0L.S.D. (0.05) 12 0.7 1.3C.V. 8 4.3 2.4
>115 Days Relative MaturityDEKALB DKC66-40RIB 116 163 17.9 57.0Doebler's 5815GRQ™ 118 160 19.1 55.3Seed Consultants SC 11AGT74™ 116 157 19.0 56.3Doebler's 5615GRQ™ 116 148 18.5 54.9
Maturity Average 157 18.6 55.9L.S.D. (0.05) 11 1.0 1.1C.V. 8 6.0 2.2Location Average 159 17.6 56.2
1 Days to maturity provided by company; differences in maturity rating methods may exist between companies.2 Reported at 15.5% moisture.
40