virginia crime and arrest trends 2006 - 2015 · although the number of property crimes decreased...
TRANSCRIPT
www.dcjs.virginia.gov/research
Virginia Crime and Arrest Trends 2006 - 2015
Department of Criminal Justice Services Criminal Justice Research Center November 2016
This project was supported by Grant No. 2016-BJ-CX-K005 awarded by the Bureau of Justice Statistics, Office of Justice Programs, US. Department of Justice. Points of view in this document are those of the author and do not necessarily represent the official position or policies of the U.S. Department of Justice.

Virginia Crime and Arrest Trends, 2006-2015
1
this page is blank
Virginia Crime and Arrest Trends, 2006-2015
2
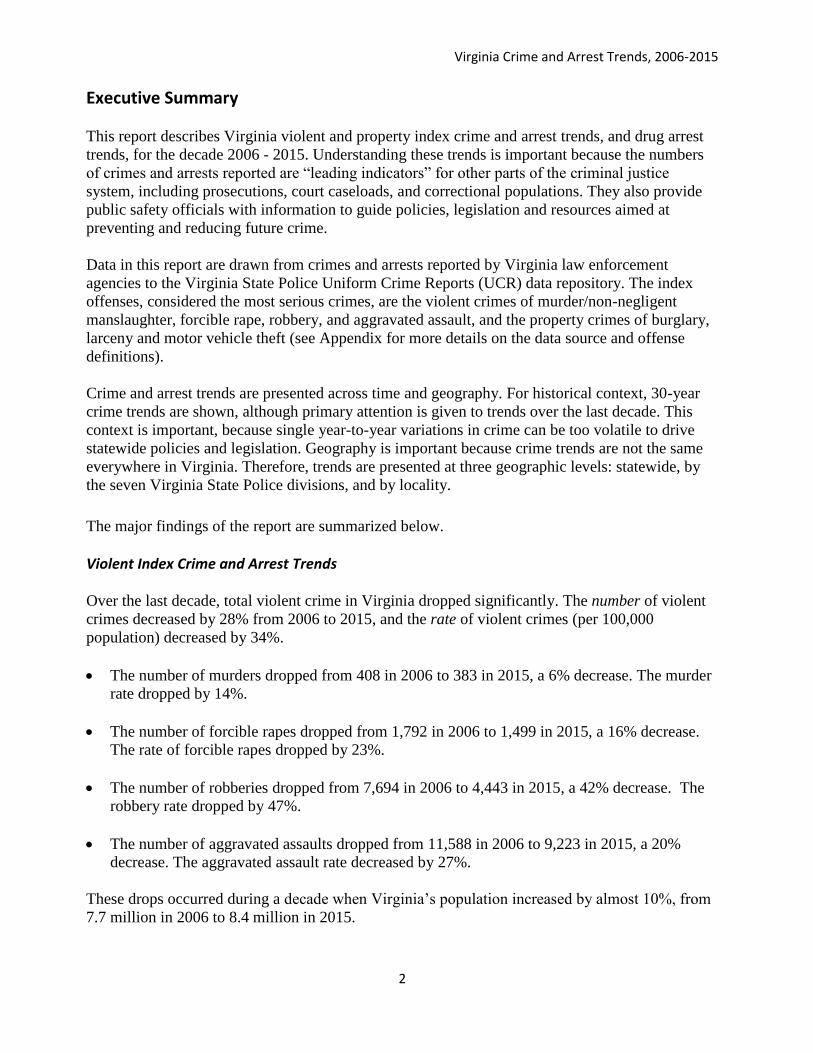
Executive Summary
This report describes Virginia violent and property index crime and arrest trends, and drug arrest
trends, for the decade 2006 - 2015. Understanding these trends is important because the numbers
of crimes and arrests reported are “leading indicators” for other parts of the criminal justice
system, including prosecutions, court caseloads, and correctional populations. They also provide
public safety officials with information to guide policies, legislation and resources aimed at
preventing and reducing future crime.
Data in this report are drawn from crimes and arrests reported by Virginia law enforcement
agencies to the Virginia State Police Uniform Crime Reports (UCR) data repository. The index
offenses, considered the most serious crimes, are the violent crimes of murder/non-negligent
manslaughter, forcible rape, robbery, and aggravated assault, and the property crimes of burglary,
larceny and motor vehicle theft (see Appendix for more details on the data source and offense
definitions).
Crime and arrest trends are presented across time and geography. For historical context, 30-year
crime trends are shown, although primary attention is given to trends over the last decade. This
context is important, because single year-to-year variations in crime can be too volatile to drive
statewide policies and legislation. Geography is important because crime trends are not the same
everywhere in Virginia. Therefore, trends are presented at three geographic levels: statewide, by
the seven Virginia State Police divisions, and by locality.
The major findings of the report are summarized below.
Violent Index Crime and Arrest Trends
Over the last decade, total violent crime in Virginia dropped significantly. The number of violent
crimes decreased by 28% from 2006 to 2015, and the rate of violent crimes (per 100,000
population) decreased by 34%.
The number of murders dropped from 408 in 2006 to 383 in 2015, a 6% decrease. The murder
rate dropped by 14%.
The number of forcible rapes dropped from 1,792 in 2006 to 1,499 in 2015, a 16% decrease.
The rate of forcible rapes dropped by 23%.
The number of robberies dropped from 7,694 in 2006 to 4,443 in 2015, a 42% decrease. The
robbery rate dropped by 47%.
The number of aggravated assaults dropped from 11,588 in 2006 to 9,223 in 2015, a 20%
decrease. The aggravated assault rate decreased by 27%.
These drops occurred during a decade when Virginia’s population increased by almost 10%, from
7.7 million in 2006 to 8.4 million in 2015.

Virginia Crime and Arrest Trends, 2006-2015
3
Although the number of violent crimes decreased significantly from 2006 to 2015, the drop in
violence has slowed in recent years. From 2014 to 2015, the violent crime rate decreased by less
than 1%. This slight decrease was driven by a drop in aggravated assaults; rates for the other three
types of violent crime increased in 2015.
The number of murders increased from 337 in 2014 to 383 in 2015, a 13% increase. The
murder rate increased by 14%. Most (94%) of the increase in the number of murders was
attributable to an increase in murders in four Virginia localities: the cities of Portsmouth,
Roanoke, and Hampton, and Pittsylvania County.
The number of forcible rapes increased from 1,453 in 2014 to 1,499 in 2015, a 3% increase.
The forcible rape rate increased by 3%.
The number of robberies increased from 4,284 in 2014 to 4,443 in 2015, a 4% increase. The
robbery rate increased by 3%.
The number of aggravated assaults decreased slightly from 9,380 in 2014 to 9,223 in 2015, a
2% decrease. The aggravated assault rate decreased by 2%.
It is important to note that although some violent crime rates increased in the last several years, the
rates of violent crime in Virginia still remain at historic lows. It is too early to tell if these
increases represent an upward trend or merely year-to-year variations.
As overall violent crime rates decreased, so too did overall violent crime arrest rates. The arrest
rate dropped from 118.9 arrests per 100,000 arrest-age (age 10+) population in 2006 to 92.1 in
2015, a 23% decrease. Arrest rates declined for both adults (down 23%) and juveniles (down
47%).
Property Index Crime and Arrest Trends Like violent crimes, property crimes declined in Virginia over the past decade. The total number
of property crimes decreased by 17% from 2006 to 2015, and the rate of property crimes (per
100,000 population) decreased by 24%.
The number of burglaries dropped from 31,718 in 2006 to 20,871 in 2015, a 34% decrease.
The burglary rate decreased by 8%.
The number of larcenies dropped from 142,834 in 2006 to 127,454 in 2015, an 11% decrease.
The larceny rate decreased by 18%.
The number of motor vehicle thefts dropped from 13,637 in 2006 to 7,300 in 2015, a 46%
decrease. The motor vehicle theft rate decreased by 51%.
Although property crime decreased over the past decade, this decline, like the decline in violent
crime, has also slowed in recent years. From 2014 to 2015, the rate of property crimes decreased
by only 3%. However, Virginia’s property crime rate was still the lowest it has been in 30 years.
Virginia Crime and Arrest Trends, 2006-2015
4
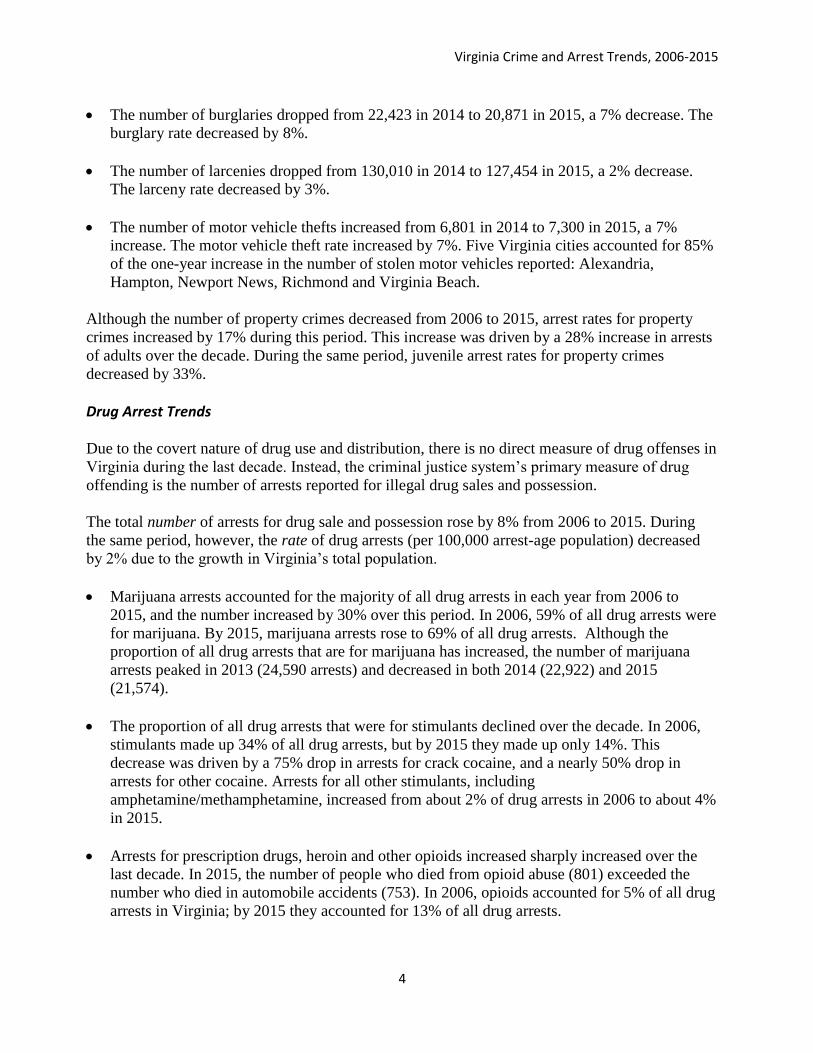
The number of burglaries dropped from 22,423 in 2014 to 20,871 in 2015, a 7% decrease. The
burglary rate decreased by 8%.
The number of larcenies dropped from 130,010 in 2014 to 127,454 in 2015, a 2% decrease.
The larceny rate decreased by 3%.
The number of motor vehicle thefts increased from 6,801 in 2014 to 7,300 in 2015, a 7%
increase. The motor vehicle theft rate increased by 7%. Five Virginia cities accounted for 85%
of the one-year increase in the number of stolen motor vehicles reported: Alexandria,
Hampton, Newport News, Richmond and Virginia Beach.
Although the number of property crimes decreased from 2006 to 2015, arrest rates for property
crimes increased by 17% during this period. This increase was driven by a 28% increase in arrests
of adults over the decade. During the same period, juvenile arrest rates for property crimes
decreased by 33%.
Drug Arrest Trends
Due to the covert nature of drug use and distribution, there is no direct measure of drug offenses in
Virginia during the last decade. Instead, the criminal justice system’s primary measure of drug
offending is the number of arrests reported for illegal drug sales and possession.
The total number of arrests for drug sale and possession rose by 8% from 2006 to 2015. During
the same period, however, the rate of drug arrests (per 100,000 arrest-age population) decreased
by 2% due to the growth in Virginia’s total population.
Marijuana arrests accounted for the majority of all drug arrests in each year from 2006 to
2015, and the number increased by 30% over this period. In 2006, 59% of all drug arrests were
for marijuana. By 2015, marijuana arrests rose to 69% of all drug arrests. Although the
proportion of all drug arrests that are for marijuana has increased, the number of marijuana
arrests peaked in 2013 (24,590 arrests) and decreased in both 2014 (22,922) and 2015
(21,574).
The proportion of all drug arrests that were for stimulants declined over the decade. In 2006,
stimulants made up 34% of all drug arrests, but by 2015 they made up only 14%. This
decrease was driven by a 75% drop in arrests for crack cocaine, and a nearly 50% drop in
arrests for other cocaine. Arrests for all other stimulants, including
amphetamine/methamphetamine, increased from about 2% of drug arrests in 2006 to about 4%
in 2015.
Arrests for prescription drugs, heroin and other opioids increased sharply increased over the
last decade. In 2015, the number of people who died from opioid abuse (801) exceeded the
number who died in automobile accidents (753). In 2006, opioids accounted for 5% of all drug
arrests in Virginia; by 2015 they accounted for 13% of all drug arrests.

Virginia Crime and Arrest Trends, 2006-2015
5
Arrests for barbiturates, hallucinogens and all other drugs increased throughout most of the
decade, but began trending down in 2013 and continued to do so through 2015.
Adults were consistently arrested for drug violations at a higher rate than juveniles. While the
adults drug arrest rate decreased by 2% over the decade, juvenile arrest rates declined by 26%.
Virginia Crime and Arrest Trends, 2006-2015
6
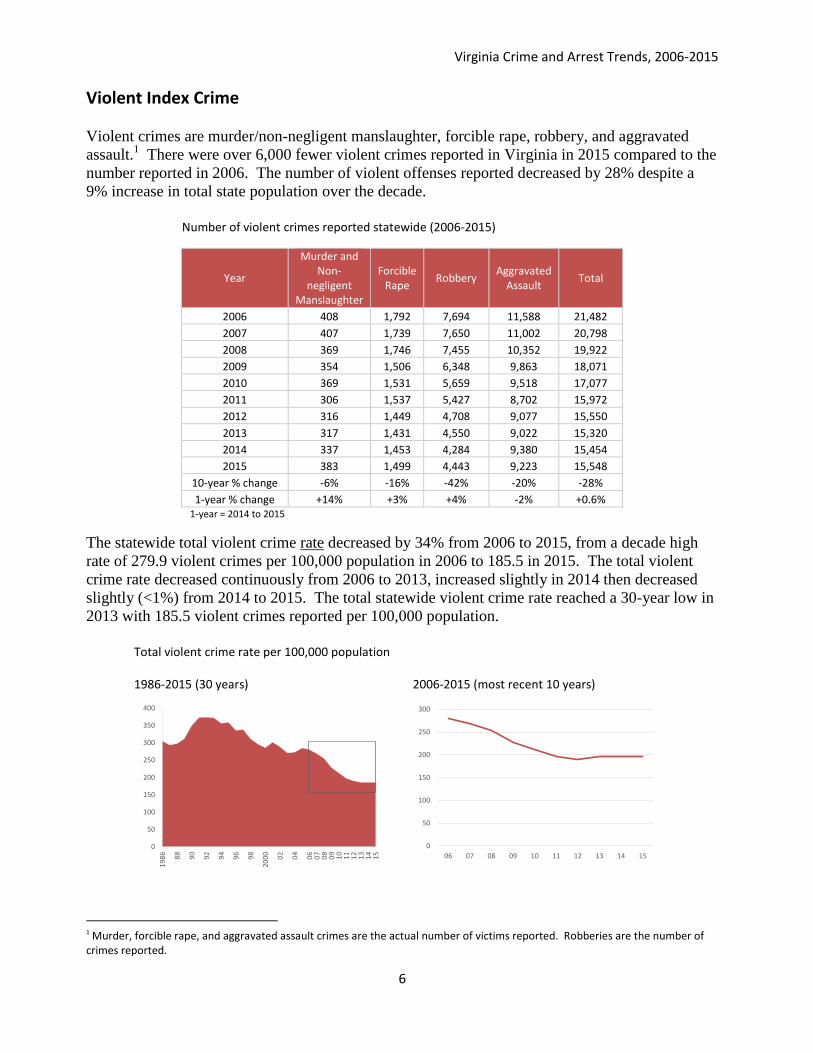
Violent Index Crime
Violent crimes are murder/non-negligent manslaughter, forcible rape, robbery, and aggravated
assault.1 There were over 6,000 fewer violent crimes reported in Virginia in 2015 compared to the
number reported in 2006. The number of violent offenses reported decreased by 28% despite a
9% increase in total state population over the decade.
Number of violent crimes reported statewide (2006-2015)
Year
Murder and Non-
negligent Manslaughter
Forcible Rape
Robbery Aggravated
Assault Total
2006 408 1,792 7,694 11,588 21,482
2007 407 1,739 7,650 11,002 20,798
2008 369 1,746 7,455 10,352 19,922
2009 354 1,506 6,348 9,863 18,071
2010 369 1,531 5,659 9,518 17,077
2011 306 1,537 5,427 8,702 15,972
2012 316 1,449 4,708 9,077 15,550
2013 317 1,431 4,550 9,022 15,320
2014 337 1,453 4,284 9,380 15,454
2015 383 1,499 4,443 9,223 15,548
10-year % change -6% -16% -42% -20% -28%
1-year % change +14% +3% +4% -2% +0.6% 1-year = 2014 to 2015
The statewide total violent crime rate decreased by 34% from 2006 to 2015, from a decade high
rate of 279.9 violent crimes per 100,000 population in 2006 to 185.5 in 2015. The total violent
crime rate decreased continuously from 2006 to 2013, increased slightly in 2014 then decreased
slightly (<1%) from 2014 to 2015. The total statewide violent crime rate reached a 30-year low in
2013 with 185.5 violent crimes reported per 100,000 population.
Total violent crime rate per 100,000 population 1986-2015 (30 years) 2006-2015 (most recent 10 years)
1 Murder, forcible rape, and aggravated assault crimes are the actual number of victims reported. Robberies are the number of crimes reported.
0
50
100
150
200
250
300
350
400
19
86
88
90
92
94
96
98
20
00
02
04
06
07
08
09
10
11
12
13
14
15
0
50
100
150
200
250
300
06 07 08 09 10 11 12 13 14 15

Virginia Crime and Arrest Trends, 2006-2015
7
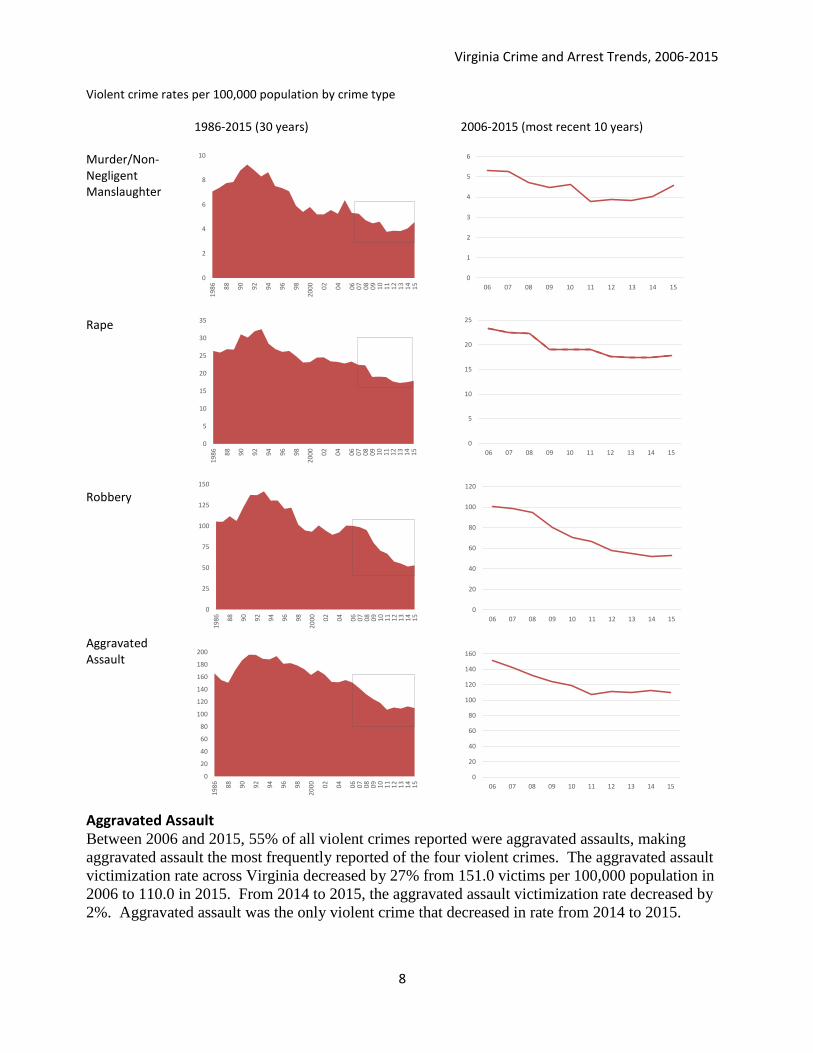
Murder/Non-Negligent Manslaughter Murder is the most serious violent crime, and each murder incident is a tragedy. It is also the
violent crime that occurs most infrequently. Only 2% of the more than 177,000 violent crimes
reported in Virginia between 2006 and 2015 were murder/non-negligent manslaughter.
From 2006 to 2015, the statewide murder rate decreased by 14%, from 5.3 victims per 100,000
population in 2006 to 4.6 in 2015. The year-to-year murder rate trend was mixed over the decade.
The murder rate declined continuously from 2006 to 2009, increased and decreased between 2010
and 2013, increased in 2014, and increased again in 2015.
The largest one-year increase in the murder rate during the decade occurred from 2014 to 2015,
when the murder rate rose by 14%. Four of the 133 Virginia localities accounted for 96% of the
total increase in the number of murders statewide from 2014 to 2015: Portsmouth, Roanoke City,
Pittsylvania County, and Hampton. The last time the statewide murder rate rose suddenly was
from 5.2 victims per 100,000 population in 2004 to 6.1 in 2005, a 17% one-year increase. Despite
the recent increases in murder victimization, the statewide murder rate remains at historic lows.
Forcible Rape Forcible rape is one of the most serious violent crimes and is underreported to law enforcement.
Nationally, 284,350 respondents to the 2014 National Crime Victimization Survey2 reported
experiencing a rape in the survey year while, for that same year, 84,041 rape victims were reported
by police in the UCR.3 This suggests that only 3 out of every 10 rapes are brought to the attention
of law enforcement. The Virginia Sexual and Domestic Violence Action Alliance reported that of
the more than 10,000 people receiving sexual violence advocacy services in Virginia in 2014, only
54% reported the sexual violence to police.4
From 2006 to 2015, the rate of violent sexual assault in Virginia decreased by 23%, from 23.4
victims per 100,000 population reported in 2006 to 17.9 reported in 2015. The victimization rate
decreased continuously from 2006 to 2009, increased slightly in 2010, decreased from 2011
through 2013 then increased in both 2014 and 2015. The rate increased by 3% from 2014 to 2015,
with 17.5 victims per 100,000 population reported in 2014.
Robbery Over the decade, the statewide robbery rate decreased by 47%, from 100.3 robberies per 100,000
population in 2006 to 53.0 in 2015. Robbery was the violent offense with the largest 10-year rate
decrease. The robbery rate increased from 2014 to 2015 by 3.0% from 51.5 robberies per 100,000
population in 2014 to 53.0 in 2015. The 2014 robbery rate was the lowest since 1986.
2 United States Department of Justice Office of Justice Programs, Bureau of Justice Statistics. Criminal Victimization, 2014.
Retrieved 6/6/2016 from http://www.bjs.gov/index.cfm?ty=pbdetail&iid=5366. 3 United States Department of Justice, Federal Bureau of Investigation. Crime in the United States, 2014. Retrieved 09/29/2015
from https://www.fbi.gov/about-us/crime-in-the-u.s.-2014/resource-pages/downloads/cius2014downloadablefiles.zip 4 Virginia Sexual and Domestic Violence Action Alliance. Sexual Violence Services in Virginia – VAdata report 01/01/2014-
12/31/2014. Retrieved 6/10/2016 from vadata.org/public-reports/2014_Statewide_SV_Report.pdf.
Virginia Crime and Arrest Trends, 2006-2015
8
Violent crime rates per 100,000 population by crime type
1986-2015 (30 years) 2006-2015 (most recent 10 years) Murder/Non-Negligent Manslaughter
Rape
Robbery
Aggravated Assault
Aggravated Assault Between 2006 and 2015, 55% of all violent crimes reported were aggravated assaults, making
aggravated assault the most frequently reported of the four violent crimes. The aggravated assault
victimization rate across Virginia decreased by 27% from 151.0 victims per 100,000 population in
2006 to 110.0 in 2015. From 2014 to 2015, the aggravated assault victimization rate decreased by
2%. Aggravated assault was the only violent crime that decreased in rate from 2014 to 2015.
0
2
4
6
8
10
19
86
88
90
92
94
96
98
20
00
02
04
06
07
08
09
10
11
12
13
14
15
0
1
2
3
4
5
6
06 07 08 09 10 11 12 13 14 15
0
5
10
15
20
25
30
35
19
86
88
90
92
94
96
98
20
00
02
04
06
07
08
09
10
11
12
13
14
15
0
5
10
15
20
25
06 07 08 09 10 11 12 13 14 15
0
20
40
60
80
100
120
06 07 08 09 10 11 12 13 14 15
0
25
50
75
100
125
150
19
86
88
90
92
94
96
98
20
00
02
04
06
07
08
09
10
11
12
13
14
15
0
20
40
60
80
100
120
140
160
180
200
19
86
88
90
92
94
96
98
20
00
02
04
06
07
08
09
10
11
12
13
14
15
0
20
40
60
80
100
120
140
160
06 07 08 09 10 11 12 13 14 15

Virginia Crime and Arrest Trends, 2006-2015
9
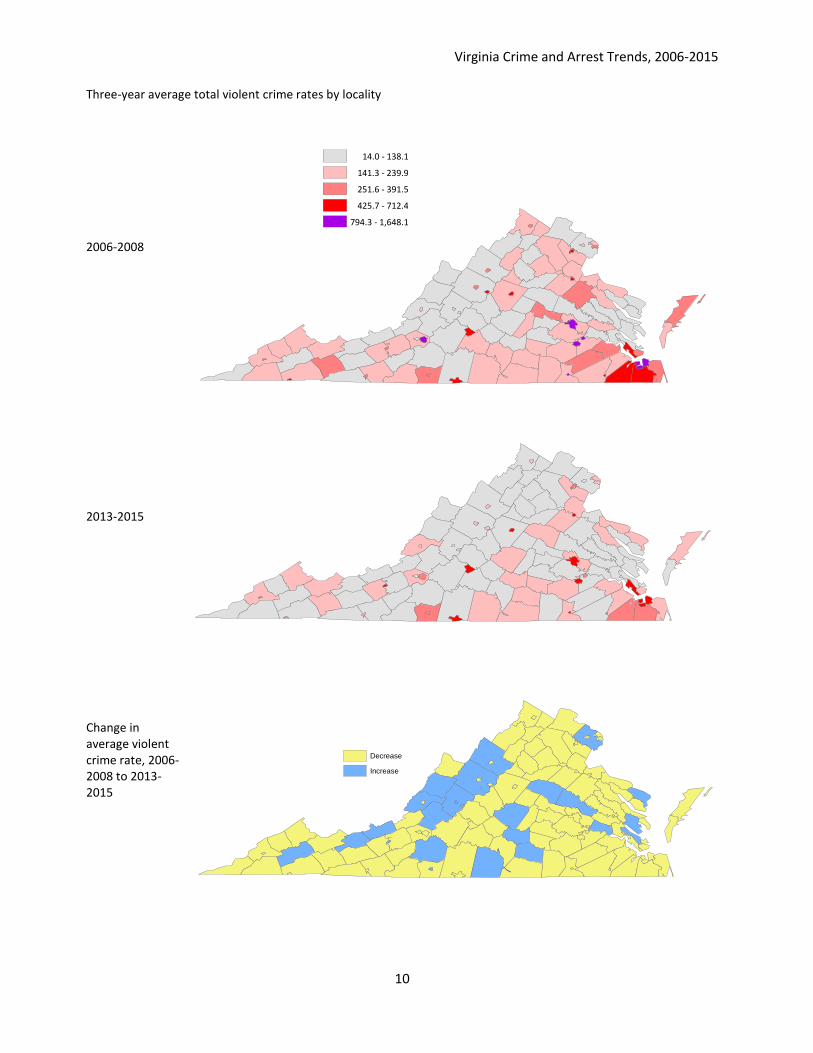
Locality Violent Index Crime Rates
The maps on the next page show three-year average total violent crime rates for each Virginia
locality for 2006-to-2008 and 2013-to-2015. Three year averages were used because in a single
year some smaller localities had no reported violent crime and averages smooth out this volatility
of rates in smaller localities.
2006-to-2008 locality average violent crime rates ranged from a low rate of 14.0 violent crimes
per 100,000 population to a high rate of 1,648.1. By comparison, 2013-to-2015 locality average
violent crime rates ranged from a low locality rate of 15.0 violent crimes per 100,000 population
to a locality high rate of 671.5.
The localities with the highest average rates were cities, and most of the high average rate
localities 2006-2008 were also the localities with the highest average rates 2013-2015. Nineteen
of the 20 localities with the highest 2006-2008 average violent crime rates had lower average rates
2013-2015.
The reduction in locality violent crime rates is shown in the maps on the following page where
many localities with deep shading (indicating higher rates) in the 2006-2008 map are shaded
noticeably lighter in the 2013-2015 map. Total violent crime rates decreased in 34 of Virginia’s
38 cities and in 74 of Virginia’s 95 counties.
Virginia Crime and Arrest Trends, 2006-2015
10
Three-year average total violent crime rates by locality
2006-2008
2013-2015
Change in average violent crime rate, 2006-2008 to 2013-2015
14.0 - 138.1
141.3 - 239.9
251.6 - 391.5
425.7 - 712.4
794.3 - 1,648.1
Decrease
Increase
Virginia Crime and Arrest Trends, 2006-2015
11
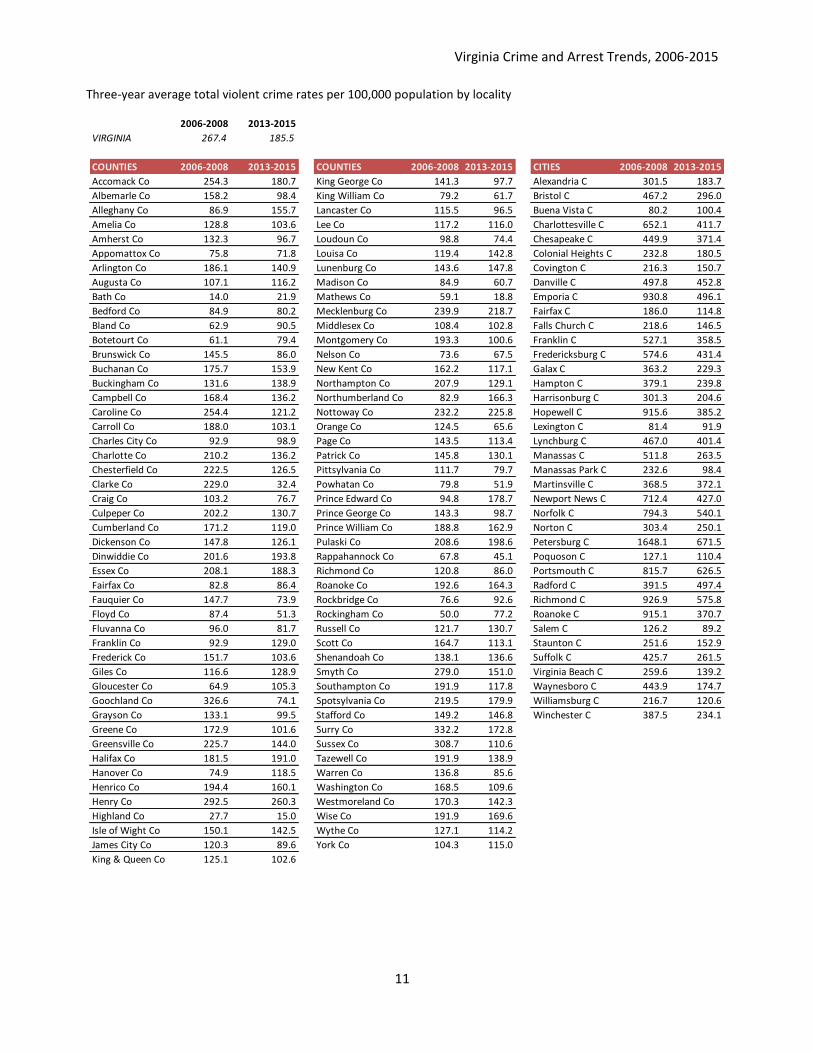
Three-year average total violent crime rates per 100,000 population by locality
2006-2008 2013-2015
VIRGINIA 267.4 185.5
COUNTIES 2006-2008 2013-2015 COUNTIES 2006-2008 2013-2015 CITIES 2006-2008 2013-2015
Accomack Co 254.3 180.7 King George Co 141.3 97.7 Alexandria C 301.5 183.7
Albemarle Co 158.2 98.4 King William Co 79.2 61.7 Bristol C 467.2 296.0
Alleghany Co 86.9 155.7 Lancaster Co 115.5 96.5 Buena Vista C 80.2 100.4
Amelia Co 128.8 103.6 Lee Co 117.2 116.0 Charlottesville C 652.1 411.7
Amherst Co 132.3 96.7 Loudoun Co 98.8 74.4 Chesapeake C 449.9 371.4
Appomattox Co 75.8 71.8 Louisa Co 119.4 142.8 Colonial Heights C 232.8 180.5
Arlington Co 186.1 140.9 Lunenburg Co 143.6 147.8 Covington C 216.3 150.7
Augusta Co 107.1 116.2 Madison Co 84.9 60.7 Danville C 497.8 452.8
Bath Co 14.0 21.9 Mathews Co 59.1 18.8 Emporia C 930.8 496.1
Bedford Co 84.9 80.2 Mecklenburg Co 239.9 218.7 Fairfax C 186.0 114.8
Bland Co 62.9 90.5 Middlesex Co 108.4 102.8 Falls Church C 218.6 146.5
Botetourt Co 61.1 79.4 Montgomery Co 193.3 100.6 Franklin C 527.1 358.5
Brunswick Co 145.5 86.0 Nelson Co 73.6 67.5 Fredericksburg C 574.6 431.4
Buchanan Co 175.7 153.9 New Kent Co 162.2 117.1 Galax C 363.2 229.3
Buckingham Co 131.6 138.9 Northampton Co 207.9 129.1 Hampton C 379.1 239.8
Campbell Co 168.4 136.2 Northumberland Co 82.9 166.3 Harrisonburg C 301.3 204.6
Caroline Co 254.4 121.2 Nottoway Co 232.2 225.8 Hopewell C 915.6 385.2
Carroll Co 188.0 103.1 Orange Co 124.5 65.6 Lexington C 81.4 91.9
Charles City Co 92.9 98.9 Page Co 143.5 113.4 Lynchburg C 467.0 401.4
Charlotte Co 210.2 136.2 Patrick Co 145.8 130.1 Manassas C 511.8 263.5
Chesterfield Co 222.5 126.5 Pittsylvania Co 111.7 79.7 Manassas Park C 232.6 98.4
Clarke Co 229.0 32.4 Powhatan Co 79.8 51.9 Martinsville C 368.5 372.1
Craig Co 103.2 76.7 Prince Edward Co 94.8 178.7 Newport News C 712.4 427.0
Culpeper Co 202.2 130.7 Prince George Co 143.3 98.7 Norfolk C 794.3 540.1
Cumberland Co 171.2 119.0 Prince William Co 188.8 162.9 Norton C 303.4 250.1
Dickenson Co 147.8 126.1 Pulaski Co 208.6 198.6 Petersburg C 1648.1 671.5
Dinwiddie Co 201.6 193.8 Rappahannock Co 67.8 45.1 Poquoson C 127.1 110.4
Essex Co 208.1 188.3 Richmond Co 120.8 86.0 Portsmouth C 815.7 626.5
Fairfax Co 82.8 86.4 Roanoke Co 192.6 164.3 Radford C 391.5 497.4
Fauquier Co 147.7 73.9 Rockbridge Co 76.6 92.6 Richmond C 926.9 575.8
Floyd Co 87.4 51.3 Rockingham Co 50.0 77.2 Roanoke C 915.1 370.7
Fluvanna Co 96.0 81.7 Russell Co 121.7 130.7 Salem C 126.2 89.2
Franklin Co 92.9 129.0 Scott Co 164.7 113.1 Staunton C 251.6 152.9
Frederick Co 151.7 103.6 Shenandoah Co 138.1 136.6 Suffolk C 425.7 261.5
Giles Co 116.6 128.9 Smyth Co 279.0 151.0 Virginia Beach C 259.6 139.2
Gloucester Co 64.9 105.3 Southampton Co 191.9 117.8 Waynesboro C 443.9 174.7
Goochland Co 326.6 74.1 Spotsylvania Co 219.5 179.9 Williamsburg C 216.7 120.6
Grayson Co 133.1 99.5 Stafford Co 149.2 146.8 Winchester C 387.5 234.1
Greene Co 172.9 101.6 Surry Co 332.2 172.8
Greensville Co 225.7 144.0 Sussex Co 308.7 110.6
Halifax Co 181.5 191.0 Tazewell Co 191.9 138.9
Hanover Co 74.9 118.5 Warren Co 136.8 85.6
Henrico Co 194.4 160.1 Washington Co 168.5 109.6
Henry Co 292.5 260.3 Westmoreland Co 170.3 142.3
Highland Co 27.7 15.0 Wise Co 191.9 169.6
Isle of Wight Co 150.1 142.5 Wythe Co 127.1 114.2
James City Co 120.3 89.6 York Co 104.3 115.0
King & Queen Co 125.1 102.6

Virginia Crime and Arrest Trends, 2006-2015
12
County and city ranking of three-year average violent crime rate
Counties are ranked against other counties (highest rate ranked 1, lowest rate ranked 95)
Cities are ranked against other cities (highest rate ranked 1, lowest rate ranked 38)
COUNTIES 2006-2008 2013-2015 COUNTIES 2006-2008 2013-2015 CITIES 2006-2008 2013-2015
Accomack Co 7 8 King George Co 49 65 Alexandria C 25 25
Albemarle Co 38 64 King William Co 83 87 Bristol C 14 17
Alleghany Co 77 17 Lancaster Co 65 67 Buena Vista C 38 35
Amelia Co 55 54 Lee Co 63 46 Charlottesville C 9 10
Amherst Co 53 66 Loudoun Co 71 81 Chesapeake C 16 14
Appomattox Co 85 84 Louisa Co 62 23 Colonial Heights C 29 26
Arlington Co 28 26 Lunenburg Co 46 20 Covington C 33 29
Augusta Co 68 45 Madison Co 78 88 Danville C 13 7
Bath Co 95 93 Mathews Co 92 94 Emporia C 2 6
Bedford Co 78 76 Mecklenburg Co 8 3 Fairfax C 34 33
Bland Co 90 69 Middlesex Co 67 57 Falls Church C 31 30
Botetourt Co 91 78 Montgomery Co 21 60 Franklin C 11 16
Brunswick Co 45 72 Nelson Co 87 85 Fredericksburg C 10 8
Buchanan Co 30 18 New Kent Co 37 44 Galax C 23 23
Buckingham Co 54 27 Northampton Co 17 35 Hampton C 21 21
Campbell Co 35 30 Northumberland Co 80 13 Harrisonburg C 26 24
Caroline Co 6 40 Nottoway Co 9 2 Hopewell C 4 12
Carroll Co 27 56 Orange Co 58 86 Lexington C 37 37
Charles City Co 74 62 Page Co 47 49 Lynchburg C 15 11
Charlotte Co 14 30 Patrick Co 44 34 Manassas C 12 18
Chesterfield Co 12 38 Pittsylvania Co 66 77 Manassas Park C 30 36
Clarke Co 10 92 Powhatan Co 82 89 Martinsville C 22 13
Craig Co 70 80 Prince Edward Co 73 10 Newport News C 8 9
Culpeper Co 18 32 Prince George Co 48 63 Norfolk C 7 4
Cumberland Co 32 41 Prince William Co 26 15 Norton C 24 20
Dickenson Co 42 39 Pulaski Co 15 4 Petersburg C 1 1
Dinwiddie Co 19 5 Rappahannock Co 88 91 Poquoson C 35 34
Essex Co 16 7 Richmond Co 60 72 Portsmouth C 6 2
Fairfax Co 81 71 Roanoke Co 22 14 Radford C 19 5
Fauquier Co 43 83 Rockbridge Co 84 68 Richmond C 3 3
Floyd Co 76 90 Rockingham Co 93 79 Roanoke C 5 15
Fluvanna Co 72 75 Russell Co 59 32 Salem C 36 38
Franklin Co 74 36 Scott Co 36 50 Staunton C 28 28
Frederick Co 39 54 Shenandoah Co 50 29 Suffolk C 18 19
Giles Co 64 37 Smyth Co 5 19 Virginia Beach C 27 31
Gloucester Co 89 53 Southampton Co 23 43 Waynesboro C 17 27
Goochland Co 2 82 Spotsylvania Co 13 9 Williamsburg C 32 32
Grayson Co 52 61 Stafford Co 41 21 Winchester C 20 22
Greene Co 31 59 Surry Co 1 11
Greensville Co 11 22 Sussex Co 3 51
Halifax Co 29 6 Tazewell Co 23 27
Hanover Co 86 42 Warren Co 51 74
Henrico Co 20 16 Washington Co 34 52
Henry Co 4 1 Westmoreland Co 33 25
Highland Co 94 95 Wise Co 23 12
Isle of Wight Co 40 24 Wythe Co 56 48
James City Co 61 70 York Co 69 47
King & Queen Co 57 58
Virginia Crime and Arrest Trends, 2006-2015
13
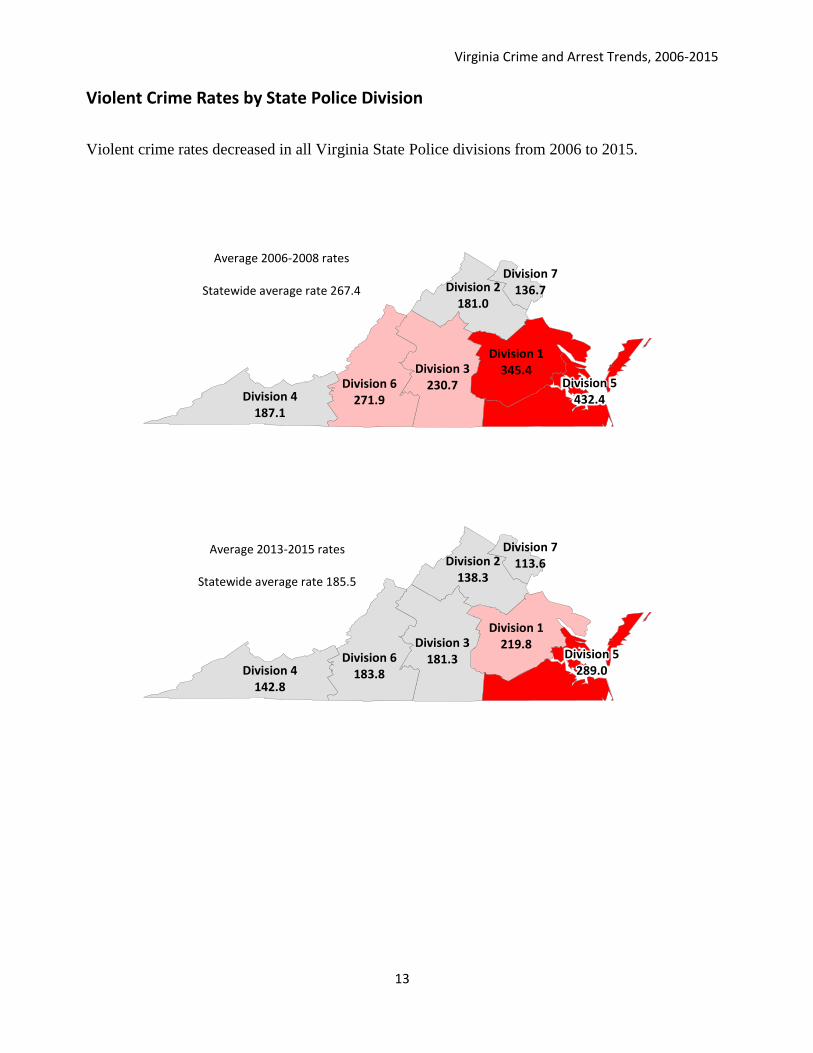
Violent Crime Rates by State Police Division
Violent crime rates decreased in all Virginia State Police divisions from 2006 to 2015.
Average 2006-2008 rates
Statewide average rate 267.4
Average 2013-2015 rates
Statewide average rate 185.5
Division 3230.7Division 6
271.9Division 4187.1
Division 1345.4
Division 2181.0
Division 5432.4
Division 7136.7
Division 3181.3Division 6
183.8Division 4142.8
Division 1219.8
Division 2138.3
Division 7113.6
Division 5289.0

Virginia Crime and Arrest Trends, 2006-2015
14
this page is blank
Virginia Crime and Arrest Trends, 2006-2015
15
Violent Arrests
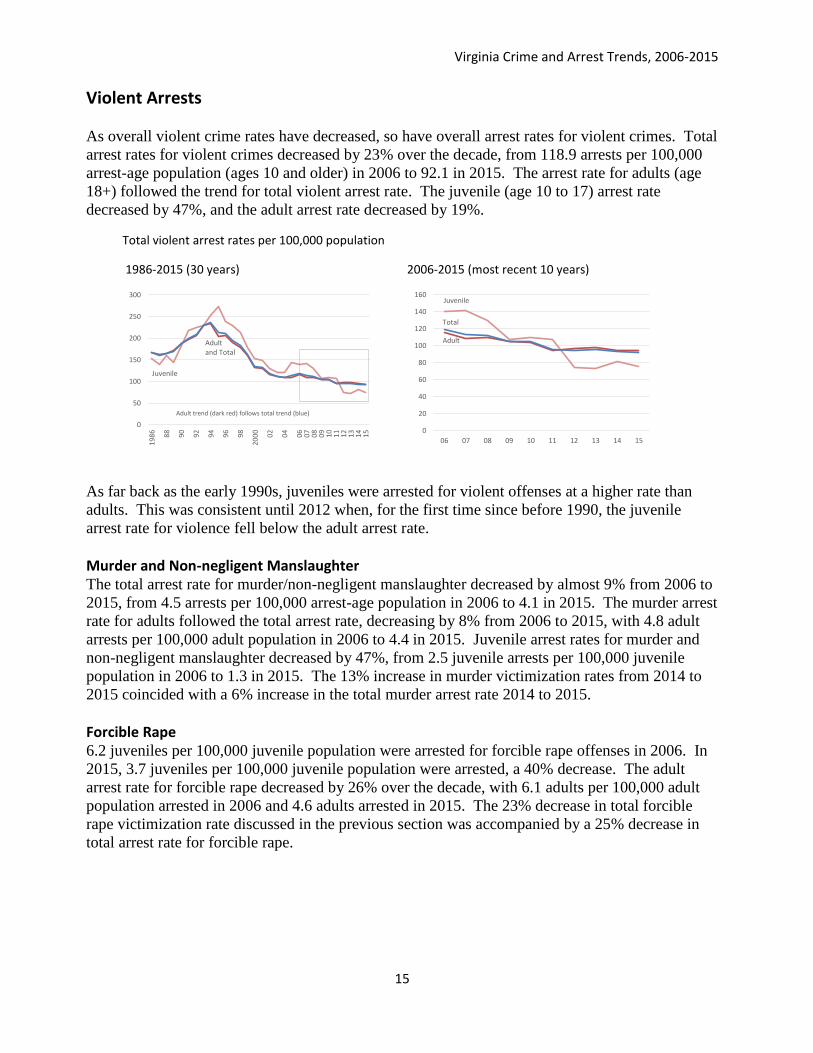
As overall violent crime rates have decreased, so have overall arrest rates for violent crimes. Total
arrest rates for violent crimes decreased by 23% over the decade, from 118.9 arrests per 100,000
arrest-age population (ages 10 and older) in 2006 to 92.1 in 2015. The arrest rate for adults (age
18+) followed the trend for total violent arrest rate. The juvenile (age 10 to 17) arrest rate
decreased by 47%, and the adult arrest rate decreased by 19%.
Total violent arrest rates per 100,000 population
1986-2015 (30 years) 2006-2015 (most recent 10 years)
As far back as the early 1990s, juveniles were arrested for violent offenses at a higher rate than
adults. This was consistent until 2012 when, for the first time since before 1990, the juvenile
arrest rate for violence fell below the adult arrest rate.
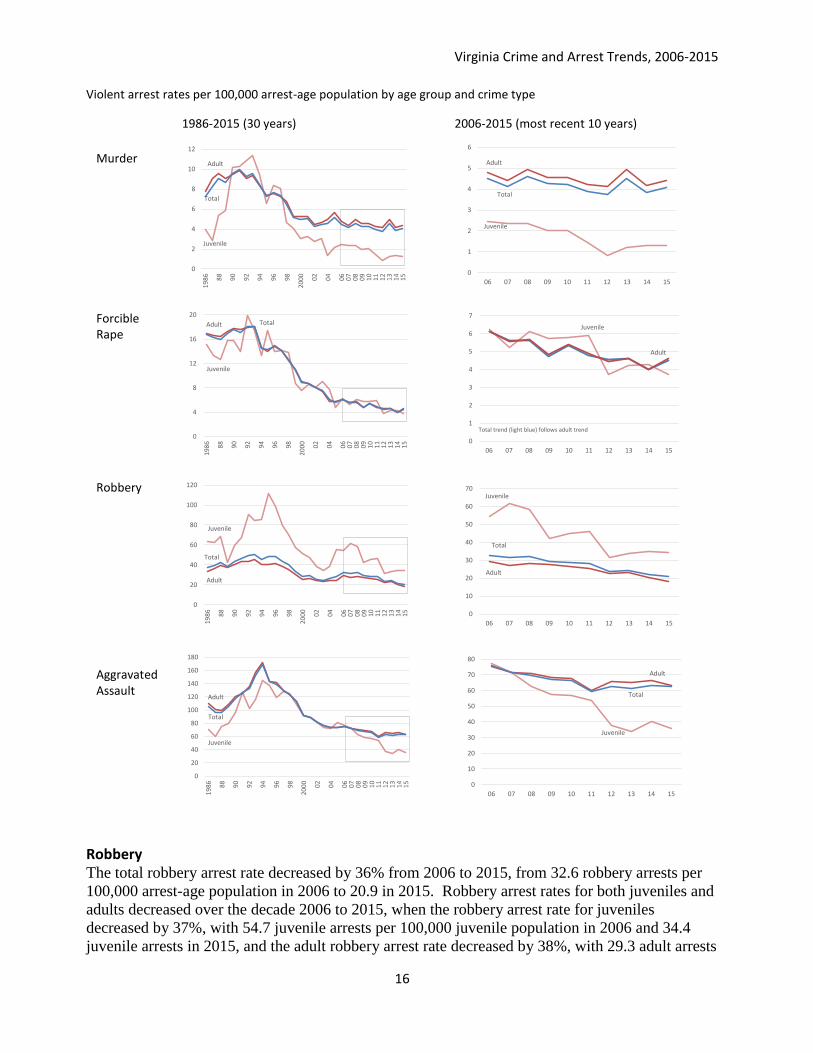
Murder and Non-negligent Manslaughter The total arrest rate for murder/non-negligent manslaughter decreased by almost 9% from 2006 to
2015, from 4.5 arrests per 100,000 arrest-age population in 2006 to 4.1 in 2015. The murder arrest
rate for adults followed the total arrest rate, decreasing by 8% from 2006 to 2015, with 4.8 adult
arrests per 100,000 adult population in 2006 to 4.4 in 2015. Juvenile arrest rates for murder and
non-negligent manslaughter decreased by 47%, from 2.5 juvenile arrests per 100,000 juvenile
population in 2006 to 1.3 in 2015. The 13% increase in murder victimization rates from 2014 to
2015 coincided with a 6% increase in the total murder arrest rate 2014 to 2015.
Forcible Rape 6.2 juveniles per 100,000 juvenile population were arrested for forcible rape offenses in 2006. In
2015, 3.7 juveniles per 100,000 juvenile population were arrested, a 40% decrease. The adult
arrest rate for forcible rape decreased by 26% over the decade, with 6.1 adults per 100,000 adult
population arrested in 2006 and 4.6 adults arrested in 2015. The 23% decrease in total forcible
rape victimization rate discussed in the previous section was accompanied by a 25% decrease in
total arrest rate for forcible rape.
0
50
100
150
200
250
300
19
86
88
90
92
94
96
98
20
00
02
04
06
07
08
09
10
11
12
13
14
15
Adult and Total
Juvenile
Adult trend (dark red) follows total trend (blue)
0
20
40
60
80
100
120
140
160
06 07 08 09 10 11 12 13 14 15
Adult
Juvenile
Total
Virginia Crime and Arrest Trends, 2006-2015
16
Violent arrest rates per 100,000 arrest-age population by age group and crime type
1986-2015 (30 years) 2006-2015 (most recent 10 years)
Robbery The total robbery arrest rate decreased by 36% from 2006 to 2015, from 32.6 robbery arrests per
100,000 arrest-age population in 2006 to 20.9 in 2015. Robbery arrest rates for both juveniles and
adults decreased over the decade 2006 to 2015, when the robbery arrest rate for juveniles decreased by 37%, with 54.7 juvenile arrests per 100,000 juvenile population in 2006 and 34.4
juvenile arrests in 2015, and the adult robbery arrest rate decreased by 38%, with 29.3 adult arrests
Murder
Forcible Rape
Robbery
Aggravated Assault
0
1
2
3
4
5
6
06 07 08 09 10 11 12 13 14 15
Adult
Juvenile
Total
0
2
4
6
8
10
12
19
86
88
90
92
94
96
98
20
00
02
04
06
07
08
09
10
11
12
13
14
15
Adult
Juvenile
Total
0
4
8
12
16
20
19
86
88
90
92
94
96
98
20
00
02
04
06
07
08
09
10
11
12
13
14
15
Adult
Juvenile
Total
0
20
40
60
80
100
120
19
86
88
90
92
94
96
98
20
00
02
04
06
07
08
09
10
11
12
13
14
15
Adult
Juvenile
Total
0
20
40
60
80
100
120
140
160
180
19
86
88
90
92
94
96
98
20
00
02
04
06
07
08
09
10
11
12
13
14
15
Adult
Juvenile
Total
0
1
2
3
4
5
6
7
06 07 08 09 10 11 12 13 14 15
Juvenile
Adult
Total trend (light blue) follows adult trend
0
10
20
30
40
50
60
70
06 07 08 09 10 11 12 13 14 15
Adult
Juvenile
Total
0
10
20
30
40
50
60
70
80
06 07 08 09 10 11 12 13 14 15
Adult
Juvenile
Total
Virginia Crime and Arrest Trends, 2006-2015
17
per 100,000 adult population in 2006, and 18.3 adult arrests in 2015. Robbery was the only violent
offense where juveniles were arrested at a consistently higher rate than adults. Aggravated Assault 75.7 aggravated assault arrests per 100,000 total arrest-age population were reported in 2006. In
2015, the total arrest rate had decreased by 17% to 62.6. 77.1 juveniles per 100,000 juvenile
population were arrested for aggravated assault in 2006. In 2015, 35.8 was the juvenile arrest rate
for aggravated assault, a 54% decrease. The aggravated assault arrest rate for adults decreased by
16% over the decade, with 75.5 adults per 100,000 adult population arrested for aggravated assault
in 2006, and 63.1 adult arrests reported in 2015. The adult arrest rate followed the total arrest rate.

Virginia Crime and Arrest Trends, 2006-2015
18
Property Index Crime Property crimes are burglary, larceny, and motor vehicle theft. The total number of property
crimes reported decreased by 17% from 2006 to 2015.
Number of property crimes reported statewide (2006-2015)
Year Burglary Larceny Motor Vehicle Theft
Total
2006 31,718 142,834 13,637 188,189
2007 31,153 145,195 12,785 189,133
2008 31,451 150,760 12,028 194,239
2009 31,079 149,253 10,302 190,634
2010 30,040 145,576 9,504 185,120
2011 30,157 142,244 8,707 181,108
2012 28,564 138,832 8,072 175,468
2013 26,123 134,691 7,660 168,474
2014 22,423 130,010 6,801 159,243
2015 20,871 127,454 7,300 155,625
10-year % change -34% -11% -47% -17%
1-year % change -7% -2% +7% -2% 1-year = 2014 to 2015
The total property crime rate decreased by 24% over the decade, with 2,452.4 property crimes per
100,000 total population reported in 2006, and 1,856.4 property crimes reported in 2015. Total property crime rates per 100,000 population
1986-2015 (30 years) 2006-2015 (most recent 10 years)
The year-to-year trend was mixed, with rates up and down early in the decade, then decreasing
continuously from 2008 on. The decade high rate occurred in 2008, with 2,479.6 property crimes
reported per 100,000 population. The decade low rate occurred in 2015, when 1,856.4 property
crimes were reported per 100,000 population. The 2015 rate was the lowest in the 30-year period.
0
500
1,000
1,500
2,000
2,500
3,000
06 07 08 09 10 11 12 13 14 15
0
500
1,000
1,500
2,000
2,500
3,000
3,500
4,000
4,500
19
86
88
90
92
94
96
98
20
00
02
04
06
07
08
09
10
11
12
13
14
15
Virginia Crime and Arrest Trends, 2006-2015
19
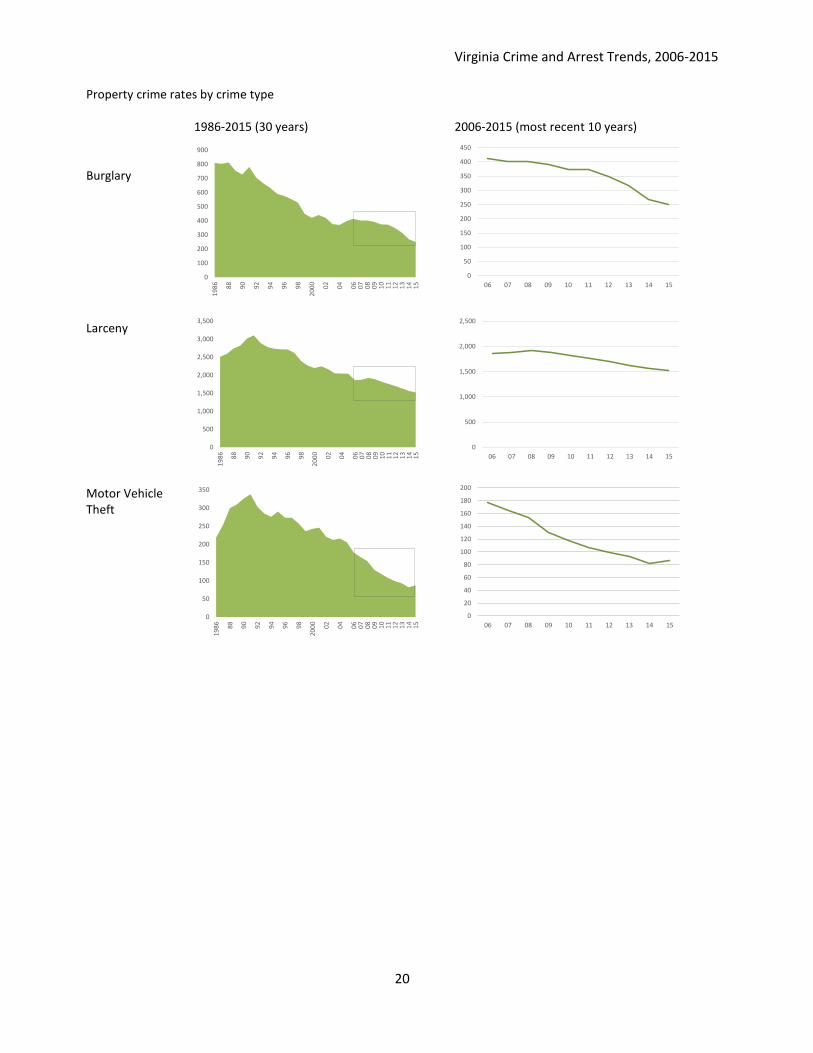
Burglary The burglary rate statewide decreased by 40%, from a 2006 rate of 413.3 burglaries per 100,000
population to 249.0 burglaries per 100,000 population in 2015. Burglaries rates decreased each
year over the decade. From 2014 to 2015 the rate decreased by 8%, with 269.4 burglaries per
100,000 population reported in 2014.
Larceny Larcenies occurred at rates almost five times higher than burglaries and almost ten times higher
than motor vehicle thefts. The larceny rate across Virginia decreased by 18% from 2006 to 2015,
from 1,861.3 to 1,520.4 larcenies per 100,000 population. The rate increased from 2006 to 2008,
then declined continuously from 2008 on. The rate decreased by 3% from 2014 to 2015.
Larcenies had the smallest percentage rate decrease of all property crimes.
Motor Vehicle Theft The motor vehicle theft rate decreased by 51% from 2006 to 2015. In 2006, 177.7 motor vehicle
thefts per 100,000 population were reported in the UCR. In 2015, 87.1 motor vehicle thefts per
100,000 population were reported. Motor vehicle thefts had the largest 10-year percentage rate
decrease of all property crimes. Automobile anti-theft technology has been credited for the steep
decline in motor vehicle thefts nationally.
The motor vehicle theft rate statewide decreased continuously from 2006 to 2014, when there
were 81.7 motor vehicle thefts per 100,000 population, then increased by almost 7% from 2014 to
2015. This was the biggest one-year increase in the motor vehicle theft rate since the early 1990s.
Five Virginia localities accounted for 85% of the 2014-to-2015 increase in the number of stolen
motor vehicles reported: Richmond City, Hampton, Virginia Beach, Newport News, and
Alexandria.
The National Insurance Crime Bureau suggests that car thieves have devised new methods of
theft, including stealing the “smart keys” needed to gain access to vehicles, using identity theft to
fraudulently purchase new vehicles, or simply stealing older vehicles without the sophisticated
anti-theft technology in newer vehicles.5 Despite the 2014-to-2015 increase in the number of
motor vehicle thefts in Virginia, statewide motor vehicle theft rates continue to be at historic lows.
5 National Insurance Crime Bureau. Historical Look at Vehicle Theft in the U.S. Retrieved 6/2/2016 from
https://www.nicb.org/newsroom/news-releases/historical-look-at-vehicle-theft-in-the-u-s-
Virginia Crime and Arrest Trends, 2006-2015
20
Property crime rates by crime type
1986-2015 (30 years) 2006-2015 (most recent 10 years) Burglary
Larceny
Motor Vehicle Theft
0
100
200
300
400
500
600
700
800
900
19
86
88
90
92
94
96
98
20
00
02
04
06
07
08
09
10
11
12
13
14
15
0
500
1,000
1,500
2,000
2,500
3,000
3,500
19
86
88
90
92
94
96
98
20
00
02
04
06
07
08
09
10
11
12
13
14
15
0
50
100
150
200
250
300
350
19
86
88
90
92
94
96
98
20
00
02
04
06
07
08
09
10
11
12
13
14
15
0
50
100
150
200
250
300
350
400
450
06 07 08 09 10 11 12 13 14 15
0
500
1,000
1,500
2,000
2,500
06 07 08 09 10 11 12 13 14 15
0
20
40
60
80
100
120
140
160
180
200
06 07 08 09 10 11 12 13 14 15
Virginia Crime and Arrest Trends, 2006-2015
21
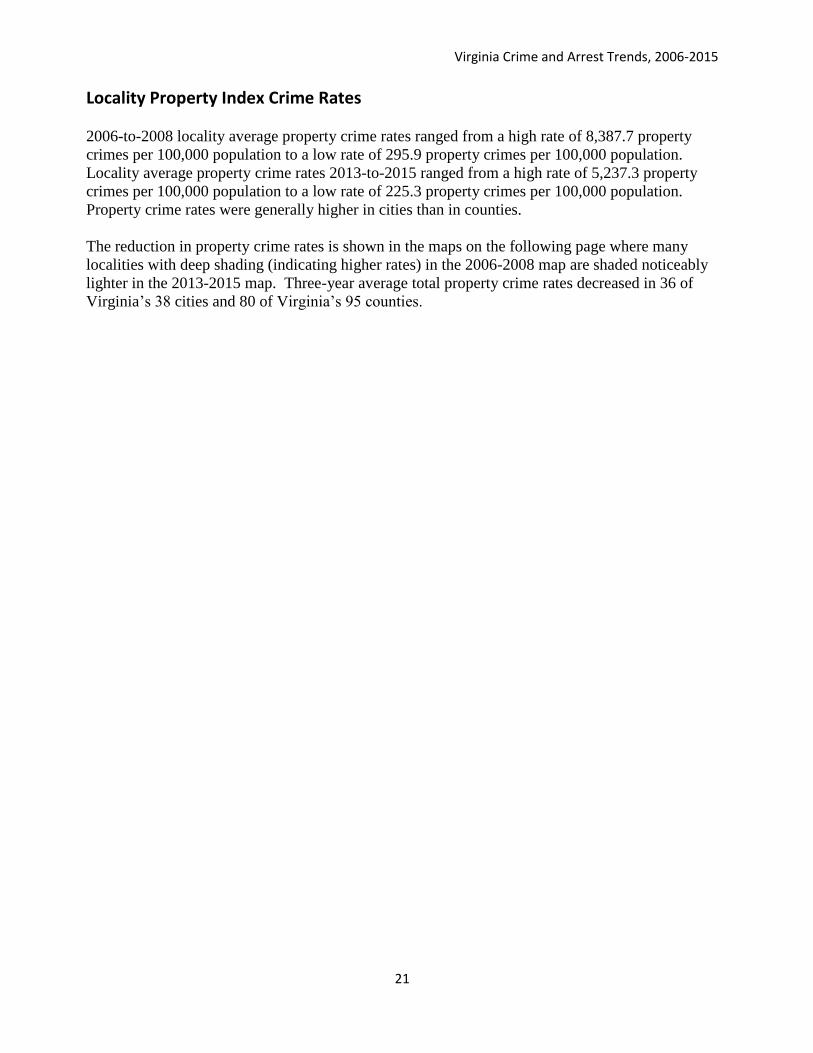
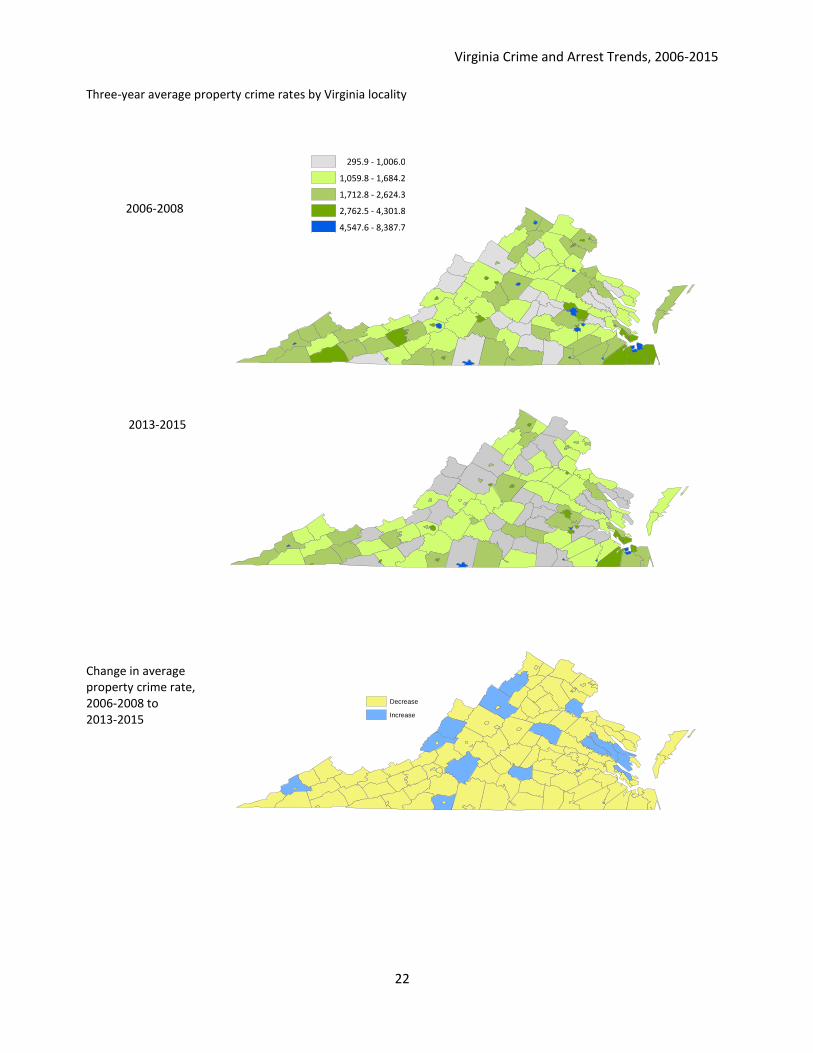
Locality Property Index Crime Rates
2006-to-2008 locality average property crime rates ranged from a high rate of 8,387.7 property
crimes per 100,000 population to a low rate of 295.9 property crimes per 100,000 population.
Locality average property crime rates 2013-to-2015 ranged from a high rate of 5,237.3 property
crimes per 100,000 population to a low rate of 225.3 property crimes per 100,000 population.
Property crime rates were generally higher in cities than in counties.
The reduction in property crime rates is shown in the maps on the following page where many
localities with deep shading (indicating higher rates) in the 2006-2008 map are shaded noticeably
lighter in the 2013-2015 map. Three-year average total property crime rates decreased in 36 of
Virginia’s 38 cities and 80 of Virginia’s 95 counties.
Virginia Crime and Arrest Trends, 2006-2015
22
Three-year average property crime rates by Virginia locality
Change in average property crime rate, 2006-2008 to 2013-2015
2013-2015
2006-2008
295.9 - 1,006.0
1,059.8 - 1,684.2
1,712.8 - 2,624.3
2,762.5 - 4,301.8
4,547.6 - 8,387.7
Decrease
Increase
Virginia Crime and Arrest Trends, 2006-2015
23
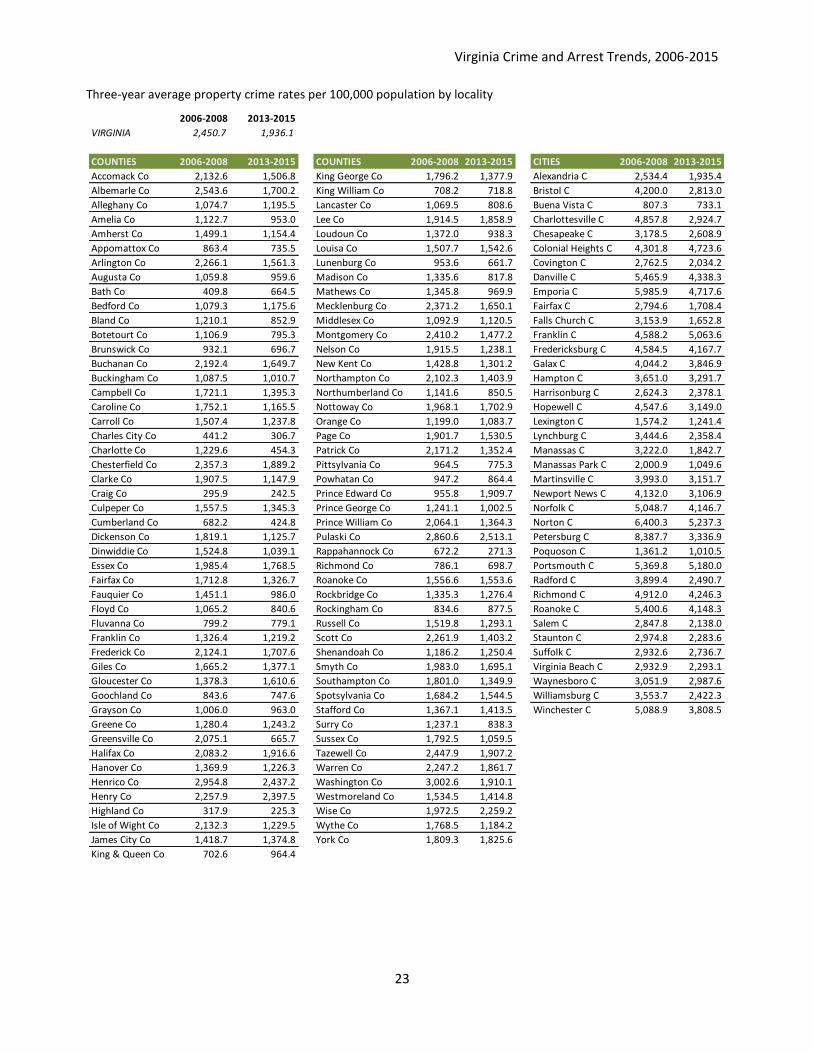
Three-year average property crime rates per 100,000 population by locality
2006-2008 2013-2015
VIRGINIA 2,450.7 1,936.1
COUNTIES 2006-2008 2013-2015 COUNTIES 2006-2008 2013-2015 CITIES 2006-2008 2013-2015
Accomack Co 2,132.6 1,506.8 King George Co 1,796.2 1,377.9 Alexandria C 2,534.4 1,935.4
Albemarle Co 2,543.6 1,700.2 King William Co 708.2 718.8 Bristol C 4,200.0 2,813.0
Alleghany Co 1,074.7 1,195.5 Lancaster Co 1,069.5 808.6 Buena Vista C 807.3 733.1
Amelia Co 1,122.7 953.0 Lee Co 1,914.5 1,858.9 Charlottesville C 4,857.8 2,924.7
Amherst Co 1,499.1 1,154.4 Loudoun Co 1,372.0 938.3 Chesapeake C 3,178.5 2,608.9
Appomattox Co 863.4 735.5 Louisa Co 1,507.7 1,542.6 Colonial Heights C 4,301.8 4,723.6
Arlington Co 2,266.1 1,561.3 Lunenburg Co 953.6 661.7 Covington C 2,762.5 2,034.2
Augusta Co 1,059.8 959.6 Madison Co 1,335.6 817.8 Danville C 5,465.9 4,338.3
Bath Co 409.8 664.5 Mathews Co 1,345.8 969.9 Emporia C 5,985.9 4,717.6
Bedford Co 1,079.3 1,175.6 Mecklenburg Co 2,371.2 1,650.1 Fairfax C 2,794.6 1,708.4
Bland Co 1,210.1 852.9 Middlesex Co 1,092.9 1,120.5 Falls Church C 3,153.9 1,652.8
Botetourt Co 1,106.9 795.3 Montgomery Co 2,410.2 1,477.2 Franklin C 4,588.2 5,063.6
Brunswick Co 932.1 696.7 Nelson Co 1,915.5 1,238.1 Fredericksburg C 4,584.5 4,167.7
Buchanan Co 2,192.4 1,649.7 New Kent Co 1,428.8 1,301.2 Galax C 4,044.2 3,846.9
Buckingham Co 1,087.5 1,010.7 Northampton Co 2,102.3 1,403.9 Hampton C 3,651.0 3,291.7
Campbell Co 1,721.1 1,395.3 Northumberland Co 1,141.6 850.5 Harrisonburg C 2,624.3 2,378.1
Caroline Co 1,752.1 1,165.5 Nottoway Co 1,968.1 1,702.9 Hopewell C 4,547.6 3,149.0
Carroll Co 1,507.4 1,237.8 Orange Co 1,199.0 1,083.7 Lexington C 1,574.2 1,241.4
Charles City Co 441.2 306.7 Page Co 1,901.7 1,530.5 Lynchburg C 3,444.6 2,358.4
Charlotte Co 1,229.6 454.3 Patrick Co 2,171.2 1,352.4 Manassas C 3,222.0 1,842.7
Chesterfield Co 2,357.3 1,889.2 Pittsylvania Co 964.5 775.3 Manassas Park C 2,000.9 1,049.6
Clarke Co 1,907.5 1,147.9 Powhatan Co 947.2 864.4 Martinsville C 3,993.0 3,151.7
Craig Co 295.9 242.5 Prince Edward Co 955.8 1,909.7 Newport News C 4,132.0 3,106.9
Culpeper Co 1,557.5 1,345.3 Prince George Co 1,241.1 1,002.5 Norfolk C 5,048.7 4,146.7
Cumberland Co 682.2 424.8 Prince William Co 2,064.1 1,364.3 Norton C 6,400.3 5,237.3
Dickenson Co 1,819.1 1,125.7 Pulaski Co 2,860.6 2,513.1 Petersburg C 8,387.7 3,336.9
Dinwiddie Co 1,524.8 1,039.1 Rappahannock Co 672.2 271.3 Poquoson C 1,361.2 1,010.5
Essex Co 1,985.4 1,768.5 Richmond Co 786.1 698.7 Portsmouth C 5,369.8 5,180.0
Fairfax Co 1,712.8 1,326.7 Roanoke Co 1,556.6 1,553.6 Radford C 3,899.4 2,490.7
Fauquier Co 1,451.1 986.0 Rockbridge Co 1,335.3 1,276.4 Richmond C 4,912.0 4,246.3
Floyd Co 1,065.2 840.6 Rockingham Co 834.6 877.5 Roanoke C 5,400.6 4,148.3
Fluvanna Co 799.2 779.1 Russell Co 1,519.8 1,293.1 Salem C 2,847.8 2,138.0
Franklin Co 1,326.4 1,219.2 Scott Co 2,261.9 1,403.2 Staunton C 2,974.8 2,283.6
Frederick Co 2,124.1 1,707.6 Shenandoah Co 1,186.2 1,250.4 Suffolk C 2,932.6 2,736.7
Giles Co 1,665.2 1,377.1 Smyth Co 1,983.0 1,695.1 Virginia Beach C 2,932.9 2,293.1
Gloucester Co 1,378.3 1,610.6 Southampton Co 1,801.0 1,349.9 Waynesboro C 3,051.9 2,987.6
Goochland Co 843.6 747.6 Spotsylvania Co 1,684.2 1,544.5 Williamsburg C 3,553.7 2,422.3
Grayson Co 1,006.0 963.0 Stafford Co 1,367.1 1,413.5 Winchester C 5,088.9 3,808.5
Greene Co 1,280.4 1,243.2 Surry Co 1,237.1 838.3
Greensville Co 2,075.1 665.7 Sussex Co 1,792.5 1,059.5
Halifax Co 2,083.2 1,916.6 Tazewell Co 2,447.9 1,907.2
Hanover Co 1,369.9 1,226.3 Warren Co 2,247.2 1,861.7
Henrico Co 2,954.8 2,437.2 Washington Co 3,002.6 1,910.1
Henry Co 2,257.9 2,397.5 Westmoreland Co 1,534.5 1,414.8
Highland Co 317.9 225.3 Wise Co 1,972.5 2,259.2
Isle of Wight Co 2,132.3 1,229.5 Wythe Co 1,768.5 1,184.2
James City Co 1,418.7 1,374.8 York Co 1,809.3 1,825.6
King & Queen Co 702.6 964.4
Virginia Crime and Arrest Trends, 2006-2015
24
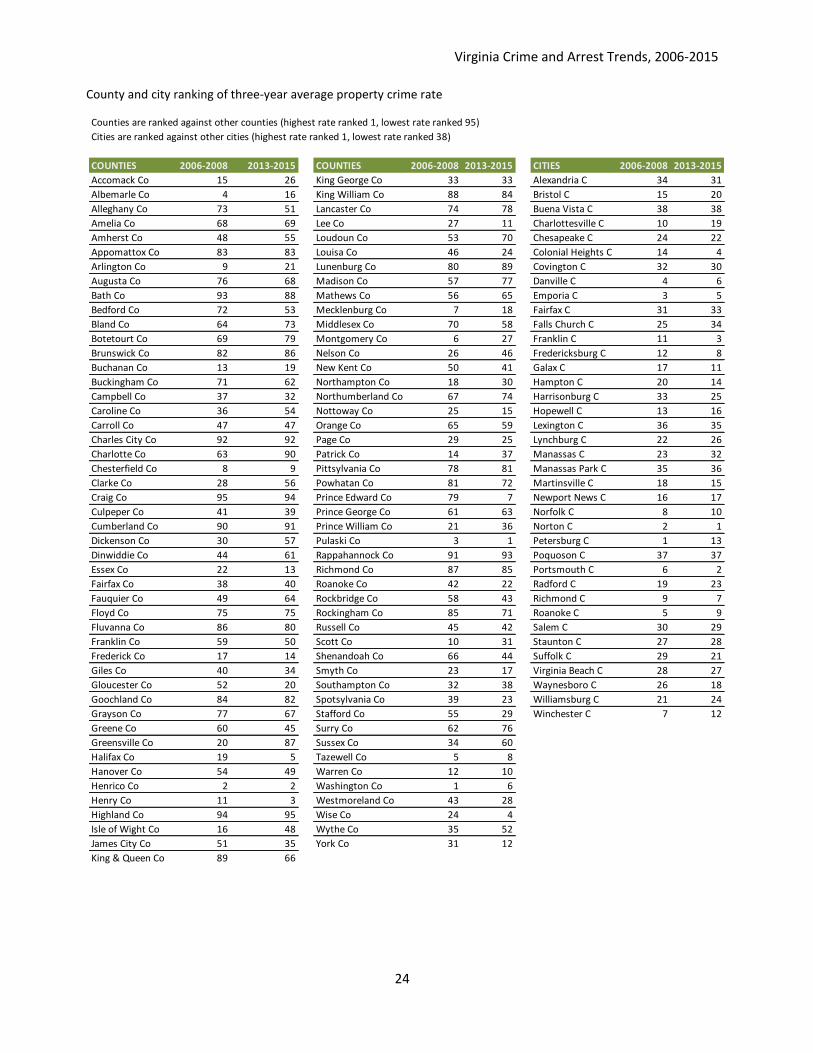
County and city ranking of three-year average property crime rate
Counties are ranked against other counties (highest rate ranked 1, lowest rate ranked 95)
Cities are ranked against other cities (highest rate ranked 1, lowest rate ranked 38)
COUNTIES 2006-2008 2013-2015 COUNTIES 2006-2008 2013-2015 CITIES 2006-2008 2013-2015
Accomack Co 15 26 King George Co 33 33 Alexandria C 34 31
Albemarle Co 4 16 King William Co 88 84 Bristol C 15 20
Alleghany Co 73 51 Lancaster Co 74 78 Buena Vista C 38 38
Amelia Co 68 69 Lee Co 27 11 Charlottesville C 10 19
Amherst Co 48 55 Loudoun Co 53 70 Chesapeake C 24 22
Appomattox Co 83 83 Louisa Co 46 24 Colonial Heights C 14 4
Arlington Co 9 21 Lunenburg Co 80 89 Covington C 32 30
Augusta Co 76 68 Madison Co 57 77 Danville C 4 6
Bath Co 93 88 Mathews Co 56 65 Emporia C 3 5
Bedford Co 72 53 Mecklenburg Co 7 18 Fairfax C 31 33
Bland Co 64 73 Middlesex Co 70 58 Falls Church C 25 34
Botetourt Co 69 79 Montgomery Co 6 27 Franklin C 11 3
Brunswick Co 82 86 Nelson Co 26 46 Fredericksburg C 12 8
Buchanan Co 13 19 New Kent Co 50 41 Galax C 17 11
Buckingham Co 71 62 Northampton Co 18 30 Hampton C 20 14
Campbell Co 37 32 Northumberland Co 67 74 Harrisonburg C 33 25
Caroline Co 36 54 Nottoway Co 25 15 Hopewell C 13 16
Carroll Co 47 47 Orange Co 65 59 Lexington C 36 35
Charles City Co 92 92 Page Co 29 25 Lynchburg C 22 26
Charlotte Co 63 90 Patrick Co 14 37 Manassas C 23 32
Chesterfield Co 8 9 Pittsylvania Co 78 81 Manassas Park C 35 36
Clarke Co 28 56 Powhatan Co 81 72 Martinsville C 18 15
Craig Co 95 94 Prince Edward Co 79 7 Newport News C 16 17
Culpeper Co 41 39 Prince George Co 61 63 Norfolk C 8 10
Cumberland Co 90 91 Prince William Co 21 36 Norton C 2 1
Dickenson Co 30 57 Pulaski Co 3 1 Petersburg C 1 13
Dinwiddie Co 44 61 Rappahannock Co 91 93 Poquoson C 37 37
Essex Co 22 13 Richmond Co 87 85 Portsmouth C 6 2
Fairfax Co 38 40 Roanoke Co 42 22 Radford C 19 23
Fauquier Co 49 64 Rockbridge Co 58 43 Richmond C 9 7
Floyd Co 75 75 Rockingham Co 85 71 Roanoke C 5 9
Fluvanna Co 86 80 Russell Co 45 42 Salem C 30 29
Franklin Co 59 50 Scott Co 10 31 Staunton C 27 28
Frederick Co 17 14 Shenandoah Co 66 44 Suffolk C 29 21
Giles Co 40 34 Smyth Co 23 17 Virginia Beach C 28 27
Gloucester Co 52 20 Southampton Co 32 38 Waynesboro C 26 18
Goochland Co 84 82 Spotsylvania Co 39 23 Williamsburg C 21 24
Grayson Co 77 67 Stafford Co 55 29 Winchester C 7 12
Greene Co 60 45 Surry Co 62 76
Greensville Co 20 87 Sussex Co 34 60
Halifax Co 19 5 Tazewell Co 5 8
Hanover Co 54 49 Warren Co 12 10
Henrico Co 2 2 Washington Co 1 6
Henry Co 11 3 Westmoreland Co 43 28
Highland Co 94 95 Wise Co 24 4
Isle of Wight Co 16 48 Wythe Co 35 52
James City Co 51 35 York Co 31 12
King & Queen Co 89 66
Virginia Crime and Arrest Trends, 2006-2015
25
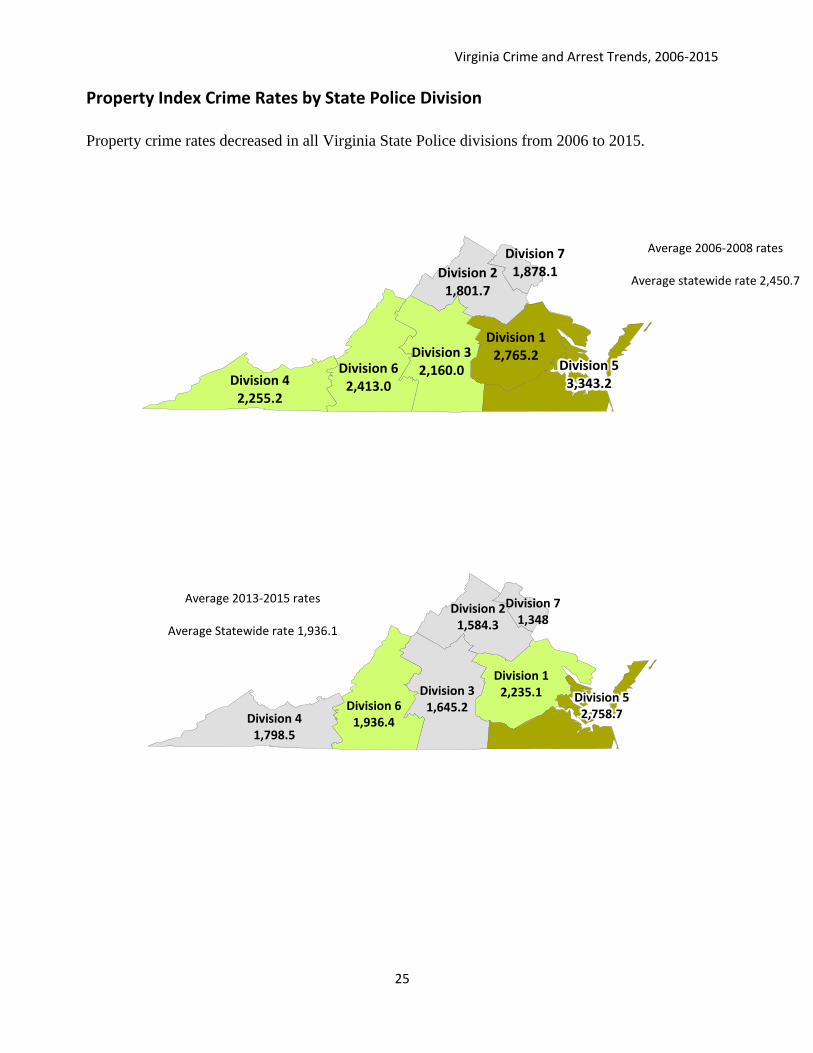
Property Index Crime Rates by State Police Division Property crime rates decreased in all Virginia State Police divisions from 2006 to 2015.
Division 62,413.0
Division 12,765.2Division 3
2,160.0Division 4
2,255.2
Division 21,801.7
Division 53,343.2
Division 71,878.1
Average 2006-2008 rates
Average statewide rate 2,450.7
Average 2013-2015 rates
Average Statewide rate 1,936.1
Division 31,645.2Division 6
1,936.4Division 41,798.5
Division 12,235.1
Division 21,584.3
Division 52,758.7
Division 71,348

Virginia Crime and Arrest Trends, 2006-2015
26
this page is blank

Virginia Crime and Arrest Trends, 2006-2015
27
Property Index Arrest Rates
Total arrest rates for property crimes increased by 17%, from 405.9 arrests per 100,000 total
arrest-age population in 2006 to 475.0 in 2015. By age group, the juvenile arrest rate for all
property crimes decreased by 33% over the decade, while the arrest rate for adults increased by
28%.
Total property arrest rates per 100,000 population age 10 and older by age group
1986-2015 (30 years) 2006-2015 (most recent 10 years)
Juveniles were arrested for property crimes at more than twice the rate of adults back in the early
1990s, and were consistently arrested at a higher rate than adults in subsequent years. From 2006
to 2015, property arrest rates for juveniles peaked in 2009 and then began a steady decline. If
current juvenile property arrest trends continue, juvenile arrest rates for property crimes may soon
fall below the arrest rate for adults.
Burglary Juvenile arrest rates for burglary decreased by 54%, from 141.4 juvenile arrests per 100,000
juvenile population in 2006 to 64.9 juvenile arrests in 2015. From 2014 to 2015 the juvenile
burglary arrest rate increased by 2%, with 63.8 juvenile arrests reported in 2014. Adult burglary
arrest rates decreased by 31% over the decade, from 57.5 adult arrests per 100,000 adult
population in 2006 to 39.4 in 2015. The adult arrest rate from 2014 to 2015 decreased by 15%
with 46.3 adult arrests reported in 2014.
Larceny Although total larceny offense rates statewide decreased from 2006 to 2015, total larceny arrest
rates statewide increased over the decade by 33%. From 2014 to 2015 total larceny arrest rates
decreased by less than 1%, from 423.3 arrests per 100,000 arrest-age population in 2014 to 419.9
in 2015. 523.4 juveniles per 100,000 juvenile population were arrested for larceny crimes in 2006.
In 2015, the arrest rate for juveniles was 385.2, a 26% decrease. From 2014 to 2015, the juvenile
larceny arrest rate decreased by 5%, with 407.3 juvenile arrests per 100,000 juvenile population in
2014. Over the decade, the adult larceny arrest rate increased by 45%, from 285.6 adults per
100,000 adult population in 2006 to 414.4 adults in 2015. The adult larceny arrest rate had the
largest 10-year percentage increase of all index crimes, violent or property. The adult larceny
arrest rate decreased by 3% from 2014 to 2015.
0
500
1,000
1,500
2,000
2,500
19
86
88
90
92
94
96
98
20
00
02
04
06
07
08
09
10
11
12
13
14
15
Juvenile
Adult
Total
0
200
400
600
800
1,000
06 07 08 09 10 11 12 13 14 15
Juvenile
Adult
Total
Virginia Crime and Arrest Trends, 2006-2015
28
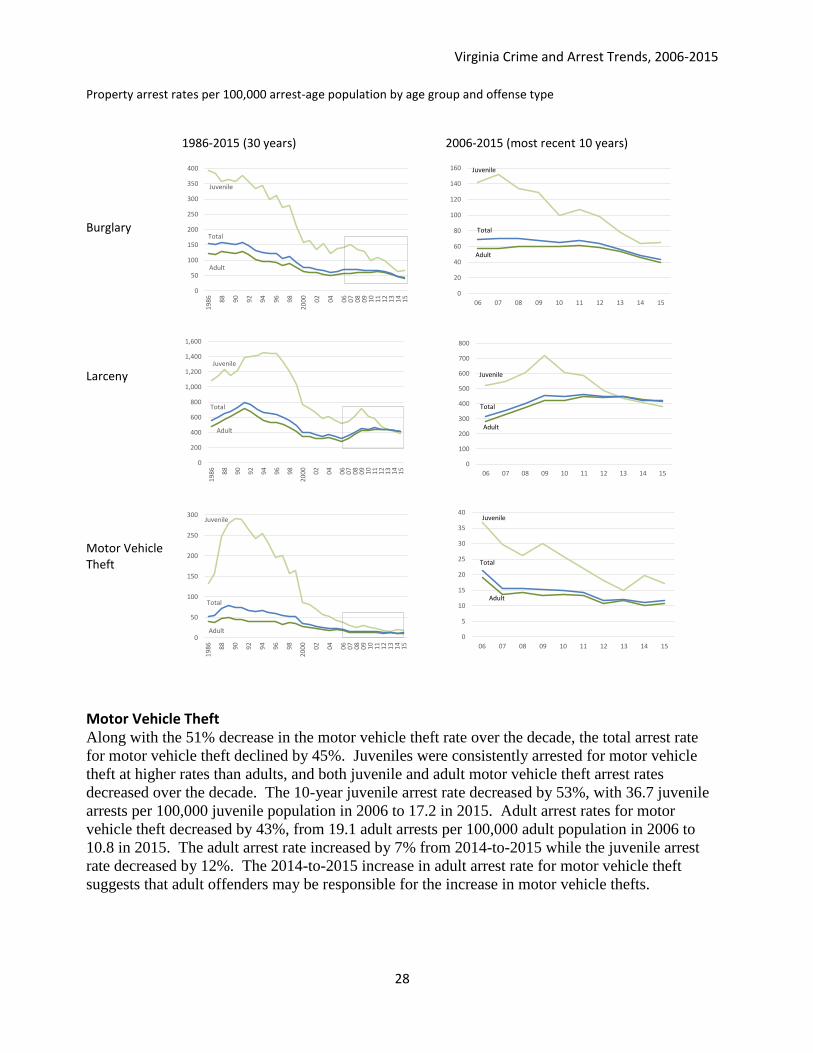
Property arrest rates per 100,000 arrest-age population by age group and offense type 1986-2015 (30 years) 2006-2015 (most recent 10 years)
Burglary
Larceny
Motor Vehicle Theft
Motor Vehicle Theft Along with the 51% decrease in the motor vehicle theft rate over the decade, the total arrest rate
for motor vehicle theft declined by 45%. Juveniles were consistently arrested for motor vehicle
theft at higher rates than adults, and both juvenile and adult motor vehicle theft arrest rates
decreased over the decade. The 10-year juvenile arrest rate decreased by 53%, with 36.7 juvenile
arrests per 100,000 juvenile population in 2006 to 17.2 in 2015. Adult arrest rates for motor
vehicle theft decreased by 43%, from 19.1 adult arrests per 100,000 adult population in 2006 to
10.8 in 2015. The adult arrest rate increased by 7% from 2014-to-2015 while the juvenile arrest
rate decreased by 12%. The 2014-to-2015 increase in adult arrest rate for motor vehicle theft
suggests that adult offenders may be responsible for the increase in motor vehicle thefts.
0
50
100
150
200
250
300
350
400
19
86
88
90
92
94
96
98
20
00
02
04
06
07
08
09
10
11
12
13
14
15
Juvenile
Adult
Total
0
200
400
600
800
1,000
1,200
1,400
1,600
19
86
88
90
92
94
96
98
20
00
02
04
06
07
08
09
10
11
12
13
14
15
Juvenile
Adult
Total
0
50
100
150
200
250
300
19
86
88
90
92
94
96
98
20
00
02
04
06
07
08
09
10
11
12
13
14
15
Juvenile
Adult
Total
0
20
40
60
80
100
120
140
160
06 07 08 09 10 11 12 13 14 15
Juvenile
Adult
Total
0
100
200
300
400
500
600
700
800
06 07 08 09 10 11 12 13 14 15
Juvenile
Adult
Total
0
5
10
15
20
25
30
35
40
06 07 08 09 10 11 12 13 14 15
Juvenile
Adult
Total

Virginia Crime and Arrest Trends, 2006-2015
29
this page is blank
Virginia Crime and Arrest Trends, 2006-2015
30
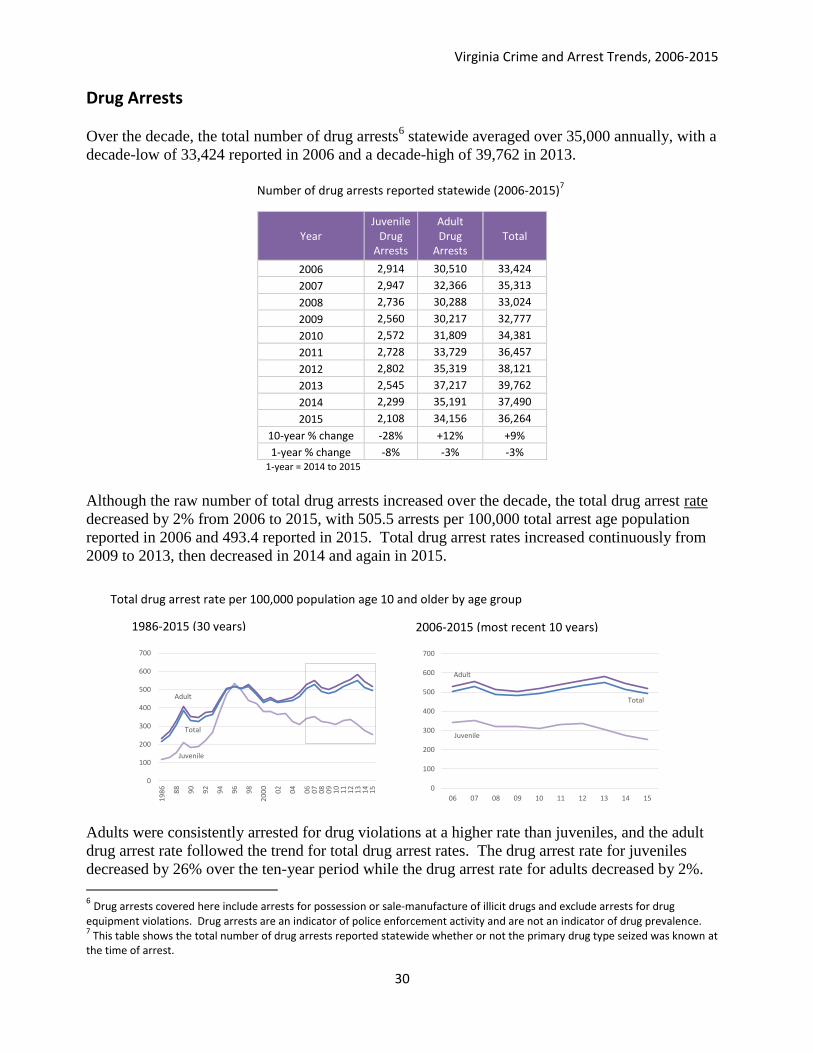
Drug Arrests
Over the decade, the total number of drug arrests6 statewide averaged over 35,000 annually, with a
decade-low of 33,424 reported in 2006 and a decade-high of 39,762 in 2013.
Number of drug arrests reported statewide (2006-2015)
7
Year Juvenile
Drug Arrests
Adult Drug
Arrests Total
2006 2,914 30,510 33,424
2007 2,947 32,366 35,313
2008 2,736 30,288 33,024
2009 2,560 30,217 32,777
2010 2,572 31,809 34,381
2011 2,728 33,729 36,457
2012 2,802 35,319 38,121
2013 2,545 37,217 39,762
2014 2,299 35,191 37,490
2015 2,108 34,156 36,264
10-year % change -28% +12% +9%
1-year % change -8% -3% -3% 1-year = 2014 to 2015
Although the raw number of total drug arrests increased over the decade, the total drug arrest rate
decreased by 2% from 2006 to 2015, with 505.5 arrests per 100,000 total arrest age population
reported in 2006 and 493.4 reported in 2015. Total drug arrest rates increased continuously from
2009 to 2013, then decreased in 2014 and again in 2015.
Total drug arrest rate per 100,000 population age 10 and older by age group
Adults were consistently arrested for drug violations at a higher rate than juveniles, and the adult
drug arrest rate followed the trend for total drug arrest rates. The drug arrest rate for juveniles
decreased by 26% over the ten-year period while the drug arrest rate for adults decreased by 2%.
6 Drug arrests covered here include arrests for possession or sale-manufacture of illicit drugs and exclude arrests for drug
equipment violations. Drug arrests are an indicator of police enforcement activity and are not an indicator of drug prevalence. 7 This table shows the total number of drug arrests reported statewide whether or not the primary drug type seized was known at
the time of arrest.
2006-2015 (most recent 10 years) 1986-2015 (30 years)
0
100
200
300
400
500
600
700
19
86
88
90
92
94
96
98
20
00
02
04
06
07
08
09
10
11
12
13
14
15
Adult
Juvenile
Total
0
100
200
300
400
500
600
700
06 07 08 09 10 11 12 13 14 15
Adult
Juvenile
Total
Virginia Crime and Arrest Trends, 2006-2015
31
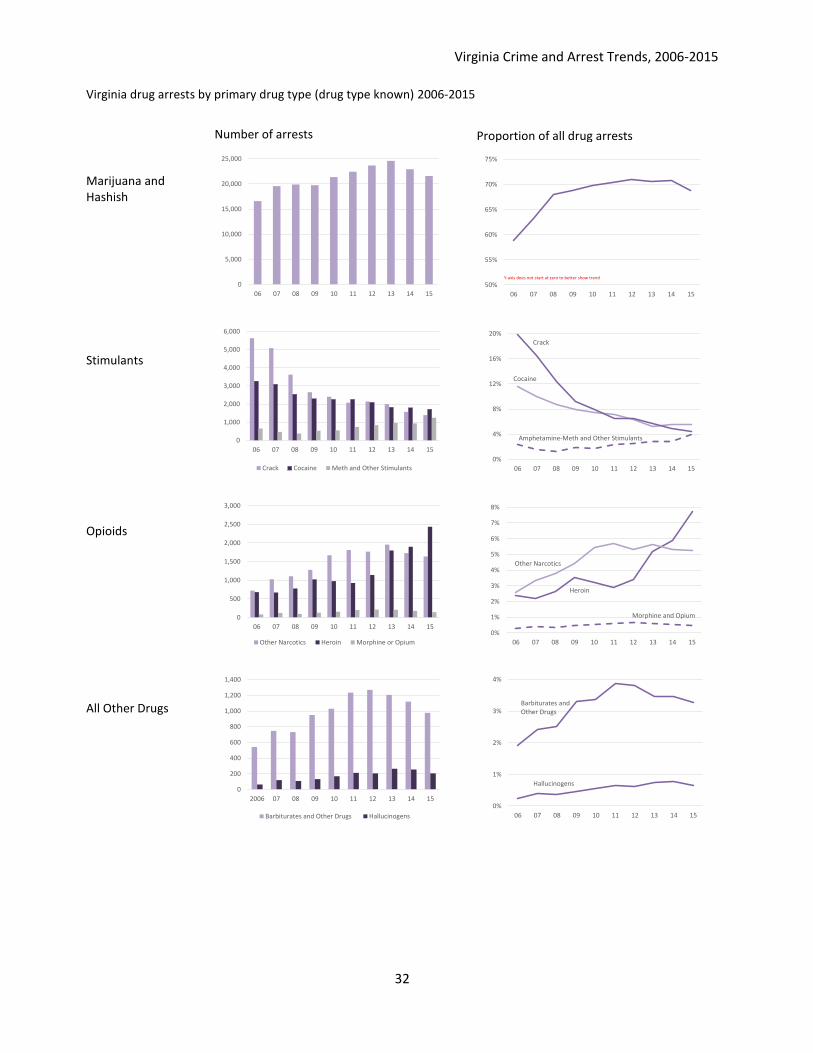
Marijuana
The overwhelming majority of drug arrests from 2006 to 2015 were for marijuana. The
proportion of all drug arrests that were for marijuana ranged from 59% in 2006 to a decade high of
just over 71% in 2012. By 2015, 69% of all drug arrests were for marijuana. The number of drug
arrests for marijuana increased continuously from 2009 to 2013, then decreased in 2014 and again
in 2015. From 2013 to 2015 the number of marijuana arrests dropped by 14%.
Stimulants Arrests for stimulants
8 made up 34% of all drug arrests in 2006 but dropped to only 14% in 2015.
The steep decrease in arrests for stimulants was driven by the 75% drop in the number of arrests
for crack (from over 5,600 arrests in 2006 down to under 1,400 arrests in 2015) and the number of
arrests for cocaine dropping by almost half (over 3,200 in 2006 down to just over 1,700 in 2015).
The proportion of arrests for amphetamine-methamphetamines and all other stimulants increased
continuously from just under 2% in 2010 to 4% in 2015. If current trends hold, the proportion of
arrests for amphetamine-methamphetamines and all other stimulants may soon surpass the
proportion of drug arrests for crack.
Opioids including Heroin and Prescription Drugs 2014 was the first year in Virginia where more people died from abuse of prescription and illicit
opioids (733 deaths) than from automobile accidents (700 deaths), and the trend continued in 2015
with an estimated 801 deaths from opioids compared with 753 deaths from automobile accidents.
The number of deaths from prescription and illicit opioids in Virginia nearly doubled from 2010 to
2015.9 Local and state health and public safety institutions in Virginia have recognized the need
to significantly reduce deaths from the abuse of prescription and illicit opioids and have adopted a
number of legal and medical strategies to do so.
Drug arrest statistics reflect this increased focus on opioid abuse, where the share of all drug
arrests in Virginia for opioids more than doubled from 5% of all drug arrests in 2006 to 13% in
2015. By 2014, the share of heroin arrests surpassed the share of arrests for Other Narcotics
(which include prescription opioids). A representative from The National Institutes of Health
National Institute on Drug Abuse testifying before the U.S. Senate Caucus on International
Narcotics Control in 2014 stated that “Growing evidence suggests that abusers of prescription
opioids are shifting to heroin as prescription drugs become less available or harder to abuse.”10
The drug arrest trends in Virginia may indicate such a shift from prescription opioids to heroin.
Barbiturates, Hallucinogens and all Other Drugs The proportion of arrests for barbiturates, hallucinogens and other drugs trended upward
throughout the decade. These drugs together make up about 4% of all drug arrests.
8 Drugs are grouped here as Stimulants (Cocaine [powder cocaine], Crack [crack cocaine], Amphetamine, Methamphetamine and
Other Stimulants), Opioids (Heroin, Opium, Morphine, and Other Narcotic Drugs which include prescription opioids), Hallucinogens (LSD, PCP, and Other Hallucinogens), and Barbiturates and Other Drugs (Depressants, Synthetic Drugs) 9 Fatal Drug Overdose Quarterly Report 4
th Quarter 2015 Edition 2015.3, April 2016. Virginia Department of Health Office of the
Chief Medical Examiner. Accessed on June 29, 2016 at https://www/vdh.virginia.gov/medExam/documents/pdf/Quarterly Drug Death Report.pdf and Virginia Crash Facts Yearly. Publications accessed on June 29, 2016 at www.dmv.state.va.us/safety/#crash_data/crash_facts/index.asp 10
America’s Addiction to Opioids: Heroin and Prescription Drug Abuse, presented by Nora Volkow, M.D., Senate Caucus on International Narcotics Control, May 14, 2014, accessed on June 9, 2016 at https://www.drugabuse.gov/about-nida/legistlative-activities/testimony-to-congress/2016/americas-addiction-to-opioids-heroin-prescription-drug-abuse
Virginia Crime and Arrest Trends, 2006-2015
32
Virginia drug arrests by primary drug type (drug type known) 2006-2015
Marijuana and Hashish
Stimulants
Opioids
All Other Drugs
Number of arrests Proportion of all drug arrests
0
5,000
10,000
15,000
20,000
25,000
06 07 08 09 10 11 12 13 14 15
0
1,000
2,000
3,000
4,000
5,000
6,000
06 07 08 09 10 11 12 13 14 15
Crack Cocaine Meth and Other Stimulants
0
200
400
600
800
1,000
1,200
1,400
2006 07 08 09 10 11 12 13 14 15
Barbiturates and Other Drugs Hallucinogens
50%
55%
60%
65%
70%
75%
06 07 08 09 10 11 12 13 14 15
Y-axis does not start at zero to better show trend
0%
4%
8%
12%
16%
20%
06 07 08 09 10 11 12 13 14 15
Crack
Cocaine
Amphetamine-Meth and Other Stimulants
0%
1%
2%
3%
4%
06 07 08 09 10 11 12 13 14 15
Barbiturates andOther Drugs
Hallucinogens
0
500
1,000
1,500
2,000
2,500
3,000
06 07 08 09 10 11 12 13 14 15
Other Narcotics Heroin Morphine or Opium
0%
1%
2%
3%
4%
5%
6%
7%
8%
06 07 08 09 10 11 12 13 14 15
Other Narcotics
Heroin
Morphine and Opium
Virginia Crime and Arrest Trends, 2006-2015
33
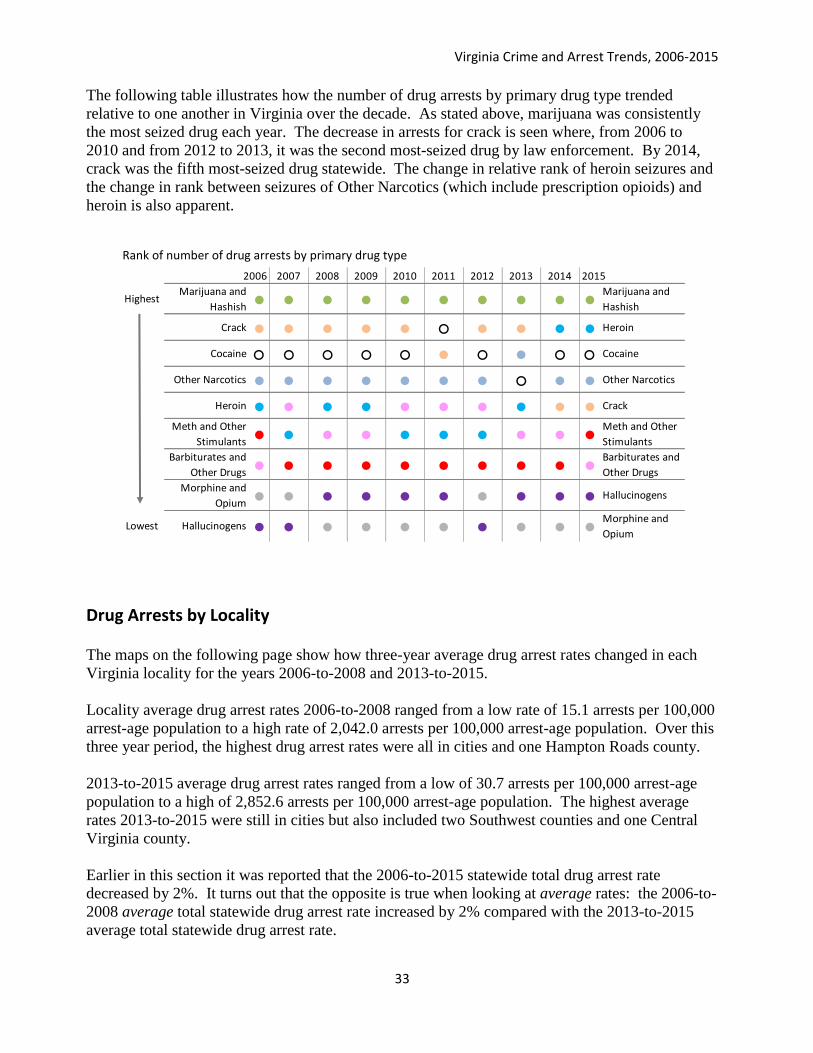
The following table illustrates how the number of drug arrests by primary drug type trended
relative to one another in Virginia over the decade. As stated above, marijuana was consistently
the most seized drug each year. The decrease in arrests for crack is seen where, from 2006 to
2010 and from 2012 to 2013, it was the second most-seized drug by law enforcement. By 2014,
crack was the fifth most-seized drug statewide. The change in relative rank of heroin seizures and
the change in rank between seizures of Other Narcotics (which include prescription opioids) and
heroin is also apparent. Rank of number of drug arrests by primary drug type
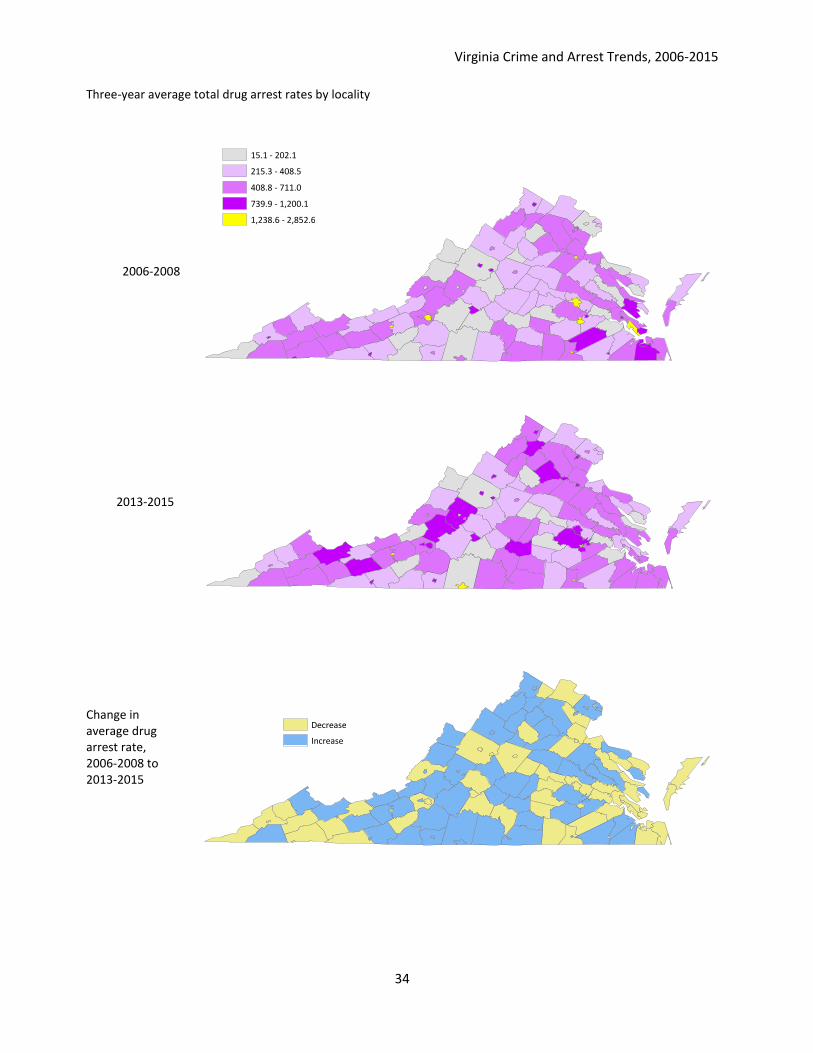
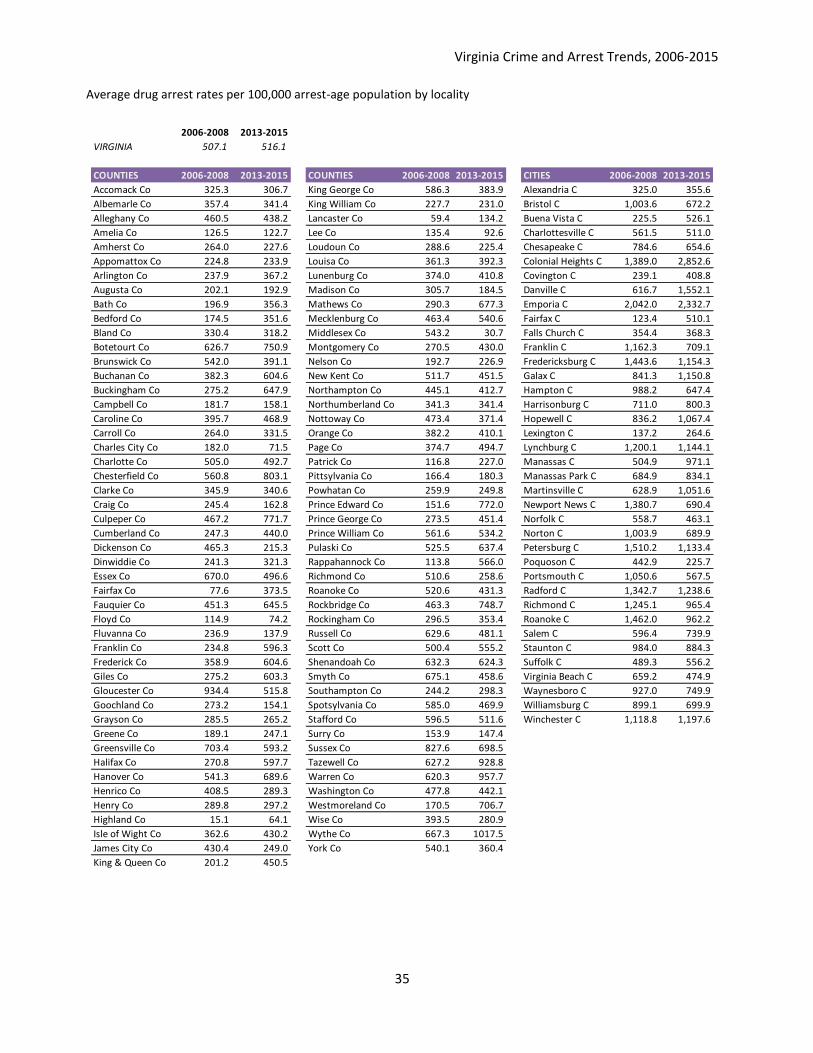
Drug Arrests by Locality The maps on the following page show how three-year average drug arrest rates changed in each
Virginia locality for the years 2006-to-2008 and 2013-to-2015.
Locality average drug arrest rates 2006-to-2008 ranged from a low rate of 15.1 arrests per 100,000
arrest-age population to a high rate of 2,042.0 arrests per 100,000 arrest-age population. Over this
three year period, the highest drug arrest rates were all in cities and one Hampton Roads county.
2013-to-2015 average drug arrest rates ranged from a low of 30.7 arrests per 100,000 arrest-age
population to a high of 2,852.6 arrests per 100,000 arrest-age population. The highest average
rates 2013-to-2015 were still in cities but also included two Southwest counties and one Central
Virginia county.
Earlier in this section it was reported that the 2006-to-2015 statewide total drug arrest rate
decreased by 2%. It turns out that the opposite is true when looking at average rates: the 2006-to-
2008 average total statewide drug arrest rate increased by 2% compared with the 2013-to-2015
average total statewide drug arrest rate.
2007 2008 2009 2010 2011 2012 2013 2014
HighestMarijuana and
Hashish ● ● ● ● ● ● ● ● ● ●Marijuana and
Hashish
Crack ● ● ● ● ● ○ ● ● ● ● Heroin
Cocaine ○ ○ ○ ○ ○ ● ○ ● ○ ○ Cocaine
Other Narcotics ● ● ● ● ● ● ● ○ ● ● Other Narcotics
Heroin ● ● ● ● ● ● ● ● ● ● Crack
Meth and Other
Stimulants ● ● ● ● ● ● ● ● ● ●Meth and Other
Stimulants
Barbiturates and
Other Drugs ● ● ● ● ● ● ● ● ● ●Barbiturates and
Other Drugs
Morphine and
Opium ● ● ● ● ● ● ● ● ● ● Hallucinogens
Lowest Hallucinogens ● ● ● ● ● ● ● ● ● ●Morphine and
Opium
2006 2015
Virginia Crime and Arrest Trends, 2006-2015
34
Three-year average total drug arrest rates by locality
2006-2008
2013-2015
Change in average drug arrest rate, 2006-2008 to 2013-2015
Decrease
Increase
15.1 - 202.1
215.3 - 408.5
408.8 - 711.0
739.9 - 1,200.1
1,238.6 - 2,852.6
Virginia Crime and Arrest Trends, 2006-2015
35
Average drug arrest rates per 100,000 arrest-age population by locality
2006-2008 2013-2015
VIRGINIA 507.1 516.1
COUNTIES 2006-2008 2013-2015 COUNTIES 2006-2008 2013-2015 CITIES 2006-2008 2013-2015
Accomack Co 325.3 306.7 King George Co 586.3 383.9 Alexandria C 325.0 355.6
Albemarle Co 357.4 341.4 King William Co 227.7 231.0 Bristol C 1,003.6 672.2
Alleghany Co 460.5 438.2 Lancaster Co 59.4 134.2 Buena Vista C 225.5 526.1
Amelia Co 126.5 122.7 Lee Co 135.4 92.6 Charlottesville C 561.5 511.0
Amherst Co 264.0 227.6 Loudoun Co 288.6 225.4 Chesapeake C 784.6 654.6
Appomattox Co 224.8 233.9 Louisa Co 361.3 392.3 Colonial Heights C 1,389.0 2,852.6
Arlington Co 237.9 367.2 Lunenburg Co 374.0 410.8 Covington C 239.1 408.8
Augusta Co 202.1 192.9 Madison Co 305.7 184.5 Danville C 616.7 1,552.1
Bath Co 196.9 356.3 Mathews Co 290.3 677.3 Emporia C 2,042.0 2,332.7
Bedford Co 174.5 351.6 Mecklenburg Co 463.4 540.6 Fairfax C 123.4 510.1
Bland Co 330.4 318.2 Middlesex Co 543.2 30.7 Falls Church C 354.4 368.3
Botetourt Co 626.7 750.9 Montgomery Co 270.5 430.0 Franklin C 1,162.3 709.1
Brunswick Co 542.0 391.1 Nelson Co 192.7 226.9 Fredericksburg C 1,443.6 1,154.3
Buchanan Co 382.3 604.6 New Kent Co 511.7 451.5 Galax C 841.3 1,150.8
Buckingham Co 275.2 647.9 Northampton Co 445.1 412.7 Hampton C 988.2 647.4
Campbell Co 181.7 158.1 Northumberland Co 341.3 341.4 Harrisonburg C 711.0 800.3
Caroline Co 395.7 468.9 Nottoway Co 473.4 371.4 Hopewell C 836.2 1,067.4
Carroll Co 264.0 331.5 Orange Co 382.2 410.1 Lexington C 137.2 264.6
Charles City Co 182.0 71.5 Page Co 374.7 494.7 Lynchburg C 1,200.1 1,144.1
Charlotte Co 505.0 492.7 Patrick Co 116.8 227.0 Manassas C 504.9 971.1
Chesterfield Co 560.8 803.1 Pittsylvania Co 166.4 180.3 Manassas Park C 684.9 834.1
Clarke Co 345.9 340.6 Powhatan Co 259.9 249.8 Martinsville C 628.9 1,051.6
Craig Co 245.4 162.8 Prince Edward Co 151.6 772.0 Newport News C 1,380.7 690.4
Culpeper Co 467.2 771.7 Prince George Co 273.5 451.4 Norfolk C 558.7 463.1
Cumberland Co 247.3 440.0 Prince William Co 561.6 534.2 Norton C 1,003.9 689.9
Dickenson Co 465.3 215.3 Pulaski Co 525.5 637.4 Petersburg C 1,510.2 1,133.4
Dinwiddie Co 241.3 321.3 Rappahannock Co 113.8 566.0 Poquoson C 442.9 225.7
Essex Co 670.0 496.6 Richmond Co 510.6 258.6 Portsmouth C 1,050.6 567.5
Fairfax Co 77.6 373.5 Roanoke Co 520.6 431.3 Radford C 1,342.7 1,238.6
Fauquier Co 451.3 645.5 Rockbridge Co 463.3 748.7 Richmond C 1,245.1 965.4
Floyd Co 114.9 74.2 Rockingham Co 296.5 353.4 Roanoke C 1,462.0 962.2
Fluvanna Co 236.9 137.9 Russell Co 629.6 481.1 Salem C 596.4 739.9
Franklin Co 234.8 596.3 Scott Co 500.4 555.2 Staunton C 984.0 884.3
Frederick Co 358.9 604.6 Shenandoah Co 632.3 624.3 Suffolk C 489.3 556.2
Giles Co 275.2 603.3 Smyth Co 675.1 458.6 Virginia Beach C 659.2 474.9
Gloucester Co 934.4 515.8 Southampton Co 244.2 298.3 Waynesboro C 927.0 749.9
Goochland Co 273.2 154.1 Spotsylvania Co 585.0 469.9 Williamsburg C 899.1 699.9
Grayson Co 285.5 265.2 Stafford Co 596.5 511.6 Winchester C 1,118.8 1,197.6
Greene Co 189.1 247.1 Surry Co 153.9 147.4
Greensville Co 703.4 593.2 Sussex Co 827.6 698.5
Halifax Co 270.8 597.7 Tazewell Co 627.2 928.8
Hanover Co 541.3 689.6 Warren Co 620.3 957.7
Henrico Co 408.5 289.3 Washington Co 477.8 442.1
Henry Co 289.8 297.2 Westmoreland Co 170.5 706.7
Highland Co 15.1 64.1 Wise Co 393.5 280.9
Isle of Wight Co 362.6 430.2 Wythe Co 667.3 1017.5
James City Co 430.4 249.0 York Co 540.1 360.4
King & Queen Co 201.2 450.5
Virginia Crime and Arrest Trends, 2006-2015
36
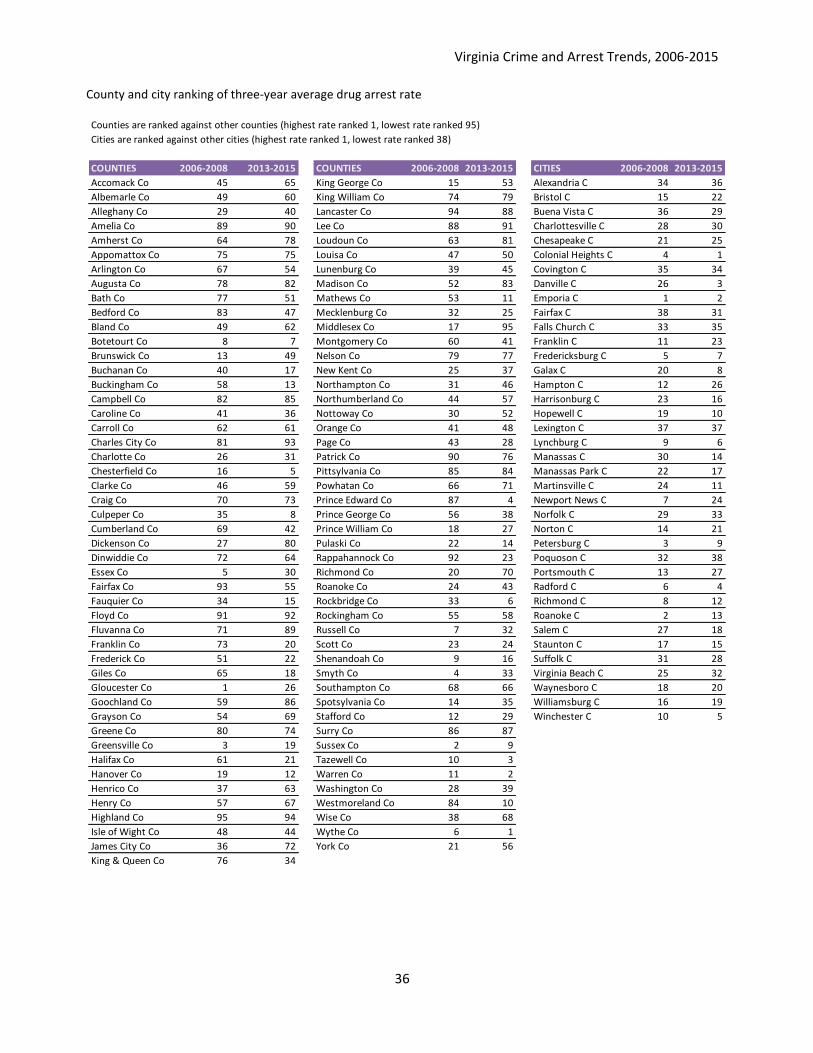
County and city ranking of three-year average drug arrest rate
Counties are ranked against other counties (highest rate ranked 1, lowest rate ranked 95)
Cities are ranked against other cities (highest rate ranked 1, lowest rate ranked 38)
COUNTIES 2006-2008 2013-2015 COUNTIES 2006-2008 2013-2015 CITIES 2006-2008 2013-2015
Accomack Co 45 65 King George Co 15 53 Alexandria C 34 36
Albemarle Co 49 60 King William Co 74 79 Bristol C 15 22
Alleghany Co 29 40 Lancaster Co 94 88 Buena Vista C 36 29
Amelia Co 89 90 Lee Co 88 91 Charlottesville C 28 30
Amherst Co 64 78 Loudoun Co 63 81 Chesapeake C 21 25
Appomattox Co 75 75 Louisa Co 47 50 Colonial Heights C 4 1
Arlington Co 67 54 Lunenburg Co 39 45 Covington C 35 34
Augusta Co 78 82 Madison Co 52 83 Danville C 26 3
Bath Co 77 51 Mathews Co 53 11 Emporia C 1 2
Bedford Co 83 47 Mecklenburg Co 32 25 Fairfax C 38 31
Bland Co 49 62 Middlesex Co 17 95 Falls Church C 33 35
Botetourt Co 8 7 Montgomery Co 60 41 Franklin C 11 23
Brunswick Co 13 49 Nelson Co 79 77 Fredericksburg C 5 7
Buchanan Co 40 17 New Kent Co 25 37 Galax C 20 8
Buckingham Co 58 13 Northampton Co 31 46 Hampton C 12 26
Campbell Co 82 85 Northumberland Co 44 57 Harrisonburg C 23 16
Caroline Co 41 36 Nottoway Co 30 52 Hopewell C 19 10
Carroll Co 62 61 Orange Co 41 48 Lexington C 37 37
Charles City Co 81 93 Page Co 43 28 Lynchburg C 9 6
Charlotte Co 26 31 Patrick Co 90 76 Manassas C 30 14
Chesterfield Co 16 5 Pittsylvania Co 85 84 Manassas Park C 22 17
Clarke Co 46 59 Powhatan Co 66 71 Martinsville C 24 11
Craig Co 70 73 Prince Edward Co 87 4 Newport News C 7 24
Culpeper Co 35 8 Prince George Co 56 38 Norfolk C 29 33
Cumberland Co 69 42 Prince William Co 18 27 Norton C 14 21
Dickenson Co 27 80 Pulaski Co 22 14 Petersburg C 3 9
Dinwiddie Co 72 64 Rappahannock Co 92 23 Poquoson C 32 38
Essex Co 5 30 Richmond Co 20 70 Portsmouth C 13 27
Fairfax Co 93 55 Roanoke Co 24 43 Radford C 6 4
Fauquier Co 34 15 Rockbridge Co 33 6 Richmond C 8 12
Floyd Co 91 92 Rockingham Co 55 58 Roanoke C 2 13
Fluvanna Co 71 89 Russell Co 7 32 Salem C 27 18
Franklin Co 73 20 Scott Co 23 24 Staunton C 17 15
Frederick Co 51 22 Shenandoah Co 9 16 Suffolk C 31 28
Giles Co 65 18 Smyth Co 4 33 Virginia Beach C 25 32
Gloucester Co 1 26 Southampton Co 68 66 Waynesboro C 18 20
Goochland Co 59 86 Spotsylvania Co 14 35 Williamsburg C 16 19
Grayson Co 54 69 Stafford Co 12 29 Winchester C 10 5
Greene Co 80 74 Surry Co 86 87
Greensville Co 3 19 Sussex Co 2 9
Halifax Co 61 21 Tazewell Co 10 3
Hanover Co 19 12 Warren Co 11 2
Henrico Co 37 63 Washington Co 28 39
Henry Co 57 67 Westmoreland Co 84 10
Highland Co 95 94 Wise Co 38 68
Isle of Wight Co 48 44 Wythe Co 6 1
James City Co 36 72 York Co 21 56
King & Queen Co 76 34
Virginia Crime and Arrest Trends, 2006-2015
37
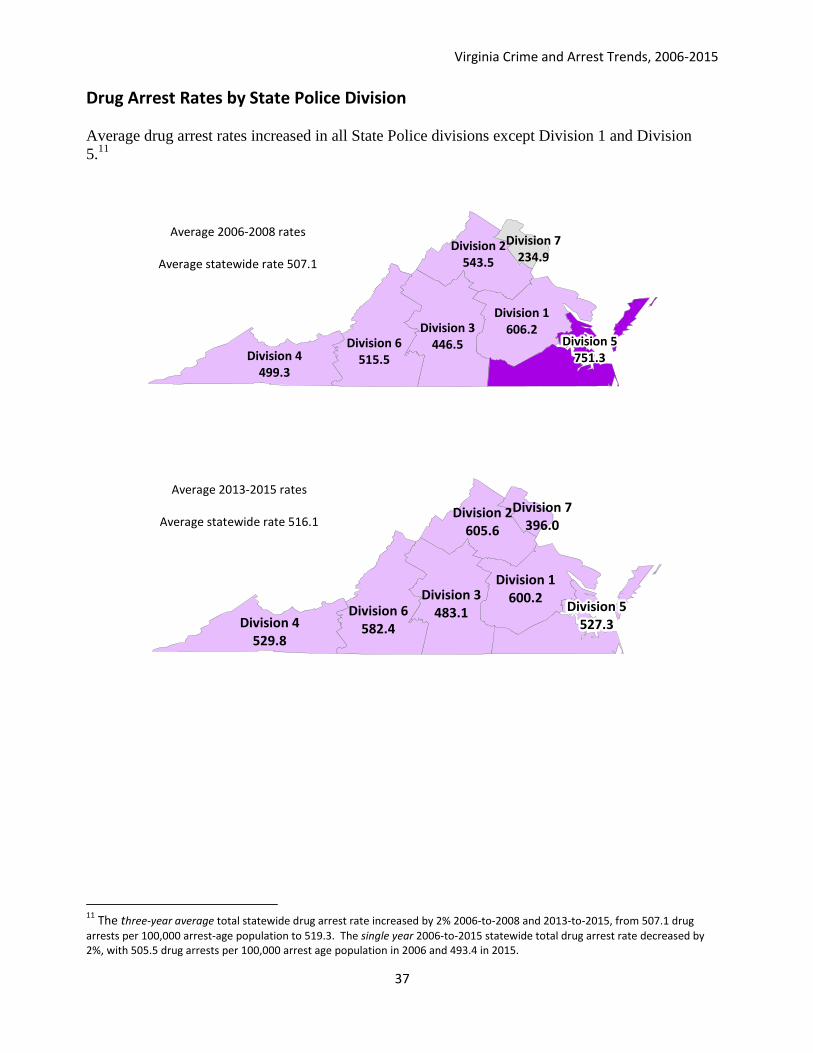
Drug Arrest Rates by State Police Division
Average drug arrest rates increased in all State Police divisions except Division 1 and Division
5.11
11
The three-year average total statewide drug arrest rate increased by 2% 2006-to-2008 and 2013-to-2015, from 507.1 drug
arrests per 100,000 arrest-age population to 519.3. The single year 2006-to-2015 statewide total drug arrest rate decreased by 2%, with 505.5 drug arrests per 100,000 arrest age population in 2006 and 493.4 in 2015.
Division 3446.5Division 6
515.5Division 4499.3
Division 1606.2
Division 2543.5
Division 7234.9
Division 5751.3
Average 2006-2008 rates
Average statewide rate 507.1
Division 6582.4
Division 1600.2Division 3
483.1Division 4
529.8
Division 2605.6
Division 7396.0
Division 5527.3
Average 2013-2015 rates
Average statewide rate 516.1

Virginia Crime and Arrest Trends, 2006-2015
38
Conclusion The numbers of violent crimes and property crimes in Virginia remain at historic lows. Over the
last decade, the violent crime rate dropped by more than one-third and rate of arrests for violent
crime dropped by 23%. The property crime rate dropped by one-quarter and the rate of arrests for
property crime dropped by 17%.
This clearly is progress in making Virginia safer. There were nearly 6,000 fewer violent crimes
reported in Virginia in 2015 than were reported in 2006, and more than 32,000 fewer property
crimes reported in 2015 than in 2006. Over the same decade, Virginia’s population increased by
more 707,000 people.
Decreases in crimes and arrests are reflected in other measures of criminal justice system activity.
The number of criminal cases begun in Virginia’s circuit courts dropped by 9% from 2006 to
2015, and the number of criminal cases begun in general district courts dropped by 9%.12
The
number of juvenile intake complaints dropped by almost 38% from 2006 to 2015.13
Virginia’s inmate populations have slowed or reversed the sharp increases that began in the 1990s.
The prison inmate population grew by about 6% from FY2006 to 2015, but is projected to grow an
average of only 0.3% annually from FY2016 to FY2022. The local-responsible jail inmate
population grew by less than 1% from FY2006 to FY2015, and is projected to grow an average of
less than 1% annually from FY2016 to 2022. The population of juveniles committed to direct care
by the Department of Juvenile Justice dropped by half from FY2006 to FY2015, and is expected
to decline an average of almost 7% annually from FY2017 to FY2022.14
Although these downward trends indicate progress, more needs to be done to maintain this
progress. Both nationally and in Virginia, some types of crime have begun to increase. From 2014
to 2015, the number of violent crimes in the U.S. increased by 4%. Murders increased by 11%,
rapes by 6%, robberies by 1% and aggravated assaults by 5%.15
Virginia followed some of these
national trends. From 2014 to 2015, the number of murders increased by 13%, rapes by 2%, and
robberies by 13%.
The number of drug arrests made in Virginia did increase over the last decade, but the drug arrest
rate declined. Arrests for marijuana continued to be the majority of these arrests. Crack and
powdered cocaine arrests dropped dramatically over the decade, but arrests involving heroin,
prescription drugs and other opioids increased and are a growing problem.
Virginia is taking a system-wide, multidisciplinary approach to address these concerns. Virginia’s
health and criminal justice systems are collaborating on multidisciplinary approaches to address
12
Office of the Executive Secretary, Supreme Court of Virginia. 2016 and 2015 Virginia State of the Judiciary Reports. Retrieved 10/20/2016 from http://www.courts.state.va.us/courtadmin/aoc/judpln/home.html. 13
Virginia Department of Juvenile Justice. 2007 and 2015 Data Resource Guides. Retrieved 10/20/2016 from http://www.djj.virginia.gov/pages/about-djj/drg.htm. 14
Office of the Secretary of Public Safety and Homeland Security. Report on the Offender Population Forecasts (FY2017 to FY2022). 15
Federal Bureau of Investigation. Crime in the U.S.2015.

Virginia Crime and Arrest Trends, 2006-2015
39
drug and mental health issues to provide treatment, rather than punishment, when appropriate.
Throughout Virginia’s criminal justice system, data-driven decision making and evidence-based
practices are being adopted to ensure that criminal justice policies and practices are scientifically
based. New efforts are being made to divert juveniles from the justice system, including efforts to
keep juveniles in classrooms, not courtrooms. Training to increase professionalism in law
enforcement is being expanded. Correctional practices are being revised to increase the odds that
offenders released from jails and prisons will become productive citizens rather than returning to
the criminal justice system.
Virginia Crime and Arrest Trends, 2006-2015
40
Appendix
Notes on the data used in this report
Data in this report are from crimes and arrests reported by Virginia law enforcement agencies to
the Virginia State Police Uniform Crime Reports (UCR) data repository, which publishes an
annual Crime in Virginia report.
The crime and arrest figures in this report may differ slightly from those in Crime in Virginia. The
DCJS Research Center estimated some missing crime and arrest counts for the years 2000 – 2009
because during this time some law enforcement agencies reported incomplete data as they
transitioned from summary-based crime and arrest reporting to incident-based reporting. Crime in
Virginia contains crime and arrest reports to the Virginia State Police with any missing data noted,
but not estimated. Additionally, the UCR data repository may receive last-minute data updates
from the local agencies that are not available to the DCJS Research Center.
The following definitions are used for violent index crimes:
Murder/non-negligent manslaughter is the willful (non-negligent) killing of one human being
by another.
Rape is penetration, no matter how slight, of the vagina or anus with any body part or object,
or oral penetration by a sex organ of another person, without the consent of the victim, whether
or not force was used. Rape excludes statutory rape. (Note: The UCR redefined rape in 2013 to
include victims of additional types of violent sexual assault). Because this is a historical report,
the legacy definition of forcible rape is used throughout the report.
Robbery is the taking, or attempting to take, anything of value under confrontational
circumstances from the control, custody or care of another person by force or threat of force or
violence and/or by putting the victim in fear of immediate harm.
Aggravated assault is an unlawful attack by one person upon another where the offender uses a
weapon or displays it in a threatening manner, or the victim suffers obvious severe or
aggravated bodily injury involving apparent broken bones, loss of teeth, possible internal
injury, severe laceration, or loss of consciousness. This includes assault with disease.
The following definitions are used for property index crimes:
Burglary is the unlawful entry into a building or other structure with the intent to commit a
felony or a theft.
Larceny is the unlawful taking, carrying, leading or riding away of property from the
possession, or constructive possession, or another person.
Virginia Crime and Arrest Trends, 2006-2015
41
Motor vehicle theft is the theft of a self-propelled vehicle that runs on the surface of land and
not on rails. It includes automobiles, buses, recreational vehicles, trucks and other motor
vehicles, e.g., motorcycles, trail bikes, golf carts, snowmobiles and mopeds.
Crime rates used in this report are the number of crimes reported per 100,000 total (all ages)
population. Crimes rates are used to allow for comparisons between localities with different
population sizes.
Arrest rates used in this report are the number of arrests reported per 100,000 total arrest-age
population. The arrest age population is individuals ages 10 and older. Juvenile arrest rates are
calculated per the juvenile population ages 10 to 17, and adult arrest rates are calculated per the
adult population ages 18 and older. U.S. Census Bureau 7/1/2015 population estimates were used
to calculate all rates. For clarity, all crime and arrest counts are shown as whole numbers, and all
crime and arrest rates are shown as decimal numbers.
In this report, crimes and arrests reported by towns are included with those reported by the
surrounding county. The city of Bedford became a town effective July 1, 2013. For consistency,
the crimes and arrests reported by the former city of Bedford are included in the totals for Bedford
County for each year 2006 through 2015.