virginia department of criminal justice services · pretrial investigation ... planning phase ......
TRANSCRIPT

Virginia Department ofCriminal Justice Services
Marie VanNostrand, Ph.D.
Virginia Pretrial Risk AssessmentAdvisory Committee Members
Danielle Angel, Case ManagerHampton/Newport News Criminal Justice Agency
Anthony C. Casale, Program AdministratorVirginia Department of Criminal Justice Services
John Clark, Deputy DirectorPretrial Services Resource Center
Cyndi O. Davis, Pretrial OfficerHalifax/Pittsylvania Court Services
Michael L. Emmons, Pretrial SupervisorChesterfield Community Corrections & Pretrial Services
Amanda E. Hayes, Criminal Justice PlannerColonial Community Criminal Justice Board
Spurgeon Kennedy, Operations Deputy DirectorD.C. Pretrial Services Agency
Peter C. Kiers, Director of OperationsNew York City Criminal Justice Agency, Inc.
Rick Martin, Director of Community CorrectionsRappahannock Regional Jail
Margo B. Ray, Pretrial OfficerArlington Pretrial Services
Ken Rose, Program AnalystVirginia Department of Criminal Justice Services
Trina Willard, Evaluation Unit ChiefVirginia Department of Criminal Justice Services
Virginia Pretrial Risk AssessmentAdvisory Committee Consultants
Steven Cuvelier, Ph.D., Associate ProfessorSam Houston State University
Dennis Potts, Assistant DirectorHarris County Office of Court Services

Table of Contents
EXECUTIVE SUMMARY................................................ 1
INTRODUCTION ........................................................... 2
PRETRIAL RISK ASSESSMENT .................................... 3
RESEARCH METHODS ................................................. 4Sample ...................................................................... 4Measures .................................................................. 5Statistical Techniques ............................................ 5Analysis Methodology ............................................ 5Results ...................................................................... 6
INSTRUMENT DEVELOPMENT ................................... 7Point Assignment .................................................... 7Risk Scores ............................................................... 9Risk Levels .............................................................. 10Equitable Classification of Groups ..................... 11Community Types ................................................. 14Summary................................................................. 16
INSTRUMENT APPLICATION .................................... 17Pretrial Interview .................................................. 17Pretrial Investigation ............................................ 18PTCC Screening Tab .............................................. 19PTCC RA Instrument Tab ..................................... 19Instrument Completion ........................................ 21
FUTURE PLANS ........................................................... 22Planning Phase ...................................................... 22Pilot Testing Phase ................................................ 22Statewide Implementation ................................... 23Validation Phase .................................................... 23
BIBLIOGRAPHY .......................................................... 24
APPENDIX A ................................................................ 25
APPENDIX B ................................................................ 26
APPENDIX C ................................................................ 27
APPENDIX D ................................................................ 28
APPENDIX E ................................................................ 32
APPENDIX F ................................................................ 36
APPENDIX G ................................................................ 37
The Virginia Department of Criminal Justice Services extends its appreciation andgratitude for the contributions of each individual who participated in the develop-ment of the Virginia Pretrial Risk Assessment Instrument. The following individualsare to be commended for their insight, expertise, dedication, and assistance:
Lead ResearcherMarie VanNostrand
Advisory Committee MembersDanielle Angel
Anthony C. CasaleJohn Clark
Cyndi O. DavisMichael L. EmmonsAmanda E. Hayes
Spurgeon KennedyPeter C. KiersRick Martin
Margo B. RayKen Rose
Trina Willard
Advisory Committee ConsultantsSteven Cuvelier
Dennis Potts
Contributors
Dan CatleyCecil W. CollierTracy E. CostiganClyde E. CristmanMona J. E. DannerLance ForsytheJulie GoetzBeverly HarrisKevin HudsonDamita JacksonGail JohnsonBrian W. Kays
Tristan LeiterDavid LundyLinda MacklinWolfgang PindurStacey B. PlichtaStephanie PowersSteve SquireSorayal A. ThorneLloyd Young, Jr.Office of the Magistrate 6th, 8th, and15th Judicial Districts
Acknowledgements
The Virginia Department of Criminal Justice Services (DCJS) developed the Vir-ginia Pretrial Risk Assessment Instrument for use by pretrial services programsacross the Commonwealth of Virginia. Pretrial services programs’ primary respon-sibilities are to provide information to judicial officers (magistrates and judges)to assist them with the bail decision (to release or detain a defendant pendingtrial) and to provide supervision and services as ordered by a judicial officer.
The Virginia Pretrial Risk Assessment Instrument utilizes nine risk factors to clas-sify a defendant in one of five risk levels. The risk levels indicate the risk of failure(failure to appear for a scheduled court appearance or arrest for a new offense)for defendants pending trial. The risk factors include measures of criminal his-tory, residence, employment, and substance abuse. Consideration was given duringinstrument development to ensure the instrument was not biased toward anygroup based on sex, race, or income. In addition, the instrument was shown toequitably classify defendants regardless of the community type in which the ar-rest occurred, ensuring that the instrument can be effectively applied statewide.
The Virginia Pretrial Risk Assessment Instrument will be completed by pretrialservices staff and provided to judicial officers as part of the pretrial investigationreport. The instrument does not take into consideration the nature and circum-stance of the offense nor the weight of the evidence; two critical factors that mustbe considered when making the bail decision. It does, however, identify the levelof risk posed by defendants based on risk factors that measure criminal history,residence, employment, and substance abuse.
Providing the risk instrument to judicial officers to consider in addition to thenature and circumstances of the offense and the weight of the evidence will assistthem in making the bail decision such that: (1) “lower risk” defendants can besafely released into the community pending trial; (2) the risk of “moderate” and“higher” risk defendants can be minimized by utilizing appropriate release condi-tions, community resources, and/or interventions upon release; and (3) the“highest risk” defendants, those for whom no condition or combination of condi-tions can reasonably assure the safety of the community or appearance in court,can be detained pending trial.
Improved bail decisions provide substantial benefits to the defendants, the com-munity, and the criminal justice system including increased public safety,protection of the presumption of innocence, expeditious court case flow, effec-tive utilization of criminal justice and community resources, and a reduction inthe potential for disparity in bail decisions.
This report details the research conducted to develop the instrument and pro-vides instruction for instrument application.
1
Executive Summary
Introduction
The Virginia Department of Criminal Justice Services (DCJS) developed the VirginiaPretrial Risk Assessment Instrument to be used by pretrial services programsacross the Commonwealth of Virginia. The General Assembly mandated, as a partof the Pretrial Services Act, that the Virginia Department of Criminal Justice Ser-vices “…shall develop risk assessment and other instruments to be used by pretrialservices programs in assisting judicial officers in discharging their duties pursu-ant to Article 1 (§ 19.2–119 et seq.) of Chapter 9 of the Code of Virginia (Code ofVirginia § 19.2-152.3).” A pretrial risk assessment instrument is used to identify adefendant’s risk of failure (failure to appear for a scheduled court appearance orarrest for a new offense) if released pending trial.
Currently there are 30 pretrial services programs serving 80 of the 134 Virginialocalities (cities and counties). Pretrial services programs began operating in Vir-ginia on a small scale in the mid 1970s. By 1995, there were 14 programs in operationand, after the Pretrial Services Act became effective on July 1, 1995, the numberincreased to 24 programs. Pretrial services programs’ primary responsibilities areto provide information to judicial officers (magistrates and judges) to assist themwith the bail decision (to release or detain a defendant pending trial) and to pro-vide supervision and services as ordered by a judicial officer.
Pretrial services staff interview and investigate adult defendants held in custodyand charged with an offense and provide pretrial investigation reports to judicialofficers at the initial bail hearing, arraignment, and/or bail review hearing. Thepretrial investigation report provides information about a defendant, which in-cludes, but is not limited to, demographics, residence, employment, education,substance use, health, and criminal history-related information. The investigationincludes an interview with the defendant, verification of information when ap-propriate, and a thorough criminal history summary including records from theNational Criminal Information Center (NCIC), Virginia Criminal Information Network(VCIN), Department of Motor Vehicles (DMV), Virginia Court Automated Informa-tion System (CAIS), and local police records.
The pretrial investigation report and other services provided by pretrial servicesprograms were developed to meet the intent of the Pretrial Services Act. As out-lined in the Code of Virginia § 19.2–152.2 “Such programs are intended to providebetter information and services for use by judicial officers in determining the riskto public safety and the assurance of appearance of persons held in custody andcharged with an offense, other than an offense punishable by death, who are pend-ing trial or hearing.” In addition to the information provided in the pretrialinvestigation report, pretrial services staff often make a bail recommendation tothe judicial officer. The recommendation is made based on information containedin the pretrial investigation report and the professional experience of the staffmaking the recommendation.
Prior to the development of the Virginia Pretrial Risk Assessment Instrument, nostandardized risk assessment instrument existed to assist pretrial services staff inidentifying defendant potential for failure if released pending trial. Utilizing a stan-dardized, objective, research-based instrument will aid pretrial services programsin their duty to provide information and services to judicial officers. This report,Assessing Risk Among Pretrial Defendants in Virginia: The Virginia Pretrial RiskAssessment Instrument, presents the Virginia Department of Criminal Justice Ser-vices’ response to the mandate contained in the Pretrial Services Act.
2

3
Pretrial Risk Assessment
The development of a pretrial risk assessment instrument requires the use ofhistorical data to identify risk factors and their relationship to pretrial failure.The information is then used to develop an instrument to identify risk levels fordefendants pending trial.
The Virginia Pretrial Risk Assessment Instrument will be incorporated into thepretrial investigation report and serve as a tool for pretrial services staff to im-prove the determination of a defendant’s risk level and to support the bailrecommendation. The risk instrument is provided to judicial officers to considerin addition to the nature and circumstances of the offense and the weight of theevidence to assist them in making the bail decision such that: (1) “lower risk”defendants can be safely released into the community pending trial; (2) the riskof “moderate” and “higher” risk defendants can be minimized by utilizing appro-priate release conditions, community resources, and/or interventions uponrelease; and (3) the “highest risk” defendants, those for whom no condition orcombination of conditions can reasonably assure the safety of the community orappearance in court, can be detained pending trial.
Improved bail decisions provide substantial benefits to the defendants, commu-nity, and the criminal justice system, including:
1. increased public safety,
2. protection of the presumption of innocence,
3. expeditious court case processing,
4. efficiently managed jail space,
5. effective utilization of criminal justice and community resources (i.e., courts,prosecutors, jail staff, police, community supervision, and substance abuseand mental health services), and
6. reduction in the potential for disparity in bail decisions by providing an objec-tive and standardized tool to assist judicial officers in the bail decision-makingprocess.
This report details the process followed by the Virginia Department of CriminalJustice Services to identify pretrial risk factors and their relationship to pretrialfailure and to develop the Virginia Pretrial Risk Assessment Instrument.
After reviewing existing data from local pretrial services programs it was deter-mined that the information necessary for analysis was either not standardized ornot available. Due to a lack of appropriate data, DCJS began collecting data foranalysis in July 1998.
SampleA dataset was developed that contains data from a sample of defendants arrestedin select Virginia localities between July 1, 1998 and June 30, 1999. The defen-dants were arrested in one of seven localities: Hampton, Fredericksburg,Spotsylvania, Emporia, Brunswick, Sussex, and Greensville. The localities includedin the dataset varied substantially in community characteristics including: com-munity type (urban, rural, and suburban); number of persons, households, andfamilies; sex; race; median family income; percentage of people below povertylevel; and education level (see Appendix A).
Data were collected from a number of sources including those listed below.
1. Personal interviews were conducted with defendants, either face-to-face or byvideo teleconference, after arrest and prior to the initial bail hearing with ajudicial officer.
2. Arrest warrants, criminal history records (i.e., National Criminal InformationCenter [NCIC], Virginia Criminal Information Network [VCIN], Department ofMotor Vehicles [DMV], Virginia Court Automated Information System [CAIS],local police records), and court records were reviewed.
3. References provided by the defendant were contacted to verify information.
4. Current and prior adult criminal justice supervision records were consultedas needed.
The cases were tracked until final disposition through the use of court and otherofficial records to determine the pretrial outcome (success or failure).
Because it was financially prohibitive to interview every defendant arrested dur-ing the year, a sampling procedure was used to account for variances in arrest dueto time of day, day of week, month, and season. A data collection schedule wasfollowed that collected data through defendant interviews and official records in48-hour increments, rotating days of the week throughout the year (see AppendixB). The defendants included in the dataset were adults (18 years or older or juve-niles previously certified as adults by the Court) arrested for one or more jailableoffense(s) (Class I and II misdemeanors, unclassified misdemeanors that carry apenalty of jail time, and all felonies).
The sampling procedure resulted in an original sample of 2,348 cases from allseven localities. The following cases were removed from the original sample:
➣ 355 Cases (15%)—never released pending trial
➣ 21 Cases (< 1%)—remained in pretrial status 10 months after the data collec-tion period ended
➣ 1 Case (< 1%)—died prior to trial
This resulted in a final sample of 1,971 cases (84%).
Research Methods
4
MeasuresAppendix C contains the variables and their corresponding values used for analy-sis. There are 50 variables classified as independent variables, which have beenclustered into the following groups: demographics, health, community and gen-eral stability, and criminal history. The variables are measures of the following:demographic characteristics, physical and mental health, substance abuse, resi-dence, transportation, employment and school status, income, the charge(s)against the defendant, and criminal history. Pretrial outcome, defined as successor failure pending trial, is the single dependent variable. A defendant was classi-fied as a “failure” pending trial if he failed to appear for a scheduled courtappearance or was arrested for a new offense pending trial. If neither of theseevents occurred the defendant was classified as a “success.” The variables are acomprehensive representation of potential predictors of pretrial outcome basedon previous pretrial risk assessment research.1
Statistical TechniquesThe dependent variable “pretrial outcome,” success or failure pending trial, isnominal and dichotomous. The independent variables range in measurement andinclude nominal, ordinal, and ratio-level data. Descriptive statistics were com-pleted for all variables and included frequencies or mean, standard deviation,median, and range, when appropriate. Any independent variables with a smalldegree of variance, 95% or more of the cases producing the same response, wereomitted from further analysis. The bivariate statistics used were Chi-Square fornominal and ordinal-level variables and Mann-Whitney U for all ratio-level vari-ables due to their non-normal distributions. The measure of association used toassess the strength of the relationships for the nominal-level variables was thePhi (φ) coefficient. Gamma (γ) was used as the measure of association for theordinal-level variables. The multivariate test used was Binary Logistic Regres-sion. Regression is the preferred tool when the goal of the research is to predictan outcome, as is the case here. Binary Logistic Regression is the most appropri-ate multivariate technique because the outcome, or dependent variable, isdichotomous.2
Analysis MethodologyThe bivariate analysis was completed to identify the statistically significant vari-ables (risk factors) related to pretrial outcome (success or failure pending trial)and the strength of the relationship between the dependent variable and eachindependent variable.
The results of the bivariate analyses were used to build a Binary Logistic Regres-sion model. Guided by the bivariate results, the model was built using a hierarchicalapproach by entering the statistically significant variables within a block of vari-ables in the following order: criminal history, community and general stability,health, and demographics. The hierarchical method of variable entry allows the
5
1 See the bibliography for publications related to previous research identifying pretrial risk factors andfor similar pretrial risk assessment research studies.
2 Grimm & Yarnold (1995)

researcher to control the order of entry of variables based on the bivariate analy-sis and previous research.3 It also allows the researcher to interpret the impact ofa block of related variables on the outcome.
The final model was guided by the Nagelkerke pseudo R2, Chi-Square (χ2) results forthe model and blocks, Hosmer and Lemeshow Goodness of Fit test, odds ratiosassociated with the independent variables (eB), the percentage of correct predic-tions (sensitivity and specificity), and the impact of the model on select groups.
ResultsThe data analysis for this research included descriptive statistics, bivariate sta-tistics, and the multivariate technique of Binary Logistic Regression. Appendix Dcontains the results of the descriptive statistics and Appendix E contains theresults of the bivariate statistics. These techniques were used to determine thecombination of risk factors that are the best predictors of pretrial failure. TheBinary Logistic Regression model can be found in Appendix F. This model identi-fied the following nine risk factors to be the best predictors of pretrial failure:
1. Charge Type—Defendants charged with a felony were more likely to fail pend-ing trial than defendants charged with a misdemeanor.
2. Pending Charge(s)—Defendants who had pending charge(s) at the time of theirarrest were more likely to fail pending trial.
3. Outstanding Warrant(s)—Defendants who had outstanding warrant(s) in an-other locality for charges unrelated to the current arrest were more likely to failpending trial.
4. Criminal History—Defendants with at least one prior misdemeanor or felonyconviction were more likely to fail pending trial.
5. Two or more Failure to Appear Convictions—Defendants with two or morefailure to appear convictions were more likely to fail pending trial.
6. Two or more Violent Convictions—Defendants with two or more violent con-victions were more likely to fail pending trial.
7. Length at Current Residence— Defendants who had lived at their current resi-dence for less than one year were more likely to fail pending trial.
8. Employed/Primary Child Caregiver—Defendants who had not been employedcontinuously at one or more jobs during the two years prior to their arrest orwho were not the primary caregiver for a child at the time of their arrest weremore likely to fail pending trial.
9. History of Drug Abuse—Defendants with a history of drug abuse were morelikely to fail pending trial.
The first six factors are measures of criminal history. The remaining factors aremeasures of residence, employment/primary child caregiver, and substance abuse.
6
3 See the bibliography for publications related to previous research identifying pretrial risk factors andfor similar pretrial risk assessment research studies.
The results of the Binary Logistic Regression model were used to develop theVirginia Pretrial Risk Assessment Instrument. Logistic Regression calculates therelationship between a set of independent variables (risk factors) and one depen-dent variable (pretrial outcome). The unique contribution of each risk factor isexpressed as a Logistic Regression coefficient, which provides the informationnecessary to construct point values for each risk factor.
Point AssignmentTransformation of coefficients into point scores was completed by following theprocedure outlined below.
1. The smallest significant coefficient was identified.
2. A score was computed that transformed the smallest coefficient to a score of0.500.
3. The transformation was applied to all coefficients, which were then roundedto the nearest whole number.
Despite the use of rounding to simplify scoring, repeated tests have shown thatthe resulting accuracy of the point scores lose only modest degrees of accuracy(less than 5%) when compared with applying the exact values produced by Logis-tic Regression. This accommodation makes the instrument calculation easier tounderstand and calculate by hand. Migrating the assessment instrument to aninformation system could improve predictions marginally and reduce the inci-dence of human error.
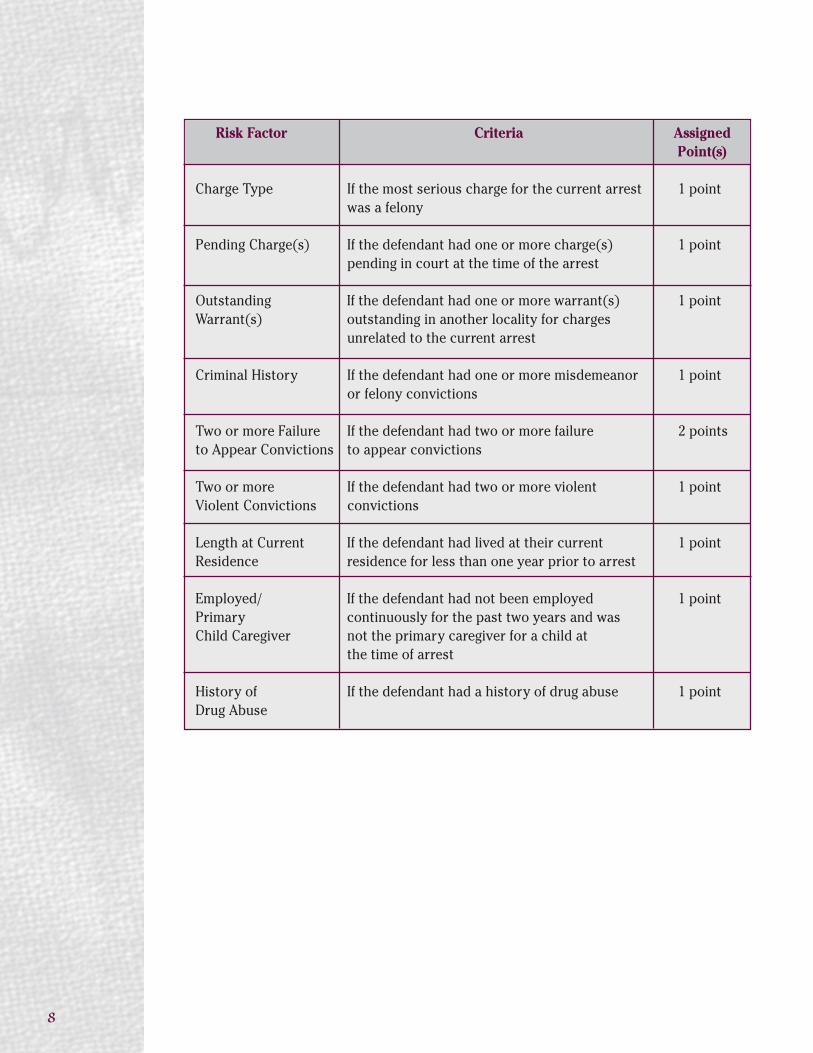
As a result of the transformation procedure, point values were assigned to eachrisk factor as demonstrated in the chart on the following page.
Instrument Development
7
8
Risk Factor Criteria AssignedPoint(s)
Charge Type If the most serious charge for the current arrest 1 pointwas a felony
Pending Charge(s) If the defendant had one or more charge(s) 1 pointpending in court at the time of the arrest
Outstanding If the defendant had one or more warrant(s) 1 pointWarrant(s) outstanding in another locality for charges
unrelated to the current arrest
Criminal History If the defendant had one or more misdemeanor 1 pointor felony convictions
Two or more Failure If the defendant had two or more failure 2 pointsto Appear Convictions to appear convictions
Two or more If the defendant had two or more violent 1 pointViolent Convictions convictions
Length at Current If the defendant had lived at their current 1 pointResidence residence for less than one year prior to arrest
Employed/ If the defendant had not been employed 1 pointPrimary continuously for the past two years and wasChild Caregiver not the primary caregiver for a child at
the time of arrest
History of If the defendant had a history of drug abuse 1 pointDrug Abuse
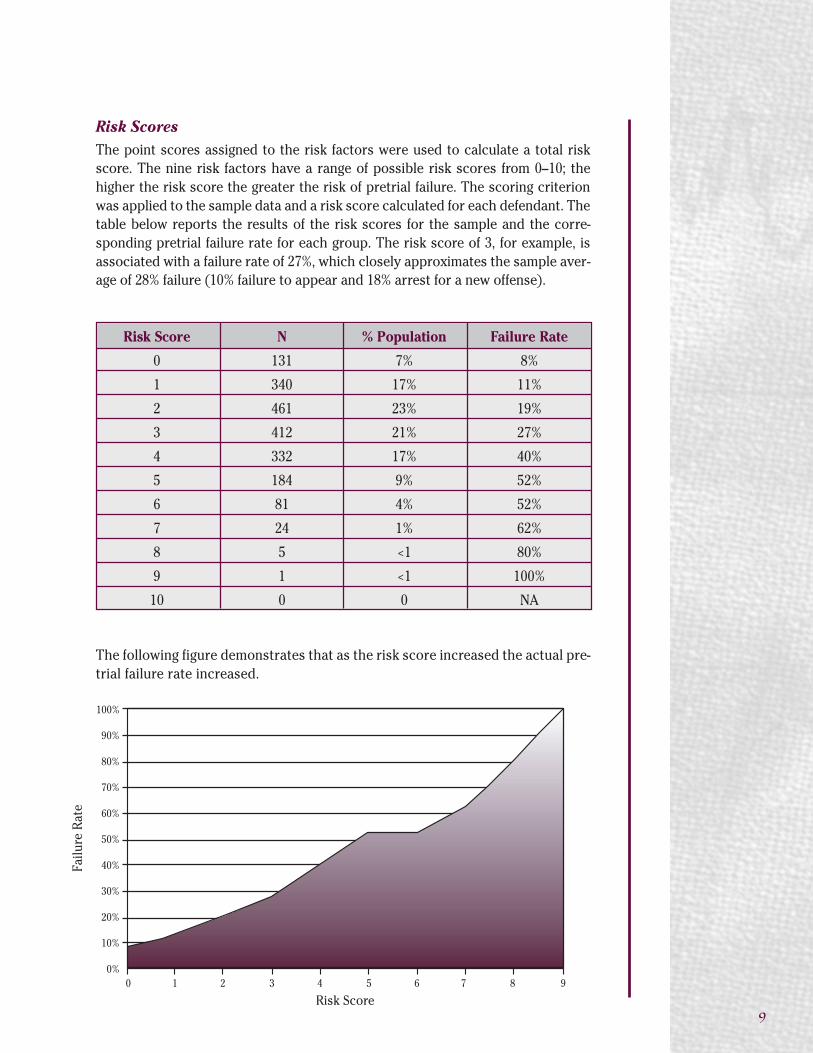
Risk ScoresThe point scores assigned to the risk factors were used to calculate a total riskscore. The nine risk factors have a range of possible risk scores from 0–10; thehigher the risk score the greater the risk of pretrial failure. The scoring criterionwas applied to the sample data and a risk score calculated for each defendant. Thetable below reports the results of the risk scores for the sample and the corre-sponding pretrial failure rate for each group. The risk score of 3, for example, isassociated with a failure rate of 27%, which closely approximates the sample aver-age of 28% failure (10% failure to appear and 18% arrest for a new offense).
Risk Score N % Population Failure Rate
0 131 7% 8%
1 340 17% 11%
2 461 23% 19%
3 412 21% 27%
4 332 17% 40%
5 184 9% 52%
6 81 4% 52%
7 24 1% 62%
8 5 <1 80%
9 1 <1 100%
10 0 0 NA
The following figure demonstrates that as the risk score increased the actual pre-trial failure rate increased.
9
100%
90%
80%
70%
60%
50%
40%
30%
20%
10%
0%
Failu
re R
ate
0 1 2 3 4 5 6 7 8 9
Risk Score
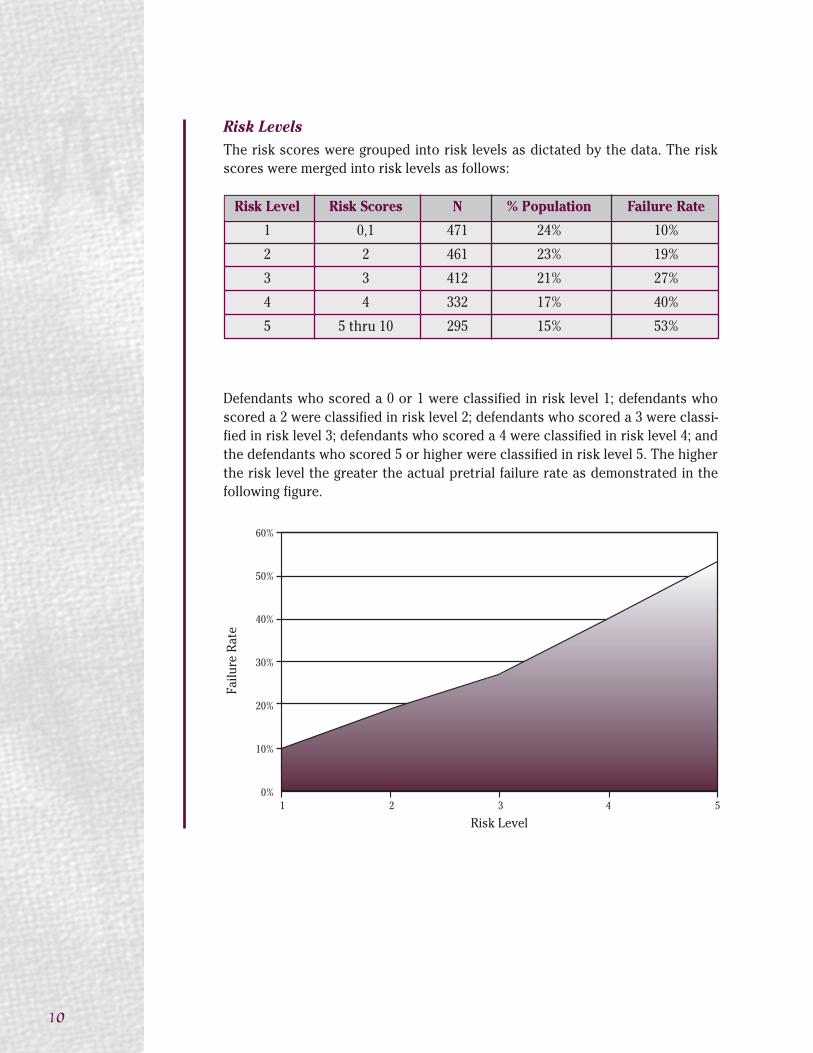
Risk LevelsThe risk scores were grouped into risk levels as dictated by the data. The riskscores were merged into risk levels as follows:
Risk Level Risk Scores N % Population Failure Rate
1 0,1 471 24% 10%
2 2 461 23% 19%
3 3 412 21% 27%
4 4 332 17% 40%
5 5 thru 10 295 15% 53%
10
Defendants who scored a 0 or 1 were classified in risk level 1; defendants whoscored a 2 were classified in risk level 2; defendants who scored a 3 were classi-fied in risk level 3; defendants who scored a 4 were classified in risk level 4; andthe defendants who scored 5 or higher were classified in risk level 5. The higherthe risk level the greater the actual pretrial failure rate as demonstrated in thefollowing figure.
60%
50%
40%
30%
20%
10%
0%
Failu
re R
ate
1 2 3 4 5
Risk Level
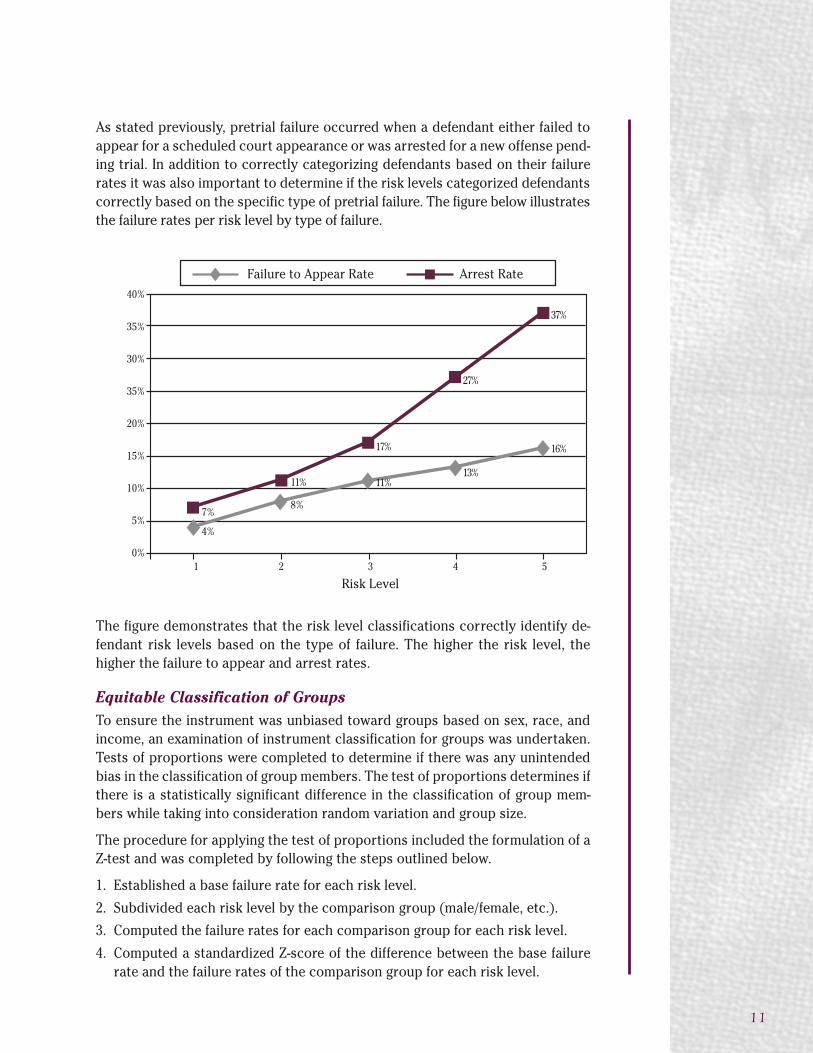
As stated previously, pretrial failure occurred when a defendant either failed toappear for a scheduled court appearance or was arrested for a new offense pend-ing trial. In addition to correctly categorizing defendants based on their failurerates it was also important to determine if the risk levels categorized defendantscorrectly based on the specific type of pretrial failure. The figure below illustratesthe failure rates per risk level by type of failure.
11
The figure demonstrates that the risk level classifications correctly identify de-fendant risk levels based on the type of failure. The higher the risk level, thehigher the failure to appear and arrest rates.
Equitable Classification of GroupsTo ensure the instrument was unbiased toward groups based on sex, race, andincome, an examination of instrument classification for groups was undertaken.Tests of proportions were completed to determine if there was any unintendedbias in the classification of group members. The test of proportions determines ifthere is a statistically significant difference in the classification of group mem-bers while taking into consideration random variation and group size.
The procedure for applying the test of proportions included the formulation of aZ-test and was completed by following the steps outlined below.
1. Established a base failure rate for each risk level.
2. Subdivided each risk level by the comparison group (male/female, etc.).
3. Computed the failure rates for each comparison group for each risk level.
4. Computed a standardized Z-score of the difference between the base failurerate and the failure rates of the comparison group for each risk level.
40%
35%
30%
35%
20%
15%
10%
5%
0%
Failure to Appear Rate
1 2 3 4 5
Risk Level
Arrest Rate
7%
4%
11%
8%
17%
11%
27%
13%
37%
16%
The Z-score is used to determine if the observed differences in groups are statis-tically significant (not due to chance). Z-scores that fall beyond plus or minus1.96 are statistically significant. A result such as this would indicate inequitabletreatment of a particular group.
The test of proportions was first applied to defendants based on their sex. Theresults are contained in the following tables.
Male Defendants
Risk Level Base Failure Rate N=1547 Comp. Group Failure Rate Z Score
1 10% 346 12% 0.287
2 19% 330 21% 0.390
3 27% 332 27% -0.132
4 40% 277 42% 0.382
5 53% 262 54% 0.142
*Statistically significant at +/- 1.96
Female Defendants
Risk Level Base Failure Rate N=424 Comp. Group Failure Rate Z Score
1 10% 125 6% -0.463
2 19% 131 15% -0.594
3 27% 80 30% 0.275
4 40% 55 31% -0.790
5 53% 33 48% -0.379
*Statistically significant at +/- 1.96
There was no statistically significant difference in classification based on sex;therefore, it was concluded that the instrument equitably classified both malesand females.
12
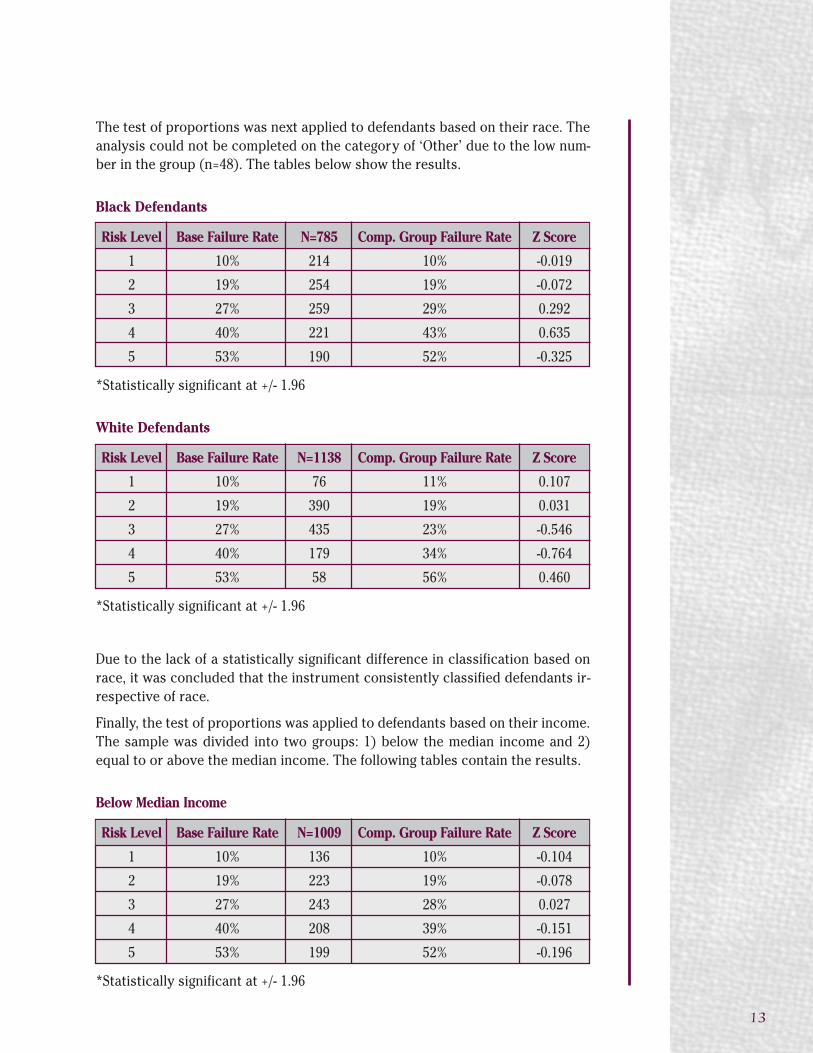
The test of proportions was next applied to defendants based on their race. Theanalysis could not be completed on the category of ‘Other’ due to the low num-ber in the group (n=48). The tables below show the results.
Black Defendants
Risk Level Base Failure Rate N=785 Comp. Group Failure Rate Z Score
1 10% 214 10% -0.019
2 19% 254 19% -0.072
3 27% 259 29% 0.292
4 40% 221 43% 0.635
5 53% 190 52% -0.325
*Statistically significant at +/- 1.96
White Defendants
Risk Level Base Failure Rate N=1138 Comp. Group Failure Rate Z Score
1 10% 76 11% 0.107
2 19% 390 19% 0.031
3 27% 435 23% -0.546
4 40% 179 34% -0.764
5 53% 58 56% 0.460
*Statistically significant at +/- 1.96
Due to the lack of a statistically significant difference in classification based onrace, it was concluded that the instrument consistently classified defendants ir-respective of race.
Finally, the test of proportions was applied to defendants based on their income.The sample was divided into two groups: 1) below the median income and 2)equal to or above the median income. The following tables contain the results.
Below Median Income
Risk Level Base Failure Rate N=1009 Comp. Group Failure Rate Z Score
1 10% 136 10% -0.104
2 19% 223 19% -0.078
3 27% 243 28% 0.027
4 40% 208 39% -0.151
5 53% 199 52% -0.196
*Statistically significant at +/- 1.96
13

14
Equal or Above Median Income
Risk Level Base Failure Rate N=962 Comp. Group Failure Rate Z Score
1 10% 335 11% 0.066
2 19% 238 20% 0.076
3 27% 169 27% -0.032
4 40% 124 41% 0.199
5 53% 96 55% 0.291
*Statistically significant at +/- 1.96
Again, there was no statistically significant difference in classification found be-tween defendants who were 1) below or 2) equal to or above the median income.
The results of the test of proportions provide confidence that the instrumentproduced unbiased classifications of risk across sex, race, and income groups.
Community TypesThe Commonwealth of Virginia consists of varying community types. The sampleused for analysis consisted of data from seven localities representing four com-munity types: large urban, small urban, rural, and mixed. For the purposes of thisresearch, community type was defined as the community type in which the de-fendant was arrested. Because this instrument will be used statewide, the test ofproportions was applied to each community type to identify any statistically sig-nificant difference in classification based on the arresting community type. Theresults of the tests are contained in the following tables.
Large Urban Community Type
Risk Level Base Failure Rate N=1050 Comp. Group Failure Rate Z Score
1 10% 219 10% -0.056
2 19% 224 22% 0.512
3 27% 166 31% 0.714
4 40% 146 38% -0.390
5 53% 121 48% -1.063
*Statistically significant at +/- 1.96
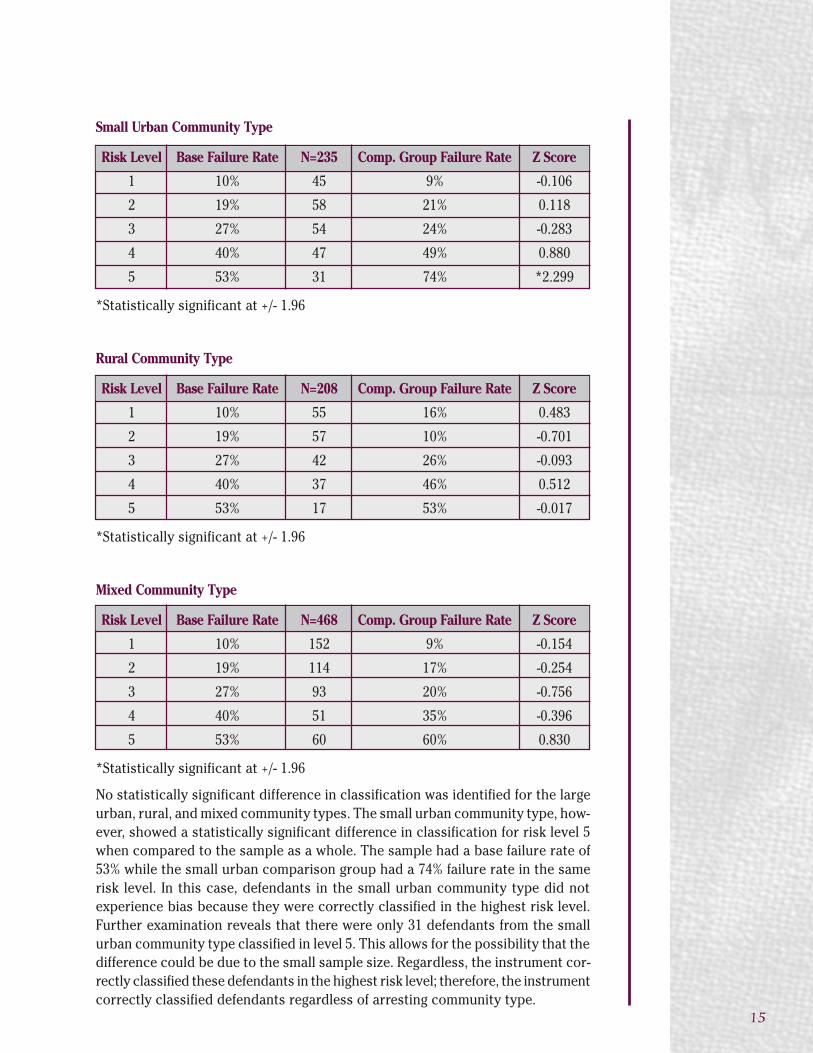
Small Urban Community Type
Risk Level Base Failure Rate N=235 Comp. Group Failure Rate Z Score
1 10% 45 9% -0.106
2 19% 58 21% 0.118
3 27% 54 24% -0.283
4 40% 47 49% 0.880
5 53% 31 74% *2.299
*Statistically significant at +/- 1.96
Rural Community Type
Risk Level Base Failure Rate N=208 Comp. Group Failure Rate Z Score
1 10% 55 16% 0.483
2 19% 57 10% -0.701
3 27% 42 26% -0.093
4 40% 37 46% 0.512
5 53% 17 53% -0.017
*Statistically significant at +/- 1.96
Mixed Community Type
Risk Level Base Failure Rate N=468 Comp. Group Failure Rate Z Score
1 10% 152 9% -0.154
2 19% 114 17% -0.254
3 27% 93 20% -0.756
4 40% 51 35% -0.396
5 53% 60 60% 0.830
*Statistically significant at +/- 1.96
No statistically significant difference in classification was identified for the largeurban, rural, and mixed community types. The small urban community type, how-ever, showed a statistically significant difference in classification for risk level 5when compared to the sample as a whole. The sample had a base failure rate of53% while the small urban comparison group had a 74% failure rate in the samerisk level. In this case, defendants in the small urban community type did notexperience bias because they were correctly classified in the highest risk level.Further examination reveals that there were only 31 defendants from the smallurban community type classified in level 5. This allows for the possibility that thedifference could be due to the small sample size. Regardless, the instrument cor-rectly classified these defendants in the highest risk level; therefore, the instrumentcorrectly classified defendants regardless of arresting community type.
15
SummaryThe Virginia Pretrial Risk Assessment Instrument was developed using nine riskfactors identified as the best predictors of pretrial failure. The risk factors wereidentified through a Binary Logistic Regression model and include measures ofcriminal history, residence, employment/primary child caregiver, and substanceabuse. The risk factors were assigned point scores based on the transformationof regression coefficients. The point scores were added to calculate a total riskscore with a range of 0–10. The risk scores were then merged into 5 risk levelswith corresponding failure rates.
Risk levels range from 1-5; the higher the risk level the greater the failure rate.The instrument was determined to have correctly classified defendants based onthe type of failure—failure to appear for a scheduled court appearance and arrestfor a new offense pending trial.
Additional steps were taken to determine if the instrument produced any unin-tended bias in the classification of group members based on sex, race, or income.Tests of proportions were completed to identify any statistically significant dif-ferences in the classification of group members. No differences were found,therefore, it was concluded that the instrument equitably classified defendantsregardless of sex, race, or income.
The test of proportions was also used to determine if the instrument was biasedbased on the community type in which the defendant was arrested. The resultsdemonstrated that defendants were equitably classified regardless of arrestingcommunity type.
The Virginia Pretrial Risk Assessment Instrument utilizes nine risk factors to clas-sify defendants into one of five levels of risk. The instrument is an accuratepredictor of pretrial failure; including both failure to appear and arrest for a newoffense pending trial. The instrument has been proven to classify defendantsequitably regardless of sex, race, income, or the arresting community type.
16

The Virginia Pretrial Risk Assessment Instrument is automated and integratedinto the Pretrial and Community Corrections Case Management System (PTCC).PTCC is a case management and information system utilized by pretrial servicesprograms statewide to track pretrial screenings, investigations, referrals to pretrialsupervision, and defendant supervision activity. Appendix G contains a sampleof the instrument. The PTCC generated instrument will vary slightly in appear-ance. The instrument is a part of the pretrial investigation report. A thoroughinterview and investigation must be completed before the instrument can be gen-erated and incorporated into the pretrial investigation report.
Pretrial InterviewDuring the pretrial interview the defendant must be asked, at a minimum, abouthis current and past employments, status as a primary child caregiver, currentand past residences, prior drug use, and adult criminal history.
Employment/Primary Child Caregiver
The defendant must provide current and previous employment information withcorresponding length of time at each employment. For risk assessment purposesit is crucial to gather employment history for the previous two years and to iden-tify any gaps in employment during that time. In addition, the defendant must beasked if he or she was a primary child caregiver at the time of the arrest.
Residence
The defendant must provide current and previous residence information withcorresponding length of time at each residence. For risk assessment purposes itis imperative that the residence history include the past two years.
Drug Use
The defendant must be asked about all prior drug use. For the purposes of riskassessment, drug use does not include alcohol, which is documented separately,but does include the use of any illegal or prescription drugs.
Criminal History
The defendant must be asked about any charges pending in an adult criminal ortraffic (not civil) court, any outstanding warrants in another jurisdiction that havenot been served, and any adult criminal convictions. This information will beused to complete the criminal history investigation and summary.
Collection of information from the defendant during the interview relating to em-ployment, primary child caregiver status, residence, drug use, and criminal historyis critical to completing the risk factors in the instrument. Responses to risk fac-tors are determined by pretrial staff based on an analysis of the informationgathered during the interview and investigation and are not intended as ques-tions to be directed to the defendant.
Instrument Application
17
Pretrial InvestigationOnce an interview has been completed, the residence, employment, and primarychild caregiver information must be verified, as well as additional informationgathered, as a part of the pretrial investigation.
Employment, Primary Child Caregiver and Residence
All attempts must be made to verify information provided by the defendant regard-ing residence, employment, and primary child caregiver status. The primarymechanism for verification of this information is through references provided bythe defendant. References usually include family members, friends, employers,or other people who have knowledge of the defendant.
Additional sources can be utilized during a pretrial investigation to verify infor-mation and include current and prior supervision activity for the defendant suchas pretrial, probation, alcohol safety action program, and other types of formaladult criminal justice supervision. These records can be good sources of infor-mation to verify residence, employment, and primary child caregiver status relatedinformation.
Drug Use
Information about a defendant’s drug use is never to be discussed with refer-ences. Any unsolicited information regarding drug use provided by a referenceshould be documented as part of the pretrial investigation.
The additional supervision sources described above can be utilized to verify infor-mation regarding prior drug use. Adult supervision records may include resultsof urinalysis as well as self-reported information provided by the defendant whileunder supervision.
Criminal History
A pretrial investigation includes a thorough criminal history check and requireschecks of the National Criminal Information Center (NCIC), Virginia CriminalInformation Network (VCIN), Department of Motor Vehicles (DMV), and VirginiaCourt Automated Information System (CAIS). Local police records can also beconsulted when appropriate. Criminal history information provided by the defen-dant that is not found on the NCIC, VCIN, or DMV records should be trackedthrough CAIS or other methods when possible.
It is imperative that the status or final outcome be found for charges that arelisted in a defendant’s criminal record without a final disposition. CAIS, local po-lice records, pretrial staff in other localities, and court clerks are all potentialresources for determining charge dispositions. An emphasis should be placed ondetermining dispositions for all failure to appear and violent charges as well ascharges that appear likely to be pending in court.
Once the criminal record check is complete, a criminal history summary detail-ing all outstanding warrants, pending charges and adult criminal convictions forthe defendant is prepared as a part of the pretrial investigation report.
18
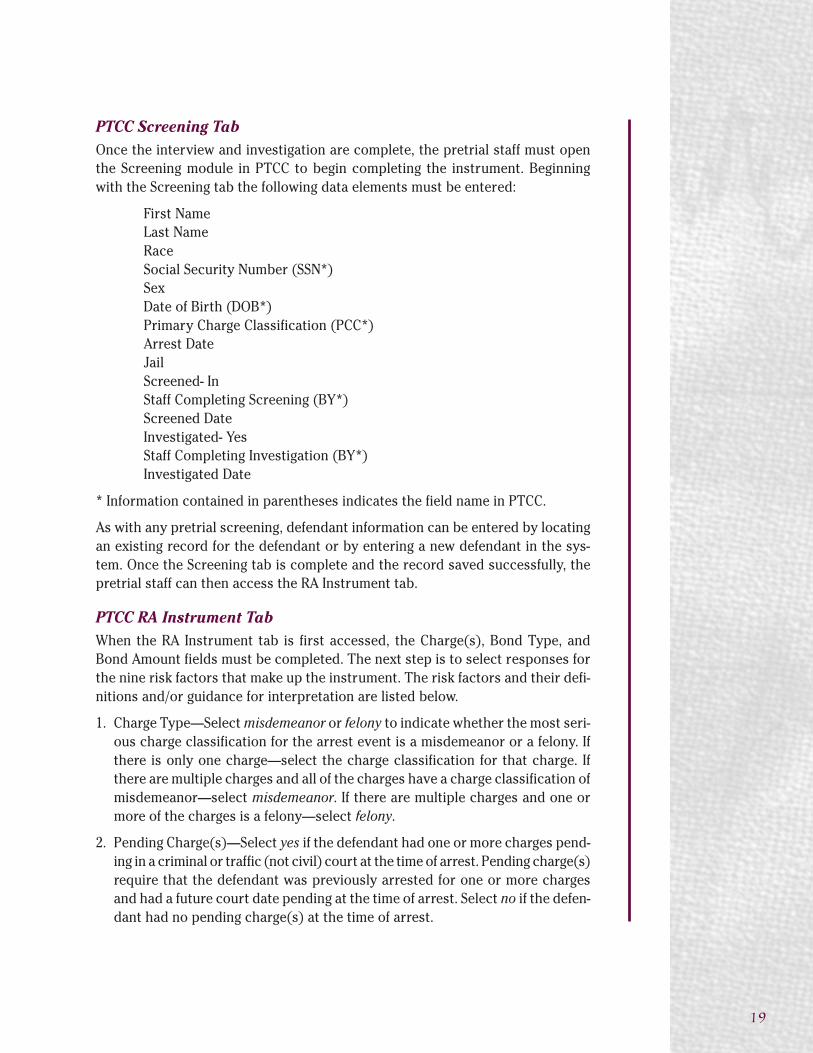
PTCC Screening TabOnce the interview and investigation are complete, the pretrial staff must openthe Screening module in PTCC to begin completing the instrument. Beginningwith the Screening tab the following data elements must be entered:
First NameLast NameRaceSocial Security Number (SSN*)SexDate of Birth (DOB*)Primary Charge Classification (PCC*)Arrest DateJailScreened- InStaff Completing Screening (BY*)Screened DateInvestigated- YesStaff Completing Investigation (BY*)Investigated Date
* Information contained in parentheses indicates the field name in PTCC.
As with any pretrial screening, defendant information can be entered by locatingan existing record for the defendant or by entering a new defendant in the sys-tem. Once the Screening tab is complete and the record saved successfully, thepretrial staff can then access the RA Instrument tab.
PTCC RA Instrument TabWhen the RA Instrument tab is first accessed, the Charge(s), Bond Type, andBond Amount fields must be completed. The next step is to select responses forthe nine risk factors that make up the instrument. The risk factors and their defi-nitions and/or guidance for interpretation are listed below.
1. Charge Type—Select misdemeanor or felony to indicate whether the most seri-ous charge classification for the arrest event is a misdemeanor or a felony. Ifthere is only one charge—select the charge classification for that charge. Ifthere are multiple charges and all of the charges have a charge classification ofmisdemeanor—select misdemeanor. If there are multiple charges and one ormore of the charges is a felony—select felony.
2. Pending Charge(s)—Select yes if the defendant had one or more charges pend-ing in a criminal or traffic (not civil) court at the time of arrest. Pending charge(s)require that the defendant was previously arrested for one or more chargesand had a future court date pending at the time of arrest. Select no if the defen-dant had no pending charge(s) at the time of arrest.
19

3. Outstanding Warrant(s)—Select yes if, at the time of the arrest, the defendanthad one or more warrant(s) outstanding in another locality for charges unre-lated to the current arrest. Outstanding warrants include warrants that havenot been served on the defendant and, therefore, do not have a future courtdate. Select no if the defendant did not have any outstanding warrant(s) at thetime of arrest.
4. Criminal History—Select yes if the defendant has at least one adult misdemeanoror felony conviction in the past. Select no if the defendant does not have anymisdemeanor or felony conviction(s) in the past.
5. Two or more Failure to Appear Convictions—Select yes if the defendant hastwo or more prior failure to appear convictions as an adult. Select no if thedefendant does not have two or more failure to appear convictions.
6. Two or more Violent Convictions—Select yes if the defendant has two or moreprior violent convictions as an adult. Select no if the defendant does not havetwo or more prior violent convictions. Violent convictions are defined in theCode of Virginia and include murder, rape, robbery, sex offenses, sexual as-sault, assault, and kidnapping. Both misdemeanor and felony assaults arecounted as violent convictions.
7. Length at Current Residence—Select less than one year or one year or more toindicate the length of time the defendant has lived at his current residence.Select less than one year if the defendant has lived at his residence less thanone year, is homeless, or does not have a stable residence. Select yes or no toindicate whether the residence information was verified by a reference or othersecondary source.
8. Employed/Primary Child Caregiver—Select yes if the defendant has been em-ployed continuously at one or more jobs during the two years prior to thearrest. Select yes if the defendant was a primary child caregiver at the time ofthe arrest. Select no if the defendant was unemployed at the time of the arrestor had a gap in employment over the two years prior to the arrest and was nota primary child caregiver at the time of arrest. Employment includes part orfull time as long as the defendant worked regularly and consistently for a mini-mum of 20 hours per week. A defendant is considered a primary child caregiverif he or she is responsible for, and consistently cares for, at least one depen-dent child (under the age of 18), living with the defendant at the time of thearrest. Select yes or no to indicate whether the employed/primary childcaregiver information was verified by a reference or other secondary source.
20
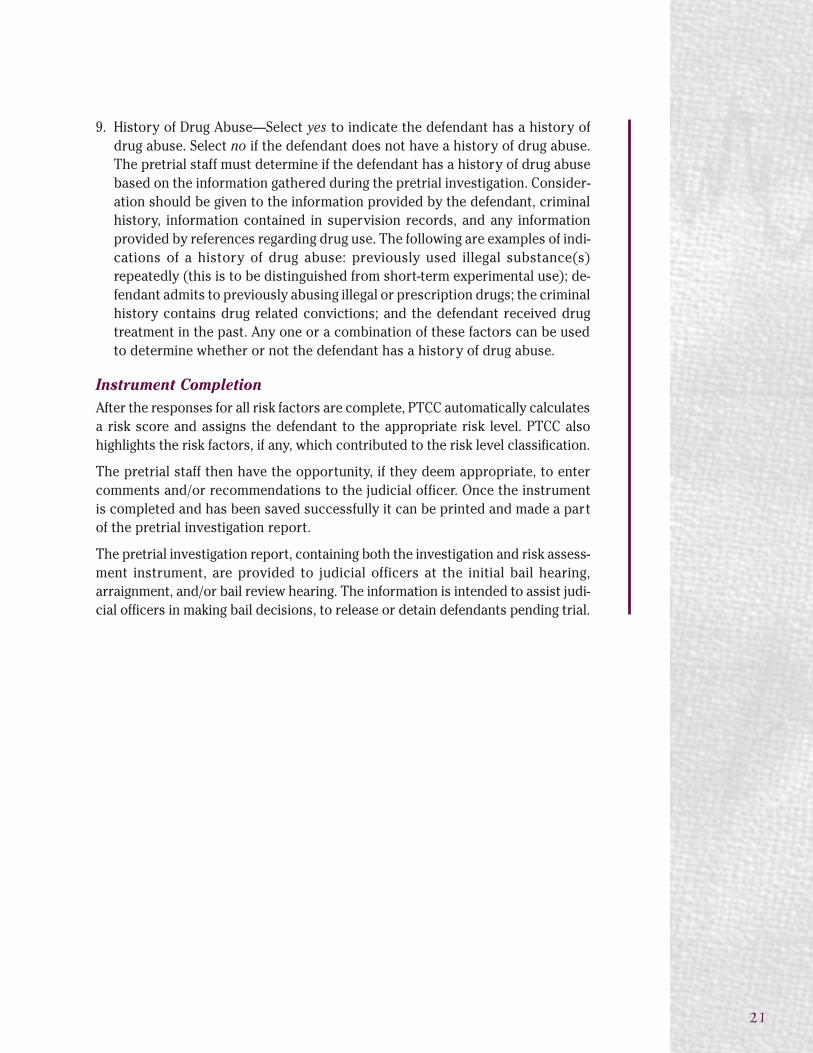
9. History of Drug Abuse—Select yes to indicate the defendant has a history ofdrug abuse. Select no if the defendant does not have a history of drug abuse.The pretrial staff must determine if the defendant has a history of drug abusebased on the information gathered during the pretrial investigation. Consider-ation should be given to the information provided by the defendant, criminalhistory, information contained in supervision records, and any informationprovided by references regarding drug use. The following are examples of indi-cations of a history of drug abuse: previously used illegal substance(s)repeatedly (this is to be distinguished from short-term experimental use); de-fendant admits to previously abusing illegal or prescription drugs; the criminalhistory contains drug related convictions; and the defendant received drugtreatment in the past. Any one or a combination of these factors can be usedto determine whether or not the defendant has a history of drug abuse.
Instrument CompletionAfter the responses for all risk factors are complete, PTCC automatically calculatesa risk score and assigns the defendant to the appropriate risk level. PTCC alsohighlights the risk factors, if any, which contributed to the risk level classification.
The pretrial staff then have the opportunity, if they deem appropriate, to entercomments and/or recommendations to the judicial officer. Once the instrumentis completed and has been saved successfully it can be printed and made a partof the pretrial investigation report.
The pretrial investigation report, containing both the investigation and risk assess-ment instrument, are provided to judicial officers at the initial bail hearing,arraignment, and/or bail review hearing. The information is intended to assist judi-cial officers in making bail decisions, to release or detain defendants pending trial.
21

The Virginia Pretrial Risk Assessment Instrument is now complete, automated,and integrated into the PTCC case management system. Future plans for imple-mentation of the instrument include four phases: planning, pilot testing, statewideimplementation, and validation.
Planning PhaseDCJS is currently in the planning phase of instrument implementation. Prior toJune 30, 2003 the tasks listed below will be completed during this phase.
1. Selection of four (4) programs to serve as pilot sites for implementation.
2. Formation of a pilot site work group to develop instrument completion instruc-tions, draft training curriculums, and complete an addendum to the PTCC UserManual.
3. Development of an implementation project management plan.
Pilot Testing PhaseFour pretrial services programs will serve as pilot sites in which to test the imple-mentation of the instrument. This will include the assessment of the efficacies ofthe following:
➣ training curriculum;
➣ instrument completion instructions;
➣ new version of PTCC; and
➣ the addendum to the PTCC User Manual.
The pilot sites will test the full integration of the instrument into the pretrial ser-vices investigation report and all aspects of instrument implementation.
Implementation of the instrument at the pilot sites will begin in July 2003 and beguided by the tasks listed below.
1. A new version of PTCC, containing the RA Instrument tab and the RA Instru-ment report will be installed at the pilot sites.
2. Training for the instrument will be provided to all pilot site staff.
3. Presentations will be made to the local Community Criminal Justice Boards(CCJB) of the pilot site localities.
4. Intensive support and technical assistance will be provided. Risk assessmentinstruments completed by programs will be reviewed to ensure accurate datainterpretation and risk assessment scoring. If discrepancies are found, addi-tional intensive training and support will be provided to address and correctthose discrepancies.
Future Plans
22

Statewide ImplementationThe implementation of the Virginia Pretrial Risk Assessment Instrument in theremaining 26 pretrial services programs is dependent upon the availability of fund-ing. Contingent upon adequate funding, statewide implementation will occurbetween September 2003 and June 2004.
Implementation will be phased in on a regional basis. Four new sites will beimplemented approximately every six weeks until all sites are fully utilizing theinstrument. Implementation will follow the same procedures as those outlinedfor the pilot sites and include the installation of a new version of PTCC, trainingprovided to all pretrial services program staff, a presentation to their respec-tive CCJB’s, concentrated technical assistance and support to the programs,and additional training as needed.
Validation PhaseIt will be crucial in future years to validate the accuracy of the instrument and tomake the adjustments necessary to ensure its effectiveness in future years. Thisphase can begin one year after statewide implementation has been achieved.
23

Ares, C. E., Rankin, A., & Sturz, H. (1963). The Manhattan Bail Project: An Interim Report on the Use of Pre-trial Parole. New York University Law Review, 38, 67–77.
Beeley, A. (1927/1966). The Bail System in Chicago. Chicago: University of Chicago Press [original 1927;reprint 1966].
Clark, S. (1988). Pretrial Release: Concepts, Issues, and Strategies for Improvement. Research in Corrections,1 (3), 1-40.
Code of Virginia. (1950). [On-line]. Available: http://legis.state.va.us/Laws/CodeofVa.htm
Cuvelier, S., & Potts, D. W. (1993). Bail Classification Profile Project: Harris County, Texas. Alexandria, VA:State Justice Institute.
Cuvelier, S., & Potts, D. W. (1997). A Reassessment of the Bail Classification Instrument and Pretrial Practicesin Harris County, Texas. Huntsville, TX: Sam Houston State University.
Eskridge, C.W. (1983). Pretrial Release Programming: Issues and Trends. New York: Clark Boardman Com-pany, Ltd.
Feeley, M. M. (1983). Court Reform on Trial. New York: Basic Books, Inc.
Gottfredson, D. & Tonry, M. (1987). Crime And Justice: A Review of Research: Vol. 1. Prediction and Classifi-cation: Criminal Justice Decision Making. Chicago: University of Chicago Press.
Goldkamp, J. S. (1979). Two Classes of Accused: A Study of Bail and Detention in America. Cambridge, MA:Ballinger Publishing Company.
Goldkamp, J. S., & Harris, M. K. (1994). Charge Seriousness, Risk Classification and Resource Implications:Three Outstanding Issues in Implementing Pretrial Release Guidelines. Philadelphia: Crime and JusticeResearch Institute.
Goldkamp, J. S., Harris, M. K., & White, M. (1997). Pretrial Release and Detention During the First Year ofPretrial Release Guidelines in Philadelphia: Review and Recommendations. Philadelphia: Crime andJustice Research Institute.
Goodman, Rebecca (1992) Hennepin County Bureau of Community Corrections Pretrial Release Study. Min-neapolis, MN: Planning and Evaluation Unit.
Grimm, L. G., & Yarnold, P. R. (1995). Reading and Understanding Multivariate Statistics. Washington, D.C.:American Psychological Association.
Jones, P. R., & Goldkamp, J. S. (1991). The Bail Guidelines Experiment in Dade County, Miami: A Case Studyin the Development and Implementation of a Policy Innovation. The Justice System Journal, 14/15.
Kern, R. P. & Kolmetz, P.F. (1986). Development of a Pretrial Risk Assessment Instrument: A Pilot Study.Richmond, VA: Virginia Department of Criminal Justice Services, Statistical Analysis Center.
McCauley, M. (1995, October). Pretrial Services. Unpublished report summarizing the results of the PinellasCounty, Florida pretrial risk research project.
Morse, W. L., & Beattie, R. L. (1932). Survey of the Administration of Criminal Justice in Oregon, Report No.1: Final Report on 1771 Felony Cases in Multnomah County. Oregon Law Review, 11.
Siddiqi, Q. (1999). Assessing Risk of Pretrial Failure to Appear in New York City: A Research Summary andImplications for Developing Release Recommendation Schemes. New York: New York City Criminal Jus-tice Agency.
Siddiqi, Q. (1999). Prediction of Pretrial Failure to Appear and an Alternative Pretrial Release Risk-Classifica-tion Scheme in New York City: A Reassessment Study. New York: New York City Criminal Justice Agency.
Thomas, W. H., Jr. (1976). Bail Reform in America. Berkeley, CA: University of California Press, Ltd.
Tobolowsky, P. M., & Quinn, J. F. (1993). Pretrial Release in the 1990s: Texas Takes Over Another Look atNon-financial Release Conditions. Criminal and Civil Confinement, 19, 267–327.
Toborg, M. A. (1981). Pretrial Release: A National Evaluation of Practices and Outcomes. Washington, DC:U.S. Department of Justice, National Institute of Justice.
U.S. Department of Justice—National Institute of Corrections. (1979). Classification Instruments For Crimi-nal Justice Decisions: Pretrial Release. Washington, DC: U.S. Department of Justice.
Bibliography
24

Large SmallCommunity Type Urban Urban Mixed Rural Rural Rural Rural
Persons* 6,187,358 133,793 19,027 57,403 5,306 8,853 15,987 10,248
Families* 1,642,735 35,322 4,166 15,670 1,423 2,434 4,090 2,792
Households* 2,294,722 49,699 7,469 18,978 2,032 3,131 5,576 3,808
Urban And Rural*
Inside urbanized area 62% 100% 100% 42% 0% 0% 0% 0%
Outside urbanized area 8% 0% 0% 5% 100% 0% 0% 0%
Rural farm 1% 0% 0% 2% 0% 5% 5% 7%
Rural non-farm 29% 0% 0% 51% 0% 95% 95% 93%
Sex*
Male 49% 49% 46% 50% 47% 48% 50% 48%
Female 51% 51% 54% 50% 53% 52% 50% 52%
Race*
White 77% 58% 76% 87% 54% 44% 41% 41%
Black 19% 39% 22% 11% 46% 56% 59% 58%
Other 4% 3% 2% 2% 0% 0% 0% 1%
Median FamilyIncome In 1989* $38,213 $34,291 $33,353 $43,596 $25,458 $25,361 $23,948 $26,538
Median HouseholdIncome In 1989* $33,328 $30,144 $26,614 $41,342 $21,009 $22,116 $19,424 $20,833
Percent BelowPoverty Level** 10% 11% 12% 5% 18% 16% 25% 20%
Total ResidentPopulation*** 6,189,000 139,181 21,953 71,981 5,835 10,967 16,465 10,078
Education***
Total persons 25 yearsand over 82,670 11,118 34,901 3,559 5,641 10,210 6,734
High school graduates 80% 74% 77% 58% 50% 51% 54%
College graduates 19% 26% 19% 13% 5% 7% 9%
Appendix ALocality/CommunityCharacteristics
* U.S. Census Bureau: 1990 Census: Summary Tape File 3A** U.S. Census Bureau: County Income and Poverty Estimates 1990 Census Estimates: Virginia 1989***U.S. Census Bureau: 1996 USA Counties General Profile
Virginia Ham
pton
Fred
eric
ksbu
rg
Spot
sylv
ania
Empo
ria
Green
svill
e
Brun
swic
k
Suss
ex
U.S. Census Bureau
25

JULY–98 AUGUST–98
S M T W T F S S M T W T F S
1 2 3 4 15 6 7 8 9 10 11 2 3 4 5 6 7 8
12 13 14 15 16 17 18 9 10 11 12 13 14 1519 20 21 22 23 24 25 16 17 18 19 20 21 2226 27 28 29 30 31 23 24 25 26 27 28 29
30 31
SEPTEMBER–98 OCTOBER–98
S M T W T F S S M T W T F S
1 2 3 4 5 1 2 36 7 8 9 10 11 12 4 5 6 7 8 9 10
13 14 15 16 17 18 19 11 12 13 14 15 16 1720 21 22 23 24 25 26 18 19 20 21 22 23 2427 28 29 30 25 26 27 28 29 30 31
NOVEMBER–98 DECEMBER–98
S M T W T F S S M T W T F S
1 2 3 4 5 6 7 1 2 3 4 58 9 10 11 12 13 14 6 7 8 9 10 11 12
15 16 17 18 19 20 21 13 14 15 16 17 18 1922 23 24 25 26 27 28 20 21 22 23 24 25 2629 30 27 28 29 30 31
JANUARY–99 FEBRUARY–99
S M T W T F S S M T W T F S
1 2 1 2 3 4 5 63 4 5 6 7 8 9 7 8 9 10 11 12 13
10 11 12 13 14 15 16 14 15 16 17 18 19 2017 18 19 20 21 22 23 21 22 23 24 25 26 2724 25 26 27 28 29 30 2831
MARCH–99 APRIL–99
S M T W T F S S M T W T F S
1 2 3 4 5 6 1 2 37 8 9 10 11 12 13 4 5 6 7 8 9 10
14 15 16 17 18 19 20 11 12 13 14 15 16 1721 22 23 24 25 26 27 18 19 20 21 22 23 2428 29 30 31 25 26 27 28 29 30
MAY–99 JUNE–99
S M T W T F S S M T W T F S
1 1 2 3 4 52 3 4 5 6 7 8 6 7 8 9 10 11 129 10 11 12 13 14 15 13 14 15 16 17 18 19
16 17 18 19 20 21 22 20 21 22 23 24 25 2623 24 25 26 27 28 29 27 28 29 3030 31
Appendix B
Data CollectionSchedule
26
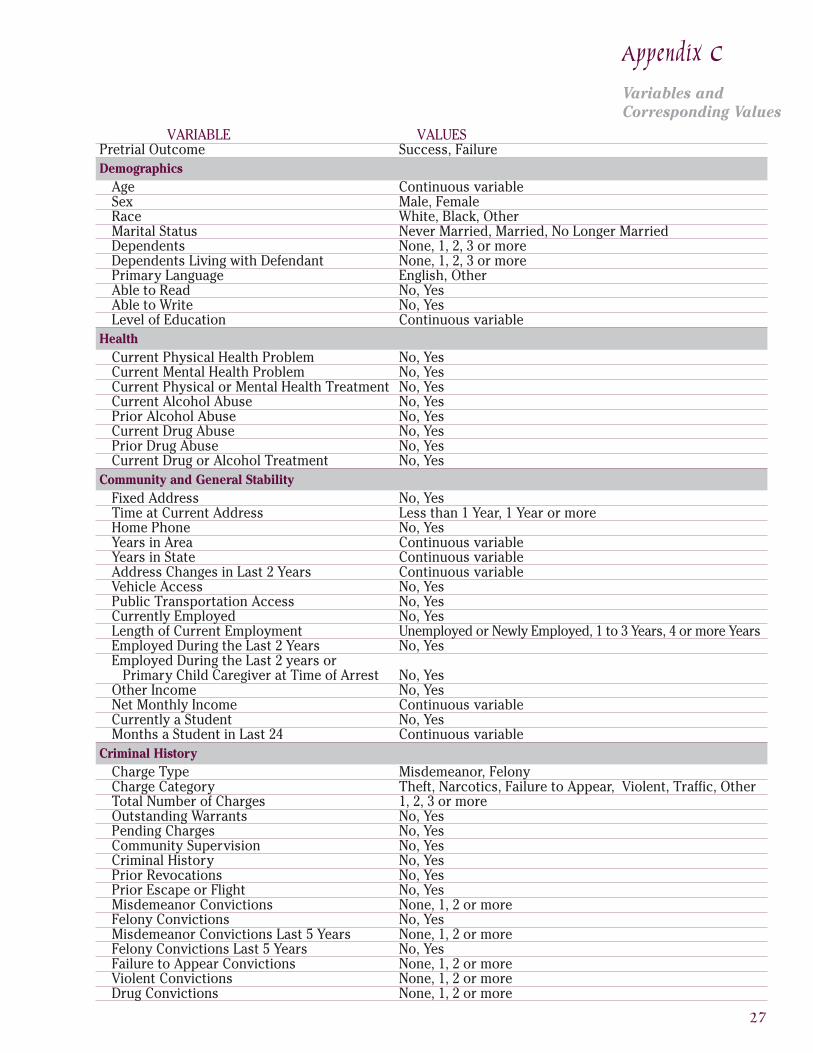
VARIABLE VALUES Pretrial Outcome Success, Failure Demographics
Age Continuous variableSex Male, FemaleRace White, Black, OtherMarital Status Never Married, Married, No Longer MarriedDependents None, 1, 2, 3 or moreDependents Living with Defendant None, 1, 2, 3 or morePrimary Language English, OtherAble to Read No, YesAble to Write No, YesLevel of Education Continuous variable
HealthCurrent Physical Health Problem No, YesCurrent Mental Health Problem No, YesCurrent Physical or Mental Health Treatment No, YesCurrent Alcohol Abuse No, YesPrior Alcohol Abuse No, YesCurrent Drug Abuse No, YesPrior Drug Abuse No, YesCurrent Drug or Alcohol Treatment No, Yes
Community and General StabilityFixed Address No, YesTime at Current Address Less than 1 Year, 1 Year or moreHome Phone No, YesYears in Area Continuous variableYears in State Continuous variableAddress Changes in Last 2 Years Continuous variableVehicle Access No, YesPublic Transportation Access No, YesCurrently Employed No, YesLength of Current Employment Unemployed or Newly Employed, 1 to 3 Years, 4 or more YearsEmployed During the Last 2 Years No, YesEmployed During the Last 2 years or Primary Child Caregiver at Time of Arrest No, YesOther Income No, YesNet Monthly Income Continuous variableCurrently a Student No, YesMonths a Student in Last 24 Continuous variable
Criminal HistoryCharge Type Misdemeanor, FelonyCharge Category Theft, Narcotics, Failure to Appear, Violent, Traffic, OtherTotal Number of Charges 1, 2, 3 or moreOutstanding Warrants No, YesPending Charges No, YesCommunity Supervision No, YesCriminal History No, YesPrior Revocations No, YesPrior Escape or Flight No, YesMisdemeanor Convictions None, 1, 2 or moreFelony Convictions No, YesMisdemeanor Convictions Last 5 Years None, 1, 2 or moreFelony Convictions Last 5 Years No, YesFailure to Appear Convictions None, 1, 2 or moreViolent Convictions None, 1, 2 or moreDrug Convictions None, 1, 2 or more
Variables andCorresponding Values
Appendix C
27

Demographics: Variable n=1971
AgeMean (SD) 31.03 (10.15)Median 29Range 18–82
SexMale 78%Female 22%
RaceWhite 40%Black 58%Other 2%
Marital StatusNever Married 54%Married 22%No Longer Married 24%
DependentsNone 45%1 20%2 17%3 or more 17%
Dependents Living with DefendantNone 65%1 14%2 11%3 or more 10%
Primary LanguageEnglish 99%Other 1%
Able to ReadNo 2%Yes 98%
Able to WriteNo 2%Yes 98%
Level of EducationMean (SD) 12 (1.83)Median 12Range 3–17
Descriptive Statistics
Appendix D
28

Health: Variable n=1971
PHYSICAL/MENTAL:Current Physical Health Problems
No 86%Yes 14%
Current Mental Health ProblemsNo 94%Yes 6%
Current Physical/Mental Health TreatmentNo 87%Yes 13%
SUBSTANCE ABUSE:Current Alcohol Abuse
No 77%Yes 23%
Prior Alcohol AbuseNo 76%Yes 24%
Current Drug AbuseNo 78%Yes 22%
Prior Drug AbuseNo 64%Yes 36%
Current Drug/Alcohol TreatmentNo 98%Yes 2%
Descriptive Statistics(cont.)
Appendix D
29
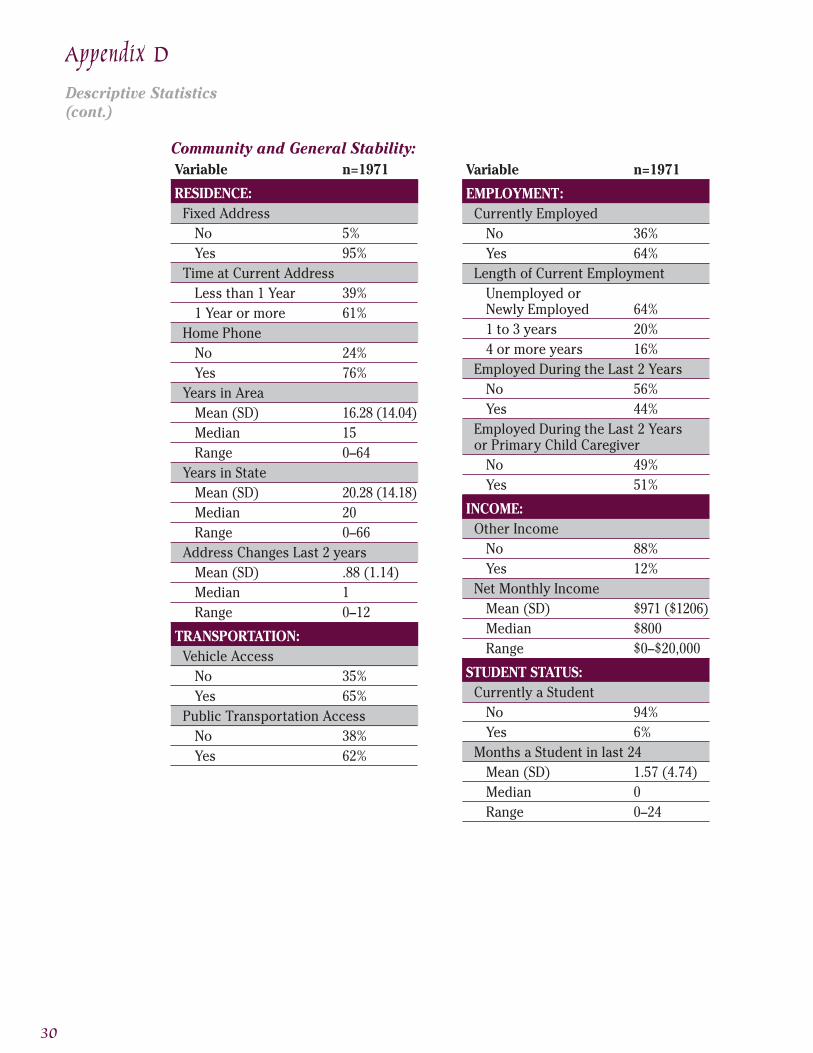
Community and General Stability: Variable n=1971
RESIDENCE:Fixed Address
No 5%Yes 95%
Time at Current AddressLess than 1 Year 39%1 Year or more 61%
Home PhoneNo 24%Yes 76%
Years in AreaMean (SD) 16.28 (14.04)Median 15Range 0–64
Years in StateMean (SD) 20.28 (14.18)Median 20Range 0–66
Address Changes Last 2 yearsMean (SD) .88 (1.14)Median 1Range 0–12
TRANSPORTATION:Vehicle Access
No 35%Yes 65%
Public Transportation AccessNo 38%Yes 62%
Variable n=1971
EMPLOYMENT:Currently Employed
No 36%Yes 64%
Length of Current EmploymentUnemployed orNewly Employed 64%1 to 3 years 20%4 or more years 16%
Employed During the Last 2 YearsNo 56%Yes 44%
Employed During the Last 2 Yearsor Primary Child Caregiver
No 49%Yes 51%
INCOME:Other Income
No 88%Yes 12%
Net Monthly IncomeMean (SD) $971 ($1206)Median $800Range $0–$20,000
STUDENT STATUS:Currently a Student
No 94%Yes 6%
Months a Student in last 24Mean (SD) 1.57 (4.74)Median 0Range 0–24
Descriptive Statistics(cont.)
Appendix D
30
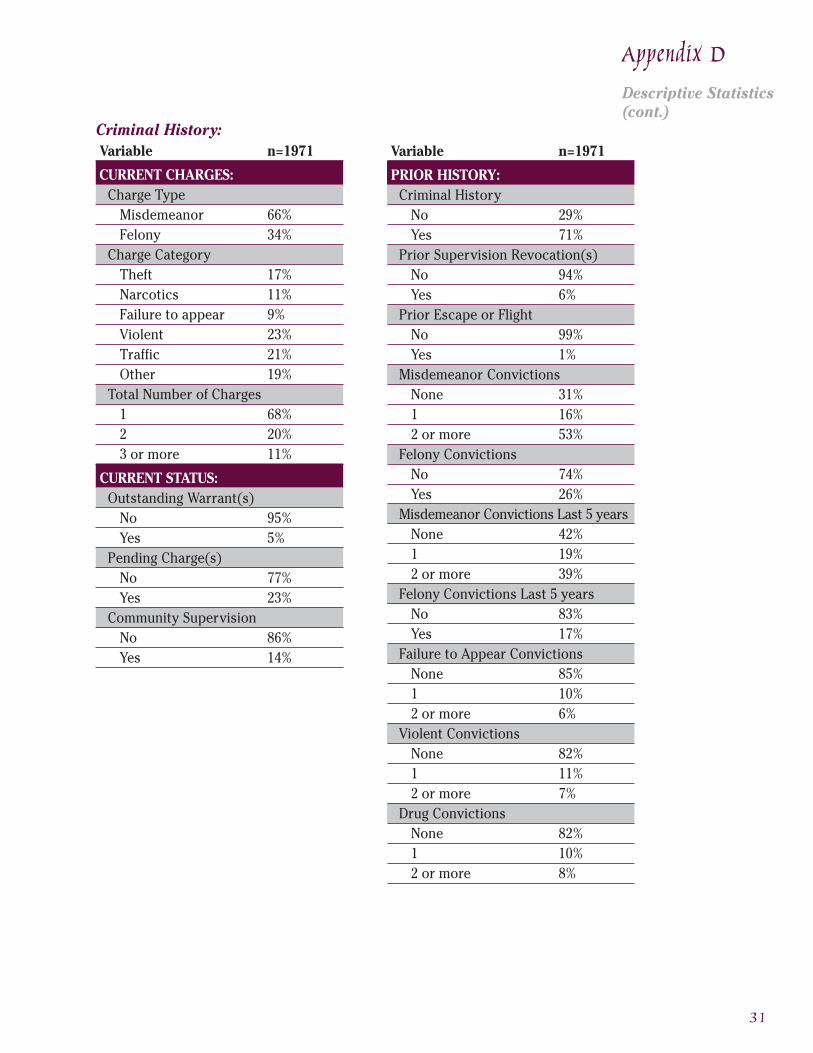
Criminal History: Variable n=1971
CURRENT CHARGES:Charge Type
Misdemeanor 66%Felony 34%
Charge CategoryTheft 17%Narcotics 11%Failure to appear 9%Violent 23%Traffic 21%Other 19%
Total Number of Charges1 68%2 20%3 or more 11%
CURRENT STATUS:Outstanding Warrant(s)
No 95%Yes 5%
Pending Charge(s)No 77%Yes 23%
Community SupervisionNo 86%Yes 14%
Variable n=1971
PRIOR HISTORY:Criminal History
No 29%Yes 71%
Prior Supervision Revocation(s)No 94%Yes 6%
Prior Escape or FlightNo 99%Yes 1%
Misdemeanor ConvictionsNone 31%1 16%2 or more 53%
Felony ConvictionsNo 74%Yes 26%
Misdemeanor Convictions Last 5 yearsNone 42%1 19%2 or more 39%
Felony Convictions Last 5 yearsNo 83%Yes 17%
Failure to Appear ConvictionsNone 85%1 10%2 or more 6%
Violent ConvictionsNone 82%1 11%2 or more 7%
Drug ConvictionsNone 82%1 10%2 or more 8%
Descriptive Statistics(cont.)
Appendix D
31

Demographics: Variable n=1971
AgeSuccessfulMean (SD) 31.41a(10.24)UnsuccessfulMean (SD) 30.04 (9.82)
Sex1
Male 71% a
Female 80%Race1
White 76%b
Black 70%Other 79%
Marital Status1
Never Married 69% a
Married 79%No Longer Married 74%
Dependents1
None 71%1 72%2 73%3 or more 76%
Dependents Living with Defendant1
None 71%1 74%2 76%3 or more 78%
Level of EducationSuccessfulMean (SD) 11.81 (1.86)UnsuccessfulMean (SD) 11.7 (1.74)
Note: 1 values represent percent successfula categories within this variable are significantly different at p <.01b categories within this variable are significantly different at p <.05
Appendix E
Bivariate Statistics
32
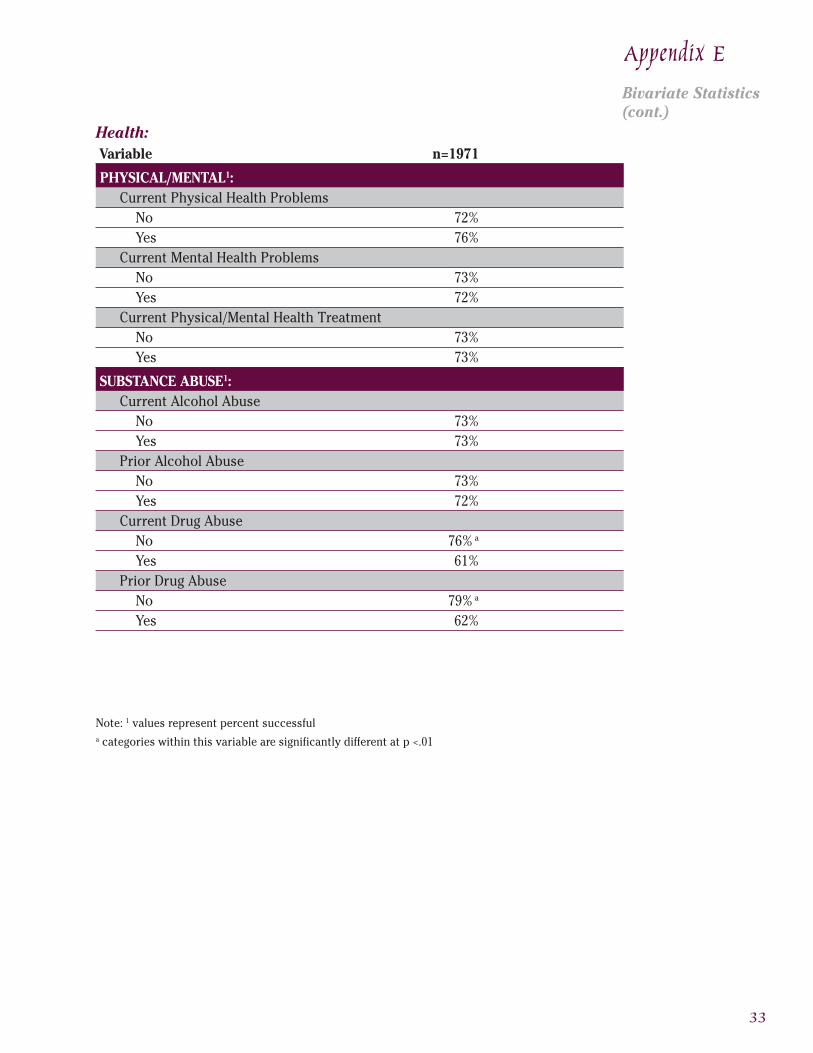
Health: Variable n=1971
PHYSICAL/MENTAL1:Current Physical Health Problems
No 72%Yes 76%
Current Mental Health ProblemsNo 73%Yes 72%
Current Physical/Mental Health TreatmentNo 73%Yes 73%
SUBSTANCE ABUSE1:Current Alcohol Abuse
No 73%Yes 73%
Prior Alcohol AbuseNo 73%Yes 72%
Current Drug AbuseNo 76% a
Yes 61%Prior Drug Abuse
No 79% a
Yes 62%
Note: 1 values represent percent successfula categories within this variable are significantly different at p <.01
Appendix E
Bivariate Statistics(cont.)
33

Variable n=1971
EMPLOYMENT:Currently Employed1
No 69%b
Yes 74%Length of Current Employment
Unemployed orNewly Employed 70%a
1 to 3 years 74%4 or more years 81%
Employed for the Last 2 YearsNo 68%a
Yes 78%Employed for the Last 2 Years orPrimary Child Caregiver
No 67%a
Yes 78%
INCOME:Other Income1
No 72%Yes 74%
Net Monthly Income2
SuccessfulMean (SD) $1029 a ($1284)UnsuccessfulMean (SD) $818 ($958)
Note: 1 values represent percent successful; 2 numbers have been rounded to the nearest whole dollara categories within this variable are significantly different at p <.01b categories within this variable are significantly different at p <.05
Community and General Stability: Variable n=1971
RESIDENCE:Fixed Address1
No 62%b
Yes 73%Time at Current Address1
Less than 1 Year 69%a
1 Year or more 75%Home Phone1
No 64%a
Yes 75%Years in Area
SuccessfulMean (SD) 16.3 (14.05)UnsuccessfulMean (SD) 16.21 (14.01)
Years in StateSuccessfulMean (SD) 20.6 (14.36)UnsuccessfulMean (SD) 19.44 (13.66)
Address Changes Last 2 yearsSuccessfulMean (SD) .86 (1.14)UnsuccessfulMean (SD) .92 (1.14)
TRANSPORTATION:Vehicle Access1
No 64%a
Yes 77%Public Transportation Access1
No 76%a
Yes 70%
Appendix E
Bivariate Statistics(cont.)
34

Criminal History: Variable n=1971
CURRENT CHARGES1:Charge Type
Misdemeanor 77%a
Felony 64%Charge Category
Theft 66%a
Narcotics 60%Failure to appear 72%Violent 76%Traffic 77%Other 76%
Total Number of Charges1 74%2 71%3 or more 69%
CURRENT STATUS1:Outstanding Warrant(s)
No 74%a
Yes 51%Pending Charge(s)
No 77%a
Yes 57%Community Supervision
No 75%a
Yes 60%
Variable n=1971
PRIOR HISTORY1:Criminal History
No 84%a
Yes 68%Prior Supervision Revocation(s)
No 74% a
Yes 58%Misdemeanor Convictions
None 83% a
1 76%2 or more 65%
Felony ConvictionsNo 77% a
Yes 61%Misdemeanor Convictions Last 5 years
None 82% a
1 73%2 or more 63%
Felony Convictions Last 5 yearsNo 75% a
Yes 60%Failure to Appear Convictions
None 75%a
1 67%2 or more 44%
Violent ConvictionsNone 75%a
1 66%2 or more 53%
Drug ConvictionsNone 76%a
1 60%2 or more 56%
Note: 1 values represent percent successfula categories within this variable are significantly different at p <.01
Appendix E
Bivariate Statistics(cont.)
35
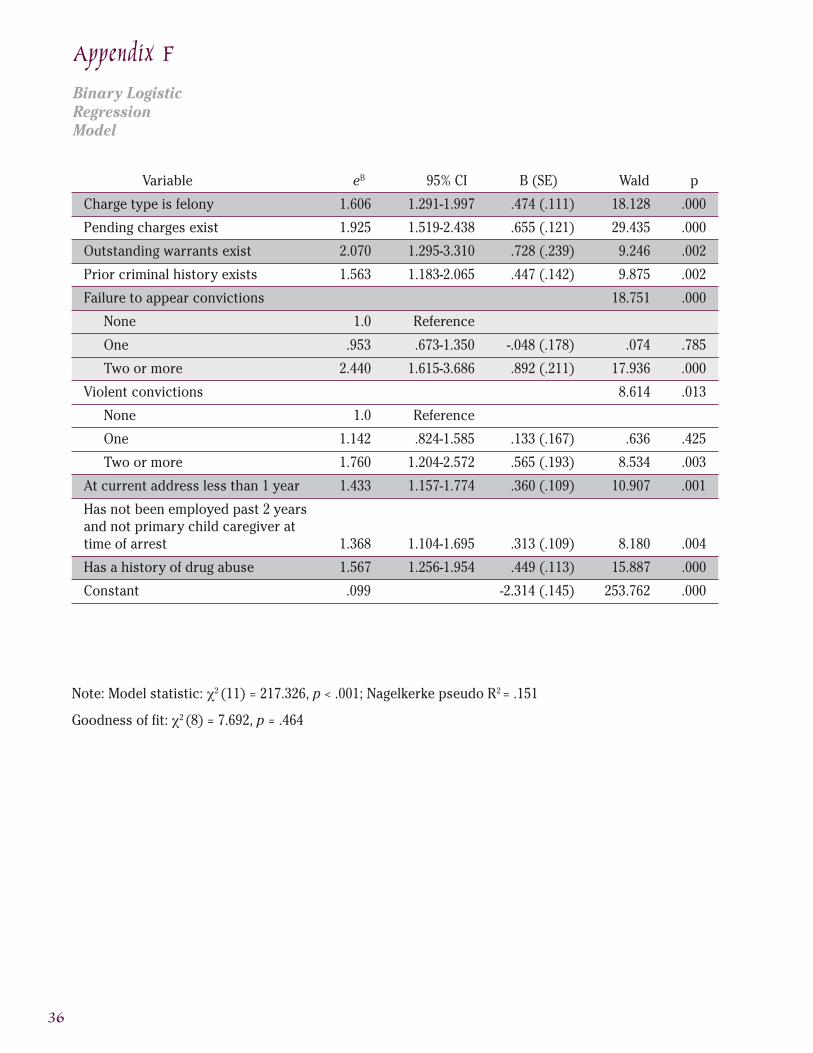
Variable eB 95% CI B (SE) Wald p
Charge type is felony 1.606 1.291-1.997 .474 (.111) 18.128 .000
Pending charges exist 1.925 1.519-2.438 .655 (.121) 29.435 .000
Outstanding warrants exist 2.070 1.295-3.310 .728 (.239) 9.246 .002
Prior criminal history exists 1.563 1.183-2.065 .447 (.142) 9.875 .002
Failure to appear convictions 18.751 .000
None 1.0 Reference
One .953 .673-1.350 -.048 (.178) .074 .785
Two or more 2.440 1.615-3.686 .892 (.211) 17.936 .000
Violent convictions 8.614 .013
None 1.0 Reference
One 1.142 .824-1.585 .133 (.167) .636 .425
Two or more 1.760 1.204-2.572 .565 (.193) 8.534 .003
At current address less than 1 year 1.433 1.157-1.774 .360 (.109) 10.907 .001
Has not been employed past 2 yearsand not primary child caregiver attime of arrest 1.368 1.104-1.695 .313 (.109) 8.180 .004
Has a history of drug abuse 1.567 1.256-1.954 .449 (.113) 15.887 .000
Constant .099 -2.314 (.145) 253.762 .000
Note: Model statistic: χ2 (11) = 217.326, p < .001; Nagelkerke pseudo R2 = .151
Goodness of fit: χ2 (8) = 7.692, p = .464
Appendix F
Binary LogisticRegressionModel
36

SAMPLE
37
Appendix G
Virginia Pretrial RiskAssessment Instrument
_______________________________________ __ Instrument Completion Date ______________
First Name _____________________________ Last Name ___________________ Race _________
SSN ____________________________________ Sex _________________________ DOB __________
Arrest Date _____________________________ Court Date __________________
Charge(s) ______________________________________________________________________________
Bond Type _____________________________ Bond Amount _________________________________
Risk Factors
1. Charge Type Felony or Misdemeanor
2. Pending Charge(s) Yes or No
3. Outstanding Warrant(s) Yes or No
4. Criminal History Yes or No
5. Two or More Failure to Appear Convictions Yes or No
6. Two or More Violent Convictions Yes or No
7. Length at Current Residence Less than 1 Year or 1 Year or More
8. Employed/ Primary Child Caregiver Yes or No
9. History of Drug Abuse Yes or No
Risk Level
1 2 3 4 5
LOW AVERAGE HIGH
Risk Factor(s) __________________________________________________________________________
_______________________________________________________________________________________
_______________________________________________________________________________________
Comments/Recommendations ____________________________________________________________
_______________________________________________________________________________________
_______________________________________________________________________________________
38
Department of Criminal Justice Services Staff
Leonard G. CookeDirector804.786.8718
Robert MathiesonChief Deputy Director804.786.8718
Francine C. EckerDeputy DirectorDivision of Programs and Services804.786.3967
Daniel E. CatleySection ChiefCorrectional Services804.786.8477

Virginia Department of Criminal Justice Services805 East Broad Street
Richmond, Virginia 23219
April 2003 www.dcjs.org