virginia high school safety study - curry school of...
TRANSCRIPT
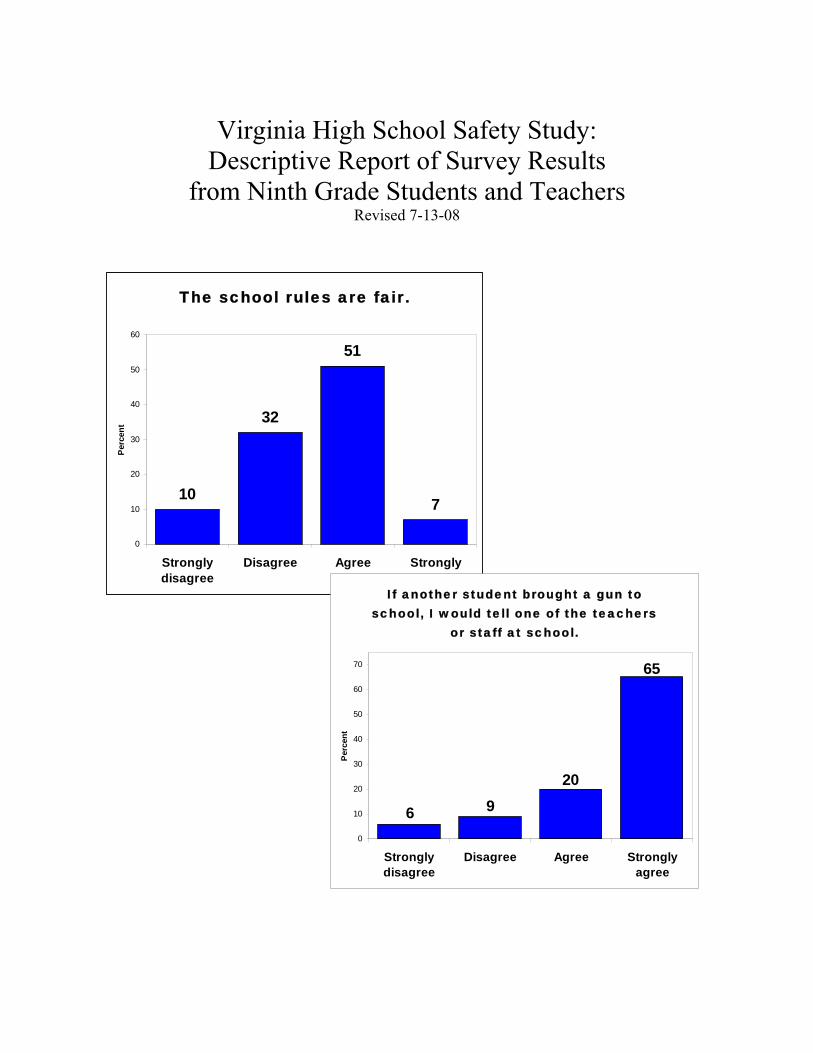
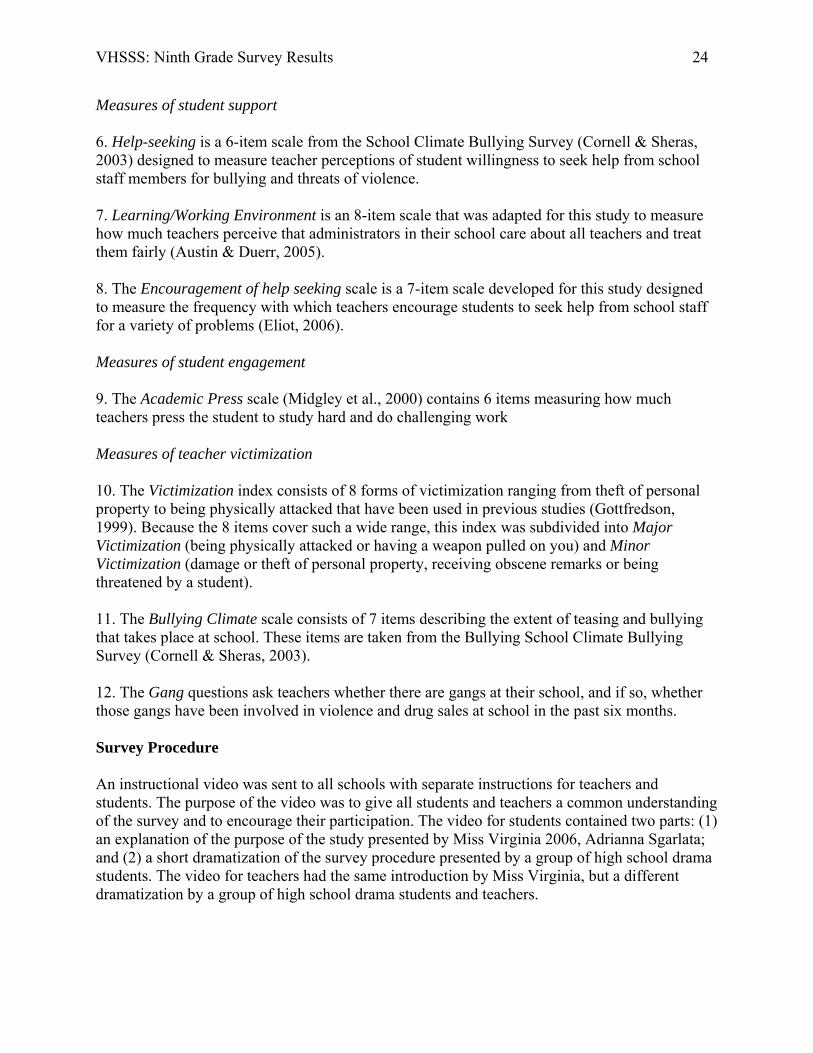
The school rules are fair.
10
32
51
7
0
10
20
30
40
50
60
Stronglydisagree
Disagree Agree Stronglyagree
Per
cent
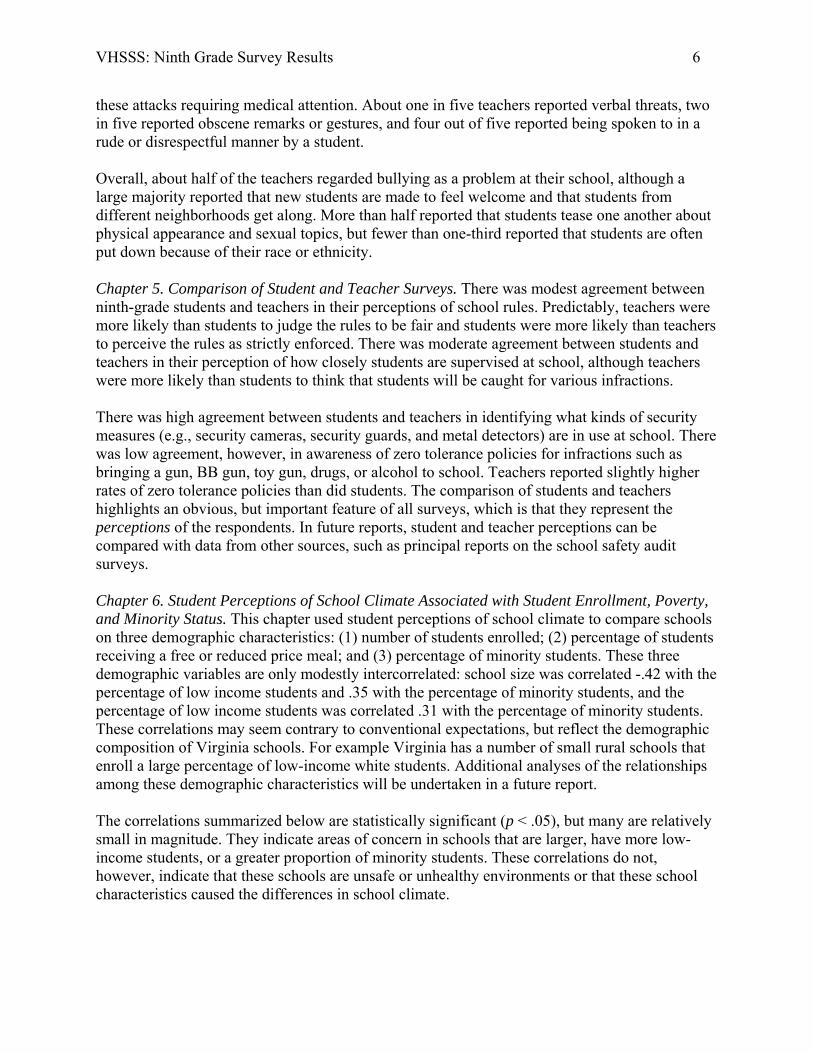
If another student brought a gun to school, I would tell one of the teachers
or staff at school.
6 920
65
0
10
20
30
40
50
60
70
Stronglydisagree
Disagree Agree Stronglyagree
Perc
ent
Virginia High School Safety Study: Descriptive Report of Survey Results
from Ninth Grade Students and Teachers Revised 7-13-08

VHSSS: Ninth Grade Survey Results 2
Table of Contents Page
4 Executive Summary 11 Chapter 1. Purpose of the Study
Why study school safety? What are the main study questions? What questions are addressed in this report? Caveats
15 Chapter 2. Study Methods Preparation for the study School eligibility and participation Participating schools Student sample Teacher sample Student survey measures Teacher survey measures Survey procedure Lessons learned to improve future surveys
27 Chapter 3. Student Survey Descriptive Results Measures of school structure Measures of student support efforts Measures of student engagement Measures of student victimization
49 Chapter 4. Teacher Survey Descriptive Results Measures of school structure Measures of student support efforts Measures of victimization
66 Chapter 5. Comparison of Student and Teacher Surveys Chapter 6. Student Perceptions of School Climate Associated with Student Enrollment,
Poverty, and Minority Status 69 Chapter 7. Teacher Perceptions of School Climate Associated with Student Enrollment, Poverty,
and Minority Status 86 Chapter 8. Correlates of Student and Teacher Victimization
Effects of victimization on academic performance SOL passing rates Commitment to school Academic press Effects of school characteristics on victimization Gangs Dress codes Student support by teachers Teacher support by administrators Daily structure
111 Chapter 9. Participant Reactions to the Survey Reactions to the Virginia Tech Shooting Principal comments Teacher comments Student comments
124 References 126 Survey questions

VHSSS: Ninth Grade Survey Results 3
Acknowledgements
This report was prepared by Dewey Cornell and Anne Gregory of the Curry School of Education at the University of Virginia, with assistance from Xitao Fan, Peter Sheras, and graduate assistants Sharmila Bandyopadhyay, Justin Collman, Megan Eliot, Jennifer Klein, Talisha Lee, Tse-Hua Shih, Erica Shirley, and Aisha Thompson. Graduate assistants Carli Hague Reis and Farah Williams assisted in data collection. We thank Donna Bowman of the Virginia Center for School Safety of the Department of Criminal Justice Services and her associates, including Matthew Davis, Sherri Johnson, Melissa Leigh, Tim Paul, and Carol Porter. We thank Arlene Cundiff of the Virginia Department of Education and her associates, including Cynthia Cave, Joyce Martin, Mona Mallory, and Raymond Woten. We recognize Adrianna Sgarlata, Miss Virginia 2006, for introducing the Virginia High School Safety Survey in the video instructions for this project. We applaud Faye Cunningham and the Albemarle High School Drama Club for their creation, filming, and production of the video instructions. We also appreciate the work of Dave Drucker, Carli Hague Reis, and Peter Sheras for their roles in producing the videos. We thank the school principals and their assistants for their work carrying out the survey. We appreciate the contributions of the students and teachers who participated in the study. This report was revised on 4-22-08 and 7-13-08 to correct several minor errors in frequency counts.

VHSSS: Ninth Grade Survey Results 4
Executive Summary
Chapter 1. Purpose of the Study. The purpose of the Virginia High School Safety Study is to identify student safety, discipline, and support policies that best maintain a safe and orderly environment conducive to learning. The project is being completed by researchers at the Curry School of Education, University of Virginia, in collaboration with the Virginia Center for School Safety of the Department of Criminal Justice Services and the Virginia Department of Education. One component of this larger project was a school climate survey administered to ninth-grade students and teachers as part of Virginia’s 2006-07 school safety audit program. This report provides a detailed review of survey results, item by item and scale by scale, but does not address the broader study questions that are still under investigation. This report does not review the research literature or theory regarding school climate, does not test formal hypotheses, or make recommendations for school practices. These matters will be addressed in additional reports. These survey results are limited to the responses of ninth-grade students and teachers, so they do not necessarily represent their whole school. Surveys results will be integrated with additional data from the whole school in subsequent reports. Chapter 2. Study Methods. Principals in each of Virginia’s public high schools were asked to select approximately 25 students and 10 teachers using a series of random numbers provided by the researchers. Of 314 eligible schools, 296 schools submitted student surveys and 291 schools submitted teacher surveys. Approximately 7,400 ninth-grade students and 2,900 ninth-grade teachers completed the online survey during the spring of 2007. The student survey consisted of standard scales designed to measure:
1. School structure (such as perceived fairness of rules, security measures, awareness of zero tolerance, daily enforcement of school rules);
2. Student support efforts (willingness to seek help from teachers, perceptions that the learning environment is supportive);
3. Student engagement (commitment to school, belief in school rules, trust in teacher authority, extracurricular involvement, perception that teachers encourage students to work hard, absence of aggressive attitudes);
4. Student victimization (various forms of victimization ranging from personal theft to being threatened, bullied, or assaulted; perceptions that there is a lot teasing and bullying at school, presence of gangs at school).
The teacher survey was similar to the student survey, but measured teacher perspectives on:
1. School structure (such as perceived fairness of rules, security measures, awareness of zero tolerance, daily enforcement of school rules);
2. Student support efforts (student willingness to seek help from teachers, teacher encouragement of help-seeking, and perceptions that administrators are supportive of teachers);
3. Student engagement (how much teachers encourage students to work hard); and

VHSSS: Ninth Grade Survey Results 5
4. Teacher victimization (various forms of victimization ranging from personal theft to being threatened or assaulted; perceptions that there is a lot teasing and bullying at school, presence of gangs at school).
Chapter 3. Student Survey Descriptive Results. Most ninth-grade students regarded their school rules to be strictly enforced, but fair. They reported trust in their teachers and acceptance of their authority. They believed their friends do not support breaking school rules, with the exception of copying homework assignments. They disavowed aggressive attitudes. They expressed willingness to seek help from their teachers if a student brought a gun to school or talked about killing someone, but were much less willing to seek help for bullying. Only about half of the students said they like school. Most students said they found school boring, but nevertheless reported that they work hard and want to get good grades. Students reported varying rates of victimization. About one in five students reported theft of personal property, one in four reported being threatened by a student, and one in eight reported being physically attacked. Overall, about half of the students perceived that bullying was a problem at their school. About one in five students reported being bullied in the past 30 days, although fewer than half of those students reported telling someone that it happened. One in twelve reported being bullied at least once per week. When asked about the general school climate, nearly three-fourths reported that students were teased about their physical appearance, about half reported teasing about sexual topics, and about one-third reported that students are often put down because of their race or ethnicity. However, about three-fourths also indicated that new students are made to feel welcome and that students from different neighborhoods get along. Over 80% agreed that “students at this school accept me for who I am.” Chapter 4. Teacher Survey Descriptive Results. Most ninth-grade teachers regarded their school rules to be fair, but had mixed opinions about enforcement. Most teachers thought that students would be caught if they got in a fight or cut class, but were less confident about smoking or wandering in the hall. Only about half thought that school rules were rigorously enforced and most did not regard their dress codes as strict. Nevertheless, most teachers expressed confidence in how their administrators handle school discipline. They also agreed that administrators are supportive of teachers and treat them fairly. The large majority of teachers reported an atmosphere in which students are free to seek help for problems such as bullying. Almost all teachers claimed that they personally encourage students to come to them for help. They consistently reported that their school fosters the social and emotional development of their students, provides instruction to prevent substance use, and has programs to resolve conflicts and provide character education. Most teachers also indicated that students are challenged to do thoughtful academic work. Teachers reported low rates of victimization for problems such as physical attacks at school. Approximately 4% reported being physically attacked in some way, with about one quarter of
VHSSS: Ninth Grade Survey Results 6
these attacks requiring medical attention. About one in five teachers reported verbal threats, two in five reported obscene remarks or gestures, and four out of five reported being spoken to in a rude or disrespectful manner by a student. Overall, about half of the teachers regarded bullying as a problem at their school, although a large majority reported that new students are made to feel welcome and that students from different neighborhoods get along. More than half reported that students tease one another about physical appearance and sexual topics, but fewer than one-third reported that students are often put down because of their race or ethnicity. Chapter 5. Comparison of Student and Teacher Surveys. There was modest agreement between ninth-grade students and teachers in their perceptions of school rules. Predictably, teachers were more likely than students to judge the rules to be fair and students were more likely than teachers to perceive the rules as strictly enforced. There was moderate agreement between students and teachers in their perception of how closely students are supervised at school, although teachers were more likely than students to think that students will be caught for various infractions. There was high agreement between students and teachers in identifying what kinds of security measures (e.g., security cameras, security guards, and metal detectors) are in use at school. There was low agreement, however, in awareness of zero tolerance policies for infractions such as bringing a gun, BB gun, toy gun, drugs, or alcohol to school. Teachers reported slightly higher rates of zero tolerance policies than did students. The comparison of students and teachers highlights an obvious, but important feature of all surveys, which is that they represent the perceptions of the respondents. In future reports, student and teacher perceptions can be compared with data from other sources, such as principal reports on the school safety audit surveys. Chapter 6. Student Perceptions of School Climate Associated with Student Enrollment, Poverty, and Minority Status. This chapter used student perceptions of school climate to compare schools on three demographic characteristics: (1) number of students enrolled; (2) percentage of students receiving a free or reduced price meal; and (3) percentage of minority students. These three demographic variables are only modestly intercorrelated: school size was correlated -.42 with the percentage of low income students and .35 with the percentage of minority students, and the percentage of low income students was correlated .31 with the percentage of minority students. These correlations may seem contrary to conventional expectations, but reflect the demographic composition of Virginia schools. For example Virginia has a number of small rural schools that enroll a large percentage of low-income white students. Additional analyses of the relationships among these demographic characteristics will be undertaken in a future report. The correlations summarized below are statistically significant (p < .05), but many are relatively small in magnitude. They indicate areas of concern in schools that are larger, have more low-income students, or a greater proportion of minority students. These correlations do not, however, indicate that these schools are unsafe or unhealthy environments or that these school characteristics caused the differences in school climate.
VHSSS: Ninth Grade Survey Results 7
Although school size did not matter for most survey items, there were some differences that favored smaller schools. Ninth-grade students in larger schools perceived a less supportive school climate and were less willing to seek help from a teacher. They were also less likely to report involvement in extracurricular activities. Although there were no school size differences for most forms of victimization, students in larger schools were more likely to report theft of personal property and having a weapon pulled on them. They were also more likely to report gangs in the school and to indicate that those gangs have been involved in drug sales and violence at school. It should be noted that all the survey questions reflect student perceptions, and do not establish that gangs are present or not present in different schools. In schools with more low-income students, ninth-grade students perceived less fairness in how rules are enforced and less support from adults in the school. Curiously, they reported less willingness to seek help from teachers, but more occasions when they did seek help or advice from a teacher. They reported less commitment to school and less trust in teachers, and described their friends as less respectful of school rules. They endorsed more aggressive attitudes and described more teasing and conflict in the school climate. They were more likely to report being bullied or physically attacked, and having personal property stolen. In schools with higher proportions of minority (nonwhite) students, there was a student perception that teachers would be more likely to overlook a student coming late to class or making a sarcastic remark, and that students would be less likely to be caught cutting class. Students perceived teachers as less supportive, but nonetheless rated themselves as more committed to school. They described their friends as less likely to accept school rules and themselves as less trusting of teachers. They were less likely to report involvement in extracurricular activities. Furthermore, students in schools with more minority students were less likely to express willingness to seek help for bullying. They were also less likely to seek help for a threat of violence such as a fellow student bringing a gun to school or talking about killing someone. However, students did report more occasions when they asked a teacher for help or advice about an academic matter or something that worried them. Students from schools with higher proportions of minority students were more likely to endorse aggressive attitudes, to report teasing about clothing and physical appearance, and to indicate more conflict among students from different neighborhoods. They were more likely to report being bullied. They reported more incidents of being physically attacked and having a weapon pulled on them (although both were relatively rare events). Like students in larger schools, they were more likely to report gangs in the school and to report that those gangs have been involved in drug sales and violence at school. Chapter 7. Teacher Perceptions of School Climate Associated with Student Enrollment, Poverty, and Minority Status. This chapter examined how teacher perceptions of school climate varied across schools based on school enrollment, student income, and minority status. The correlations summarized below are statistically significant (p < .05), but many are relatively small in magnitude. They indicate areas

VHSSS: Ninth Grade Survey Results 8
of concern in schools that are larger, have more low income students, or a greater proportion of minority students, but do not necessarily mean that these schools are unsafe or unhealthy environments. These correlations do not demonstrate that these school characteristics caused the differences in school climate. In larger schools, ninth-grade teachers reported more security measures, but less strict enforcement of school rules and less confidence in administrator handling of disciplinary matters. They expressed feeling less supported by the school administration. They reported more health and prevention programs, but perceived students as less willing to seek help. They were less likely to encourage students to come forward if they have information about a gun at school or a student who plans to hurt someone. Ninth-grade teachers in larger schools were more likely to report victimization, particularly obscene remarks or gestures from a student. They perceived a less positive school climate, with more conflict among students from different neighborhoods and more students being put down because of their race or ethnicity. Like the ninth-grade students, teachers in larger schools were more likely to report gangs in the school and to report that those gangs have been involved in drug sales and violence at school. Ninth-grade teachers in schools with higher proportions of low income students reported relatively few consistent differences from other teachers. They perceived more awareness of zero tolerance policies, and less emphasis on health and prevention programs in their schools. Teachers in schools with a higher proportion of students from low-income families experienced higher rates of victimization, particularly verbal threats, obscene remarks, serious physical attacks (although rare), and theft of personal property.
In schools with higher proportions of minority students, teachers reported less confidence that the school rules were fair and strictly enforced. They reported more security measures, but a less structured school environment, with students less likely to be caught cutting class, smoking, or getting into a fight. Teachers were more likely to overlook students coming late to class or making a sarcastic remark. Teachers in schools with higher proportions of minority students consistently perceived less support from their administrators and described less confidence in how they handle disciplinary matters. They reported less emphasis on health and prevention programs Furthermore, these teachers felt that students were less likely to express willingness to seek help for bullying or a threat of violence such as a student bringing a gun to school or talking about killing someone. Teachers perceived a consistently less favorable school climate, with more teasing and bullying, and gangs. Teachers in schools with higher proportions of minority students experienced more victimization, including verbal threats, rude and obscene remarks, physical attacks, and theft of personal property.

VHSSS: Ninth Grade Survey Results 9
Chapter 8. Correlates of Student and Teacher Victimization. School safety is essential to maintaining an environment conducive to learning. In support of this view, the correlations of victimization rates with schoolwide SOL passing rates were examined. These are preliminary analyses using relatively simple correlational analyses that will be followed up with more complex analyses controlling for potentially confounding variables. These analyses are presented to illustrate the kinds of questions that can be investigated in subsequent phases of this project. Schools with higher rates of teacher victimization had lower passing rates in Science, Mathematics, English, and History SOL exams, even after controlling for school size, the percentage of low income students, and the percentage of minority students in the school. Similarly, ninth-grade student victimization was correlated with lower passing rates in Mathematics and English SOL exams. It was surprising to observe these correlations since most of the students taking SOL exams were not ninth graders. It would appear the ninth grade victimization rates are sufficiently indicative of school climate trends that they are correlated with academic performance on the SOL exams. The statistical significance of the correlations were maintained even after using partial correlations to control for school size, the percentage of low income students, and the percentage of minority students in the school. These findings will be examined in more detail in future reports when additional SOL data are available. One indication of how victimization rates could influence teaching and learning is that ninth-grade student victimization rates were correlated with lower student commitment to school and lower academic press (how much teachers press students to really think and do their best work). It is important to identify school characteristics that increase victimization rates and in turn depress student achievement. Several findings are highlighted in this chapter:
• Victimization rates were higher in schools with gangs. • Victimization rates were lower in schools with stricter dress codes. • Victimization rates were lower in schools with higher teacher support of students. • Victimization rates were lower in schools with higher administrative support of teachers. • Victimization rates were lower in schools with higher daily structure (more likely
enforcement of school rules). It is important to note again that these findings are correlational; they do not establish a causal relationship between school climate and victimization levels. However, these findings do support the theory of authoritative school discipline that underlies this project and they indicate important directions for further study that will be examined in future reports. Chapter 9. Participant Reactions to the Survey. The survey period began on April 1, 2007, about two weeks before the Virginia Tech shooting on April 16. Surveys completed before April 16 were compared to those completed after April 16. Overall, these analyses showed no large changes in survey results. The most notable changes were that after the shooting, students expressed greater willingness to seek help from teachers if a student brought a gun to school (increasing from 78% to 85%) or if a student talked about killing someone (increasing from 72% to 80%).
VHSSS: Ninth Grade Survey Results 10
After the student and teacher surveys were completed, principals completed a brief online survey that invited them to write any comments they had about the study. All 87 comments are included in this report. Although many principals found that the survey process went smoothly and praised the project, others noted that it was time-consuming to select participants and they encountered technical difficulties with the online survey and video instructions. Many also questioned the timing of the survey because of the need to prepare for SOL exams. Students and teachers also had an opportunity to write comments on their surveys. The vast majority chose to comment on school climate and safety conditions. For example, a teacher commented:
“I have taught for over 40 years, and I have never seen an administration try so hard to make both students and teachers feel appreciated. We pick students of the month on a regular basis and reward them for their academic and behavioral efforts. We sometimes get students who have never been successful at anything, and before they leave our school, they DO become successes. This makes our whole society safer.”
There were 1,593 student comments, including 58 that praised the survey (“The survey was an excellent idea for the school”) and 48 that criticized the survey (“This survey was stupid because no one is going to listen to it and change what the students want changed.”) The most commonly expressed student concerns were complaints about school safety (179 comments), bullying (121), the fairness of school rules (112), weapons at school (68), the dress code (67), drugs (56), fighting (52), racism (47), and gangs (39). There were many positive comments by students who felt safe and supported at school. Here are three examples: 1. “This is a great school, but all schools have flaws, all schools have bullies. Safety is not an
issue here. I can go to school without worrying about my personal safety.” 2. “I feel very safe at this school and the teachers have all treated me well.” 3. “I think that our school is a very safe place to be and I wouldn’t pick any other place to be
that I could be more safe.” This Executive Summary presents a selected sample of survey results intended to give a broad overview of study findings. There are many additional results in the report that may suggest interpretations and conclusions not presented here. Readers are cautioned that the findings are descriptive and correlational, and do not necessarily indicate causal relationships. Moreover, this is a study in progress, with additional data analyses and reports to come.

VHSSS: Ninth Grade Survey Results 11
Chapter 1 Study Purpose
The purpose of the Virginia High School Safety Study is to identify student safety, discipline, and support policies that best maintain a safe and orderly school environment conducive to learning. This report presents results from the survey of ninth-grade students and teachers that was conducted as part of this larger study. Why study school safety? National concern over school violence has stimulated widespread changes in school policies and practices, but how do we know whether these changes are effective in reducing violent and disruptive behavior? Some efforts—such as zero tolerance discipline policies—are intended to create a more structured school environment, while other efforts concentrate on building supportive relationships with students. Does zero tolerance make schools safer? Do student support efforts improve student engagement in school? More broadly, what is the right balance of structure and support to maintain a safe and orderly school environment? The Virginia High School Safety Study is designed to provide some answers to these questions.
State and national trends indicate that violence in schools is not increasing, but decreasing, and that schools continue to be one of the safest places for young people (Cornell, 2006). Nevertheless, school authorities must continuously monitor the school climate and look for ways to maintain and improve a safe school environment. Moreover, even though Virginia schools are safe, there is room for improvement. According to state crime and discipline reports, in 2004-05, there were 124,543 discipline violations in the high school grades (9-12). This included 5,204 fights, 2,156 assaults, 2,367 threats, 901 weapons incidents, and 23,883 cases of disorderly conduct, as well as other types of offenses. The more serious violations resulted in 89,058 short term suspensions, 2,491 long-term suspensions, and 2,056 expulsions. Notably, ninth grade is the peak year for high school student aggression: ninth graders received 45% of these disciplinary consequences, compared to 25% for 10th grade, 16% for 11th grade, and 13% for 12th grade students. Moreover, Virginia’s expulsion rate of .169 per thousand students was among the top five in the nation (National Center for Education Statistics, 2004). What are the main study questions? The Virginia High School Safety Study is designed to investigate three main questions:
1. How much structure and support are optimal to prevent youth violence in schools? 2. How does neighborhood crime and poverty affect school crime and disorder? 3. Are there school structure and support practices that reduce disproportionate punishment
of minority students? The investigation of these questions will require the collection of data from five sources:
1. To measure school discipline violations and rates of suspension and expulsion, we are reviewing data from the annual state discipline reports;
VHSSS: Ninth Grade Survey Results 12
Minority Population
Poverty
Teacher Records
School Records
Student Reports
SchoolStructure
SchoolSupport
Crime
Dem
ogra
phic
Ris
kFa
ctor
s
Protective Factors
School Violence
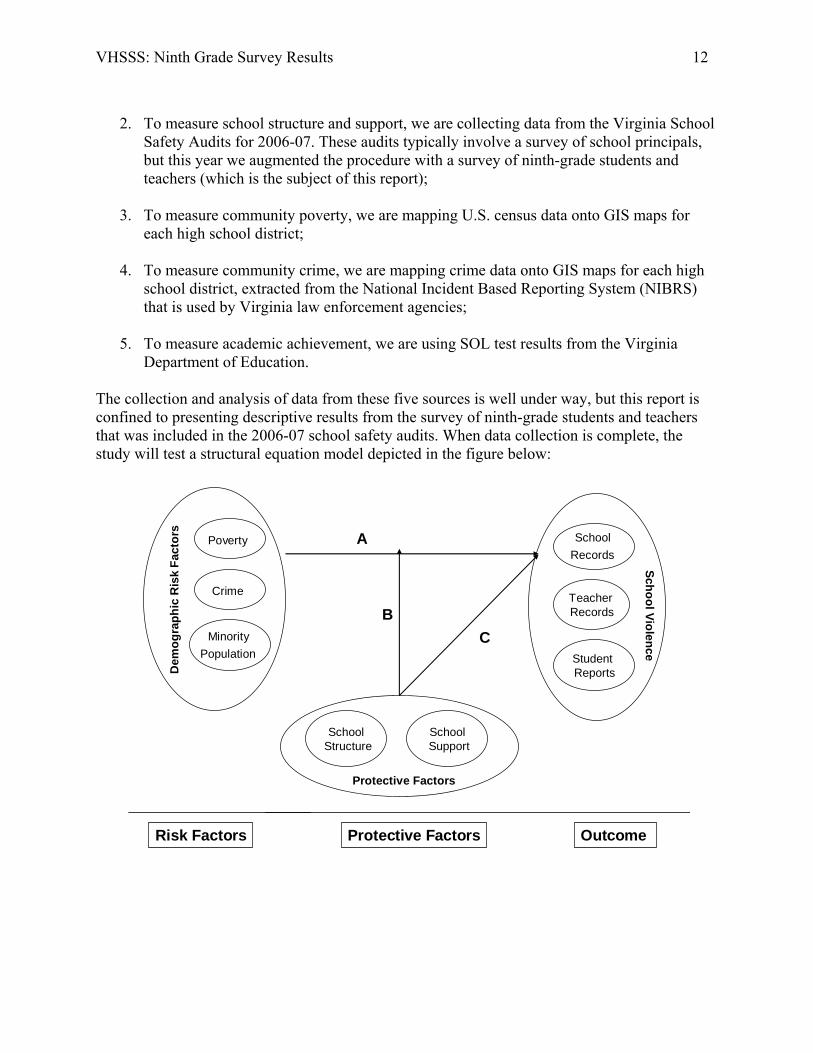
Risk Factors Protective Factors Outcome
A
BC
2. To measure school structure and support, we are collecting data from the Virginia School
Safety Audits for 2006-07. These audits typically involve a survey of school principals, but this year we augmented the procedure with a survey of ninth-grade students and teachers (which is the subject of this report);
3. To measure community poverty, we are mapping U.S. census data onto GIS maps for
each high school district; 4. To measure community crime, we are mapping crime data onto GIS maps for each high
school district, extracted from the National Incident Based Reporting System (NIBRS) that is used by Virginia law enforcement agencies;
5. To measure academic achievement, we are using SOL test results from the Virginia
Department of Education.
The collection and analysis of data from these five sources is well under way, but this report is confined to presenting descriptive results from the survey of ninth-grade students and teachers that was included in the 2006-07 school safety audits. When data collection is complete, the study will test a structural equation model depicted in the figure below:

VHSSS: Ninth Grade Survey Results 13
What questions are addressed in this report? This report is prepared at the request of the Virginia Department of Education in order to provide a summary of results from the surveys of ninth-grade students and teachers. Therefore, it addresses the following questions regarding Virginia’s ninth-grade students:
1. Structure. How do Virginia’s ninth-grade students perceive the rules, disciplinary standards, and security practices that make up the structure of the school climate?
2. Support. How do ninth grade-students perceive the school’s efforts to support students
by encouraging students to work hard and seek help when they need it? 3. Engagement. How engaged in learning and school activities are Virginia’s ninth-grade
students? 4. Victim experiences. How frequently are ninth-grade students victimized by peers and
how much bullying and teasing do they perceive in the school? The survey of teachers addresses a similar set of questions:
5. Structure. How do Virginia’s ninth-grade teachers perceive the rules, disciplinary standards, and security practices that make up the structure of the school climate?
6. Support. How do ninth-grade teachers perceive the school’s efforts to support students
by encouraging students to work hard and seek help when they need it? 7. Victim experiences. How frequently are ninth-grade teachers victimized by students and
how much bullying and teasing do they perceive in the school? To address the next series of questions, the individual survey results were aggregated at the school level in order provide a set of student-perceived measures of the school climate for each school and a set of teacher-perceived measures of the school climate for each school. The average score for students at the same school was used as a proxy or indicator of school climate (as perceived by ninth graders) and the average score for teachers at the same school was used as an indicator of school climate (as perceived by ninth-grade teachers). School climate consisted of measures of school structure, student support, student engagement, and victim experiences. Some scales were completed by both students and teachers, while other scales were specific to one group. These school-level measures were used to address an additional set of questions:
8. Student-Teacher agreement. How much agreement is there between student and teacher perceptions of the school climate?
9. Effect of school demographics on student perceptions. How do student perceptions of
school climate differ as a function of school enrollment, the percentage of low income students in the school, and the percentage of minority students in the school?
VHSSS: Ninth Grade Survey Results 14
10. Effect of school demographics on teacher perceptions. How do teacher perceptions of
school climate differ as a function of school enrollment, the percentage of low income students in the school, and the percentage of minority students in the school?
Finally, this report includes a series of questions examining the relationship of school safety to other dimensions of the school.
11. Effects of victimization on academic performance. How are high rates of victimization correlated with student achievement and engagement in learning?
12. Effects of school characteristics on victimization. How are school characteristics such
as strict enforcement of school rules correlated with victimization??
Caveats There are two important limitations to the survey results presented in this report. First, all of the survey results are based on descriptive statistics and correlations, and therefore do not establish causal relationships. Readers are cautioned not to draw firm conclusions about the direction of causal effects based on the limited evidence provided in this study. Second, these survey results are limited to the responses of ninth-grade students and teachers and do not necessarily represent the whole school. It is likely that students in higher grades would have a more mature perspective and would give somewhat different answers to many of the survey questions. However, the purpose of these analyses is to provide a common point of comparison across schools, not to provide an absolute measure of each school. Ninth grade was chosen because ninth grade is the first year of high school and ninth-grade students typically have a much higher rate of discipline problems than students in other grades. To some extent, ninth-graders might be regarded as the canary in the coal mine—a particularly vulnerable group in the high school setting that should be monitored closely. Furthermore, by gathering information from ninth-grade students, it will be useful to track the future achievement, discipline record, and graduate rate of this cohort in subsequent years. If this survey is repeated in future years, it would be desirable to obtain samples from each grade level.
VHSSS: Ninth Grade Survey Results 15
Chapter 2 Study Methods
Preparation for the Study In planning this study, the researchers placed a high priority on minimizing the burden on school administrators and the disruption of instructional time for students. Initially, three decisions were made in consultation with our collaborators in the Department of Education and Department of Criminal Justice Services:
1) The survey would be administered on-line, to minimize paperwork for school staff. 2) The survey would be administered to a small number of students in a single grade, to
avoid schoolwide disruption of student instruction. 3) The survey would be designed for administration within a standard 50-minute period,
to minimize student time out of class. In order to notify schools about the survey, the following steps were undertaken:
1) As soon as the project was approved (October 2006), the principal investigator (Dr. Cornell) consulted with representatives from the Department of Education and Department of Criminal Justice Services to plan the survey portion of the study.
2) Information was provided to two professional organizations (Virginia Association of School Superintendents and Virginia Association of Secondary School Principals) and was published in their newsletters.
3) Detailed information was posted on the websites of the University of Virginia Youth Violence Project and the Virginia Center for School Safety of the Department of Criminal Justice Services.
4) Dr. Cornell sought meetings with each regional superintendent’s group. Presentations were made to seven regional groups in December and January. Feedback from these presentations was used to make modifications to the study.
5) An additional meeting was held with State Superintendent Dr. Cannaday and a group of superintendents to review study methods and procedures for reporting results. The meeting resulted in additional modifications to study procedures.
6) Dr. Cannaday issued a superintendent’s memo advising schools about the study. To provide schools with instructions for the survey portion of the study, a packet of materials was prepared for each school. The packet included:
1) Detailed written instructions for selecting participants and administering the survey; 2) Paper copies of the survey and forms for carrying out the study; 3) Two copies of a DVD containing separate video instructions for principals, students,
and teachers, as well as electronic copies of all forms. The packet of materials was sent by U.S. postal mail to each school principal. Researchers then contacted the principals by email and telephone to verify that the packet had been received. Although no packets were returned by the U.S. postal service as undeliverable, there were 41

VHSSS: Ninth Grade Survey Results 16
schools in which school authorities reported that they did not receive a packet. The correct name and address was verified and a second packet was sent. In 7 cases, a third packet was mailed. Copies of the materials were also posted on the Internet. The timetable for the survey was developed in collaboration with the Department of Education and after consulting with a variety of school administrators. School principals were notified of the study by the Superintendents Memo 24 of January 26, 2007. Instruction packets were mailed to schools on March 4, 2007. In order to provide schools with flexibility in conducting the survey, they were asked to identify a one-week period in April when their students and teachers would complete the study. Many schools were unable to conduct the study within this timeframe, and the study period was extended for these schools. The final school to participate in the study completed its surveying in June. After schools completed student and teacher surveys, principals were required to submit a brief online report indicating how many students and teachers were invited to participate, how many declined, and how many ultimately participated. The collection of school principal surveys was completed in August. Throughout the data collection period, researchers provided telephone and email consultation with each school to answer questions about survey procedures and remained in contact with school authorities until the survey process was completed. Staff of the Virginia Center for School Safety also devoted extensive time to consulting with school authorities and encouraging their participation. School Eligibility and Participation
Three hundred and fourteen public high schools in the state of Virginia were eligible for participation in this study. Eligible schools had to include grades 9-12, provide the opportunity to earn a high school diploma, and serve a majority of students under the age of 18. Educational programs were not eligible if they were housed in a juvenile detention facility, if students attended for less than ½ the school day, or if the majority of the student population had a handicapping condition that would prevent them from being able to take the survey. Several high schools that served only grades 10-12 were not eligible for the study. The student and teacher surveys were administered as part of the annual school safety audits required of all public schools in Virginia. Virginia code § 22.1-279.8 defines the safety audit as “a written assessment of the safety conditions in each public school to (i) identify and, if necessary, develop solutions for physical safety concerns, including building security issues and (ii) identify and evaluate any patterns of student safety concerns occurring on school property or at school-sponsored events. Solutions and responses shall include recommendations for structural adjustments, changes in school safety procedures, and revisions to the school board's standards for student conduct.” Responsibility for the content and format of the school safety audit is assigned to the Virginia Center for School Safety. According to §22.1-279.8, “B. The Virginia Center for School Safety shall develop a list of items to be reviewed and evaluated in the school safety audits required by

VHSSS: Ninth Grade Survey Results 17
this section. . . . The Virginia Center for School Safety shall prescribe a standardized report format for school safety audits, additional reporting criteria, and procedures for report submission, which may include instructions for electronic submission.” Because all school divisions are mandated to complete the school safety audit, all schools were expected to participate in the student and teacher surveys. A number of school principals requested clarification of this requirement, and were referred to the Virginia Center for School Safety. All school authorities were assured that participation in the student and teachers surveys was not voluntary for schools and was necessary in order to fulfill the requirement for a school safety audit during the 2006-07 school year. School authorities were further advised by the Center for School Safety that the identities of nonparticipating schools could not be held in confidence because participation in the school safety audit was a matter of public record. Of the 314 eligible high schools, 296 (94%) submitted student surveys, 291 (93%) submitted teacher surveys, and 276 (88%) submitted both teacher and student surveys. The names of nonparticipating schools were made available to the Department of Education and the Virginia Center for School Safety. The only noteworthy difference between participating and non-participating schools was that the non-participating schools tended to be smaller in enrollment, with an average 9th grade enrollment of 250 students and a range of 9 to 633 students. Participating Schools Participating schools came from all 8 geographical regions in Virginia. The table below presents a breakdown of counties in each region based on their classification by the U.S. Census Bureau as rural areas, Metropolitan Statistical Areas, or Consolidated Metropolitan Statistical Areas. Region Rural Metropolitan
Statistical Area Consolidated Metropolitan
Statistical Area 1 0 (0%) 15 (100%) 0 (0%) 2 4 (27%) 10 (73%) 0 (0%) 3 11 (64%) 3 (18%) 3 (18%) 4 5 (26%) 2 (11%) 12 (63%) 5 8 (40%) 12 (60 %) 0 0 (0%) 6 9 (60%) 6 (40%) 0 0 (0%) 7 16 (84%) 3 (16%) 0 0 (0%) 8 12 (100%) 0 (0%) 0 0 (0%)
Note: Consolidated Metropolitan Statistical Areas (CMSA) include 1 million residents or more in their most densely populated center.

VHSSS: Ninth Grade Survey Results 18
Ninth-grade enrollment for participating schools.
Enrollment Number of schools Percentage of sample <25 students 1 <1%
25-99 38 12% 100-299 94 32% 300-499 83 28%
>500 82 28%
Schools differed substantially in the percentage of minority student enrollment, as displayed in the table below. Percentage of minority students in whole school enrollment.
Percent Minority Enrollment Number of schools Percentage of sample <10% minority students 48 18
11-30% 79 28 31-50% 59 22 51-70% 47 17 71-90% 26 10 >90% 14 5
Number of surveys per school. A total of 25 student surveys and 10 teacher surveys were requested from each school, although some schools chose to have more participants. Schools with fewer than 25 ninth-grade students or 10 ninth-grade teachers were asked to submit as many surveys as possible. Participating schools submitted an average of 25 (range 1-86) student surveys and 10 (1-24) teacher surveys. The table below displays the number of student and teacher surveys submitted across schools. For example, four schools submitted 1-5 student surveys and 20 schools submitted 1-5 teacher surveys. The largest number of schools submitted 21-25 student surveys (157 schools) and 6-10 teacher surveys (177 schools). Number of schools submitting surveys
Number of Schools Number of Surveys per School Student Surveys Teacher Surveys
1-5 4 20 6-10 3 177 11-15 7 79 16-20 12 16 21-25 157 -- 26-30 94 -- >31 17 --

VHSSS: Ninth Grade Survey Results 19
Student Sample The sample was selected from the population of students identified by their school as ninth-grade students. Ninth-grade students were not included in the study if (1) they did not read English well enough to complete the survey; (2) they had cognitive limitations (e.g., mental retardation) that prevented them from comprehending the survey; or (3) they had physical limitations that prevented them from completing the survey. Principals were sent detailed instructions for selecting a random sample of ninth-grade students and teachers to complete the survey (see appendix for a copy of the instructions). Each school was supplied with a form containing a list of random numbers that were to be matched with an alphabetized list of ninth-grade students. For example, if the first random number on the list was 12, then the twelfth student on the alphabetized list of ninth-grade students would be selected. The list of random numbers was generated individually for each school, based on its fall 2006 ninth-grade enrollment. Each school was asked to send the parents of identified students a standard letter explaining the purpose of the study and notifying them that their child was selected by random number to complete an anonymous online survey about school safety. Because parents could decline their child’s participation (by contacting the school), principals were asked to contact 50 students in order to have at least 25 students complete the survey. At the conclusion of the survey, principals were asked to complete an online form indicating how many students were identified for the study, how many parents declined, how many students were unable to participate for other reasons, and finally, how many students completed the survey. According to reports received from 291 principals, there were 112 parents who declined to allow their children to participate and 325 students who declined to participate. As indicated in the table below, there were 641 students who were absent from school when the survey was administered, 105 who were suspended, and 142 who had moved or transferred. There were 68 who were unable to take the survey for language reasons and 590 who were unable to take the survey for other reasons (such as a field trip, SOL exam preparation, or a handicapping condition that prevented the student from taking the survey). Overall, 1,983 alternate students had to be invited to participate in the study, with each school contacting an average of 6.8 alternate students. Students who did not participate in the survey
Reports from 291 principals Students Parents declined 112Students declined 325Students absent due to illness 641Students absent due to suspension 105Student had moved or transferred 142Language barrier prevented student from taking survey 68Other (absent due to field trip, alternative placement, homebound instruction, or SOL exam preparation/disability made student ineligible)
590

VHSSS: Ninth Grade Survey Results 20
Students completed the survey anonymously, reporting only their age, grade, race, and school. Students selected the name of their school from a scroll-down list and then clicked on the school name before proceeding to the next question. After the surveying began, it was evident that some students did not correctly identify the name of their school. It is likely that some students made an error in scrolling down the list and accidentally clicked on the wrong school name. It is also possible that some students intentionally clicked on the wrong school name. Fortunately, the IP address and the date of survey completion were automatically documented as part of the survey record. As a result, the school name reported by each student was checked against the IP address (a unique number assigned to each computer operating on the Internet) for the computer used to complete the survey. Researchers verified the school division which owned the IP address and the known dates the school was using to complete the survey. In this way, 189 surveys with the wrong school name were identified and corrected. The origin of 5 student surveys could not be determined and were dropped from the analysis. The same verification process was used to correct 23 teacher surveys and 4 online reports completed by principals. The origin of 8 teacher surveys could not be determined. All principal reports were connected with the correct school. Sample characteristics. The final sample consisted of 7,318 9th grade students who completed surveys. Of these students, 49% were girls and 51% were boys. The student sample was 63 % White/Caucasian, 23% Black/African American, 5% Latino/Hispanic, 3% Asian American, 1% American Indian, and 5% Other. This distribution does not differ substantially from the high school population described in a 2005 survey conducted by the National Center for Education Statistics, which reported 68% Caucasian, 20% African American, 6% Hispanic, 5% Asian American, <1% American Indian, and <2% Other. The mean age of student participants was 14.8, with a range of 12 to 17 years. See table below for the distribution of student ages. Age distribution for participating students
12 13 14 15 16 17 Number of Students 1 12 2272 4175 790 181Percentage of Sample <1% <1% 31% 56% 11% 2% Teacher Sample
The teacher sample was selected by a procedure similar to the student sample. Principals received a random number list to use in selecting ninth-grade teachers from their alphabetized list of teachers. For purposes of this study, a ninth-grade teacher was defined as any teacher who had at least two classes filled with predominantly ninth-grade students at the time of survey administration. Principals identified approximately 20 teachers in order to gain a sample of 10 teachers per school. Schools with fewer than ten ninth-grade teachers were encouraged to have all available

VHSSS: Ninth Grade Survey Results 21
ninth-grade teachers complete the survey. Teachers were contacted by letter and invited to participate in the study. Teachers who declined to participate were replaced by the next teacher identified on the random number list. According to reports received from 291 principals, there were 163 teachers who declined to participate, 140 who were absent the week of administration, and another 162 who, for unknown reasons, did not complete the survey. Sample characteristics. Of the 2,922 teachers who completed the survey, 64% were female and 36% were male. Eighty-three percent of the teachers were White, 12% were African-American, 2% were Latino, 1% were Asian-American, 1% were American Indian and 1% were Other. The teachers reported a wide range of teaching experience, as shown in the table below. Years of experience among participating teachers (2919 teachers reporting)
1-5 years 6-10 years 11-15 years >16 years Number of teachers 1056 613 365 885Percentage of sample 36% 21% 13% 30%
Student Survey Measures Measures of school structure 1. Experience of School Rules is a 7-item scale that measures perceptions of the school rules as fair and strictly enforced. This scale has been used in the School Crime Supplement to the National Crime Victimization Survey (NCES, 2005). 2. Security Measures is an index of 9 security measures (e.g., metal detectors, security cameras) that students are asked to identify as present or absent at their school. These items are taken from the School Crime Supplement to the National Crime Victimization Survey (NCES, 2005) 3. The Awareness of Zero Tolerance Policies index asks students whether the school has zero tolerance (automatic expulsion or lengthy suspension) for any of 10 different infractions, ranging from bringing a gun to school to fighting at school. 4. In order to gauge out-of-class time, the Time out of Class questions ask students how much time they have for lunch, how many minutes they have to change classes, and how many times they change class in a typical day. These items were suggested for the survey by a school principal. 5. The Daily Structure scale (Cornell, 2006) consists of 6 items devised for this study to measure student perceptions of how strictly rules were enforced for common problems such as cutting class, coming late to class, smoking, fighting, and speaking sarcastically to a teacher.

VHSSS: Ninth Grade Survey Results 22
Measures of student support efforts 6. Help-seeking is an 8-item scale from the School Climate Bullying Survey (Cornell & Sheras, 2003) designed to measure student willingness to seek help from school staff members for bullying and threats of violence. 7. Help-seeking Behavior is a 4-item scale designed for this study to measure how often students actually sought help from a teacher for academic or non-academic concerns (Eliot, 2006). 8. Learning/Working Environment is an 8-item scale used to measure how much students perceive that adults in their school care about all students and treat them fairly (Austin & Duerr, 2005). Measures of student engagement 9. Commitment to school is a 9-item scale developed to measure how much a student likes school and tries hard to do well (Thornberry, Lizotte, Krohn, Farnworth, Jang, 1991). 10. The Belief in School Rules index consists of 16 items asking whether the student’s friends support breaking various rules such as cheating on tests, getting into fights, and skipping school (Stewart. 2003). This scale indirectly measures the student’s acceptance of school rules without asking the student to make an admission of guilt. 11. The Aggressive Attitudes scale consists of 6 items measuring the student’s endorsement of beliefs and attitudes that support aggressive behavior, such as the conviction that if you fight, others will look up to you and the attitude that bullying and hitting others is enjoyable. This scale was taken from the School Climate Bullying Survey (Cornell & Sheras, 2003). 12. The Trust in Teacher Authority scale asks 5 questions about the student’s respect for the authority of their teachers (Gregory, 2005). 13. The School Involvement index surveys students about their involvement in various extracurricular activities, ranging from athletic teams to school government. This list is taken from the School Crime Supplement to the National Crime Victimization Survey (NCES, 2005). 14. The Academic Press scale (Midgley et al., 2000) contains 6 items measuring how much teachers press the student to study hard and do challenging work. Measures of student victimization. 15. The Victimization index consists of 7 forms of victimization ranging from theft of personal property to being physically attacked that have been used in previous studies (Gottfredson, 1999). Because the 7 items cover such a wide range, this index was subdivided into Major Victimization (being physically attacked or having a weapon pulled on you) and Minor Victimization (damage or theft of personal property, receiving obscene remarks or being threatened by a student).

VHSSS: Ninth Grade Survey Results 23
16. The Bullying Climate scale consists of 7 items describing the extent of teasing and bullying that takes place at school. These items are taken from the Bullying School Climate Bullying Survey (Cornell & Sheras, 2003). 17. The Bullying Index asks students how frequently they have been victims of various forms of bullying. These 4 items are taken from the Bullying School Climate Bullying Survey (Cornell & Sheras, 2003). 18. The Bully Reporting questions ask students whether they have told anyone that they were bullied in the past 30 days. 19. The Gang questions ask students whether there are gangs at their school, and if so, whether those gangs have been involved in violence and drug sales at school in the past six months. 20. The Validity questions ask students whether they are being honest and telling the truth on the survey. These questions help identify a small group of students who answer the survey randomly or who admit making inappropriate responses. Teacher Survey Measures Measures of school structure 1. Experience of School Rules is a 7-item scale that measures perceptions of the school rules as fair and strictly enforced. This scale has been used in the School Crime Supplement to the National Crime Victimization Survey (NCES, 2005). 2. Security Measures is an index of 9 security measures (e.g., metal detectors, security cameras) that teachers are asked to identify as present or absent at their school. These items are taken from the School Crime Supplement to the National Crime Victimization Survey (NCES, 2005) 3. The Awareness of Zero Tolerance Policies index asks teachers whether the school has zero tolerance (automatic expulsion or lengthy suspension) for any of 10 different infractions, ranging from bringing a gun to school to fighting at school. 4. In order to gauge out-of-class time, the Time out of Class questions ask teachers how much time students have for lunch, how many minutes they have to change classes, and how many times they change class in a typical day. These items were suggested for the survey by a school principal. 5. The Daily Structure scale (Cornell, 2006) consists of 6 items devised for this study to measure teacher perceptions of how strictly rules were enforced for common problems such as cutting class, coming late to class, smoking, fighting, and speaking sarcastically to a teacher
VHSSS: Ninth Grade Survey Results 24
Measures of student support 6. Help-seeking is a 6-item scale from the School Climate Bullying Survey (Cornell & Sheras, 2003) designed to measure teacher perceptions of student willingness to seek help from school staff members for bullying and threats of violence. 7. Learning/Working Environment is an 8-item scale that was adapted for this study to measure how much teachers perceive that administrators in their school care about all teachers and treat them fairly (Austin & Duerr, 2005). 8. The Encouragement of help seeking scale is a 7-item scale developed for this study designed to measure the frequency with which teachers encourage students to seek help from school staff for a variety of problems (Eliot, 2006). Measures of student engagement 9. The Academic Press scale (Midgley et al., 2000) contains 6 items measuring how much teachers press the student to study hard and do challenging work Measures of teacher victimization 10. The Victimization index consists of 8 forms of victimization ranging from theft of personal property to being physically attacked that have been used in previous studies (Gottfredson, 1999). Because the 8 items cover such a wide range, this index was subdivided into Major Victimization (being physically attacked or having a weapon pulled on you) and Minor Victimization (damage or theft of personal property, receiving obscene remarks or being threatened by a student). 11. The Bullying Climate scale consists of 7 items describing the extent of teasing and bullying that takes place at school. These items are taken from the Bullying School Climate Bullying Survey (Cornell & Sheras, 2003). 12. The Gang questions ask teachers whether there are gangs at their school, and if so, whether those gangs have been involved in violence and drug sales at school in the past six months. Survey Procedure An instructional video was sent to all schools with separate instructions for teachers and students. The purpose of the video was to give all students and teachers a common understanding of the survey and to encourage their participation. The video for students contained two parts: (1) an explanation of the purpose of the study presented by Miss Virginia 2006, Adrianna Sgarlata; and (2) a short dramatization of the survey procedure presented by a group of high school drama students. The video for teachers had the same introduction by Miss Virginia, but a different dramatization by a group of high school drama students and teachers.
VHSSS: Ninth Grade Survey Results 25
Principals were asked to administer the survey to groups of students seated at individual computers in a quiet room supervised by a staff member. Students were to begin by viewing the instructional video, and then use their web browser to view the survey website and complete the survey. Teachers were asked to self-administer the survey on any school computer within the same week that students took the survey. Teachers were to watch the instructional video and then complete the survey. Lessons Learned to Improve Future Surveys 1. Choice of sample. Many school superintendents expressed concern about the choice of ninth-grade students for the survey. Ninth graders are not representative of the whole student body, they are less mature than the other students, and they include a disproportionate number of students who failed to advance beyond ninth grade in previous years. Unfortunately, this advice was received too late to expand the survey, but in future years it would be desirable to survey all grades. Furthermore, some superintendents were concerned that a sample of just 25 students would not be sufficient to characterize their school. Although there are statistical reasons why a sample of 25 per school is sufficient for the purposes of this study, it would be desirable to survey a larger sample of students, or survey all available students, in future surveys. 2. Use of DVDs to convey video instructions. A number of schools found it difficult to use a DVD to present video instructions to students and teachers. Some school personnel were unfamiliar with the distinction between a CD and DVD, and were not prepared to make copies of the DVD video available to groups of students for viewing prior to taking the survey. Some principals thought that the DVD was defective, although we were not able to find a single defective DVD among those that were returned to us. In almost every case, we were able to resolve the problem over the telephone with the technology advisor for the school. In future studies, it might be preferable to place the video on the web for downloading and viewing. The most significant problem with this approach is that school computers might not be well-equipped to download high quality videos. 3. Identification of schools. Survey participants identified their school by clicking on the name of their school from a drop-down list of schools. This proved to be prone to error, as many students, as well as some teachers and principals, clicked on the wrong school. Fortunately, the correct school identity could be determined by checking the IP address for the computer used to take the survey, but this is a time consuming process. Another approach would be to assign each school a unique code number and require participants to write in the code number for their school in order to take the survey. The code numbers would have to be sufficiently diverse (e.g., not in consecutive order) that students could not readily type in a number that happened to correspond to a different school. 4. Use of commercial survey company. The commercial survey company Survey Monkey was used to administer the online survey. Although Survey Monkey has some attractive features and it is easy to construct a survey, there were a number of technical problems. Most notably, the survey went offline several times during the administration period. This was inconvenient for schools that had scheduled students to take the survey and then found that the survey was not

VHSSS: Ninth Grade Survey Results 26
available. Moreover, Survey Monkey relies almost entirely on email correspondence and the inability to speak with a live consultant made it difficult to resolve problems. 5. Special delivery of packets. Many principals reported that they did not receive the instruction packet, although all of the addresses were confirmed as correct and no packets were returned by the U.S. Postal Service as undeliverable. In many cases, school personnel reported finding that the packet had been received, but misplaced. In some cases, two and even three packets were mailed. In future surveys, it may be desirable to send the packets by special delivery to raise awareness of their arrival and to obtain a signature to confirm their receipt. 6. Survey administration schedule. Many school principals complained that the survey should not be administered in April because it interfered with preparation for SOL testing. In future years, it may be preferable to administer the survey in February or March.
VHSSS: Ninth Grade Survey Results 27
Chapter 3 Student Survey Descriptive Results
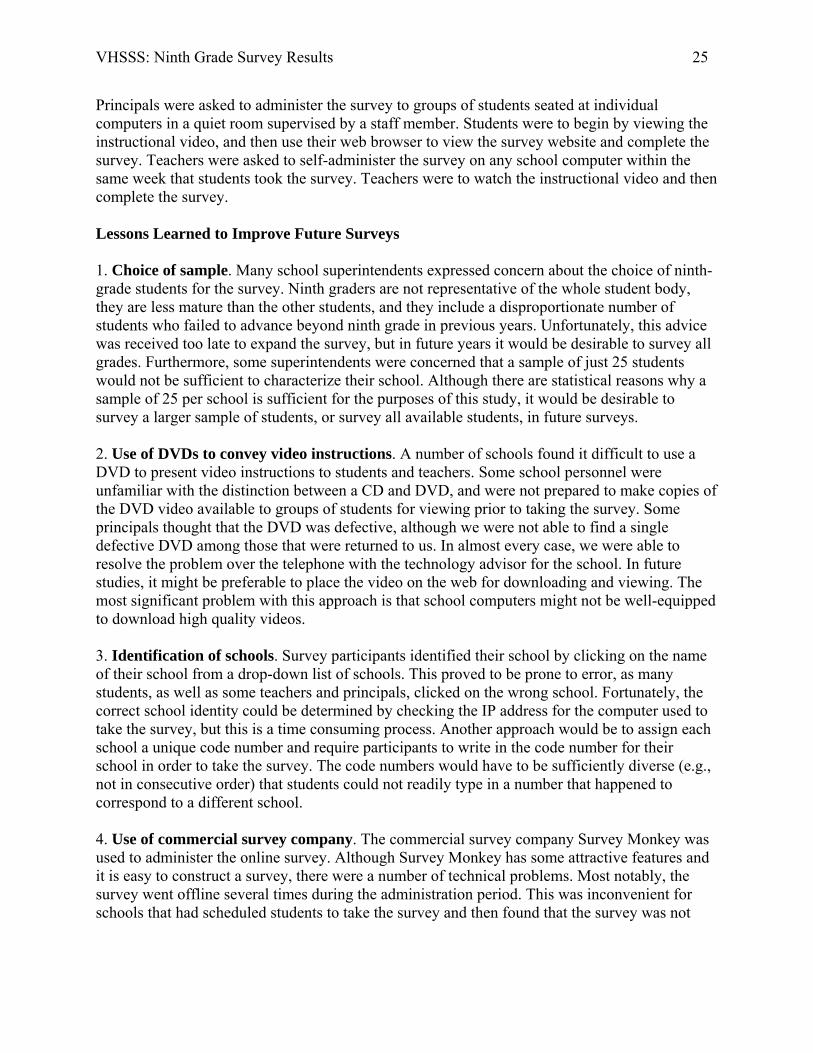
Measures of School Structure Experience of school rules scale
Source: School Crime Supplement to the National Crime Victimization Survey (NCES, 2005) Overall, most students agree or strongly agree that the school rules are known by everyone (67%). In addition, most students agree or strongly agree that the school rules are strictly enforced (70%) and if a student breaks the rules, he or she will be punished (84%). About half the students agree or strongly agree that the school rules are fair (58%). There were mixed opinions regarding whether students agree that there is a strict dress code at school (52%).
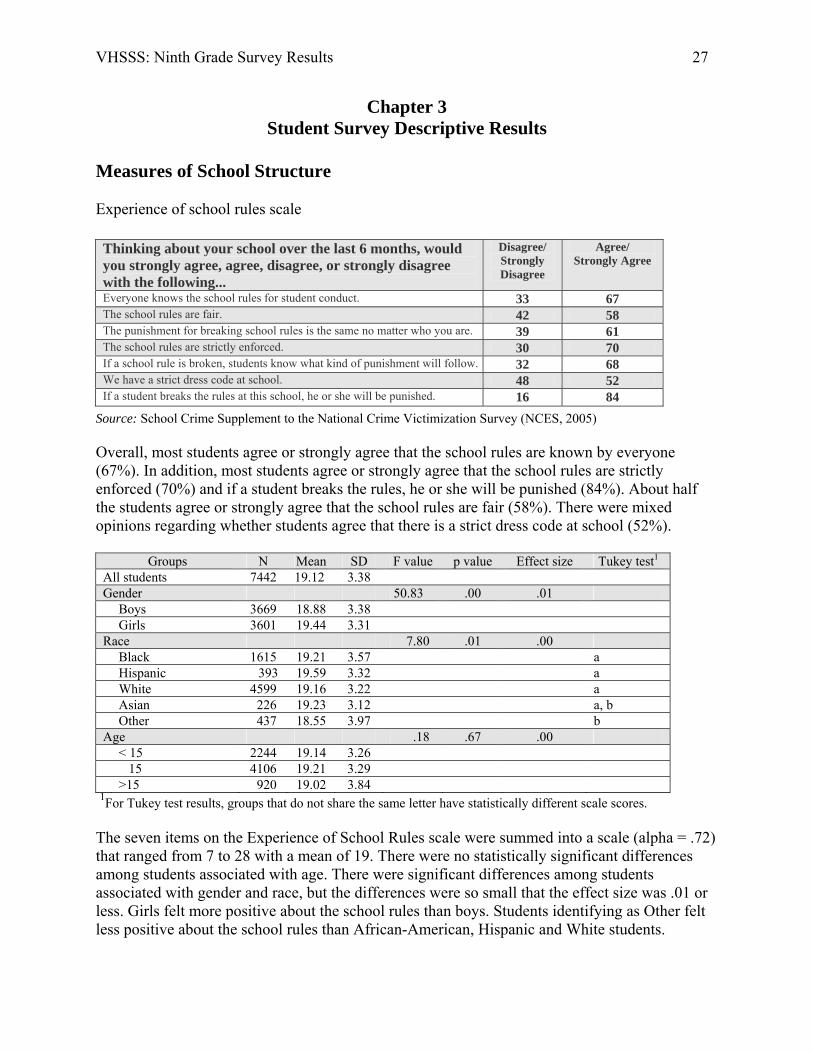
Groups N Mean SD F value p value Effect size Tukey test1 All students 7442 19.12 3.38 Gender 50.83 .00 .01 Boys 3669 18.88 3.38 Girls 3601 19.44 3.31 Race 7.80 .01 .00 Black 1615 19.21 3.57 a Hispanic 393 19.59 3.32 a White 4599 19.16 3.22 a Asian 226 19.23 3.12 a, b Other 437 18.55 3.97 b Age .18 .67 .00 < 15 2244 19.14 3.26 15 4106 19.21 3.29 >15 920 19.02 3.84
1For Tukey test results, groups that do not share the same letter have statistically different scale scores. The seven items on the Experience of School Rules scale were summed into a scale (alpha = .72) that ranged from 7 to 28 with a mean of 19. There were no statistically significant differences among students associated with age. There were significant differences among students associated with gender and race, but the differences were so small that the effect size was .01 or less. Girls felt more positive about the school rules than boys. Students identifying as Other felt less positive about the school rules than African-American, Hispanic and White students.
Thinking about your school over the last 6 months, would you strongly agree, agree, disagree, or strongly disagree with the following...
Disagree/ Strongly Disagree
Agree/ Strongly Agree
Everyone knows the school rules for student conduct. 33 67 The school rules are fair. 42 58 The punishment for breaking school rules is the same no matter who you are. 39 61 The school rules are strictly enforced. 30 70 If a school rule is broken, students know what kind of punishment will follow. 32 68 We have a strict dress code at school. 48 52 If a student breaks the rules at this school, he or she will be punished. 16 84
VHSSS: Ninth Grade Survey Results 28
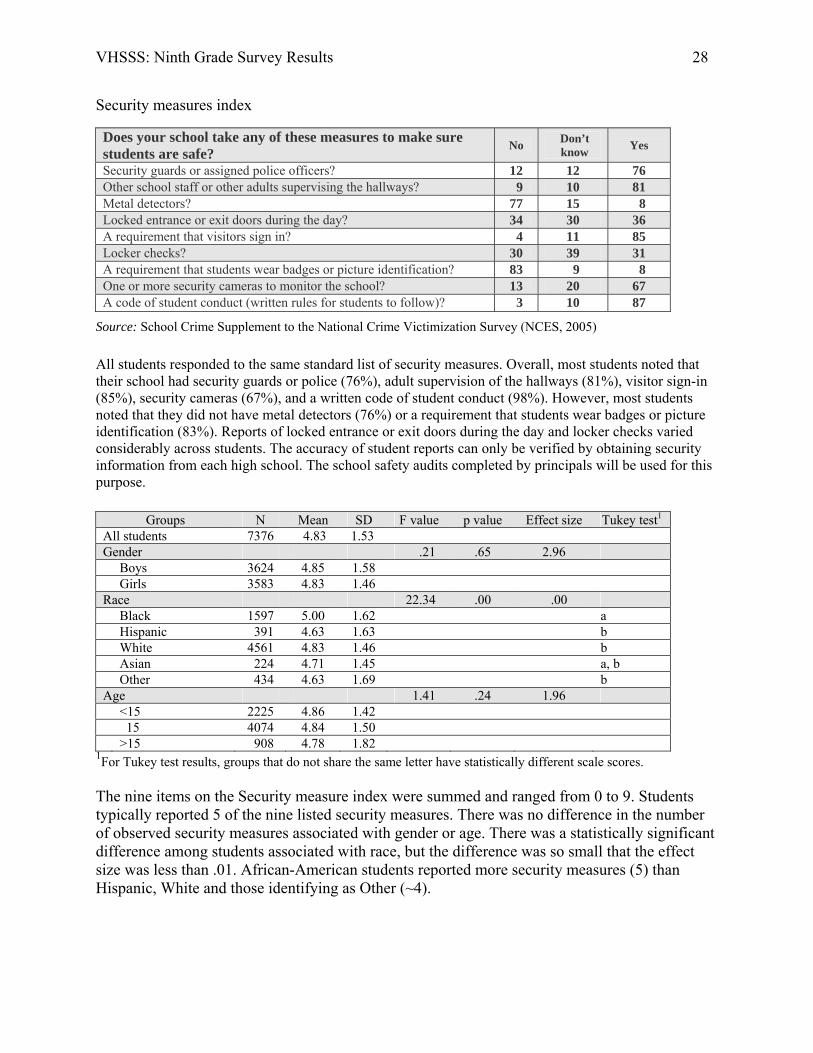
Security measures index
Source: School Crime Supplement to the National Crime Victimization Survey (NCES, 2005) All students responded to the same standard list of security measures. Overall, most students noted that their school had security guards or police (76%), adult supervision of the hallways (81%), visitor sign-in (85%), security cameras (67%), and a written code of student conduct (98%). However, most students noted that they did not have metal detectors (76%) or a requirement that students wear badges or picture identification (83%). Reports of locked entrance or exit doors during the day and locker checks varied considerably across students. The accuracy of student reports can only be verified by obtaining security information from each high school. The school safety audits completed by principals will be used for this purpose.
Groups N Mean SD F value p value Effect size Tukey test1 All students 7376 4.83 1.53 Gender .21 .65 2.96 Boys 3624 4.85 1.58 Girls 3583 4.83 1.46 Race 22.34 .00 .00 Black 1597 5.00 1.62 a Hispanic 391 4.63 1.63 b White 4561 4.83 1.46 b Asian 224 4.71 1.45 a, b Other 434 4.63 1.69 b Age 1.41 .24 1.96 <15 2225 4.86 1.42 15 4074 4.84 1.50 >15 908 4.78 1.82
1For Tukey test results, groups that do not share the same letter have statistically different scale scores. The nine items on the Security measure index were summed and ranged from 0 to 9. Students typically reported 5 of the nine listed security measures. There was no difference in the number of observed security measures associated with gender or age. There was a statistically significant difference among students associated with race, but the difference was so small that the effect size was less than .01. African-American students reported more security measures (5) than Hispanic, White and those identifying as Other (~4).
Does your school take any of these measures to make sure students are safe? No Don’t
know Yes
Security guards or assigned police officers? 12 12 76 Other school staff or other adults supervising the hallways? 9 10 81 Metal detectors? 77 15 8 Locked entrance or exit doors during the day? 34 30 36 A requirement that visitors sign in? 4 11 85 Locker checks? 30 39 31 A requirement that students wear badges or picture identification? 83 9 8 One or more security cameras to monitor the school? 13 20 67 A code of student conduct (written rules for students to follow)? 3 10 87

VHSSS: Ninth Grade Survey Results 29
Awareness of zero tolerance policies index
Source: Virginia Dept. of Criminal Justice Services, 2005 Students were asked for their perceptions of whether their school had zero tolerance for various infractions. Overall, most students reported that their school had zero tolerance for a gun (88%), a BB gun or similar gun (82%), a toy gun (62%), a cutting weapon (79%), illegal drugs (84%), and alcohol (80%). Most students also reported zero tolerance for fighting at school (69%). Reports were mixed regarding bringing legal drugs to school and belonging to a gang. The accuracy of student reports will be verified by obtaining security information from the school safety audits completed by principals.
1For Tukey test results, groups that do not share the same letter have statistically different scale scores.
The ten items on the Awareness of Zero Tolerance index were summed and ranged from 0 to 10. Most students were aware of zero tolerance policies in their schools for 7 of the 9 offenses listed. There were no differences in the awareness of zero tolerance associated with race. There were some statistically significant differences among students associated with gender and age. Girls were more aware of zero tolerance rules compared to boys. Students older than 15 were less aware of zero tolerance rules than students 15 or younger. However, the difference was so small that the effect size was less than .01.
Zero tolerance means that a student is automatically expelled or given a lengthy suspension for any violation of the rule. Does your school have zero tolerance for:
No Don’t know Yes
Bringing a gun to school? 7 5 88 Bringing a BB gun, pellet gun, or similar gun to school? 7 11 82 Bringing a toy gun or something that looks like a gun to school? 9 29 62 Bringing in edged or cutting weapons such as knives? 9 12 79 Bringing illegal drugs to school? 8 8 84 Bringing legal drugs, such as prescription drugs and over the counter medications, to school? 18 32 50
Bringing alcohol to school? 8 12 80 Belonging to a gang? 21 40 39 Fighting at school? 17 14 69 Does your school have zero tolerance for some other reason not mentioned above? 27 66 7
Groups N Mean SD F value p value Effect size Tukey test1 All students 7280 6.54 2.60 Gender 4.80 .03 6.74 Male 3574 6.49 2.60 Female 3542 6.63 2.58 Race .31 .58 4.28 Black 1590 6.50 2.87 Hispanic 385 6.06 2.93 White 4498 6.65 2.42 Asian 220 6.46 2.46 Other 423 6.27 2.88 Age 7.48 .01 .00 <15 2194 6.63 2.45 A 15 4024 6.57 2.55 A >15 898 6.31 3.07 B
VHSSS: Ninth Grade Survey Results 30
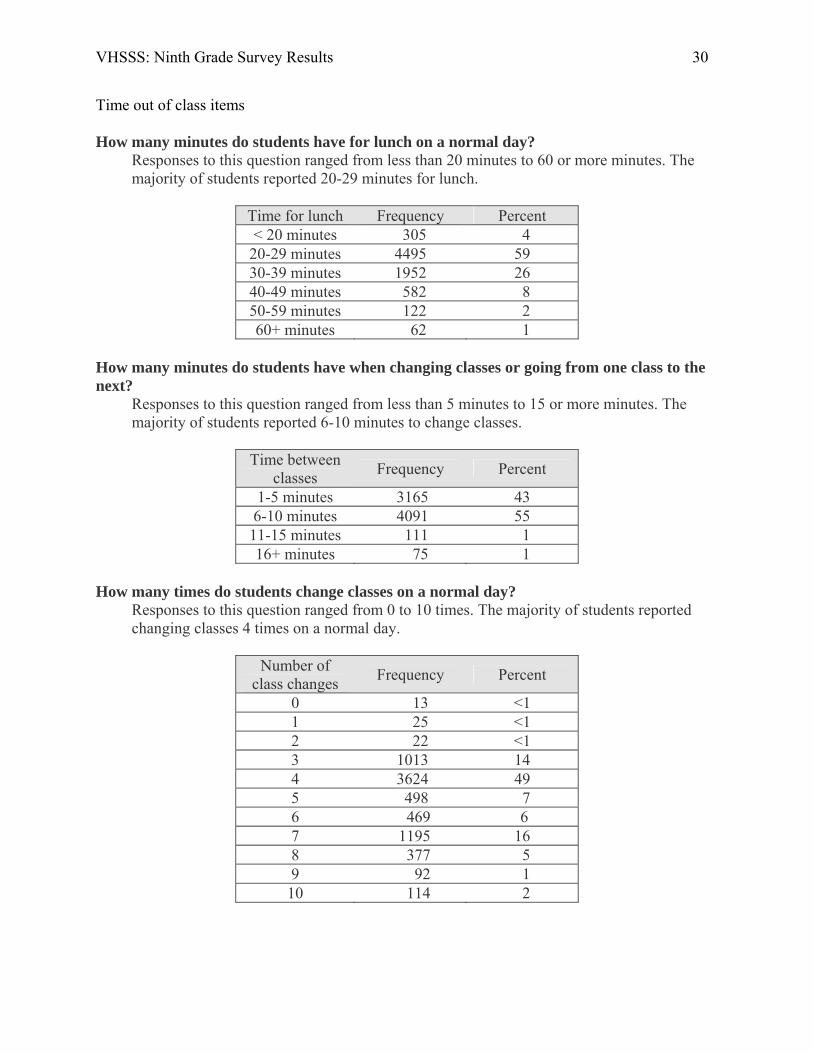
Time out of class items How many minutes do students have for lunch on a normal day?
Responses to this question ranged from less than 20 minutes to 60 or more minutes. The majority of students reported 20-29 minutes for lunch.
Time for lunch Frequency Percent < 20 minutes 305 4
20-29 minutes 4495 59 30-39 minutes 1952 26 40-49 minutes 582 8 50-59 minutes 122 2 60+ minutes 62 1
How many minutes do students have when changing classes or going from one class to the next?
Responses to this question ranged from less than 5 minutes to 15 or more minutes. The majority of students reported 6-10 minutes to change classes.
Time between classes Frequency Percent
1-5 minutes 3165 43 6-10 minutes 4091 55 11-15 minutes 111 1 16+ minutes 75 1
How many times do students change classes on a normal day?
Responses to this question ranged from 0 to 10 times. The majority of students reported changing classes 4 times on a normal day.
Number of class changes Frequency Percent
0 13 <1 1 25 <1 2 22 <1 3 1013 14 4 3624 49 5 498 7 6 469 6 7 1195 16 8 377 5 9 92 1 10 114 2

VHSSS: Ninth Grade Survey Results 31
Daily structure scale
How likely are the following? Not at all
Likely/ Not Likely
Likely/ Very
Likely If a student was wandering in the hallways during class time, how likely would an adult stop the student? 48 52
If a student cut a class, how likely would the student be caught? 41 59 If a student smoked a cigarette at school, how likely would the student be caught? 37 63
If two students got into a fight at school, how likely would they get caught? 8 92 If a student was five minutes late for class, how likely would teachers overlook it? 56 44
If a student said something sarcastic to a teacher, how likely would the teacher overlook what the student said? 43 57
Source: Cornell, 2006
Overall, most students think it is likely or very likely for other students to be caught either smoking (63%) or getting into fights at school (92%). Over half reported that it was likely or very likely that adults would stop students from wandering in the halls during class time (52%), that students will be caught cutting class (59%), and that teachers would overlook sarcastic comments from students (57%). On the other hand, over half the students do not think that teachers would overlook a student being five minutes late to class (56%).
Groups N Mean SD F value p value Effect size Tukey test1
All students 7442 16.41 2.60 Gender 17.29 .00 .00 Boys 3669 16.30 2.63 Girls 3601 16.55 2.54 Race 9.02 .00 .00 Black 1615 16.42 2.60 a, b Hispanic 393 16.08 2.54 a, c White 4599 16.52 2.57 b Asian 226 16.14 2.39 a, b, c Other 437 15.87 2.71 c Age .37 .69 1.01 <15 2244 16.41 2.56 15 4106 16.44 2.69 >15 920 16.37 2.77
1For Tukey test results, groups that do not share the same letter have statistically different scale scores. The six items of the Daily Structure scale were summed into a scale from 6 to 24 with a mean of 16. There were no statistical differences among students associated with age. Students differed significantly based on gender and race; however, the differences were small (effect size = .00). Girls were more likely than boys to report that students were did not get away with breaking school rules. Additionally, White students were more likely to report that students would get caught breaking rules than Hispanic and those identifying as Other. Students identifying as Other were also less likely to report that students would get caught than African-American students.

VHSSS: Ninth Grade Survey Results 32
Measures of Student Support Help seeking scale How much do you agree or disagree with these statements?
Somewhat Disagree/
Strongly Disagree
Somewhat Agree/ Strongly
Agree If another student was bullying me, I would tell one of the teachers or staff at school. 46 54
There are adults at this school I could turn to if I had a personal problem. 26 74
If I tell a teacher that someone is bullying me, the teacher will do something to help. 21 79
Students tell teachers when other students are being bullied. 69 31 If another student talked about killing someone, I would tell one of the teachers or staff at school. 21 79
If another student brought a gun to school, I would tell one of the teachers or staff at school. 16 84
Teachers here make it clear to students that bullying is not tolerated. 33 67 Students here try to stop bullying when they see it happening. 63 37
Source: Cornell & Sheras, 2003 Overall, most students somewhat agree or agree that there are adults at school to whom they could turn with personal problems (74%), would report another student if they talked about killing someone (79%) and would report guns at school (84%). The majority of students reported that teachers make it clear that bullying is not tolerated (67%) and will do something to stop bullying (79%). Slightly more than half the students (54%) somewhat agree or strongly agree that they would tell one of the teachers or staff at school if they were being bullied. Most students somewhat disagree or strongly disagree that students tell teachers about bullying (69%) and that students try to stop bullying after witnessing it happen (63%).
Groups N Mean SD F value p value Effect size Tukey test1 All students 7339 22.2 4.68 Gender 97.75 .00 .01 Boys 3714 21.67 4.83 Girls 3625 22.75 Race 26.53 .00 .00 Black 1643 21.24 4.89 a Hispanic 394 22.34 5.03 b White 4632 22.62 4.49 b Asian 228 22.75 4.36 b Other 442 20.98 5.00 a Age 3.26 .07 4.01 <15 2255 22.21 3.89 15 4135 22.31 3.84 >15 949 21.73 4.13
1For Tukey test results, groups that do not share the same letter have statistically different scale scores. The eight items on the Help Seeking scale were summed into a scale that ranged from 8 to 32 with a mean of 22. There were no statistical differences among students associated with age, although students differed slightly based on gender and race. The effect sizes were so small that the effect sizes were .01 or lower. Girls reported more positively about seeking help at school compared to boys. Hispanic, White and Asian students were more likely to agree that students seek help than Black students or those identifying as Other.

VHSSS: Ninth Grade Survey Results 33
Help seeking behavior scale
During the past 6 months, how many times have you… Never Once or
Twice
About Once a week
Several Times a Week
Gone to a teacher (or other adult at school) for academic help? 22 48 19 11
Asked a teacher (or other adult at school) for advice? 47 37 10 6 Told a teacher (or other adult at school) about something that worries you? 66 26 5 3
Told a teacher (or other adult at school) about a friend who was in trouble? 76 19 3 2
Source: Eliot, 2006 Overall, most students reported that they never told a teacher about a friend who was in trouble (76%) or about something that worried them (66%). Almost half of students reported that they never asked a teacher for advice (48%) and only went to a teacher for academic help once or twice (47%).
Groups N Mean SD F value p value Effect size Tukey test1
All students 7240 7.00 4.68 Gender 44.54 .00 .01 Boys 3653 6.53 2.27 Girls 3583 6.89 2.35 Race 14.06 .00 .01 Black 1602 7.01 2.51 a Hispanic 390 6.58 2.41 b White 4585 6.58 2.18 b Asian 226 6.49 2.21 b Other 433 7.09 2.69 a Age 21.22 .00 .01 <15 2255 6.55 2.21 a 15 4135 6.69 2.27 a >15 909 7.14 2.69 b
1For Tukey test results, groups that do not share the same letter have statistically different scale scores. The four items on the Help seeking behavior scale were summed into a scale that ranged from 4 to 16 with a mean of 7. There were statistical differences among students associated with gender, race, and age. However, the effect sizes were so small that the effect sizes were .01 or lower. Girls were more likely than boys to report help-seeking behaviors. African-American students and those identifying as Other were more likely to report seeking a teacher or another adult at school for help. Additionally, students older than 15 were more likely to report seeking help from a teacher or another adult at school.

VHSSS: Ninth Grade Survey Results 34
Learning/Working environment scale How much do you agree that adults in this school…
Disagree/ Strongly Disagree
Somewhat Agree
Agree/ Strongly
Agree Really care about all students. 17 37 46 Acknowledge and pay attention to students. 14 38 48 Want all students to do their best. 8 22 70 Listen to what students have to say. 21 38 41 Believe that every student can be a success. 18 29 53 Treat all students fairly. 37 30 33 Support and treat students with respect. 19 34 47 Feel a responsibility to improve the school. 18 33 49
Source: Austin & Duerr, 2005 Overall, most students report a positive perception of the school as a learning environment. Notably, most students agree or strongly agree that adults in their school want students to do their best (70%). Slightly more than half (53%) of students agree or strongly agree that adults in their schools believe that every student can be a success. There was less agreement on the other items, but in each case, the majority agreed to some extent that the environment was positive.
Groups N Mean SD F value p value Effect size Tukey test1 All students 7338 27.25 6.82 Gender 3.47 .06 4.73 Boys 3714 27.10 6.94 Girls 3624 27.40 6.68 Race 25.06 .00 .00 Black 1643 25.81 7.00 a Hispanic 394 28.31 6.79 b White 4631 27.78 6.61 b Asian 228 28.34 6.62 b Other 442 25.55 7.32 a Age 13.95 .00 .01 <15 2255 27.30 6.75 a, b 15 4135 27.34 6.66 a >15 948 26.74 7.59 b
1For Tukey test results, groups that do not share the same letter have statistically different scale scores. The eight items of the Learning/Working Environment scale were summed into a scale (alpha = .92) that ranged from 8 to 40 with a mean of 27. There were no statistically significant differences in perceptions of support among students associated with gender, but there were differences associated with race and age. Hispanic, White, and Asian students felt more positively about the learning and working environment in their schools than Black students and those identifying as Other. Students, age 15, reported slightly more positive perceptions of support received from adults than older students.

VHSSS: Ninth Grade Survey Results 35
Measures of Student Engagement Commitment to school
How much do you agree or disagree with these statements? Disagree/ Strongly Disagree
Agree/ Strongly Agree
You like school a lot. 50 50 School is boring to you. 35 65 You do poorly at school. 75 15 You don’t really belong at school. 87 13 Homework is a waste of time. 58 42 You try hard at school. 13 87 You usually finish your homework. 24 76 Getting good grades is very important to you. 9 91 Sometimes you do extra work to improve your grades. 27 73
Source: Thornberry, Lizotte, Krohn, Farnworth, Jang, 1991 Overall, most students disagree or strongly disagree that they do poorly at school (75%), don’t really belong at school (87%), or think homework is a waste of time (58%). Most students believe they try hard at school (87%), usually finish their homework (76%), value getting good grades (91%), and sometimes do extra work to improve grades (73%). However, most students agree or strongly agree that school is boring (65%).
Groups N Mean SD F value p value Effect size Tukey test1 All students 7240 27.00 4.04 Gender 295.14 .00 .04 Boys 3653 25.30 4.61 Girls 583 27.14 4.47 Race 12.73 .00 .01 Black 0 1602 26.82 4.27 a Hispanic 390 25.83 4.78 b White 8 4585 25.98 4.72 b Asian 226 27.15 4.39 a Other 433 26.21 4.70 a, b Age 62.49 .00 .02 < 15 2 2229 26.59 4.44 a 15 9 4098 26.35 4.57 a >15 909 24.64 5.04 b
1For Tukey test results, groups that do not share the same letter have statistically different scale scores. The nine items of the Commitment to School scale were summed into a scale that ranged from 21 to 30 with a mean of 27 (alpha = .81). There were some statistically significant differences among students associated with gender and race. As evidenced by their higher mean, girls expressed more commitment to school than boys. African American and Asian students as well as students identifying as Other rated higher commitment to school than students identifying as White or Hispanic; however, the difference was so small, that the effect size was negligible. Students older than 15 reported less commitment to school than those who were 15 and younger.

VHSSS: Ninth Grade Survey Results 36
Belief in school rules index This section asks you what your friends think, not what you do. In your school, is it OK with your friends to do the following:
Disagree/ Strongly Disagree
Agree/ Strongly Agree
Be late for school? 53 47 Cut a couple of classes? 67 33 Skip school for a whole day? 68 32 Cheat on tests? 62 38 Copy someone else’s homework? 37 63 Get into physical fights? 67 33 Belong to gangs? 87 13 Steal belongings from school, a student, or a teacher? 86 14 Destroy or damage school property? 85 15 Smoke on school grounds? 84 16 Drink alcohol during the school day? 90 10 Use illegal weapons during the school day? 96 4 Bring weapons to school? 93 7 Abuse teachers physically? 97 3 Talk back to teachers? 57 43 Disobey school rules? 62 38
Source: Stewart. 2003
Overall, most students indicate that their friends support school rules. The overwhelming majority of students do not perceive their friends as okay with abusing teachers, using weapons, or consuming alcohol during the school day, etc. The rule-breaking that students reported was most acceptable to their peers was copying someone’s homework (63%), coming late for school (47%), and talking back to teachers (43%).
Groups N Mean SD F value p value Effect size Tukey test1
All students 7240 45.75 6.65 Gender 87.13 .00 .01 Boys 3653 48.04 9.26 Girls 3583 50.03 8.85 Race 4.54 .00 .00 Black 1602 48.54 9.47 a Hispanic 390 48.51 9.12 a, b White 4585 49.25 8.88 a, b Asian 226 50.46 8.55 b Other 433 48.16 10.26 a Age 9.59 .00 .00 <15 2229 49.45 8.84 a 15 4098 49.05 9.06 a >15 909 47.89 9.88 b 1For Tukey test results, groups that do not share the same letter have statistically different scale scores. The sixteen items on the Belief in School Rules index were summed (some items were reverse scored) so that higher scores indicated more acceptance of school rules. Scores ranged from 40 to 55 with a mean of 46 (alpha = .94). Girls reported more acceptance of school rules among their friends than did boys. Asian students reported more acceptance of school rules among their friends than did Black or Other students; however, the difference was so small, that the effect size was negligible. Students older than 15 viewed their friends as less inclined to follow school rules than those who were 15 and younger.

VHSSS: Ninth Grade Survey Results 37
Aggressive attitudes index
How much do you agree or disagree with following? Disagree/ Strongly Disagree
Agree/ Strongly
Agree It feels good when I hit someone. 77 23 If you fight a lot, everyone will look up to you. 87 13 Sometimes you only have two choices: get punched or punch the other person first.
49 51
If you are afraid to fight, you won’t have many friends. 82 18 Students who are bullied or teased mostly deserve it. 90 10 Bullying is sometimes fun to do. 83 17
Source: Cornell & Sheras, 2003 Overall, most students disavowed aggressive attitudes, but about half of ninth-grade students feel that sometimes they have to punch someone first or get punched, and almost a quarter admitted that it feels good to hit someone.
1For Tukey test results, groups that do not share the same letter have statistically different scale scores.
Boys endorsed (i.e.., marked agreement with) more aggressive attitudes than girls, with a noteworthy effect size of .09. Students identifying as Black, Hispanic, and Other marked higher agreement with aggressive beliefs than White and Asian students. Students older than 15 were more supportive of aggressive behavior than those who were 15 and younger.
Groups N Mean SD F value p value Effect size Tukey test1 All students 7240 11.23 3.61 Gender 700.14 .00 .09 Male 3653 12.34 3.53 Female 3583 10.20 3.36 Race 46.48 .00 .03 Black 1602 12.23 3.37 a Hispanic 390 11.59 3.64 b White 4585 10.90 3.59 c Asian 226 10.58 3.40 c Other 433 11.81 4.02 a, b Age 52.55 .00 .01 <15 2229 10.96 3.56 a 15 4098 11.21 3.61 b >15 909 12.38 3.55 c
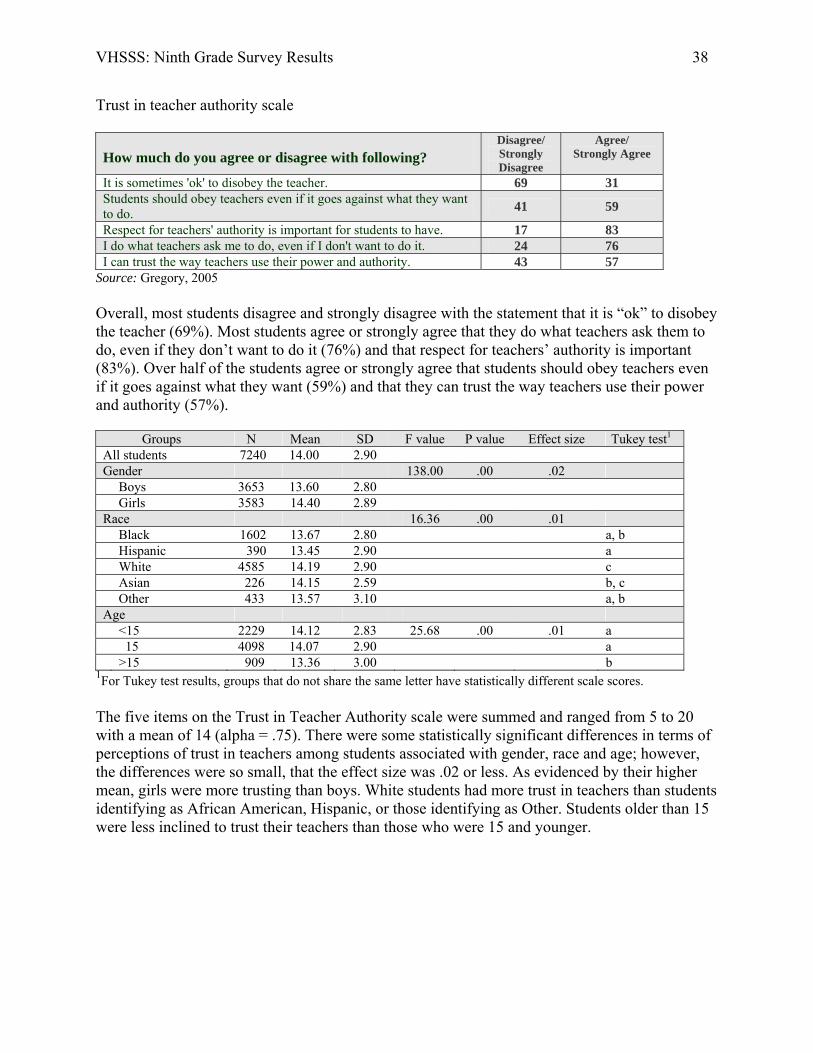
VHSSS: Ninth Grade Survey Results 38
Trust in teacher authority scale
How much do you agree or disagree with following? Disagree/ Strongly Disagree
Agree/ Strongly Agree
It is sometimes 'ok' to disobey the teacher. 69 31 Students should obey teachers even if it goes against what they want to do. 41 59
Respect for teachers' authority is important for students to have. 17 83 I do what teachers ask me to do, even if I don't want to do it. 24 76 I can trust the way teachers use their power and authority. 43 57
Source: Gregory, 2005
Overall, most students disagree and strongly disagree with the statement that it is “ok” to disobey the teacher (69%). Most students agree or strongly agree that they do what teachers ask them to do, even if they don’t want to do it (76%) and that respect for teachers’ authority is important (83%). Over half of the students agree or strongly agree that students should obey teachers even if it goes against what they want (59%) and that they can trust the way teachers use their power and authority (57%).
Groups N Mean SD F value P value Effect size Tukey test1
All students 7240 14.00 2.90 Gender 138.00 .00 .02 Boys 3653 13.60 2.80 Girls 3583 14.40 2.89 Race 16.36 .00 .01 Black 1602 13.67 2.80 a, b Hispanic 390 13.45 2.90 a White 4585 14.19 2.90 c Asian 226 14.15 2.59 b, c Other 433 13.57 3.10 a, b Age <15 2229 14.12 2.83 25.68 .00 .01 a 15 4098 14.07 2.90 a >15 909 13.36 3.00 b
1For Tukey test results, groups that do not share the same letter have statistically different scale scores. The five items on the Trust in Teacher Authority scale were summed and ranged from 5 to 20 with a mean of 14 (alpha = .75). There were some statistically significant differences in terms of perceptions of trust in teachers among students associated with gender, race and age; however, the differences were so small, that the effect size was .02 or less. As evidenced by their higher mean, girls were more trusting than boys. White students had more trust in teachers than students identifying as African American, Hispanic, or those identifying as Other. Students older than 15 were less inclined to trust their teachers than those who were 15 and younger.
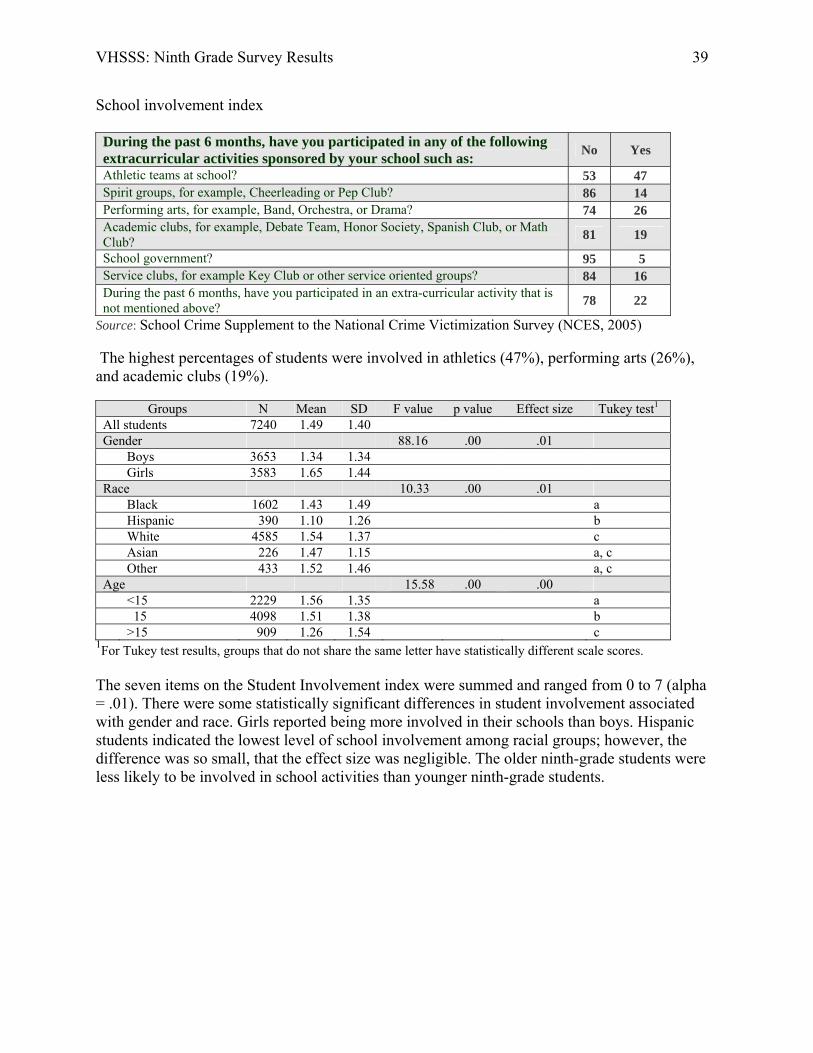
VHSSS: Ninth Grade Survey Results 39
School involvement index During the past 6 months, have you participated in any of the following extracurricular activities sponsored by your school such as: No Yes
Athletic teams at school? 53 47 Spirit groups, for example, Cheerleading or Pep Club? 86 14 Performing arts, for example, Band, Orchestra, or Drama? 74 26 Academic clubs, for example, Debate Team, Honor Society, Spanish Club, or Math Club? 81 19
School government? 95 5 Service clubs, for example Key Club or other service oriented groups? 84 16 During the past 6 months, have you participated in an extra-curricular activity that is not mentioned above? 78 22
Source: School Crime Supplement to the National Crime Victimization Survey (NCES, 2005) The highest percentages of students were involved in athletics (47%), performing arts (26%), and academic clubs (19%).
Groups N Mean SD F value p value Effect size Tukey test1 All students 7240 1.49 1.40 Gender 88.16 .00 .01 Boys 3653 1.34 1.34 Girls 3583 1.65 1.44 Race 10.33 .00 .01 Black 1602 1.43 1.49 a Hispanic 390 1.10 1.26 b White 4585 1.54 1.37 c Asian 226 1.47 1.15 a, c Other 433 1.52 1.46 a, c Age 15.58 .00 .00 <15 2229 1.56 1.35 a 15 4098 1.51 1.38 b >15 909 1.26 1.54 c
1For Tukey test results, groups that do not share the same letter have statistically different scale scores. The seven items on the Student Involvement index were summed and ranged from 0 to 7 (alpha = .01). There were some statistically significant differences in student involvement associated with gender and race. Girls reported being more involved in their schools than boys. Hispanic students indicated the lowest level of school involvement among racial groups; however, the difference was so small, that the effect size was negligible. The older ninth-grade students were less likely to be involved in school activities than younger ninth-grade students.

VHSSS: Ninth Grade Survey Results 40
Academic press scale
How true is this in your school? Not at all/Not Very true
Somewhat True
True/Very True
When I've figured out how to do a problem, my teachers give me more challenging problems to think about.
21 43 36
My teachers press me to do thoughtful work. 16 33 51 When I'm working out a problem, my teachers tell me to keep thinking until I really understand.
19 32 49
My teachers don't let me do just easy work, but make me think.
14 30 56
My teachers make sure that the work I do really makes me think.
17 35 48
My teachers accept nothing less than my full effort. 19 30 51 Source: Academic Press (Midgley et al., 2000) Overall, about half of the students agreed that teachers press them to do thoughtful work (51%), make them think (56%), and accept nothing less than their full effort (51%).
Groups N Mean SD F value p value Effect size Tukey test1 All students 7240 20.49 4.62 Gender 18.35 .00 .00 Boys 3653 20.26 4.67 Girls 3583 20.72 4.56 Race 6.20 .00 .00 Black 1602 21.00 4.77 a Hispanic 390 20.38 4.53 a, b White 4585 20.34 4.55 b Asian 226 20.32 4.24 a, b Other 433 20.40 4.97 a, b Age 1.24 .29 3.43 <15 2229 20.56 4.57 a 15 4098 20.50 4.60 a >15 909 20.27 4.86 a
1For Tukey test results, groups that do not share the same letter have statistically different scale scores. The six items on the Academic Press index were summed and ranged from 6 to 30 with a mean of 20 (alpha = .84). Girls reported feeling slightly more pushed toward achievement by their teachers than boys. African-American students reported greater academic press than White students; however, the difference was so small that the effect size was negligible. There were no significant differences associated with age.

VHSSS: Ninth Grade Survey Results 41
Measures of Student Victimization Total victimization index
Source: Victimization (Gottfredson, 1999) Overall, the most common forms of victimization reported by students involved being the recipient of obscene remarks or gestures (51%), being threatened (28%), or having personal property stolen (20%).
1For Tukey test results, groups that do not share the same letter have statistically different scale scores. The seven items on the Total Victimization index were summed and ranged from 0 to 7. Students typically reported one or two forms of victimization. Boys were more likely to experience victimization than girls. Students identifying as Other were more likely to experience victimization than other racial groups. Students older than 15 reported more victimization than students 15 or younger than 15.
This year in school have any of the following happened to you personally in the school? False True
Damage to personal property worth more than $10. 85 15 Theft of personal property worth more than $10. 80 20 Was physically attacked and had to see a doctor 96 4 Was physically attacked, but not serious enough to see a doctor. 87 13 Received obscene remarks or gestures from a student. 49 51 Was threatened in remarks by a student. 72 28 Had a weapon pulled on me. 96 4
Groups N Mean SD F value p value Effect size Tukey test1 All students 7485 1.34 1.50 Gender 110.64 .00 .02 Boys 3621 1.52 1.31 Girls 3541 1.15 1.62 Race 13.03 .00 .01 Black 1591 1.32 1.52 a Hispanic 385 1.22 1.48 a White 4529 1.31 1.44 a Asian 226 1.20 1.45 a Other 431 1.82 1.81 b Age 19.60 .00 .01 <15 2213 1.25 1.42 a 15 4047 1.32 1.46 a >15 902 1.61 1.75 b

VHSSS: Ninth Grade Survey Results 42
Major victimization index
From: Victimization (Gottfredson, 1999) Because the Total Victimization scale covers a wide range of victim experiences, the scale was subdivided into Major and Minor Scales. Overall most students noted that they did not experience major victimization in the form of having a weapon pulled on them (96%) or being physically attacked resulting in having to see a doctor (96%). However, 13% of the students reported that they had been physically attacked, but not serious enough to see a doctor.
1For Tukey test results, groups that do not share the same letter have statistically different scale scores. The three items of the Major victimization scale were summed into a scale (alpha = .53) that ranged from 0 to 3 with a mean of .21. Boys were more likely to report major victimization than girls. Students in the Other racial group reported the higher victimization levels than any other group, and African-American students reported more victimization than White students. Students older than 15 were more likely to experience major victimization than younger students.
This year in school have any of the following happened to you personally in the school? False True
Was physically attacked and had to see a doctor 96 4 Was physically attacked, but not serious enough to see a doctor. 87 13 Had a weapon pulled on me. 96 4
Groups N Mean SD F value p value Effect size Tukey test1 All students 7485 .21 .54 Gender 142.21 .00 .02 Boys 3621 .28 .62 Girls 3541 .13 .42 Race 18.43 .00 .01 Black 1591 .25 .60 a Hispanic 385 .22 .54 a, b White 4529 .17 .47 b Asian 226 .21 .53 a, b Other 431 .37 .75 c Age 38.25 .00 .01 <15 2213 .16 .46 a 15 4047 .20 .52 a >15 902 .34 .72 b
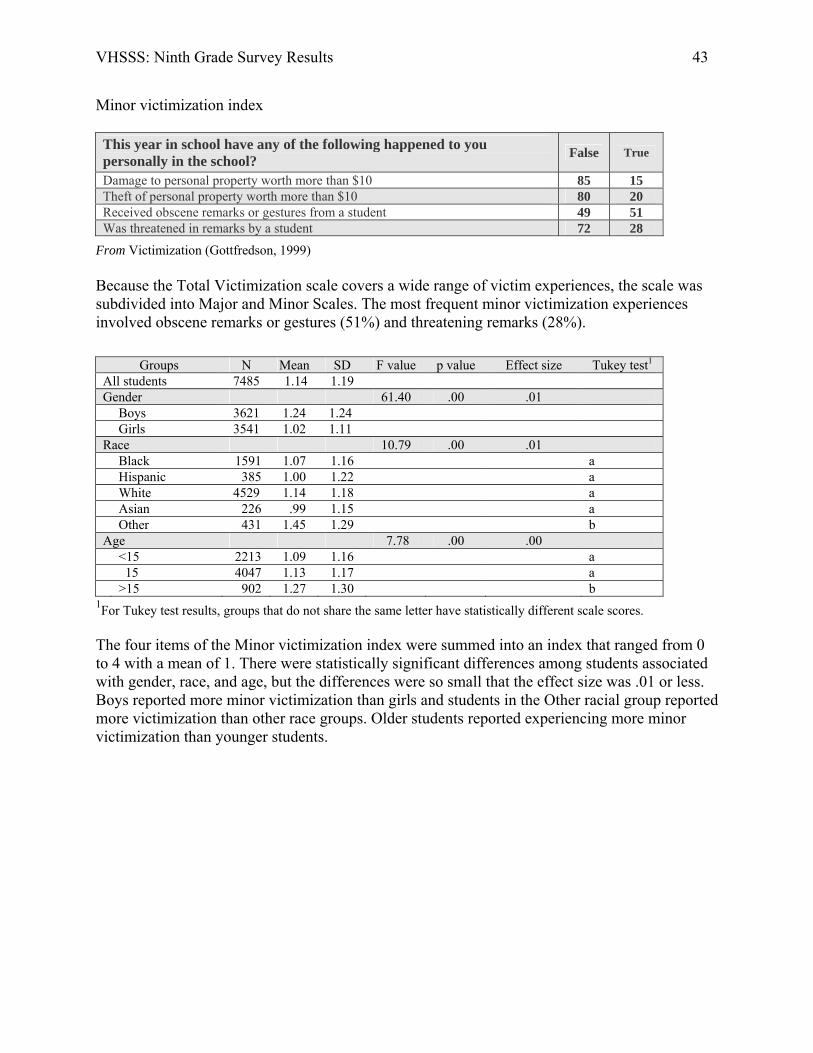
VHSSS: Ninth Grade Survey Results 43
Minor victimization index
From Victimization (Gottfredson, 1999) Because the Total Victimization scale covers a wide range of victim experiences, the scale was subdivided into Major and Minor Scales. The most frequent minor victimization experiences involved obscene remarks or gestures (51%) and threatening remarks (28%).
1For Tukey test results, groups that do not share the same letter have statistically different scale scores. The four items of the Minor victimization index were summed into an index that ranged from 0 to 4 with a mean of 1. There were statistically significant differences among students associated with gender, race, and age, but the differences were so small that the effect size was .01 or less. Boys reported more minor victimization than girls and students in the Other racial group reported more victimization than other race groups. Older students reported experiencing more minor victimization than younger students.
This year in school have any of the following happened to you personally in the school? False True
Damage to personal property worth more than $10 85 15 Theft of personal property worth more than $10 80 20 Received obscene remarks or gestures from a student 49 51 Was threatened in remarks by a student 72 28
Groups N Mean SD F value p value Effect size Tukey test1 All students 7485 1.14 1.19 Gender 61.40 .00 .01 Boys 3621 1.24 1.24 Girls 3541 1.02 1.11 Race 10.79 .00 .01 Black 1591 1.07 1.16 a Hispanic 385 1.00 1.22 a White 4529 1.14 1.18 a Asian 226 .99 1.15 a Other 431 1.45 1.29 b Age 7.78 .00 .00 <15 2213 1.09 1.16 a 15 4047 1.13 1.17 a >15 902 1.27 1.30 b
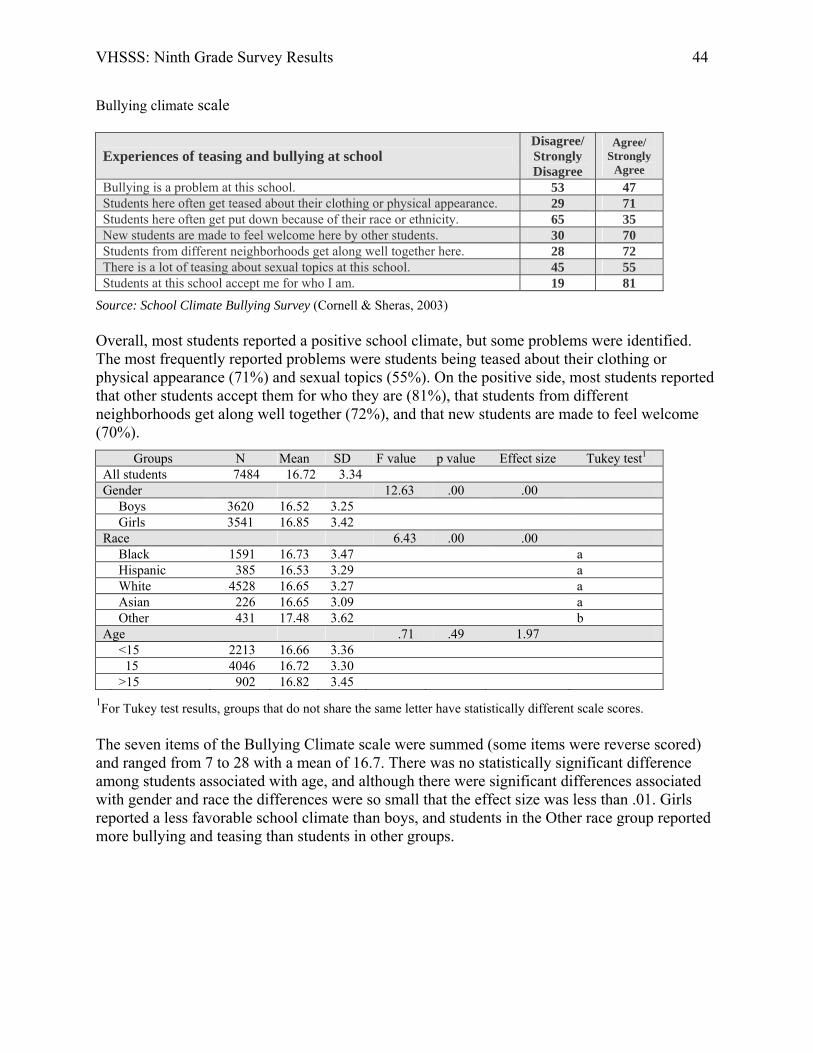
VHSSS: Ninth Grade Survey Results 44
Bullying climate scale
Source: School Climate Bullying Survey (Cornell & Sheras, 2003) Overall, most students reported a positive school climate, but some problems were identified. The most frequently reported problems were students being teased about their clothing or physical appearance (71%) and sexual topics (55%). On the positive side, most students reported that other students accept them for who they are (81%), that students from different neighborhoods get along well together (72%), and that new students are made to feel welcome (70%).
1For Tukey test results, groups that do not share the same letter have statistically different scale scores. The seven items of the Bullying Climate scale were summed (some items were reverse scored) and ranged from 7 to 28 with a mean of 16.7. There was no statistically significant difference among students associated with age, and although there were significant differences associated with gender and race the differences were so small that the effect size was less than .01. Girls reported a less favorable school climate than boys, and students in the Other race group reported more bullying and teasing than students in other groups.
Experiences of teasing and bullying at school Disagree/ Strongly Disagree
Agree/ Strongly
Agree Bullying is a problem at this school. 53 47 Students here often get teased about their clothing or physical appearance. 29 71 Students here often get put down because of their race or ethnicity. 65 35 New students are made to feel welcome here by other students. 30 70 Students from different neighborhoods get along well together here. 28 72 There is a lot of teasing about sexual topics at this school. 45 55 Students at this school accept me for who I am. 19 81
Groups N Mean SD F value p value Effect size Tukey test1 All students 7484 16.72 3.34 Gender 12.63 .00 .00 Boys 3620 16.52 3.25 Girls 3541 16.85 3.42 Race 6.43 .00 .00 Black 1591 16.73 3.47 a Hispanic 385 16.53 3.29 a White 4528 16.65 3.27 a Asian 226 16.65 3.09 a Other 431 17.48 3.62 b Age .71 .49 1.97 <15 2213 16.66 3.36 15 4046 16.72 3.30 >15 902 16.82 3.45

VHSSS: Ninth Grade Survey Results 45
Bullying index
Source: School Climate Bullying Survey (Cornell & Sheras, 2003) Researchers typically used a cut-off of about once per week or more to identify bullying. By this cutoff, about 8% of students reported being a victim of bullying. It should be noted, however, that when asked about a more specific form of bullying, more students reported victim experiences (this inconsistency is commonly observed in other studies). The most frequently reported form of bullying was verbal, followed by social and then physical bullying.
1For Tukey test results, groups that do not share the same letter have statistically different scale scores. The four items of the Bullying index were summed into an index and ranged from 4 to 16 with a mean of 5.5. There were no statistically significant differences among students associated with age, but there were some significant differences among students associated with gender and race. Boys reported more bullying than girls. Students in the Other category reported the highest levels of bullying, and African-American students reported less bullying than White students.
How often have you experienced the following? Never Once
or twice
About once per
week
Several times per
week Bullying is defined as the use of one’s strength or status to injure, threaten, or embarrass another person. Bullying can be physical, verbal, or social. It is not bullying when two students of about the same strength argue or fight. By this definition, I have been bullied in the past month.
71 21 4 4
Physical bullying involves repeatedly hitting, kicking, or shoving someone weaker on purpose. By this definition, I have been physically bullied in the past month.
88 9 2 1
Verbal bullying involves repeatedly teasing, putting down, or insulting someone on purpose. By this definition, I have been verbally bullied in the past month.
60 27 7 6
Social bullying involves getting others repeatedly to ignore or exclude someone on purpose. By this definition, I have been socially bullied in the past month.
74 19 4 3
Groups N Mean SD F value p value Effect size Tukey test1 All students 7484 5.54 2.32 Gender 4.96 .03 6.94 Boys 3620 5.60 2.45 Girls 3541 5.48 2.17 Race 9.84 .00 .01 Black 1591 5.33 2.25 a Hispanic 385 5.35 2.12 a, b White 4528 5.59 2.29 b Asian 226 5.42 2.20 a, b Other 431 6.06 2.91 c Age 1.35 .26 .00 <15 2213 5.48 2.21 15 4046 5.57 2.33 >15 902 5.60 2.53

VHSSS: Ninth Grade Survey Results 46
Bully reporting questions Have you told anyone that you were bullied in the past 30 days at school?
Responses Frequency Percent I have not been bullied. 6092 81 I have been bullied, but I have not told anyone. 813 11 I have told someone. 580 8
Most students reported that they had not been bullied at school (81%), but of those students who have been bullied, the majority has not told anyone. I have told these persons that I was bullied in the past 30 days at school;
Responses Frequency Percent No one 6344 77 A parent 606 7 A friend 844 10 A teacher or other adult at school 215 3 Someone else 264 3
Students are 2-3 times much more likely to tell a friend or a parent that they have been bullied than to tell a teacher or other adult at school.

VHSSS: Ninth Grade Survey Results 47
Gang questions Are there any gangs at your school?
Responses Frequency Percent Don’t Know 2651 47 Yes 1288 35 No 3547 18
Nearly half of students reported that they did not know whether there were gangs at their school. During the last six months, how often have gangs been involved in fights, attacks, or other violence at your school?
Responses Frequency Percent Don’t Know 2651 43 Never 1288 33 Once or twice in the last 6 months 3547 14 Once or twice a month 464 6 Once or twice a week 180 2 Almost everyday 135 2
Have gangs been involved in the sale of drugs at your school in the last six months?
Responses Frequency Percent Don’t Know 4599 61 No 1690 23 Yes 1196 16

VHSSS: Ninth Grade Survey Results 48
Validity questions
These items were included in the survey in order to identify students who were not paying attention when they answered the survey or who were willing to admit that they were not being honest. Previous research has shown than when a substantial number of students respond inappropriately to these items, they inflate the rates of problems reported at the school. These rates are acceptably low.
How much do you agree or disagree with these statements? Strongly Disagree/ Somewhat Disagree
Strongly Agree/
Somewhat Agree
I am being honest on this survey. 2 98 I am telling the truth on this survey 4 96

VHSSS: Ninth Grade Survey Results 49
Chapter 4 Teacher Survey Descriptive Results
Measures of School Structure
Experience of school rules scale
Thinking about your school over the last 6 months, would you strongly agree, agree, disagree, or strongly disagree with the following...
Disagree/ Strongly Disagree
Agree/ Strongly
Agree Everyone knows the school rules for student conduct. 17 83 The school rules are fair. 6 94 The punishment for breaking school rules is the same no matter who you are. 48 52 The school rules are strictly enforced. 49 51 If a school rule is broken, students know what kind of punishment will follow. 38 62 We have a strict dress code at school. 56 44 If a student breaks the rules at this school, he or she will be punished. 34 66
Source: School Crime Supplement to the National Crime Victimization Survey (NCES, 2005) Overall, most teachers agree or strongly agree that the school rules are fair (94%) and known by everyone (83%). There were mixed opinions regarding whether rules are strictly enforced and students know what kind of punishment will follow breaking a rule, and whether punishment is the same no matter who breaks the rule. About half of the teachers (56%) felt that their school did not have a strict dress code.
Groups N Mean SD F value p value Effect size Tukey test1
All teachers 2938 19.11 3.95 Gender 9.30 .00 .00 Male 1068 19.39 3.93 Female 1846 18.93 3.95 Race 4.45 .00 .01 Black 354 18.71 4.16 a, b Hispanic 52 19.17 4.22 a, b White 2407 19.17 3.88 a Asian 40 20.45 4.28 a Other 61 17.59 4.38 b Teaching Experience (years) 13.95 .00 .01 1-5 1062 18.81 3.89 a 6-10 617 18.61 3.84 a 11-15 364 19.14 4.13 a 16 or more 871 19.78 3.93 b
1For Tukey test results, groups that do not share the same letter have statistically different scale scores. The seven items on the Experience of Rules scale were summed into a scale (alpha = .86) that ranged from 7 to 28 with a mean of 19. There were some statistically significant differences among teachers associated with gender, race, and teaching experience, but the differences were so small that the effect size was .01 or less. Male teachers felt more positive about school rules than female teachers. Asian teachers and White teachers felt more positive about school rules than those identifying as Other. Teachers with 16 or more years of experience had more positive perceptions of the school rules than other teachers.

VHSSS: Ninth Grade Survey Results 50
Security measures index
Does your school take any of these measures to make sure students are safe? No Don’t know Yes
Security guards or assigned police officers? 7 1 92 Other school staff or other adults supervising the hallways? 4 1 95 Metal detectors? 89 4 7 Locked entrance or exit doors during the day? 30 5 65 A requirement that visitors sign in? 2 1 97 Locker checks? 26 31 43 A requirement that students wear badges or picture identification? 93 1 6 One or more security cameras to monitor the school? 17 9 74 A code of student conduct (written rules for students to follow)? 1 1 98
Source: School Crime Supplement to the National Crime Victimization Survey (NCES, 2005) All teachers were presented with the same standard list of security measures. Overall, most teachers reported that their school had security guards or police (92%), adult supervision of the hallways (95%), visitor sign-in (97%), locked entrance doors (65%), security cameras (74%), and a written code of student conduct (98%). However, most teachers noted that they did not have metal detectors (89%) or a requirement for students to wear badges (93%). One-third of teachers were unaware if their schools had locker checks. Teacher perceptions could be verified by comparing their answers with the school safety audits completed by principals.
Groups N Mean SD F value p value Effect size Tukey test1 All teachers 2933 5.77 1.20 Gender 2.18 .14 .00 Male 1066 5.81 1.23 Female 1843 5.74 1.19 Race 12.72 .00 .02 Black 352 6.18 1.47 a Hispanic 52 5.56 1.45 b White 2404 5.72 1.14 b Asian 40 5.70 1.18 a, b Other 61 5.49 1.32 b Teaching Experience (years) 4.23 .01 .00 1-5 1059 5.67 1.21 a 6-10 615 5.76 1.26 a, b 11-15 384 5.84 1.13 a, b 16 or more 871 5.85 1.18 b
1For Tukey test results, groups that do not share the same letter have statistically different scale scores. The “yes” responses on the Security measure index were summed and ranged from 0 to 9. Teachers typically reported 6 or 7 of the nine listed security measures. There was no difference in the number of security measures observed by male or female teachers. There were some statistically significant differences among teachers associated with race and teaching experience, but the differences were so small that the effect size was .01 or less. African American teachers on average reported one more security measures (~ 6 measures) than other racial and ethnic groups (~ 5 measures). Teachers with 16 or more years of experience observed slightly more security measures than teachers with 1 to 5 years of teaching.

VHSSS: Ninth Grade Survey Results 51
Awareness of zero tolerance policies index
Zero tolerance means that a student is automatically expelled or given a lengthy suspension for any violation of the rule. Does your school have zero tolerance for:
No Don’t know Yes
Bringing a gun to school? 2 6 92 Bringing a BB gun, pellet gun, or similar gun to school? 2 15 83 Bringing a toy gun or something that looks like a gun to school? 4 35 61 Bringing in edged or cutting weapons such as knives? 6 15 79 Bringing illegal drugs to school? 6 9 85 Bringing legal drugs, such as prescription drugs and over the counter medications, to school? 15 32 53
Bringing alcohol to school? 7 13 80 Belonging to a gang? 20 45 35 Fighting at school? 20 11 69 Does your school have zero tolerance for some other reason not mentioned above? 23 72 5
Source: Virginia Dept. of Criminal Justice Services, 2005 Overall, most teachers reported that their school had zero tolerance for a gun (92%), a BB gun or similar gun (83%), a toy gun (61%), a cutting weapon (79%), illegal drugs (85%), legal drugs (53%), and alcohol (80%). Most teachers also reported zero tolerance for fighting at school (69%). There was less agreement on zero tolerance policies regarding belonging to a gang. Teacher perceptions of zero tolerance could be verified with the school safety audit surveys completed by principals.
Groups N Mean SD F value p value Effect size Tukey test1 All teachers 2871 6.58 2.43 Gender 3.18 .08 .00 Male 1040 6.69 2.34 Female 1810 6.52 2.48 Race 3.74 .01 .01 Black 352 6.99 2.39 a Hispanic 52 6.08 2.66 a, b White 2349 6.54 2.41 b Asian 38 6.61 2.51 a, b Other 59 6.15 2.82 a, b Teaching Experience (years) 28.51 .00 .03 1-5 1017 6.14 2.59 a 6-10 604 6.43 2.57 a, b 11-15 363 6.75 2.28 b 16 or more 866 7.14 2.07 c
1For Tukey test results, groups that do not share the same letter have statistically different scale scores. The “yes” responses on the Awareness of Zero Tolerance Policies index were summed and ranged from 0 to 10. Most teachers were aware of zero tolerance policies in their schools for 6 or 7 of the 9 offenses listed. There was no difference in the awareness of zero tolerance among male or female teachers. There were some statistically significant differences among teachers associated with race and teaching experience, but the differences were so small that the effect size was .03 or less. White teachers reported that their school had fewer zero tolerance rules compared to African American teachers. Each of the groups based on teaching experience differed significantly from at least one other group. Teachers with 16 or more years of experience reported more tolerance policies than the other groups.
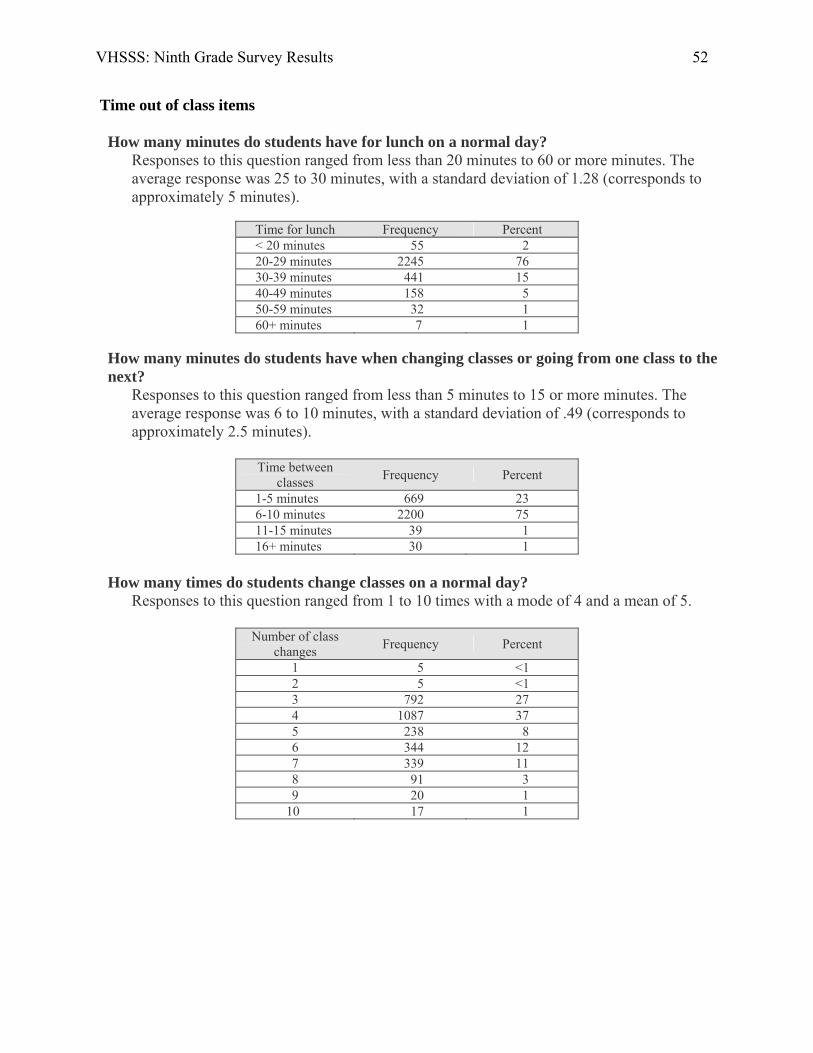
VHSSS: Ninth Grade Survey Results 52
Time out of class items
How many minutes do students have for lunch on a normal day? Responses to this question ranged from less than 20 minutes to 60 or more minutes. The average response was 25 to 30 minutes, with a standard deviation of 1.28 (corresponds to approximately 5 minutes).
Time for lunch Frequency Percent < 20 minutes 55 2 20-29 minutes 2245 76 30-39 minutes 441 15 40-49 minutes 158 5 50-59 minutes 32 1 60+ minutes 7 1
How many minutes do students have when changing classes or going from one class to the next?
Responses to this question ranged from less than 5 minutes to 15 or more minutes. The average response was 6 to 10 minutes, with a standard deviation of .49 (corresponds to approximately 2.5 minutes).
Time between classes Frequency Percent
1-5 minutes 669 23 6-10 minutes 2200 75 11-15 minutes 39 1 16+ minutes 30 1
How many times do students change classes on a normal day?
Responses to this question ranged from 1 to 10 times with a mode of 4 and a mean of 5.
Number of class changes Frequency Percent
1 5 <1 2 5 <1 3 792 27 4 1087 37 5 238 8 6 344 12 7 339 11 8 91 3 9 20 1
10 17 1
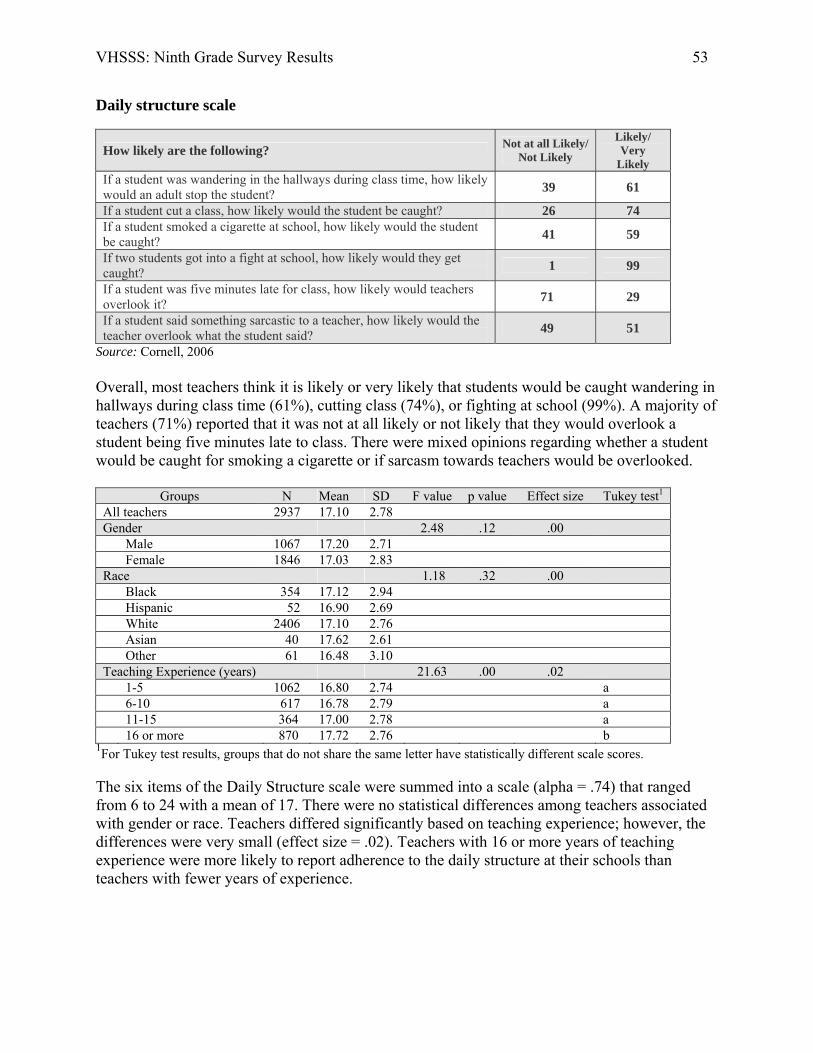
VHSSS: Ninth Grade Survey Results 53
Daily structure scale
How likely are the following? Not at all Likely/ Not Likely
Likely/ Very
Likely If a student was wandering in the hallways during class time, how likely would an adult stop the student? 39 61
If a student cut a class, how likely would the student be caught? 26 74 If a student smoked a cigarette at school, how likely would the student be caught? 41 59
If two students got into a fight at school, how likely would they get caught? 1 99
If a student was five minutes late for class, how likely would teachers overlook it? 71 29
If a student said something sarcastic to a teacher, how likely would the teacher overlook what the student said? 49 51
Source: Cornell, 2006 Overall, most teachers think it is likely or very likely that students would be caught wandering in hallways during class time (61%), cutting class (74%), or fighting at school (99%). A majority of teachers (71%) reported that it was not at all likely or not likely that they would overlook a student being five minutes late to class. There were mixed opinions regarding whether a student would be caught for smoking a cigarette or if sarcasm towards teachers would be overlooked.
Groups N Mean SD F value p value Effect size Tukey test1 All teachers 2937 17.10 2.78 Gender 2.48 .12 .00 Male 1067 17.20 2.71 Female 1846 17.03 2.83 Race 1.18 .32 .00 Black 354 17.12 2.94 Hispanic 52 16.90 2.69 White 2406 17.10 2.76 Asian 40 17.62 2.61 Other 61 16.48 3.10 Teaching Experience (years) 21.63 .00 .02 1-5 1062 16.80 2.74 a 6-10 617 16.78 2.79 a 11-15 364 17.00 2.78 a 16 or more 870 17.72 2.76 b
1For Tukey test results, groups that do not share the same letter have statistically different scale scores. The six items of the Daily Structure scale were summed into a scale (alpha = .74) that ranged from 6 to 24 with a mean of 17. There were no statistical differences among teachers associated with gender or race. Teachers differed significantly based on teaching experience; however, the differences were very small (effect size = .02). Teachers with 16 or more years of teaching experience were more likely to report adherence to the daily structure at their schools than teachers with fewer years of experience.
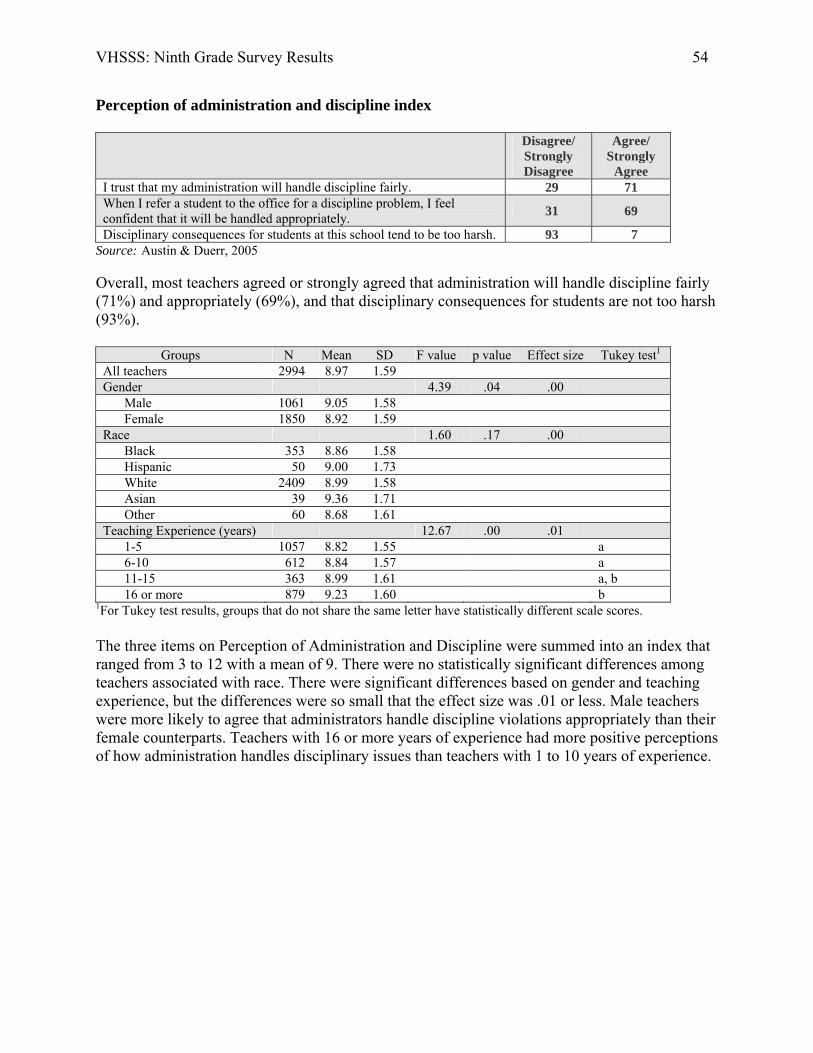
VHSSS: Ninth Grade Survey Results 54
Perception of administration and discipline index
Disagree/ Strongly Disagree
Agree/ Strongly
Agree I trust that my administration will handle discipline fairly. 29 71 When I refer a student to the office for a discipline problem, I feel confident that it will be handled appropriately. 31 69
Disciplinary consequences for students at this school tend to be too harsh. 93 7 Source: Austin & Duerr, 2005
Overall, most teachers agreed or strongly agreed that administration will handle discipline fairly (71%) and appropriately (69%), and that disciplinary consequences for students are not too harsh (93%).
Groups N Mean SD F value p value Effect size Tukey test1 All teachers 2994 8.97 1.59 Gender 4.39 .04 .00 Male 1061 9.05 1.58 Female 1850 8.92 1.59 Race 1.60 .17 .00 Black 353 8.86 1.58 Hispanic 50 9.00 1.73 White 2409 8.99 1.58 Asian 39 9.36 1.71 Other 60 8.68 1.61 Teaching Experience (years) 12.67 .00 .01 1-5 1057 8.82 1.55 a 6-10 612 8.84 1.57 a 11-15 363 8.99 1.61 a, b 16 or more 879 9.23 1.60 b
1For Tukey test results, groups that do not share the same letter have statistically different scale scores. The three items on Perception of Administration and Discipline were summed into an index that ranged from 3 to 12 with a mean of 9. There were no statistically significant differences among teachers associated with race. There were significant differences based on gender and teaching experience, but the differences were so small that the effect size was .01 or less. Male teachers were more likely to agree that administrators handle discipline violations appropriately than their female counterparts. Teachers with 16 or more years of experience had more positive perceptions of how administration handles disciplinary issues than teachers with 1 to 10 years of experience.
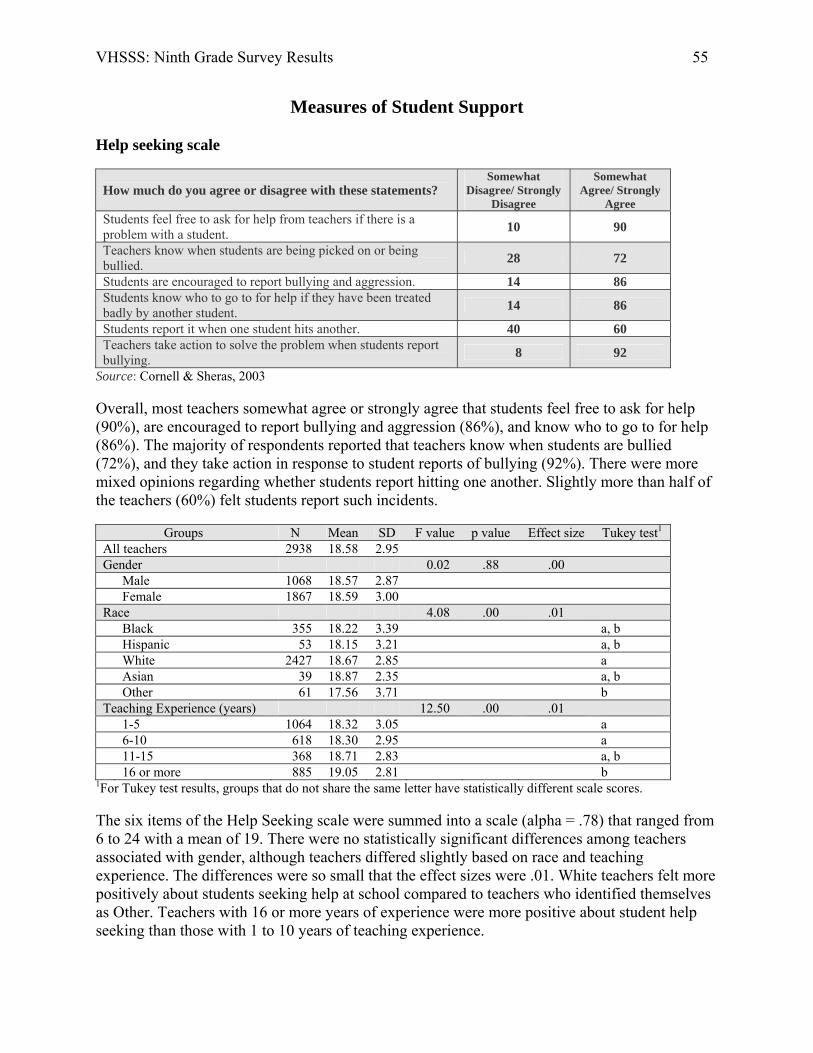
VHSSS: Ninth Grade Survey Results 55
Measures of Student Support Help seeking scale
How much do you agree or disagree with these statements? Somewhat
Disagree/ Strongly Disagree
Somewhat Agree/ Strongly
Agree Students feel free to ask for help from teachers if there is a problem with a student. 10 90
Teachers know when students are being picked on or being bullied. 28 72
Students are encouraged to report bullying and aggression. 14 86 Students know who to go to for help if they have been treated badly by another student. 14 86
Students report it when one student hits another. 40 60 Teachers take action to solve the problem when students report bullying. 8 92
Source: Cornell & Sheras, 2003 Overall, most teachers somewhat agree or strongly agree that students feel free to ask for help (90%), are encouraged to report bullying and aggression (86%), and know who to go to for help (86%). The majority of respondents reported that teachers know when students are bullied (72%), and they take action in response to student reports of bullying (92%). There were more mixed opinions regarding whether students report hitting one another. Slightly more than half of the teachers (60%) felt students report such incidents.
Groups N Mean SD F value p value Effect size Tukey test1 All teachers 2938 18.58 2.95 Gender 0.02 .88 .00 Male 1068 18.57 2.87 Female 1867 18.59 3.00 Race 4.08 .00 .01 Black 355 18.22 3.39 a, b Hispanic 53 18.15 3.21 a, b White 2427 18.67 2.85 a Asian 39 18.87 2.35 a, b Other 61 17.56 3.71 b Teaching Experience (years) 12.50 .00 .01 1-5 1064 18.32 3.05 a 6-10 618 18.30 2.95 a 11-15 368 18.71 2.83 a, b 16 or more 885 19.05 2.81 b
1For Tukey test results, groups that do not share the same letter have statistically different scale scores. The six items of the Help Seeking scale were summed into a scale (alpha = .78) that ranged from 6 to 24 with a mean of 19. There were no statistically significant differences among teachers associated with gender, although teachers differed slightly based on race and teaching experience. The differences were so small that the effect sizes were .01. White teachers felt more positively about students seeking help at school compared to teachers who identified themselves as Other. Teachers with 16 or more years of experience were more positive about student help seeking than those with 1 to 10 years of teaching experience.

VHSSS: Ninth Grade Survey Results 56
Learning/Working environment scale
How much do you agree that administrators in this school…
Disagree/ Strongly Disagree
Somewhat Agree
Agree/ Strongly Agree
Really care about all teachers. 11 20 69 Acknowledge and pay attention to teachers. 12 23 65 Want all teachers to do their best. 3 10 87 Listen to what teachers have to say. 14 25 61 Believe that every teacher can be a success. 7 23 70 Treat all teachers fairly. 20 24 56 Support and treat each other with respect. 8 19 73 Feel a responsibility to improve the school. 4 15 81
Source: Austin & Duerr, 2005 Overall, most teachers feel positively about the support and encouragement they receive from administration at their schools. Most notably, the majority agreed or strongly agreed that administrators want all teachers to do their best (87%), and feel a responsibility to improve the school (81%). There was less agreement about whether or not all teachers are treated fairly.
Group N Mean SD F value p value Effect size Tukey test1 All teachers 2938 31.32 6.92 Gender 7.48 .01 .00 Male 1068 31.77 6.77 Female 1867 31.05 6.99 Race 3.58 .01 .00 Black 355 30.51 7.10 a Hispanic 53 30.96 7.31 a White 2427 31.47 6.87 a Asian 39 32.74 5.69 a Other 61 29.07 7.73 a Teaching Experience (years) 4.01 .01 .00 1-5 1064 31.29 6.81 a, b 6-10 618 30.70 6.73 a 11-15 368 30.99 7.26 a, b 16 or more 885 31.90 7.00 b
1For Tukey test results, groups that do not share the same letter have statistically different scale scores. The eight items of the Learning/Work Environment scale were summed into a scale (alpha = .95) that ranged from 8 to 40 with a mean of 31. There were some statistically significant differences among teachers associated with gender, race, and teaching experience, but the differences were so small that the effect sizes were all less than .01. Male teachers reported slightly more positive perceptions of administrative support than did female teachers. Although there was an overall significant difference among racial groups, no single comparison of teachers by racial category showed a significant difference. Teachers with 16 or more years of teaching experience had more positive perceptions of support from administrators than teachers with 6 to 10 years of experience.

VHSSS: Ninth Grade Survey Results 57
Health and prevention items
Disagree/ Strongly Disagree
Neither Agree nor Disagree
Agree/ Strongly Agree
This school collaborates well with community organizations to help address substance abuse or other problems among youth.
12 31 57
This school provides effective confidential support and referral services for students needing help because of substance abuse, violence, or other problems.
9 29 62
Overall, most teachers agree or strongly agree that their schools provide appropriate health and prevention programs for students in need. However, almost a third of teachers felt ambivalent about whether or not their schools collaborate well with community organizations (31%), and if youth suffering from substance abuse, violence, or other problems receive effective and confidential support from their schools (29%).
Groups N Mean SD F value P value Effect size Tukey test1 All teachers 2938 7.24 1.72 Gender .93 .33 .00 Male 1068 7.28 1.69 Female 1867 7.21 1.74 Race 1.42 .23 .00 Black 355 7.15 1.93 Hispanic 53 6.96 1.87 White 2427 7.26 1.68 Asian 39 7.36 1.81 Other 61 6.89 1.80 Teaching Experience (years) 22.63 .00 .02 1-5 1064 7.01 1.75 a 6-10 618 7.09 1.74 a 11-15 368 7.23 1.71 a 16 or more 885 7.62 1.62 b
1For Tukey test results, groups that do not share the same letter have statistically different scale scores. The two items of the Health and Prevention Programs were summed and ranged from 2 to 10 with a mean of 7. There were no statistically significant differences among teachers associated with gender or race. There were significant differences based on teaching experience, but the differences were so small that the effect size was .02. Teachers with 16 or more years of experience perceived more effective use of health and prevention programs than teachers with less experience.
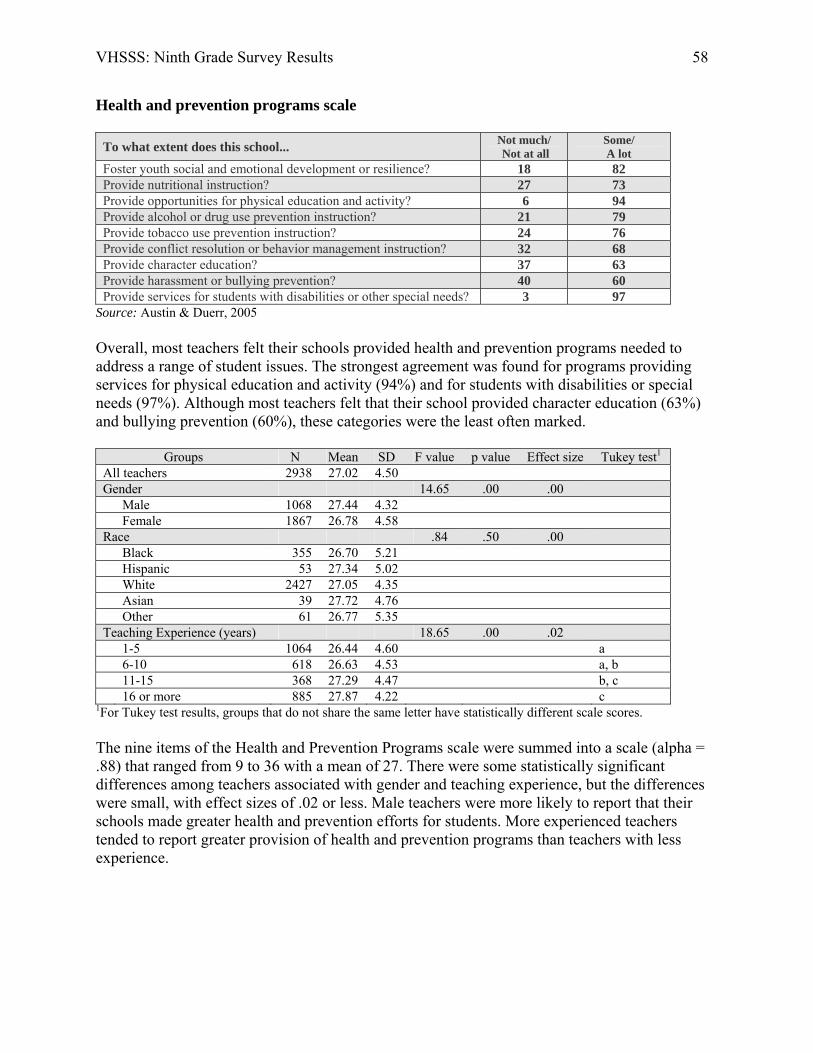
VHSSS: Ninth Grade Survey Results 58
Health and prevention programs scale
To what extent does this school... Not much/ Not at all
Some/ A lot
Foster youth social and emotional development or resilience? 18 82 Provide nutritional instruction? 27 73 Provide opportunities for physical education and activity? 6 94 Provide alcohol or drug use prevention instruction? 21 79 Provide tobacco use prevention instruction? 24 76 Provide conflict resolution or behavior management instruction? 32 68 Provide character education? 37 63 Provide harassment or bullying prevention? 40 60 Provide services for students with disabilities or other special needs? 3 97
Source: Austin & Duerr, 2005 Overall, most teachers felt their schools provided health and prevention programs needed to address a range of student issues. The strongest agreement was found for programs providing services for physical education and activity (94%) and for students with disabilities or special needs (97%). Although most teachers felt that their school provided character education (63%) and bullying prevention (60%), these categories were the least often marked.
Groups N Mean SD F value p value Effect size Tukey test1 All teachers 2938 27.02 4.50 Gender 14.65 .00 .00 Male 1068 27.44 4.32 Female 1867 26.78 4.58 Race .84 .50 .00 Black 355 26.70 5.21 Hispanic 53 27.34 5.02 White 2427 27.05 4.35 Asian 39 27.72 4.76 Other 61 26.77 5.35 Teaching Experience (years) 18.65 .00 .02 1-5 1064 26.44 4.60 a 6-10 618 26.63 4.53 a, b 11-15 368 27.29 4.47 b, c 16 or more 885 27.87 4.22 c
1For Tukey test results, groups that do not share the same letter have statistically different scale scores. The nine items of the Health and Prevention Programs scale were summed into a scale (alpha = .88) that ranged from 9 to 36 with a mean of 27. There were some statistically significant differences among teachers associated with gender and teaching experience, but the differences were small, with effect sizes of .02 or less. Male teachers were more likely to report that their schools made greater health and prevention efforts for students. More experienced teachers tended to report greater provision of health and prevention programs than teachers with less experience.

VHSSS: Ninth Grade Survey Results 59
Encouragement of help seeking scale
How much do you agree with the following statements… Disagree/ Strongly Disagree
Agree/ Strongly
Agree I encourage students to come to me for academic help. 1 99 I let students know that I am available to talk outside of class. 3 97 I encourage students to turn to me with personal problems. 22 78 I encourage students to tell me if they are being bullied. 8 92 I encourage students to come forward if they have information about a gun at school. 7 93
I encourage students to come forward if they have information about a student who plans to hurt him/herself or someone else. 6 94
I believe that teachers should be mentors as well as instructors. 2 98
Overall, most teachers agreed or strongly agreed that they encourage students to seek help for a variety of reasons including academics (99%), personal problems (78%), bullying (92%), information about weapons at school (93%), and information about students intending harm to him/herself or someone else (94%). Almost all teachers reported letting their students know they are available outside of class (97%), and that they believe that teachers should be mentors as well as instructors (98%).
Groups N Mean SD F value p value Effect size All teachers 2994 33.30 3.79 Gender 3.51 .06 .00 Boys 1061 33.24 3.88 Girls 1850 33.35 3.73 Race .36 .84 .00 Black 353 33.17 4.15 Hispanic 50 32.86 4.51 White 2409 33.34 3.71 Asian 39 33.51 3.89 Other 60 33.08 3.74 Teaching Experience (years) .15 .93 .00 1-5 1057 33.15 3.67 6-10 612 33.12 3.81 11-15 363 33.33 3.96 16 or more 879 33.62 3.80
The seven items of the Encouragement of Help Seeking scale were summed into a scale (alpha = .85) that ranged from 12 to 40 with a mean of 33. There were no statistically significant differences among teachers associated with gender, race, or teaching experience.

VHSSS: Ninth Grade Survey Results 60
Measures of Student Engagement Academic press scale
How true is this in your school? Not very true/ Not at all true
Somewhat true
True/ Very true
When students figure out how to do a problem, teachers give them more challenging problems to think about. 5 41 54
Teachers press students to do thoughtful work. 4 27 69 When students are working out a problem, teachers tell them to keep thinking until they really understand. 6 39 55
Teachers don't let students just do easy work, but make them think. 6 34 60 Teachers make sure that the work students do really makes them think. 7 39 54
Teachers accept nothing less than students' full effort. 19 45 36 Source: Midgley et al., 2000 A majority of teachers reported that teachers in their school press students to really think when working out problems. A little over half of teachers felt this was true or very true in terms of providing students who can solve a problem even more challenging problems (54%), pressing them to do thoughtful work (69%), and making sure they don’t just do easy work (60%). There were mixed opinions regarding whether teachers accept nothing less than students’ full effort. Slightly less than half of the teachers (45%) felt this was somewhat true.
Groups N Mean SD F value p value Effect size Tukey test1 All teachers 2939 21.32 3.72 Gender 0.57 .45 .00 Male 1068 21.25 3.61 Female 1868 21.36 3.79 Race 3.45 .01 .00 Black 355 21.76 4.25 a Hispanic 53 20.70 5.17 a White 2428 21.25 3.58 a Asian 39 22.77 3.96 a Other 61 20.98 4.08 a Teaching Experience (years) 8.06 .00 .01 1-5 1064 21.06 3.71 a 6-10 619 20.99 3.85 a 11-15 368 21.52 3.56 a, b 16 or more 885 21.77 3.68 b
1For Tukey test results, groups that do not share the same letter have statistically different scale scores. The six items of the Academic Press scale were summed into a scale (alpha = .89) that ranged from 6 to 30 with a mean of 21. There were no statistical differences among teachers associated with gender, although teachers differed slightly based on race and teaching experience. The differences were so small that the effect sizes were .01 or less. Although there was an overall significant difference among racial groups, no single comparison of teachers by racial category showed a significant difference. Teachers with 16 or more years of experience were more likely to agree that teachers pressed students to think while doing work at school than those with 1 to 10 years of teaching experience.

VHSSS: Ninth Grade Survey Results 61
Measures of Teacher Victimization Total victimization index
This year in school have any of the following happened to you personally in the school?
False True
Damage to personal property worth more than $10. 86.3 13.7 Theft of personal property worth more than $10. 84.6 15.4 Was physically attacked and had to see a doctor. 98.9 1.1 Was physically attacked, but not seriously enough to see a doctor. 96.9 3.1 Received obscene remarks or gestures from a student. 56.9 43.1 Was threatened in remarks by a student. 80.3 19.7 Had a weapon pulled on me. 99.6 0.4 Was spoken to in a rude or disrespectful manner by a student. 16.3 83.7
Source: Gottfredson, 1999
Overall, most teachers reported little personal victimization in school this year. About one in seven teachers reported damage (14%) or theft (15%) of personal property. A small percentage (1-3%) reported being physically attacked, although about one in five reported being threatened by a student (20%). Less than 1% of teachers reported having had a weapon pulled on them. The most frequent forms of victimization were receiving obscene remarks or gestures (43%) and being spoken to in a disrespectful manner (84%).
Groups N Mean SD F value p value Effect size Tukey test1 All teachers 2994 1.80 1.35 Gender 0.01 .94 .00 Male 1061 1.80 1.45 Female 1850 1.80 1.28 Race 0.91 .46 .00 Black 353 1.84 1.34 Hispanic 50 1.74 1.24 White 2409 1.79 1.34 Asian 39 1.72 1.40 Other 60 2.10 1.36 Teaching Experience (years) 13.42 .00 .01 1-5 1057 1.98 1.36 a 6-10 612 1.82 1.27 a, b 11-15 363 1.68 1.28 b, c 16 or more 879 1.61 1.36 c
1For Tukey test results, groups that do not share the same letter have statistically different scale scores. The “true” responses of the Total Victimization index were summed into an index that ranged from 0 to 8 with a mean of 2. Although there were no statistically significant differences among teachers associated with gender or race, there were significant differences based on teaching experience. The differences were so small that the effect size was .01. Teachers with 16 or more years of experience were less likely to report victimization than teachers with 1 to 10 years of experience.

VHSSS: Ninth Grade Survey Results 62
More severe victimization index
This year in school have any of the following happened to you personally in the school?
False True
Was physically attacked and had to see a doctor. 98.9 1.1 Was physically attacked, but not seriously enough to see a doctor. 96.9 3.1 Had a weapon pulled on me. 99.6 0.4
Source: Gottfredson, 1999
The most serious forms of victimization were pulled from the total scale and analyzed separately. Few teachers reported serious victimization.
Groups N Mean SD F value p value Effect size All teachers 2994 0.05 0.27 Gender 4.53 .03 .00 Male 1061 0.06 0.32 Female 1850 0.04 0.22 Race 1.13 .34 .00 Black 353 0.05 0.32 Hispanic 50 0.00 0.00 White 2409 0.04 0.25 Asian 39 0.10 0.38 Other 60 0.07 0.31 Teaching Experience (years) 0.98 .40 .00 1-5 1057 0.05 0.29 6-10 612 0.05 0.29 11-15 363 0.03 0.18 16 or more 879 0.04 0.23
The three items of the More Severe Victimization index were summed into an index that ranged from 0 to 3 with a mean of 1. There were statistically significant differences among teachers associated with gender, although none associated with race or teaching experience. The differences related to gender were so small that the effect size was less than .01. Male teachers were slightly more likely to report serious victimization than their female counterparts.

VHSSS: Ninth Grade Survey Results 63
Minor victimization index
This year in school have any of the following happened to you personally in the school?
False True
Damage to personal property worth more than $10. 86 14 Theft of personal property worth more than $10. 85 15 Received obscene remarks or gestures from a student. 57 43 Was threatened in remarks by a student. 80 20 Was spoken to in a rude or disrespectful manner by a student. 16 84
Source: Gottfredson, 1999
The less serious forms of victimization were pulled from the total scale for separate analysis.
Groups N Mean SD F value p value Effect size Tukey test1 All teachers 2994 1.76 1.25 Gender 0.13 .72 .00 Male 1061 1.75 1.32 Female 1850 1.76 1.21 Race 0.92 .45 .00 Black 353 1.78 1.24 Hispanic 50 1.74 1.24 White 2409 1.75 1.26 Asian 39 1.62 1.16 Other 60 2.03 1.19 Teaching Experience (years) 14.06 .00 .01 1-5 1057 1.93 1.25 a 6-10 612 1.77 1.18 a, b 11-15 363 1.65 1.25 b, c 16 or more 879 1.58 1.29 c
1For Tukey test results, groups that do not share the same letter have statistically different scale scores. The five items of the Minor Victimization index were summed into an index that ranged from 0 to 5 with a mean of 2. There were no statistically significant differences among teachers associated with gender or race. There were significant differences based on teaching experience, but the differences were so small that the effect size was .01. Overall, teachers with 16 or more years of experience reported less minor victimization than teachers with 1 to 10 years of experience.
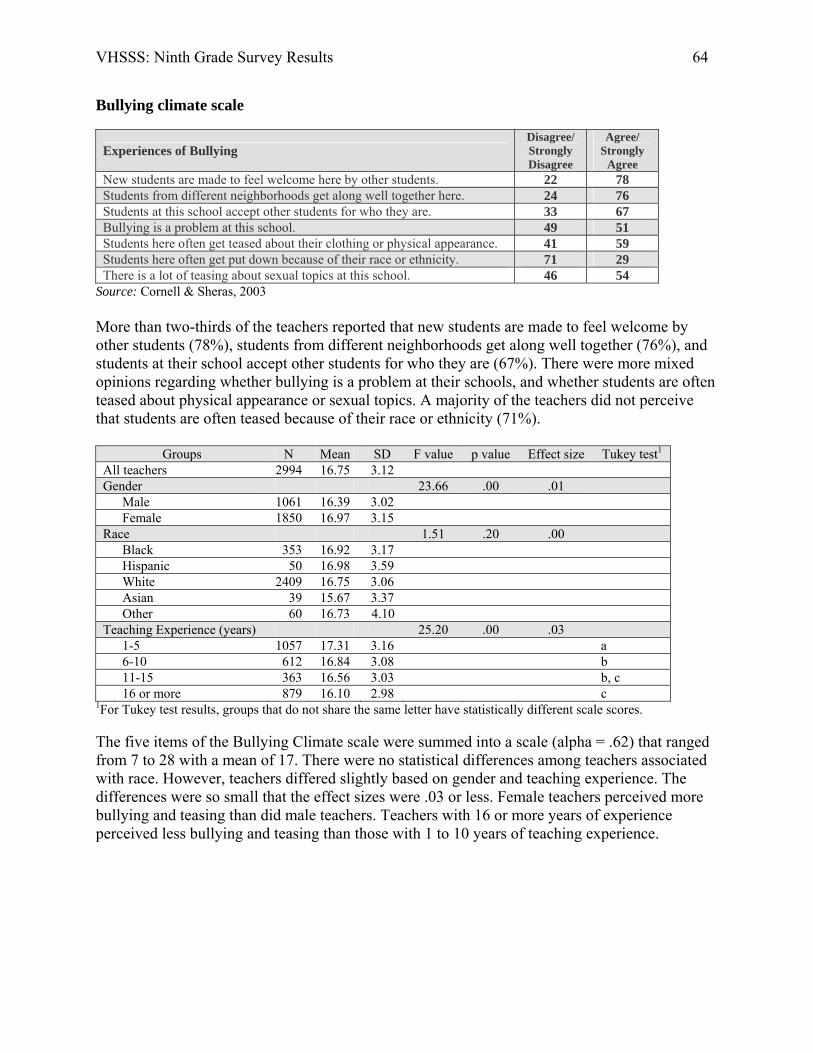
VHSSS: Ninth Grade Survey Results 64
Bullying climate scale
Experiences of Bullying Disagree/ Strongly Disagree
Agree/ Strongly
Agree New students are made to feel welcome here by other students. 22 78 Students from different neighborhoods get along well together here. 24 76 Students at this school accept other students for who they are. 33 67 Bullying is a problem at this school. 49 51 Students here often get teased about their clothing or physical appearance. 41 59 Students here often get put down because of their race or ethnicity. 71 29 There is a lot of teasing about sexual topics at this school. 46 54
Source: Cornell & Sheras, 2003 More than two-thirds of the teachers reported that new students are made to feel welcome by other students (78%), students from different neighborhoods get along well together (76%), and students at their school accept other students for who they are (67%). There were more mixed opinions regarding whether bullying is a problem at their schools, and whether students are often teased about physical appearance or sexual topics. A majority of the teachers did not perceive that students are often teased because of their race or ethnicity (71%).
Groups N Mean SD F value p value Effect size Tukey test1 All teachers 2994 16.75 3.12 Gender 23.66 .00 .01 Male 1061 16.39 3.02 Female 1850 16.97 3.15 Race 1.51 .20 .00 Black 353 16.92 3.17 Hispanic 50 16.98 3.59 White 2409 16.75 3.06 Asian 39 15.67 3.37 Other 60 16.73 4.10 Teaching Experience (years) 25.20 .00 .03 1-5 1057 17.31 3.16 a 6-10 612 16.84 3.08 b 11-15 363 16.56 3.03 b, c 16 or more 879 16.10 2.98 c
1For Tukey test results, groups that do not share the same letter have statistically different scale scores. The five items of the Bullying Climate scale were summed into a scale (alpha = .62) that ranged from 7 to 28 with a mean of 17. There were no statistical differences among teachers associated with race. However, teachers differed slightly based on gender and teaching experience. The differences were so small that the effect sizes were .03 or less. Female teachers perceived more bullying and teasing than did male teachers. Teachers with 16 or more years of experience perceived less bullying and teasing than those with 1 to 10 years of teaching experience.
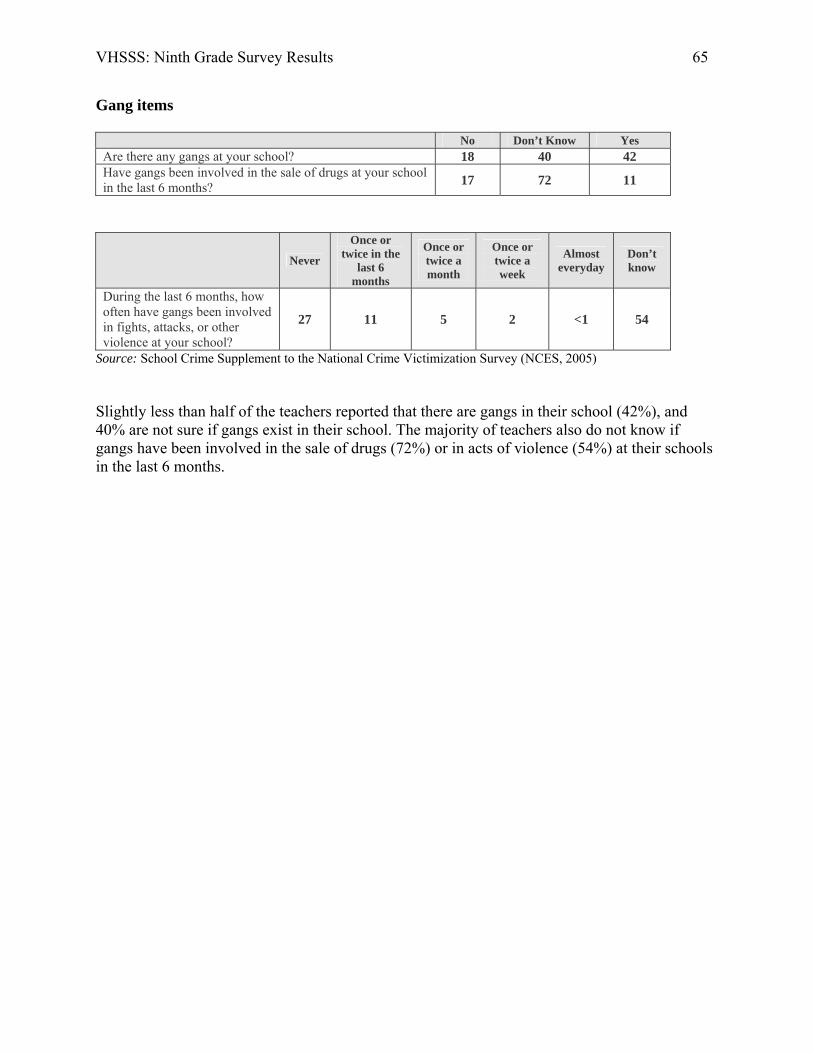
VHSSS: Ninth Grade Survey Results 65
Gang items
No Don’t Know Yes Are there any gangs at your school? 18 40 42 Have gangs been involved in the sale of drugs at your school in the last 6 months? 17 72 11
Never
Once or twice in the
last 6 months
Once or twice a month
Once or twice a week
Almost everyday
Don’t know
During the last 6 months, how often have gangs been involved in fights, attacks, or other violence at your school?
27 11 5 2 <1 54
Source: School Crime Supplement to the National Crime Victimization Survey (NCES, 2005) Slightly less than half of the teachers reported that there are gangs in their school (42%), and 40% are not sure if gangs exist in their school. The majority of teachers also do not know if gangs have been involved in the sale of drugs (72%) or in acts of violence (54%) at their schools in the last 6 months.

VHSSS: Ninth Grade Survey Results 66
Chapter 5 Comparison of Student and Teacher Perceptions of School Climate
A special feature of this survey is that teachers and students were asked many of the same questions, so that it is possible to compare their perspectives. There are 32 questions comprising four scales that can be directly compared. Each table on the following pages presents a comparison of student and teacher perceptions of the school climate, based on the average scores for students and teachers within the same school. There is a total of 291schools in these analyses. Each table presents two types of comparisons between teachers and students. The first comparison is the Pearson correlation (r) that measures the extent to which student and teacher scores correspond with one another, so that a school receiving a high score from its teachers will receive a high score from its students. After the r value is the p value indicating the statistical significance of the correlation. The second comparison is a paired t-test to measure the difference between teacher and student scores. This comparison is useful to determine if teachers systematically give higher or lower scores than students. Each table presents the means and standard deviations for students and teachers, followed by the t-value, its statistical significance (p), and effect size. Experience of school rules. There is modest agreement between teachers and students in their overall perception of school rules. Agreement is greatest in perceiving whether there is a strict dress code, but lowest in whether the punishment for breaking school rules is the same no matter who you are. Teachers are more likely than students to perceive that everyone knows the school rules and that the rules are fair. Students are more likely than teachers to perceive that the rules are strictly enforced and that the dress code is strict. Daily structure. There is moderate agreement between teachers and students in their perception of how closely students are supervised at school. Teachers are more likely than students to perceive that students will be caught wandering in the hallway, cutting class, or fighting. In contrast, students are more likely than teachers to perceive that students will be caught smoking. Students are less likely than their teachers to perceive that teachers will overlook a student coming late to class or saying something sarcastic to a teacher. Security measures. There was high overall agreement between teachers and students in perceptions of security measures in place at school, although teachers report more security measures than do students. The highest agreement between teachers and students is on whether the school uses security cameras, employs security guards and/or police officers, and has metal detectors. However, there is little agreement between teachers and students on whether visitors must sign in to the school and whether students must wear ID badges. Awareness of zero tolerance policies. There is poor agreement between teachers and students in awareness of zero tolerance policies. In other words, teachers and students do not agree on whether the school has zero tolerance for guns, BB guns, toy guns, drugs, alcohol, and other objects or actions. Teachers are slightly more likely to report a zero tolerance policy than students.
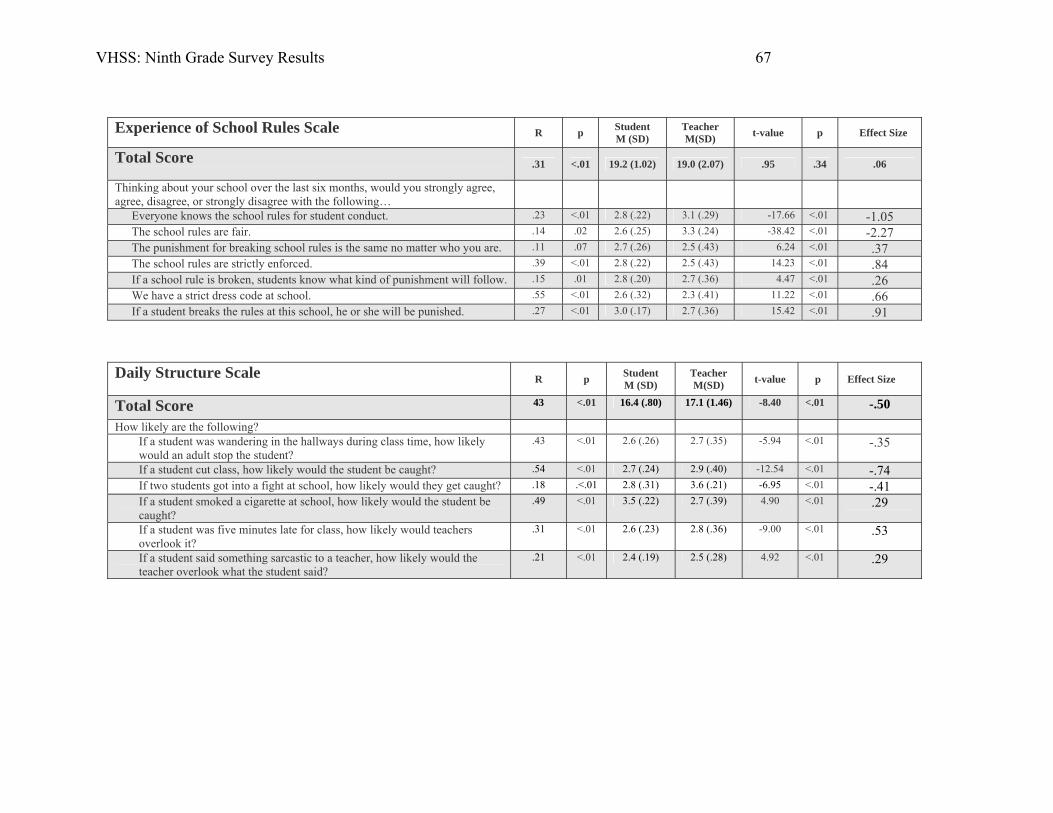
VHSS: Ninth Grade Survey Results 67
Experience of School Rules Scale R p Student
M (SD) Teacher M(SD) t-value p Effect Size
Total Score
.31 <.01 19.2 (1.02) 19.0 (2.07) .95 .34 .06
Thinking about your school over the last six months, would you strongly agree, agree, disagree, or strongly disagree with the following…
Everyone knows the school rules for student conduct. .23 <.01 2.8 (.22) 3.1 (.29) -17.66 <.01 -1.05 The school rules are fair. .14 .02 2.6 (.25) 3.3 (.24) -38.42 <.01 -2.27 The punishment for breaking school rules is the same no matter who you are. .11 .07 2.7 (.26) 2.5 (.43) 6.24 <.01 .37 The school rules are strictly enforced. .39 <.01 2.8 (.22) 2.5 (.43) 14.23 <.01 .84 If a school rule is broken, students know what kind of punishment will follow. .15 .01 2.8 (.20) 2.7 (.36) 4.47 <.01 .26 We have a strict dress code at school. .55 <.01 2.6 (.32) 2.3 (.41) 11.22 <.01 .66 If a student breaks the rules at this school, he or she will be punished. .27 <.01 3.0 (.17) 2.7 (.36) 15.42 <.01 .91
Daily Structure Scale
R p Student M (SD)
Teacher M(SD) t-value p Effect Size
Total Score 43 <.01 16.4 (.80) 17.1 (1.46) -8.40 <.01 -.50
How likely are the following? If a student was wandering in the hallways during class time, how likely would an adult stop the student?
.43 <.01 2.6 (.26) 2.7 (.35) -5.94 <.01 -.35
If a student cut class, how likely would the student be caught? .54 <.01 2.7 (.24) 2.9 (.40) -12.54 <.01 -.74 If two students got into a fight at school, how likely would they get caught? .18 .<.01 2.8 (.31) 3.6 (.21) -6.95 <.01 -.41 If a student smoked a cigarette at school, how likely would the student be caught?
.49 <.01 3.5 (.22) 2.7 (.39) 4.90 <.01 .29
If a student was five minutes late for class, how likely would teachers overlook it?
.31 <.01 2.6 (.23) 2.8 (.36) -9.00 <.01 .53
If a student said something sarcastic to a teacher, how likely would the teacher overlook what the student said?
.21 <.01 2.4 (.19) 2.5 (.28) 4.92 <.01 .29

VHSSS: Ninth Grade Survey Results 68
School Security Measures Index
r p Student M (SD)
Teacher M(SD) t-value p Effect Size
Total Score .79 <.01 4.8 (.75) 5.8 (.82) -31.01 <.01 -1.84
Does your school take any of these measures to make sure students are safe? Security guards or assigned police officers? .86 <.01 0.9 (.22) .9 (.23) -8.69 <.01 -.51 Other school staff or other adults supervising the hallways? .17 <.01 0.9 (.10) 1.0 (.08) -8.56 <.01 -.51 Metal detectors? .83 <.01 0.1 (.19) .1 (.20) 2.93 .004 .17 Locked entrance or exit doors during the day? .67 <.01 0.5 (.25) .7 (.30) -14.06 <.01 -.83 A requirement that visitors sign in? .04 .51 1.0 (.06) 1.0 (.05) -5.15 <.01 -.31 Locker checks? .47 <.01 0.5 (.26) .6 (.28) -6.75 <.01 -.40 A requirement that students wear badges or picture identification? -.15 .80 0.1 (.16) .6 (.15) 6.51 <.01 .39 One or more security cameras to monitor the school? .94 <.01 0.8 (.34) .8 (.38) 1.70 .09 .10 A code of student conduct (written rules for students to follow)? .21 <.01 1.0 (.05) 1.0 (.04) -8.29 <.01 -.49
Awareness of Zero Tolerance Policies Index
r p Student M (SD)
Teacher M(SD) t-value p Effect Size
Total Score .19 <.01 6.5 (.70) 6.6 (1.09) -1.09 .28 -.06
Zero tolerance means that a student is automatically expelled or given a lengthy suspension for any violation of the rule. Does your school have zero tolerance for:
Bringing a BB gun, pellet gun, or similar gun to school? -.07 .22 0.9 (.07) 1.0 (.06) -9.05 <.01 -.54 Bringing a toy gun or something that looks like a gun to school? .01 .88 0.9 (.09) .9 (.12) -7.49 <.01 -.44 Bringing in edged or cutting weapons such as knives? .29 <.01 0.9 (.09) .9 (.12) -3.66 <.01 -.22 Bringing illegal drugs to school? .11 .07 0.9 (.07) .9 (.11) -3.46 <.01 -.20 Bringing legal drugs, such as prescription drugs and over the counter medications, to school?
.09 .11 0.7 (.15) .8 (.20) -3.11 .<01 -.18
Bringing alcohol to school? .04 .46 0.9 (.07) .9 (.11) -2.09 .04 .12 Belonging to a gang? .22 <.01 0.6 (.18) .7 (.27) -.54 .59 -.03 Fighting at school? .15 .01 0.8 (.10) .8 (.17) 2.63 <.01 .16 Does your school have zero tolerance for some other reason not mentioned above?
.03 .65 .2 (.17) .2 (.29) .62 .53 .04

VHSS: Ninth Grade Survey Results 69
Chapter 6
Student Perceptions of School Climate Differences Associated with Student Enrollment, Poverty, and Minority Status
In this section, student surveys are aggregated so that each school has a single score representing the average of all the students for that school who completed the survey. The scores for each school were correlated with the size of the school (Fall 2006 total enrollment for grades 9-12), the percentage of students eligible for free or reduced price meals (low income), and the percentage of minority (nonwhite) students at the school. The overall sample size consisted of 286 schools; however, for a small number of schools, there are missing data for some of the variables. Correlations are presented first for the total score for each scale or index and then for each of the items that are part of the scale or index. The analyses presented here are simple correlations and they do not prove the existence of a causal relationship. However, the presence of a statistically significant correlation does indicate the need for further study and examination in future reports. It is also important to recognize that school size is correlated -.42 with the percentage of low income students and .35 with the percentage of minority students in the school, and that the percentage of low income students is correlated .31 with the percentage of minority students. In future analyses, we will attempt to disentangle the complex and interacting effects of these variables on school climate. Throughout this section we have prepared some bar charts that allow readers to appreciate what the correlations mean in practical terms. We followed three conventions in creating these charts: 1. School enrollment was classified as small, medium, and large using the cut-offs used in
Virginia athletics: under 700, 700-1500, and over 1500 students. 2. For other variables that did not have convenient cut-off points, we divided schools into
groups by rank ordering the schools and classifying the top third as “high,” the middle third as “medium,” and the lower third as “low.” This is an arbitrary division.
3. Finally, we transformed the scores on most scales into percentiles so that they will be easier
to interpret. For example, rather than present a chart showing the average scores for each group of schools, we report the percentile rank for each group in comparison to all schools. Percentile scores do not tell us the absolute size of the gap between two points, but do indicate how many schools fall above and below those points. (Note that a large percentile gap could be associated with a relatively small difference if a large number of schools are clustered together.)
We have selectively chosen some of the statistically significant correlations to mention in the text and to depict in charts. The reader is urged to review all of the statistically significant results in order to gain a more complete understanding of the findings. Effect sizes are reported because in a large sample even small group differences can be statistically significant.
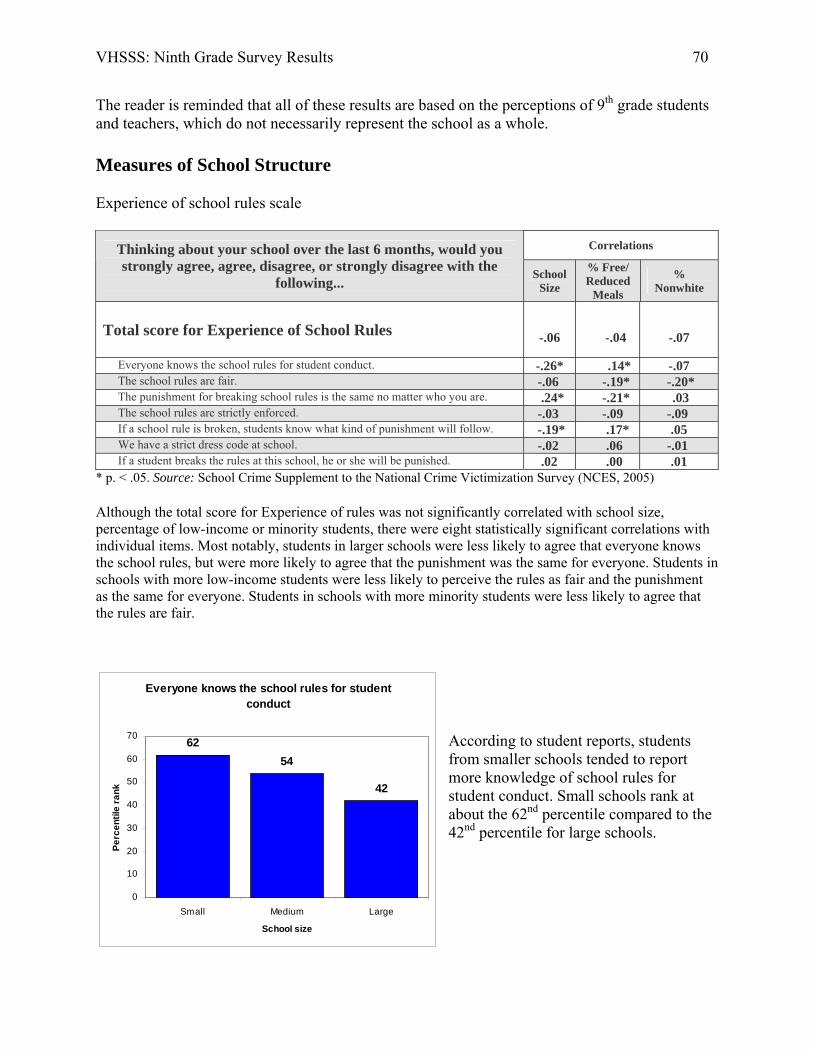
VHSSS: Ninth Grade Survey Results 70
Everyone knows the school rules for student conduct
6254
42
0
10
20
30
40
50
60
70
Small Medium Large
School size
Perc
entil
e ra
nkThe reader is reminded that all of these results are based on the perceptions of 9th grade students and teachers, which do not necessarily represent the school as a whole. Measures of School Structure
Experience of school rules scale
Correlations Thinking about your school over the last 6 months, would you strongly agree, agree, disagree, or strongly disagree with the
following... School Size
% Free/ Reduced
Meals
% Nonwhite
Total score for Experience of School Rules
-.06
-.04
-.07
Everyone knows the school rules for student conduct. -.26* .14* -.07 The school rules are fair. -.06 -.19* -.20* The punishment for breaking school rules is the same no matter who you are. .24* -.21* .03 The school rules are strictly enforced. -.03 -.09 -.09 If a school rule is broken, students know what kind of punishment will follow. -.19* .17* .05 We have a strict dress code at school. -.02 .06 -.01 If a student breaks the rules at this school, he or she will be punished. .02 .00 .01
* p. < .05. Source: School Crime Supplement to the National Crime Victimization Survey (NCES, 2005) Although the total score for Experience of rules was not significantly correlated with school size, percentage of low-income or minority students, there were eight statistically significant correlations with individual items. Most notably, students in larger schools were less likely to agree that everyone knows the school rules, but were more likely to agree that the punishment was the same for everyone. Students in schools with more low-income students were less likely to perceive the rules as fair and the punishment as the same for everyone. Students in schools with more minority students were less likely to agree that the rules are fair.
According to student reports, students from smaller schools tended to report more knowledge of school rules for student conduct. Small schools rank at about the 62nd percentile compared to the 42nd percentile for large schools.

VHSSS: Ninth Grade Survey Results 71
Security guards or assigned police officers?
13
37
51
0
10
20
30
40
50
60
Small Medium Large
School size
Perc
entil
e ra
nkSecurity Measures index
Correlations Does your school take any of these measures to make sure
students are safe? School Size
% Free/ Reduced
Meals
% Nonwhite
Total score for Security Measures
.17*
.09
.27*
Security guards or assigned police officers? .41* -.16* .26* Other school staff or other adults supervising the hallways? .28* -.17* .15* Metal detectors? .05 .31* .45* Locked entrance or exit doors during the day? .14* -.03 .15* A requirement that visitors sign in? .16* -.17* .02 Locker checks? -.15* .14* -.14* A requirement that students wear badges or picture identification? .10 .19* .37* One or more security cameras to monitor the school? .19* .00 .15* A code of student conduct (written rules for students to follow)? .16* -.13* -.03
* p. < .05. Source: School Crime Supplement to the National Crime Victimization Survey (NCES, 2005) The total score for Security measures was significantly correlated with school size and the percentage of minority students. For example, students from larger schools and schools with more minority students were more likely to report security measures such as security guards, staff supervising the hallways, and locked entrances during the day. In total, there were twenty-one statistically significant correlations with individual scale items. .
Students in large schools were more likely than students in small schools to report the presence of security guards or assigned police officers. Large schools rank at the 51st percentile compared to the 13th percentile for small schools. Note, however, that these are student perceptions and might not reflect the actual presence of security and police staff.

VHSSS: Ninth Grade Survey Results 72
Awareness of zero tolerance policies index
Correlations Zero tolerance means that a student is automatically expelled or given a lengthy suspension for any violation of
the rule. Does your school have zero tolerance for: School
Size
% Free/ Reduced
Meals
% Nonwhite
Total score for Awareness of Zero Tolerance Policies
.04 -.06 -.03
Bringing a gun to school? .02 -.32* -.22* Bringing a BB gun, pellet gun, or similar gun to school? .03 -.33* -.22* Bringing a toy gun or something that looks like a gun to school? .06 -.21* -.05 Bringing in edged or cutting weapons such as knives? .17* -.22* .06 Bringing illegal drugs to school? .02 -.27* -.20* Bringing legal drugs, such as prescription drugs and over the counter medications, to school? .13* -.08 .01
Bringing alcohol to school? .01 -.24* -.20* Belonging to a gang? .00 -.08 -.06 Fighting at school? -.06 .01 -.06 Does your school have zero tolerance for some other reason not mentioned above? .05 .01 .09
* p. < .05. Source: Virginia Dept. of Criminal Justice Services, 2005 The total score for Awareness of zero tolerance policies was not significantly correlated with school size, percentage of low-income students or minority students; however, there were twelve statistically significant correlations with individual items. For example, students from schools with higher percentages of low-income and minority students were less likely to note zero tolerance for bringing guns, illegal drugs, or alcohol to school. Time out of class
Correlations
School Size
% Free/ Reduced
Meals
% Nonwhite
How many minutes do students have for lunch on a normal day? -.02 -.01 -.01 How many minutes do students have when changing classes or going from one class to the next?
.50* -.20* .05
How many times do students change classes on a normal day? -.33* .05 -.23*
* p. < .05. Students from larger schools reported more time between classes, while students from schools with higher percentages of lower-income students reported less time. Students from larger schools and schools with a higher minority population reported fewer class changes during the school day.
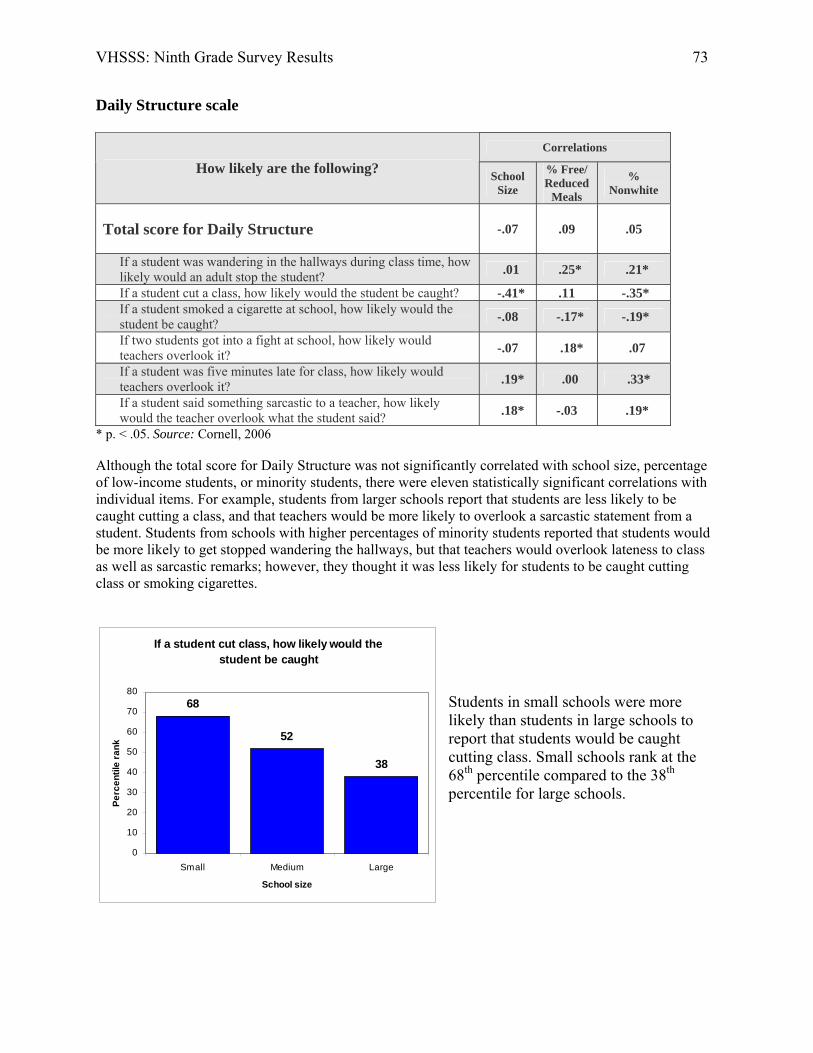
VHSSS: Ninth Grade Survey Results 73
If a student cut class, how likely would the student be caught
68
52
38
0
10
20
30
40
50
60
70
80
Small Medium Large
School size
Perc
entil
e ra
nkDaily Structure scale
Correlations
How likely are the following? School Size
% Free/ Reduced
Meals
% Nonwhite
Total score for Daily Structure
-.07 .09 .05
If a student was wandering in the hallways during class time, how likely would an adult stop the student? .01 .25* .21*
If a student cut a class, how likely would the student be caught? -.41* .11 -.35* If a student smoked a cigarette at school, how likely would the student be caught? -.08 -.17* -.19*
If two students got into a fight at school, how likely would teachers overlook it? -.07 .18* .07
If a student was five minutes late for class, how likely would teachers overlook it? .19* .00 .33*
If a student said something sarcastic to a teacher, how likely would the teacher overlook what the student said? .18* -.03 .19*
* p. < .05. Source: Cornell, 2006 Although the total score for Daily Structure was not significantly correlated with school size, percentage of low-income students, or minority students, there were eleven statistically significant correlations with individual items. For example, students from larger schools report that students are less likely to be caught cutting a class, and that teachers would be more likely to overlook a sarcastic statement from a student. Students from schools with higher percentages of minority students reported that students would be more likely to get stopped wandering the hallways, but that teachers would overlook lateness to class as well as sarcastic remarks; however, they thought it was less likely for students to be caught cutting class or smoking cigarettes.
Students in small schools were more likely than students in large schools to report that students would be caught cutting class. Small schools rank at the 68th percentile compared to the 38th percentile for large schools.

VHSSS: Ninth Grade Survey Results 74
Students tell teachers when other students are being bullied
68
52
37
0
10
20
30
40
50
60
70
80
Small Medium Large
School size
Perc
entil
e ra
nkMeasures of Student Support Help Seeking Scale
Correlations
How much do you agree or disagree with these statements? School Size
% Free/ Reduced
Meals
% Nonwhite
Total score for Help Seeking
-.17* -.14* -.32*
If another student was bullying me, I would tell one of the teachers or staff at school. -.04 -.08 -.12*
There are adults at this school I could turn to if I had a personal problem. -.14* .01 -.08
If I tell a teacher that someone is bullying me, the teacher will do something to help. -.01 -.25* -.20*
Students tell teachers when other students are being bullied. -.33* .22* -.12* If another student talked about killing someone, I would tell one of the teachers or staff at school. -.16* -.11 -.30*
If another student brought a gun to school, I would tell one of the teachers or staff at school. -.11 -.27* -.48*
Teachers here make it clear to students that bullying is not tolerated. -.06 -.22* -.25* Students here try to stop bullying when they see it happening -.20* -.06 -.29*
* p. < .05. Source: Cornell & Sheras, 2003 Overall, students from larger schools and schools with higher percentages of low-income and minority students reported less willingness to seek help from teachers or staff at their schools. There were fifteen statistically significant correlations for individual items.
Students in small schools were more likely than students in large schools to report bullying behaviors to teachers. Small schools rank at the 68th percentile compared to the 37th percentile for large schools.

VHSSS: Ninth Grade Survey Results 75
Told a teacher (or other adult at school) about something that worries you
6154
46
0
10
20
30
40
50
60
70
Small Medium Large
School size
Perc
entil
e ra
nkHelp seeking behavior scale
Correlations
During the past 6 months, how many times have you… School Size
% Free/ Reduced
Meals
% Nonwhite
Total Score for Help Seeking Behavior
-.12*
.23*
.28*
Gone to a teacher (or other adult at school) for academic help? .10 -.06 .28* Asked a teacher (or other adult at school) for advice? -.13* .26* .20* Told a teacher (or other adult at school) about something that worries you? -.17* .29* .25*
Told a teacher (or other adult at school) about a friend who was in trouble? -.26* .31* .09
* p. < .05. Source: School Crime Supplement to the National Crime Victimization Survey (NCES, 2005) Students from larger schools reported fewer efforts to seek help from a teacher than students in smaller schools. Conversely, students in schools with more low-income or minority students reported more help-seeking behavior.
Students in small schools were more likely than students in large schools to tell a teacher or another adult about something worrying them. Small schools rank at the 61st percentile compared to the 46th percentile for large schools.

VHSSS: Ninth Grade Survey Results 76
Adults in this school really care about all students
64
5042
0
10
20
30
40
50
60
70
Small Medium Large
School size
Perc
entil
e ra
nkLearning/Working Environment scale
Correlations
How much do you agree that adults in this school… School Size
% Free/ Reduced
Meals
% Nonwhite
Total score for Learning/Working Environment
-.17* -.16* -.30*
Really care about all students. -.21* -.18* -.37* Acknowledge and pay attention to students. -.14* -.21* -.30* Want all students to do their best. -.17* -.16* -.26* Listen to what students have to say. -.13* -.18* -.33* Believe that every student can be a success. -.22* -.02 -.14* Treat all students fairly. -.02 -.18* -.19* Support and treat students with respect. -.09 -.20* -.31* Feel a responsibility to improve the school. -.20* -.03 -.23*
* p. < .05. Source: Austin & Duerr, 2005 In general, students from larger schools and schools with higher percentages of low-income and minority students feel less positively about the learning/working environment within their school. Most notably, students in larger schools are less likely to believe that adults feel that every student can be a success and that they really care about all students. Similarly, students in schools with a larger percentage of minority students perceived the adults in the school as less caring and interested in listening.
Students in small schools were more likely than students in large schools to perceive that adults in school really care about all students. Small schools rank at the 64th percentile compared to the 42nd percentile for large schools.

VHSSS: Ninth Grade Survey Results 77
Measures of Engagement Commitment to school scale
Correlations
How much do you agree or disagree with these statements? School Size
% Free/ Reduced
Meals
% Nonwhite
Total Score for Commitment to School
.08 -.12* .19*
You like school a lot .04 -.01 .12* School is boring to you. .05 -.16* -.17* You do poorly at school. -.04 .11 -.08 You don’t really belong at school. -.08 .14* -.15* Homework is a waste of time. .00 -.09 -.26* You try hard at school. -.07 .01 .11 You usually finish your homework. .04 -.35* -.22* Getting good grades is very important to you. .18* -.15* .23* Sometimes you do extra work to improve your grades. .23* -.24* .23*
p. < .05. Source: Thornberry, Lizotte, Krohn, Farnworth, Jang, 1991
Overall, students from schools with higher percentages of low-income students reported less of a commitment to school. However, students from schools with a higher percentage of minority students reported more of a commitment to school.

VHSSS: Ninth Grade Survey Results 78
Belief in school rules scale
Correlations This section asks you what your friends think, not what you do. In your school, is it OK with your friends to do the
following: School
Size
% Free/ Reduced
Meals
% Nonwhite
Total Score for Belief in School Rules
-.02 -.21* -.19*
Be late for school? .02 -.13* -.21* Cut a couple of classes? .22* .11 .28* Skip school for a whole day? -.21* .12* -.17* Cheat on tests? .03 .12* .11 Copy someone else’s homework? .18* -.20* -.02 Get into physical fights? -.09 .31* .19* Belong to gangs? .05 .31* .36* Steal belongings from school, a student, or a teacher? .16* .09 .21* Destroy or damage school property? .05 .15* .16* Smoke on school grounds? -.08 .35* .16* Drink alcohol during the school day? -.07 .22* .08 Use illegal weapons during the school day? -.09 .32* .17* Bring weapons to school? -.10 .29* .15* Abuse teachers physically? -.05 .37* .22* Talk back to teachers? .12* .11 -.36* Disobey school rules? .10 .04 .15*
* p. < .05. Source: Stewart. 2003 Overall, students from schools with higher percentages of low-income and minority students reported less acceptance of school rules among their friends.

VHSSS: Ninth Grade Survey Results 79
Aggressive attitudes scale
Correlations
How much do you agree or disagree with following? School Size
% Free/ Reduced
Meals
% Nonwhite
Total Score for Aggressive Attitudes
-.07 .39* .34*
It feels good when I hit someone. -.09 .34* .29* If you fight a lot, everyone will look up to you. .01 .37* .40* Sometimes you only have two choices: get punched or punch the other person first. -.09 .43* .35*
If you are afraid to fight, you won’t have many friends. -.06 .37* .38* Students who are bullied or teased mostly deserve it. -.13* .24* .02 Bullying is sometimes fun to do. .06 .00 .09
* p. < .05. Source: Cornell & Sheras, 2003 Students from schools with higher percentages of low-income and minority students expressed higher agreement with aggressive beliefs. Trust in teacher authority scale
Correlations
How much do you agree or disagree with following? School Size
% Free/ Reduced
Meals
% Nonwhite
Total Score for Teacher Authority
-.12* -.13* -.18*
It is sometimes 'ok' to disobey the teacher. .10 -.01 .07 Students should obey teachers even if it goes against what they want to do. -.20* -.05 -.16*
Respect for teachers' authority is important for students to have. -.01 -.08 .03 I do what teachers ask me to do, even if I don't want to do it. .01 -.24* -.17* I can trust the way teachers use their power and authority. -.14* -.17* -.30*
* p. < .05. Source: Gregory, 2005 Overall, students from larger schools and from schools with higher percentages of low-income and minority students reported less trust in teacher authority.

VHSSS: Ninth Grade Survey Results 80
School involvement scale
Correlations During the past 6 months, have you participated in any of the following extra-curricular activities sponsored by your
school such as: School
Size
% Free/ Reduced
Meals
% Nonwhite
Total score for School Involvement
-.19* -.07 -.17*
Athletic teams at school? -.17* -.23* -.30* Spirit groups, for example, Cheerleading or Pep Club? -.28* .07 -.19* Performing arts, for example, Band, Orchestra, or Drama? .04 -.18* .02 Academic clubs, for example, Debate Team, Honor Society, Spanish Club, or Math Club? -.25* .10 -.15*
School government? -.17* .16* .15* Service clubs, for example Key Club or other service oriented groups? -.11 .00 -.18*
During the past 6 months, have you participated in an extra- curricular activity that is not mentioned above? .13* -.04 .16*
* p. < .05. Source: School Crime Supplement to the National Crime Victimization Survey (NCES, 2005) In general, students from larger schools and schools with a larger minority population reported less involvement in school activities. Academic press scale
Correlations
How true is this in your school? School Size
% Free/ Reduced
Meals
% Nonwhite
Total Score for Academic Press
-.05 .06 .04
When I've figured out how to do a problem, my teachers give me more challenging problems to think about. .04 -.02 .03
My teachers press me to do thoughtful work. .03 -.14* -.02 When I'm working out a problem, my teachers tell me to keep thinking until I really understand. -.03 -.02 -.04
My teachers don't let me do just easy work, but make me think. -.09 .17* .05 My teachers make sure that the work I do really makes me think. -.05 .08 .05 My teachers accept nothing less than my full effort. -.12* .19* .11
* p. < .05. Source: Academic Press (Midgley et al., 2000) The total score for Academic press was not significantly correlated with school demographics.

VHSSS: Ninth Grade Survey Results 81
Victimization Total victimization index
Correlations This year in school have any of the following happened to
you personally in the school? School Size
% Free/ Reduced
Meals
% Nonwhite
Total index score for Total Victimization
.03 .03 .04
Damage to personal property worth more than $10. .07 .02 .02 Theft of personal property worth more than $10. .21* -.20* .11 Was physically attacked and had to see a doctor -.02 .26* .15* Was physically attacked, but not serious enough to see a doctor. -.02 .05 .07 Received obscene remarks or gestures from a student. -.09 -.01 -.12* Was threatened in remarks by a student. -.07 .08 .02 Had a weapon pulled on me. .12* .08 .14*
Source: Victimization (Gottfredson, 1999) The overall scale score for Total victimization was not statistically correlated with school demographics. However, there were seven significant correlations for individual items. For example, students from larger schools were more likely to report theft of personal property and students from schools with higher percentages of low-income students were less likely to report theft, but more likely to report being physically attacked and having to see a doctor. Major Victimization Scale
Correlations This year in school have any of the following happened to
you personally in the school? School Size
% Free/ Reduced
Meals
% Nonwhite
Total scale score for Major Victimization
.02 .15* .15*
Was physically attacked and had to see a doctor -.02 .26* .15* Was physically attacked, but not serious enough to see a doctor. -.02 .05 .07 Had a weapon pulled on me. .12* .08 .14*
From Victimization (Gottfredson, 1999) Overall, students from schools with higher percentages of low-income and minority students were more likely to report major victimization.

VHSSS: Ninth Grade Survey Results 82
Minor victimization index
Correlations This year in school have any of the following happened to
you personally in the school? School Size
% Free/ Reduced
Meals
% Nonwhite
Total index score for Minor Victimization
.03 -.03 -.01
Damage to personal property worth more than $10 .07 .02 .02 Theft of personal property worth more than $10 .21* -.20* .11 Received obscene remarks or gestures from a student -.09 -.01 -.16* Was threatened in remarks by a student -.07 .08 .02
From Victimization (Gottfredson, 1999) Minor victimization as a whole was not significantly correlated with school demographics. Bullying climate scale
Correlations
Experiences of teasing and bullying at school School Size
% Free/ Reduced
Meals
% Nonwhite
Total score for Bullying Climate scale
.11 .15* .07
Bullying is a problem at this school. .12* .09 .01 Students here often get teased about their clothing or physical appearance. .11 .20* .27*
Students here often get put down because of their race or ethnicity. .27* -.03 .06 New students are made to feel welcome here by other students. .02 -.17* .02 Students from different neighborhoods get along well together here. -.02 - .42* -.35* There is a lot of teasing about sexual topics at this school. .08 -.17* -.19* Students at this school accept me for who I am. .16* -.05 .23*
Source: Bullying School Climate Survey (Cornell & Sheras, 2003) Overall, students from schools with higher percentages of low-income students reported more bullying and teasing. There were eleven statistically significant correlations for individual items.
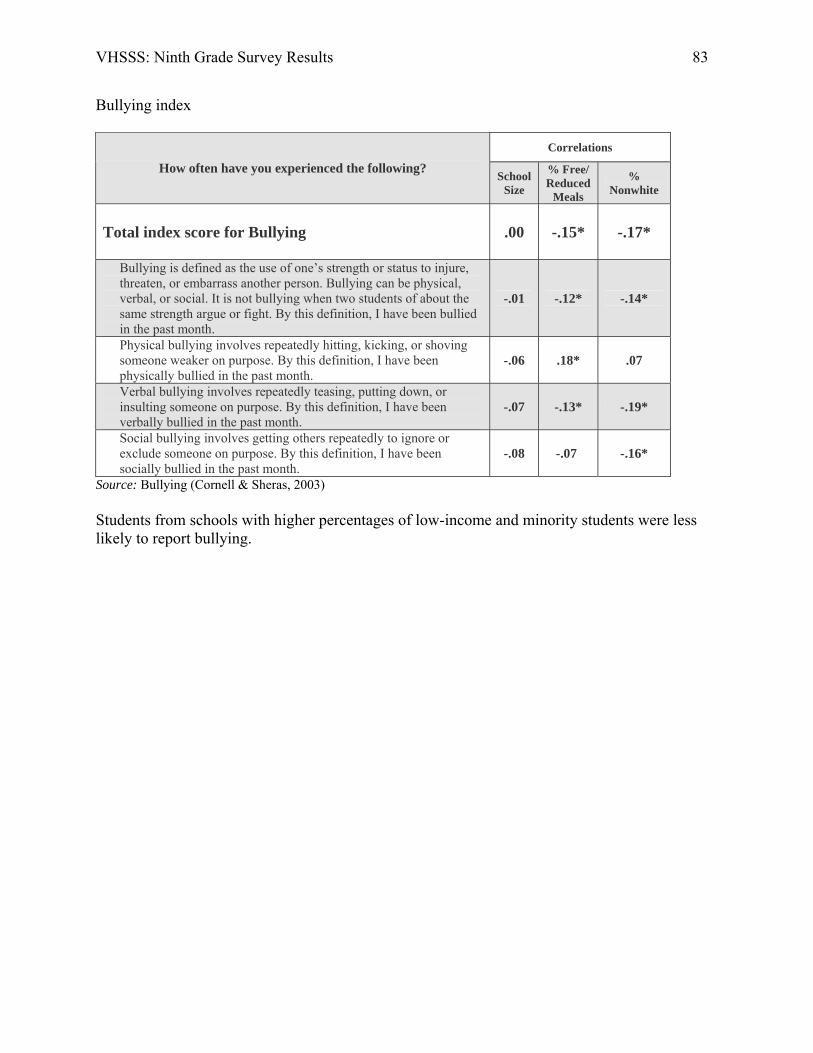
VHSSS: Ninth Grade Survey Results 83
Bullying index
Correlations
How often have you experienced the following? School Size
% Free/ Reduced
Meals
% Nonwhite
Total index score for Bullying
.00 -.15* -.17*
Bullying is defined as the use of one’s strength or status to injure, threaten, or embarrass another person. Bullying can be physical, verbal, or social. It is not bullying when two students of about the same strength argue or fight. By this definition, I have been bullied in the past month.
-.01 -.12* -.14*
Physical bullying involves repeatedly hitting, kicking, or shoving someone weaker on purpose. By this definition, I have been physically bullied in the past month.
-.06 .18* .07
Verbal bullying involves repeatedly teasing, putting down, or insulting someone on purpose. By this definition, I have been verbally bullied in the past month.
-.07 -.13* -.19*
Social bullying involves getting others repeatedly to ignore or exclude someone on purpose. By this definition, I have been socially bullied in the past month.
-.08 -.07 -.16*
Source: Bullying (Cornell & Sheras, 2003) Students from schools with higher percentages of low-income and minority students were less likely to report bullying.
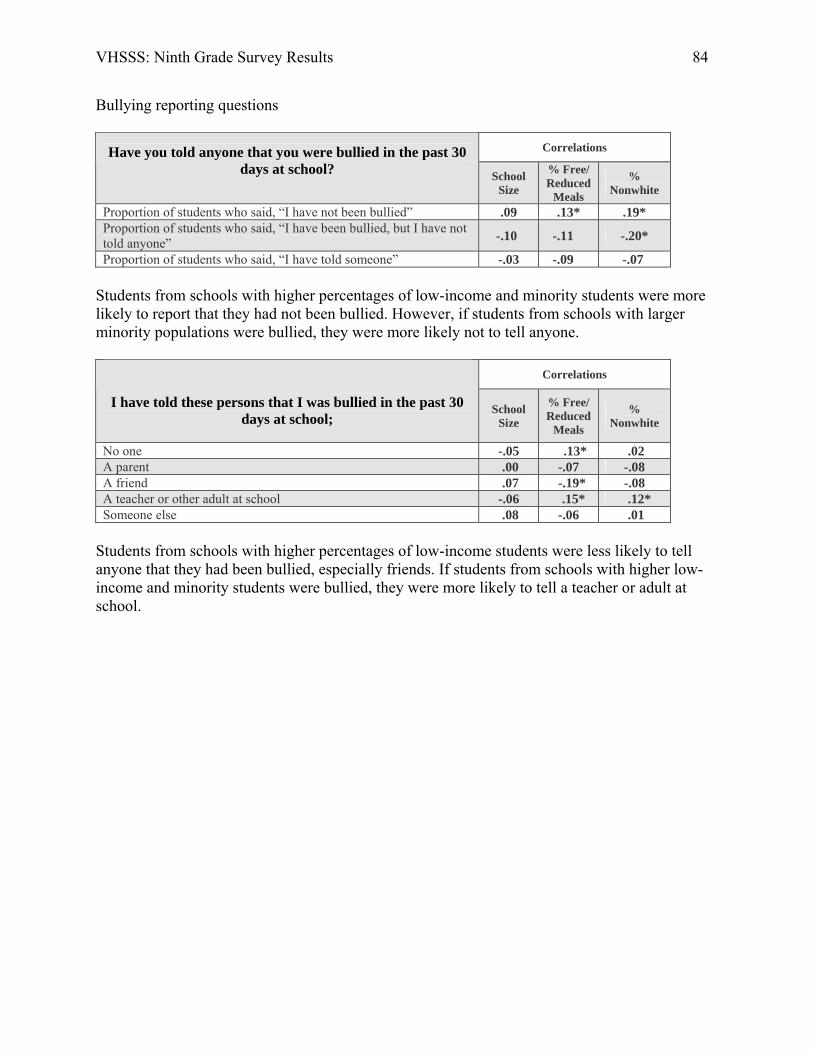
VHSSS: Ninth Grade Survey Results 84
Bullying reporting questions
Correlations Have you told anyone that you were bullied in the past 30 days at school?
School
Size
% Free/ Reduced
Meals
% Nonwhite
Proportion of students who said, “I have not been bullied” .09 .13* .19* Proportion of students who said, “I have been bullied, but I have not told anyone” -.10 -.11 -.20*
Proportion of students who said, “I have told someone” -.03 -.09 -.07 Students from schools with higher percentages of low-income and minority students were more likely to report that they had not been bullied. However, if students from schools with larger minority populations were bullied, they were more likely not to tell anyone.
Correlations
I have told these persons that I was bullied in the past 30 days at school;
School Size
% Free/ Reduced
Meals
% Nonwhite
No one -.05 .13* .02 A parent .00 -.07 -.08 A friend .07 -.19* -.08 A teacher or other adult at school -.06 .15* .12* Someone else .08 -.06 .01
Students from schools with higher percentages of low-income students were less likely to tell anyone that they had been bullied, especially friends. If students from schools with higher low-income and minority students were bullied, they were more likely to tell a teacher or adult at school.
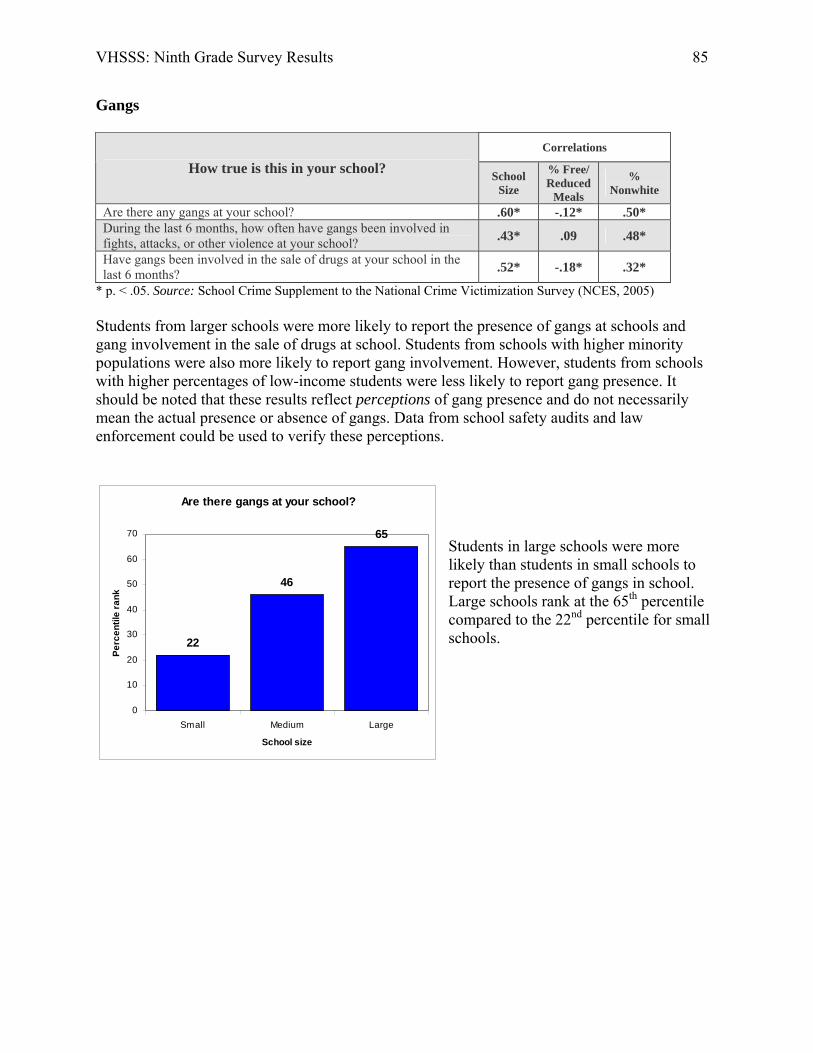
VHSSS: Ninth Grade Survey Results 85
Are there gangs at your school?
22
46
65
0
10
20
30
40
50
60
70
Small Medium Large
School size
Perc
entil
e ra
nkGangs
Correlations
How true is this in your school? School Size
% Free/ Reduced
Meals
% Nonwhite
Are there any gangs at your school? .60* -.12* .50* During the last 6 months, how often have gangs been involved in fights, attacks, or other violence at your school? .43* .09 .48*
Have gangs been involved in the sale of drugs at your school in the last 6 months? .52* -.18* .32*
* p. < .05. Source: School Crime Supplement to the National Crime Victimization Survey (NCES, 2005) Students from larger schools were more likely to report the presence of gangs at schools and gang involvement in the sale of drugs at school. Students from schools with higher minority populations were also more likely to report gang involvement. However, students from schools with higher percentages of low-income students were less likely to report gang presence. It should be noted that these results reflect perceptions of gang presence and do not necessarily mean the actual presence or absence of gangs. Data from school safety audits and law enforcement could be used to verify these perceptions.
Students in large schools were more likely than students in small schools to report the presence of gangs in school. Large schools rank at the 65th percentile compared to the 22nd percentile for small schools.
VHSSS: Ninth Grade Survey Results 86
Chapter 7 Teacher Perceptions of School Climate Differences Associated with Student
Enrollment, Poverty, and Minority Status
In this section, teacher surveys are aggregated so that each school has a single score representing the average of all the teachers for that school who completed the survey. The scores for each school were correlated with the size of the school (Fall 2006 total enrollment for grades 9-12), the percentage of students eligible for free or reduced price meals (low income), and the percentage of minority (nonwhite) students at the school. The overall sample size consisted of 286 schools; however, for a small number of schools, there are missing data for some of the variables. Correlations are presented first for the total score for each scale or index and then for each of the items that are part of the scale or index. The analyses presented here are simple correlations and they do not prove the existence of a causal relationship. However, the presence of a statistically significant correlation does indicate the need for further study and examination in future reports. It is also important to recognize that school size is correlated -.42 with the percentage of low income students and .35 with the percentage of minority students in the school, and that the percentage of low income students is correlated .31 with the percentage of minority students. In future analyses, we will attempt to disentangle the complex and interacting effects of these variables on school climate. Throughout this section we have prepared some bar charts that allow readers to better appreciate what the correlations mean in practical terms. We followed three conventions in creating most of these charts: 1. School enrollment was classified as small, medium, and large using the cut-offs used in
Virginia athletics: under 700, 700-1500, and over 1500 students. 2. For other variables that did not have convenient cut-off points, we divided schools into
groups by rank ordering the schools and classifying the top third as “high,” the middle third as “medium,” and the lower third as “low.”
3. Finally, we transformed the scores on most scales into percentiles so that they will be easier
to interpret. For example, rather than present a chart showing the average score for a group of schools, we report the percentile for the mean of these schools among all schools.
We have selectively chosen some of the statistically significant correlations to mention in the text and to depict in charts. The reader is urged to review all of the statistically significant results in order to gain a more complete understanding of the findings. Effect sizes are reported because in a large sample even small group differences can be statistically significant. The reader is reminded that all of these results are based on the perceptions of 9th grade students and teachers, which do not necessarily represent the school as a whole.

VHSSS: Ninth Grade Survey Results 87
If a school rule is broken, students know what punishment will follow.
62
48 48
0
10
20
30
40
50
60
70
Small Medium Large
School size
Perc
entil
e ra
nk
Measures of School Structure
Correlations Thinking about your school over the last 6 months, would you strongly
agree, agree, disagree, or strongly disagree with the following... School Size
% Free/ Reduced
Meals
% Nonwhite
Total Score for Experience of School Rules
-.14* -.01 -.25*
Everyone knows the school rules for student conduct. -.10 -.05 -.18* The school rules are fair. -.02 -.15* -.17* The punishment for breaking school rules is the same no matter who you are. -.09 -.05 -.25* The school rules are strictly enforced. -.14* -.02 -.26* If a school rule is broken, students know what kind of punishment will follow. -.20* .04 -.24* We have a strict dress code at school. -.10 .07 -.05 If a student breaks the rules at this school, he or she will be punished. -.14* .03 -.27*
* p. < .05. Source: School Crime Supplement to the National Crime Victimization Survey (NCES, 2005) Teachers in larger schools and schools with proportionately more minority students were less likely to perceive the school rules as strict, but fair, and consistently enforced than teachers from schools that were smaller or had proportionately fewer minority students. One example is presented in the adjacent chart. Teachers in medium and larger schools were less likely than teachers in smaller schools to report that students know what punishment will follow from breaking a rule. Medium and large schools (> 700 students) rank at about the 48th percentile compared to the 62nd percentile for small schools (< 700 students).

VHSSS: Ninth Grade Survey Results 88
Number of Security Measures
33
4853
0
10
20
30
40
50
60
Small Medium Large
School size
Perc
entil
e ra
nk
Security measures index
Correlations Does your school take any of these measures to make sure
students are safe School Size
% Free/ Reduced
Meals
% Nonwhite
Total index score of security measures
.18* .09 .22*
Security guards or assigned police officers? .35* -.16* .14* Other school staff or other adults supervising the hallways? -.04 -.03 -.15* Metal detectors? .03 .33* .47* Locked entrance or exit doors during the day? .22* -.11 .13* A requirement that visitors sign in? .15* -.23* -.08 Locker checks? -.01 .11 -.11 A requirement that students wear badges or picture identification? .05 .24* .36* One or more security cameras to monitor the school? .13* .03 .12* A code of student conduct (written rules for students to follow)? .08 -.16* -.10
* p. < .05. Source: School Crime Supplement to the National Crime Victimization Survey (NCES, 2005) Teachers in larger schools and schools with proportionately more minority students reported more security measures than teachers from smaller schools and teachers with proportionately fewer minority students. Notably, according to teachers, schools with proportionately more minority students were substantially more likely to use metal detectors and require student identification. Teachers in larger schools were more likely to report higher numbers of security measures implemented in their schools than teachers in smaller schools. Large schools (> 1,500 students) rank at about the 53rd percentile compared to the 33rd percentile for small schools (< 700 students).

VHSSS: Ninth Grade Survey Results 89
Awareness of zero tolerance policies index
Correlations Zero tolerance means that a student is automatically expelled or given a lengthy suspension for any violation of the rule. Does
your school have zero tolerance for: School Size
% Free/ Reduced
Meals
% Nonwhite
Total score for awareness of zero tolerance policies
-.03 .12* .01
Bringing a gun to school? .08 -.06 .01 Bringing a BB gun, pellet gun, or similar gun to school? .08 .01 .05 Bringing a toy gun or something that looks like a gun to school? .06 -.00 .04 Bringing in edged or cutting weapons such as knives? .20* -.14* .09 Bringing illegal drugs to school? -.03 -.04 -.08 Bringing legal drugs, such as prescription drugs and over the counter
medications, to school? .10 .03 -.04
Bringing alcohol to school? -.03 .05 -.02 Belonging to a gang? -.08 .07 -.20* Fighting at school? .04 -.03 -.09 Does your school have zero tolerance for some other reason not
mentioned above? .14* -.02 .13*
* p. < .05. Source: Virginia Dept. of Criminal Justice Services, 2005 Teachers in schools with proportionately larger numbers of low income students reported more zero tolerance policies than teachers from other schools. Time out of class items
Correlations
School Size
% Free/ Reduced
Meals
% Nonwhite
How many minutes do students have for lunch on a normal day? .10 -.10 .01 How many minutes do students have when changing classes or going from
one class to the next? .38* -.22* -.04
How many times do students change classes on a normal day? -.30* .04 -.22* * p. < .05. In general, teachers in larger schools report that students have more time between classes, but fewer class changes throughout the day. Schools with more low-income students permit less time to change classes, and schools with more minority students tend to have fewer class changes during a normal day.

VHSSS: Ninth Grade Survey Results 90
If a student cut a class, how likely would the student be caught?
70
4435
0
10
20
30
40
50
60
70
80
Small Medium Large
School size
Perc
entil
e ra
nkDaily structure scale
Correlations
How likely are the following? School Size
% Free/ Reduced
Meals
% Nonwhite
Total score for Daily Structure
-.28* .01 -.28*
If a student was wandering in the hallways during class time, how likely would an adult stop the student?
-.10 .15* .03
If a student cut a class, how likely would the student be caught? -.39* -.02 -.47* If a student smoked a cigarette at school, how likely would the
student be caught? -.19* -.02 -.19*
If two students got into a fight at school, how likely would they get caught?
-.14* .06 -.05
If a student was five minutes late for class, how likely would teachers overlook it?
.15* .14* .30*
If a student said something sarcastic to a teacher, how likely would the teacher overlook what the student said?
.18* -.08 .14*
* p. < .05. Source: Cornell, 2006 In larger schools and schools with more minority students, teachers perceive less daily structure. Correlations with individual items show that teachers report that students in these schools are less likely to be caught cutting a class and smoking. Similarly, these teachers were more likely to report that tardiness and sarcasm directed at a teacher would be overlooked.
Teachers in larger schools were less likely than teachers in smaller schools to report that students would be caught for cutting class. Large schools (> 1,500 students) rank at about the 35th percentile compared to small schools (< 700 students) that rank at the 70th percentile.

VHSSS: Ninth Grade Survey Results 91
When I refer a student to the office for a discipline problem, I feel confident that it will be
handled appropriately.
67
44 43
0
10
20
30
40
50
60
70
80
Small Medium Large
School size
Perc
entil
e ra
nkPerception of administration and discipline index
Correlations
School Size
% Free/ Reduced
Meals
% Nonwhite
Total index score for perception of administration and discipline
-.15* -.04 -.29*
I trust that my administration will handle discipline fairly. -.14* -.01 -.26* When I refer a student to the office for a discipline problem, I feel confident that it will be handled appropriately. -.22* .01 -.29*
Disciplinary consequences for students at this school tend to be too harsh. -.12 .10 -.04
* p. < .05. Source: Austin & Duerr, 2005 In general, teachers in larger schools and teachers in schools with more minority students had a more negative perception of how administrators handled discipline.
Teachers in small schools were more likely than those in larger schools to report that when referring a student for a discipline problem they feel confident that the problem will be handled appropriately. Small schools rank at about the 67th percentile compared to larger schools with 700 or more students that rank at about the 43rd percentile.
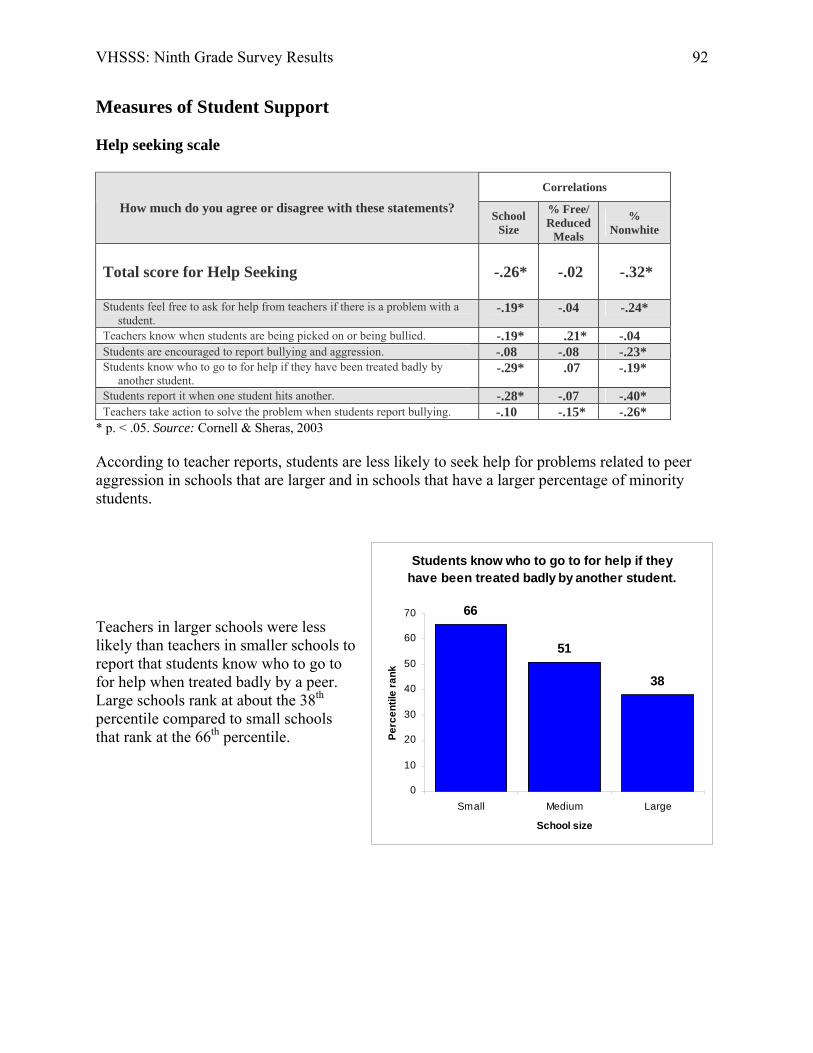
VHSSS: Ninth Grade Survey Results 92
Students know who to go to for help if they have been treated badly by another student.
66
51
38
0
10
20
30
40
50
60
70
Small Medium Large
School size
Perc
entil
e ra
nk
Measures of Student Support Help seeking scale
Correlations
How much do you agree or disagree with these statements? School Size
% Free/ Reduced
Meals
% Nonwhite
Total score for Help Seeking
-.26* -.02 -.32*
Students feel free to ask for help from teachers if there is a problem with a student.
-.19* -.04 -.24*
Teachers know when students are being picked on or being bullied. -.19* .21* -.04 Students are encouraged to report bullying and aggression. -.08 -.08 -.23* Students know who to go to for help if they have been treated badly by another student.
-.29* .07 -.19*
Students report it when one student hits another. -.28* -.07 -.40* Teachers take action to solve the problem when students report bullying. -.10 -.15* -.26*
* p. < .05. Source: Cornell & Sheras, 2003 According to teacher reports, students are less likely to seek help for problems related to peer aggression in schools that are larger and in schools that have a larger percentage of minority students. Teachers in larger schools were less likely than teachers in smaller schools to report that students know who to go to for help when treated badly by a peer. Large schools rank at about the 38th percentile compared to small schools that rank at the 66th percentile.

VHSSS: Ninth Grade Survey Results 93
How much do you agree that administrators in this school treat all teachers fairly?
69
4939
0
10
20
30
40
50
60
70
80
Small Medium Large
School size
Perc
entil
e ra
nk
Learning/Working environment scale
Correlations
How much do you agree that administrators in this school… School Size
% Free/ Reduced
Meals
% Nonwhite
Total score of Learning/Working Environment
-.23* -.01 -.29*
Really care about all teachers. -.26* .02 -.29* Acknowledge and pay attention to teachers. -.25* .01 -.31* Want all teachers to do their best. -.11 -.06 -.22* Listen to what teachers have to say. -.22* .03 -.25* Believe that every teacher can be a success. -.20* -.01 -.24* Treat all teachers fairly. -.25* .02 -.28* Support and treat each other with respect. -.18* -.06 -.28* Feel a responsibility to improve the school. -.19* -.02 -.22*
* p. < .05. Source: Austin & Duerr, 2005 In general, teachers in larger schools and in schools with a higher percentage of minority students tend to have a more negative perception of their working environment. Teachers in large schools were less likely to agree that administrators in their school treat all teachers fairly as compared to teachers in smaller schools. There is a 30 point difference in percentile rank between large schools (39th percentile) and small schools (69th percentile).

VHSSS: Ninth Grade Survey Results 94
Health and prevention items
Correlations
How much do you agree that this school… School Size
% Free/ Reduced
Meals
% Nonwhite
Total score of Health and Prevention Items
.09 -.17* -.19*
Collaborates well with community organizations to help address substance abuse or other problems among youth.
.06 -.13* -.17*
Provides effective confidential support and referral services for students needing help because of substance abuse, violence, or other problems.
.10 .19* -.19*
* p. < .05. School size was not related to the teachers’ perceptions of health and prevention programming. However, teachers in schools with low-income students and schools with more minority students were less likely to have positive perceptions of how the school collaborates with community organizations and whether the school provides effective support and referral services.

VHSSS: Ninth Grade Survey Results 95
To what extent does your school provide conflict resolution or behavior management
instruction?
35
48
66
0
10
20
30
40
50
60
70
Small Medium Large
School size
Perc
entil
e ra
nkHealth and prevention programs scale
Correlations
To what extent does this school... School Size
% Free/ Reduced
Meals
% Nonwhite
Total score of Health and Prevention Programs
.12* -.18* -.14*
Foster youth social and emotional development or resilience? .04 -.17* -.17* Provide nutritional instruction? .03 .00 -.07 Provide opportunities for physical education and activity? .07 -.17* -.08 Provide alcohol or drug use prevention instruction? .12* -.19* -.11 Provide tobacco use prevention instruction? .10 -.14* -.12* Provide conflict resolution or behavior management instruction? .31* -.10 .18* Provide character education? .01 -.08 -.15* Provide harassment or bullying prevention? -.03 -.10 -.20* Provide services for students with disabilities or other special needs? .21* -.33* -.23*
* p. < .05. Source: Austin & Duerr, 2005 Overall, teachers in larger schools had more positive impressions about the health and prevention programs implemented in their schools. In contrast, teachers in schools with higher percentages of low income students and higher percentages of minority students had less positive perceptions of the health and prevention programs in their schools.
According to teacher reports, larger schools tended to provide more conflict resolution or behavior management instruction than smaller schools. Large schools rank at about the 66th percentile compared to the 35th percentile for small schools.
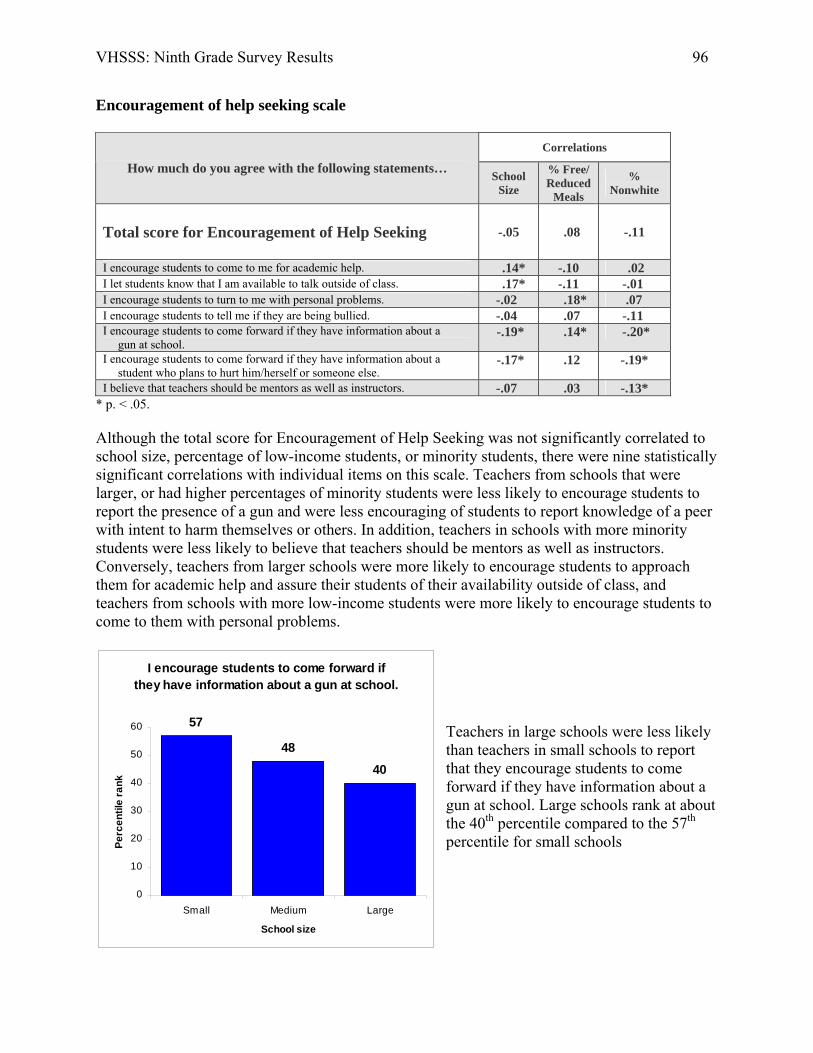
VHSSS: Ninth Grade Survey Results 96
I encourage students to come forward if they have information about a gun at school.
57
4840
0
10
20
30
40
50
60
Small Medium Large
School size
Perc
entil
e ra
nkEncouragement of help seeking scale
Correlations
How much do you agree with the following statements… School Size
% Free/ Reduced
Meals
% Nonwhite
Total score for Encouragement of Help Seeking
-.05 .08 -.11
I encourage students to come to me for academic help. .14* -.10 .02 I let students know that I am available to talk outside of class. .17* -.11 -.01 I encourage students to turn to me with personal problems. -.02 .18* .07 I encourage students to tell me if they are being bullied. -.04 .07 -.11 I encourage students to come forward if they have information about a gun at school.
-.19* .14* -.20*
I encourage students to come forward if they have information about a student who plans to hurt him/herself or someone else.
-.17* .12 -.19*
I believe that teachers should be mentors as well as instructors. -.07 .03 -.13* * p. < .05. Although the total score for Encouragement of Help Seeking was not significantly correlated to school size, percentage of low-income students, or minority students, there were nine statistically significant correlations with individual items on this scale. Teachers from schools that were larger, or had higher percentages of minority students were less likely to encourage students to report the presence of a gun and were less encouraging of students to report knowledge of a peer with intent to harm themselves or others. In addition, teachers in schools with more minority students were less likely to believe that teachers should be mentors as well as instructors. Conversely, teachers from larger schools were more likely to encourage students to approach them for academic help and assure their students of their availability outside of class, and teachers from schools with more low-income students were more likely to encourage students to come to them with personal problems.
Teachers in large schools were less likely than teachers in small schools to report that they encourage students to come forward if they have information about a gun at school. Large schools rank at about the 40th percentile compared to the 57th percentile for small schools

VHSSS: Ninth Grade Survey Results 97
Teachers press students to do thoughtful work.
48 46
59
0
10
20
30
40
50
60
70
Small Medium Large
School size
Perc
entil
e ra
nk
Measures of Student Engagement Academic press scale
Correlations
How true is this in your school? School Size
% Free/ Reduced
Meals
% Nonwhite
Total score for Academic Press
.08 -.08 -.04
When students figure out how to do a problem, teachers give them more challenging problems to think about. .14* -.12 -.04 Teachers press students to do thoughtful work. .14* -.16* -.08 When students are working out a problem, teachers tell them to keep thinking until they really understand. -.01 -.00 -.01 Teachers don't let students just do easy work, but make them think. .08 -.09 -.04 Teachers make sure that the work students do really makes them think. .14* -.07 .06 Teachers accept nothing less than students' full effort. -.05 .03 -.08
* p. < .05. Source: Midgley et al., 2000 There were no statistically significant correlations between the overall score for Academic Press and the three school demographics. However, teachers from larger schools were more likely to report that they gave more challenging problems, pressed students to do thoughtful work, and made sure the work really makes students think. Teachers in schools with more low income students reported being less likely to press students to do thoughtful work. Teachers in large schools were more likely than teachers in small and medium schools to report that teachers in their schools press students to do thoughtful work. Large schools rank at about the 59th percentile compared to small schools that rank at the 48th percentile and medium schools that rank at the 46th percentile.
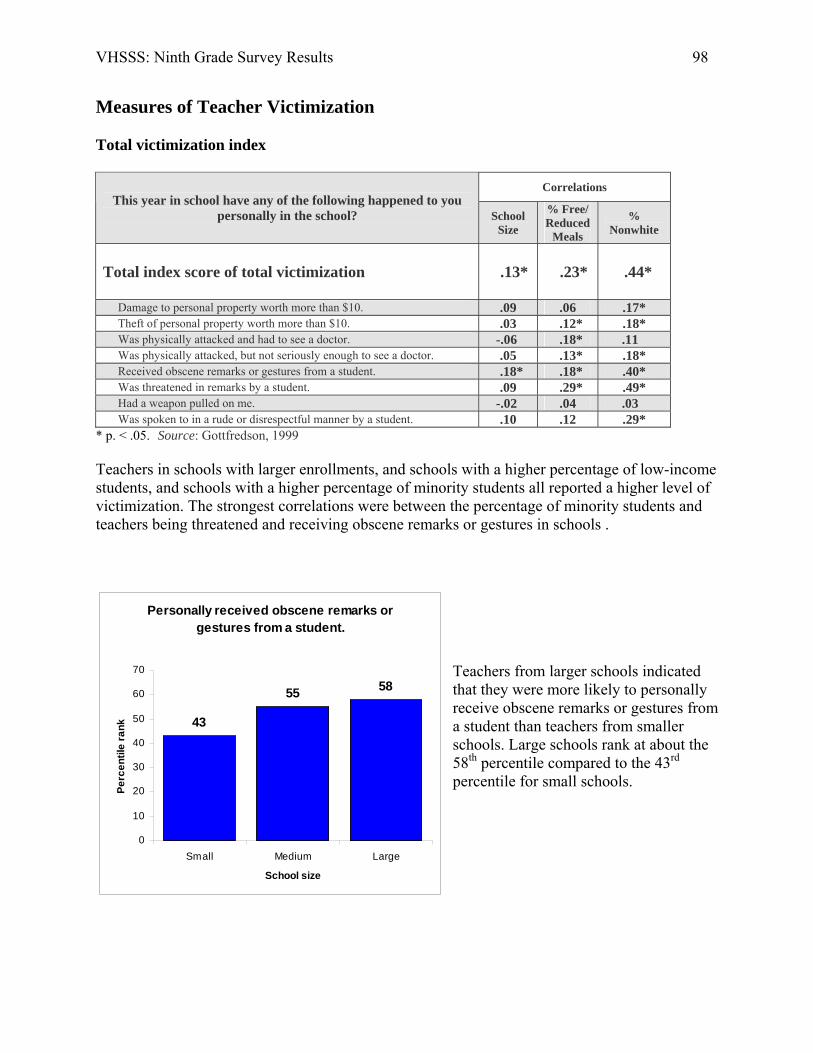
VHSSS: Ninth Grade Survey Results 98
Personally received obscene remarks or gestures from a student.
43
55 58
0
10
20
30
40
50
60
70
Small Medium Large
School size
Perc
entil
e ra
nkMeasures of Teacher Victimization Total victimization index
Correlations This year in school have any of the following happened to you
personally in the school? School Size
% Free/ Reduced
Meals
% Nonwhite
Total index score of total victimization
.13* .23* .44*
Damage to personal property worth more than $10. .09 .06 .17* Theft of personal property worth more than $10. .03 .12* .18* Was physically attacked and had to see a doctor. -.06 .18* .11 Was physically attacked, but not seriously enough to see a doctor. .05 .13* .18* Received obscene remarks or gestures from a student. .18* .18* .40* Was threatened in remarks by a student. .09 .29* .49* Had a weapon pulled on me. -.02 .04 .03 Was spoken to in a rude or disrespectful manner by a student. .10 .12 .29*
* p. < .05. Source: Gottfredson, 1999 Teachers in schools with larger enrollments, and schools with a higher percentage of low-income students, and schools with a higher percentage of minority students all reported a higher level of victimization. The strongest correlations were between the percentage of minority students and teachers being threatened and receiving obscene remarks or gestures in schools .
Teachers from larger schools indicated that they were more likely to personally receive obscene remarks or gestures from a student than teachers from smaller schools. Large schools rank at about the 58th percentile compared to the 43rd percentile for small schools.

VHSSS: Ninth Grade Survey Results 99
More severe victimization index
Correlations This year in school have any of the following happened to you
personally in the school? School Size
% Free/ Reduced
Meals
% Nonwhite
Total index score for more severe victimization
.00 .17* .16*
Was physically attacked and had to see a doctor. -.06 .18* .11 Was physically attacked, but not seriously enough to see a doctor. .05 .13* .18* Had a weapon pulled on me. -.02 .04 .03
* p. < .05. Source: Gottfredson, 1999 Teachers in schools with a higher percentage of low-income students and schools with a higher percentage of minority students reported higher rates of more serious victimization such as physical assaults. Minor victimization index
Correlations This year in school have any of the following happened to you
personally in the school? School Size
% Free/ Reduced
Meals
% Nonwhite
Total index score of minor victimization
.14* .22* .44*
Damage to personal property worth more than $10. .09 .06 .17* Theft of personal property worth more than $10. .03 .12* .18* Received obscene remarks or gestures from a student. .18* .18* .40* Was threatened in remarks by a student. .09 .29* .49* Was spoken to in a rude or disrespectful manner by a student. .10 .12 .29*
* p. < .05. Source: Gottfredson, 1999 Overall, teachers in larger schools and schools with a higher percentage of low-income and schools with higher percentages of minority students reported higher rates of minor victimization. The strongest correlations were associated with the percentage of minority students in the school.

VHSSS: Ninth Grade Survey Results 100
Students here often get put down because of their race or ethnicity.
36
56 56
0
10
20
30
40
50
60
Small Medium Large
School size
Perc
entil
e ra
nkBullying climate scale
Correlations
Experiences of Bullying School Size
% Free/ Reduced
Meals
% Nonwhite
Total score of Bullying Climate
.15* .10 .28*
New students are made to feel welcome here by other students. -.14* -.01 -.20* Students from different neighborhoods get along well together here. -.25* -.19* -.50* Students at this school accept other students for who they are. -.09 -.11 -.24* Bullying is a problem at this school. .06 .10 .15* Students here often get teased about their clothing or physical appearance. .05 .12 .18* Students here often get put down because of their race or ethnicity. .20* -.13* .09 There is a lot of teasing about sexual topics at this school. .01 .12* .12*
* p. < .05. Source: Cornell & Sheras, 2003 Overall, teachers in larger schools and schools with a higher percentage of minority students perceived higher rates of bullying and teasing in their schools. The strongest correlations were observed with the percentage of minority students in the school. Notably, teachers are less likely to report that students from different neighborhoods get along well together in schools that are larger, have more low income students, and have more minority students.
According to teachers, there is a higher presence of racial or ethnic teasing among students in medium and large schools than in small schools. Large and medium schools both rank at the 56th percentile whereas small schools rank at the 36th percentile.

VHSSS: Ninth Grade Survey Results 101
Are there any gangs at your school?
29
39
53
0
10
20
30
40
50
60
Small Medium Large
School size
Perc
entil
e ra
nk
Gang items
Correlations
How true is this in your school? School Size
% Free/ Reduced
Meals
% Nonwhite
Are there any gangs at your school? .58* -.09 .60* Have gangs been involved in the sale of drugs at your school in the last 6 months? .48* .04 .50* During the last 6 months, how often have gangs been involved in fights, attacks, or other violence at your school? .43* .14* .61*
* p. < .05. Source: School Crime Supplement to the National Crime Victimization Survey (NCES, 2005) In general, teachers in schools that are larger or have a higher percentage of minority students were more likely to report gangs at their schools. Furthermore, teachers from these schools were more likely to report that gangs at their schools were involved with drugs and violence in their schools in the past 6 months. There were seven statistically significant correlations with individual items. Teachers in larger schools were more likely to report the presence of gangs at their schools than teachers in smaller schools. Large schools rank at about the 53rd percentile compared to the 29th percentile for small schools.

VHSSS: Ninth Grade Survey Results 102
Chapter 8 Correlates of Student and Teacher Victimization
This chapter presents some of the school characteristics that are correlated with student and teacher victimization. The purpose of these analyses is to suggest ways in which the school climate can affect school safety and vice versa. Because the analyses are correlational and cross-sectional, they do not establish causal relationships, but do indicate important areas for further study. These results are samples from the many analyses that could be undertaken. Effects of victimization on academic performance These analyses show how school victimization rates appear to affect academic performance. For example, the first set of analyses shows that schools with high victimization rates have lower SOL passing rates. These correlational analyses do not prove that higher victimization will cause lower passing rates, but they suggest that victimization may be an important consideration in improving a school’s SOL passing rate. The analyses presented in this section include three measures of academic performance:
1. SOL passing rates
2. Commitment to school
3. Academic press Effects of school characteristics on victimization This series of analyses identify school characteristic that are likely to affect victimization rates. For example, it is hypothesized that the presence of gangs would be associated with higher student and teacher victimization. Again, these correlations do not establish a causal relationship, but indicate areas that merit further investigation with longitudinal data and controls for potentially confounding and mediating variables. These analyses will be pursued in future reports. The school characteristics examined in the final sections of this chapter include:
1. Presence of gangs 2. Dress code 3. Student support efforts (Student Learning/Working Environment) 4. Teacher support efforts (Teacher Learning/Working Environment)
5. Daily structure
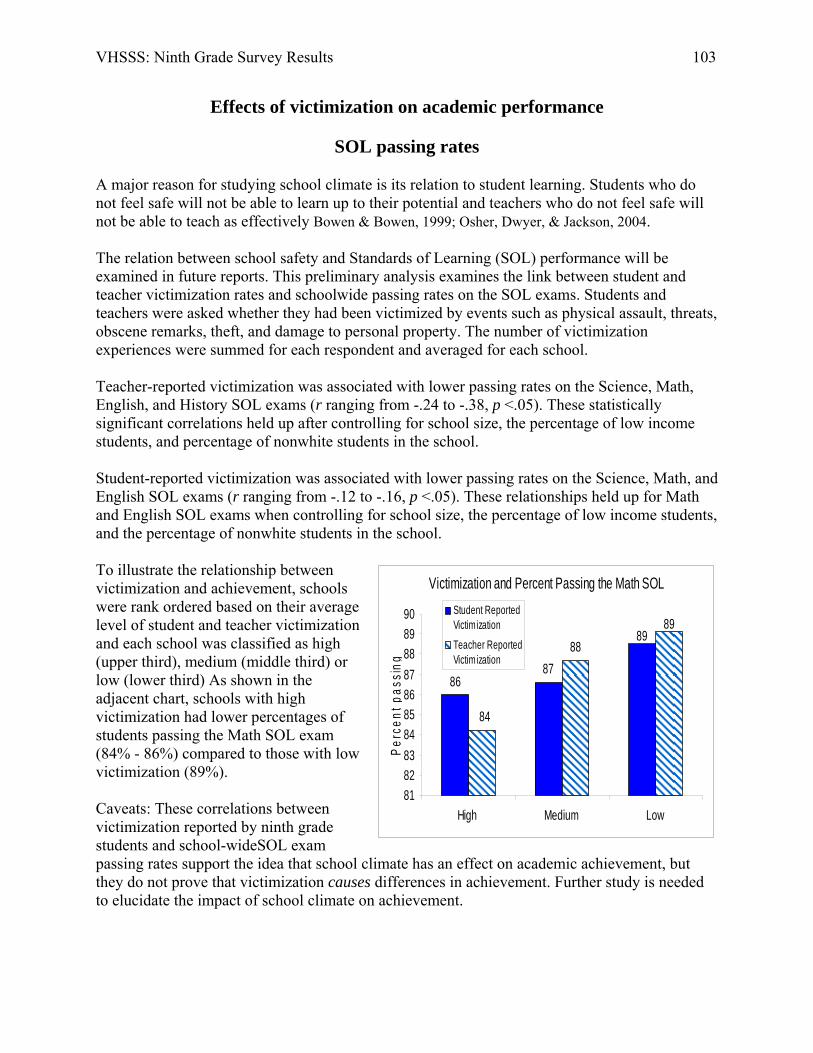
VHSSS: Ninth Grade Survey Results 103
Victimization and Percent Passing the Math SOL
8788
86
89
84
89
81828384858687888990
High Medium Low
Perc
ent p
assi
ng
Student ReportedVictimizationTeacher ReportedVictimization
Effects of victimization on academic performance
SOL passing rates A major reason for studying school climate is its relation to student learning. Students who do not feel safe will not be able to learn up to their potential and teachers who do not feel safe will not be able to teach as effectively Bowen & Bowen, 1999; Osher, Dwyer, & Jackson, 2004. The relation between school safety and Standards of Learning (SOL) performance will be examined in future reports. This preliminary analysis examines the link between student and teacher victimization rates and schoolwide passing rates on the SOL exams. Students and teachers were asked whether they had been victimized by events such as physical assault, threats, obscene remarks, theft, and damage to personal property. The number of victimization experiences were summed for each respondent and averaged for each school. Teacher-reported victimization was associated with lower passing rates on the Science, Math, English, and History SOL exams (r ranging from -.24 to -.38, p <.05). These statistically significant correlations held up after controlling for school size, the percentage of low income students, and percentage of nonwhite students in the school. Student-reported victimization was associated with lower passing rates on the Science, Math, and English SOL exams (r ranging from -.12 to -.16, p <.05). These relationships held up for Math and English SOL exams when controlling for school size, the percentage of low income students, and the percentage of nonwhite students in the school. To illustrate the relationship between victimization and achievement, schools were rank ordered based on their average level of student and teacher victimization and each school was classified as high (upper third), medium (middle third) or low (lower third) As shown in the adjacent chart, schools with high victimization had lower percentages of students passing the Math SOL exam (84% - 86%) compared to those with low victimization (89%). Caveats: These correlations between victimization reported by ninth grade students and school-wideSOL exam passing rates support the idea that school climate has an effect on academic achievement, but they do not prove that victimization causes differences in achievement. Further study is needed to elucidate the impact of school climate on achievement.

VHSSS: Ninth Grade Survey Results 104
Victimization, Academic Press, and Commitment to School
43
49
56
35
45
60
0.00
10.00
20.00
30.00
40.00
50.00
60.00
70.00
High Medium Low
Victimization
Scho
ol P
erce
ntile
Academic Press
Commitment to School
Academic Press and Commitment to School This preliminary analysis examines the link between school safety and two measures of an academically-oriented school climate: academic press and commitment to school. The academic press scale measures student perceptions of whether teachers push them to really think, provide them with challenging problems, make sure they don’t just do easy work, and accept nothing less than students’ full effort. The commitment to school scale measures how much students agree that they work hard in school, like school, do extra homework, and try hard. We found that student-reported victimization was associated with lower academic press (r = -.21, p < .001) and lower commitment to school (r = -.24, p < .001). To illustrate the relationship between victimization, academic press, and commitment to school, schools were rank ordered based on their average level of student and teacher victimization and each school was classified as high (upper third), medium (middle third) or low (lower third). As shown in the adjacent chart, schools with high victimization ranked lower in academic press and commitment to school (35th – 43rd percentile) compared to those with low victimization (56th – 60th percentile). Caveats: These correlations between victimization, academic press, and commitment to school support the idea that school safety has an effect on the academic climate of schools, but they do not prove that victimization causes differences in academic climate.

VHSSS: Ninth Grade Survey Results 105
Victimization and Adult Support in School
62
44
67
49
0
10
20
30
40
50
60
70
80
Low Support High Support
Per
cent
ile
Student Reported VictimizationTeacher Reported Victimization
Effects of school characteristics on victimization
Learning/Working Environment Students were asked whether they believed adults in their school cared about students, were interested in listening to them, and communicated the idea that every student can be a success. Overall, this scale measured perceptions of adult support in their learning environment. Student perceptions of support were used to classify schools. There were 152 schools classified as having “high” adult support because the average student response was above the mean of 3.4 on a scale which ranged from strongly disagree (1) to strongly agree (5). One hundred and thirty-eight schools were classified as having “low” adult support because their average student response was 3.3 or lower. Student perceptions of adult support were correlated with both teachers reports of being victimized (r = -.31, p < .001) and student reports of being victimized (r = -.39, p < .001). As shown in the adjacent chart, schools with high support tended to rank lower in victimization (44th – 49th percentile) than schools with low support, which ranked high in victimization (62nd – 67th percentile). These findings are consistent with the theory that a supportive school staff will create a safer school environment for students. Caveats: These results do not prove that adult support causes differences in victimization. It is certainly possible that there are complex relationships between support and victimization. For example, students who are highly victimized may develop more negative perceptions of staff support, and high rates of victimization may erode staff support for students. Even if the relationship between support and victimization is bidirectional and interactive, there is reason to believe that an emphasis on creating a supportive environment will have a positive impact on school safety and lead to lower levels of victimization.
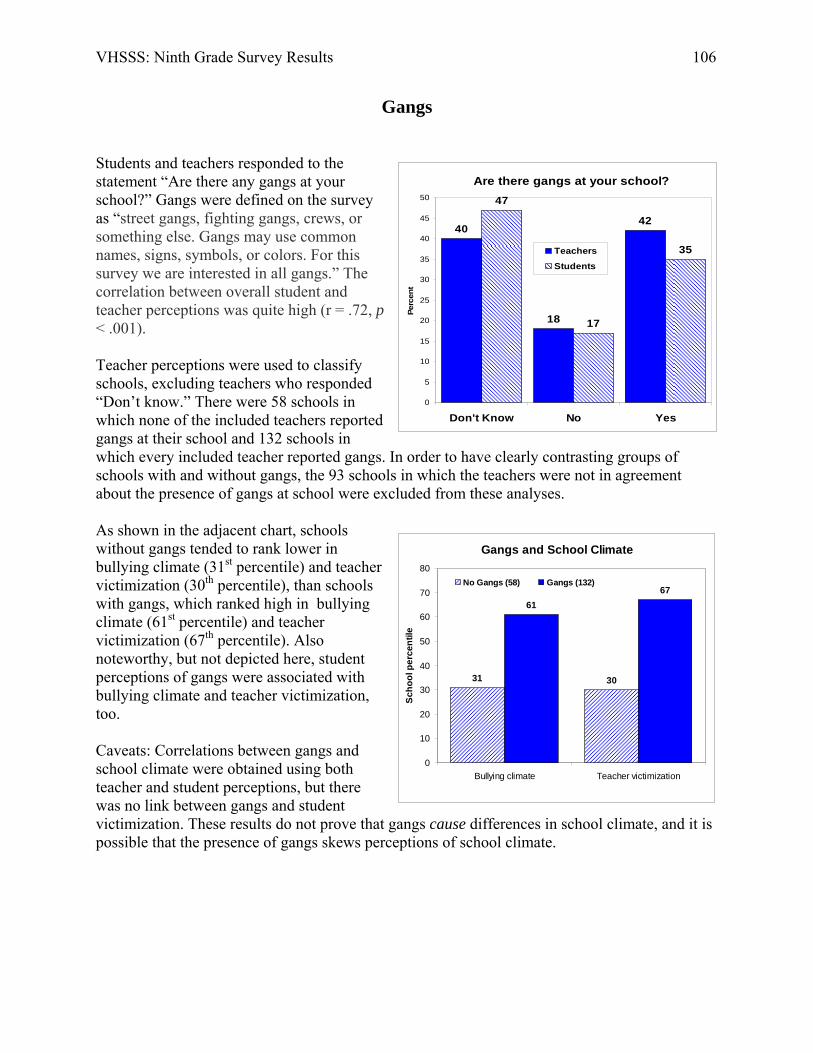
VHSSS: Ninth Grade Survey Results 106
Gangs and School Climate
31 30
6167
0
10
20
30
40
50
60
70
80
Bullying climate Teacher victimization
Scho
ol p
erce
ntile
No Gangs (58) Gangs (132)
Are there gangs at your school?
40
18
42
47
17
35
0
5
10
15
20
25
30
35
40
45
50
Don't Know No YesPe
rcen
t
Teachers
Students
Gangs
Students and teachers responded to the statement “Are there any gangs at your school?” Gangs were defined on the survey as “street gangs, fighting gangs, crews, or something else. Gangs may use common names, signs, symbols, or colors. For this survey we are interested in all gangs.” The correlation between overall student and teacher perceptions was quite high (r = .72, p < .001). Teacher perceptions were used to classify schools, excluding teachers who responded “Don’t know.” There were 58 schools in which none of the included teachers reported gangs at their school and 132 schools in which every included teacher reported gangs. In order to have clearly contrasting groups of schools with and without gangs, the 93 schools in which the teachers were not in agreement about the presence of gangs at school were excluded from these analyses. As shown in the adjacent chart, schools without gangs tended to rank lower in bullying climate (31st percentile) and teacher victimization (30th percentile), than schools with gangs, which ranked high in bullying climate (61st percentile) and teacher victimization (67th percentile). Also noteworthy, but not depicted here, student perceptions of gangs were associated with bullying climate and teacher victimization, too. Caveats: Correlations between gangs and school climate were obtained using both teacher and student perceptions, but there was no link between gangs and student victimization. These results do not prove that gangs cause differences in school climate, and it is possible that the presence of gangs skews perceptions of school climate.

VHSSS: Ninth Grade Survey Results 107
We have a strict dress code at this school.
15
41
37
7
11
3735
16
0
5
10
15
20
25
30
35
40
45
Strongly disagree Disagree Agree Strongly agree
Perc
ent
TeachersStudents
Dress Code and School Climate
61
48
40
67
52
41
0
10
20
30
40
50
60
70
80
Lax (75) Medium (187) Strict (24)
Teacher perceptions of dress code
Scho
ol p
erce
ntile
Bullying climate
Teacher victimization
Dress Codes
Students and teachers responded to the statement “We have a strict dress code at this school” by checking “Strongly disagree” (1 point), “Disagree” (2 points), “Agree” (3 points), or “Strongly Agree” (4 points). About half of students and teachers perceive their school’s dress code as strict. Students tended to perceive the dress code as somewhat stricter than did teachers, but the correlation between teachers and students was substantial (r = .55, p < .001). Teacher perceptions were used to classify schools. There were 75 schools classified has having a lax dress code because the average teacher response was 2.0 or lower, while 24 schools were classified as having a strict dress code because their average teacher response was 3.0 or higher. The majority of schools (187) fell in the middle. A stricter dress codes was correlated with teacher reports of less bullying and teasing (r = -.20, p < .001) and lower rates of teacher victimization (r = - .24, p < .001). As shown in the adjacent chart, schools with a lax dress code tend to rank higher in bullying climate (61st percentile) and teacher victimization (67th percentile), while schools with a strict code ranked lower in bullying climate (40th percentile) and teacher victimization (41st percentile). Relationships were found for teacher perceptions, but not student perceptions Caveats:. These results do not prove that dress codes cause differences in school climate; it is likely that dress codes are associated with a variety of other school policies and practices. Furthermore, it is possible that teacher perceptions of school climate affected their perception of the dress code. Finally, these results are based on teacher perceptions of the dress code and not actual dress restrictions.

VHSSS: Ninth Grade Survey Results 108
Schools with high student support have relatively low student victimization.
63
51
38
0
10
20
30
40
50
60
70
Low Medium High
Student support efforts
Perc
entil
e in
Stu
dent
Vic
timiz
atio
n
Schools with high student support have relatively low teacher victimization.
6661
37
0
10
20
30
40
50
60
70
Low Medium High
Student support efforts
Perc
entil
e in
Tea
cher
Vic
timiz
atio
n
Student Support Efforts One measure of student support efforts is the Learning/Working Environment scale, which asks students how much the adults at school care about them, listen to them, and treat them fairly. Overall, students perceived the adults at their school as supportive. Students were asked, “How much do you agree that adults in this school…”
Disagree/ Strongly Disagree
Somewhat Agree
Agree/ Strongly
Agree Really care about all students. 17 37 46 Acknowledge and pay attention to students. 14 38 48 Want all students to do their best. 8 22 70 Listen to what students have to say. 21 38 41 Believe that every student can be a success. 18 29 53 Treat all students fairly. 37 30 33 Support and treat students with respect. 19 34 47 Feel a responsibility to improve the school. 18 33 49
Schools with especially supportive environments had lower levels of both student victimization (r = -.38) and teacher victimization (r = -.31). To illustrate the relationship between student support and victimization, schools were divided into thirds and classified as low, medium, or high in student support. The first chart shows that the average school with high student support has student victimization levels at the 38th percentile, whereas the average school with low student support has student victimization levels at the 63rd percentile. The second chart shows similar findings for teacher victimization. The average school with high student support has teacher victimization levels at the 37th percentile, whereas the average school with low student support has teacher victimization levels at the 66th percentile.
Caveats: These correlations are consistent with the view that student support efforts have a positive influence on school safety, but they do not prove that student support causes lower victimization.

VHSSS: Ninth Grade Survey Results 109
Schools with high teacher support have relatively low teacher victimization.
73
57
30
0
10
20
30
40
50
60
70
80
Low Medium High
Teacher support efforts
Perc
entil
e in
Tea
cher
Vic
timiz
atio
n
Schools with high teacher support have relatively low student victimization.
62
5044
0
10
20
30
40
50
60
70
Low Medium High
Teacher support efforts
Perc
entil
e in
Stu
dent
Vic
timiz
atio
nTeacher Support Efforts
Whereas students were asked how adults supported them at school, the teachers were asked a similar set of questions about administrator support of their work. Results from the Teacher Learning/Working Environment scale (table below) show that most teachers regard their administrators as supportive and fair.
Teachers were asked, “How much do you agree that administrators in this school…”
Disagree/ Strongly Disagree
Somewhat Agree
Agree/ Strongly Agree
Really care about all teachers. 11 20 69 Acknowledge and pay attention to teachers. 12 23 65 Want all teachers to do their best. 3 10 87 Listen to what teachers have to say. 14 25 61 Believe that every teacher can be a success. 7 23 70 Treat all teachers fairly. 20 24 56 Support and treat each other with respect. 8 19 73 Feel a responsibility to improve the school. 4 15 81
Schools with especially supportive administrators had lower levels of both student victimization (r = -.18) and teacher victimization (r = -.53). To illustrate the relationship between administrative support of teachers and victimization, schools were divided into thirds and classified as low, medium, or high in teacher support. The first chart shows that the average school with high teacher support has student victimization levels at the 44th percentile, whereas the average school with low student support has student victimization levels at the 62rd percentile. The second chart shows even stronger findings for teacher victimization. The average school with high teacher support has teacher victimization levels at the 30th percentile, whereas the average school with low teacher support has teacher victimization levels at the 73rd percentile.
Caveats: These correlations are consistent with the view that teacher support by administrators has a positive influence on school safety, but they do not prove that teacher support causes lower victimization.

VHSSS: Ninth Grade Survey Results 110
Schools with high daily structure have relatively low student victimization.
5952
40
0
10
20
30
40
50
60
70
Low Medium High
Daily Structure
Perc
entil
e in
Stu
dent
Vic
timiz
atio
n
Schools with high daily structure have relatively low teacher victimization.
6457
47
0
10
20
30
40
50
60
70
Low Medium High
Daily Structure
Perc
entil
e in
Tea
cher
Vic
timiz
atio
n
Daily Structure
To measure the degree of structure in the daily routine at school, students were asked how likely students would be caught for various misbehaviors. As reflected in the table below, most students feel that school rules are enforced, but there is a wide range of opinion.
Students were asked, “How likely are the following?” Not at all
Likely/ Not Likely
Likely/ Very
Likely If a student was wandering in the hallways during class time, how likely would an adult stop the student? 48 52
If a student cut a class, how likely would the student be caught? 41 59 If a student smoked a cigarette at school, how likely would the student be caught? 37 63
If two students got into a fight at school, how likely would they get caught? 8 92 If a student was five minutes late for class, how likely would teachers overlook it? (reverse scored) 56 44
If a student said something sarcastic to a teacher, how likely would the teacher overlook what the student said? (reverse scored) 43 57
Schools with higher daily structure (more likely enforcement of rules) have lower levels of both student victimization (r = -.24) and teacher victimization (-.22). To illustrate the relationship between daily structure and victimization, schools were divided into thirds and classified as low, medium, or high in daily structure. The first chart shows that the average school with high daily structure has student victimization levels at the 40th percentile, whereas the average school with low daily structure has student victimization levels at the 59th percentile. The second chart shows similar results for teacher victimization. The average school with high daily structure has teacher victimization levels at the 47th percentile, whereas the average school with low daily structure has teacher victimization levels at the 64th percentile.
Caveats: These correlations are consistent with the view that Daily Structure has a positive influence on school safety, but they do not prove that it causes lower victimization. In addition, the measure of Daily Structure completed by teachers shows somewhat different results. Teacher-perceive daily structure is correlated with teacher victimization (r = -.55) but not student victimization (-.08).

VHSSS: Ninth Grade Survey Results 111
If another student talked about killing someone, I would tell one of the teachers
or staff at school.
28
72
20
80
0
10
20
30
40
50
60
70
80
90
Disagree Agree
Strongly Disagree/Disagree versus Strongly Agree/Agree
Perc
ent o
f Stu
dent
s
Pre-shooting
Post shooting
If another student brought a gun to school, I would tell one of the teachers or staff at
school.
22
78
15
85
0
10
20
30
40
50
60
70
80
90
Disagree Agree
Strongly Disagree/Disagree versus Strongly Agree/Agree
Perc
ent o
f Stu
dent
s
Pre-shooting
Post shooting
Chapter 9 Participant Reactions to the Survey
Reactions to the Virginia Tech Shooting
The survey period began on April 1, about two weeks before the Virginia Tech shooting on April 16. A natural question is whether this event affected survey responses. Consequently, student and teacher surveys completed before April 16 were compared to those completed after April 16 (excluding April 16).
Overall, these analyses showed several small, statistically significant, changes, but no
large changes in survey results. As indicated in the table (next page), student perceptions of the school rules and daily structure declined slightly, indicating less perceived structure at school, and their perception of the school as a positive learning environment increased slightly. Curiously, their involvement in extracurricular activities was slightly lower. The most notable change, however, was that after the shooting, students expressed greater willingness to seek help from teachers if a student brought a gun to school or threatened to kill someone (see charts below). Students also reported greater willingness to seek help for bullying and perceived other students as more willing to try to stop bullying when they saw it happening.
It is perhaps equally noteworthy that many perceptions did not change. There was no
change in student reports of victimization or bullying at school, and no differences in their belief in school rules, their trust in teachers, and their perception of how much their teachers attempted to challenge them academically. They did not report higher levels of security measures or greater awareness of zero tolerance policies.

VHSSS: Ninth Grade Survey Results 112
Student perceptions before and after the Virginia Tech shooting
Pre-Shooting N ≈ 900
Post-Shooting N ≈ 6000 Student survey scale or item
X (SD) X (SD)
t value p Effect
size
Experience of school rules 19.4 (3.19) 19.1 (3.37) 2.03 .04 .09 Security measures 4.9 (1.53) 4.8 (1.52) 1.47 .14 -- Awareness of zero tolerance policies 6.7 (2.64) 6.6 (2.57) .93 .36 -- Daily structure 16.6 (2.61) 16.4 (2.59) 2.00 .05 .08 Learning/working environment 26.8 (7.01) 27.4 (6.75) 2.44 .02 .09 Commitment to school 26.0 (4.74) 26.3 (4.60) 1.62 .10 -- School involvement 1.6 (1.44) 1.5 (1.39) 2.42 .02 .07 Belief in school rules 49.1 (9.42) 49.1 (9.01) .03 .97 -- Teacher trust 14.0 (2.90) 14.0 (2.89) .58 .56 -- Academic press 20.4 (4.69) 20.5 (4.61) .93 .35 -- Aggressive attitudes 11.6 (3.70) 11.2 (3.59) 2.98 .56 -- Victimization (Total) 1.4 (1.53) 1.3 (1.48) 1.35 .18 -- Bullying victimization 1.4 (2.22) 1.3 (2.11) .78 .44 -- Bullying climate (Teasing and bullying at school) 16.6 (3.52) 16.7 (3.33) .97 .33 -- Help-seeking behavior 6.8 (2.41) 6.7 (2.29) 1.48 .14 -- Help-seeking (Willingness to seek help) 21.8 (4.88) 22.3 (4.61) 3.31 .001 .11 Items on the Help-seeking scale: If another student was bullying me, I would tell one
of the teachers or staff at school. 2.4 (.96) 2.5 (.95) 2.88 .004 .11
There are adults at this school I could turn to if I had a personal problem.
2.9 (.97) 3.0 (.97) 2.93 .017 .10
If I tell a teacher that someone is bullying me, the teacher will do something to help.
3.0 (.87) 3.1 (.86) 1.52 .13 --
Students tell teachers when other students are being bullied.
2.1 (.89) 2.1 (.89) .10 .92 --
If another student talked about killing someone, I would tell one of the teachers or staff at school.
3.0 (1.01) 3.3 (.93) 7.13 <.001 .32
If another student brought a gun to school, I would tell one of the teachers or staff at school.
3.3 (.98) 3.5 (.89) 5.22 <.001 .22
Teachers here make it clear to students that bullying is not tolerated.
2.8 (.95) 2.8 (.92) .11 .91 --
Students here try to stop bullying when they see it happening.
2.2 (.99) 2.1 (.93) 2.35 .02 .11
Note. N varies slightly across analyses due to missing data.

VHSSS: Ninth Grade Survey Results 113
Principal comments A total of 299 principals (including designees) completed a brief online survey after the student and teacher surveys were completed. Principals were invited to write any comments they had about the study. Below are all 87 comments that were received: Positive comments
1. “This was a very good project. The selected students were eager to participate and appeared to have taken the survey seriously.”
2. “The teachers and students liked the ease of the survey and the online format.” 3. “I think it is a great idea to find out what the students are thinking. It will definitely help administrators and staff
to identify potential problems faster so that we may prevent situations from happening.” 4. “I like the way it was set up; it did not disrupt the entire school day by pulling large numbers of students out of
class; on-line survey.” 5. “One advantage of the structure of this survey was the ability of the building administrator to be flexible in
scheduling when the survey process would take place. With the overwhelming number of activities and testing requirements in the high school setting, flexibility of scheduling made this survey very easy to schedule for teachers, students and administrators.”
6. “I thought the project was very well organized, information was presented in a format that was easily understood and extremely functional. You obviously understand the amount of daily objectives that are involved in the school day and created a project that was effective for all involved.”
7. “I found the directions to be very clear. The process worked very well from the letters home and to teachers, to the completion of the survey today.”
8. “Movies were very helpful.” 9. “Teachers took it seriously. After they completed the survey, they sat in a group and talked about it and shared
with me that they hope the results will be used.” 10. “It was an excellent idea. Hopefully, we can utilize the results to improve our safety plan.” 11. “Students took the survey very seriously. Please note that the survey was done the Wednesday following the
VA Tech incident. Data comparisons between before and after the incident are strongly suggested.” 12. “Students and teachers completed the survey per regulations. All observed completing the survey did so in a
serious manner. Several students included extensive comments.” 13. “Survey went over well.” 14. “A relatively smooth operation. We hope the results are helpful.” 15. “The survey was very easy to administer. The students did not have any problems answering the questions. The
website was easy to access.” 16. “After getting over the process of the selection, conducting the survey was very easy.” 17. “Very well organized. I appreciate the updates. Great instructions and templates!” 18. “It was very well organized and easy to complete.” 19. “The students were glad that they had a voice in a study that was done throughout the state of Virginia.” 20. “People seemed very willing to do this. We don't know if they took it more seriously due to the Virginia Tech
situation or not.” 21. “Very involved procedures. Excellent questions.” 22. “Students and teachers were positive about giving their time to complete the survey.” 23. “Excellent project! Longitudinal would be nice - stay with these freshman for the next few years to see if
impressions of school safety change over time - as students mature, schools improve, etc.” 24. “I believe the questions covered a broad spectrum involving the daily processes in a school day. We look
forward to reviewing the results. Furthermore, we hope positive changes will occur as a result.” 25. “It helped students to consider other areas of safety other than building level.” 26. “I thought the instructions were very clear. Administering the survey went very well.” 27. “I am very interested in seeing the results of both the teachers and the students. It will be interesting to see the
survey from two different points of views.” 28. “Well organized survey, no changes necessary.”

VHSSS: Ninth Grade Survey Results 114
Criticisms and suggestions
29. “The timing was lousy. We start SOL testing on April 30. Spring break for us is April 7-15. This survey required students to miss class instruction at the most important time of the year for us as we complete the curriculum and work with students to prepare for the SOL tests. Suggest you do this survey well before a few weeks prior to SOL testing.”
30. “The only problem was enabling students’ access to the site. Technical support corrected the problem by gaining access by the technology proctor, which expedited the process once in place.”
31. “Make sure your web site always works. Teachers do not have a lot of free time to do things like this survey and to have the link not working was very frustrating to them.”
32. “When 5 of our students completed the survey, the thank you page did not come up. A sheet about errors came up and told them to refresh the page. We called our technical assistance dept and they said it was not a technical problem on our end. We believe their survey had been submitted.”
33. “The random selection process created an administrative burden for our one data specialist. The requirement to select at random and to schedule specific students, some who should not have missed class, is problematic to learning. We lost an instructional period for our computer lab instruction.”
34. “1. The DVD was difficult to use - it would be nice if this were actually a DVD. 2. We could not view the video - due to high traffic the video kept stopping and starting. 3. There were problems with internet security (getting the responses to go through our filter). The students left the survey room with the impression that even after completing the survey twice, our answers did not go through. We soon learned, however, that these surveys did go through - both times, in fact. It is strongly possible that the two teachers who experienced similar problems actually submitted their answers.”
35. “The video was ridiculous. Our students and teachers are required to do so many things that they have no choice about, that to ask them to sit through that video to get to the web address was insulting. Next time, give us some directions to read to the group of students and let the teachers read the directions themselves. Don't waste their time!”
36. “The video didn't help much, especially the part with the clown. The students were fine listening to Ms. Virginia, and most would have been ok with the proctor explaining the procedure, reasons, and significance of the survey to them.”
37. “The DVD/CD combo for the video was difficult to access. I had to have our technology specialist burn copies of the individual videos for usage. In the future it would be helpful to have either DVD or CD for usage.”
38. “In the future I would like to have more random numbers from the beginning. I know that a process is in place for calling and getting those, but it is time consuming enough to get 25 students to show up for this. A larger pool would be helpful.”
39. “The students thought the video 'silly'.” 40. “The students believed that the second part of the video was very childish and cheesy. They became restless
while watching it. If the survey is to be taken seriously, the instructions should be serious as well.” 41. “The survey was an excellent idea; however, the introductions need to be improved. The student introduction
was too elementary, and did not set the correct tone for something so serious. The teacher introduction should be shorter, and more to the point.”
42. “It was extremely difficult tracking down students and teachers to complete this survey even with constant reminders via email.”
43. “Typo on #24 of teacher survey. The student video was really "lame" according to the kids.” 44. “It is very hard for 9th grade students to return any type of forms. It is harder for administration to check on
forms being returned if we do not have direct contact with them in their homeroom. Some of the students could not be chosen at random because the student population was smaller that the random number to be used. It should also be noted that some of the students in the random selection were special needs students and they needed help to take the survey. All of the students (19) in our survey had returned permission slips signed by their parent. This number included alternate students as well.”
45. “We had difficulty with the video and many were concerned after they clicked done and a message came up about time constraints.”
46. “The process was too cumbersome.” 47. “It would be beneficial if a student who speaks another language (i.e Spanish) would have access to a survey in
his or her own language.”

VHSSS: Ninth Grade Survey Results 115
48. “Our technology teacher loaded the videos onto the network where it could be accessed by students and teachers. If it had been necessary to load the videos onto individual computers, the time requirements would have been oppressive. Since the students were selected randomly, they were pulled from many classes. Teaching was interrupted for at least 30 minutes in all those classes. That is not a good use of our time.”
49. “Suggest the survey be completed in October. April is very near SOL time and even though the time is minimal, teachers always like students not to miss instructional time.”
50. “When a principal is trying to "step back" to avoid contaminating the survey data- it is hard to know who took it and who didn’t because all of my original students and teachers said they did it - then I got an email saying I was short- wasn’t sure who did or didn’t take it.”
51. “This is a very time consuming process on the person organizing the survey in the building. April-June is a heavy testing remediation time and students should not be pulled from class to conduct a survey. Arrangements should be made for this to be done strictly on student and teacher's own time via email with coordination between state and county level officials.”
52. “We did not receive the packet until late April...very little time to prepare.” 53. “Please put the yellow sheets on the CD disk in word so that we can put the names on the sheet.” 54. “Making it on-line, with video, made it a bit more complicated and time consuming than I would have liked just
prior to the testing season.” 55. “While worthwhile, the survey required an unusually large amount of planning during a busy time of year with
SOL testing in computer labs and SOL preparation in classrooms!” 56. “I found this survey to be very time consuming and somewhat redundant when compared with other safety
audits and surveys we complete. I also felt it was presented at the most difficult time of the school year with SOL tests/preparation, AP testing, and other end of the year activities taking place. I am not sure that this survey is of great value in it's present form compared to the disruption it causes to the instructional program.”
57. “Survey should also be available in Spanish.” 58. “This was a very time intensive survey which required a lot of work on the part of the administrator. It took
away from my other tasks. Some of the letters given to the students to take home to the parents were not returned by the student. Random numbers should be lower for ninth grade populations under 500 to obtain a larger sample group.”
59. “A variety of participants is needed to really get of fair analysis of school safety. Opportunity to all staff members.”
60. “Doing this survey on-line was difficult and time-consuming.” 61. “The sample design may have been better for a high school that contains 9th graders in "homes" or "pods." We
do not. I was very difficult reaching the students and the criteria for the teachers, only applied to 13 teachers, total.”
62. “This took a lot of time to set up and administer. It was labor intensive. I hope the results were worth all of the effort.”
63. “Random selection of students caused issues - special education, alternative education, suspended, absent, out of county placement, etc.”
64. “Please issue survey earlier in school year. (Around mid to late march).” 65. “April is a problematic months for testing. Online survey was more efficient than paper/pencil. Random
selection is difficult; too many alternates are used”
Mixed and neutral comments
66. “Great project, but many times the web site was down and/or blocked. Fortunately, we were able to complete the survey to your specifications.”
67. “The school is very oriented toward academics and preparations for testing sequences may have interfered with participation.”
68. “I think the project has merit. The instructions were very clear and well thought out. I would like to see results for our school in order to address student raised issues via our school improvement team. I was not pleased with the website for the survey timing my students out when they were 3/4's into the survey and they had to start over. This is SOL crunch time and to take students out of class for 45 minutes because the technology was not performing well is undesirable…”
VHSSS: Ninth Grade Survey Results 116
69. “First of all, X is a college-prep high school and the teachers and students filled out the forms without difficulty because we do not have many of the problems that were listed on the form which was most interesting.”
70. “We chose the date for the survey before the incidents at Virginia Tech. Because of the Virginia Tech shootings the students were very serious about the survey and the questions that it contained.”
71. “There were no complaints, the students seemed to enjoy the video, and liked being heard. The only problem we had was that on a few of the surveys when selecting the submit survey the survey did not go to the thank you page. On those the students re-completed the survey. On one when the student clicked on the submit link the survey monkey home page came up. Overall it was very easy to set up and complete.”
72. “The research/ survey assistants were incredibly helpful, and Dr. Cornell is always a pleasure to work with. The survey questions were quite fascinating - I am eager to see the results. The only negative comments uttered by selected students and staff were critiques about the video. The first portion with Miss Virginia was helpful, but the latter half of the film was not very well received. I was initially concerned about the timing of our survey administration given this week's tragic events at Virginia Tech, but that did not appear to be a factor during our survey administration. Not one student mentioned the incident nor did any staffers. This does not guarantee, of course, that it did not skew their responses in one direction or another, but nothing was articulated to the survey administrators, at least.”
73. “We chose to begin on Tuesday, the day after the shooting at Virginia Tech. I'm sure you are aware. It will be interesting to see how the first month of April when students will probably give completely different answers than the students who answered after April 16th. Just a comment. Thank you.”
74. “Students and most staff enjoyed the process. One staff member complained of spelling errors in the survey.” 75. “We had no problems in conducting the survey and once students were identified and taken out to do the survey
we had to use two of our alternates. Through out the entire process it was easy to follow and conduct the survey. The only problem that we had was installing the video on twenty five different computers.”
76. “We had no problem conducting the survey and we had to use two of our alternates which was helpful since they were identified for us and we could pull them easily. The one area we did have problems with was installing the video for the students on 25 computers for one of our disc did not work properly”
77. “I gave teachers two days to complete the survey and had to remind four of them. All emailed be that they had completed the survey.”
78. “I would be interested in the results.” 79. “We experienced a power failure during the students' survey session. Three students using desktop computers
had to restart the test, part-way through. Students using their laptops had no issues.” 80. “This survey takes a great deal of time to execute. I hope the information you receive is worth the effort it takes
to prepare the lists, notify the participants and then to give the survey.” 81. “The video segment presented by Ms. VA was sufficient for instructions. The additional skits featuring Capt.
Excitement and The Teachers' Lounge could have created bias for valid survey results.” 82. “Will results be provided for individual school or school district or both?” 83. “We had completed this survey and received word that we had not. Please recheck you records.” 84. “We made a comment about the Va Tech tragedy and how we thought the survey may be skewed.” 85. “We only had 7 total teachers who met your criteria for 50% instruction of 9th grade students.” 86. “The students and teachers wanted to know why they were selected.” 87. “I did not administer the survey; my assistant principal did and therefore the above information is my best
guess. I do know that our students and teachers did participate and that my AP indicated that the survey went well. I also believe that he responded to this survey initially as the survey administrator. Unfortunately, he is on vacation and I cannot verify information. I do know that the timing of the survey in late spring was not advantageous to getting good responses. Perhaps a survey in Oct/Nov or Mar/Apr would be better received. Thank you!”

VHSSS: Ninth Grade Survey Results 117
Teacher comments Of the 3,014 completed teacher surveys, there were 455 comments. Most of the comments were concerned with school conditions rather than the survey. Here is a sample of positive comments and concerns: Positive comments
1. “I believe we have a very safe school but we can always be better in making sure that we are always open to change.”
2. “I feel as though our school personnel do everything within their means to maintain a safe and orderly school environment.”
3. “I feel fairly safe at this school. Whenever there has been a serious problem the administration has appropriately dealt with it. However on occasion some students get off lightly for doing things and others students doing the same get the book thrown at them. Just my perspective and I realize I don't always know the entire story and background. I do feel that equity should always be strived for.”
4. “I feel that our school is relatively safe and that our new administration is working hard to make it even safer. I feel the problems we do have are because too many of the younger teachers simply want to be the friend of the students, instead of doing their jobs. They tend to ignore many of the rules that are in place (passes, tardies, etc.) and often overlook small incidents in the hallways that potentially lead to bigger incidents. 'Teachers make teaching hard.’”
5. “I have taught for over 40 years, and I have never seen an administration try so hard to make both students and teachers feel appreciated. We pick students of the month on a regular basis and reward them for their academic and behavioral efforts. We sometimes get students who have never been successful at anything, and before they leave our school, they DO become successes. This makes our whole society safer.”
6. “Our school is very diverse, and this diverse environment is celebrated. Although I feel pretty sure that bullying must occur here at our school, I have seen little evidence of it directly. I do not feel threatened here, but I certainly hope (and encourage) that a student who did, would let me or another adult at the school know about it right away.”
7. “We have an excellent safety and security staff, and several of our administrators do an excellent job, principal included. However, there are a couple of administrators that lack in several of the items in question, as well as several teachers.”
8. “Excellent survey for school safety.” 9. “Community involvement is paramount within our school district and helps combat some disciplinary problems
mentioned in this survey. Thank you for giving me the opportunity to participate in this important survey.” 10. “This school safety survey is great. There were some questions that I feel were difficult to answer due to words
like 'often' and 'a lot'. I do feel that teasing is a problem not because of this particular school, but because youth tend to do this wherever and I know that it happens to some degree here. However, other and a lot sort of shifts the answer. I would like to say also that I commend our administration for recent measures taken to ensure safety here at our campus. They attend some seminars and came back and boldly made changes with the safety of our school and students in mind. I do feel however that the presence of our resource officer is not visible enough throughout our campus. I rarely see the officer in the part of the building in which I teach and believe that the presence of the officer would be a deterrent to any potential safety or violence issues.”
11. “I feel very safe at my school. The administration has taken firm stand against drug dealers and gangsters to the point of kicking out most of them at the first signs of blatant defiance. Bullying happens everywhere, but we are aware of it and fighting it.”
12. “I believe that the staff and students really feel safe in the building and with each other. Although we and any community has gangs, there is not a law against being a gang member. Our resource officer helps provide information to teachers, admin., and staff as a form of awareness. Our county in general looks for outwardly signs, symbols, dress etc. That would indicate gang affiliation. Teachers look for and report such things as well. I think that the students feel strongly that the teachers look-out for their best interest and support them by any means possible. The staff members in this school will continue to make improvements--there is always room for improvement. With all of the great programs and learning opportunities, I am proud to work for this county and definitely this school!”

VHSSS: Ninth Grade Survey Results 118
Concerns
13. “Certain Administrator(s) do(es) not assess punishment equitably among all students who break the rules. Students know which one(s) they should try to talk to when in trouble.”
14. “Administration needs to stop the selling of cookies and drinks and candy during the school day to cut down on hall traffic.”
15. “Real safety will not improve until we begin to take action instead of doing all these meaningless surveys! When we begin to scan everyone entering a school building, (like in a Federal building) maybe things will get better. Let us stop worrying so much about individuals rights, that we forget about their responsibility as citizens of the U.S.A.”
16. “I hear from students that too much in the way of slack behavior is allowed. I hear of cheating and rowdy behavior that goes unrecognized. Sometimes the students are boasting, sometimes they are witnesses and express unfairness.”
17. “Guns have been found in our school and in the school next door. In each case, students helped by telling on the student who had the gun, but at our school, the students had to be pressured to 'break the code' that prevents them from telling on each other, even though guns were involved.”
18. “Support services from Special Education Services is limited for ESL students in this county. Very little is done to stop homophobic remarks.”
19. “”Administrators need to be consistent in enforcing school rules. Talking to students alone does not work.” 20. “Most students are respectful and well behaved. We do have a core of 100-150 students who are the constant
discipline and behavior problems. This does not seem to be the right educational setting for them. If they don't want to be here and bring nothing to the educational setting, then they should be removed or given the option to obtain a GED or equivalent. They occupy too much class and administrative time.”
21. “The school is in serious need of more security. I mean real security because it seems as if school security does not have any real authority or power. This needs to be done as soon as possible because with the number of students in this building and the problems with drugs and violence, I am so afraid that something will happen and someone will really get hurt and then it will be too late!”
22. “90% of all problems I have come from about 5% of my students. If those 5% had an alternative school to go to, I think we would see a dramatic drop in serious problems.”
23. “A big problem is that the students who are consistently disrupting classes/the school do NOT care about getting in trouble. There is no parental support, or, if there is, there is either too little or the kids just don't care.”
24. “A number of questions were difficult to answer accurately because I simply had no bases to answer. Since I couldn't choose and option of ‘Don't Know’; I had to choose something. My answers must be taken with a grain of salt because of this.”
25. “I do not feel safe at this school because anyone can enter the building at any times. Students are not checked for weapons upon entrance. I think the school rules are there, but not specific and therefore can not be enforced. I.E school dress code is up to the teachers to use their judgment on weather it is appropriate or not. I don't agree with this method because everyone is not the same. Some will think it is ok and some will not, therefore, a lot of things are left alone. We have female students who wear shorts up to their butt and can go the whole day without someone saying something to them. Also, punishment for a violent act in this school is not harsh enough. Students curse at teachers and would only receive after school restrictions. Student with anger management problems (i.e. students who have the tendency to explode) are in regular classrooms with other students and teachers. If this is the case, there is bound to be a problem eventually. I would love to have metal detectors and a bullet proof door to my classroom.”
26. “The administration needs to be more consistent when enforcing safety rules. Also the rules need to be more explicitly written so that there is no room for potential discrimination based on gender, sexual orientation, race, creed, etc.”
27. “There are no consistent consequences for behavior. We need to teach social skills! We are not preparing the students to affectively deal with problems.”
28. “There should be some method of evaluating how any administrator does his or her job. Teachers are evaluated by the administration but if one of them is not doing their job, the teacher has no say so except to avoid any dealing with that one person.”

VHSSS: Ninth Grade Survey Results 119
29. “This school needs to take a serious look at who diagnoses kids for Special Education needs. There are a lot of kids’ needs that are not being met. Even when there is all the evidence in the world some keeps are not receiving the benefits they need.”
30. “This school should do a better job of enforcing the dress code, particularly to encourage a more positive example for young ladies. In addition, eating in class and generally using foul language should not be overlooked. While the eating in class may not seem like a big deal, students who are allowed to bring in full course meals, crunchy chips, pizza, etc. really distract others focused on learning. (Not to mention the behavior problems presented by food throwing and damage to school classrooms.)”
31. “Too many students are wandering in the halls without supervision. They have asked to go to the bathroom, the clinic, their locker, or elsewhere. Teachers give the students the benefit of the doubt, but the same students are always in the halls during class.”
32. “There's a lot more sexual harassment, and fights over relationships, than gang related activity. Lots of our students are sexually active, and over half of the girls have children or are pregnant. “Sexual harassment is one of the most important factors that make our schools unsafe. Thank you.”
33. “In our school the biggest problem with school safety is the lack of concern by the faculty. There are many teachers who do not enforce the rules and many teachers who do not expect or lead their students to do the right thing. I believe too many teachers are passive about the problems in our school. These teachers seem to think they are not responsible for disciplining students outside of their classroom and unfortunately, sometimes in their classroom. I also believe that the administrators have a philosophy that teachers should police other teachers. For a school with so many discipline problems this is not practical. I would like the administrator to make teachers follow the rules, especially the ones that lead to large problems.”
34. “Although I have not been assaulted during this school year, I have witnessed a student assaulting another student within my classroom and I have been assaulted on campus in a previous school year. Based upon my experiences with these two incidents, it is unfortunate that I can no longer say that neither my safety nor the safety of my current students is guaranteed.”
35. “I feel that our school is very unsafe. We installed new locks on all of our doors that require a number passcode to enter, but the doors stay unlocked all the time; therefore, you don't need a pass code to enter. On several occasions, parents have entered the school and came directly to my classroom without checking in the main office.”
VHSSS: Ninth Grade Survey Results 120
Student comments Of the 7,431 completed student surveys, there were 1,593 comments. This included 58 comments praising the survey. Two examples were: 1. “It was a good test. It asked some good questions. It talked about everything that was going on in school. I think
that every school should HAVE to take this test just to find out if schools really are safe. It made me really think about everything that has been going on in school. It is a great test. Keep up the good work.”
2. “The survey was an excellent idea for the school, being that Virginia Tech was recently attacked I believe this
survey will help our school and other schools learn to be more observant of there operations, activities, and more importantly, students.”
In contrast, there were 48 comments critical of the survey. Two examples were: 1. “This survey is pointless in my opinion because X high school is going to look over what each student said and
then not try to fix the problem areas. That’s how this school has always been.” 2. “This survey was stupid because no one is going to listen to it and change what the students want changed. It is
a HUGE waste of time!!!” The ratings by more than 7,000 students clearly indicate an overall positive view of school climate and safety that is consistent with the positive comments. However, a number of students also raised concerns about school safety or fairness of school rules. In order to identify what kinds of concerns are most common among students, these comments were content coded according to the presence or absence of 12 topics (a single comment could receive multiple codes). The table below presents sample comments and the distribution of comments. The comments are presented in order from most frequent to least frequent. This coding did NOT include positive comments, because it was intended to identify the content of student concerns. Therefore, these comments should NOT be used to describe the overall conditions of Virginia schools.
Sample comments expressing concerns # of Comments %
Safety 179 11 “School has always been meant to be a place where we can be safe, grow, and learn.
Now, it just doesn't feel like it is anymore.” “I think that we should have more security guards at our school and metal detectors,
because just last week we had a threat at our school and people could have hid their weapons in suit cases for instruments and in bags. We just need more protection.”
Bullying 121 8 “Bullying is a big problem at schools, not all the time is it bad enough to tell someone,
but it happens all the time still. Bullying brings down people's confidence, and a lot of the time, bullying makes kids stop trying hard enough at school.”
“Many kids these days don't like to tell teachers about being bullied because most kids do it on a regular basis. They don't think of it as bullying, they think of it as harmless teasing.”
Fairness 112 7 “My school rules are not fair to all people and are ridicules. There are rules that no one
even cares about.” “Rules are not the same for every one. Teachers do not treat every one the same way

VHSSS: Ninth Grade Survey Results 121
even though they say they do.” Weapons 68 4
“The people in this school need to be more aware of the students that they bring to the school. Because they don’t check the background of the child or the history and yet and still their bringing guns... drugs... and everything else..”
“People can bring in any sort of weapon, no way of stopping them.” Dress code 67 4
“I think that the school dress code is horrible and since we are in high school, I think we should have more of a right to wear whatever we want.”
“I think that the dress code and appropriateness is being way overdone in other words the teachers are using to much power.”
Drugs 56 4 “Drugs are more of a problem than violence or bullying.” “Need more personal and locker searches for drugs and other contraband”
Fighting 52 3 “I think that this school is not as safe as I would like it to be. There are a lot of fights
that go on and the punishment is very light...” “I think the rules and punishments regarding fighting at school should only be
enforced on the attacker because in some situations fighting is necessary a defense.” Race 47 3
“RACISM!!!!!!!!!!!!!!, please do something to stop this behavior in school, even when teachers turn their back toward students, it begins to happen again. Please do something to stop this.”
There is a big problem about people being teased about race! Gangs 39 2
“Earlier in the year the school had an incident where two guys got into a gang fight. The school did go through measures such as putting up metal detectors and checking backpacks.”
“Gangs are a true issue here at X School. People get 'jumped' everyday because they are not in the right gang. Also the use of drugs on the buses is a true issue including purple haze and weed.”
Virginia Tech 35 2 Sometimes, I am afraid that people who don't fit in, are considered outsiders, or do not
act well in school will eventually bring a gun or hurt others for no reason. I am even more afraid of this after what happened at Virginia Tech. I think our school should do more to insure that students cannot bring weapons to school without being caught (install metal detectors).
“Honestly, after what happened on Tech campus I almost don’t feel safe at school anymore. I know my school has done what they could to make things better but it still is a worry.”
Food 26 2 “More time for lunch and to change classes.” “We need better food.”
Cell phones 21 1 “I think students should be able to bring cell phones to school incase of an
emergency.” “We should be able to use our ipods or other Mp3's in the hall ways it’s not like we are
hurting anyone. Also we should be able to use our cell phones in the hallway like if we absolutely need to talk to someone like a parent or a friend.”

VHSSS: Ninth Grade Survey Results 122
Many students made positive comments about the safety of their school. A selection of these comments is presented below:
1. “This is a great school, but all schools have flaws, all schools have bullies. Safety is not an issue here. I can go to school without worrying about my personal safety.”
2. “I feel very safe at this school and the teachers have all treated me well.”
3. “I think that our school is a very safe place to be and I wouldn’t pick any other place to be that I could be
more safe.”
4. “I think that this is a great school. There is not a lot of bullying or fights at the school. There is always room for improvement but I think for now we are fine.”
5. “I think school safety is very important. Without school safety and guidelines our school would be a wreck.
We need to keep up the good work!!”
6. “X is a very safe school where I think that everyone feels comfortable. The only people who bully and make trouble are the ones that have problems themselves. Bullies are not common so no one is really affected by their remarks.”
7. “X is an exceptional school in the topic of security, although it would be a little more efficient if more
guards were posted about the school, also, metal detectors would be a great installment to the school to track down abusers of school rules. Other than this, I always feel safe at school, and never have any feeling of insecurity.”
8. “My school is a good school, there is hardly any put downs, and I have never seen a fist fight.”
9. “X is a safe environment for all of us and the teachers and adults try their best to help but sometimes they
don't see what all goes on.”
10. “I think that our school does a very good job of keeping us safe. You don't really hear about fights and such in a conversation. We don't really have a lot of internal hostility towards one another, so there's not a lot of violence. As for gangs and drugs, I've never seen or heard or been involved in anything like that.”
11. “Our school has good safety. The survey addressed everything very well.”
12. “My school is very nice. People respect others of different groups and we are practically safe.”
13. “X isn't a terrible school, and overall the main things on my mind when I come to school isn't safety, cause
I never really feel in harm when I am here, I have never really been in or witnessed a dangerous situation, and I'm thankful for that. I just think that the schools safety is pretty good and I'm happy here at X.”
14. “I think we should do more of these to make sure our school is safer!”
15. “This survey is a great way to see how each school is doing on the bullying level. I answered all honestly
and hope this will help my school in the future!!!”
16. “I personally feel that our school is safe and that in the case of an emergency our school is prepared.”
17. “I personally think that this school is a safe school. But then again, I don't really know what goes on because I keep out of trouble with my own friends. But I really do think this school is safe. If I was in trouble, I would want to come here. But that's just my own opinion.”

VHSSS: Ninth Grade Survey Results 123
18. “Very safe school I feel, even though my answers may not make it seem like it. Bullying isn't that much of a problem, but it does happen occasionally. Staff and students are very nice, understanding, and sympathetic.”
19. “Unlike some schools we feel safe here, and I know I don't feel any problem in talking with one of my
teachers. If I had to pick a school it would be this one.”
20. “Overall, the school is a safe place for students.”
21. “X is a pretty safe school. Some teachers aren't as fair as others, but all in all, it's a great school.”
22. “Our school is a safe school and when I am at school I feel very safe to be here because they monitor the hallways.”
23. “This is so long, but it's worth it. Here at X there really is no need for extremely strict rules. We all have
respect for each other, and we are all are here for one thing: to get our education and go to college.”
24. “I feel that my school is pretty safe. Sometimes students get away with things that are against the rules because they don't get caught by teachers. Students will get name called, but I don't take it seriously. I just forget about it and move on. I’m here for an education not to have a party.”
25. I personally think that this was a perfect time to take this essay with the events that occurred at Virginia
Tech. Although I know that this survey had nothing to do with this event, I think it shows that even the small schools in the 'country' so-to-speak have just as much of a threat as does any other school. Our school is a wonderful place and although we have never had sizeable breech in our safety/security, I feel we are prepared if one should arise.

VHSSS: Ninth Grade Survey Results 124
References Austin, G. & Duerr, M. (2005) Guidebook for the California Healthy Kids Survey. Part III.
School Climate Survey for teachers and other staff, 2005-2006 edition. WestEd. Retrieved January 5, 2006, from http://www.wested.org/pub/docs/chks_surveys_summary.html
Bowen, N. K., & Bowen, G. L. (1999). Effects of crime and violence in neighborhoods and
schools on the school behavior and performance of adolescents. Journal of Adolescent Research, 14, 219-341.
Cornell, D. G. (2006). Bullying Climate Scale. Unpublished scale. Charlottesville, Virginia:
Curry School of Education, University of Virginia. Cornell, D. G., & Sheras, P. L. (2003). The School Climate Bullying Survey. Unpublished survey
and report. Charlottesville, Virginia: Curry School of Education, University of Virginia. Eliot, M. (2006). Help seeking in schools: The influence of perceived support and zero tolerance
discipline policies. Unpublished proposal and presentation. Charlottesville, Virginia: Curry School of Education, University of Virginia.
Gottfredson, G. D. (1999). User’s manual for the Effective School Battery. Ellicott City, MD:
Gottfredson Associates. Gregory, A. & Weinstein, S. R. (2005). A window on the discipline gap: Defiance or
cooperation in the high school classroom. Unpublished manuscript. University of California, Berkeley.
Midgley, C., Maehr, M., Hruda L., Anderman, E., Freeman, K. (2000). Manual for patterns of
adaptive learning. Ann Arbor: University of Michigan. National Center for Education Statistics (2004). Indicators of school crime and safety. Retrieved
January 10, 2006, from http://www.nces.ed.gov/. National Center for Education Statistics (2005). School crime supplement to the national crime
victimization survey 2005. Retrieved January, 2006 from http://nces.ed.gov/Programs/Crime/surveys.asp.
Osher, D., Dwyer, K. P., & Jackson, S. (2004). Safe, Supportive and Successful Schools Step by
Step. American Institutes for Research, Sopris West Educational Services: Longmont, CO.
Stewart, E. A. (2003). School social bonds, school climate, and school misbehavior: A multilevel
analysis. Justice Quarterly, 20, 575-604.

VHSSS: Ninth Grade Survey Results 125
Thornberry, T. P., Lizotte, A. J., Krohn, M. D., Farnworth, M., & Jang, S. J. (1991). Testing interactional theory: An examination of reciprocal causal relationships among family, school, and delinquency. Journal of Criminal Law and Criminology, 82, 3-35.

VHSS: Ninth Grade Survey Results 126 Student Survey for Virginia High School Safety Study
Parent Review Copy (The online version of this survey is formatted for easier reading and completion)
The purpose of this survey is to improve the safety and climate of Virginia high schools. We want to understand how students feel about their school. We hope you will give us open and honest answers. This is an anonymous survey, which means that no one will know your name or your individual answers. Please mark the response that best describes you.
What school do you attend? _____________ How old are you? __________________ What grade are you in? _________________ Are you? (Female, Male) What do you consider yourself to be? (White, Black, Hispanic, American Indian, Asian, Other) Is English spoken in your home? (Yes, No) Are other languages spoken in your home? (No, Spanish, Other)
Thinking about your school over the last 6 months, would you strongly agree, agree, disagree, or strongly disagree with the following...
Strongly Disagree
Disagree Agree Strongly Agree
Everyone knows the school rules for student conduct. The school rules are fair. The punishment for breaking school rules is the same no matter who you are. The school rules are strictly enforced. If a school rule is broken, students know what kind of punishment will follow. We have a strict dress code at school. If a student breaks the rules at this school, he or she will be punished.
Does your school take any of these measures to make sure students are safe? No Don’t
know Yes
Security guards or assigned police officers? Other school staff or other adults supervising the hallways? Metal detectors? Locked entrance or exit doors during the day? A requirement that visitors sign in? Locker checks? A requirement that students wear badges or picture identification? One or more security cameras to monitor the school? A code of student conduct (written rules for students to follow)?
Zero tolerance means that a student is automatically expelled or given a lengthy suspension for any violation of the rule. Does your school have zero tolerance for:
No Don’t know
Yes
Bringing a gun to school? Bringing a BB gun, pellet gun, or similar gun to school? Bringing a toy gun or something that looks like a gun to school? Bringing in edged or cutting weapons such as knives? Bringing illegal drugs to school? Bringing legal drugs, such as prescription drugs and over the counter medications, to school?
Bringing alcohol to school? Belonging to a gang? Fighting at school? Does your school have zero tolerance for some other reason not mentioned above?
How many minutes do students have for lunch on a normal day? ________________ How many minutes do students have when changing classes or going from one class to the next? _______________ How many times do students change classes on a normal day? ________________

VHSSS: Ninth Grade Survey Results 127
How likely are the following? Not at all
Likely Not Likely Likely Very
Likely
If a student was wandering in the hallways during class time, how likely would an adult stop the student?
If a student cut a class, how likely would the student be caught? If a student smoked a cigarette at school, how likely would the student be caught?
If two students got into a fight at school, how likely would they get caught? If a student was five minutes late for class, how likely would teachers overlook it?
If a student said something sarcastic to a teacher, how likely would the teacher overlook what the student said?
How much do you agree or disagree with these statements? Strongly
Disagree Somewhat Disagree
Somewhat Agree
Strongly Agree
If another student was bullying me, I would tell one of the teachers or staff at school.
There are adults at this school I could turn to if I had a personal problem. If I tell a teacher that someone is bullying me, the teacher will do something to help.
Students tell teachers when other students are being bullied. If another student talked about killing someone, I would tell one of the teachers or staff at school.
If another student brought a gun to school, I would tell one of the teachers or staff at school.
Teachers here make it clear to students that bullying is not tolerated. Students here try to stop bullying when they see it happening. I am being honest on this survey.
How much do you agree that adults in this school... Strongly
Disagree Disagree Somewhat Agree Agree Strongly
Agree Really care about all students. Acknowledge and pay attention to students. Want all students to do their best. Listen to what students have to say. Believe that every student can be a success. Treat all students fairly. Support and treat students with respect. Feel a responsibility to improve the school.
How much do you agree or disagree with these statements? Strongly
Disagree
Disagree Agree Strongly Agree
You like school a lot. School is boring to you. You do poorly at school. You don't really belong at school. Homework is a waste of time. You try hard at school. You usually finish your homework. Getting good grades is very important to you. Sometimes you do extra work to improve your grades.
If you could choose on your own between studying to get a good grade on a test or going out with your friends, would you… (Definitely go out with friends, Probably go out with friends, Probably study, Definitely study)
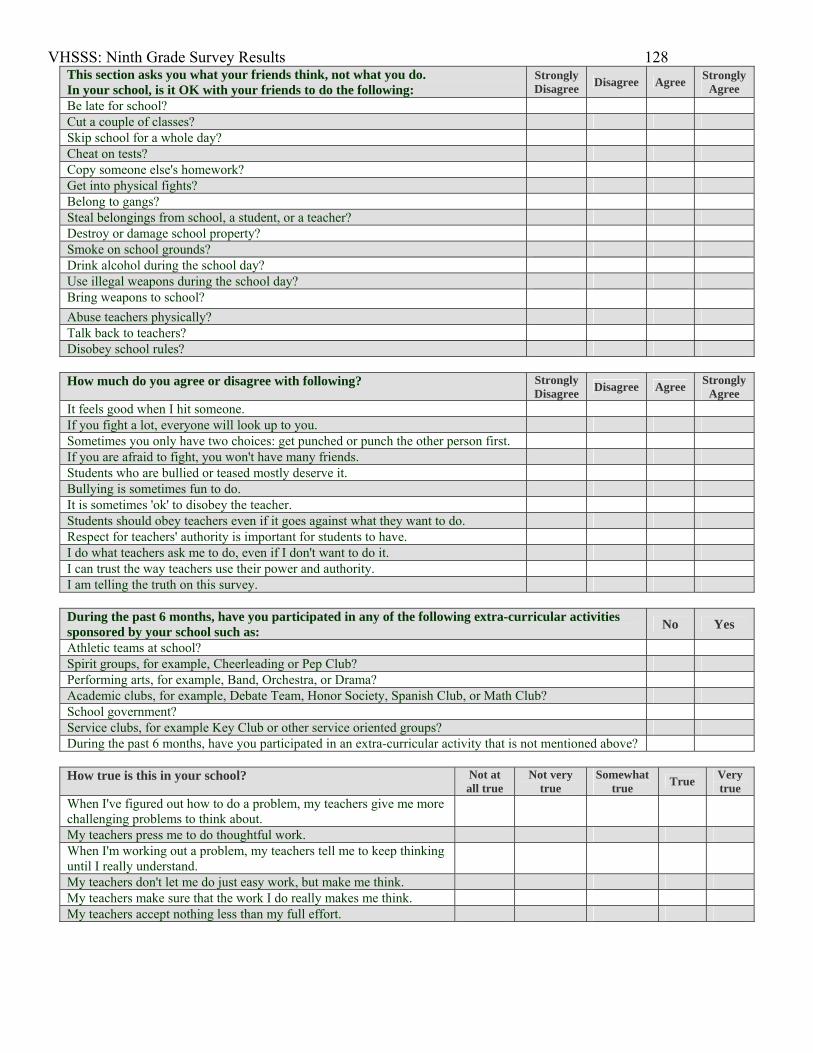
VHSSS: Ninth Grade Survey Results 128 This section asks you what your friends think, not what you do. In your school, is it OK with your friends to do the following:
Strongly Disagree Disagree Agree Strongly
Agree Be late for school? Cut a couple of classes? Skip school for a whole day? Cheat on tests? Copy someone else's homework? Get into physical fights? Belong to gangs? Steal belongings from school, a student, or a teacher? Destroy or damage school property? Smoke on school grounds? Drink alcohol during the school day? Use illegal weapons during the school day? Bring weapons to school? Abuse teachers physically? Talk back to teachers? Disobey school rules?
How much do you agree or disagree with following? Strongly
Disagree Disagree Agree Strongly Agree
It feels good when I hit someone. If you fight a lot, everyone will look up to you. Sometimes you only have two choices: get punched or punch the other person first. If you are afraid to fight, you won't have many friends. Students who are bullied or teased mostly deserve it. Bullying is sometimes fun to do. It is sometimes 'ok' to disobey the teacher. Students should obey teachers even if it goes against what they want to do. Respect for teachers' authority is important for students to have. I do what teachers ask me to do, even if I don't want to do it. I can trust the way teachers use their power and authority. I am telling the truth on this survey.
During the past 6 months, have you participated in any of the following extra-curricular activities sponsored by your school such as: No Yes
Athletic teams at school? Spirit groups, for example, Cheerleading or Pep Club? Performing arts, for example, Band, Orchestra, or Drama? Academic clubs, for example, Debate Team, Honor Society, Spanish Club, or Math Club? School government? Service clubs, for example Key Club or other service oriented groups? During the past 6 months, have you participated in an extra-curricular activity that is not mentioned above?
How true is this in your school? Not at
all true Not very
true Somewhat
true True Very true
When I've figured out how to do a problem, my teachers give me more challenging problems to think about.
My teachers press me to do thoughtful work. When I'm working out a problem, my teachers tell me to keep thinking until I really understand.
My teachers don't let me do just easy work, but make me think. My teachers make sure that the work I do really makes me think. My teachers accept nothing less than my full effort.

VHSSS: Ninth Grade Survey Results 129 During the past 6 months, how many times have you…
Never Once or Twice
About Once a week
Several Times a Week
Gone to a teacher (or other adult at school) for academic help?
Asked a teacher (or other adult at school) for advice? Told a teacher (or other adult at school) about something that worries you? Told a teacher (or other adult at school) about a friend who was in trouble?
This year in school have any of the following happened to you personally in the school? False True Damage to personal property worth more than $10. Theft of personal property worth more than $10. Was physically attacked and had to see a doctor. Was physically attacked, but not seriously enough to see a doctor. Received obscene remarks or gestures from a student. Was threatened in remarks by a student. Had a weapon pulled on me.
Now, we'd like to know about gangs at your school. You may know these as street gangs, fighting gangs, crews, or something else. Gangs may use common names, signs, symbols, or colors. For this survey we are interested in all gangs. - Are there any gangs at your school? (Yes, No, Don’t know) - During the last 6 months, how often have gangs been involved in fights, attacks, or other violence at your school? - Have gangs been involved in the sale of drugs at your school in the last 6 months? (Yes, No, Don’t know)
How often have you experienced the following?
Never Once or twice
About once per
week
Several times
per week Bullying is defined as the use of one's strength or status to injure, threaten, or embarrass another person. Bullying can be physical, verbal, or social. It is not bullying when two students of about the same strength argue or fight. By this definition, I have been bullied in the past month.
Physical bullying involves repeatedly hitting, kicking, or shoving someone weaker on purpose. By this definition, I have been physically bullied in the past month.
Verbal bullying involves repeatedly teasing, putting down, or insulting someone on purpose. By this definition, I have been verbally bullied in the past month.
Social bullying involves getting others repeatedly to ignore or exclude someone on purpose. By this definition, I have been socially bullied in the past month.
Experiences of bullying Strongly
Disagree Disagree Agree Strongly Agree
Bullying is a problem at this school. Students here often get teased about their clothing or physical appearance. Students here often get put down because of their race or ethnicity. New students are made to feel welcome here by other students. Students from different neighborhoods get along well together here. There is a lot of teasing about sexual topics at this school. Students at this school accept me for who I am.
Have you told anyone that you were bullied in the past 30 days at school? (I have not been bullied; I have been bullied, but I have not told anyone; I have told someone)
I have told these persons that I was bullied in the past 30 days at school; (No one, A parent, A friend, A teacher or other adult at school, Someone else)
Thank you for completing the survey!

VHSS: Ninth Grade Survey Results 130 Teacher Survey for Virginia High School Safety Study
Participant Review Copy (The online version of this survey is formatted for easier reading and completion)
The purpose of this survey is to improve the safety and climate of Virginia high schools. We hope you will give us open and honest answers. This is an anonymous survey, which means that no one will know your name or your individual answers.
Please note, when we ask you about "school" we mean all grades in your school, and that when we ask about "teachers" or "students" in general, we mean all teachers and students in the school.
Please read each question carefully and click on your answers for each question.
Are you? (Female, Male) What do you consider yourself to be? (White, Black, Hispanic, American Indian, Asian, Other) How many years have you been teaching? ____________________ A majority of my teaching is done with? ____________________
This first section is about your opinion about how things work in your school.
Thinking about your school over the last 6 months, would you strongly agree, agree, disagree, or strongly disagree with the following...
Strongly Disagree Disagree Agree Strongly
Agree Everyone knows the school rules for student conduct. The school rules are fair. The punishment for breaking school rules is the same no matter who you are. The school rules are strictly enforced. If a school rule is broken, students know what kind of punishment will follow. We have a strict dress code at school. If a student breaks the rules at this school, he or she will be punished.
Does your school take any of these measures to make sure students are safe? No Don’t know Yes Security guards or assigned police officers? Other school staff or other adults supervising the hallways? Metal detectors? Locked entrance or exit doors during the day? A requirement that visitors sign in? Locker checks? A requirement that students wear badges or picture identification? One or more security cameras to monitor the school? A code of student conduct (written rules for students to follow)?
Zero tolerance means that a student is automatically expelled or given a lengthy suspension for any violation of the rule. Does your school have zero tolerance for: No Don’t know Yes
Bringing a gun to school? Bringing a BB gun, pellet gun, or similar gun to school? Bringing a toy gun or something that looks like a gun to school? Bringing in edged or cutting weapons such as knives? Bringing illegal drugs to school? Bringing legal drugs, such as prescription drugs and over the counter medications, to school? Bringing alcohol to school? Belonging to a gang? Fighting at school? Does your school have zero tolerance for some other reason not mentioned above?
How many minutes do students have for lunch on a normal day? ________________ How many minutes do students have when changing classes or going from one class to the next? _______________ How many times do students change classes on a normal day? ________________
How likely are the following? Not at all
Likely
Not Likely Likely Very Likely
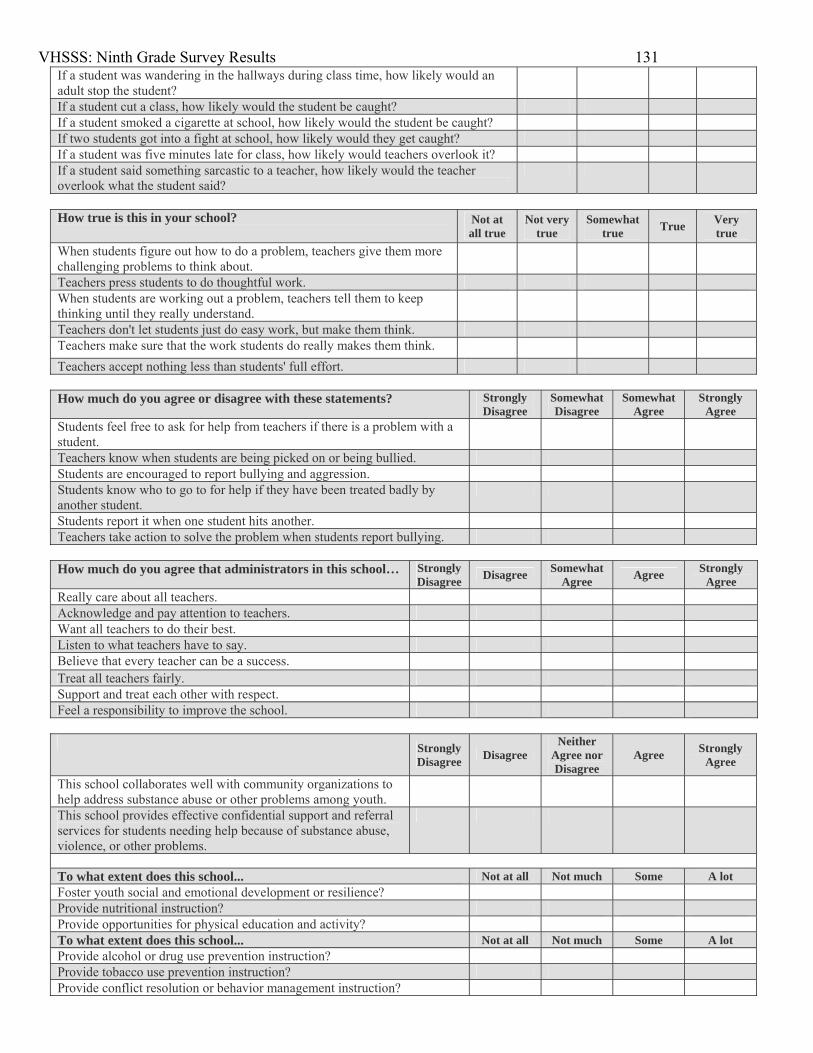
VHSSS: Ninth Grade Survey Results 131 If a student was wandering in the hallways during class time, how likely would an adult stop the student?
If a student cut a class, how likely would the student be caught? If a student smoked a cigarette at school, how likely would the student be caught? If two students got into a fight at school, how likely would they get caught? If a student was five minutes late for class, how likely would teachers overlook it? If a student said something sarcastic to a teacher, how likely would the teacher overlook what the student said?
How true is this in your school? Not at
all true Not very
true Somewhat
true True Very true
When students figure out how to do a problem, teachers give them more challenging problems to think about.
Teachers press students to do thoughtful work. When students are working out a problem, teachers tell them to keep thinking until they really understand.
Teachers don't let students just do easy work, but make them think. Teachers make sure that the work students do really makes them think. Teachers accept nothing less than students' full effort.
How much do you agree or disagree with these statements? Strongly
Disagree Somewhat Disagree
Somewhat Agree
Strongly Agree
Students feel free to ask for help from teachers if there is a problem with a student.
Teachers know when students are being picked on or being bullied. Students are encouraged to report bullying and aggression. Students know who to go to for help if they have been treated badly by another student.
Students report it when one student hits another. Teachers take action to solve the problem when students report bullying.
How much do you agree that administrators in this school… Strongly
Disagree Disagree Somewhat Agree Agree Strongly
Agree Really care about all teachers. Acknowledge and pay attention to teachers. Want all teachers to do their best. Listen to what teachers have to say. Believe that every teacher can be a success. Treat all teachers fairly. Support and treat each other with respect. Feel a responsibility to improve the school.
Strongly
Disagree Disagree Neither
Agree nor Disagree
Agree Strongly Agree
This school collaborates well with community organizations to help address substance abuse or other problems among youth.
This school provides effective confidential support and referral services for students needing help because of substance abuse, violence, or other problems.
To what extent does this school... Not at all Not much Some A lot Foster youth social and emotional development or resilience? Provide nutritional instruction? Provide opportunities for physical education and activity? To what extent does this school... Not at all Not much Some A lot Provide alcohol or drug use prevention instruction? Provide tobacco use prevention instruction? Provide conflict resolution or behavior management instruction?

VHSSS: Ninth Grade Survey Results 132 Provide character education? Provide harassment or bullying prevention? Provide services for students with disabilities or other special needs?
This next section is about your own interactions with students.
How much do you agree with the following statements… Strongly Disagree Disagree Agree Strongly
Agree I encourage students to come to me for academic help. I let students know that I am available to talk outside of class. I encourage students to turn to me with personal problems. I encourage students to tell me if they are being bullied. I encourage students to come forward if they have information about a gun at school.
I encourage students to come forward if they have information about a student who plans to hurt him/herself or someone else.
I believe that teachers should be mentors as well as instructors. Disciplinary consequences for students at this school tend to be too harsh. I trust that my administration will handle discipline fairly. When I refer a student to the office for a discipline problem, I feel confident that it will be handled appropriately.
This year in school have any of the following happened to you personally in the school? False True Damage to personal property worth more than $10. Theft of personal property worth more than $10. Was physically attacked and had to see a doctor. Was physically attacked, but not seriously enough to see a doctor. Received obscene remarks or gestures from a student. Was threatened in remarks by a student. Had a weapon pulled on me. Was spoken to in a rude or disrespectful manner by a student.
Now, we'd like to know about gangs at your school. You may know these as street gangs, fighting gangs, crews, or something else. Gangs may use common names, signs, symbols, or colors. For this survey we are interested in all gangs. Are there any gangs at your school? (Yes, No, Don’t know) During the last 6 months, how often have gangs been involved in fights, attacks, or other violence at your school? (Never, Once or twice in the last 6 months, Once or twice a month, Once or twice a week, Almost everyday, Don’t know) Have gangs been involved in the sale of drugs at your school in the last 6 months? (Yes, No, Don’t know)
Experiences of Bullying Strongly Disagree Disagree Agree Strongly
Agree Bullying is a problem at this school. Students here often get teased about their clothing or physical appearance. Students here often get put down because of their race or ethnicity. New students are made to feel welcome here by other students. Students from different neighborhoods get along well together here. There is a lot of teasing about sexual topics at this school. Students at this school accept other students for who they are.
Thank you for completing the survey!