virginia hospital & healthcare association · pdf filevirginia hospital & healthcare...
TRANSCRIPT

VIRGINIA HOSPITAL & HEALTHCARE ASSOCIATION HOSPITAL ENGAGEMENT NETWORK
BETSY COLE ARCHER, MS, BB (ASCP)
DIRECTOR, PERFORMANCE IMPROVEMENT
CENTER FOR HEALTHCARE EXCELLENCE

ABOUT ME
Master of Science, Virginia Commonwealth University
Transfusion Medicine
Manager, Quality and Patient Safety
Large health system in Virginia (Richmond and Hampton Roads)
Ambulatory Care -> Imaging centers, radiation oncology, urgent care centers, etc.
Director, Performance Improvement
Multiple initiatives that support our vision
Hospital Acquired Infections
Preventable readmissions
Reducing hospital costs through quality improvement
Strengthening hospital performance in penalty programs
Making healthcare safer for Virginians

VHHA - WHO ARE WE?
Virginia Hospital & Healthcare Association
Alliance of 107 hospitals and 26 health systems
The Center for Healthcare Excellence
Improve healthcare by assisting members to achieve top-tier performance in quality, safety, & service

VHHA VISION
Through the power of collaboration, the association will be the recognized driving force behind making Virginia the healthiest state in the nation by 2020.

VHHA MISSION
Working with our members and other stakeholders, the association is to transform Virginia’s health care system to achieve top tier performance in safety, quality, value, service and
population health. The association’s leadership is focused on: principled, innovative and effective advocacy; promoting initiatives that improve health care safety, quality, value and service; and,
aligning forces among health care and business entities to advance health and economic opportunity for all Virginians.

HOW WILL WE ACHIEVE OUR AIM?
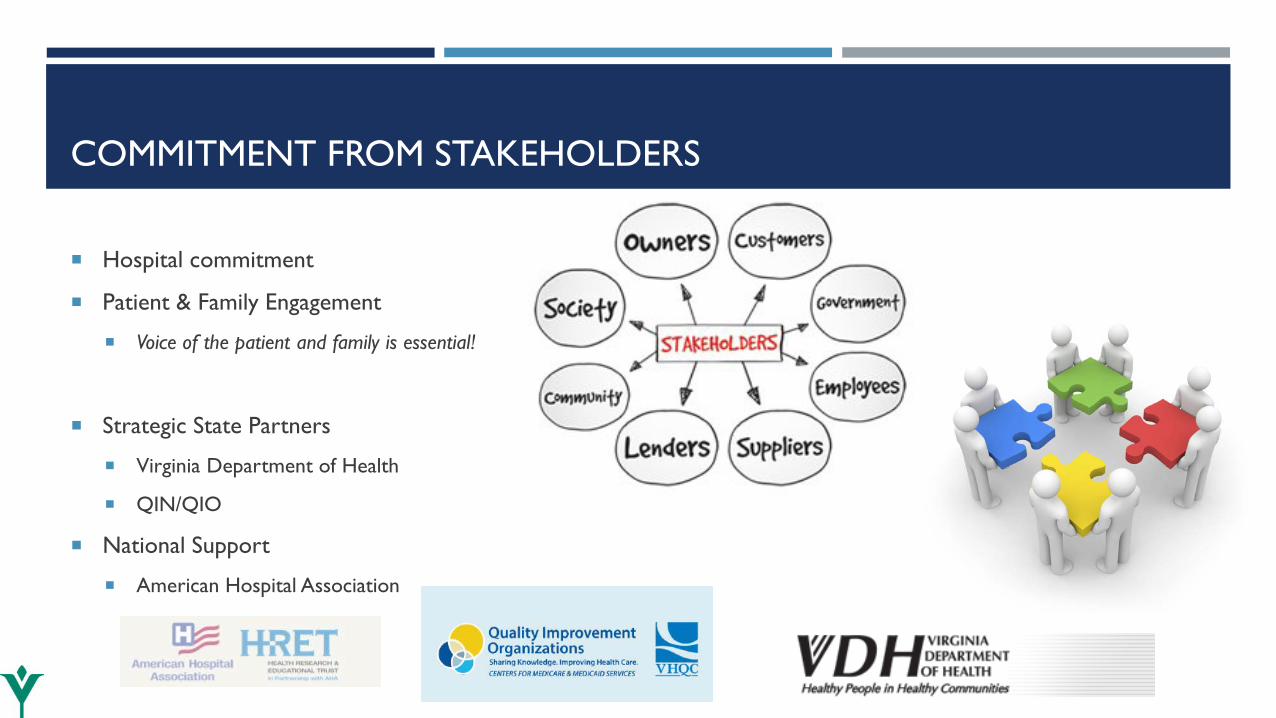
COMMITMENT FROM STAKEHOLDERS
Hospital commitment
Patient & Family Engagement
Voice of the patient and family is essential!
Strategic State Partners
Virginia Department of Health
QIN/QIO
National Support
American Hospital Association

EXTERNAL FUNDING…
Center for Medicare & Medicaid Services (CMS)

AHA/HRET & VHHA HOSPITAL ENGAGEMENT NETWORK HEN 2.0
SEPTEMBER 2015 - 2016

SO WHAT IS A HEN ANYWAY?
• Improvement collaborative
• Best-practice incubator
• Community of peers
• Learning cohort
• Quality improvement (QI)
• Clinical content
• Standardized measures and accelerated timeframes

WHY JOIN A COLLABORATIVE?
Best deployed when there is a gap between accepted best practice and current practice
Collaboratives allow participants to:
Spread evidence-based best practices
Shared learning via virtual events
Monitor outcomes through data
Rapid Cycle Improvement (PDSA)
Achieve ambitious project goals…

HEN 2.0 PROJECT GOALS
Reduce Harm by 40%
Reduce Preventable Readmissions by 20%
…by September 23, 2016
3 operational metric categories:
Patient and family engagement
Health care disparities
Engaging leadership and governance
Adverse Event Areas
• Adverse Drug Events (ADE) • Injuries from Falls
• Central Line-Associated Blood Stream Infections (CLABSI)
• Catheter-Associated Urinary Tract Infection (CAUTI)
• Ventilator Associated Events (VAP)
• Venous Thromboembolism (VTE)
• Pressure Ulcers (PrU) • Surgical Site Infections
• Obstetrical (OB) Harm and Early Elective Deliveries (EED)
• Readmissions
• Airway Safety • Clostridium difficile (C. diff.), including antibiotic stewardship
• Culture of Safety, fully integrates patient safety with worker safety
• Severe Sepsis and Septic Shock 12

HOW WILL WE IMPROVE? IMPROVEMENT STRATEGIES

VHHA HEN
36 hospitals committed
Elizabeth City, NC

HOW DO WE KNOW THERE’S A NEED TO IMPROVE?
Perform needs
assessment
Collect baseline
data
Perform gap analysis
Develop change package

IMPROVEMENT STRATEGIES
Education plan: emphasize implementation and doing work instead of planning to do work
Site Visits – Gemba walk!
Measurement System
Access to experts
Listserv & website
Change packages!
Peer to Peer Learning:
IHI Model for Improvement
Our Members!
What have you tried?
What worked?
What were your barriers?
What can your network team help you to overcome?

CONNECTING TO RESOURCES
Webinars for each topic from national advisors
Facilitation of networking and shared learning
VHHA In-person events with Subject Matter Experts
Coaching calls
Regular interaction to keep pace with goals

HOW WILL WE KNOW CHANGE IS AN IMPROVEMENT? MEASUREMENT SYSTEM

USING DATA…
Encyclopedia of Measures
Baseline data collected for each measure
Monthly monitoring data
Real-time improvement
Database allows for graphs, benchmarking, comparisons, and relative reductions

RESULTS NATIONAL AND VIRGINIA HEN RESULTS

WHAT DOES THE AHA/HRET HEN 2.0 PROJECT LOOK LIKE?
1,500+ hospitals across 33 states and one region
Spanning 5 time zones (PR to AK)

HEN 2.0 – HOSPITAL CHARACTERISTICS
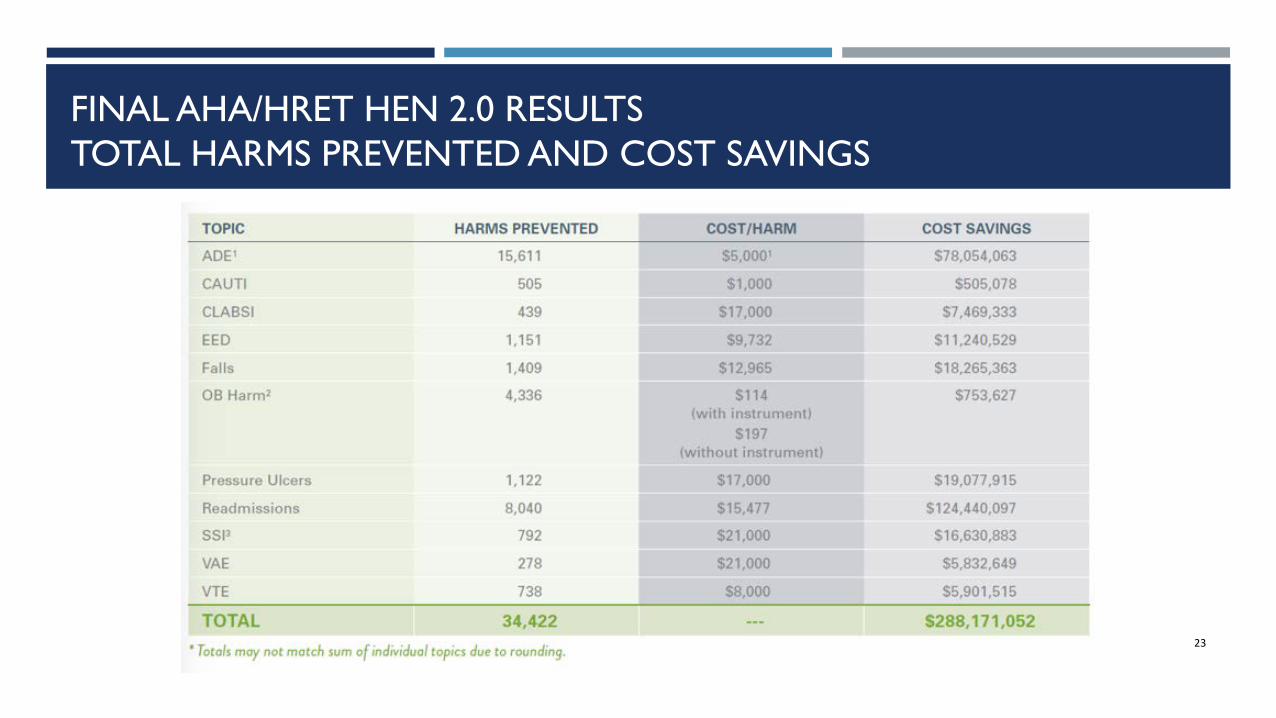
FINAL AHA/HRET HEN 2.0 RESULTS TOTAL HARMS PREVENTED AND COST SAVINGS
23

FINAL AHA/HRET HEN 2.0 RESULTS
Core Harm Topic / Measure Hospitals (%)
Reporting Data at Baseline1
Baseline Rate
Apr – Jun 2016 Rate
Relative Improvement2
HEN 1 Ending Rate3
HEN 2.0 Performance Benchmark4
OB Harm: Vaginal deliveries without instrument 719 (94%) 21.56 10.91 -49% 19.53 N/A
Early Elective Deliveries (EED) 722 (94%) 4.02 2.24 -44% 4.89 2.00 PrU: Pressure Ulcer Rate (Stage 3+) 1137 (88%) 1.60 0.91 -43% 1.21 1.49 VTE: Post-Operative Venous Thromboembolism (VTE) 911 (93%) 4.51 2.99 -34% 4.35 N/A
SSI: Surgical site infection rate, all procedures reported 907 (93%) 2.01 1.59 -21% N/A N/A
VAE: Infection-Related Ventilator-Associated Condition (IVAC) Rate 776 (92%) 1.40 1.20 -14% 1.52 N/A
ADE: Adverse drug events, all ADEs reported 1,005 (78%) 1.63 1.44 -12% N/A N/A
CLABSI:Central line-associated blood stream infections per 1,000 central line days
1,007 (98%) 1.00 0.89 -11% N/A 0.21
Falls: Falls w/Injury 1,230 (96%) 0.64 0.60 -5% 0.64 0.50 Readmissions: All-cause, 30-day readmissions 1,225 (95%) 8.51 8.14 -4% 8.78 N/A
CAUTI: Catheter-associated urinary tract infections per 1,000 catheter days
1,260 (98%) 1.02 0.98 -4% N/A 0.27
24
1 The percent reporting represents the number of hospitals reporting baseline data divided by the number of hospitals expected to report data for the topic and/or measure. For example, non-OB hospitals are not expected to report data on EED or OB Harm.
2 Relative improvement calculates baseline compared to the most recent available three-month rate (Apr – Jun 2016).
3 Most current available three-month rate at the end of HEN 1.
4 HEN 2.0 performance benchmarks as released by the Evaluation Contractor September 132016 (PfPPEC_Benchmarks_Sept_2016.xlsx)

VIRGINIA HEN BY NUMBERS
36 • Active Virginia participants
24 • VHHA-provided educational programs
4
• In-person learning sessions • Readmissions & C. difficile • Sepsis • HRO pre-summit event • Patient & Family Engagement
10 • Virtual Shared Learning Events

VIRGINIA HEN RESULTS
199
368
258
311
130
229 194
237
-
50
100
150
200
250
300
350
400
Oct Nov Dec Jan Feb Mar Apr May
Num
ber
of H
arm
s Pr
even
ted
Monitoring Month
Harms Prevented by Month
Number of Harms Prevented
Total Harms Prevented: 1,851 Total Cost Savings: $16,585,917

VIRGINIA RESULTS BY TOPIC
STATE AGGREGATE TOPIC-LEVEL ACHIEVEMENT
NOTE: A topic is considered met if the relative reduction is 17.6% or better (12% or better for readmissions)
Baseline Rate Most Current Q Rate (Mar - May 2016)
Relative reduction
Baseline Data Submission
May Data Submission
ADE 1.67 1.97 18.2% 81% 58% CAUTI 1.17 1.05 -10.1% 97% 100% CLABSI 0.93 0.75 -19.2% 97% 100% EED 2.72 1.25 -54.0% 96% 96% Falls 0.50 0.54 6.7% 97% 83% OB Harm 23.45 6.93 -70.4% 96% 44% PrU (1) 11.96 0.53 -95.6% 106% 52% Read 3.72 4.15 11.7% 97% 8% SSI 2.07 1.95 -5.5% 94% 103% VAE 6.08 5.35 -12.1% 97% 100% VTE 8.28 4.36 -47.3% 97% 46% CDI 0.74 0.88 19.1% 97% 100% SEPSIS 65.77 64.40 -2.1% 11% 8%
We still have work to do!

HOSPITAL ACHIEVEMENTS
10
21 21 22 20 21
30
8
20
26
21
Num
ber
of H
ospi
tals
Mee
ting
Goa
l
Number of Hospitals Achieving ≥ 40% Reduction of Harm (20% for Readmissions)
NOTE: Hospital-level achievement is assessed comparing aggregate data (October 2015 – August 2016) from baseline

THE POWER OF STORIES…

NEXT STEPS HEN UNDERGOES A TRANSFORMATION!
