virginia’s offshore wind resource: size, economics, and
TRANSCRIPT

Virginia’s Offshore Wind Resource:Size, Economics, and Future Development
Virginia’s Offshore Wind Resource:Size, Economics, and Future Development
George Hagerman
VCERC Director of Research Virginia Tech Advanced Research Institute4300 Wilson Blvd., Suite 750Arlington, VA 22203
Email: [email protected]: 703-387-6030
Virginia Commission on Energy and Environment
Richmond, VA
18 August 2009

Virginia’s Realistic Near-TermOffshore Wind Development Potential

Greatest Near-Term Mid-Atlantic Offshore Wind Potential is off Dominion’s VA-NC Service Area

GIS Analysis and Mapping of Resource
• Focus on 50 MMS lease blocks and avoid all excluded areas
MMS lease blocks are4.8 km x 4.8 km, with each block having 7 x 7 turbines.
Turbines spaced 685 mapart (7.6 rotor diameters)
Each lease block could contain 49 turbines
= 147 MW per block withVestas model V-90 3 MW
= 6.4 MW per km2
GIS layers and calculations by James Madison University

Class 6 Winds areLargely Beyond the Visual Horizon
Beyond the Territorial Sea Limit of 12 n.mi., turbines wouldbe barely visible, and then only on the clearest days.
12 n.mi.
Photo simulation of Long Island offshore wind project
Total available area of Class 6 beyond 12 n.mi. is 575.6 sq.km(142,500 acres); could support 3,680 MW ofwind capacity.

Preliminary GIS Calculations
• At density of 6.4 MW per km2, could support ~4.5 GW, avoiding all excluded areas
TOTAL
235 km2
595 km2
374 km2
131 km2
Assuming capacity factors of 35% for Class 5 and 40% for Class 6, annual generation potential is ~5,500 and ~14,100 GWh/yr from Class 5 and Class 6 areas, respectively.

Near-Term Offshore Wind Generation PotentialCompared with Virginia’s Other Electricity Sources
At 17,900 GWh per year, offshore wind powerin non-excluded areas within 50 MMS lease blocks off Virginia Beach has the potential to become Virginia’s third largest electricity source.

Offshore Wind ProjectLayout and Construction
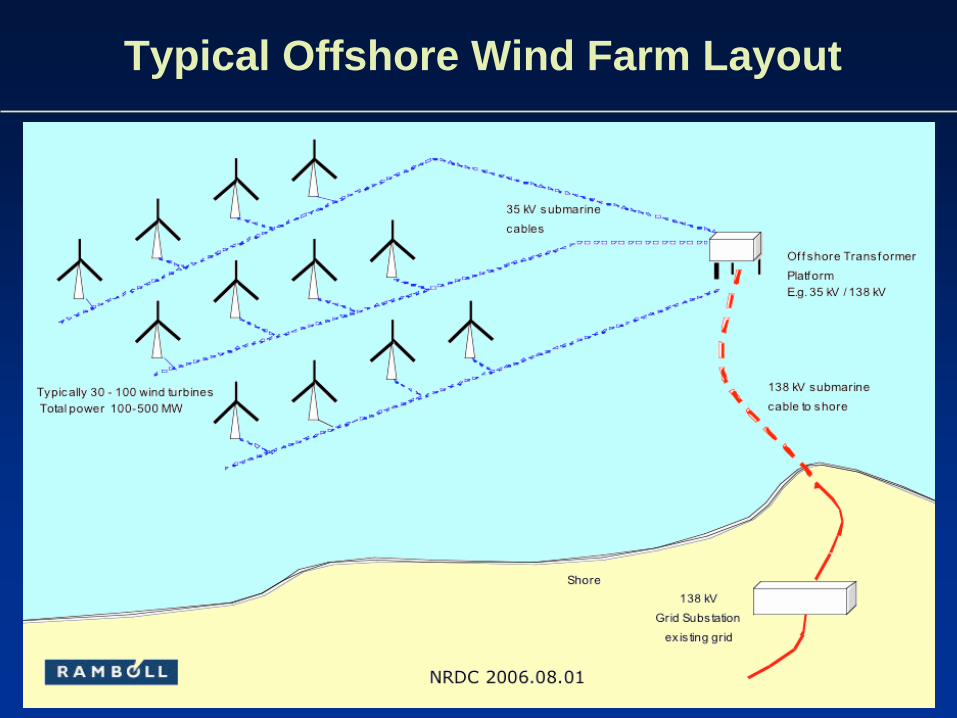
Typical Offshore Wind Farm Layout
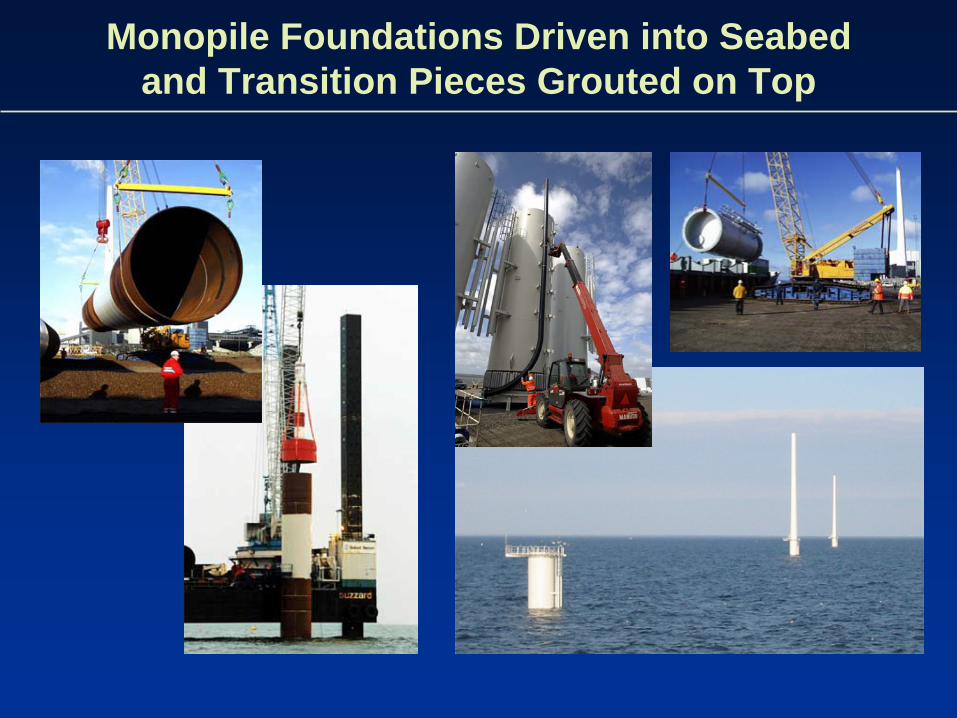
Monopile Foundations Driven into Seabedand Transition Pieces Grouted on Top

Horns Rev 2-MW TurbinesInstalled Using Self-Propelled A2 SEA Vessels

North Hoyle 2-MW TurbinesInstalled Using Towed Seacore Jack-Up Rigs
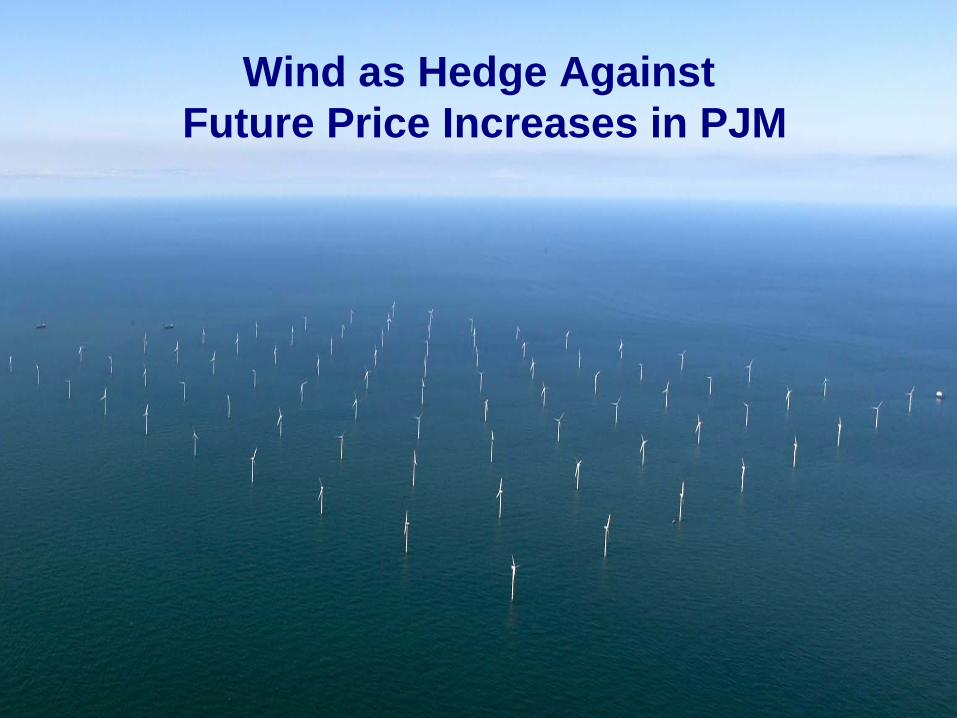
Wind as Hedge Against Future Price Increases in PJM

PJM Energizes About One-Fifthof the U.S. Gross Domestic Product

Financial Assumptions
• Taxes and depreciation• Composite tax rate: 38.8% (35% Federal, 5.85% State)• General depreciation declining balance is used
– GDS life of 15 years for conventional fuels– GDS life of 5 years (bonus depreciation) for wind
• Project financing• 100% of the plant is financed up front
– 43.2% Debt and 56.8% Equity– Debt interest rate: 5.586%– Equity rate of return: 13.75% common, 7.174% preferred– Includes 3-year construction loan (7.5% debt rate)
• Debt is paid monthly, equity quarterly• Financing term: 25 years• Service life: 25 years for gas, wind; 50 years for coal

Buckingham CountyCombined Cycle Gas-Fired Project
• Capital cost basis• As published in PUE-2008-00014 (Filed 03/11/2008)• Plant Cost $614 million• Transmission Cost $5.1 million
• 580 MW rated capacity
• 89.9% annual operational capacity factor
• Plant heat rate: 6.09 MMBtu per MWhr
• 25 plant operators
• Emissions• CO2 1,829,088 ton/year• Nox 178 ton/year
• Actual in-service date: 2011(used 2012 for all projects)
Possum Point #6

Wise County Coal-Fired Project• Capital cost basis
• As published in PUE-2007-00066 (Filed 03/31/2008)& PUE-2007-00111 (Filed 12/03/2007)
• Plant Cost $1.8 billion• Transmission Cost $23 million
• 585 MW rated capacity• 98.9% annual operational capacity factor• Plant heat rate: 10.00 MMBtu per MWhr• Coal heat content: 15.4 MMBTU per short ton• 75 plant operators• Emissions
• CO2 4,838,060 ton/year• NOx 1,755 ton/year• SOx 3,009 ton/year
• Actual in-service date: 2013(used 2012 for all projects)
Virginia City Hybrid Energy Center

V90-3MW Offshore Wind Project
Capital cost estimated in March 2008 dollars using Virginia maritime supplier bids and published data• Plant cost at offshore busbar : $ 1,748 million
• Transmission cost to Fentress : $ 153 million
• Total plant investment : $ 1,901 million (~ $3,230 / kW)
588 MW installedrated capacity
38% annualcapacity factor
20% PJM capacity factor
Kentish Flats

Projected Coal Prices by 2012

New Offshore Wind Compared with New Coal

Delivered Coal PricesAlready Seem to Exceed Projections

Projected Natural Prices by 2012

New Offshore Wind Compared with New CCGT

NERA Study of Fossil Generation Portfolio in PJM

NERA Study of Fossil Generation Portfolio in PJM

PJM Long-Term Electricity Price Forecast
VCERC preliminary estimate of merchant power offshore wind Year 1bid price is ~$120/MWh

PJM Long-Term Electricity Price Forecast
VCERC preliminary estimate of merchant power offshore wind Year 1bid price is ~$120/MWh
Merchant offshore wind bilateral power purchase contracts for a weighted price of 1/3 on-peak and 2/3 off-peak likely to be competitive by 2017-2018 time frame

Anticipated CommercialDevelopment Timetable

Development of Greater Gabbard: 504 MW (UK)
From lease award to construction start = ~4.5 years
2.5 Year Build-Out
Onshore work starts: mid-2008
Offshore work starts: mid-2009
First phase power: mid-2010
Full project power: end 2011

Development of Horns Rev II: 209 MW (Denmark)
From lease award to construction start = ~2.5 years

Construction of Horns Rev II: 209 MW (Denmark)
From construction start to fully commissioned = 1.5 years

US Offshore Wind Commercial Projects
Atlantic Ocean
Gulf of Mexico
Cape Wind
W.E.S.T. LLC
Hull Municipal
Southern Company
Cuyahoga County
New Jersey
Delaware
Patriot Renewables
US Offshore Wind Projects
Project State MW
Cape Wind MA 468
Hull Municipal MA 15
Patriot Renewables MA 300
Rhode Island (OER) RI 400
New Jersey (BPU) NJ 350
Delmarva DE 350
Southern Company GA 10
W.E.S.T. TX 150
Cuyahoga County OH 20
Total MW 2,063
Rhode Island
Project in Federal Waters
Project in State Waters
US projects in offshore Atlanticwill require 1-2 years to obtain non-competitive commercial lease, 3-4 years to obtain competitive commercial lease. To this must be added 4-7 years for development and build-out of any large (350-500 MW) project.
VCERC has recommended that Governor form federal-state-local task force to guide MMS offshore wind leasing process such that projects can become operational at projected time of commercial viability, namely by 2017-2018
