virginiavirginia ˘˘ chesapeake baychesapeake bay finfish
TRANSCRIPT
2014 Final Report2014 Final Report2014 Final Report2014 Final ReportVirginia ∼ Chesapeake BayVirginia ∼ Chesapeake BayVirginia ∼ Chesapeake BayVirginia ∼ Chesapeake Bay
Finfish AgeingFinfish AgeingFinfish AgeingFinfish Ageingandandandand
Population AnalysisPopulation AnalysisPopulation AnalysisPopulation Analysis
Hongsheng Liao, Cynthia M. Jones,Hongsheng Liao, Cynthia M. Jones,& Jessica L. Gilmore& Jessica L. Gilmore
September 28, 2015September 28, 2015


2014 Final ReportVirginia and Chesapeake Bay Finfish
Ageing and Population Analysis
Hongsheng Liao, Cynthia M. Jones, & Jessica L. Gilmore
September 28, 2015
Center for Quantitative Fisheries EcologyOld Dominion University
800 West 46th StreetNorfolk, VA 23508
Funded by contract No. F-126-R-12 from the Virginia Saltwater RecreationalDevelopment Fund through the Virginia Marine Resources Commission

Contents
EXECUTIVE SUMMARY vii
ACKNOWLEDGEMENTS viii
1 ATLANTIC CROAKER Micropogonias undulatus 11.1 INTRODUCTION . . . . . . . . . . . . . . . . . . . . . . . . . . . . . . . . . 21.2 METHODS . . . . . . . . . . . . . . . . . . . . . . . . . . . . . . . . . . . . . 2
1.2.1 Sample size for ageing . . . . . . . . . . . . . . . . . . . . . . . . . . . 21.2.2 Handling of collections . . . . . . . . . . . . . . . . . . . . . . . . . . . 21.2.3 Preparation . . . . . . . . . . . . . . . . . . . . . . . . . . . . . . . . . 21.2.4 Readings . . . . . . . . . . . . . . . . . . . . . . . . . . . . . . . . . . 31.2.5 Comparison tests . . . . . . . . . . . . . . . . . . . . . . . . . . . . . . 4
1.3 RESULTS . . . . . . . . . . . . . . . . . . . . . . . . . . . . . . . . . . . . . . 41.3.1 Sample size . . . . . . . . . . . . . . . . . . . . . . . . . . . . . . . . . 41.3.2 Reading precision . . . . . . . . . . . . . . . . . . . . . . . . . . . . . . 41.3.3 Year class . . . . . . . . . . . . . . . . . . . . . . . . . . . . . . . . . . 51.3.4 Age-length key . . . . . . . . . . . . . . . . . . . . . . . . . . . . . . . 5
1.4 REFERENCES . . . . . . . . . . . . . . . . . . . . . . . . . . . . . . . . . . . 5
2 BLACK DRUM Pogonias cromis 112.1 INTRODUCTION . . . . . . . . . . . . . . . . . . . . . . . . . . . . . . . . . 122.2 METHODS . . . . . . . . . . . . . . . . . . . . . . . . . . . . . . . . . . . . . 12
2.2.1 Handling of collections . . . . . . . . . . . . . . . . . . . . . . . . . . . 122.2.2 Preparation . . . . . . . . . . . . . . . . . . . . . . . . . . . . . . . . . 122.2.3 Readings . . . . . . . . . . . . . . . . . . . . . . . . . . . . . . . . . . 122.2.4 Comparison tests . . . . . . . . . . . . . . . . . . . . . . . . . . . . . . 13
2.3 RESULTS . . . . . . . . . . . . . . . . . . . . . . . . . . . . . . . . . . . . . . 142.3.1 Reading precision . . . . . . . . . . . . . . . . . . . . . . . . . . . . . . 142.3.2 Year class . . . . . . . . . . . . . . . . . . . . . . . . . . . . . . . . . . 142.3.3 Age-length key . . . . . . . . . . . . . . . . . . . . . . . . . . . . . . . 14
2.4 REFERENCES . . . . . . . . . . . . . . . . . . . . . . . . . . . . . . . . . . . 15
3 BLUEFISH Pomatomus saltatrix 193.1 INTRODUCTION . . . . . . . . . . . . . . . . . . . . . . . . . . . . . . . . . 20
i
CONTENTS
3.2 METHODS . . . . . . . . . . . . . . . . . . . . . . . . . . . . . . . . . . . . . 203.2.1 Sample size for ageing . . . . . . . . . . . . . . . . . . . . . . . . . . . 203.2.2 Handling of collections . . . . . . . . . . . . . . . . . . . . . . . . . . . 203.2.3 Preparation . . . . . . . . . . . . . . . . . . . . . . . . . . . . . . . . . 203.2.4 Readings . . . . . . . . . . . . . . . . . . . . . . . . . . . . . . . . . . 213.2.5 Comparison tests . . . . . . . . . . . . . . . . . . . . . . . . . . . . . . 22
3.3 RESULTS . . . . . . . . . . . . . . . . . . . . . . . . . . . . . . . . . . . . . . 233.3.1 Sample size . . . . . . . . . . . . . . . . . . . . . . . . . . . . . . . . . 233.3.2 Reading precision . . . . . . . . . . . . . . . . . . . . . . . . . . . . . . 233.3.3 Year class . . . . . . . . . . . . . . . . . . . . . . . . . . . . . . . . . . 233.3.4 Age-length key . . . . . . . . . . . . . . . . . . . . . . . . . . . . . . . 24
3.4 REFERENCES . . . . . . . . . . . . . . . . . . . . . . . . . . . . . . . . . . . 24
4 COBIA Rachycentron canadum 314.1 INTRODUCTION . . . . . . . . . . . . . . . . . . . . . . . . . . . . . . . . . 324.2 METHODS . . . . . . . . . . . . . . . . . . . . . . . . . . . . . . . . . . . . . 32
4.2.1 Handling of collections . . . . . . . . . . . . . . . . . . . . . . . . . . . 324.2.2 Preparation . . . . . . . . . . . . . . . . . . . . . . . . . . . . . . . . . 324.2.3 Readings . . . . . . . . . . . . . . . . . . . . . . . . . . . . . . . . . . 324.2.4 Comparison tests . . . . . . . . . . . . . . . . . . . . . . . . . . . . . . 33
4.3 RESULTS . . . . . . . . . . . . . . . . . . . . . . . . . . . . . . . . . . . . . . 344.3.1 Reading precision . . . . . . . . . . . . . . . . . . . . . . . . . . . . . . 344.3.2 Year class . . . . . . . . . . . . . . . . . . . . . . . . . . . . . . . . . . 344.3.3 Age-length key . . . . . . . . . . . . . . . . . . . . . . . . . . . . . . . 34
4.4 REFERENCES . . . . . . . . . . . . . . . . . . . . . . . . . . . . . . . . . . . 35
5 RED DRUM Sciaenops ocellatus 395.1 INTRODUCTION . . . . . . . . . . . . . . . . . . . . . . . . . . . . . . . . . 405.2 METHODS . . . . . . . . . . . . . . . . . . . . . . . . . . . . . . . . . . . . . 40
5.2.1 Handling of collections . . . . . . . . . . . . . . . . . . . . . . . . . . . 405.2.2 Preparation . . . . . . . . . . . . . . . . . . . . . . . . . . . . . . . . . 405.2.3 Readings . . . . . . . . . . . . . . . . . . . . . . . . . . . . . . . . . . 405.2.4 Comparison tests . . . . . . . . . . . . . . . . . . . . . . . . . . . . . . 41
5.3 RESULTS . . . . . . . . . . . . . . . . . . . . . . . . . . . . . . . . . . . . . . 425.3.1 Reading precision . . . . . . . . . . . . . . . . . . . . . . . . . . . . . . 425.3.2 Year class . . . . . . . . . . . . . . . . . . . . . . . . . . . . . . . . . . 425.3.3 Age-length key . . . . . . . . . . . . . . . . . . . . . . . . . . . . . . . 42
5.4 REFERENCES . . . . . . . . . . . . . . . . . . . . . . . . . . . . . . . . . . . 42
6 SHEEPSHEAD Archosargus probatocephalus 476.1 INTRODUCTION . . . . . . . . . . . . . . . . . . . . . . . . . . . . . . . . . 486.2 METHODS . . . . . . . . . . . . . . . . . . . . . . . . . . . . . . . . . . . . . 48
6.2.1 Handling of collections . . . . . . . . . . . . . . . . . . . . . . . . . . . 486.2.2 Preparation . . . . . . . . . . . . . . . . . . . . . . . . . . . . . . . . . 486.2.3 Readings . . . . . . . . . . . . . . . . . . . . . . . . . . . . . . . . . . 486.2.4 Comparison tests . . . . . . . . . . . . . . . . . . . . . . . . . . . . . . 49
6.3 RESULTS . . . . . . . . . . . . . . . . . . . . . . . . . . . . . . . . . . . . . . 506.3.1 Reading precision . . . . . . . . . . . . . . . . . . . . . . . . . . . . . . 50
ii

CONTENTS
6.3.2 Year class . . . . . . . . . . . . . . . . . . . . . . . . . . . . . . . . . . 506.3.3 Age-length key . . . . . . . . . . . . . . . . . . . . . . . . . . . . . . . 50
6.4 REFERENCES . . . . . . . . . . . . . . . . . . . . . . . . . . . . . . . . . . . 50
7 ATLANTIC SPADEFISH Chaetodipterus faber 557.1 INTRODUCTION . . . . . . . . . . . . . . . . . . . . . . . . . . . . . . . . . 567.2 METHODS . . . . . . . . . . . . . . . . . . . . . . . . . . . . . . . . . . . . . 56
7.2.1 Sample size for ageing . . . . . . . . . . . . . . . . . . . . . . . . . . . 567.2.2 Handling of collections . . . . . . . . . . . . . . . . . . . . . . . . . . . 567.2.3 Preparation . . . . . . . . . . . . . . . . . . . . . . . . . . . . . . . . . 567.2.4 Readings . . . . . . . . . . . . . . . . . . . . . . . . . . . . . . . . . . 577.2.5 Comparison tests . . . . . . . . . . . . . . . . . . . . . . . . . . . . . . 58
7.3 RESULTS . . . . . . . . . . . . . . . . . . . . . . . . . . . . . . . . . . . . . . 587.3.1 Sample size . . . . . . . . . . . . . . . . . . . . . . . . . . . . . . . . . 587.3.2 Reading precision . . . . . . . . . . . . . . . . . . . . . . . . . . . . . . 587.3.3 Year class . . . . . . . . . . . . . . . . . . . . . . . . . . . . . . . . . . 597.3.4 Age-length key . . . . . . . . . . . . . . . . . . . . . . . . . . . . . . . 59
7.4 REFERENCES . . . . . . . . . . . . . . . . . . . . . . . . . . . . . . . . . . . 59
8 SPANISH MACKEREL Scomberomorous maculatus 638.1 INTRODUCTION . . . . . . . . . . . . . . . . . . . . . . . . . . . . . . . . . 648.2 METHODS . . . . . . . . . . . . . . . . . . . . . . . . . . . . . . . . . . . . . 64
8.2.1 Sample size for ageing . . . . . . . . . . . . . . . . . . . . . . . . . . . 648.2.2 Handling of collections . . . . . . . . . . . . . . . . . . . . . . . . . . . 648.2.3 Preparation . . . . . . . . . . . . . . . . . . . . . . . . . . . . . . . . . 648.2.4 Readings . . . . . . . . . . . . . . . . . . . . . . . . . . . . . . . . . . 658.2.5 Comparison tests . . . . . . . . . . . . . . . . . . . . . . . . . . . . . . 66
8.3 RESULTS . . . . . . . . . . . . . . . . . . . . . . . . . . . . . . . . . . . . . . 668.3.1 Sample size . . . . . . . . . . . . . . . . . . . . . . . . . . . . . . . . . 668.3.2 Reading precision . . . . . . . . . . . . . . . . . . . . . . . . . . . . . . 668.3.3 Year class . . . . . . . . . . . . . . . . . . . . . . . . . . . . . . . . . . 678.3.4 Age-length key . . . . . . . . . . . . . . . . . . . . . . . . . . . . . . . 67
8.4 REFERENCES . . . . . . . . . . . . . . . . . . . . . . . . . . . . . . . . . . . 67
9 SPOT Leiostomus xanthurus 719.1 INTRODUCTION . . . . . . . . . . . . . . . . . . . . . . . . . . . . . . . . . 729.2 METHODS . . . . . . . . . . . . . . . . . . . . . . . . . . . . . . . . . . . . . 72
9.2.1 Sample size for ageing . . . . . . . . . . . . . . . . . . . . . . . . . . . 729.2.2 Handling of collections . . . . . . . . . . . . . . . . . . . . . . . . . . . 729.2.3 Preparation . . . . . . . . . . . . . . . . . . . . . . . . . . . . . . . . . 729.2.4 Readings . . . . . . . . . . . . . . . . . . . . . . . . . . . . . . . . . . 739.2.5 Comparison tests . . . . . . . . . . . . . . . . . . . . . . . . . . . . . . 74
9.3 RESULTS . . . . . . . . . . . . . . . . . . . . . . . . . . . . . . . . . . . . . . 749.3.1 Sample size . . . . . . . . . . . . . . . . . . . . . . . . . . . . . . . . . 749.3.2 Reading precision . . . . . . . . . . . . . . . . . . . . . . . . . . . . . . 749.3.3 Year class . . . . . . . . . . . . . . . . . . . . . . . . . . . . . . . . . . 759.3.4 Age-length key . . . . . . . . . . . . . . . . . . . . . . . . . . . . . . . 75
9.4 REFERENCES . . . . . . . . . . . . . . . . . . . . . . . . . . . . . . . . . . . 75
iii

CONTENTS
10 SPOTTED SEATROUT Cynoscion nebulosus 7910.1 INTRODUCTION . . . . . . . . . . . . . . . . . . . . . . . . . . . . . . . . . 8010.2 METHODS . . . . . . . . . . . . . . . . . . . . . . . . . . . . . . . . . . . . . 80
10.2.1 Sample size for ageing . . . . . . . . . . . . . . . . . . . . . . . . . . . 8010.2.2 Handling of collections . . . . . . . . . . . . . . . . . . . . . . . . . . . 8010.2.3 Preparation . . . . . . . . . . . . . . . . . . . . . . . . . . . . . . . . . 8010.2.4 Readings . . . . . . . . . . . . . . . . . . . . . . . . . . . . . . . . . . 8110.2.5 Comparison tests . . . . . . . . . . . . . . . . . . . . . . . . . . . . . . 82
10.3 RESULTS . . . . . . . . . . . . . . . . . . . . . . . . . . . . . . . . . . . . . . 8210.3.1 Sample size . . . . . . . . . . . . . . . . . . . . . . . . . . . . . . . . . 8210.3.2 Reading precision . . . . . . . . . . . . . . . . . . . . . . . . . . . . . . 8210.3.3 Year class . . . . . . . . . . . . . . . . . . . . . . . . . . . . . . . . . . 8210.3.4 Age-length key . . . . . . . . . . . . . . . . . . . . . . . . . . . . . . . 83
10.4 REFERENCES . . . . . . . . . . . . . . . . . . . . . . . . . . . . . . . . . . . 83
11 STRIPED BASS Morone saxatilis 8711.1 INTRODUCTION . . . . . . . . . . . . . . . . . . . . . . . . . . . . . . . . . 8811.2 METHODS . . . . . . . . . . . . . . . . . . . . . . . . . . . . . . . . . . . . . 88
11.2.1 Sample size for ageing . . . . . . . . . . . . . . . . . . . . . . . . . . . 8811.2.2 Handling of collection . . . . . . . . . . . . . . . . . . . . . . . . . . . 8811.2.3 Preparation . . . . . . . . . . . . . . . . . . . . . . . . . . . . . . . . . 8911.2.4 Readings . . . . . . . . . . . . . . . . . . . . . . . . . . . . . . . . . . 8911.2.5 Comparison Tests . . . . . . . . . . . . . . . . . . . . . . . . . . . . . . 92
11.3 RESULTS . . . . . . . . . . . . . . . . . . . . . . . . . . . . . . . . . . . . . . 9211.3.1 Sample size . . . . . . . . . . . . . . . . . . . . . . . . . . . . . . . . . 9211.3.2 Scales . . . . . . . . . . . . . . . . . . . . . . . . . . . . . . . . . . . . 9311.3.3 Otoliths . . . . . . . . . . . . . . . . . . . . . . . . . . . . . . . . . . . 9411.3.4 Comparison of scale and otolith ages . . . . . . . . . . . . . . . . . . . 9411.3.5 Age-Length-Key (ALK) . . . . . . . . . . . . . . . . . . . . . . . . . . 95
11.4 RECOMMENDATIONS . . . . . . . . . . . . . . . . . . . . . . . . . . . . . . 9511.5 REFERENCES . . . . . . . . . . . . . . . . . . . . . . . . . . . . . . . . . . . 95
12 SUMMER FLOUNDER Paralichthys dentatus 10512.1 INTRODUCTION . . . . . . . . . . . . . . . . . . . . . . . . . . . . . . . . . 10612.2 METHODS . . . . . . . . . . . . . . . . . . . . . . . . . . . . . . . . . . . . . 106
12.2.1 Sample size for ageing . . . . . . . . . . . . . . . . . . . . . . . . . . . 10612.2.2 Handling of collection . . . . . . . . . . . . . . . . . . . . . . . . . . . 10612.2.3 Preparation . . . . . . . . . . . . . . . . . . . . . . . . . . . . . . . . . 10712.2.4 Readings . . . . . . . . . . . . . . . . . . . . . . . . . . . . . . . . . . 10712.2.5 Comparison Tests . . . . . . . . . . . . . . . . . . . . . . . . . . . . . . 110
12.3 RESULTS . . . . . . . . . . . . . . . . . . . . . . . . . . . . . . . . . . . . . . 11012.3.1 Sample size . . . . . . . . . . . . . . . . . . . . . . . . . . . . . . . . . 11012.3.2 Scales . . . . . . . . . . . . . . . . . . . . . . . . . . . . . . . . . . . . 11112.3.3 Otoliths . . . . . . . . . . . . . . . . . . . . . . . . . . . . . . . . . . . 11212.3.4 Comparison of scale and otolith ages . . . . . . . . . . . . . . . . . . . 11212.3.5 Age-Length-Key (ALK) . . . . . . . . . . . . . . . . . . . . . . . . . . 113
12.4 REFERENCES . . . . . . . . . . . . . . . . . . . . . . . . . . . . . . . . . . . 113
iv

CONTENTS
13 TAUTOG Tautoga onitis 12113.1 INTRODUCTION . . . . . . . . . . . . . . . . . . . . . . . . . . . . . . . . . 12213.2 METHODS . . . . . . . . . . . . . . . . . . . . . . . . . . . . . . . . . . . . . 122
13.2.1 Sample size for ageing . . . . . . . . . . . . . . . . . . . . . . . . . . . 12213.2.2 Handling of collection . . . . . . . . . . . . . . . . . . . . . . . . . . . 12213.2.3 Preparation . . . . . . . . . . . . . . . . . . . . . . . . . . . . . . . . . 12313.2.4 Readings . . . . . . . . . . . . . . . . . . . . . . . . . . . . . . . . . . 12313.2.5 Comparison Tests . . . . . . . . . . . . . . . . . . . . . . . . . . . . . . 125
13.3 RESULTS . . . . . . . . . . . . . . . . . . . . . . . . . . . . . . . . . . . . . . 12513.3.1 Sample size . . . . . . . . . . . . . . . . . . . . . . . . . . . . . . . . . 12513.3.2 Opercula . . . . . . . . . . . . . . . . . . . . . . . . . . . . . . . . . . 12513.3.3 Otoliths . . . . . . . . . . . . . . . . . . . . . . . . . . . . . . . . . . . 12613.3.4 Comparison of operculum and otolith ages . . . . . . . . . . . . . . . . 12713.3.5 Age-Length-Key (ALK) . . . . . . . . . . . . . . . . . . . . . . . . . . 128
13.4 REFERENCES . . . . . . . . . . . . . . . . . . . . . . . . . . . . . . . . . . . 128
14 WEAKFISH Cynoscion regalis 13714.1 INTRODUCTION . . . . . . . . . . . . . . . . . . . . . . . . . . . . . . . . . 13814.2 METHODS . . . . . . . . . . . . . . . . . . . . . . . . . . . . . . . . . . . . . 138
14.2.1 Sample size for ageing . . . . . . . . . . . . . . . . . . . . . . . . . . . 13814.2.2 Handling of collections . . . . . . . . . . . . . . . . . . . . . . . . . . . 13814.2.3 Preparation . . . . . . . . . . . . . . . . . . . . . . . . . . . . . . . . . 13814.2.4 Readings . . . . . . . . . . . . . . . . . . . . . . . . . . . . . . . . . . 13914.2.5 Comparison tests . . . . . . . . . . . . . . . . . . . . . . . . . . . . . . 140
14.3 RESULTS . . . . . . . . . . . . . . . . . . . . . . . . . . . . . . . . . . . . . . 14014.3.1 Sample size . . . . . . . . . . . . . . . . . . . . . . . . . . . . . . . . . 14014.3.2 Reading precision . . . . . . . . . . . . . . . . . . . . . . . . . . . . . . 14014.3.3 Year class . . . . . . . . . . . . . . . . . . . . . . . . . . . . . . . . . . 14114.3.4 Age-length key . . . . . . . . . . . . . . . . . . . . . . . . . . . . . . . 141
14.4 REFERENCES . . . . . . . . . . . . . . . . . . . . . . . . . . . . . . . . . . . 141
v

EXECUTIVE SUMMARY
In this report we present the ageing results of 14 finfish species collected from commercial andrecreational catches made in the Chesapeake Bay and Virginia waters of the Atlantic Ocean,U.S.A. in 2014. All fish were collected by the Virginia Marine Resources Commission’s(VMRC) Stock Assessment Program and the Center for Quantitative Fisheries Ecology(CQFE) at Old Dominion University in 2014 and aged in 2015 at the Age and GrowthLaboratory of CQFE. This report is broken into chapters, one for each of the 14 species.We present measures of ageing precision, graphs of year-class distributions, and age-lengthkeys for each species.
Three calcified structures (hard-parts) are used in age determination. Specifically, two cal-cified structures were used for determining fish ages of the following three species: stripedbass, Morone saxatilis, (n = 856); summer flounder, Paralichthys dentatus, (n = 819);and tautog, Tautoga onitis, (n = 308). Scales and otoliths were used to age striped bassand summer flounder, opercula and otoliths were used to age tautog. Comparing alter-native hard-parts allowed us to assess their usefulness in determining fish age as well asthe relative precision of each structure. Ages were determined from otoliths only for thefollowing species: Atlantic croaker, Micropogonias undulatus, (n = 364); black drum, Pogo-nias cromis, (n = 123); bluefish, Pomatomus saltatrix, (n = 366); cobia, Rachycentroncanadum, (n = 287); red drum, Sciaenops ocellatus, (n = 80); sheepshead, Archosargusprobatocephalus, (n = 120); Atlantic spadefish, Chaetodipterus faber, (n = 288); Spanishmackerel, Scomberomorous maculates, (n = 236); spot, Leiostomus xanthurus, (n = 276);spotted seatrout, Cynoscion nebulosus, (n = 273); and weakfish, Cynoscion regalis, (n =295). In total, we made 10,926 age readings from scales, otoliths and opercula collectedduring 2014. A summary of the age ranges for all species aged is presented in Table 1.
In this report, we also present sample sizes and coefficient of variation (CV) for estimatesof age composition for the following species: Atlantic croaker, bluefish, spadefish, Spanishmackerel, spot, spotted seatrout, striped bass, summer flounder, tautog, and weakfish. Thesample sizes and the CVs enabled us to determine how many fish we needed to age in eachlength interval and to measure the precision for estimates of major age classes in each species,respectively, enhancing our efficiency and effectiveness on ageing those species.
To support environmental and wildlife agencies, and charities, we donated more than 2,529pounds of dissected fish to the Salvation Army to feed the homeless, and the Wildlife Re-sponse, Inc., a local wildlife rescue agency which is responsible for saving injured animalsfound by the public.
In 2014, we continued to upgrade our Age and Growth Laboratory website, which can beaccessed at http://odu.edu/sci/research/cqfe/research/ageing-lab. The websiteincludes an electronic version of this document and our previous VMRC final reportsfrom 2001 to 2013. The site also provides more detailed explanations of the methods andstructures we use in age determination.
vii
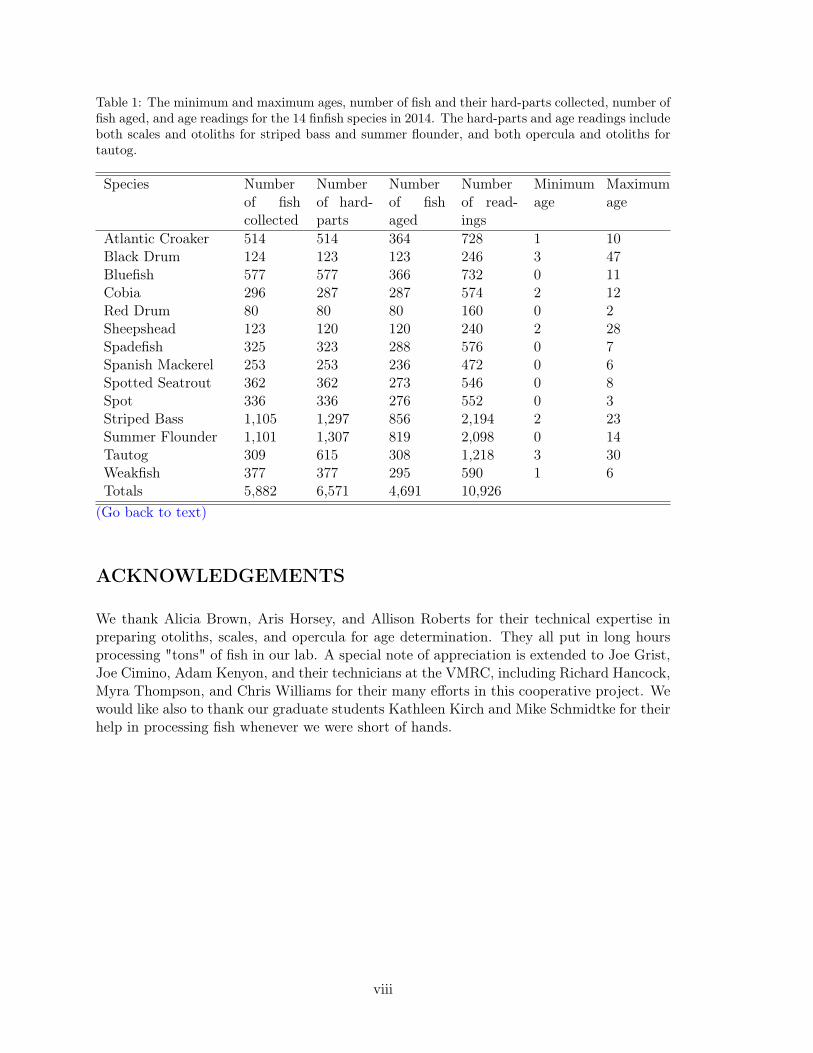
Table 1: The minimum and maximum ages, number of fish and their hard-parts collected, number offish aged, and age readings for the 14 finfish species in 2014. The hard-parts and age readings includeboth scales and otoliths for striped bass and summer flounder, and both opercula and otoliths fortautog.
Species Numberof fishcollected
Numberof hard-parts
Numberof fishaged
Numberof read-ings
Minimumage
Maximumage
Atlantic Croaker 514 514 364 728 1 10Black Drum 124 123 123 246 3 47Bluefish 577 577 366 732 0 11Cobia 296 287 287 574 2 12Red Drum 80 80 80 160 0 2Sheepshead 123 120 120 240 2 28Spadefish 325 323 288 576 0 7Spanish Mackerel 253 253 236 472 0 6Spotted Seatrout 362 362 273 546 0 8Spot 336 336 276 552 0 3Striped Bass 1,105 1,297 856 2,194 2 23Summer Flounder 1,101 1,307 819 2,098 0 14Tautog 309 615 308 1,218 3 30Weakfish 377 377 295 590 1 6Totals 5,882 6,571 4,691 10,926
(Go back to text)
ACKNOWLEDGEMENTS
We thank Alicia Brown, Aris Horsey, and Allison Roberts for their technical expertise inpreparing otoliths, scales, and opercula for age determination. They all put in long hoursprocessing "tons" of fish in our lab. A special note of appreciation is extended to Joe Grist,Joe Cimino, Adam Kenyon, and their technicians at the VMRC, including Richard Hancock,Myra Thompson, and Chris Williams for their many efforts in this cooperative project. Wewould like also to thank our graduate students Kathleen Kirch and Mike Schmidtke for theirhelp in processing fish whenever we were short of hands.
viii
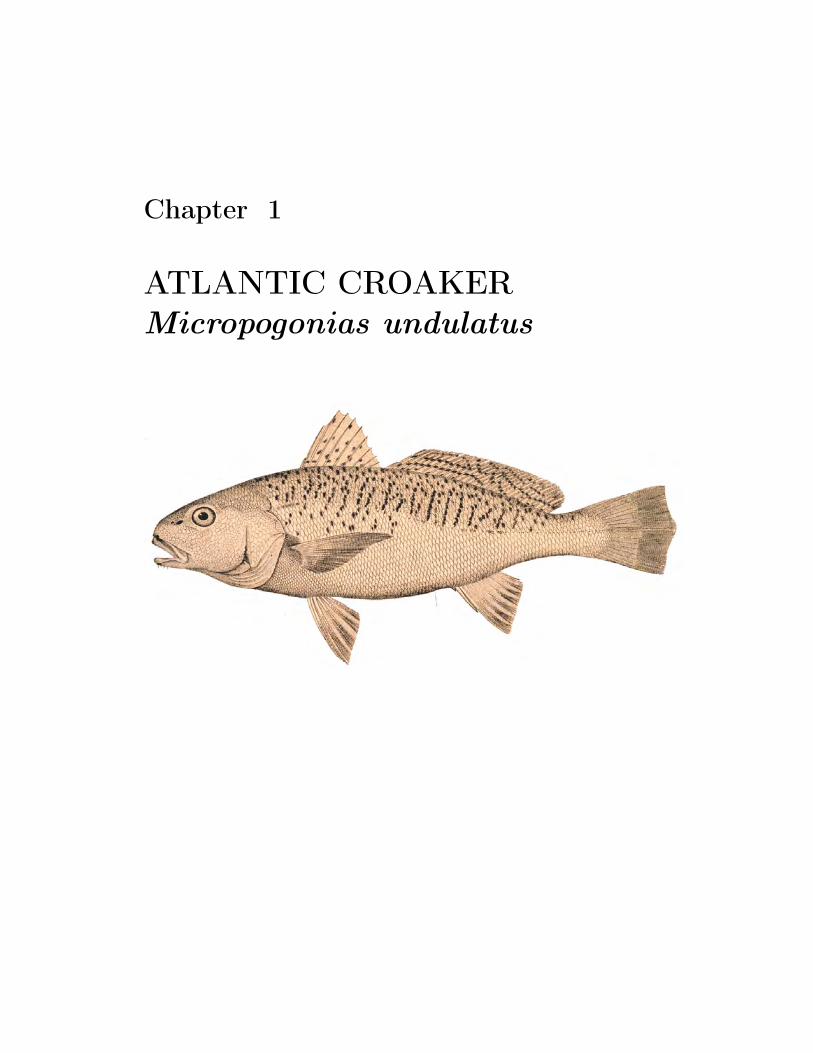
Chapter 1
ATLANTIC CROAKERMicropogonias undulatus

CHAPTER 1. ATLANTIC CROAKER MICROPOGONIAS UNDULATUS
1.1 INTRODUCTION
We aged a total of 364 Atlantic croaker,Micropogonias undulatus, collected by theVMRC’s Biological Sampling Program forage and growth analysis in 2014. Croakerages ranged from 1to 10 years old with anaverage age of 4.7, a standard deviation of1.8, and a standard error of 0.09. Ten ageclasses (1 to 10) were represented, compris-ing fish of the 2004 to 2013 year-classes.The sample was dominated by fish from theyear-classes of 2008 and 2010 with 28.8%and 26.6%, respectively.
1.2 METHODS
1.2.1 Sample size for ageing
We estimated sample size for ageingcroaker in 2014 using a two-stage ran-dom sampling method (Quinn and Deriso1999) to increase precision in estimatesof age composition from fish sampled effi-ciently and effectively. The basic equationis:
A =Va
θ2aCV2 +Ba/L
(1.1)
where A is the sample size for ageingcroaker in 2014; θa stands for the propor-tion of age a fish in a catch. Va and Barepresent variance components within andbetween length intervals for age a, respec-tively; CV is the coefficient of variation; Lwas the total number of croaker used byVMRC to estimate length distribution ofthe catches from 2008 to 2012. θa, Va, Ba,and CV were calculated using pooled age-length data of croaker collected from 2008to 2012 and using equations in Quinn andDeriso (1999). For simplicity, the equationsare not listed here. The equation (1.1) indi-cates that the more fish that are aged, thesmaller the CV (or higher precision) thatwill be obtained. Therefore, the criterion
to age A (number) of fish is that A shouldbe a number above which there is only a1% CV reduction for the most major age incatch by ageing an additional 100 or morefish. Finally, Al is A multiplied by the pro-portion of length interval l from the lengthdistribution of the 2008 to 2012 catch. Alis number of fish to be aged for length in-terval l in 2014.
1.2.2 Handling of collections
Otoliths were received by the Age & andGrowth Laboratory in labeled coin en-velopes, were sorted by date of capture.Their envelope labels were verified againstVMRC’s collection data, and each fish wasassigned a unique Age and Growth Labo-ratory identification number. All otolithswere stored dry in their original labeledcoin envelopes.
1.2.3 Preparation
Sagittal otoliths, hereafter, referred to as"otoliths", were processed for age deter-mination following the methods describedin Barbieri et al. (1994) with a fewmodifications. The left or right otolithwas randomly selected and attached, dis-tal side down, to a glass slide with clearCrystalbondTM 509 adhesive or imbeddedin epoxy. The otoliths were viewed by eyeand, when necessary, under a stereo micro-scope to identify the location of the core,and the position of the core was markedusing a pencil across the otolith surface.At least one transverse cross-section (here-after, referred to as "thin-section") wasthen removed from the marked core ofeach otolith using a Buehler IsoMetTM low-speed saw equipped with two, 3-inch di-ameter, Norton diamond grinding wheels(hereafter, referred to as "blades"), sepa-rated by a stainless steel spacer of 0.5 mm(diameter 2.5"). Thin-sections were placed
2
CHAPTER 1. ATLANTIC CROAKER MICROPOGONIAS UNDULATUS
on labeled glass slides and covered with athin layer of Flo-texx mounting mediumthat not only fixed the sections to the slide,but more importantly, provided enhancedcontrast and greater readability by increas-ing light transmission through the thin-sections.
Click here to obtain the protocol atthe CQFE website on how to prepareotolith thin-section for ageing Atlanticcroaker.
1.2.4 Readings
The CQFE system assigns an age class toa fish based on a combination of numberof annuli in a thin-section, the date of cap-ture, and the species-specific period whenthe annulus is deposited. Each year, asthe fish grows, its otoliths grow and leavebehind markers of their age, called an an-nulus. Technically, an otolith annulus isthe combination of both the opaque andthe translucent band. In practice, only theopaque bands are counted as annuli. Thenumber of annuli replaces "x" in our nota-tion below, and is the initial "age" assign-ment of the fish.
Second, the thin-section is examined fortranslucent growth. If no translucentgrowth is visible beyond the last annulus,the otolith is called "even" and no modi-fication of the assigned age is made. Theinitial assigned age, then, is the age class ofthe fish. Any growth beyond the last an-nulus can be interpreted as either being to-ward the next age class or within the sameage class. If translucent growth is visiblebeyond the last annulus, a "+" is added tothe notation.
By convention all fish in the NorthernHemisphere are assigned a birth date ofJanuary 1. In addition, each species hasa specific period during which it depositsthe annulus. If the fish is captured after
the end of the species-specific annulus de-position period and before January 1, it isassigned an age class notation of "x+x",where "x" is the number of annuli in thethin-section. If the fish is captured be-tween January 1 and the end of the species-specific annulus deposition period, it is as-signed an age class notation of "x+(x+1)".Thus, any growth beyond the last annulus,after its "birthday" but before the end ofannulus deposition period, is interpreted asbeing toward the next age class.
For example, Atlantic croaker otolith an-nulus formation occurs between April andMay (Barbieri et al. 1994a and b). Acroaker captured between January 1 andMay 31, before the end of the species’ an-nulus deposition period, with three visibleannuli and some translucent growth afterthe last annulus, would be assigned an ageclass of "x+(x+1)" or 3+(3+1), noted as3+4. This is the same age-class assignedto a fish with four visible annuli capturedafter the end of May 31, the period of an-nulus deposition, which would be noted as4+4.
All thin-sections were aged by two differentreaders using a Nikon SMZ1000 stereo mi-croscope under transmitted light and dark-field polarization at between 8 and 20 timesmagnification. Each reader aged all of theotolith samples.
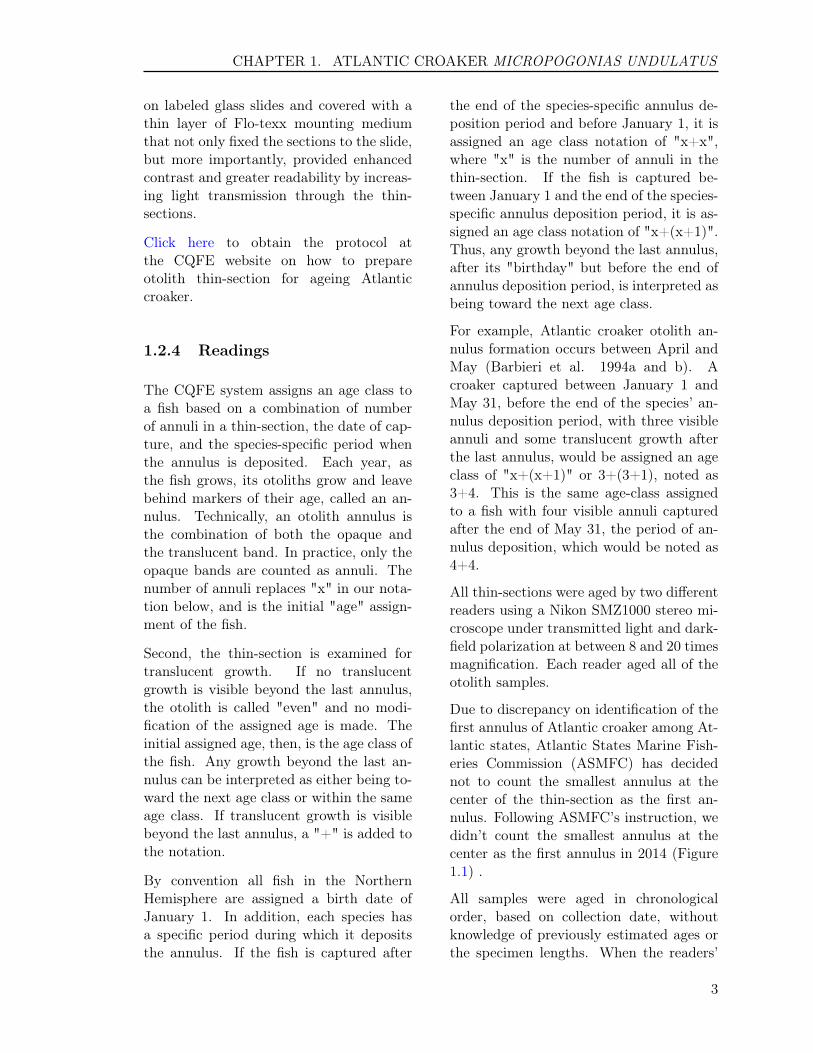
Due to discrepancy on identification of thefirst annulus of Atlantic croaker among At-lantic states, Atlantic States Marine Fish-eries Commission (ASMFC) has decidednot to count the smallest annulus at thecenter of the thin-section as the first an-nulus. Following ASMFC’s instruction, wedidn’t count the smallest annulus at thecenter as the first annulus in 2014 (Figure1.1) .
All samples were aged in chronologicalorder, based on collection date, withoutknowledge of previously estimated ages orthe specimen lengths. When the readers’
3

CHAPTER 1. ATLANTIC CROAKER MICROPOGONIAS UNDULATUS
Figure 1.1: Otolith thin-sections of a 8 year-old croaker without counting the smallest ringand with the last annulus on the edge of thethin-section
ages agreed, that age was assigned to thefish. When the two readers disagreed, bothreaders sat down together and re-aged thefish, again without any knowledge of pre-viously estimated ages or lengths, and as-signed a final age to the fish. When thereaders were unable to agree on a final age,the fish was excluded from further analy-sis.
Click here to obtain the protocol atthe CQFE website on how to age At-lantic croaker using their otolith thin-sections.
1.2.5 Comparison tests
A symmetry test (Hoenig et al. 1995)and coefficient of variation (CV) analysiswere used to detect any systematic differ-ence and precision on age readings, respec-tively, for the following comparisons: 1) be-tween the two readers in the current year,2) within each reader in the current year,and 3) time-series bias between the currentand previous years within each reader. Thereadings from the entire sample for the cur-rent year were used to examine the differ-ence between two readers. A random sub-sample of 50 fish from the current year wasselected for second readings to examine thedifference within a reader. Fifty otolithsrandomly selected from fish aged in 2003
were used to examine the time-series biaswithin each reader. A figure of 1:1 equiv-alence was used to illustrate those differ-ences (Campana et al. 1995). All statis-tics analyses were performed in R 2.15.2(R Core Team 2012).
1.3 RESULTS
1.3.1 Sample size
We estimated a sample size of 463 Atlanticcroaker in 2014, ranging in length intervalfrom 6 to 20 inches (Table 1.1). This sam-ple size provided a range in (CV) for agecomposition approximately from the small-est (CV) of 9% for age 4 to the largest(CV) of 21% for age 2. In 2014, we ran-domly selected and aged 364 fish from 514croaker collected by VMRC. We fell shortin our over-all collections for this optimallength-class sampling estimate by 104 fish.However, we were short of many fish fromthe major length intervals (The interval re-quires 10 or more fish), as a result, theprecision for the estimates of major agegroups would definitely be influenced sig-nificantly. Therefore, precaution should beused when developing ALK using these agedata.
1.3.2 Reading precision
Both readers had high self-precision.Specifically, there was no significant differ-ence between the first and second readingsfor Reader 1 with an agreement of 98% anda CV of 0.3% (test of symmetry: χ2 = 1, df= 1, P = 0.3173), and there was no signifi-cant difference between the first and secondreadings for Reader 2 with an agreementof 94% and a CV of 1.4% (test of symme-try: χ2 = 3, df = 2, P = 0.2231). Therewas no evidence of systematic disagreementbetween Reader 1 and Reader 2 with anagreement of 96.7% and a CV of 0.6% (test
4
CHAPTER 1. ATLANTIC CROAKER MICROPOGONIAS UNDULATUS
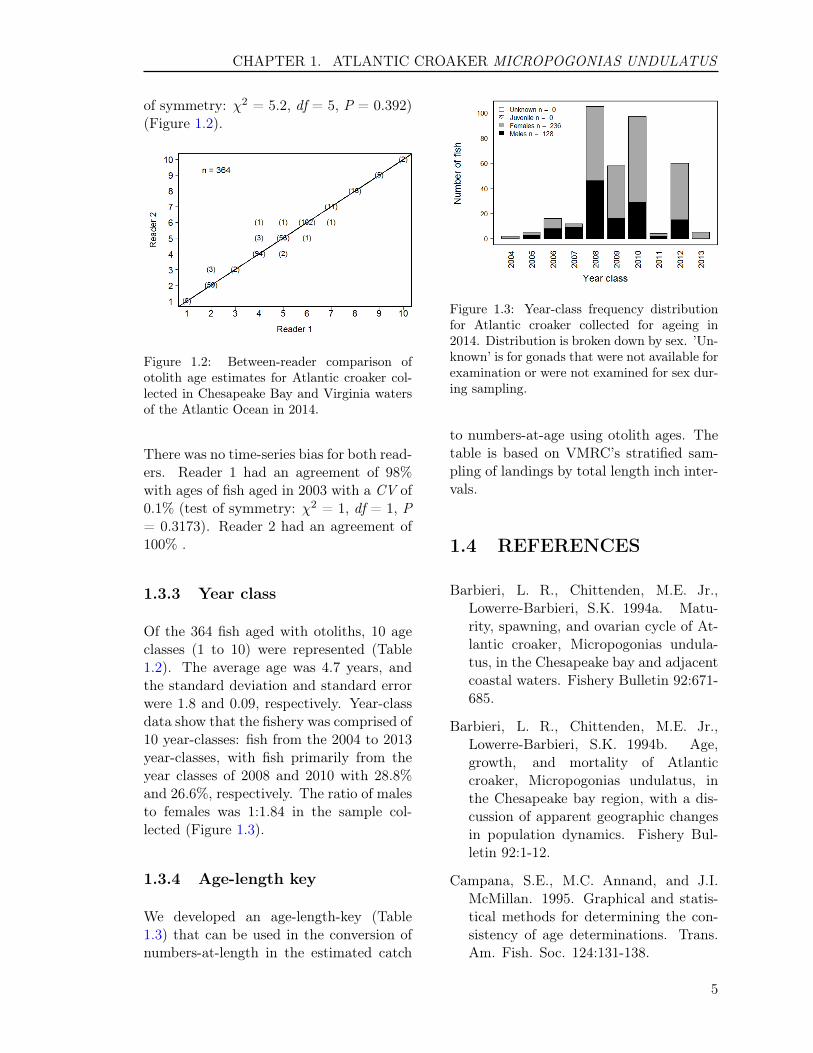
of symmetry: χ2 = 5.2, df = 5, P = 0.392)(Figure 1.2).
Figure 1.2: Between-reader comparison ofotolith age estimates for Atlantic croaker col-lected in Chesapeake Bay and Virginia watersof the Atlantic Ocean in 2014.
There was no time-series bias for both read-ers. Reader 1 had an agreement of 98%with ages of fish aged in 2003 with a CV of0.1% (test of symmetry: χ2 = 1, df = 1, P= 0.3173). Reader 2 had an agreement of100% .
1.3.3 Year class
Of the 364 fish aged with otoliths, 10 ageclasses (1 to 10) were represented (Table1.2). The average age was 4.7 years, andthe standard deviation and standard errorwere 1.8 and 0.09, respectively. Year-classdata show that the fishery was comprised of10 year-classes: fish from the 2004 to 2013year-classes, with fish primarily from theyear classes of 2008 and 2010 with 28.8%and 26.6%, respectively. The ratio of malesto females was 1:1.84 in the sample col-lected (Figure 1.3).
1.3.4 Age-length key
We developed an age-length-key (Table1.3) that can be used in the conversion ofnumbers-at-length in the estimated catch
Figure 1.3: Year-class frequency distributionfor Atlantic croaker collected for ageing in2014. Distribution is broken down by sex. ’Un-known’ is for gonads that were not available forexamination or were not examined for sex dur-ing sampling.
to numbers-at-age using otolith ages. Thetable is based on VMRC’s stratified sam-pling of landings by total length inch inter-vals.
1.4 REFERENCES
Barbieri, L. R., Chittenden, M.E. Jr.,Lowerre-Barbieri, S.K. 1994a. Matu-rity, spawning, and ovarian cycle of At-lantic croaker, Micropogonias undula-tus, in the Chesapeake bay and adjacentcoastal waters. Fishery Bulletin 92:671-685.
Barbieri, L. R., Chittenden, M.E. Jr.,Lowerre-Barbieri, S.K. 1994b. Age,growth, and mortality of Atlanticcroaker, Micropogonias undulatus, inthe Chesapeake bay region, with a dis-cussion of apparent geographic changesin population dynamics. Fishery Bul-letin 92:1-12.
Campana, S.E., M.C. Annand, and J.I.McMillan. 1995. Graphical and statis-tical methods for determining the con-sistency of age determinations. Trans.Am. Fish. Soc. 124:131-138.
5

CHAPTER 1. ATLANTIC CROAKER MICROPOGONIAS UNDULATUS
Hoenig, J.M., M.J. Morgan, and C.A.Brown. 1995. Analysing differences be-tween two age determination methodsby tests of symmetry. Can. J. Fish.Aquat. Sci. 52:364-368.
Quinn, T. J. II, and R. B. Deriso. 1999.Quantitative Fish Dynamics. OxfordUniveristy Press. New York.
R Core Team (2012). R: A lan-guage and environment for statisticalcomputing. R Foundation for Sta-tistical Computing, Vienna, Austria.ISBN 3-900051-07-0, URL http://www.R-project.org.
6

CHAPTER 1. ATLANTIC CROAKER MICROPOGONIAS UNDULATUS
Table 1.1: Number of Atlantic croaker collected and aged in each 1-inch length interval in 2014.’Target’ represents the sample size for ageing estimated for 2014, and ’Need’ represents number offish shorted in each length interval compared to the optimum sample size for ageing and number offish aged.
Interval Target Collected Aged Need6 - 6.99 5 1 1 47 - 7.99 7 24 8 08 - 8.99 7 27 8 09 - 9.99 19 29 20 0
10 - 10.99 30 52 30 011 - 11.99 54 78 54 012 - 12.99 97 158 98 013 - 13.99 72 73 73 014 - 14.99 59 39 39 2015 - 15.99 44 24 24 2016 - 16.99 29 8 8 2117 - 17.99 23 1 1 2218 - 18.99 7 0 0 719 - 19.99 5 0 0 520 - 20.99 5 0 0 5
Totals 463 514 364 104(Go back to text)
7
CHAPTER 1. ATLANTIC CROAKER MICROPOGONIAS UNDULATUS
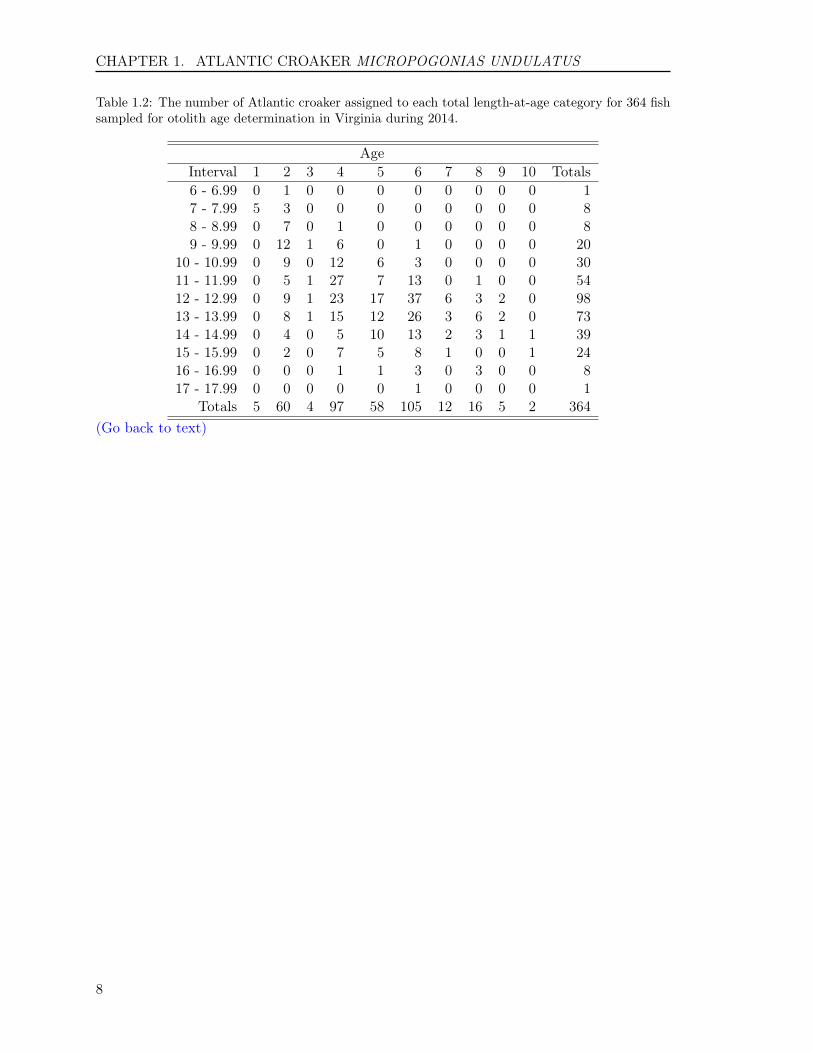
Table 1.2: The number of Atlantic croaker assigned to each total length-at-age category for 364 fishsampled for otolith age determination in Virginia during 2014.
AgeInterval 1 2 3 4 5 6 7 8 9 10 Totals6 - 6.99 0 1 0 0 0 0 0 0 0 0 17 - 7.99 5 3 0 0 0 0 0 0 0 0 88 - 8.99 0 7 0 1 0 0 0 0 0 0 89 - 9.99 0 12 1 6 0 1 0 0 0 0 20
10 - 10.99 0 9 0 12 6 3 0 0 0 0 3011 - 11.99 0 5 1 27 7 13 0 1 0 0 5412 - 12.99 0 9 1 23 17 37 6 3 2 0 9813 - 13.99 0 8 1 15 12 26 3 6 2 0 7314 - 14.99 0 4 0 5 10 13 2 3 1 1 3915 - 15.99 0 2 0 7 5 8 1 0 0 1 2416 - 16.99 0 0 0 1 1 3 0 3 0 0 817 - 17.99 0 0 0 0 0 1 0 0 0 0 1
Totals 5 60 4 97 58 105 12 16 5 2 364(Go back to text)
8

CHAPTER 1. ATLANTIC CROAKER MICROPOGONIAS UNDULATUS
Table 1.3: Age-Length key, as proportion-at-age in each 1-inch length interval, based on otolith agesfor Atlantic croaker sampled for age determination in Virginia during 2014.
AgeInterval 1 2 3 4 5 6 7 8 9 106 - 6.99 0 1 0 0 0 0 0 0 0 07 - 7.99 0.62 0.38 0 0 0 0 0 0 0 08 - 8.99 0 0.88 0 0.12 0 0 0 0 0 09 - 9.99 0 0.6 0.05 0.3 0 0.05 0 0 0 0
10 - 10.99 0 0.3 0 0.4 0.2 0.1 0 0 0 011 - 11.99 0 0.09 0.02 0.5 0.13 0.24 0 0.02 0 012 - 12.99 0 0.09 0.01 0.23 0.17 0.38 0.06 0.03 0.02 013 - 13.99 0 0.11 0.01 0.21 0.16 0.36 0.04 0.08 0.03 014 - 14.99 0 0.1 0 0.13 0.26 0.33 0.05 0.08 0.03 0.0315 - 15.99 0 0.08 0 0.29 0.21 0.33 0.04 0 0 0.0416 - 16.99 0 0 0 0.12 0.12 0.38 0 0.38 0 017 - 17.99 0 0 0 0 0 1 0 0 0 0
(Go back to text)
9


Chapter 2
BLACK DRUM Pogonias cromis

CHAPTER 2. BLACK DRUM POGONIAS CROMIS
2.1 INTRODUCTION
We aged a total of 123 black drum, Pogo-nias cromis, collected by the VMRC’s Bi-ological Sampling Program for age andgrowth analysis in 2014. Black drum agesranged from 3 to 47 years old with an av-erage age of 11.2, a standard deviation of9.2, and a standard error of 0.83. Twenty-six age classes (3 to 17, 22, 24 to 26, 29, 33to 35, 42 to 43, 47) were represented, com-prising fish of the 1967, 1971 to 1972, 1979to 1981, 1985, 1988 to 1990, 1992, 1997 to2011 year-classes. The sample was domi-nated by fish from the year-classes of 2009and 2007 with 17.1% and 15.4%, respec-tively.
2.2 METHODS
2.2.1 Handling of collections
Sagittal otoliths, hereafter, referred to as"otoliths", were received by the Age andGrowth Laboratory in labeled coin en-velopes. In the lab they were sorted by dateof capture, their envelope labels were ver-ified against VMRC’s collection data, andeach fish was assigned a unique Age andGrowth Laboratory identification number.All otoliths were stored dry in their originallabeled coin envelopes.
2.2.2 Preparation
Otoliths were processed for age determi-nation following the methods described inBobko (1991) and Jones and Wells (1998).The left or right sagittal otolith was ran-domly selected and attached, distal sidedown, to a glass slide with CrystalbondTM
509 adhesive or embedded in epoxy. Theotoliths were viewed by eye, and whennecessary, under a stereo microscope toidentify the location of the core, and
the position of the core marked usinga pencil across the otolith surface. Atleast one transverse cross-section (hereafter"thin-section") was then removed from themarked core of each otolith using a BuehlerIsoMetTM low-speed saw equipped withtwo, three inch diameter, Norton DiamondGrinding Wheels, separated by a stainlesssteel spacer of 0.5 mm (diameter 2.5"). Theposition of the marked core fell within the0.5 mm space between the blades, such thatthe core was included in the removed thin-section. Otolith thin-sections were placedon labeled glass slides and covered with athin layer of Flo-texx mounting mediumthat not only fixed the sections to theslide, but more importantly, provided en-hanced contrast and greater readability byincreasing light transmission through thesections.
Click here to obtain the protocol at theCQFE website on how to prepare otoliththin-section for ageing black drum.
2.2.3 Readings
The CQFE system assigns an age class toa fish based on a combination of numberof annuli in a thin-section, the date of cap-ture, and the species-specific period whenthe annulus is deposited. Each year, asthe fish grows, its otoliths grow and leavebehind markers of their age, called an an-nulus. Technically, an otolith annulus isthe combination of both the opaque andthe translucent band. In practice, only theopaque bands are counted as annuli. Thenumber of annuli replaces "x" in our nota-tion below, and is the initial "age" assign-ment of the fish.
Second, the thin-section is examined fortranslucent growth. If no translucentgrowth is visible beyond the last annulus,the otolith is called "even" and no modi-fication of the assigned age is made. Theinitial assigned age, then, is the age class of
12

CHAPTER 2. BLACK DRUM POGONIAS CROMIS
the fish. Any growth beyond the last an-nulus can be interpreted as either being to-ward the next age class or within the sameage class. If translucent growth is visiblebeyond the last annulus, a "+" is added tothe notation.
By convention all fish in the NorthernHemisphere are assigned a birth date ofJanuary 1. In addition, each species hasa specific period during which it depositsthe annulus. If the fish is captured afterthe end of the species-specific annulus de-position period and before January 1, it isassigned an age class notation of "x+x",where "x" is the number of annuli in thethin-section. If the fish is captured be-tween January 1 and the end of the species-specific annulus deposition period, it is as-signed an age class notation of "x+(x+1)".Thus, any growth beyond the last annulus,after its "birthday" but before the end ofannulus deposition period, is interpreted asbeing toward the next age class.
For example, black drum otolith annulusformation occurs between May and June(Beckman et al. 1990; Bobko 1991; Jonesand Wells 1998). A black drum cap-tured between January 1 and June 30, be-fore the end of the species’ annulus de-position period, with three visible annuliand some translucent growth after the lastannulus, would be assigned an age classof "x+(x+1)" or 3+(3+1), noted as 3+4.This is the same age-class assigned to a fishwith four visible annuli captured after theend of May 31, the period of annulus depo-sition, which would be noted as 4+4.
All thin-sections were aged by two differentreaders using a Nikon SMZ1000 stereo mi-croscope under transmitted light and dark-field polarization at between 8 and 20 timesmagnification (Figure 2.1). Each readeraged all of the otolith samples.
All samples were aged in chronologicalorder, based on collection date, withoutknowledge of previously estimated ages or
Figure 2.1: Otolith thin-section of a 3 year-oldblack drum
the specimen lengths. When the readers’ages agreed, that age was assigned to thefish. When the two readers disagreed, bothreaders sat down together and re-aged thefish, again without any knowledge of pre-viously estimated ages or lengths, and as-signed a final age to the fish. When thereaders were unable to agree on a final age,the fish was excluded from further analy-sis.
Click here to obtain the protocol at theCQFE website on how to age black drumusing their otolith thin-sections.
2.2.4 Comparison tests
A symmetry test (Hoenig et al. 1995)and coefficient of variation (CV) analysiswere used to detect any systematic differ-ence and precision on age readings, respec-tively, for the following comparisons: 1) be-tween the two readers in the current year,2) within each reader in the current year,and 3) time-series bias between the currentand previous years within each reader. Thereadings from the entire sample for the cur-rent year were used to examine the differ-ence between two readers. A random sub-sample of 50 fish from the current year wasselected for second readings to examine thedifference within a reader. Fifty otolithsrandomly selected from fish aged in 2003were used to examine the time-series biaswithin each reader. A figure of 1:1 equiv-alence was used to illustrate those differ-ences (Campana et al. 1995). All statis-
13
CHAPTER 2. BLACK DRUM POGONIAS CROMIS
tics analyses were performed in R 2.15.2(R Core Team 2012).
2.3 RESULTS
2.3.1 Reading precision
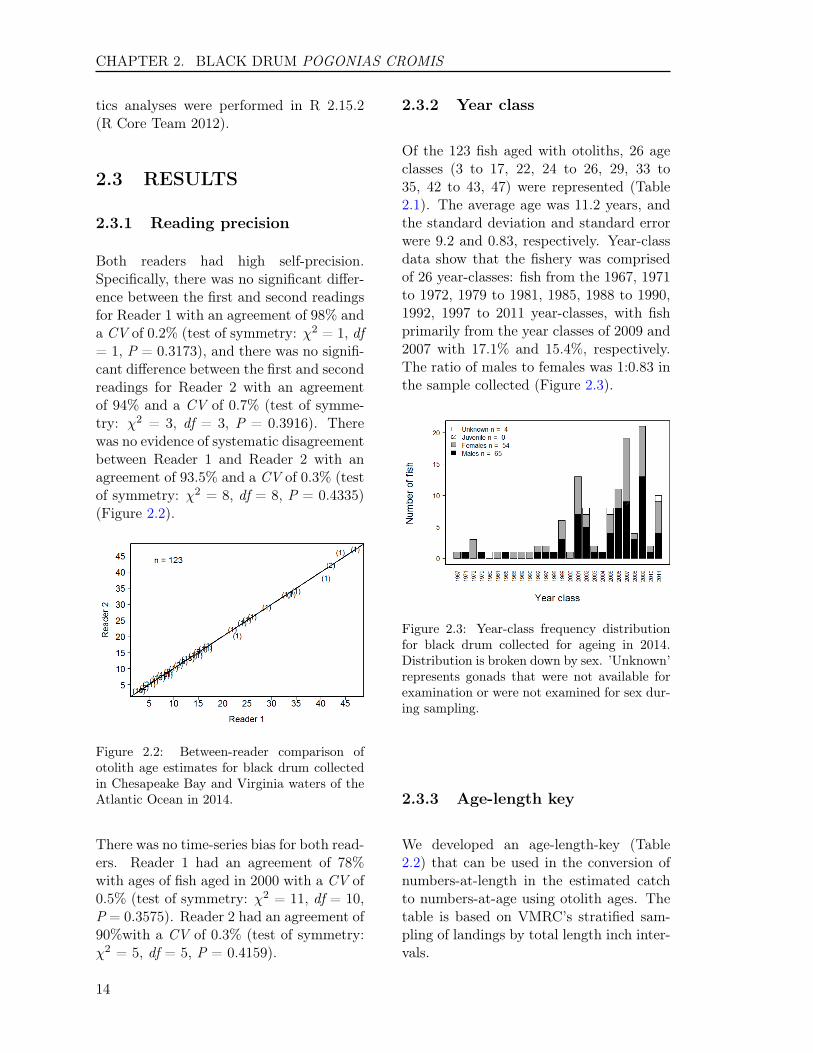
Both readers had high self-precision.Specifically, there was no significant differ-ence between the first and second readingsfor Reader 1 with an agreement of 98% anda CV of 0.2% (test of symmetry: χ2 = 1, df= 1, P = 0.3173), and there was no signifi-cant difference between the first and secondreadings for Reader 2 with an agreementof 94% and a CV of 0.7% (test of symme-try: χ2 = 3, df = 3, P = 0.3916). Therewas no evidence of systematic disagreementbetween Reader 1 and Reader 2 with anagreement of 93.5% and a CV of 0.3% (testof symmetry: χ2 = 8, df = 8, P = 0.4335)(Figure 2.2).
Figure 2.2: Between-reader comparison ofotolith age estimates for black drum collectedin Chesapeake Bay and Virginia waters of theAtlantic Ocean in 2014.
There was no time-series bias for both read-ers. Reader 1 had an agreement of 78%with ages of fish aged in 2000 with a CV of0.5% (test of symmetry: χ2 = 11, df = 10,P = 0.3575). Reader 2 had an agreement of90%with a CV of 0.3% (test of symmetry:χ2 = 5, df = 5, P = 0.4159).
2.3.2 Year class
Of the 123 fish aged with otoliths, 26 ageclasses (3 to 17, 22, 24 to 26, 29, 33 to35, 42 to 43, 47) were represented (Table2.1). The average age was 11.2 years, andthe standard deviation and standard errorwere 9.2 and 0.83, respectively. Year-classdata show that the fishery was comprisedof 26 year-classes: fish from the 1967, 1971to 1972, 1979 to 1981, 1985, 1988 to 1990,1992, 1997 to 2011 year-classes, with fishprimarily from the year classes of 2009 and2007 with 17.1% and 15.4%, respectively.The ratio of males to females was 1:0.83 inthe sample collected (Figure 2.3).
Figure 2.3: Year-class frequency distributionfor black drum collected for ageing in 2014.Distribution is broken down by sex. ’Unknown’represents gonads that were not available forexamination or were not examined for sex dur-ing sampling.
2.3.3 Age-length key
We developed an age-length-key (Table2.2) that can be used in the conversion ofnumbers-at-length in the estimated catchto numbers-at-age using otolith ages. Thetable is based on VMRC’s stratified sam-pling of landings by total length inch inter-vals.
14

CHAPTER 2. BLACK DRUM POGONIAS CROMIS
2.4 REFERENCES
Beckman, D. W., C. A. Wilson, and A. L.Stanley. 1990. Age and growth of blackdrum in Louisiana waters of the Gulf ofMexico. Transactions of American Fish-eries Society 19:537-544.
Bobko, S. J. 1991. Age, growth, and repro-duction of black drum, Pogonias cromis,in Virginia. M.S. thesis. Old DominionUniversity, Norfolk, VA.
Campana, S.E., M.C. Annand, and J.I.McMillan. 1995. Graphical and statisti-cal methods for determining the consis-tency of age eterminations. Trans. Am.Fish. Soc. 124:131-138.
Hoenig, J.M., M.J. Morgan, and C.A.Brown. 1995. Analysing differences be-tween two age determination methodsby tests of symmetry. Can. J. Fish.Aquat. Sci. 52:364-368.
Jones, C.J. and B.K. Wells. 1998. Age,growth, and mortality of black drum,Pogonias cromis, in the Chesapeake Bayregion. Fish. Bull. 96:451-461.
R Core Team (2012). R: A lan-guage and environment for statisticalcomputing. R Foundation for Sta-tistical Computing, Vienna, Austria.ISBN 3-900051-07-0, URL http://www.R-project.org.
15
CHAPTER 2. BLACK DRUM POGONIAS CROMIS
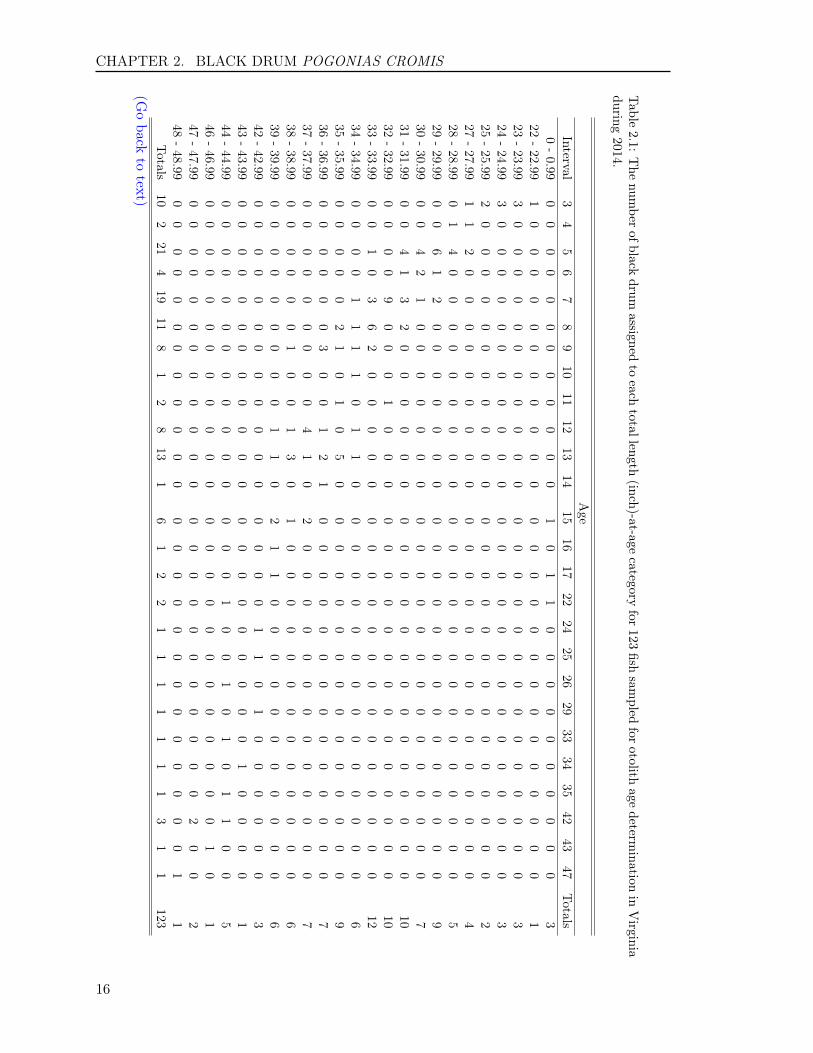
Table
2.1:The
number
ofblackdrum
assignedto
eachtotallength
(inch)-at-agecategory
for123
fishsam
pledfor
otolithage
determination
inVirginia
during2014.
Age
Interval3
45
67
89
1011
1213
1415
1617
2224
2526
2933
3435
4243
47Totals
0-0.99
00
00
00
00
00
00
10
11
00
00
00
00
00
322
-22.99
10
00
00
00
00
00
00
00
00
00
00
00
00
123
-23.99
30
00
00
00
00
00
00
00
00
00
00
00
00
324
-24.99
30
00
00
00
00
00
00
00
00
00
00
00
00
325
-25.99
20
00
00
00
00
00
00
00
00
00
00
00
00
227
-27.99
11
20
00
00
00
00
00
00
00
00
00
00
00
428
-28.99
01
40
00
00
00
00
00
00
00
00
00
00
00
529
-29.99
00
61
20
00
00
00
00
00
00
00
00
00
00
930
-30.99
00
42
10
00
00
00
00
00
00
00
00
00
00
731
-31.99
00
41
32
00
00
00
00
00
00
00
00
00
00
1032
-32.99
00
00
90
00
10
00
00
00
00
00
00
00
00
1033
-33.99
00
10
36
20
00
00
00
00
00
00
00
00
00
1234
-34.99
00
00
11
11
01
10
00
00
00
00
00
00
00
635
-35.99
00
00
02
10
10
50
00
00
00
00
00
00
00
936
-36.99
00
00
00
30
01
21
00
00
00
00
00
00
00
737
-37.99
00
00
00
00
04
10
20
00
00
00
00
00
00
738
-38.99
00
00
00
10
01
30
10
00
00
00
00
00
00
639
-39.99
00
00
00
00
01
10
21
10
00
00
00
00
00
642
-42.99
00
00
00
00
00
00
00
00
11
01
00
00
00
343
-43.99
00
00
00
00
00
00
00
00
00
00
01
00
00
144
-44.99
00
00
00
00
00
00
00
01
00
10
10
11
00
546
-46.99
00
00
00
00
00
00
00
00
00
00
00
00
10
147
-47.99
00
00
00
00
00
00
00
00
00
00
00
02
00
248
-48.99
00
00
00
00
00
00
00
00
00
00
00
00
01
1Totals
102
214
1911
81
28
131
61
22
11
11
11
13
11
123(G
oback
totext)
16

CHAPTER 2. BLACK DRUM POGONIAS CROMIS
Tab
le2.2:
Age-Lengthkey,
asprop
ortion
-at-agein
each
1-inch
leng
thinterval,ba
sedon
otolithages
forblackdrum
sampled
forag
edeterm
ination
inVirginiadu
ring
2014.
Age
Interval
34
56
78
910
1112
1314
1516
1722
2425
2629
3334
3542
4347
0-0.99
00
00
00
00
00
00
0.33
00.33
0.33
00
00
00
00
00
22-22.99
10
00
00
00
00
00
00
00
00
00
00
00
00
23-23.99
10
00
00
00
00
00
00
00
00
00
00
00
00
24-24.99
10
00
00
00
00
00
00
00
00
00
00
00
00
25-25.99
10
00
00
00
00
00
00
00
00
00
00
00
00
27-27.99
0.25
0.25
0.5
00
00
00
00
00
00
00
00
00
00
00
028
-28.99
00.2
0.8
00
00
00
00
00
00
00
00
00
00
00
029
-29.99
00
0.67
0.11
0.22
00
00
00
00
00
00
00
00
00
00
030
-30.99
00
0.57
0.29
0.14
00
00
00
00
00
00
00
00
00
00
031
-31.99
00
0.4
0.1
0.3
0.2
00
00
00
00
00
00
00
00
00
00
32-32.99
00
00
0.9
00
00.1
00
00
00
00
00
00
00
00
033
-33.99
00
0.08
00.25
0.5
0.17
00
00
00
00
00
00
00
00
00
034
-34.99
00
00
0.17
0.17
0.17
0.17
00.17
0.17
00
00
00
00
00
00
00
035
-35.99
00
00
00.22
0.11
00.11
00.56
00
00
00
00
00
00
00
036
-36.99
00
00
00
0.43
00
0.14
0.29
0.14
00
00
00
00
00
00
00
37-37.99
00
00
00
00
00.57
0.14
00.29
00
00
00
00
00
00
038
-38.99
00
00
00
0.17
00
0.17
0.5
00.17
00
00
00
00
00
00
039
-39.99
00
00
00
00
00.17
0.17
00.33
0.17
0.17
00
00
00
00
00
042
-42.99
00
00
00
00
00
00
00
00
0.33
0.33
00.33
00
00
00
43-43.99
00
00
00
00
00
00
00
00
00
00
01
00
00
44-44.99
00
00
00
00
00
00
00
00.2
00
0.2
00.2
00.2
0.2
00
46-46.99
00
00
00
00
00
00
00
00
00
00
00
00
10
47-47.99
00
00
00
00
00
00
00
00
00
00
00
01
00
48-48.99
00
00
00
00
00
00
00
00
00
00
00
00
01
(Goba
ckto
text)
17


Chapter 3
BLUEFISH Pomatomus saltatrix

CHAPTER 3. BLUEFISH POMATOMUS SALTATRIX
3.1 INTRODUCTION
We aged a total of 366 bluefish, Pomatomussaltatrix, collected by the VMRC’s Biolog-ical Sampling Program for age and growthanalysis in 2014. Bluefish ages ranged from0 to 11 years old with an average age of2.4, a standard deviation of 2, and a stan-dard error of 0.1. Twelve age classes (0 to11) were represented, comprising fish of the2003 to 2014 year-classes. The sample wasdominated by fish from the year-classes of2012 and 2013 with 32.8% and 31.4%, re-spectively.
3.2 METHODS
3.2.1 Sample size for ageing
We estimated sample size for ageing blue-fish in 2014 using a two-stage random sam-pling method (Quinn and Deriso 1999) toincrease precision in estimates of age com-position from fish sampled efficiently andeffectively. The basic equation is:
A =Va
θ2aCV2 +Ba/L
(3.1)
where A is the sample size for ageing blue-fish in 2014; θa stands for the proportion ofage a fish in a catch. Va and Ba representvariance components within and betweenlength intervals for age a, respectively; CVis the coefficient of variation; L was the to-tal number of bluefish used by VMRC toestimate length distribution of the catchesfrom 2008 to 2012. θa, Va, Ba, and CV werecalculated using pooled age-length data ofbluefish collected from 2008 to 2012 and us-ing equations in Quinn and Deriso (1999).For simplicity, the equations are not listedhere. The equation (3.1) indicates that themore fish that are aged, the smaller the CV(or higher precision) that will be obtained.Therefore, the criterion to age A (number)of fish is that A should be a number above
which there is only a 1% CV reduction forthe most major age in catch by aging anadditional 100 or more fish. Finally, Al isA multiplied by the proportion of length in-terval l from the length distribution of the2008 to 2012 catch. Al is number of fish tobe aged for length interval l in 2014. Basedon VMRC’s request in 2010, we used 1-cmlength interval for bluefish, which differedfrom other species (1-inch).
3.2.2 Handling of collections
Otoliths were received by the Age &Growth Laboratory in labeled coin en-velopes, and were sorted by date of capture.Their envelope labels were verified againstVMRC’s collection data, and each fish wasassigned a unique Age and Growth Labo-ratory identification number. All otolithswere stored dry in their original labeledcoin envelopes.
3.2.3 Preparation
We used our thin-section and bake tech-nique to process bluefish sagittal otoliths(hereafter, referred to as "otoliths") forage determination (Robillard et al. 2009).Otolith preparation began by randomlyselecting either the right or left otolith.Each whole otolith was placed in a ceramic"Coors" spot plate well and baked in aThermolyne 1400 furnace at 400 ◦C. Bak-ing time was dependent on the otolith’s sizeand gauged by color, with a light caramelcolor desired. Once a suitable color wasachieved the baked otolith was embeddedin epoxy resin with its distal surface orien-tated downwards. The otoliths were viewedby eye and, when necessary, under a stereomicroscope to identify the location of thecore. Then, the position of the core wasmarked using a permanent marker acrossthe epoxy resin surface. At least one trans-verse cross-section (hereafter, referred to
20

CHAPTER 3. BLUEFISH POMATOMUS SALTATRIX
as "thin-section") was then removed fromthe marked core of each otolith using aBuehler IsoMetTM low-speed saw equippedwith two, 3-inch diameter, Norton diamondgrinding wheels (hereafter, referred to as"blades"), separated by a stainless steelspacer of 0.5 mm (diameter 2.5"). Theotolith was positioned so the blades strad-dled each side of the otolith focus. It wascrucial that this cut be perpendicular tothe long axis of the otolith. Failure to doso resulted in broad and distorted wintergrowth zones. A proper cut resulted inannuli that were clearly defined and delin-eated. Once cut, thin-sections were placedon labeled glass slides and covered with athin layer of Flo-texx mounting mediumthat not only fixed the sections to the slide,but more importantly, provided enhancedcontrast and greater readability by increas-ing light transmission through the thin-section.
Click here to obtain the protocol at theCQFE website on how to prepare otoliththin-section for ageing bluefish.
3.2.4 Readings
The CQFE system assigns an age class toa fish based on a combination of numberof annuli in a thin-section, the date of cap-ture, and the species-specific period whenthe annulus is deposited. Each year, asthe fish grows, its otoliths grow and leavebehind markers of their age, called an an-nulus. Technically, an otolith annulus isthe combination of both the opaque andthe translucent band. In practice, only theopaque bands are counted as annuli. Thenumber of annuli replaces "x" in our nota-tion below, and is the initial "age" assign-ment of the fish.
Second, the thin-section is examined fortranslucent growth. If no translucentgrowth is visible beyond the last annulus,the otolith is called "even" and no modi-
fication of the assigned age is made. Theinitial assigned age, then, is the age class ofthe fish. Any growth beyond the last an-nulus can be interpreted as either being to-ward the next age class or within the sameage class. If translucent growth is visiblebeyond the last annulus, a "+" is added tothe notation.
By convention all fish in the NorthernHemisphere are assigned a birth date ofJanuary 1. In addition, each species hasa specific period during which it depositsthe annulus. If the fish is captured afterthe end of the species-specific annulus de-position period and before January 1, it isassigned an age class notation of "x+x",where "x" is the number of annuli in thethin-section. If the fish is captured be-tween January 1 and the end of the species-specific annulus deposition period, it is as-signed an age class notation of "x+(x+1)".Thus, any growth beyond the last annulus,after its "birthday" but before the end ofannulus deposition period, is interpreted asbeing toward the next age class.
For example, bluefish otolith deposition oc-curs between March and June (Robillardet al. 2009). A bluefish captured betweenJanuary 1 and May 31, before the endof the species’ annulus deposition period,with three visible annuli and some translu-cent growth after the last annulus, wouldbe assigned an age class of "x+(x+1)" or3+(3+1), noted as 3+4. This is the sameage-class assigned to a fish with four vis-ible annuli captured after the end of May31, the period of annulus deposition, whichwould be noted as 4+4.
All thin-sections were aged by two differentreaders using a Nikon SMZ1000 stereo mi-croscope under transmitted light and dark-field polarization at between 8 and 20 timesmagnification (Figure 3.1). Each readeraged all of the otolith samples.
21
CHAPTER 3. BLUEFISH POMATOMUS SALTATRIX
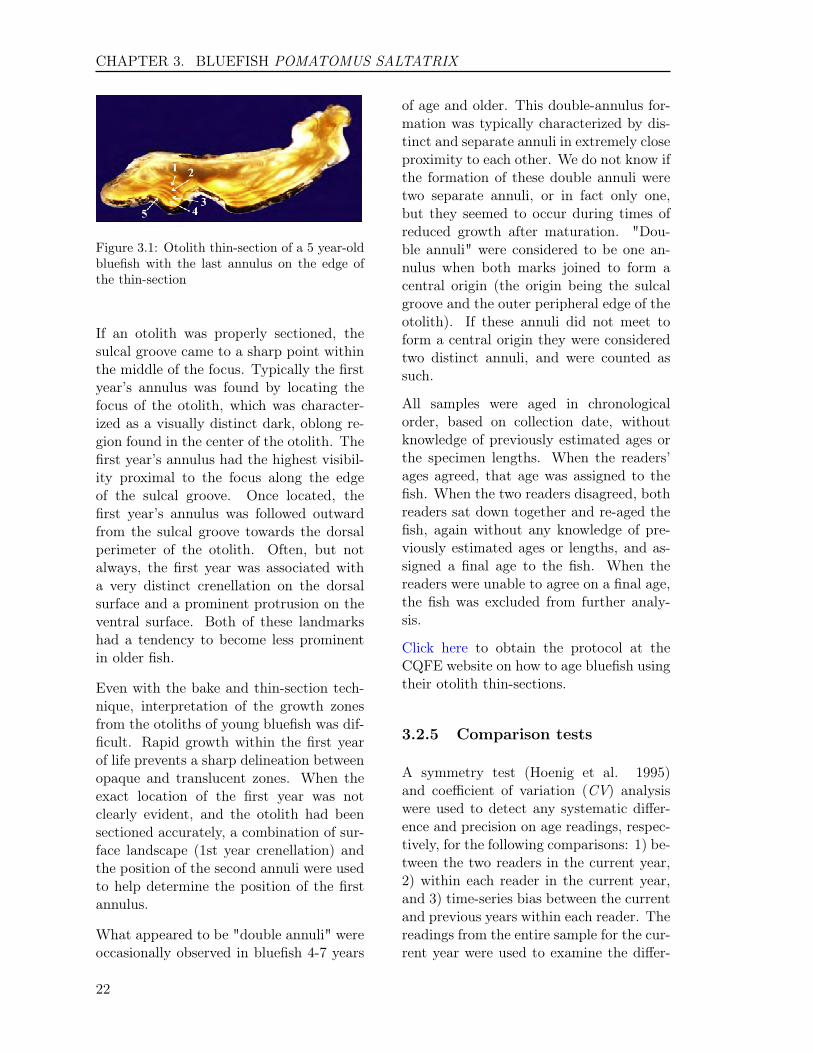
Figure 3.1: Otolith thin-section of a 5 year-oldbluefish with the last annulus on the edge ofthe thin-section
If an otolith was properly sectioned, thesulcal groove came to a sharp point withinthe middle of the focus. Typically the firstyear’s annulus was found by locating thefocus of the otolith, which was character-ized as a visually distinct dark, oblong re-gion found in the center of the otolith. Thefirst year’s annulus had the highest visibil-ity proximal to the focus along the edgeof the sulcal groove. Once located, thefirst year’s annulus was followed outwardfrom the sulcal groove towards the dorsalperimeter of the otolith. Often, but notalways, the first year was associated witha very distinct crenellation on the dorsalsurface and a prominent protrusion on theventral surface. Both of these landmarkshad a tendency to become less prominentin older fish.
Even with the bake and thin-section tech-nique, interpretation of the growth zonesfrom the otoliths of young bluefish was dif-ficult. Rapid growth within the first yearof life prevents a sharp delineation betweenopaque and translucent zones. When theexact location of the first year was notclearly evident, and the otolith had beensectioned accurately, a combination of sur-face landscape (1st year crenellation) andthe position of the second annuli were usedto help determine the position of the firstannulus.
What appeared to be "double annuli" wereoccasionally observed in bluefish 4-7 years
of age and older. This double-annulus for-mation was typically characterized by dis-tinct and separate annuli in extremely closeproximity to each other. We do not know ifthe formation of these double annuli weretwo separate annuli, or in fact only one,but they seemed to occur during times ofreduced growth after maturation. "Dou-ble annuli" were considered to be one an-nulus when both marks joined to form acentral origin (the origin being the sulcalgroove and the outer peripheral edge of theotolith). If these annuli did not meet toform a central origin they were consideredtwo distinct annuli, and were counted assuch.
All samples were aged in chronologicalorder, based on collection date, withoutknowledge of previously estimated ages orthe specimen lengths. When the readers’ages agreed, that age was assigned to thefish. When the two readers disagreed, bothreaders sat down together and re-aged thefish, again without any knowledge of pre-viously estimated ages or lengths, and as-signed a final age to the fish. When thereaders were unable to agree on a final age,the fish was excluded from further analy-sis.
Click here to obtain the protocol at theCQFE website on how to age bluefish usingtheir otolith thin-sections.
3.2.5 Comparison tests
A symmetry test (Hoenig et al. 1995)and coefficient of variation (CV) analysiswere used to detect any systematic differ-ence and precision on age readings, respec-tively, for the following comparisons: 1) be-tween the two readers in the current year,2) within each reader in the current year,and 3) time-series bias between the currentand previous years within each reader. Thereadings from the entire sample for the cur-rent year were used to examine the differ-
22
CHAPTER 3. BLUEFISH POMATOMUS SALTATRIX
ence between two readers. A random sub-sample of 50 fish from the current year wasselected for second readings to examine thedifference within a reader. Fifty otolithsrandomly selected from fish aged in 2003were used to examine the time-series biaswithin each reader. A figure of 1:1 equiv-alence was used to illustrate those differ-ences (Campana et al. 1995). All statis-tics analyses were performed in R 2.15.2(R Core Team 2012).
3.3 RESULTS
3.3.1 Sample size
We estimated a sample size of 449 bluefishin 2014, ranging in length interval from 16to 97 centimeters (Table 3.1). This samplesize provided a range in (CV) for age com-position approximately from the smallest(CV) of 5% for age 2 to the largest (CV)of 21% for age 5. In 2014, we randomly se-lected and aged 366 fish from 577 bluefishcollected by VMRC. We fell short in ourover-all collections for this optimal length-class sampling estimate by 115 fish. How-ever, we were short of no fish from the ma-jor length intervals (The interval requiresmore than 5 fish), as a result, the precisionfor the estimates of major age groups wouldnot be influenced significantly.
3.3.2 Reading precision
Both readers had high self-precision.Specifically, there was no significant differ-ence between the first and second readingsfor Reader 1 with an agreement of 94% anda CV of 1.7% (test of symmetry: χ2 = 3, df= 3, P = 0.3916), and there was no signif-icant difference between the first and sec-ond readings for Reader 2 with an agree-ment of 90% and a CV of 4.5% (test ofsymmetry: χ2 = 5, df = 4, P = 0.2873).
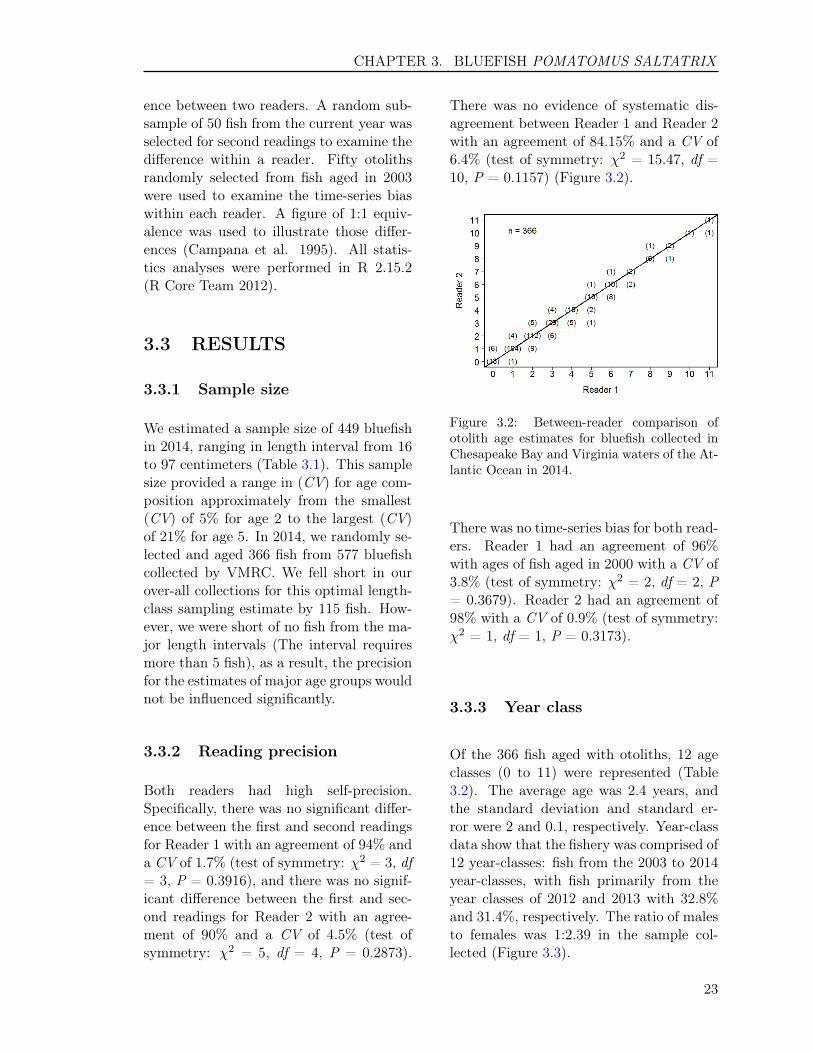
There was no evidence of systematic dis-agreement between Reader 1 and Reader 2with an agreement of 84.15% and a CV of6.4% (test of symmetry: χ2 = 15.47, df =10, P = 0.1157) (Figure 3.2).
Figure 3.2: Between-reader comparison ofotolith age estimates for bluefish collected inChesapeake Bay and Virginia waters of the At-lantic Ocean in 2014.
There was no time-series bias for both read-ers. Reader 1 had an agreement of 96%with ages of fish aged in 2000 with a CV of3.8% (test of symmetry: χ2 = 2, df = 2, P= 0.3679). Reader 2 had an agreement of98% with a CV of 0.9% (test of symmetry:χ2 = 1, df = 1, P = 0.3173).
3.3.3 Year class
Of the 366 fish aged with otoliths, 12 ageclasses (0 to 11) were represented (Table3.2). The average age was 2.4 years, andthe standard deviation and standard er-ror were 2 and 0.1, respectively. Year-classdata show that the fishery was comprised of12 year-classes: fish from the 2003 to 2014year-classes, with fish primarily from theyear classes of 2012 and 2013 with 32.8%and 31.4%, respectively. The ratio of malesto females was 1:2.39 in the sample col-lected (Figure 3.3).
23

CHAPTER 3. BLUEFISH POMATOMUS SALTATRIX
Figure 3.3: Year-class frequency distributionfor bluefish collected for ageing in 2014. Dis-tribution is broken down by sex. ’Unknown’represents gonads that were not available forexamination or were not examined for sex dur-ing sampling.
3.3.4 Age-length key
We developed an age-length-key (Table3.3) that can be used in the conversion ofnumbers-at-length in the estimated catchto numbers-at-age using otolith ages. Thetable is based on VMRC’s stratified sam-pling of landings by total length cm inter-vals.
3.4 REFERENCES
Campana, S.E., M.C. Annand, and J.I.McMillan. 1995. Graphical and statis-tical methods for determining the con-sistency of age determinations. Trans.Am. Fish. Soc. 124:131-138.
Hoenig, J.M., M.J. Morgan, and C.A.Brown. 1995. Analysing differences be-tween two age determination methodsby tests of symmetry. Can. J. Fish.Aquat. Sci. 52:364-368.
Quinn, T. J. II, and R. B. Deriso. 1999.Quantitative Fish Dynamics. OxfordUniveristy Press. New York.
R Core Team (2012). R: A lan-
guage and environment for statisticalcomputing. R Foundation for Sta-tistical Computing, Vienna, Austria.ISBN 3-900051-07-0, URL http://www.R-project.org.
Robillard, E. M., C. S. Reiss, and C. M.Jones. 2009. Age-validation and growthof bluefish (Pomatomus saltatrix) alongthe East Coast of the United States.Fisheries Research 95:65-75.
24

CHAPTER 3. BLUEFISH POMATOMUS SALTATRIX
Table 3.1: Number of bluefish collected and aged in each 1-cm length interval in 2014. ’Target’represents the sample size for ageing estimated for 2014, and ’Need’ represents number of fishshorted in each length interval compared to the optimum sample size for ageing and number of fishaged.
(Go back to text)Interval Target Collected Aged Need
16 - 16.99 5 1 1 417 - 17.99 5 0 0 518 - 18.99 5 0 0 519 - 19.99 5 6 6 020 - 20.99 5 20 6 021 - 21.99 5 14 5 022 - 22.99 5 18 5 023 - 23.99 5 13 6 024 - 24.99 5 13 6 025 - 25.99 5 15 6 026 - 26.99 5 12 6 027 - 27.99 5 11 6 028 - 28.99 5 10 6 029 - 29.99 5 12 6 030 - 30.99 5 12 8 031 - 31.99 5 8 6 032 - 32.99 5 14 6 033 - 33.99 6 11 6 034 - 34.99 6 6 6 035 - 35.99 6 9 6 036 - 36.99 8 11 8 037 - 37.99 8 14 8 038 - 38.99 7 16 7 039 - 39.99 9 11 9 040 - 40.99 8 14 8 041 - 41.99 8 12 8 042 - 42.99 8 18 8 043 - 43.99 8 14 8 044 - 44.99 7 9 7 045 - 45.99 9 12 9 046 - 46.99 7 8 7 047 - 47.99 8 15 8 048 - 48.99 6 10 6 049 - 49.99 5 13 6 050 - 50.99 5 11 6 051 - 51.99 5 4 4 152 - 52.99 5 10 6 053 - 53.99 5 5 5 054 - 54.99 5 5 5 055 - 55.99 5 6 6 0
(To continue)
25
CHAPTER 3. BLUEFISH POMATOMUS SALTATRIX
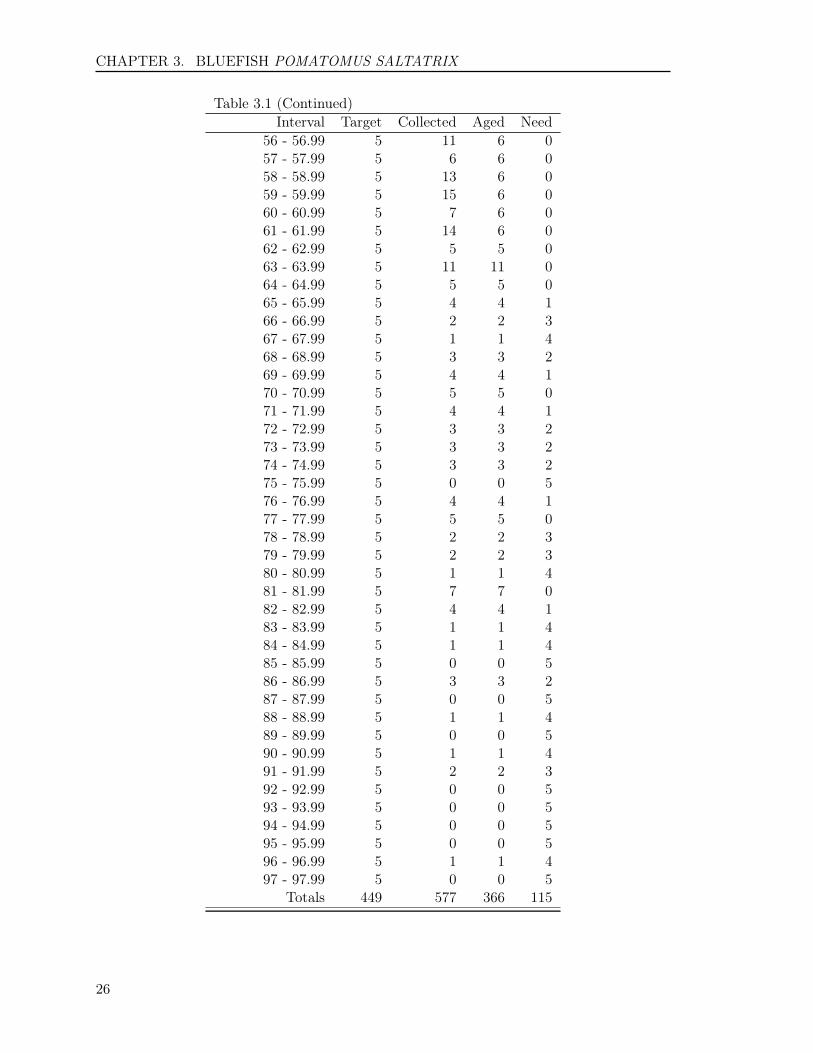
Table 3.1 (Continued)Interval Target Collected Aged Need
56 - 56.99 5 11 6 057 - 57.99 5 6 6 058 - 58.99 5 13 6 059 - 59.99 5 15 6 060 - 60.99 5 7 6 061 - 61.99 5 14 6 062 - 62.99 5 5 5 063 - 63.99 5 11 11 064 - 64.99 5 5 5 065 - 65.99 5 4 4 166 - 66.99 5 2 2 367 - 67.99 5 1 1 468 - 68.99 5 3 3 269 - 69.99 5 4 4 170 - 70.99 5 5 5 071 - 71.99 5 4 4 172 - 72.99 5 3 3 273 - 73.99 5 3 3 274 - 74.99 5 3 3 275 - 75.99 5 0 0 576 - 76.99 5 4 4 177 - 77.99 5 5 5 078 - 78.99 5 2 2 379 - 79.99 5 2 2 380 - 80.99 5 1 1 481 - 81.99 5 7 7 082 - 82.99 5 4 4 183 - 83.99 5 1 1 484 - 84.99 5 1 1 485 - 85.99 5 0 0 586 - 86.99 5 3 3 287 - 87.99 5 0 0 588 - 88.99 5 1 1 489 - 89.99 5 0 0 590 - 90.99 5 1 1 491 - 91.99 5 2 2 392 - 92.99 5 0 0 593 - 93.99 5 0 0 594 - 94.99 5 0 0 595 - 95.99 5 0 0 596 - 96.99 5 1 1 497 - 97.99 5 0 0 5
Totals 449 577 366 115
26

CHAPTER 3. BLUEFISH POMATOMUS SALTATRIX
Table 3.2: The number of bluefish assigned to each total length (cm)-at-age category for 366 fishsampled for otolith age determination in Virginia during 2014.
(Go back to text)Age
Interval 0 1 2 3 4 5 6 7 8 9 10 11 Totals16 - 16.99 1 0 0 0 0 0 0 0 0 0 0 0 119 - 19.99 6 0 0 0 0 0 0 0 0 0 0 0 620 - 20.99 3 3 0 0 0 0 0 0 0 0 0 0 621 - 21.99 2 3 0 0 0 0 0 0 0 0 0 0 522 - 22.99 3 2 0 0 0 0 0 0 0 0 0 0 523 - 23.99 3 3 0 0 0 0 0 0 0 0 0 0 624 - 24.99 2 4 0 0 0 0 0 0 0 0 0 0 625 - 25.99 0 6 0 0 0 0 0 0 0 0 0 0 626 - 26.99 0 6 0 0 0 0 0 0 0 0 0 0 627 - 27.99 0 6 0 0 0 0 0 0 0 0 0 0 628 - 28.99 0 6 0 0 0 0 0 0 0 0 0 0 629 - 29.99 0 6 0 0 0 0 0 0 0 0 0 0 630 - 30.99 0 8 0 0 0 0 0 0 0 0 0 0 831 - 31.99 0 6 0 0 0 0 0 0 0 0 0 0 632 - 32.99 0 6 0 0 0 0 0 0 0 0 0 0 633 - 33.99 0 4 2 0 0 0 0 0 0 0 0 0 634 - 34.99 0 5 1 0 0 0 0 0 0 0 0 0 635 - 35.99 0 4 2 0 0 0 0 0 0 0 0 0 636 - 36.99 0 7 1 0 0 0 0 0 0 0 0 0 837 - 37.99 0 5 3 0 0 0 0 0 0 0 0 0 838 - 38.99 0 3 4 0 0 0 0 0 0 0 0 0 739 - 39.99 0 3 6 0 0 0 0 0 0 0 0 0 940 - 40.99 0 1 7 0 0 0 0 0 0 0 0 0 841 - 41.99 0 2 6 0 0 0 0 0 0 0 0 0 842 - 42.99 0 1 7 0 0 0 0 0 0 0 0 0 843 - 43.99 0 0 6 2 0 0 0 0 0 0 0 0 844 - 44.99 0 2 4 1 0 0 0 0 0 0 0 0 745 - 45.99 0 2 7 0 0 0 0 0 0 0 0 0 946 - 46.99 0 1 6 0 0 0 0 0 0 0 0 0 747 - 47.99 0 2 5 1 0 0 0 0 0 0 0 0 848 - 48.99 0 1 5 0 0 0 0 0 0 0 0 0 649 - 49.99 0 1 4 1 0 0 0 0 0 0 0 0 650 - 50.99 0 1 3 2 0 0 0 0 0 0 0 0 651 - 51.99 0 1 2 1 0 0 0 0 0 0 0 0 452 - 52.99 0 1 3 2 0 0 0 0 0 0 0 0 653 - 53.99 0 1 3 1 0 0 0 0 0 0 0 0 554 - 54.99 0 2 2 1 0 0 0 0 0 0 0 0 555 - 55.99 0 0 4 2 0 0 0 0 0 0 0 0 656 - 56.99 0 0 3 3 0 0 0 0 0 0 0 0 657 - 57.99 0 0 2 3 1 0 0 0 0 0 0 0 658 - 58.99 0 0 3 2 1 0 0 0 0 0 0 0 6
(To continue)
27
CHAPTER 3. BLUEFISH POMATOMUS SALTATRIX
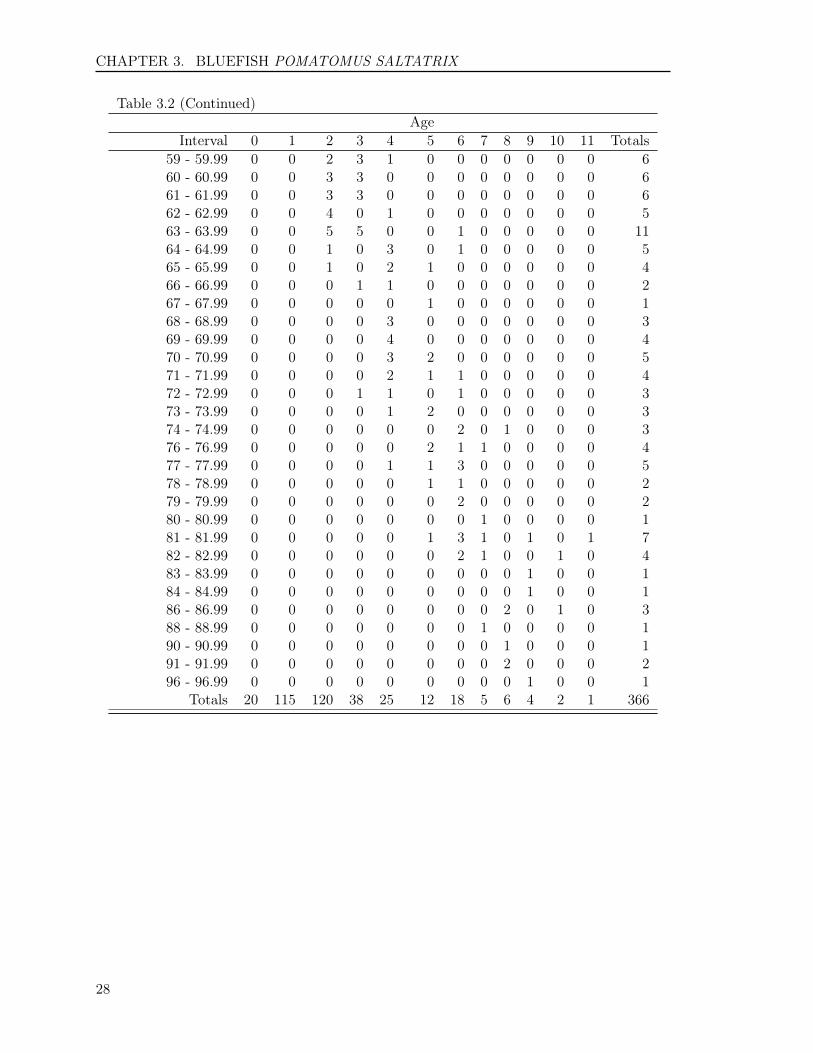
Table 3.2 (Continued)Age
Interval 0 1 2 3 4 5 6 7 8 9 10 11 Totals59 - 59.99 0 0 2 3 1 0 0 0 0 0 0 0 660 - 60.99 0 0 3 3 0 0 0 0 0 0 0 0 661 - 61.99 0 0 3 3 0 0 0 0 0 0 0 0 662 - 62.99 0 0 4 0 1 0 0 0 0 0 0 0 563 - 63.99 0 0 5 5 0 0 1 0 0 0 0 0 1164 - 64.99 0 0 1 0 3 0 1 0 0 0 0 0 565 - 65.99 0 0 1 0 2 1 0 0 0 0 0 0 466 - 66.99 0 0 0 1 1 0 0 0 0 0 0 0 267 - 67.99 0 0 0 0 0 1 0 0 0 0 0 0 168 - 68.99 0 0 0 0 3 0 0 0 0 0 0 0 369 - 69.99 0 0 0 0 4 0 0 0 0 0 0 0 470 - 70.99 0 0 0 0 3 2 0 0 0 0 0 0 571 - 71.99 0 0 0 0 2 1 1 0 0 0 0 0 472 - 72.99 0 0 0 1 1 0 1 0 0 0 0 0 373 - 73.99 0 0 0 0 1 2 0 0 0 0 0 0 374 - 74.99 0 0 0 0 0 0 2 0 1 0 0 0 376 - 76.99 0 0 0 0 0 2 1 1 0 0 0 0 477 - 77.99 0 0 0 0 1 1 3 0 0 0 0 0 578 - 78.99 0 0 0 0 0 1 1 0 0 0 0 0 279 - 79.99 0 0 0 0 0 0 2 0 0 0 0 0 280 - 80.99 0 0 0 0 0 0 0 1 0 0 0 0 181 - 81.99 0 0 0 0 0 1 3 1 0 1 0 1 782 - 82.99 0 0 0 0 0 0 2 1 0 0 1 0 483 - 83.99 0 0 0 0 0 0 0 0 0 1 0 0 184 - 84.99 0 0 0 0 0 0 0 0 0 1 0 0 186 - 86.99 0 0 0 0 0 0 0 0 2 0 1 0 388 - 88.99 0 0 0 0 0 0 0 1 0 0 0 0 190 - 90.99 0 0 0 0 0 0 0 0 1 0 0 0 191 - 91.99 0 0 0 0 0 0 0 0 2 0 0 0 296 - 96.99 0 0 0 0 0 0 0 0 0 1 0 0 1
Totals 20 115 120 38 25 12 18 5 6 4 2 1 366
28

CHAPTER 3. BLUEFISH POMATOMUS SALTATRIX
Table 3.3: Age-Length key, as proportion-at-age in each 1-cm length interval, based on otolith agesfor bluefish sampled for age determination in Virginia during 2014.
(Go back to text)Age
Interval 0 1 2 3 4 5 6 7 8 9 10 1116 - 16.99 1 0 0 0 0 0 0 0 0 0 0 019 - 19.99 1 0 0 0 0 0 0 0 0 0 0 020 - 20.99 0.5 0.5 0 0 0 0 0 0 0 0 0 021 - 21.99 0.4 0.6 0 0 0 0 0 0 0 0 0 022 - 22.99 0.6 0.4 0 0 0 0 0 0 0 0 0 023 - 23.99 0.5 0.5 0 0 0 0 0 0 0 0 0 024 - 24.99 0.33 0.67 0 0 0 0 0 0 0 0 0 025 - 25.99 0 1 0 0 0 0 0 0 0 0 0 026 - 26.99 0 1 0 0 0 0 0 0 0 0 0 027 - 27.99 0 1 0 0 0 0 0 0 0 0 0 028 - 28.99 0 1 0 0 0 0 0 0 0 0 0 029 - 29.99 0 1 0 0 0 0 0 0 0 0 0 030 - 30.99 0 1 0 0 0 0 0 0 0 0 0 031 - 31.99 0 1 0 0 0 0 0 0 0 0 0 032 - 32.99 0 1 0 0 0 0 0 0 0 0 0 033 - 33.99 0 0.67 0.33 0 0 0 0 0 0 0 0 034 - 34.99 0 0.83 0.17 0 0 0 0 0 0 0 0 035 - 35.99 0 0.67 0.33 0 0 0 0 0 0 0 0 036 - 36.99 0 0.88 0.12 0 0 0 0 0 0 0 0 037 - 37.99 0 0.62 0.38 0 0 0 0 0 0 0 0 038 - 38.99 0 0.43 0.57 0 0 0 0 0 0 0 0 039 - 39.99 0 0.33 0.67 0 0 0 0 0 0 0 0 040 - 40.99 0 0.12 0.88 0 0 0 0 0 0 0 0 041 - 41.99 0 0.25 0.75 0 0 0 0 0 0 0 0 042 - 42.99 0 0.12 0.88 0 0 0 0 0 0 0 0 043 - 43.99 0 0 0.75 0.25 0 0 0 0 0 0 0 044 - 44.99 0 0.29 0.57 0.14 0 0 0 0 0 0 0 045 - 45.99 0 0.22 0.78 0 0 0 0 0 0 0 0 046 - 46.99 0 0.14 0.86 0 0 0 0 0 0 0 0 047 - 47.99 0 0.25 0.62 0.12 0 0 0 0 0 0 0 048 - 48.99 0 0.17 0.83 0 0 0 0 0 0 0 0 049 - 49.99 0 0.17 0.67 0.17 0 0 0 0 0 0 0 050 - 50.99 0 0.17 0.5 0.33 0 0 0 0 0 0 0 051 - 51.99 0 0.25 0.5 0.25 0 0 0 0 0 0 0 052 - 52.99 0 0.17 0.5 0.33 0 0 0 0 0 0 0 053 - 53.99 0 0.2 0.6 0.2 0 0 0 0 0 0 0 054 - 54.99 0 0.4 0.4 0.2 0 0 0 0 0 0 0 055 - 55.99 0 0 0.67 0.33 0 0 0 0 0 0 0 056 - 56.99 0 0 0.5 0.5 0 0 0 0 0 0 0 057 - 57.99 0 0 0.33 0.5 0.17 0 0 0 0 0 0 058 - 58.99 0 0 0.5 0.33 0.17 0 0 0 0 0 0 0
(To continue)
29

CHAPTER 3. BLUEFISH POMATOMUS SALTATRIX
Table 3.3 (Continued)Age
Interval 0 1 2 3 4 5 6 7 8 9 10 1159 - 59.99 0 0 0.33 0.5 0.17 0 0 0 0 0 0 060 - 60.99 0 0 0.5 0.5 0 0 0 0 0 0 0 061 - 61.99 0 0 0.5 0.5 0 0 0 0 0 0 0 062 - 62.99 0 0 0.8 0 0.2 0 0 0 0 0 0 063 - 63.99 0 0 0.45 0.45 0 0 0.09 0 0 0 0 064 - 64.99 0 0 0.2 0 0.6 0 0.2 0 0 0 0 065 - 65.99 0 0 0.25 0 0.5 0.25 0 0 0 0 0 066 - 66.99 0 0 0 0.5 0.5 0 0 0 0 0 0 067 - 67.99 0 0 0 0 0 1 0 0 0 0 0 068 - 68.99 0 0 0 0 1 0 0 0 0 0 0 069 - 69.99 0 0 0 0 1 0 0 0 0 0 0 070 - 70.99 0 0 0 0 0.6 0.4 0 0 0 0 0 071 - 71.99 0 0 0 0 0.5 0.25 0.25 0 0 0 0 072 - 72.99 0 0 0 0.33 0.33 0 0.33 0 0 0 0 073 - 73.99 0 0 0 0 0.33 0.67 0 0 0 0 0 074 - 74.99 0 0 0 0 0 0 0.67 0 0.33 0 0 076 - 76.99 0 0 0 0 0 0.5 0.25 0.25 0 0 0 077 - 77.99 0 0 0 0 0.2 0.2 0.6 0 0 0 0 078 - 78.99 0 0 0 0 0 0.5 0.5 0 0 0 0 079 - 79.99 0 0 0 0 0 0 1 0 0 0 0 080 - 80.99 0 0 0 0 0 0 0 1 0 0 0 081 - 81.99 0 0 0 0 0 0.14 0.43 0.14 0 0.14 0 0.1482 - 82.99 0 0 0 0 0 0 0.5 0.25 0 0 0.25 083 - 83.99 0 0 0 0 0 0 0 0 0 1 0 084 - 84.99 0 0 0 0 0 0 0 0 0 1 0 086 - 86.99 0 0 0 0 0 0 0 0 0.67 0 0.33 088 - 88.99 0 0 0 0 0 0 0 1 0 0 0 090 - 90.99 0 0 0 0 0 0 0 0 1 0 0 091 - 91.99 0 0 0 0 0 0 0 0 1 0 0 096 - 96.99 0 0 0 0 0 0 0 0 0 1 0 0
30

Chapter 4
COBIA Rachycentron canadum

CHAPTER 4. COBIA RACHYCENTRON CANADUM
4.1 INTRODUCTION
We aged a total of 287 cobia, Rachycentroncanadum, collected by the VMRC’s Biolog-ical Sampling Program for age and growthanalysis in 2014. Cobia ages ranged from2 to 12 years old with an average age of4.7, a standard deviation of 1.8, and a stan-dard error of 0.11. Ten age classes (2 to 10,12) were represented, comprising fish of the2002, 2004 to 2012 year-classes. The sam-ple was dominated by fish from the year-class of 2010 with 54.4%.
4.2 METHODS
4.2.1 Handling of collections
Sagittal otoliths, hereafter, referred to as"otoliths", were received by the Age andGrowth Laboratory in labeled coin en-velopes and were sorted by date of capture,their envelope labels were verified againstVMRC’s collection data, and each fish wasassigned a unique Age and Growth Labo-ratory identification number. All otolithswere stored inside of protective Axygen 2ml micro-tubes within their original labeledcoin envelopes.
4.2.2 Preparation
Otoliths were processed for age determina-tion. The left or right otolith was ran-domly selected and embedded, distal sidedown, in epoxy resin and allowed to hardenovernight. The otoliths were viewed by eye,and when necessary, under a stereo micro-scope to identify the location of the core,and the position of the core marked us-ing a permanent marker across the epoxyresin surface. At least one transversecross-section (hereafter "thin-section") wasthen removed from the marked core of
each otolith using a Buehler IsoMetTM low-speed saw equipped with two, three inch di-ameter, Norton Diamond Grinding Wheels,separated by a stainless steel spacer of0.5 mm (diameter 2.5"). The position ofthe marked core fell within the 0.5 mmspace between the blades, such that thecore was included in the removed thin sec-tion. Otolith thin-sections were placedon labeled glass slides and covered with athin layer of Flo-texx mounting mediumthat not only fixed the sections to theslide, but more importantly, provided en-hanced contrast and greater readability byincreasing light transmission through thesection.
Click here to obtain the protocol at theCQFE website on how to prepare otoliththin-section for ageing cobia.
4.2.3 Readings
The CQFE system assigns an age class toa fish based on a combination of numberof annuli in a thin-section, the date of cap-ture, and the species-specific period whenthe annulus is deposited. Each year, asthe fish grows, its otoliths grow and leavebehind markers of their age, called an an-nulus. Technically, an otolith annulus isthe combination of both the opaque andthe translucent band. In practice, only theopaque bands are counted as annuli. Thenumber of annuli replaces "x" in our nota-tion below, and is the initial "age" assign-ment of the fish.
Second, the thin-section is examined fortranslucent growth. If no translucentgrowth is visible beyond the last annulus,the otolith is called "even" and no modi-fication of the assigned age is made. Theinitial assigned age, then, is the age class ofthe fish. Any growth beyond the last an-nulus can be interpreted as either being to-ward the next age class or within the sameage class. If translucent growth is visible
32
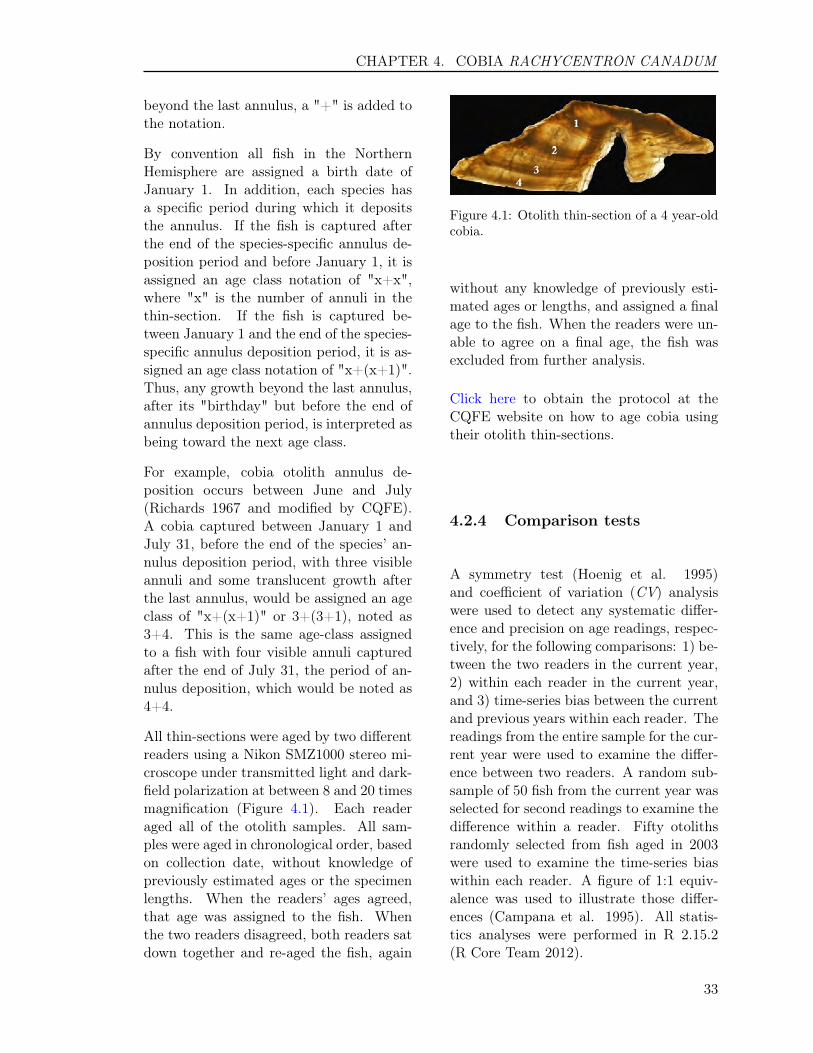
CHAPTER 4. COBIA RACHYCENTRON CANADUM
beyond the last annulus, a "+" is added tothe notation.
By convention all fish in the NorthernHemisphere are assigned a birth date ofJanuary 1. In addition, each species hasa specific period during which it depositsthe annulus. If the fish is captured afterthe end of the species-specific annulus de-position period and before January 1, it isassigned an age class notation of "x+x",where "x" is the number of annuli in thethin-section. If the fish is captured be-tween January 1 and the end of the species-specific annulus deposition period, it is as-signed an age class notation of "x+(x+1)".Thus, any growth beyond the last annulus,after its "birthday" but before the end ofannulus deposition period, is interpreted asbeing toward the next age class.
For example, cobia otolith annulus de-position occurs between June and July(Richards 1967 and modified by CQFE).A cobia captured between January 1 andJuly 31, before the end of the species’ an-nulus deposition period, with three visibleannuli and some translucent growth afterthe last annulus, would be assigned an ageclass of "x+(x+1)" or 3+(3+1), noted as3+4. This is the same age-class assignedto a fish with four visible annuli capturedafter the end of July 31, the period of an-nulus deposition, which would be noted as4+4.
All thin-sections were aged by two differentreaders using a Nikon SMZ1000 stereo mi-croscope under transmitted light and dark-field polarization at between 8 and 20 timesmagnification (Figure 4.1). Each readeraged all of the otolith samples. All sam-ples were aged in chronological order, basedon collection date, without knowledge ofpreviously estimated ages or the specimenlengths. When the readers’ ages agreed,that age was assigned to the fish. Whenthe two readers disagreed, both readers satdown together and re-aged the fish, again
Figure 4.1: Otolith thin-section of a 4 year-oldcobia.
without any knowledge of previously esti-mated ages or lengths, and assigned a finalage to the fish. When the readers were un-able to agree on a final age, the fish wasexcluded from further analysis.
Click here to obtain the protocol at theCQFE website on how to age cobia usingtheir otolith thin-sections.
4.2.4 Comparison tests
A symmetry test (Hoenig et al. 1995)and coefficient of variation (CV) analysiswere used to detect any systematic differ-ence and precision on age readings, respec-tively, for the following comparisons: 1) be-tween the two readers in the current year,2) within each reader in the current year,and 3) time-series bias between the currentand previous years within each reader. Thereadings from the entire sample for the cur-rent year were used to examine the differ-ence between two readers. A random sub-sample of 50 fish from the current year wasselected for second readings to examine thedifference within a reader. Fifty otolithsrandomly selected from fish aged in 2003were used to examine the time-series biaswithin each reader. A figure of 1:1 equiv-alence was used to illustrate those differ-ences (Campana et al. 1995). All statis-tics analyses were performed in R 2.15.2(R Core Team 2012).
33

CHAPTER 4. COBIA RACHYCENTRON CANADUM
4.3 RESULTS
4.3.1 Reading precision
Both readers had high self-precision.Specifically, there was no significant differ-ence between the first and second readingsfor Reader 1 with an agreement of 94% anda CV of 1.7% (test of symmetry: χ2 = 3, df= 3, P = 0.3916), and there was no signifi-cant difference between the first and secondreadings for Reader 2 with an agreement of96% and a CV of 1% (test of symmetry: χ2
= 2, df = 2, P = 0.3679). There was no ev-idence of systematic disagreement betweenReader 1 and Reader 2 with an agreementof 95.12% and a CV of 0.9% (test of symme-try: χ2 = 4.67, df = 7, P = 0.7006) (Figure4.2).
Figure 4.2: Between-reader comparison ofotolith age estimates for cobia collected inChesapeake Bay and Virginia waters of the At-lantic Ocean in 2014.
There was no time-series bias for both read-ers. Reader 1 had an agreement of 86%with ages of fish aged in 2000 with a CV of1.2% (test of symmetry: χ2 = 5, df = 6, P= 0.5438). Reader 2 had an agreement of86% with a CV of 1.7% (test of symmetry:χ2 = 7, df = 7, P = 0.4289).
4.3.2 Year class
Of the 287 fish aged with otoliths, 10 ageclasses (2 to 10, 12) were represented (Ta-ble 4.1). The average age was 4.7 years,and the standard deviation and standarderror were 1.8 and 0.11, respectively. Year-class data show that the fishery was com-prised of 10 year-classes: fish from the2002, 2004 to 2012 year-classes, with fishprimarily from the year class of 2010 with54.4%. The ratio of males to females was1:1.15 in the sample collected (Figure 4.3).
Figure 4.3: Year-class frequency distributionfor cobia collected for ageing in 2014. Distri-bution is broken down by sex. ’Unknown’ rep-resents gonads that were not available for ex-amination or were not examined for sex duringsampling.
4.3.3 Age-length key
We developed an age-length-key (Table4.2) that can be used in the conversion ofnumbers-at-length in the estimated catchto numbers-at-age using otolith ages. Thetable is based on VMRC’s stratified sam-pling of landings by total length inch inter-vals.
34

CHAPTER 4. COBIA RACHYCENTRON CANADUM
4.4 REFERENCES
Campana, S.E., M.C. Annand, and J.I.McMillan. 1995. Graphical and statis-tical methods for determining the con-sistency of age determinations. Trans.Am. Fish. Soc. 124:131-138.
Hoenig, J.M., M.J. Morgan, and C.A.Brown. 1995. Analysing differences be-tween two age determination methodsby tests of symmetry. Can. J. Fish.Aquat. Sci. 52:364-368.
R Core Team (2012). R: A lan-guage and environment for statisticalcomputing. R Foundation for Sta-tistical Computing, Vienna, Austria.ISBN 3-900051-07-0, URL http://www.R-project.org.
Richards, C.E. 1967. Age, Growth, andFecundity of the Cobia, Rachycentroncanadum, from Chesapeake Bay andAdjacent Waters. Contribution No.252, Virginia Institute of Marine Sci-ence, Gloucester Point, Virginia, 343-350.
35
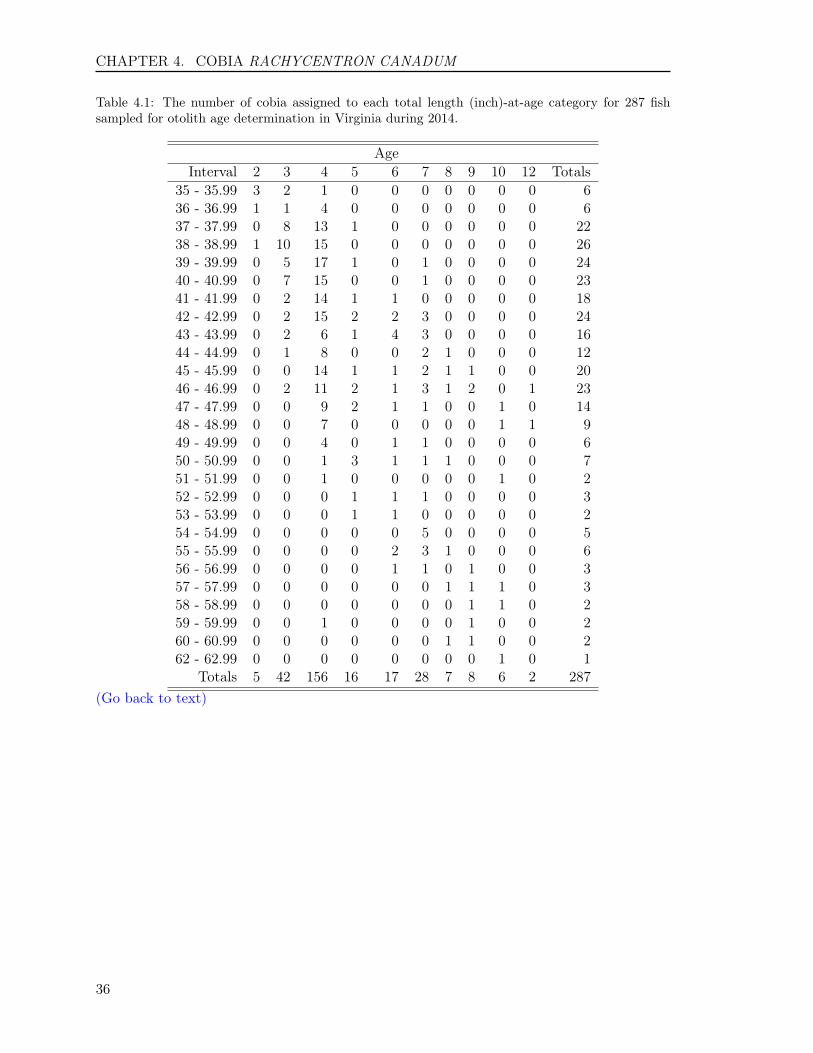
CHAPTER 4. COBIA RACHYCENTRON CANADUM
Table 4.1: The number of cobia assigned to each total length (inch)-at-age category for 287 fishsampled for otolith age determination in Virginia during 2014.
AgeInterval 2 3 4 5 6 7 8 9 10 12 Totals
35 - 35.99 3 2 1 0 0 0 0 0 0 0 636 - 36.99 1 1 4 0 0 0 0 0 0 0 637 - 37.99 0 8 13 1 0 0 0 0 0 0 2238 - 38.99 1 10 15 0 0 0 0 0 0 0 2639 - 39.99 0 5 17 1 0 1 0 0 0 0 2440 - 40.99 0 7 15 0 0 1 0 0 0 0 2341 - 41.99 0 2 14 1 1 0 0 0 0 0 1842 - 42.99 0 2 15 2 2 3 0 0 0 0 2443 - 43.99 0 2 6 1 4 3 0 0 0 0 1644 - 44.99 0 1 8 0 0 2 1 0 0 0 1245 - 45.99 0 0 14 1 1 2 1 1 0 0 2046 - 46.99 0 2 11 2 1 3 1 2 0 1 2347 - 47.99 0 0 9 2 1 1 0 0 1 0 1448 - 48.99 0 0 7 0 0 0 0 0 1 1 949 - 49.99 0 0 4 0 1 1 0 0 0 0 650 - 50.99 0 0 1 3 1 1 1 0 0 0 751 - 51.99 0 0 1 0 0 0 0 0 1 0 252 - 52.99 0 0 0 1 1 1 0 0 0 0 353 - 53.99 0 0 0 1 1 0 0 0 0 0 254 - 54.99 0 0 0 0 0 5 0 0 0 0 555 - 55.99 0 0 0 0 2 3 1 0 0 0 656 - 56.99 0 0 0 0 1 1 0 1 0 0 357 - 57.99 0 0 0 0 0 0 1 1 1 0 358 - 58.99 0 0 0 0 0 0 0 1 1 0 259 - 59.99 0 0 1 0 0 0 0 1 0 0 260 - 60.99 0 0 0 0 0 0 1 1 0 0 262 - 62.99 0 0 0 0 0 0 0 0 1 0 1
Totals 5 42 156 16 17 28 7 8 6 2 287(Go back to text)
36

CHAPTER 4. COBIA RACHYCENTRON CANADUM
Table 4.2: Age-Length key, as proportion-at-age in each 1-inch length interval, based on otolith agesfor cobia sampled for age determination in Virginia during 2014.
AgeInterval 2 3 4 5 6 7 8 9 10 12
35 - 35.99 0.5 0.33 0.17 0 0 0 0 0 0 036 - 36.99 0.17 0.17 0.67 0 0 0 0 0 0 037 - 37.99 0 0.36 0.59 0.05 0 0 0 0 0 038 - 38.99 0.04 0.38 0.58 0 0 0 0 0 0 039 - 39.99 0 0.21 0.71 0.04 0 0.04 0 0 0 040 - 40.99 0 0.3 0.65 0 0 0.04 0 0 0 041 - 41.99 0 0.11 0.78 0.06 0.06 0 0 0 0 042 - 42.99 0 0.08 0.62 0.08 0.08 0.12 0 0 0 043 - 43.99 0 0.12 0.38 0.06 0.25 0.19 0 0 0 044 - 44.99 0 0.08 0.67 0 0 0.17 0.08 0 0 045 - 45.99 0 0 0.7 0.05 0.05 0.1 0.05 0.05 0 046 - 46.99 0 0.09 0.48 0.09 0.04 0.13 0.04 0.09 0 0.0447 - 47.99 0 0 0.64 0.14 0.07 0.07 0 0 0.07 048 - 48.99 0 0 0.78 0 0 0 0 0 0.11 0.1149 - 49.99 0 0 0.67 0 0.17 0.17 0 0 0 050 - 50.99 0 0 0.14 0.43 0.14 0.14 0.14 0 0 051 - 51.99 0 0 0.5 0 0 0 0 0 0.5 052 - 52.99 0 0 0 0.33 0.33 0.33 0 0 0 053 - 53.99 0 0 0 0.5 0.5 0 0 0 0 054 - 54.99 0 0 0 0 0 1 0 0 0 055 - 55.99 0 0 0 0 0.33 0.5 0.17 0 0 056 - 56.99 0 0 0 0 0.33 0.33 0 0.33 0 057 - 57.99 0 0 0 0 0 0 0.33 0.33 0.33 058 - 58.99 0 0 0 0 0 0 0 0.5 0.5 059 - 59.99 0 0 0.5 0 0 0 0 0.5 0 060 - 60.99 0 0 0 0 0 0 0.5 0.5 0 062 - 62.99 0 0 0 0 0 0 0 0 1 0
(Go back to text)
37

Chapter 5
RED DRUM Sciaenops ocellatus

CHAPTER 5. RED DRUM SCIAENOPS OCELLATUS
5.1 INTRODUCTION
We aged a total of 80 red drum, Sciaenopsocellatus, collected by the VMRC’s Biolog-ical Sampling Program for age and growthanalysis in 2014. Red drum ages rangedfrom 1 to 3 years old with an average ageof 2.8, a standard deviation of 0.5, and astandard error of 0.06. Three age classes(1 to 3) were represented, comprising fish ofthe 2011 to 2013 year-classes. The samplewas dominated by fish from the year-classof 2011 with 83.8%.
5.2 METHODS
5.2.1 Handling of collections
Sagittal otoliths, hereafter, referred to as"otoliths", were received by the Age andGrowth Laboratory in labeled coin en-velopes, and were sorted by date of capture.Their envelope labels were verified againstVMRC’s collection data, and each fish wasassigned a unique Age and Growth Labo-ratory identification number. All otolithswere stored dry in their original labeledcoin envelopes.
5.2.2 Preparation
Otoliths were processed for age determi-nation following the methods describedin Ross et al. (1993) and Jones andWells (1998) for red drum. The left orright sagittal otolith was randomly se-lected and attached, distal side down, toa glass slide with CrystalbondTM 509 ad-hesive. The otoliths were viewed by eye,and when necessary, under a stereo micro-scope to identify the location of the core,and the position of the core marked us-ing a pencil across the otolith surface. Atleast one transverse cross-section (hereafter"thin-section") was then removed from the
marked core of each otolith using a BuehlerIsoMetTM low-speed saw equipped withtwo, three inch diameter, Norton DiamondGrinding Wheels, separated by a stainlesssteel spacer of 0.5 mm (diameter 2.5"). Theposition of the marked core fell within the0.5 mm space between the blades, such thatthe core was included in the removed thin-section. Otolith thin-sections were placedon labeled glass slides and covered with athin layer of Flo-texx mounting mediumthat not only fixed the sections to theslide, but more importantly, provided en-hanced contrast and greater readability byincreasing light transmission through thesections.
Click here to obtain the protocol at theCQFE website on how to prepare otoliththin-section for ageing red drum.
5.2.3 Readings
The CQFE system assigns an age class toa fish based on a combination of numberof annuli in a thin-section, the date of cap-ture, and the species-specific period whenthe annulus is deposited. Each year, asthe fish grows, its otoliths grow and leavebehind markers of their age, called an an-nulus. Technically, an otolith annulus isthe combination of both the opaque andthe translucent band. In practice, only theopaque bands are counted as annuli. Thenumber of annuli replaces "x" in our nota-tion below, and is the initial "age" assign-ment of the fish.
Second, the thin-section is examined fortranslucent growth. If no translucentgrowth is visible beyond the last annulus,the otolith is called "even" and no modi-fication of the assigned age is made. Theinitial assigned age, then, is the age class ofthe fish. Any growth beyond the last an-nulus can be interpreted as either being to-ward the next age class or within the sameage class. If translucent growth is visible
40

CHAPTER 5. RED DRUM SCIAENOPS OCELLATUS
beyond the last annulus, a "+" is added tothe notation.
By convention all fish in the NorthernHemisphere are assigned a birth date ofJanuary 1. In addition, each species hasa specific period during which it depositsthe annulus. If the fish is captured afterthe end of the species-specific annulus de-position period and before January 1, it isassigned an age class notation of "x+x",where "x" is the number of annuli in thethin-section. If the fish is captured be-tween January 1 and the end of the species-specific annulus deposition period, it is as-signed an age class notation of "x+(x+1)".Thus, any growth beyond the last annulus,after its "birthday" but before the end ofannulus deposition period, is interpreted asbeing toward the next age class.
For example, red drum annulus formationoccurs between March and June (Ross et al.1995 and modified by CQFE). A red drumcaptured between January 1 and June 30,before the end of the species’ annulus de-position period, with three visible annuliand some translucent growth after the lastannulus, would be assigned an age classof "x+(x+1)" or 3+(3+1), noted as 3+4.This is the same age-class assigned to a fishwith four visible annuli captured after theend of June 30, the period of annulus depo-sition, which would be noted as 4+4.
All thin-sections were aged by two differentreaders using a Nikon SMZ1000 stereo mi-croscope under transmitted light and dark-field polarization at between 8 and 20 timesmagnification (Figure 5.1). Each readeraged all of the otolith samples.
All samples were aged in chronologicalorder, based on collection date, withoutknowledge of previously estimated ages orthe specimen lengths. When the readers’ages agreed, that age was assigned to thefish. When the two readers disagreed, bothreaders sat down together and re-aged thefish, again without any knowledge of pre-
Figure 5.1: Otolith thin-section of a 4 year-oldred drum with the last annulus on the edge ofthe thin-section
viously estimated ages or lengths, and as-signed a final age to the fish. When thereaders were unable to agree on a final age,the fish was excluded from further analy-sis.
Click here to obtain the protocol at theCQFE website on how to age red drum us-ing their otolith thin-sections.
5.2.4 Comparison tests
A symmetry test (Hoenig et al. 1995)and coefficient of variation (CV) analysiswere used to detect any systematic differ-ence and precision on age readings, respec-tively, for the following comparisons: 1) be-tween the two readers in the current year,2) within each reader in the current year,and 3) time-series bias between the currentand previous years within each reader. Thereadings from the entire sample for the cur-rent year were used to examine the differ-ence between two readers. A random sub-sample of 50 fish from the current year wasselected for second readings to examine thedifference within a reader. Fifty otolithsrandomly selected from fish aged in 2003were used to examine the time-series biaswithin each reader. A figure of 1:1 equiv-alence was used to illustrate those differ-ences (Campana et al. 1995). All statis-tics analyses were performed in R 2.15.2(R Core Team 2012).
41

CHAPTER 5. RED DRUM SCIAENOPS OCELLATUS
5.3 RESULTS
5.3.1 Reading precision
Both readers had high self-precision.Specifically, there was no significant dif-ference between the first and second read-ings for Reader 1 with an agreement of100% , and there was no significant differ-ence between the first and second readingsfor Reader 2 with an agreement of 100%.There was no evidence of systematic dis-agreement between Reader 1 and Reader2 with an agreement of 100% (Figure 5.2).
Figure 5.2: Between-reader comparison ofotolith age estimates for red drum collected inChesapeake Bay and Virginia waters of the At-lantic Ocean in 2014.
There was no time-series bias for both read-ers. Reader 1 had an agreement of 98%with ages of fish aged in 2000 with a CV of0.4% (test of symmetry: χ2 = 1, df = 1, P= 0.3173). Reader 2 had an agreement of98% with a CV of 0.1% (test of symmetry:χ2 = 1, df = 1, P = 0.3173).
5.3.2 Year class
Of the 80 fish aged with otoliths, 3 ageclasses (1 to 3) were represented (Table5.1). The average age was 2.8 years, andthe standard deviation and standard error
were 0.5 and 0.06, respectively. Year-classdata show that the fishery was comprised of3 year-classes: fish from the 2011 to 2013year-classes, with fish primarily from theyear class of 2011 with 83.8%. The ratio ofmales to females was 1:0.42 in the samplecollected (Figure 5.3).
Figure 5.3: Year-class frequency distributionfor red drum collected for ageing in 2014. Dis-tribution is broken down by sex. ’Unknown’represents gonads that were not available forexamination or were not examined for sex dur-ing sampling.
5.3.3 Age-length key
We developed an age-length-key (Table5.2) that can be used in the conversion ofnumbers-at-length in the estimated catchto numbers-at-age using otolith ages. Thetable is based on VMRC’s stratified sam-pling of landings by total length inch inter-vals.
5.4 REFERENCES
Campana, S.E., M.C. Annand, and J.I.McMillan. 1995. Graphical and statis-tical methods for determining the con-sistency of age determinations. Trans.Am. Fish. Soc. 124:131-138.
Hoenig, J.M., M.J. Morgan, and C.A.Brown. 1995. Analyzing differences be-
42
CHAPTER 5. RED DRUM SCIAENOPS OCELLATUS
tween two age determination methodsby tests of symmetry. Can. J. Fish.Aquat. Sci. 52:364-368.
R Core Team (2012). R: A lan-guage and environment for statisticalcomputing. R Foundation for Sta-tistical Computing, Vienna, Austria.ISBN 3-900051-07-0, URL http://www.R-project.org.
Ross, J., Stevens, T., Vaughan, D. 1995.Age, Growth, Mortality, and Reproduc-tive Biology of Red Drums in North Car-olina Waters. Trans. Amer. Fish. Soc.124:37-54.
43

CHAPTER 5. RED DRUM SCIAENOPS OCELLATUS
Table 5.1: The number of red drum assigned to each total length (inch)-at-age category for 80 fishsampled for otolith age determination in Virginia during 2014.
AgeInterval 1 2 3 Totals
17 - 17.99 1 0 0 118 - 18.99 2 0 1 319 - 19.99 1 0 1 220 - 20.99 0 0 2 221 - 21.99 0 0 9 922 - 22.99 0 1 11 1223 - 23.99 0 4 9 1324 - 24.99 0 3 13 1625 - 25.99 0 0 8 826 - 26.99 0 1 10 1127 - 27.99 0 0 2 229 - 29.99 0 0 1 1
Totals 4 9 67 80(Go back to text)
44
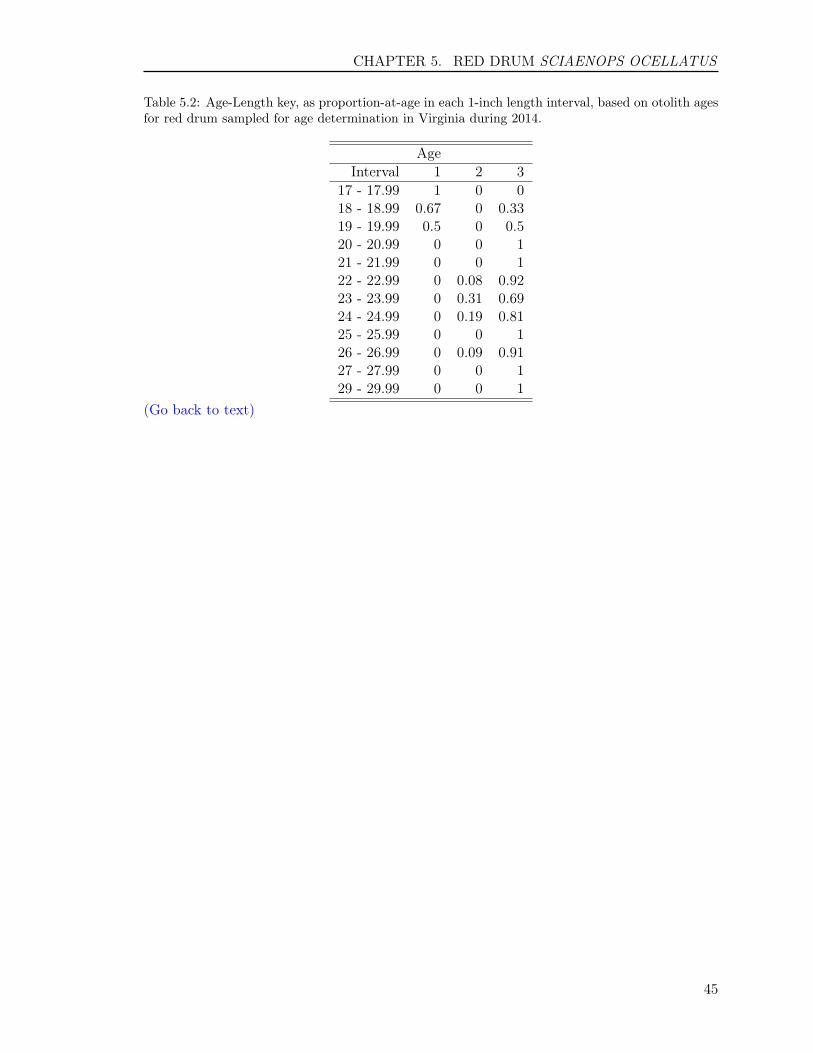
CHAPTER 5. RED DRUM SCIAENOPS OCELLATUS
Table 5.2: Age-Length key, as proportion-at-age in each 1-inch length interval, based on otolith agesfor red drum sampled for age determination in Virginia during 2014.
AgeInterval 1 2 3
17 - 17.99 1 0 018 - 18.99 0.67 0 0.3319 - 19.99 0.5 0 0.520 - 20.99 0 0 121 - 21.99 0 0 122 - 22.99 0 0.08 0.9223 - 23.99 0 0.31 0.6924 - 24.99 0 0.19 0.8125 - 25.99 0 0 126 - 26.99 0 0.09 0.9127 - 27.99 0 0 129 - 29.99 0 0 1
(Go back to text)
45

Chapter 6
SHEEPSHEAD Archosargusprobatocephalus

CHAPTER 6. SHEEPSHEAD ARCHOSARGUS PROBATOCEPHALUS
6.1 INTRODUCTION
We aged a total of 120 sheepshead, Ar-chosargus probatocephalus, collected bythe VMRC’s Biological Sampling Programfor age and growth analysis in 2014.Sheepshead ages ranged from 2 to 28 yearsold with an average age of 8.5, a standarddeviation of 6.6, and a standard error of0.6. Twenty age classes (2 to 9, 12 to 13, 15to 18, 20 to 21, 23 to 24, 26, 28) were rep-resented, comprising fish of the 1986, 1988,1990 to 1991, 1993 to 1994, 1996 to 1999,2001 to 2002, 2005 to 2012 year-classes.The sample was dominated by fish from theyear-class of 2011 with 30.8%.
6.2 METHODS
6.2.1 Handling of collections
Sagittal otoliths, hereafter, referred to as"otoliths", were received by the Age andGrowth Laboratory in labeled coin en-velopes,and were sorted by date of capture.Their envelope labels were verified againstVMRC’s collection data, and each fish wasassigned a unique Age and Growth Labo-ratory identification number. All otolithswere stored dry in their original labeledcoin envelopes.
6.2.2 Preparation
Otoliths were processed for age determi-nation following the methods described inBallenger et al. (in progress). The leftor right otolith was randomly selected andembedded, distal side down, in epoxy resinand allowed to harden overnight. Theotoliths were viewed by eye, and when nec-essary, under a stereo microscope to iden-tify the location of the core, and the posi-tion of the core marked using a permanentmarker across the epoxy resin surface. At
least one transverse cross-section (hereafter"thin-section") was then removed from themarked core of each otolith using a BuehlerIsoMetTM low-speed saw equipped withtwo, three inch diameter, Norton DiamondGrinding Wheels, separated by a stainlesssteel spacer of 0.5 mm (diameter 2.5"). Theposition of the marked core fell within the0.5 mm space between the blades, such thatthe core was included in the removed thinsection. Otolith thin-sections were placedon labeled glass slides and covered with athin layer of Flo-texx mounting mediumthat not only fixed the sections to theslide, but more importantly, provided en-hanced contrast and greater readability byincreasing light transmission through thesection.
Click here to obtain the protocol at theCQFE website on how to prepare otoliththin-section for ageing sheepshead.
6.2.3 Readings
The CQFE system assigns an age class toa fish based on a combination of numberof annuli in a thin-section, the date of cap-ture, and the species-specific period whenthe annulus is deposited. Each year, asthe fish grows, its otoliths grow and leavebehind markers of their age, called an an-nulus. Technically, an otolith annulus isthe combination of both the opaque andthe translucent band. In practice, only theopaque bands are counted as annuli. Thenumber of annuli replaces "x" in our nota-tion below, and is the initial "age" assign-ment of the fish.
Second, the thin-section is examined fortranslucent growth. If no translucentgrowth is visible beyond the last annulus,the otolith is called "even" and no modi-fication of the assigned age is made. Theinitial assigned age, then, is the age class ofthe fish. Any growth beyond the last an-nulus can be interpreted as either being to-
48

CHAPTER 6. SHEEPSHEAD ARCHOSARGUS PROBATOCEPHALUS
ward the next age class or within the sameage class. If translucent growth is visiblebeyond the last annulus, a "+" is added tothe notation.
By convention all fish in the NorthernHemisphere are assigned a birth date ofJanuary 1. In addition, each species hasa specific period during which it depositsthe annulus. If the fish is captured afterthe end of the species-specific annulus de-position period and before January 1, it isassigned an age class notation of "x+x",where "x" is the number of annuli in thethin-section. If the fish is captured be-tween January 1 and the end of the species-specific annulus deposition period, it is as-signed an age class notation of "x+(x+1)".Thus, any growth beyond the last annulus,after its "birthday" but before the end ofannulus deposition period, is interpreted asbeing toward the next age class.
For example, sheepshead otolith annu-lus formation occurs between May andJune (Ballenger et al. in progress). Asheepshead captured between January 1and July 31, before the end of the species’annulus deposition period, with three visi-ble annuli and some translucent growth af-ter the last annulus, would be assigned anage class of "x+(x+1)" or 3+(3+1), notedas 3+4. This is the same age-class assignedto a fish with four visible annuli capturedafter the end of May 31, the period of an-nulus deposition, which would be noted as4+4.
All thin-sections were aged by two differentreaders using a Nikon SMZ1000 stereo mi-croscope under transmitted light and dark-field polarization at between 8 and 20 timesmagnification (Figure 6.1). Each readeraged all of the otolith samples. All sam-ples were aged in chronological order, basedon collection date, without knowledge ofpreviously estimated ages or the specimenlengths. When the readers’ ages agreed,that age was assigned to the fish. When
Figure 6.1: Otolith thin-section of a 5 year-oldsheepshead
the two readers disagreed, both readers satdown together and re-aged the fish, againwithout any knowledge of previously esti-mated ages or lengths, and assigned a finalage to the fish. When the readers were un-able to agree on a final age, the fish wasexcluded from further analysis.
Click here to obtain the protocol at theCQFE website on how to age sheepsheadusing their otolith thin-sections.
6.2.4 Comparison tests
A symmetry test (Hoenig et al. 1995)and coefficient of variation (CV) analysiswere used to detect any systematic differ-ence and precision on age readings, respec-tively, for the following comparisons: 1) be-tween the two readers in the current year,2) within each reader in the current year,and 3) time-series bias between the currentand previous years within each reader. Thereadings from the entire sample for the cur-rent year were used to examine the differ-ence between two readers. A random sub-sample of 50 fish from the current year wasselected for second readings to examine thedifference within a reader. Fifty otolithsrandomly selected from fish aged in 2003were used to examine the time-series biaswithin each reader. A figure of 1:1 equiv-alence was used to illustrate those differ-ences (Campana et al. 1995). All statis-tics analyses were performed in R 2.15.2(R Core Team 2012).
49

CHAPTER 6. SHEEPSHEAD ARCHOSARGUS PROBATOCEPHALUS
6.3 RESULTS
6.3.1 Reading precision
Both readers had high self-precision.Specifically, there was no significant differ-ence between the first and second readingsfor Reader 1 with an agreement of 88% anda CV of 1.3% (test of symmetry: χ2 = 4, df= 5, P = 0.5494), and there was no signifi-cant difference between the first and secondreadings for Reader 2 with an agreement of76% and a CV of 3% (test of symmetry: χ2
= 9, df = 7, P = 0.2527). There was no ev-idence of systematic disagreement betweenReader 1 and Reader 2 with an agreementof 75.83% and a CV of 2.1% (test of sym-metry: χ2 = 21.67, df = 15, P = 0.1168)(Figure 6.2).
Figure 6.2: Between-reader comparison ofotolith age estimates for sheepshead collectedin Chesapeake Bay and Virginia waters of theAtlantic Ocean in 2014.
There was no time-series bias for both read-ers. Reader 1 had an agreement of 98%with ages of fish aged in 2008 with a CV of0.1% (test of symmetry: χ2 = 1, df = 1, P= 0.3173). Reader 2 had an agreement of100% .
6.3.2 Year class
Of the 120 fish aged with otoliths, 20 ageclasses (2 to 9, 12 to 13, 15 to 18, 20 to 21,
23 to 24, 26, 28) were represented (Table6.1). The average age was 8.5 years, andthe standard deviation and standard errorwere 6.6 and 0.6, respectively. Year-classdata show that the fishery was comprisedof 20 year-classes: fish from the 1986, 1988,1990 to 1991, 1993 to 1994, 1996 to 1999,2001 to 2002, 2005 to 2012 year-classes,with fish primarily from the year class of2011 with 30.8%. The ratio of males tofemales was 1:0.65 in the sample collected(Figure 6.3).
Figure 6.3: Year-class frequency distributionfor sheepshead collected for ageing in 2014.Distribution is broken down by sex. ’Unknown’represents gonads that were not available forexamination or were not examined for sex dur-ing sampling.
6.3.3 Age-length key
We developed an age-length-key (Table6.2) that can be used in the conversion ofnumbers-at-length in the estimated catchto numbers-at-age using otolith ages. Thetable is based on VMRC’s stratified sam-pling of landings by total length inch inter-vals.
6.4 REFERENCES
Campana, S.E., M.C. Annand, and J.I.McMillan. 1995. Graphical and statis-tical methods for determining the con-
50
CHAPTER 6. SHEEPSHEAD ARCHOSARGUS PROBATOCEPHALUS
sistency of age determinations. Trans.Am. Fish. Soc. 124:131-138.
Ballenger, J. H. Liao, and C.M. Jones.(in progress). Length-weight, Ageand Growth of Sheepshead, Archosar-gus probatocephalus (Pisces: Sparidae),from the Chesapeake Bay region, Vir-ginia: A Comparison to other Areas.Fisheries Bulletin.
Hoenig, J.M., M.J. Morgan, and C.A.Brown. 1995. Analyzing differences be-tween two age determination methodsby tests of symmetry. Can. J. Fish.Aquat. Sci. 52:364-368.
R Core Team (2012). R: A lan-guage and environment for statisticalcomputing. R Foundation for Sta-tistical Computing, Vienna, Austria.ISBN 3-900051-07-0, URL http://www.R-project.org.
51
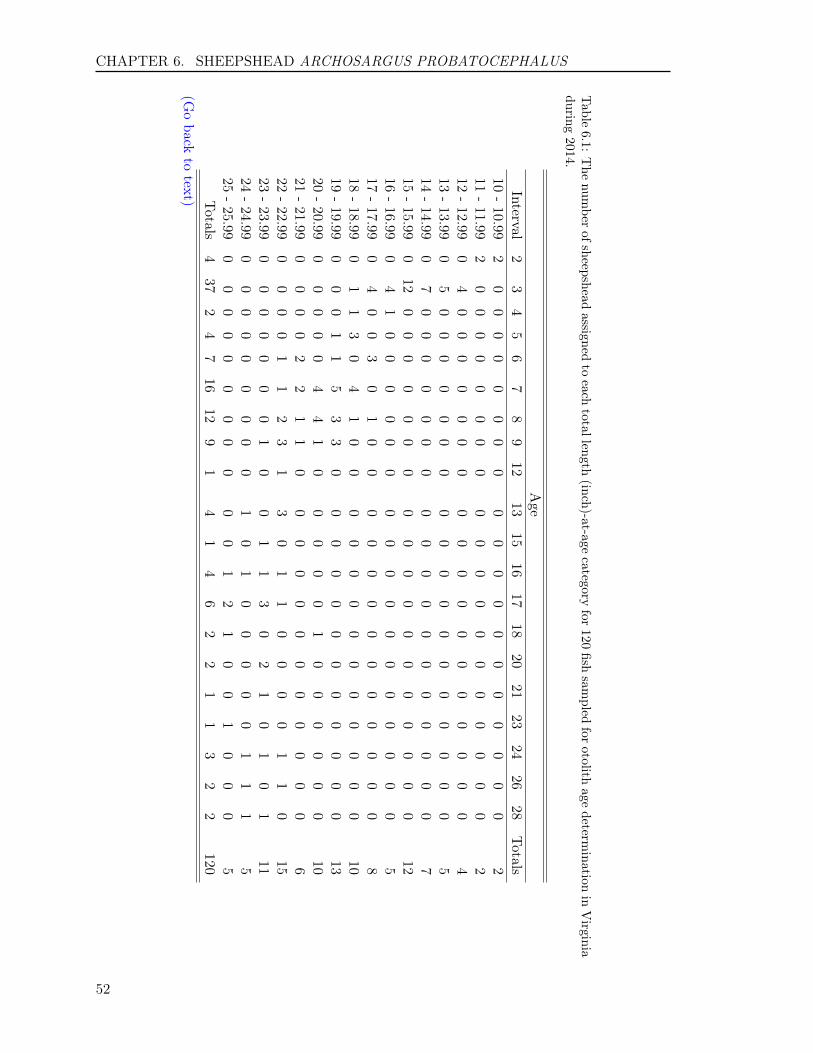
CHAPTER 6. SHEEPSHEAD ARCHOSARGUS PROBATOCEPHALUS
Table
6.1:The
number
ofsheepsheadassigned
toeach
totallength(inch)-at-age
categoryfor
120fish
sampled
forotolith
agedeterm
inationin
Virginia
during2014.
Age
Interval2
34
56
78
912
1315
1617
1820
2123
2426
28Totals
10-10.99
20
00
00
00
00
00
00
00
00
00
211
-11.99
20
00
00
00
00
00
00
00
00
00
212
-12.99
04
00
00
00
00
00
00
00
00
00
413
-13.99
05
00
00
00
00
00
00
00
00
00
514
-14.99
07
00
00
00
00
00
00
00
00
00
715
-15.99
012
00
00
00
00
00
00
00
00
00
1216
-16.99
04
10
00
00
00
00
00
00
00
00
517
-17.99
04
00
30
10
00
00
00
00
00
00
818
-18.99
01
13
04
10
00
00
00
00
00
00
1019
-19.99
00
01
15
33
00
00
00
00
00
00
1320
-20.99
00
00
04
41
00
00
01
00
00
00
1021
-21.99
00
00
22
11
00
00
00
00
00
00
622
-22.99
00
00
11
23
13
01
10
00
01
10
1523
-23.99
00
00
00
01
00
11
30
21
01
01
1124
-24.99
00
00
00
00
01
01
00
00
01
11
525
-25.99
00
00
00
00
00
01
21
00
10
00
5Totals
437
24
716
129
14
14
62
21
13
22
120(G
oback
totext)
52
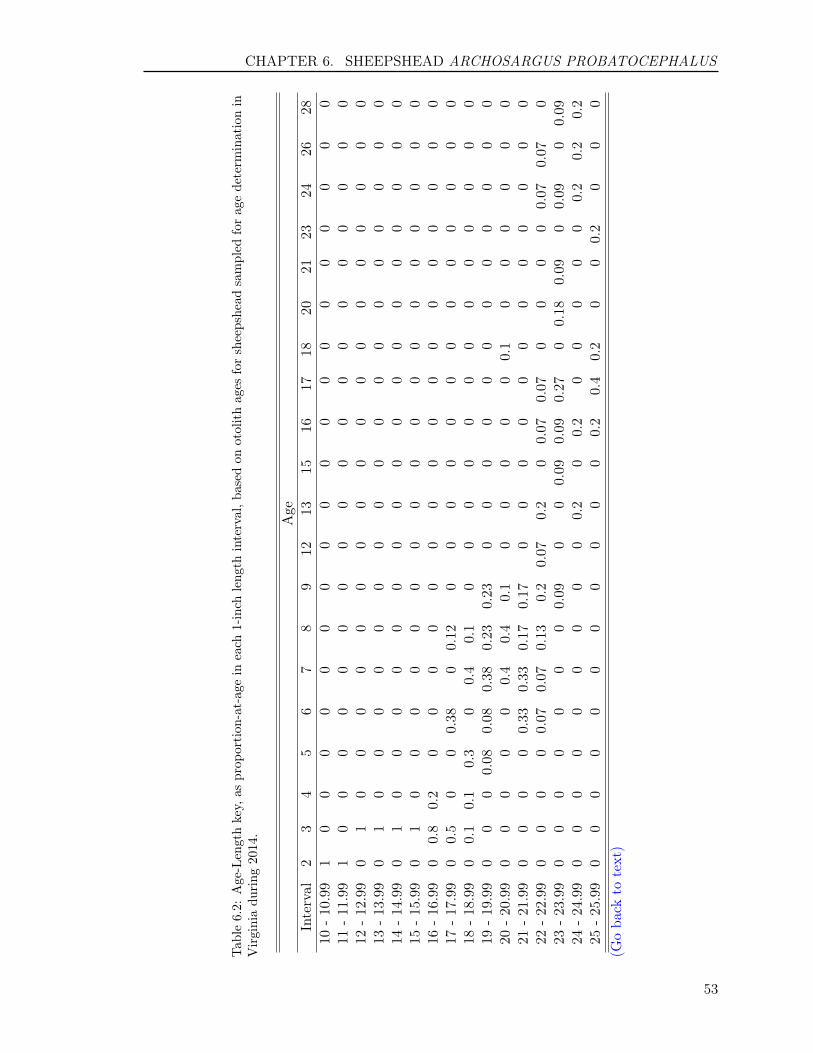
CHAPTER 6. SHEEPSHEAD ARCHOSARGUS PROBATOCEPHALUS
Tab
le6.2:
Age-Lengthkey,
asprop
ortion
-at-agein
each
1-inch
leng
thinterval,b
ased
onotolithages
forsheepshead
sampled
forag
edeterm
inationin
Virginiadu
ring
2014.
Age
Interval
23
45
67
89
1213
1516
1718
2021
2324
2628
10-10.99
10
00
00
00
00
00
00
00
00
00
11-11.99
10
00
00
00
00
00
00
00
00
00
12-12.99
01
00
00
00
00
00
00
00
00
00
13-13.99
01
00
00
00
00
00
00
00
00
00
14-14.99
01
00
00
00
00
00
00
00
00
00
15-15.99
01
00
00
00
00
00
00
00
00
00
16-16.99
00.8
0.2
00
00
00
00
00
00
00
00
017
-17.99
00.5
00
0.38
00.12
00
00
00
00
00
00
018
-18.99
00.1
0.1
0.3
00.4
0.1
00
00
00
00
00
00
019
-19.99
00
00.08
0.08
0.38
0.23
0.23
00
00
00
00
00
00
20-20.99
00
00
00.4
0.4
0.1
00
00
00.1
00
00
00
21-21.99
00
00
0.33
0.33
0.17
0.17
00
00
00
00
00
00
22-22.99
00
00
0.07
0.07
0.13
0.2
0.07
0.2
00.07
0.07
00
00
0.07
0.07
023
-23.99
00
00
00
00.09
00
0.09
0.09
0.27
00.18
0.09
00.09
00.09
24-24.99
00
00
00
00
00.2
00.2
00
00
00.2
0.2
0.2
25-25.99
00
00
00
00
00
00.2
0.4
0.2
00
0.2
00
0(G
oba
ckto
text)
53


Chapter 7
ATLANTIC SPADEFISHChaetodipterus faber
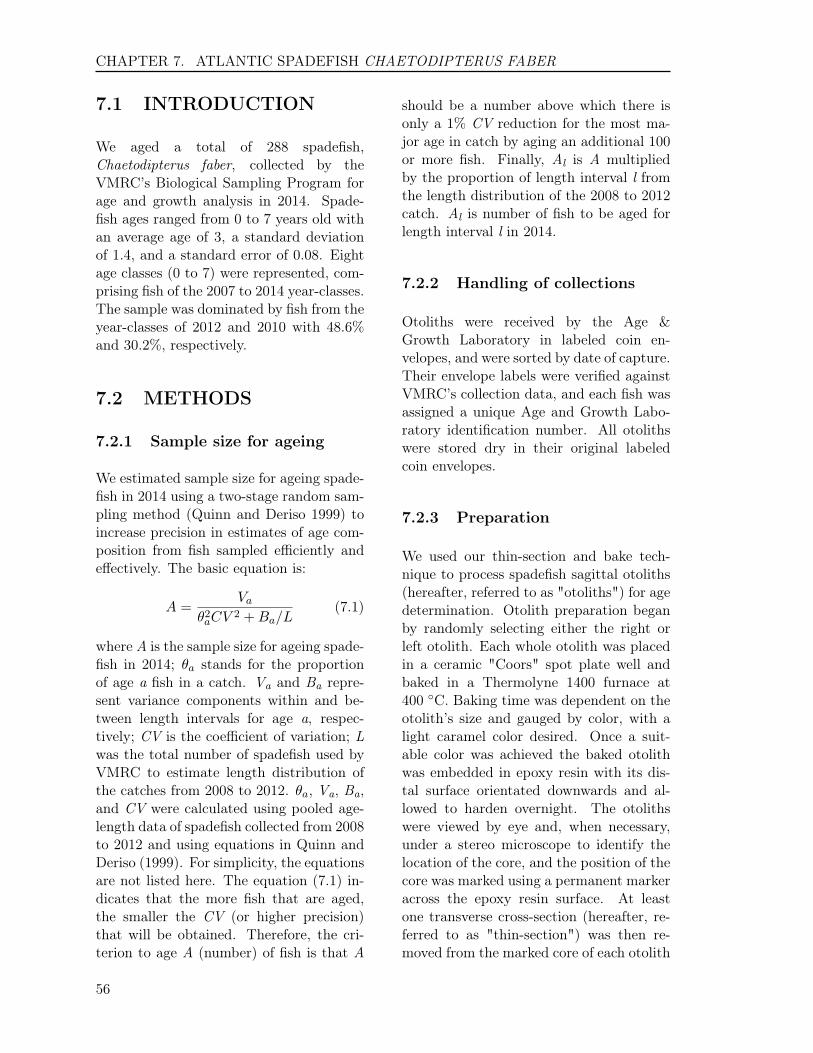
CHAPTER 7. ATLANTIC SPADEFISH CHAETODIPTERUS FABER
7.1 INTRODUCTION
We aged a total of 288 spadefish,Chaetodipterus faber, collected by theVMRC’s Biological Sampling Program forage and growth analysis in 2014. Spade-fish ages ranged from 0 to 7 years old withan average age of 3, a standard deviationof 1.4, and a standard error of 0.08. Eightage classes (0 to 7) were represented, com-prising fish of the 2007 to 2014 year-classes.The sample was dominated by fish from theyear-classes of 2012 and 2010 with 48.6%and 30.2%, respectively.
7.2 METHODS
7.2.1 Sample size for ageing
We estimated sample size for ageing spade-fish in 2014 using a two-stage random sam-pling method (Quinn and Deriso 1999) toincrease precision in estimates of age com-position from fish sampled efficiently andeffectively. The basic equation is:
A =Va
θ2aCV2 +Ba/L
(7.1)
where A is the sample size for ageing spade-fish in 2014; θa stands for the proportionof age a fish in a catch. Va and Ba repre-sent variance components within and be-tween length intervals for age a, respec-tively; CV is the coefficient of variation; Lwas the total number of spadefish used byVMRC to estimate length distribution ofthe catches from 2008 to 2012. θa, Va, Ba,and CV were calculated using pooled age-length data of spadefish collected from 2008to 2012 and using equations in Quinn andDeriso (1999). For simplicity, the equationsare not listed here. The equation (7.1) in-dicates that the more fish that are aged,the smaller the CV (or higher precision)that will be obtained. Therefore, the cri-terion to age A (number) of fish is that A
should be a number above which there isonly a 1% CV reduction for the most ma-jor age in catch by aging an additional 100or more fish. Finally, Al is A multipliedby the proportion of length interval l fromthe length distribution of the 2008 to 2012catch. Al is number of fish to be aged forlength interval l in 2014.
7.2.2 Handling of collections
Otoliths were received by the Age &Growth Laboratory in labeled coin en-velopes, and were sorted by date of capture.Their envelope labels were verified againstVMRC’s collection data, and each fish wasassigned a unique Age and Growth Labo-ratory identification number. All otolithswere stored dry in their original labeledcoin envelopes.
7.2.3 Preparation
We used our thin-section and bake tech-nique to process spadefish sagittal otoliths(hereafter, referred to as "otoliths") for agedetermination. Otolith preparation beganby randomly selecting either the right orleft otolith. Each whole otolith was placedin a ceramic "Coors" spot plate well andbaked in a Thermolyne 1400 furnace at400 ◦C. Baking time was dependent on theotolith’s size and gauged by color, with alight caramel color desired. Once a suit-able color was achieved the baked otolithwas embedded in epoxy resin with its dis-tal surface orientated downwards and al-lowed to harden overnight. The otolithswere viewed by eye and, when necessary,under a stereo microscope to identify thelocation of the core, and the position of thecore was marked using a permanent markeracross the epoxy resin surface. At leastone transverse cross-section (hereafter, re-ferred to as "thin-section") was then re-moved from the marked core of each otolith
56
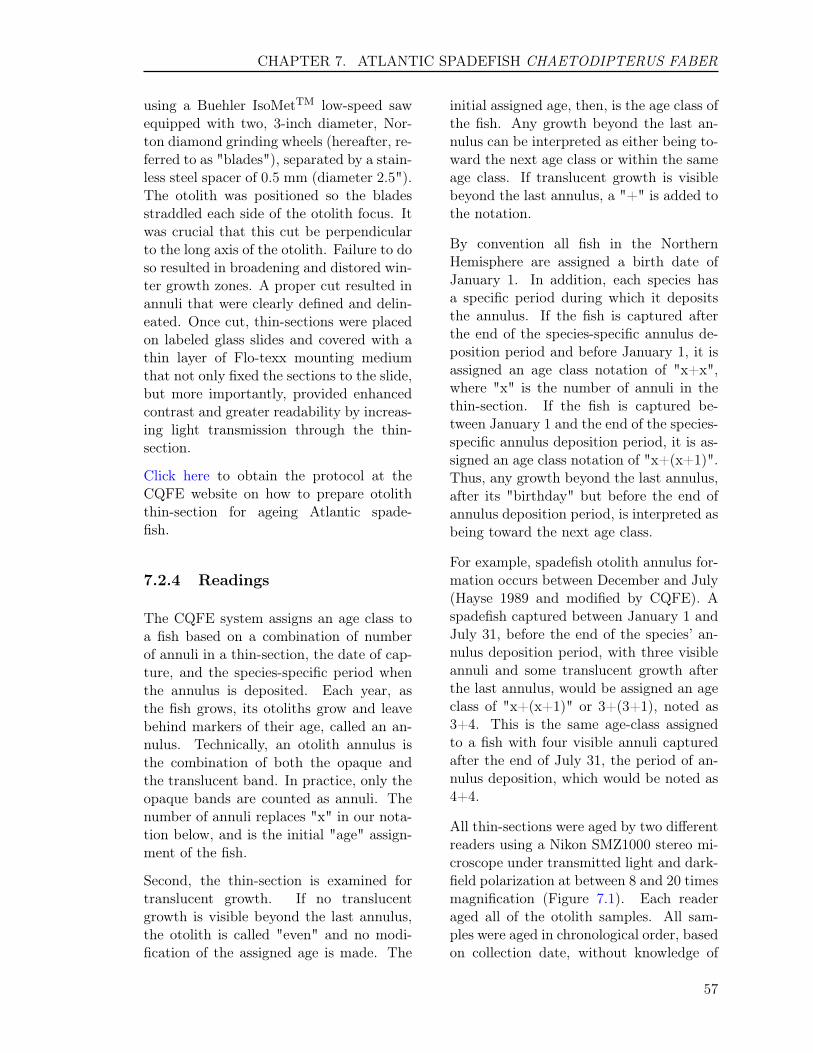
CHAPTER 7. ATLANTIC SPADEFISH CHAETODIPTERUS FABER
using a Buehler IsoMetTM low-speed sawequipped with two, 3-inch diameter, Nor-ton diamond grinding wheels (hereafter, re-ferred to as "blades"), separated by a stain-less steel spacer of 0.5 mm (diameter 2.5").The otolith was positioned so the bladesstraddled each side of the otolith focus. Itwas crucial that this cut be perpendicularto the long axis of the otolith. Failure to doso resulted in broadening and distored win-ter growth zones. A proper cut resulted inannuli that were clearly defined and delin-eated. Once cut, thin-sections were placedon labeled glass slides and covered with athin layer of Flo-texx mounting mediumthat not only fixed the sections to the slide,but more importantly, provided enhancedcontrast and greater readability by increas-ing light transmission through the thin-section.
Click here to obtain the protocol at theCQFE website on how to prepare otoliththin-section for ageing Atlantic spade-fish.
7.2.4 Readings
The CQFE system assigns an age class toa fish based on a combination of numberof annuli in a thin-section, the date of cap-ture, and the species-specific period whenthe annulus is deposited. Each year, asthe fish grows, its otoliths grow and leavebehind markers of their age, called an an-nulus. Technically, an otolith annulus isthe combination of both the opaque andthe translucent band. In practice, only theopaque bands are counted as annuli. Thenumber of annuli replaces "x" in our nota-tion below, and is the initial "age" assign-ment of the fish.
Second, the thin-section is examined fortranslucent growth. If no translucentgrowth is visible beyond the last annulus,the otolith is called "even" and no modi-fication of the assigned age is made. The
initial assigned age, then, is the age class ofthe fish. Any growth beyond the last an-nulus can be interpreted as either being to-ward the next age class or within the sameage class. If translucent growth is visiblebeyond the last annulus, a "+" is added tothe notation.
By convention all fish in the NorthernHemisphere are assigned a birth date ofJanuary 1. In addition, each species hasa specific period during which it depositsthe annulus. If the fish is captured afterthe end of the species-specific annulus de-position period and before January 1, it isassigned an age class notation of "x+x",where "x" is the number of annuli in thethin-section. If the fish is captured be-tween January 1 and the end of the species-specific annulus deposition period, it is as-signed an age class notation of "x+(x+1)".Thus, any growth beyond the last annulus,after its "birthday" but before the end ofannulus deposition period, is interpreted asbeing toward the next age class.
For example, spadefish otolith annulus for-mation occurs between December and July(Hayse 1989 and modified by CQFE). Aspadefish captured between January 1 andJuly 31, before the end of the species’ an-nulus deposition period, with three visibleannuli and some translucent growth afterthe last annulus, would be assigned an ageclass of "x+(x+1)" or 3+(3+1), noted as3+4. This is the same age-class assignedto a fish with four visible annuli capturedafter the end of July 31, the period of an-nulus deposition, which would be noted as4+4.
All thin-sections were aged by two differentreaders using a Nikon SMZ1000 stereo mi-croscope under transmitted light and dark-field polarization at between 8 and 20 timesmagnification (Figure 7.1). Each readeraged all of the otolith samples. All sam-ples were aged in chronological order, basedon collection date, without knowledge of
57
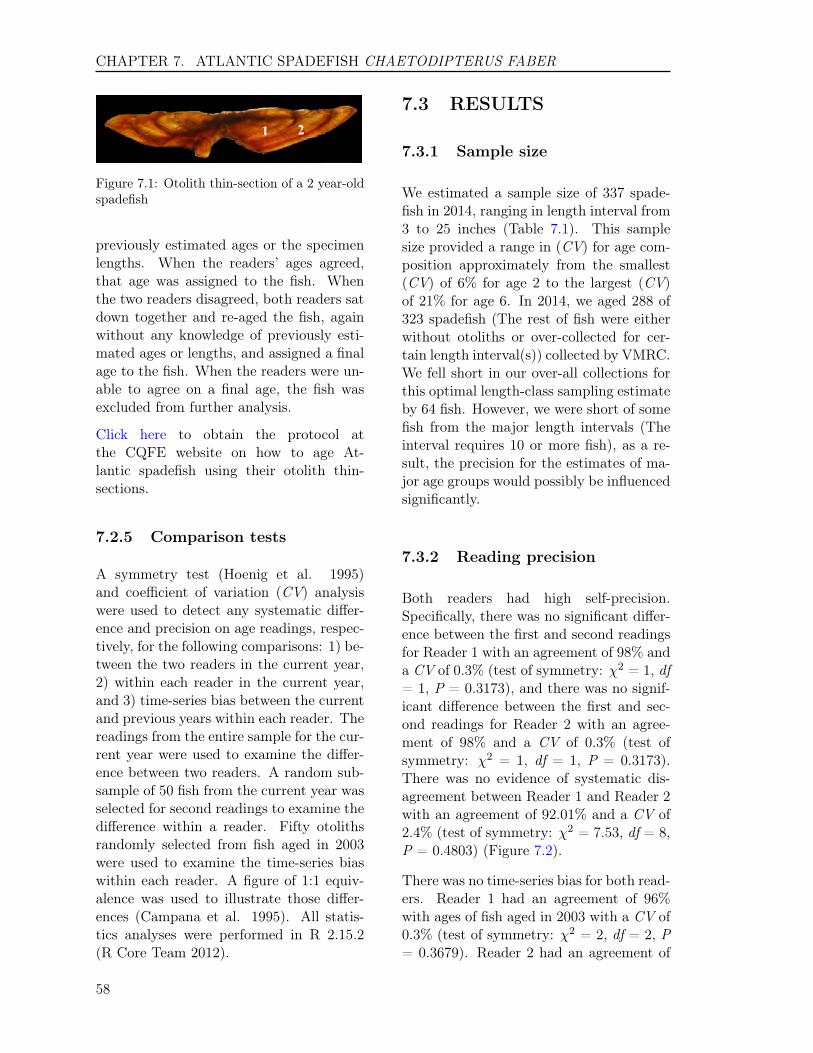
CHAPTER 7. ATLANTIC SPADEFISH CHAETODIPTERUS FABER
Figure 7.1: Otolith thin-section of a 2 year-oldspadefish
previously estimated ages or the specimenlengths. When the readers’ ages agreed,that age was assigned to the fish. Whenthe two readers disagreed, both readers satdown together and re-aged the fish, againwithout any knowledge of previously esti-mated ages or lengths, and assigned a finalage to the fish. When the readers were un-able to agree on a final age, the fish wasexcluded from further analysis.
Click here to obtain the protocol atthe CQFE website on how to age At-lantic spadefish using their otolith thin-sections.
7.2.5 Comparison tests
A symmetry test (Hoenig et al. 1995)and coefficient of variation (CV) analysiswere used to detect any systematic differ-ence and precision on age readings, respec-tively, for the following comparisons: 1) be-tween the two readers in the current year,2) within each reader in the current year,and 3) time-series bias between the currentand previous years within each reader. Thereadings from the entire sample for the cur-rent year were used to examine the differ-ence between two readers. A random sub-sample of 50 fish from the current year wasselected for second readings to examine thedifference within a reader. Fifty otolithsrandomly selected from fish aged in 2003were used to examine the time-series biaswithin each reader. A figure of 1:1 equiv-alence was used to illustrate those differ-ences (Campana et al. 1995). All statis-tics analyses were performed in R 2.15.2(R Core Team 2012).
7.3 RESULTS
7.3.1 Sample size
We estimated a sample size of 337 spade-fish in 2014, ranging in length interval from3 to 25 inches (Table 7.1). This samplesize provided a range in (CV) for age com-position approximately from the smallest(CV) of 6% for age 2 to the largest (CV)of 21% for age 6. In 2014, we aged 288 of323 spadefish (The rest of fish were eitherwithout otoliths or over-collected for cer-tain length interval(s)) collected by VMRC.We fell short in our over-all collections forthis optimal length-class sampling estimateby 64 fish. However, we were short of somefish from the major length intervals (Theinterval requires 10 or more fish), as a re-sult, the precision for the estimates of ma-jor age groups would possibly be influencedsignificantly.
7.3.2 Reading precision
Both readers had high self-precision.Specifically, there was no significant differ-ence between the first and second readingsfor Reader 1 with an agreement of 98% anda CV of 0.3% (test of symmetry: χ2 = 1, df= 1, P = 0.3173), and there was no signif-icant difference between the first and sec-ond readings for Reader 2 with an agree-ment of 98% and a CV of 0.3% (test ofsymmetry: χ2 = 1, df = 1, P = 0.3173).There was no evidence of systematic dis-agreement between Reader 1 and Reader 2with an agreement of 92.01% and a CV of2.4% (test of symmetry: χ2 = 7.53, df = 8,P = 0.4803) (Figure 7.2).
There was no time-series bias for both read-ers. Reader 1 had an agreement of 96%with ages of fish aged in 2003 with a CV of0.3% (test of symmetry: χ2 = 2, df = 2, P= 0.3679). Reader 2 had an agreement of
58
CHAPTER 7. ATLANTIC SPADEFISH CHAETODIPTERUS FABER
Figure 7.2: Between-reader comparison ofotolith age estimates for spadefish collected inChesapeake Bay and Virginia waters of the At-lantic Ocean in 2014.
98% with a CV of 0.2% (test of symmetry:χ2 = 1, df = 1, P = 0.3173).
7.3.3 Year class
Of the 288 fish aged with otoliths, 8 ageclasses (0 to 7) were represented (Table7.2). The average age was 3 years, andthe standard deviation and standard errorwere 1.4 and 0.08, respectively. Year-classdata show that the fishery was comprised of8 year-classes: fish from the 2007 to 2014year-classes, with fish primarily from theyear classes of 2012 and 2010 with 48.6%and 30.2%, respectively. The ratio of malesto females was 1:1.1 in the sample collected(Figure 7.3).
7.3.4 Age-length key
We developed an age-length-key (Table7.3) that can be used in the conversion ofnumbers-at-length in the estimated catchto numbers-at-age using otolith ages. Thetable is based on VMRC’s stratified sam-pling of landings by total length inch inter-vals.
Figure 7.3: Year-class frequency distributionfor spadefish collected for ageing in 2014. Dis-tribution is broken down by sex. ’Unknown’represents gonads that were not available forexamination or were not examined for sex dur-ing sampling.
7.4 REFERENCES
Campana, S.E., M.C. Annand, and J.I.McMillan. 1995. Graphical and statis-tical methods for determining the con-sistency of age determinations. Trans.Am. Fish. Soc. 124:131-138.
Hayse, J. W. 1989. Feeding habits, age,growth, and reproduction of Atlanticspadefish Chaetodipterus faber (Piscies:Ephippidae) in South Carolina. FisheryBulletin 88: 67-83.
Hoenig, J.M., M.J. Morgan, and C.A.Brown. 1995. Analyzing differences be-tween two age determination methodsby tests of symmetry. Can. J. Fish.Aquat. Sci. 52:364-368.
Quinn, T. J. II, and R. B. Deriso. 1999.Quantitative Fish Dynamics. OxfordUniveristy Press. New York.
R Core Team (2012). R: A lan-guage and environment for statisticalcomputing. R Foundation for Sta-tistical Computing, Vienna, Austria.ISBN 3-900051-07-0, URL http://www.R-project.org.
59

CHAPTER 7. ATLANTIC SPADEFISH CHAETODIPTERUS FABER
Table 7.1: Number of Atlantic spadefish collected and aged in each 1-inch length interval in 2014.’Target’ represents the sample size for ageing estimated for 2014, and ’Need’ represents number offish shorted in each length interval compared to the optimum sample size for ageing and number offish aged.
Interval Target Collected Aged Need3 - 3.99 5 0 0 54 - 4.99 5 6 6 05 - 5.99 10 22 14 06 - 6.99 39 53 39 07 - 7.99 46 51 51 08 - 8.99 34 30 30 49 - 9.99 25 20 20 5
10 - 10.99 20 13 13 711 - 11.99 14 16 16 012 - 12.99 21 20 20 113 - 13.99 22 10 10 1214 - 14.99 14 14 14 015 - 15.99 14 18 14 016 - 16.99 10 18 10 017 - 17.99 15 19 18 018 - 18.99 10 8 8 219 - 19.99 8 4 4 420 - 20.99 5 1 1 421 - 21.99 5 0 0 522 - 22.99 5 0 0 523 - 23.99 5 0 0 525 - 25.99 5 0 0 5
Totals 337 323 288 64(Go back to text)
60

CHAPTER 7. ATLANTIC SPADEFISH CHAETODIPTERUS FABER
Table 7.2: The number of Atlantic spadefish assigned to each total length-at-age category for 288fish sampled for otolith age determination in Virginia during 2014.
AgeInterval 0 1 2 3 4 5 6 7 Totals4 - 4.99 5 1 0 0 0 0 0 0 65 - 5.99 1 5 8 0 0 0 0 0 146 - 6.99 0 0 39 0 0 0 0 0 397 - 7.99 0 0 49 2 0 0 0 0 518 - 8.99 0 0 26 4 0 0 0 0 309 - 9.99 0 0 14 5 1 0 0 0 20
10 - 10.99 0 0 4 2 7 0 0 0 1311 - 11.99 0 0 0 4 12 0 0 0 1612 - 12.99 0 0 0 4 16 0 0 0 2013 - 13.99 0 0 0 2 8 0 0 0 1014 - 14.99 0 0 0 2 12 0 0 0 1415 - 15.99 0 0 0 0 12 1 1 0 1416 - 16.99 0 0 0 0 9 0 0 1 1017 - 17.99 0 0 0 0 10 3 2 3 1818 - 18.99 0 0 0 0 0 2 4 2 819 - 19.99 0 0 0 0 0 2 2 0 420 - 20.99 0 0 0 0 0 0 0 1 1
Totals 6 6 140 25 87 8 9 7 288(Go back to text)
61
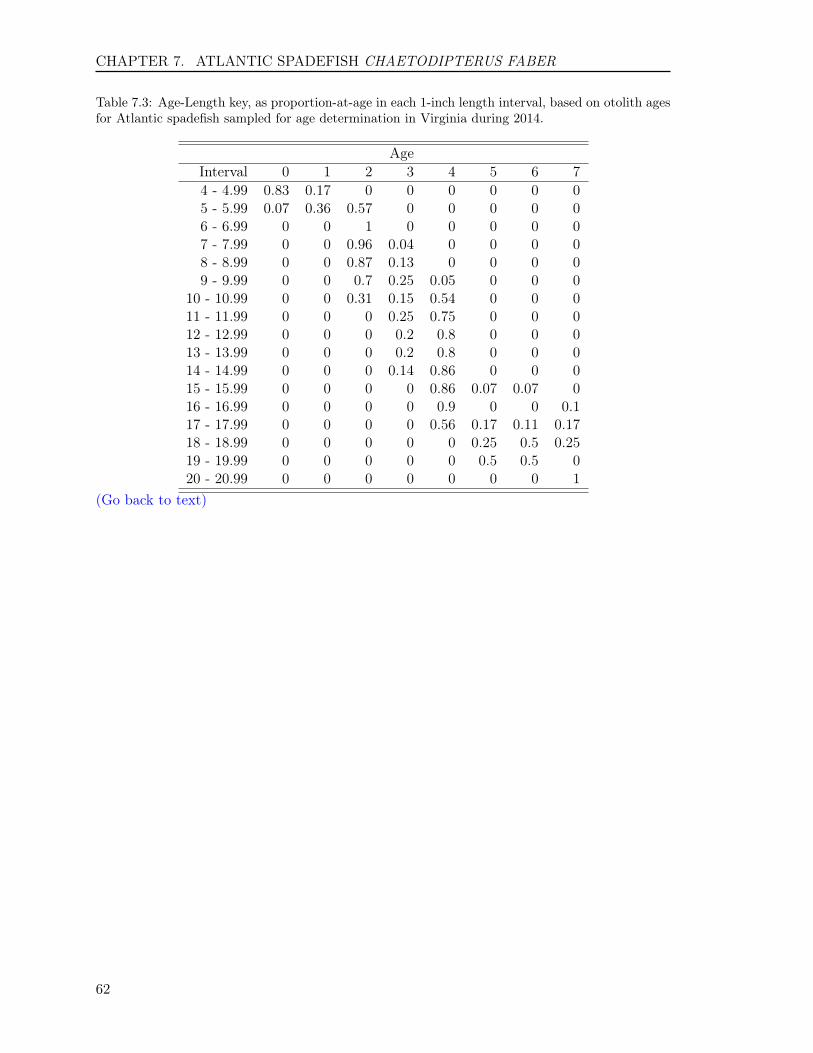
CHAPTER 7. ATLANTIC SPADEFISH CHAETODIPTERUS FABER
Table 7.3: Age-Length key, as proportion-at-age in each 1-inch length interval, based on otolith agesfor Atlantic spadefish sampled for age determination in Virginia during 2014.
AgeInterval 0 1 2 3 4 5 6 74 - 4.99 0.83 0.17 0 0 0 0 0 05 - 5.99 0.07 0.36 0.57 0 0 0 0 06 - 6.99 0 0 1 0 0 0 0 07 - 7.99 0 0 0.96 0.04 0 0 0 08 - 8.99 0 0 0.87 0.13 0 0 0 09 - 9.99 0 0 0.7 0.25 0.05 0 0 0
10 - 10.99 0 0 0.31 0.15 0.54 0 0 011 - 11.99 0 0 0 0.25 0.75 0 0 012 - 12.99 0 0 0 0.2 0.8 0 0 013 - 13.99 0 0 0 0.2 0.8 0 0 014 - 14.99 0 0 0 0.14 0.86 0 0 015 - 15.99 0 0 0 0 0.86 0.07 0.07 016 - 16.99 0 0 0 0 0.9 0 0 0.117 - 17.99 0 0 0 0 0.56 0.17 0.11 0.1718 - 18.99 0 0 0 0 0 0.25 0.5 0.2519 - 19.99 0 0 0 0 0 0.5 0.5 020 - 20.99 0 0 0 0 0 0 0 1
(Go back to text)
62
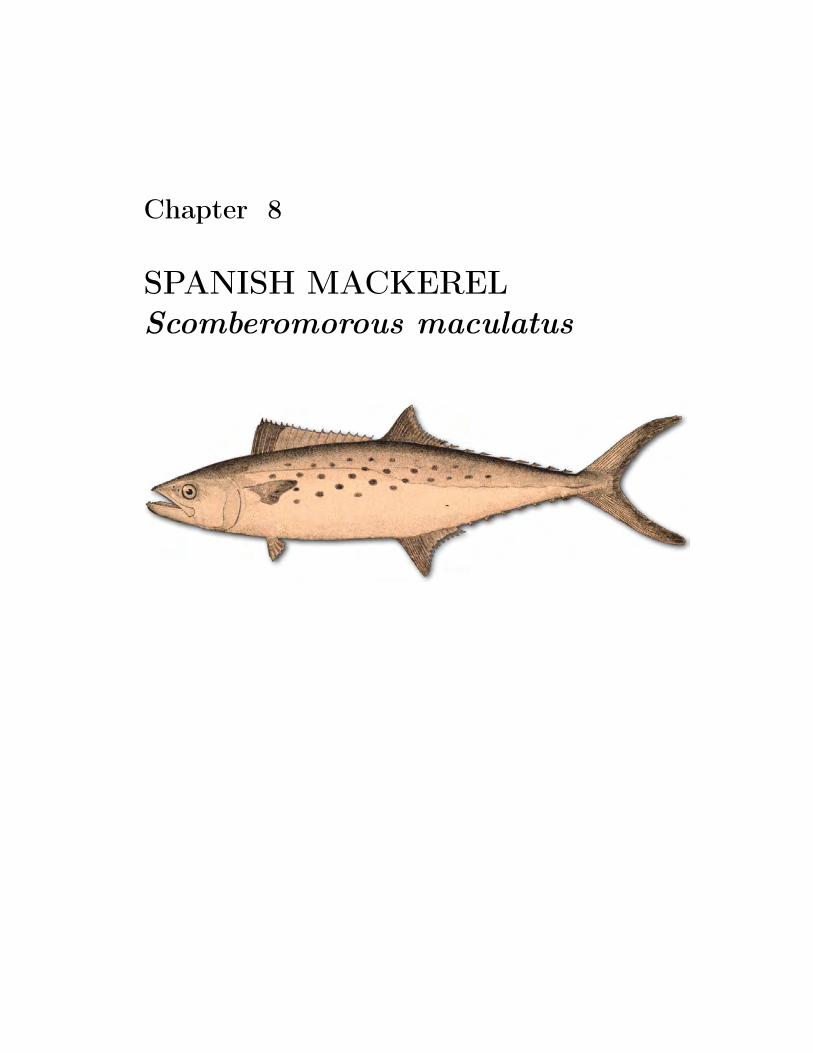
Chapter 8
SPANISH MACKERELScomberomorous maculatus
CHAPTER 8. SPANISH MACKEREL SCOMBEROMOROUS MACULATUS
8.1 INTRODUCTION
We aged a total of 236 Spanish mackerel,Scomberomorous maculatus, collected bythe VMRC’s Biological Sampling Programfor age and growth analysis in 2014. Span-ish mackerel ages ranged from 0 to 6 yearsold with an average age of 1.5, a standarddeviation of 0.8, and a standard error of0.05. Seven age classes (0 to 6) were repre-sented, comprising fish of the 2008 to 2014year-classes. The sample was dominated byfish from the year-classes of 2013 and 2012with 63.6% and 25.4%, respectively.
8.2 METHODS
8.2.1 Sample size for ageing
We estimated sample size for ageing Span-ish mackerel in 2014 using a two-stage ran-dom sampling method (Quinn and Deriso1999) to increase precision in estimatesof age composition from fish sampled effi-ciently and effectively. The basic equationis:
A =Va
θ2aCV2 +Ba/L
(8.1)
where A is the sample size for ageing Span-ish mackerel in 2014; θa stands for the pro-portion of age a fish in a catch. Va and Barepresent variance components within andbetween length intervals for age a, respec-tively; CV is the coefficient of variation; Lwas the total number of Spanish mackerelused by VMRC to estimate length distri-bution of the catches from 2008 to 2012.θa, Va, Ba, and CV were calculated usingpooled age-length data of Spanish mack-erel collected from 2008 to 2012 and us-ing equations in Quinn and Deriso (1999).For simplicity, the equations are not listedhere. The equation (8.1) indicates that themore fish that are aged, the smaller the CV(or higher precision) that will be obtained.
Therefore, the criterion to age A (number)of fish is that A should be a number abovewhich there is only a 1% CV reduction forthe most major age in catch by aging anadditional 100 or more fish. Finally, Al isA multiplied by the proportion of length in-terval l from the length distribution of the2008 to 2012 catch. Al is number of fish tobe aged for length interval l in 2014.
8.2.2 Handling of collections
Otoliths were received by the Age &Growth Laboratory in labeled coin en-velopes, and were sorted by date of capture.Their envelope labels were verified againstVMRC’s collection data, and each fish wasassigned a unique Age and Growth Labo-ratory identification number. All otolithswere stored dry in their original labeledcoin envelopes.
8.2.3 Preparation
Sagittal otoliths, hereafter, referred to as"otolith", were processed for age determi-nation. The left or right otolith was ran-domly selected and embedded, distal sidedown, in epoxy resin and allowed to hardenovernight. The otoliths were viewed by eye,and when necessary, under a stereo micro-scope to identify the location of the core,and the position of the core marked us-ing a permanent marker across the epoxyresin surface. At least one transversecross-section (hereafter "thin-section") wasthen removed from the marked core ofeach otolith using a Buehler IsoMetTM low-speed saw equipped with two, three inch di-ameter, Norton Diamond Grinding Wheels,separated by a stainless steel spacer of0.5 mm (diameter 2.5"). The position ofthe marked core fell within the 0.5 mmspace between the blades, such that thecore was included in the removed thin sec-tion. Otolith thin-sections were placed
64
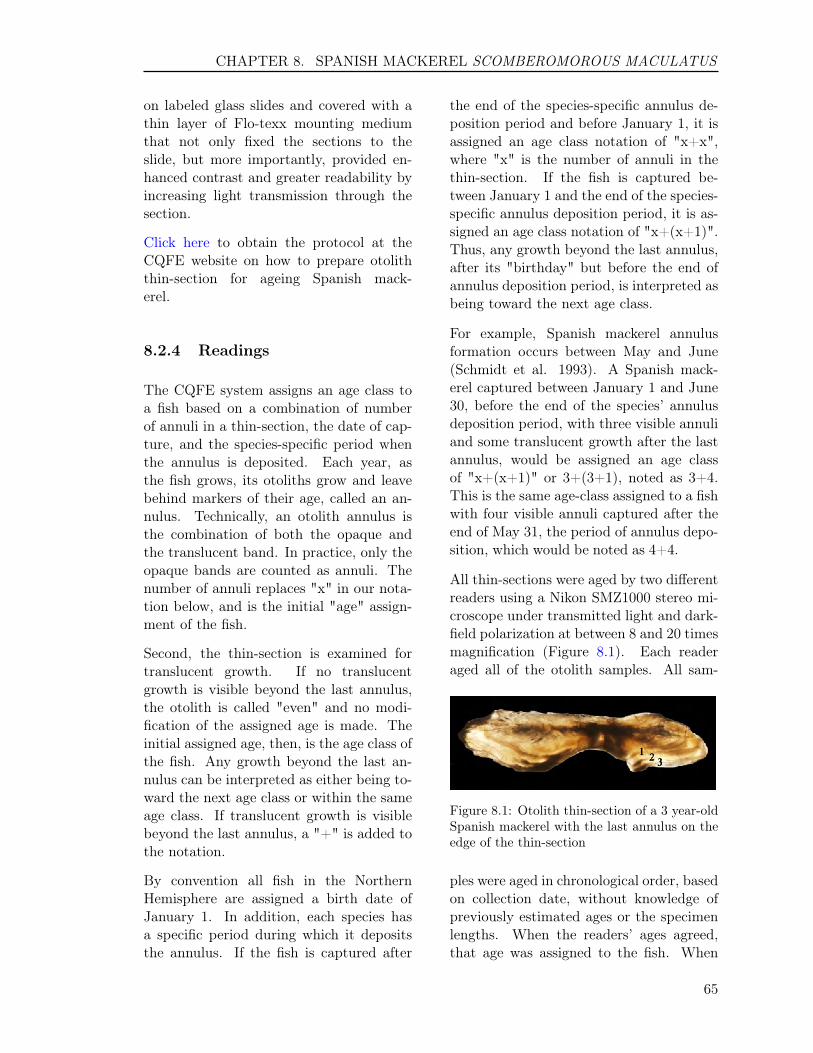
CHAPTER 8. SPANISH MACKEREL SCOMBEROMOROUS MACULATUS
on labeled glass slides and covered with athin layer of Flo-texx mounting mediumthat not only fixed the sections to theslide, but more importantly, provided en-hanced contrast and greater readability byincreasing light transmission through thesection.
Click here to obtain the protocol at theCQFE website on how to prepare otoliththin-section for ageing Spanish mack-erel.
8.2.4 Readings
The CQFE system assigns an age class toa fish based on a combination of numberof annuli in a thin-section, the date of cap-ture, and the species-specific period whenthe annulus is deposited. Each year, asthe fish grows, its otoliths grow and leavebehind markers of their age, called an an-nulus. Technically, an otolith annulus isthe combination of both the opaque andthe translucent band. In practice, only theopaque bands are counted as annuli. Thenumber of annuli replaces "x" in our nota-tion below, and is the initial "age" assign-ment of the fish.
Second, the thin-section is examined fortranslucent growth. If no translucentgrowth is visible beyond the last annulus,the otolith is called "even" and no modi-fication of the assigned age is made. Theinitial assigned age, then, is the age class ofthe fish. Any growth beyond the last an-nulus can be interpreted as either being to-ward the next age class or within the sameage class. If translucent growth is visiblebeyond the last annulus, a "+" is added tothe notation.
By convention all fish in the NorthernHemisphere are assigned a birth date ofJanuary 1. In addition, each species hasa specific period during which it depositsthe annulus. If the fish is captured after
the end of the species-specific annulus de-position period and before January 1, it isassigned an age class notation of "x+x",where "x" is the number of annuli in thethin-section. If the fish is captured be-tween January 1 and the end of the species-specific annulus deposition period, it is as-signed an age class notation of "x+(x+1)".Thus, any growth beyond the last annulus,after its "birthday" but before the end ofannulus deposition period, is interpreted asbeing toward the next age class.
For example, Spanish mackerel annulusformation occurs between May and June(Schmidt et al. 1993). A Spanish mack-erel captured between January 1 and June30, before the end of the species’ annulusdeposition period, with three visible annuliand some translucent growth after the lastannulus, would be assigned an age classof "x+(x+1)" or 3+(3+1), noted as 3+4.This is the same age-class assigned to a fishwith four visible annuli captured after theend of May 31, the period of annulus depo-sition, which would be noted as 4+4.
All thin-sections were aged by two differentreaders using a Nikon SMZ1000 stereo mi-croscope under transmitted light and dark-field polarization at between 8 and 20 timesmagnification (Figure 8.1). Each readeraged all of the otolith samples. All sam-
Figure 8.1: Otolith thin-section of a 3 year-oldSpanish mackerel with the last annulus on theedge of the thin-section
ples were aged in chronological order, basedon collection date, without knowledge ofpreviously estimated ages or the specimenlengths. When the readers’ ages agreed,that age was assigned to the fish. When
65
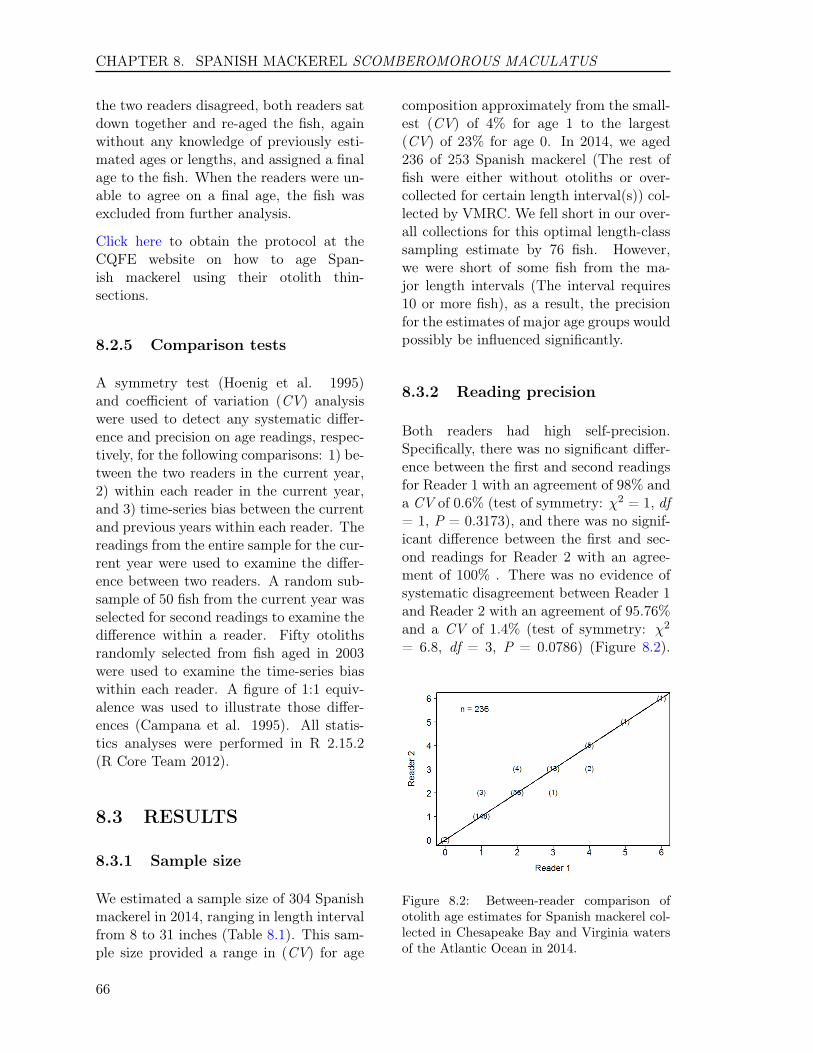
CHAPTER 8. SPANISH MACKEREL SCOMBEROMOROUS MACULATUS
the two readers disagreed, both readers satdown together and re-aged the fish, againwithout any knowledge of previously esti-mated ages or lengths, and assigned a finalage to the fish. When the readers were un-able to agree on a final age, the fish wasexcluded from further analysis.
Click here to obtain the protocol at theCQFE website on how to age Span-ish mackerel using their otolith thin-sections.
8.2.5 Comparison tests
A symmetry test (Hoenig et al. 1995)and coefficient of variation (CV) analysiswere used to detect any systematic differ-ence and precision on age readings, respec-tively, for the following comparisons: 1) be-tween the two readers in the current year,2) within each reader in the current year,and 3) time-series bias between the currentand previous years within each reader. Thereadings from the entire sample for the cur-rent year were used to examine the differ-ence between two readers. A random sub-sample of 50 fish from the current year wasselected for second readings to examine thedifference within a reader. Fifty otolithsrandomly selected from fish aged in 2003were used to examine the time-series biaswithin each reader. A figure of 1:1 equiv-alence was used to illustrate those differ-ences (Campana et al. 1995). All statis-tics analyses were performed in R 2.15.2(R Core Team 2012).
8.3 RESULTS
8.3.1 Sample size
We estimated a sample size of 304 Spanishmackerel in 2014, ranging in length intervalfrom 8 to 31 inches (Table 8.1). This sam-ple size provided a range in (CV) for age
composition approximately from the small-est (CV) of 4% for age 1 to the largest(CV) of 23% for age 0. In 2014, we aged236 of 253 Spanish mackerel (The rest offish were either without otoliths or over-collected for certain length interval(s)) col-lected by VMRC. We fell short in our over-all collections for this optimal length-classsampling estimate by 76 fish. However,we were short of some fish from the ma-jor length intervals (The interval requires10 or more fish), as a result, the precisionfor the estimates of major age groups wouldpossibly be influenced significantly.
8.3.2 Reading precision
Both readers had high self-precision.Specifically, there was no significant differ-ence between the first and second readingsfor Reader 1 with an agreement of 98% anda CV of 0.6% (test of symmetry: χ2 = 1, df= 1, P = 0.3173), and there was no signif-icant difference between the first and sec-ond readings for Reader 2 with an agree-ment of 100% . There was no evidence ofsystematic disagreement between Reader 1and Reader 2 with an agreement of 95.76%and a CV of 1.4% (test of symmetry: χ2
= 6.8, df = 3, P = 0.0786) (Figure 8.2).
Figure 8.2: Between-reader comparison ofotolith age estimates for Spanish mackerel col-lected in Chesapeake Bay and Virginia watersof the Atlantic Ocean in 2014.
66

CHAPTER 8. SPANISH MACKEREL SCOMBEROMOROUS MACULATUS
There was no time-series bias for both read-ers. Reader 1 had an agreement of 96%with fish aged in 2003 with a CV of 1.9%(test of symmetry: χ2 = 0, df = 1, P = 1).Reader 2 had an agreement of 98% with aCV of 0.3% (test of symmetry: χ2 = 1, df= 1, P = 0.3173).
8.3.3 Year class
Of the 236 fish aged with otoliths, 7 ageclasses (0 to 6) were represented (Table8.2). The average age was 1.5 years, andthe standard deviation and standard errorwere 0.8 and 0.05, respectively. Year-classdata show that the fishery was comprised of7 year-classes: fish from the 2008 to 2014year-classes, with fish primarily from theyear classes of 2013 and 2012 with 63.6%and 25.4%, respectively. The ratio of malesto females was 1:1.96 in the sample col-lected (Figure 8.3).
Figure 8.3: Year-class frequency distributionfor Spanish mackerel collected for ageing in2014. Distribution is broken down by sex. ’Un-known’ represents gonads that were not avail-able for examination or were not examined forsex during sampling.
8.3.4 Age-length key
We developed an age-length-key (Table8.3) that can be used in the conversion ofnumbers-at-length in the estimated catch
to numbers-at-age using otolith ages. Thetable is based on VMRC’s stratified sam-pling of landings by total length inch inter-vals.
8.4 REFERENCES
Campana, S.E., M.C. Annand, and J.I.McMillan. 1995. Graphical and statis-tical methods for etermining the consis-tency of age terminations. Trans. Am.Fish. Soc. 124:131-138.
Hoenig, J.M., M.J. Morgan, and C.A.Brown. 1995. Analyzing differences be-tween two age determination methodsby tests of symmetry. Can. J. Fish.Aquat. Sci. 52:364-368.
Quinn, T. J. II, and R. B. Deriso. 1999.Quantitative Fish Dynamics. OxfordUniveristy Press. New York.
R Core Team (2012). R: A lan-guage and environment for statisticalcomputing. R Foundation for Sta-tistical Computing, Vienna, Austria.ISBN 3-900051-07-0, URL http://www.R-project.org.
Schmidt, D., Collins, M., Wyanski, D.1993. Age, growth, maturity, andspawning of Spanish mackerel fromthe Atlantic coast of the southeast-ern United States. Fishery Bulletin91s.
67

CHAPTER 8. SPANISH MACKEREL SCOMBEROMOROUS MACULATUS
Table 8.1: Number of Spanish mackerel collected and aged in each 1-inch length interval in 2014.’Target’ represents the sample size for ageing estimated for 2014, and ’Need’ represents number offish shorted in each length interval compared to the optimum sample size for ageing and number offish aged.
Interval Target Collected Aged Need8 - 8.99 5 0 0 59 - 9.99 5 0 0 5
10 - 10.99 5 0 0 511 - 11.99 5 0 0 512 - 12.99 5 0 0 513 - 13.99 6 3 3 314 - 14.99 20 11 11 915 - 15.99 42 39 39 316 - 16.99 45 48 48 017 - 17.99 40 41 41 018 - 18.99 22 26 22 019 - 19.99 18 23 18 020 - 20.99 15 19 16 021 - 21.99 15 21 16 022 - 22.99 11 7 7 423 - 23.99 5 6 6 024 - 24.99 5 6 6 025 - 25.99 5 2 2 326 - 26.99 5 0 0 527 - 27.99 5 0 0 528 - 28.99 5 0 0 529 - 29.99 5 1 1 430 - 30.99 5 0 0 531 - 31.99 5 0 0 5
Totals 304 253 236 76(Go back to text)
68

CHAPTER 8. SPANISH MACKEREL SCOMBEROMOROUS MACULATUS
Table 8.2: The number of Spanish mackerel assigned to each total length-at-age category for 236fish sampled for otolith age determination in Virginia during 2014.
AgeInterval 0 1 2 3 4 5 6 Totals
13 - 13.99 1 2 0 0 0 0 0 314 - 14.99 0 11 0 0 0 0 0 1115 - 15.99 0 38 1 0 0 0 0 3916 - 16.99 1 47 0 0 0 0 0 4817 - 17.99 0 37 4 0 0 0 0 4118 - 18.99 0 14 8 0 0 0 0 2219 - 19.99 0 1 16 1 0 0 0 1820 - 20.99 0 0 14 1 1 0 0 1621 - 21.99 0 0 10 6 0 0 0 1622 - 22.99 0 0 6 0 0 1 0 723 - 23.99 0 0 1 2 3 0 0 624 - 24.99 0 0 0 5 1 0 0 625 - 25.99 0 0 0 2 0 0 0 229 - 29.99 0 0 0 0 0 0 1 1
Totals 2 150 60 17 5 1 1 236(Go back to text)
69

CHAPTER 8. SPANISH MACKEREL SCOMBEROMOROUS MACULATUS
Table 8.3: Age-Length key, as proportion-at-age in each 1-inch length interval, based on otolith agesfor Spanish mackerel sampled for age determination in Virginia during 2014.
AgeInterval 0 1 2 3 4 5 6
13 - 13.99 0.33 0.67 0 0 0 0 014 - 14.99 0 1 0 0 0 0 015 - 15.99 0 0.97 0.03 0 0 0 016 - 16.99 0.02 0.98 0 0 0 0 017 - 17.99 0 0.9 0.1 0 0 0 018 - 18.99 0 0.64 0.36 0 0 0 019 - 19.99 0 0.06 0.89 0.06 0 0 020 - 20.99 0 0 0.88 0.06 0.06 0 021 - 21.99 0 0 0.62 0.38 0 0 022 - 22.99 0 0 0.86 0 0 0.14 023 - 23.99 0 0 0.17 0.33 0.5 0 024 - 24.99 0 0 0 0.83 0.17 0 025 - 25.99 0 0 0 1 0 0 029 - 29.99 0 0 0 0 0 0 1
(Go back to text)
70
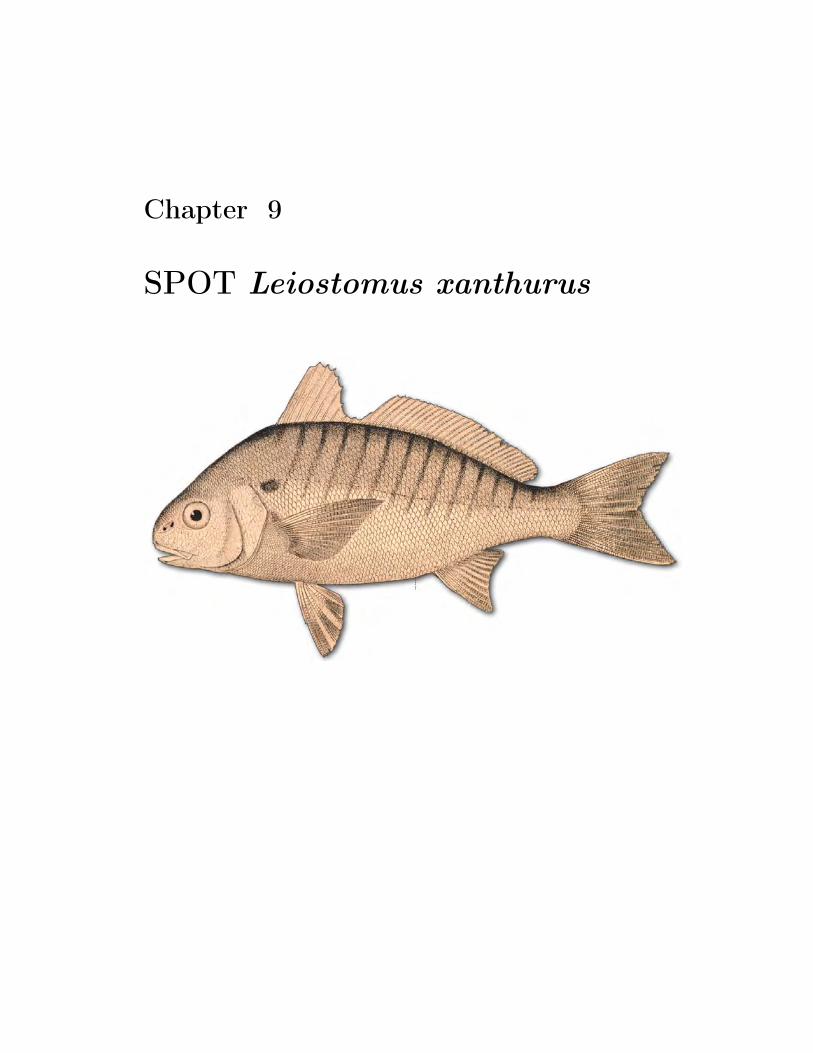
Chapter 9
SPOT Leiostomus xanthurus

CHAPTER 9. SPOT LEIOSTOMUS XANTHURUS
9.1 INTRODUCTION
We aged a total of 276 spot, Leiostomusxanthurus, collected by the VMRC’s Bi-ological Sampling Program for age andgrowth analysis in 2014. spot ages rangedfrom 0 to 3 years old with an average ageof 1.7, a standard deviation of 0.5, and astandard error of 0.03. Four age classes (0to 3) were represented, comprising fish ofthe 2011 to 2014 year-classes. The samplewas dominated by fish from the year-classof 2012 with 65.6%.
9.2 METHODS
9.2.1 Sample size for ageing
We estimated sample size for ageing spotin 2014 using a two-stage random samplingmethod (Quinn and Deriso 1999) to in-crease precision in estimates of age com-position from fish sampled efficiently andeffectively. The basic equation is:
A =Va
θ2aCV2 +Ba/L
(9.1)
where A is the sample size for ageing spotin 2014; θa stands for the proportion of agea fish in a catch. Va and Ba representvariance components within and betweenlength intervals for age a, respectively; CVis the coefficient of variation; L was thetotal number of spot used by VMRC toestimate length distribution of the catchesfrom 2008 to 2012. θa, Va, Ba, and CV werecalculated using pooled age-length data ofspot collected from 2008 to 2012 and us-ing equations in Quinn and Deriso (1999).For simplicity, the equations are not listedhere. The equation (1.1) indicates that themore fish that are aged, the smaller the CV(or higher precision) that will be obtained.Therefore, the criterion to age A (number)of fish is that A should be a number abovewhich there is only a 1% CV reduction for
the most major age in catch by ageing anadditional 100 or more fish. Finally, Al is Amultiplied by the proportion of length in-terval l from the length distribution of the2008 to 2012 catch. Al is number of fish tobe aged for length interval l in 2014.
9.2.2 Handling of collections
Otoliths were received by the Age & andGrowth Laboratory in labeled coin en-velopes, were sorted by date of capture.Their envelope labels were verified againstVMRC’s collection data, and each fish wasassigned a unique Age and Growth Labo-ratory identification number. All otolithswere stored dry in their original labeledcoin envelopes.
9.2.3 Preparation
Sagittal otoliths, hereafter, referred to as"otoliths", were processed for age determi-nation following the methods described inBarbieri et al. (1994) with a few modifi-cations. The left or right otolith was ran-domly selected and embedded (distal sidedown) in epoxy resin and allowed to hardenovernight. The otoliths were viewed byeye and, when necessary, under a stereomicroscope to identify the location of thecore, and the position of the core wasmarked using a permanent marker acrossthe epoxy resin surface. At least one trans-verse cross-section (hereafter, referred toas "thin-section") was then removed fromthe marked core of each otolith using aBuehler IsoMetTM low-speed saw equippedwith two, 3-inch diameter, Norton diamondgrinding wheels (hereafter, referred to as"blades"), separated by a stainless steelspacer of 0.5 mm (diameter 2.5"). Thin-sections were placed on labeled glass slidesand covered with a thin layer of Flo-texxmounting medium that not only fixed thesections to the slide, but more importantly,
72

CHAPTER 9. SPOT LEIOSTOMUS XANTHURUS
provided enhanced contrast and greaterreadability by increasing light transmissionthrough the thin-sections.
Click here to obtain the protocol at theCQFE website on how to prepare otoliththin-section for ageing spot.
9.2.4 Readings
The CQFE system assigns an age class toa fish based on a combination of numberof annuli in a thin-section, the date of cap-ture, and the species-specific period whenthe annulus is deposited. Each year, asthe fish grows, its otoliths grow and leavebehind markers of their age, called an an-nulus. Technically, an otolith annulus isthe combination of both the opaque andthe translucent band. In practice, only theopaque bands are counted as annuli. Thenumber of annuli replaces "x" in our nota-tion below, and is the initial "age" assign-ment of the fish.
Second, the thin-section is examined fortranslucent growth. If no translucentgrowth is visible beyond the last annulus,the otolith is called "even" and no modi-fication of the assigned age is made. Theinitial assigned age, then, is the age class ofthe fish. Any growth beyond the last an-nulus can be interpreted as either being to-ward the next age class or within the sameage class. If translucent growth is visiblebeyond the last annulus, a "+" is added tothe notation.
By convention all fish in the NorthernHemisphere are assigned a birth date ofJanuary 1. In addition, each species hasa specific period during which it depositsthe annulus. If the fish is captured afterthe end of the species-specific annulus de-position period and before January 1, it isassigned an age class notation of "x+x",where "x" is the number of annuli in thethin-section. If the fish is captured be-
tween January 1 and the end of the species-specific annulus deposition period, it is as-signed an age class notation of "x+(x+1)".Thus, any growth beyond the last annulus,after its "birthday" but before the end ofannulus deposition period, is interpreted asbeing toward the next age class.
For example, spot otolith annulus forma-tion occurs between May and July (Pinerand Jones 2004). A spot captured betweenJanuary 1 and May 31, before the endof the species’ annulus deposition period,with three visible annuli and some translu-cent growth after the last annulus, wouldbe assigned an age class of "x+(x+1)" or3+(3+1), noted as 3+4. This is the sameage-class assigned to a fish with four vis-ible annuli captured after the end of May31, the period of annulus deposition, whichwould be noted as 4+4.
All thin-sections were aged by two differentreaders using a Nikon SMZ1000 stereo mi-croscope under transmitted light and dark-field polarization at between 8 and 20 timesmagnification (Figure 9.1). Each readeraged all of the otolith samples. Due to dis-
Figure 9.1: Otolith thin-section of a 2 year-oldspot
crepancy on identification of the first an-nulus of spot among Atlantic states, At-lantic States Marine Fisheries Commission(ASMFC) has decided not to count thesmallest annulus at the center of the thin-section as the first annulus. FollowingASMFC’s instruction, we didn’t count thesmallest annulus at the center as the firstannulus in 2014.
73
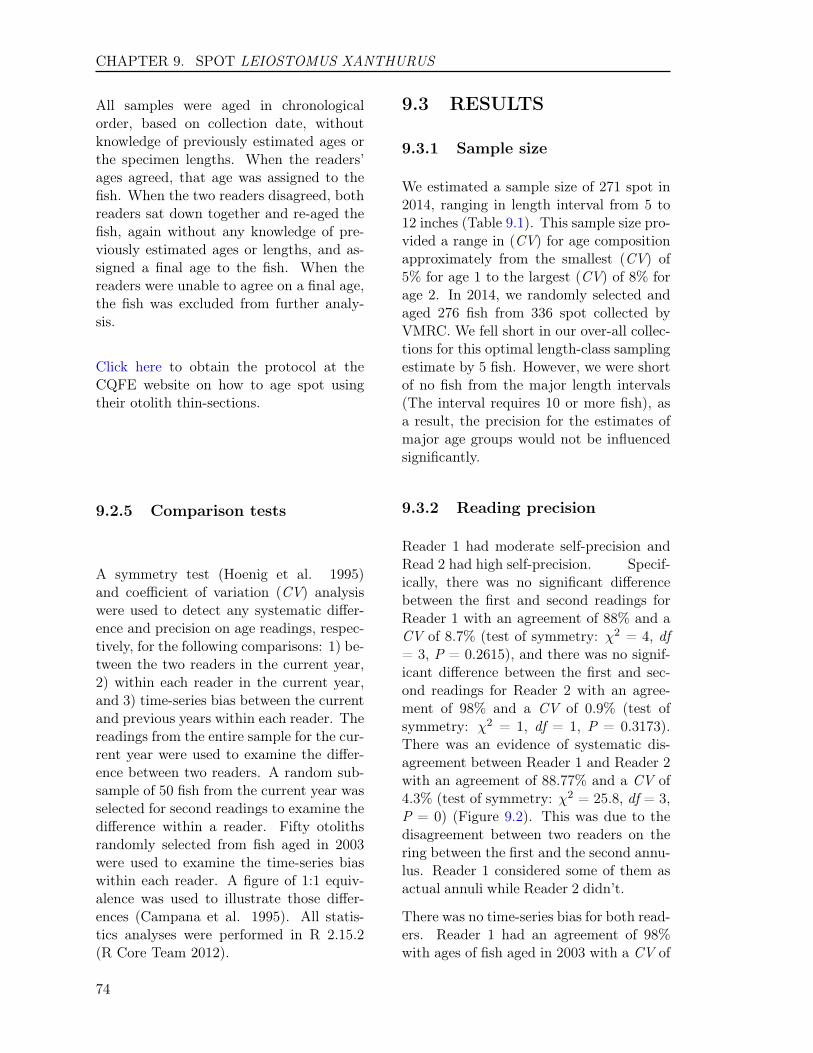
CHAPTER 9. SPOT LEIOSTOMUS XANTHURUS
All samples were aged in chronologicalorder, based on collection date, withoutknowledge of previously estimated ages orthe specimen lengths. When the readers’ages agreed, that age was assigned to thefish. When the two readers disagreed, bothreaders sat down together and re-aged thefish, again without any knowledge of pre-viously estimated ages or lengths, and as-signed a final age to the fish. When thereaders were unable to agree on a final age,the fish was excluded from further analy-sis.
Click here to obtain the protocol at theCQFE website on how to age spot usingtheir otolith thin-sections.
9.2.5 Comparison tests
A symmetry test (Hoenig et al. 1995)and coefficient of variation (CV) analysiswere used to detect any systematic differ-ence and precision on age readings, respec-tively, for the following comparisons: 1) be-tween the two readers in the current year,2) within each reader in the current year,and 3) time-series bias between the currentand previous years within each reader. Thereadings from the entire sample for the cur-rent year were used to examine the differ-ence between two readers. A random sub-sample of 50 fish from the current year wasselected for second readings to examine thedifference within a reader. Fifty otolithsrandomly selected from fish aged in 2003were used to examine the time-series biaswithin each reader. A figure of 1:1 equiv-alence was used to illustrate those differ-ences (Campana et al. 1995). All statis-tics analyses were performed in R 2.15.2(R Core Team 2012).
9.3 RESULTS
9.3.1 Sample size
We estimated a sample size of 271 spot in2014, ranging in length interval from 5 to12 inches (Table 9.1). This sample size pro-vided a range in (CV) for age compositionapproximately from the smallest (CV) of5% for age 1 to the largest (CV) of 8% forage 2. In 2014, we randomly selected andaged 276 fish from 336 spot collected byVMRC. We fell short in our over-all collec-tions for this optimal length-class samplingestimate by 5 fish. However, we were shortof no fish from the major length intervals(The interval requires 10 or more fish), asa result, the precision for the estimates ofmajor age groups would not be influencedsignificantly.
9.3.2 Reading precision
Reader 1 had moderate self-precision andRead 2 had high self-precision. Specif-ically, there was no significant differencebetween the first and second readings forReader 1 with an agreement of 88% and aCV of 8.7% (test of symmetry: χ2 = 4, df= 3, P = 0.2615), and there was no signif-icant difference between the first and sec-ond readings for Reader 2 with an agree-ment of 98% and a CV of 0.9% (test ofsymmetry: χ2 = 1, df = 1, P = 0.3173).There was an evidence of systematic dis-agreement between Reader 1 and Reader 2with an agreement of 88.77% and a CV of4.3% (test of symmetry: χ2 = 25.8, df = 3,P = 0) (Figure 9.2). This was due to thedisagreement between two readers on thering between the first and the second annu-lus. Reader 1 considered some of them asactual annuli while Reader 2 didn’t.
There was no time-series bias for both read-ers. Reader 1 had an agreement of 98%with ages of fish aged in 2003 with a CV of
74
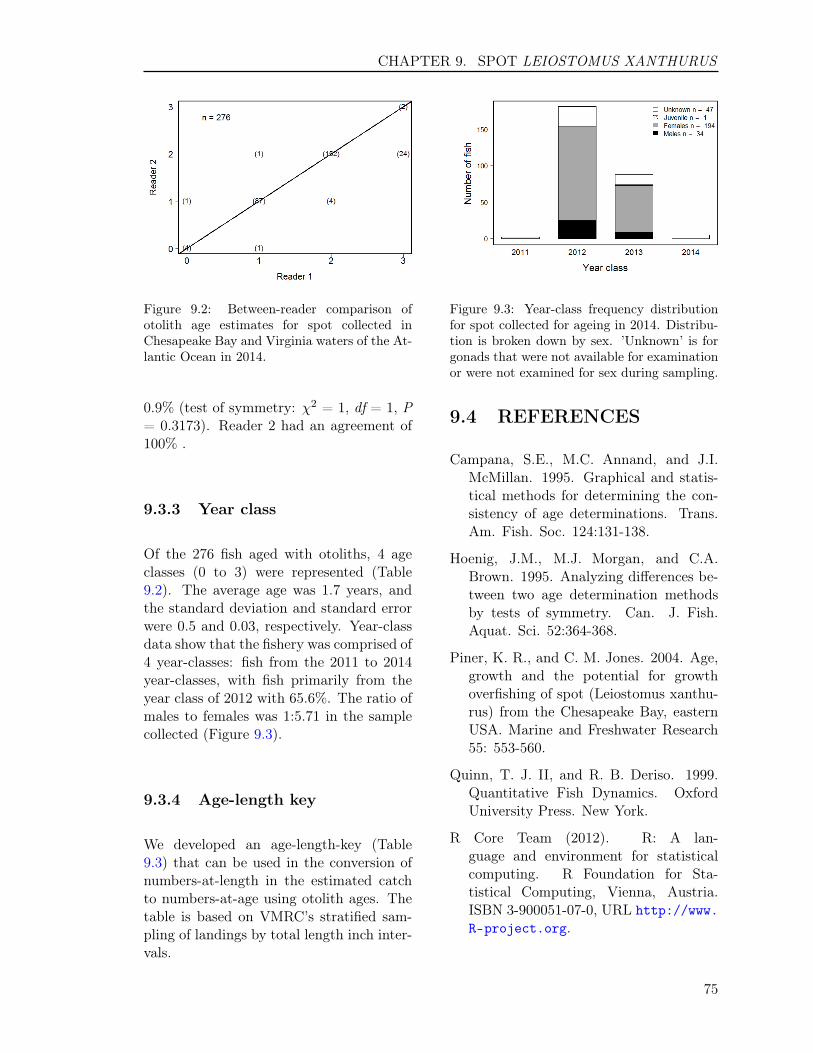
CHAPTER 9. SPOT LEIOSTOMUS XANTHURUS
Figure 9.2: Between-reader comparison ofotolith age estimates for spot collected inChesapeake Bay and Virginia waters of the At-lantic Ocean in 2014.
0.9% (test of symmetry: χ2 = 1, df = 1, P= 0.3173). Reader 2 had an agreement of100% .
9.3.3 Year class
Of the 276 fish aged with otoliths, 4 ageclasses (0 to 3) were represented (Table9.2). The average age was 1.7 years, andthe standard deviation and standard errorwere 0.5 and 0.03, respectively. Year-classdata show that the fishery was comprised of4 year-classes: fish from the 2011 to 2014year-classes, with fish primarily from theyear class of 2012 with 65.6%. The ratio ofmales to females was 1:5.71 in the samplecollected (Figure 9.3).
9.3.4 Age-length key
We developed an age-length-key (Table9.3) that can be used in the conversion ofnumbers-at-length in the estimated catchto numbers-at-age using otolith ages. Thetable is based on VMRC’s stratified sam-pling of landings by total length inch inter-vals.
Figure 9.3: Year-class frequency distributionfor spot collected for ageing in 2014. Distribu-tion is broken down by sex. ’Unknown’ is forgonads that were not available for examinationor were not examined for sex during sampling.
9.4 REFERENCES
Campana, S.E., M.C. Annand, and J.I.McMillan. 1995. Graphical and statis-tical methods for determining the con-sistency of age determinations. Trans.Am. Fish. Soc. 124:131-138.
Hoenig, J.M., M.J. Morgan, and C.A.Brown. 1995. Analyzing differences be-tween two age determination methodsby tests of symmetry. Can. J. Fish.Aquat. Sci. 52:364-368.
Piner, K. R., and C. M. Jones. 2004. Age,growth and the potential for growthoverfishing of spot (Leiostomus xanthu-rus) from the Chesapeake Bay, easternUSA. Marine and Freshwater Research55: 553-560.
Quinn, T. J. II, and R. B. Deriso. 1999.Quantitative Fish Dynamics. OxfordUniversity Press. New York.
R Core Team (2012). R: A lan-guage and environment for statisticalcomputing. R Foundation for Sta-tistical Computing, Vienna, Austria.ISBN 3-900051-07-0, URL http://www.R-project.org.
75

CHAPTER 9. SPOT LEIOSTOMUS XANTHURUS
Table 9.1: Number of spot collected and aged in each 1-inch length interval in 2014. ’Target’represents the sample size for ageing estimated for 2014, and ’Need’ represents number of fishshorted in each length interval compared to the optimum sample size for ageing and number of fishaged.
Interval Target Collected Aged Need5 - 5.99 6 7 6 06 - 6.99 6 19 6 07 - 7.99 31 36 32 08 - 8.99 59 68 60 09 - 9.99 85 110 86 0
10 - 10.99 61 72 63 011 - 11.99 18 24 23 012 - 12.99 5 0 0 5
Totals 271 336 276 5(Go back to text)
76
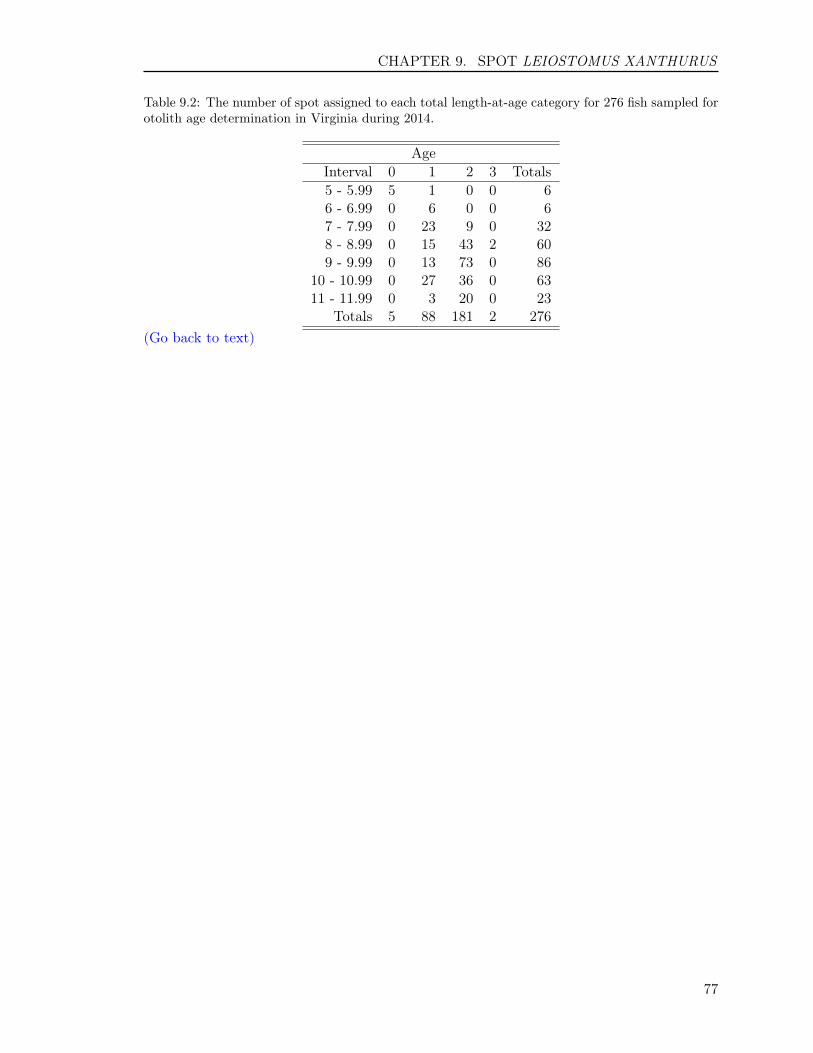
CHAPTER 9. SPOT LEIOSTOMUS XANTHURUS
Table 9.2: The number of spot assigned to each total length-at-age category for 276 fish sampled forotolith age determination in Virginia during 2014.
AgeInterval 0 1 2 3 Totals5 - 5.99 5 1 0 0 66 - 6.99 0 6 0 0 67 - 7.99 0 23 9 0 328 - 8.99 0 15 43 2 609 - 9.99 0 13 73 0 86
10 - 10.99 0 27 36 0 6311 - 11.99 0 3 20 0 23
Totals 5 88 181 2 276(Go back to text)
77
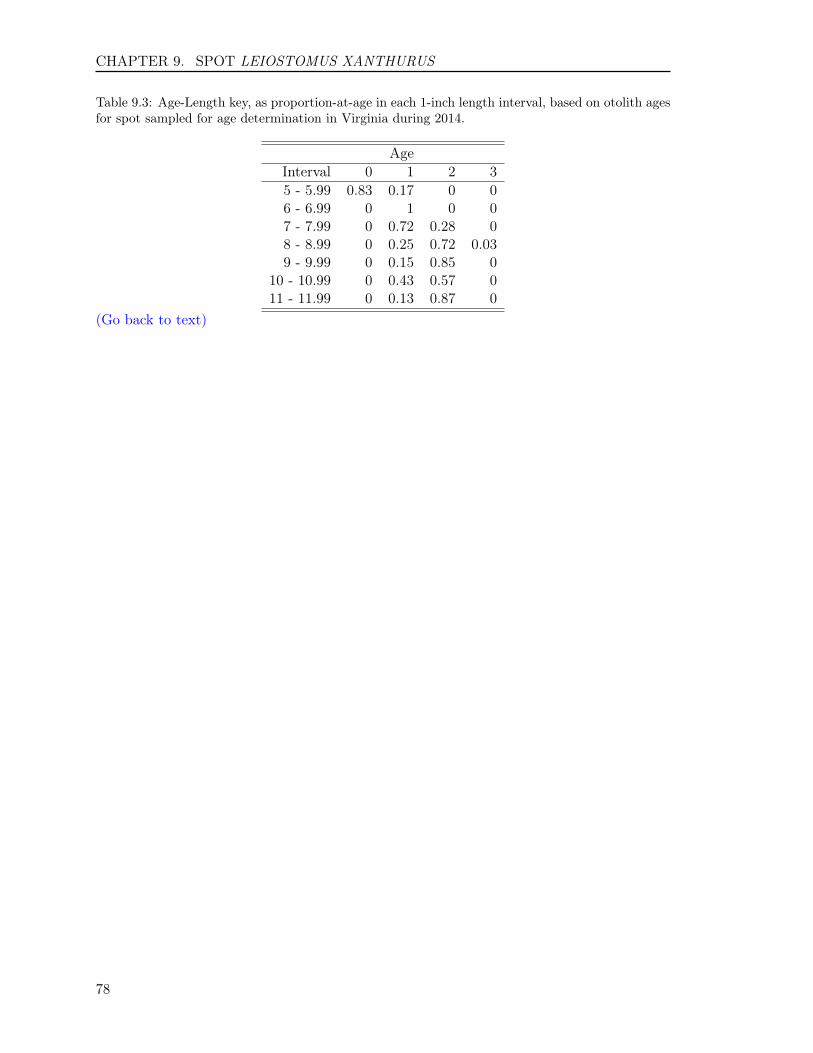
CHAPTER 9. SPOT LEIOSTOMUS XANTHURUS
Table 9.3: Age-Length key, as proportion-at-age in each 1-inch length interval, based on otolith agesfor spot sampled for age determination in Virginia during 2014.
AgeInterval 0 1 2 35 - 5.99 0.83 0.17 0 06 - 6.99 0 1 0 07 - 7.99 0 0.72 0.28 08 - 8.99 0 0.25 0.72 0.039 - 9.99 0 0.15 0.85 0
10 - 10.99 0 0.43 0.57 011 - 11.99 0 0.13 0.87 0
(Go back to text)
78

Chapter 10
SPOTTED SEATROUT Cynoscionnebulosus
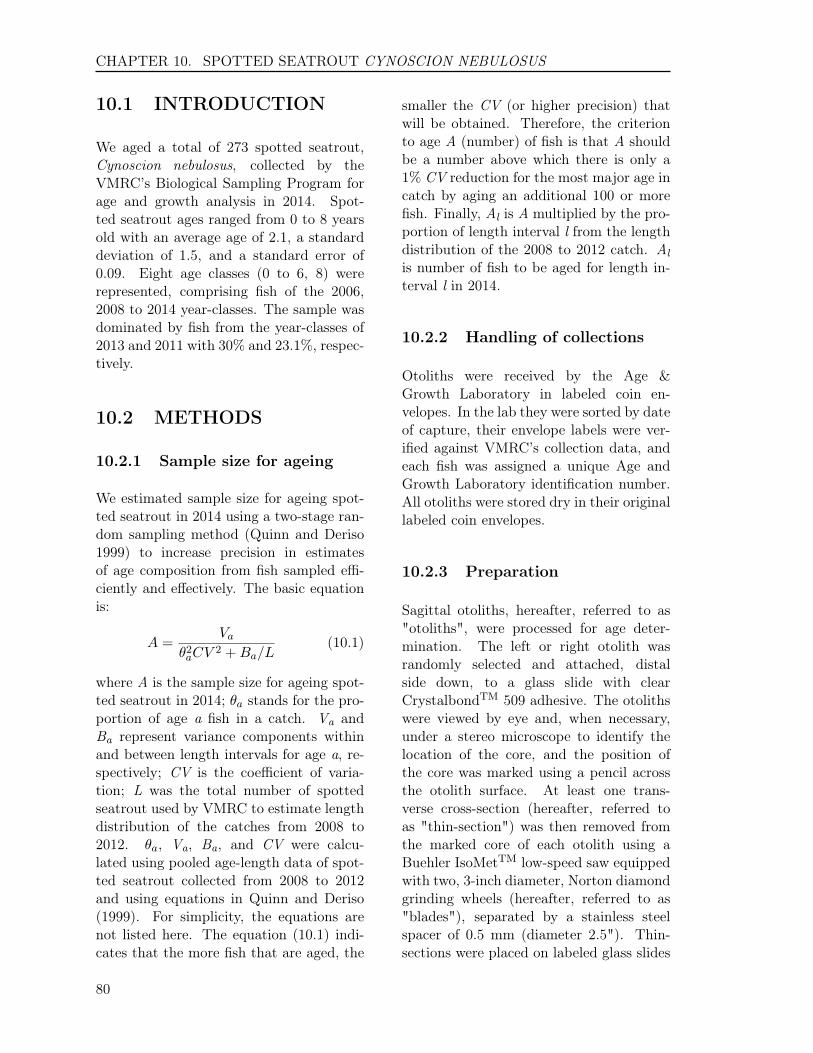
CHAPTER 10. SPOTTED SEATROUT CYNOSCION NEBULOSUS
10.1 INTRODUCTION
We aged a total of 273 spotted seatrout,Cynoscion nebulosus, collected by theVMRC’s Biological Sampling Program forage and growth analysis in 2014. Spot-ted seatrout ages ranged from 0 to 8 yearsold with an average age of 2.1, a standarddeviation of 1.5, and a standard error of0.09. Eight age classes (0 to 6, 8) wererepresented, comprising fish of the 2006,2008 to 2014 year-classes. The sample wasdominated by fish from the year-classes of2013 and 2011 with 30% and 23.1%, respec-tively.
10.2 METHODS
10.2.1 Sample size for ageing
We estimated sample size for ageing spot-ted seatrout in 2014 using a two-stage ran-dom sampling method (Quinn and Deriso1999) to increase precision in estimatesof age composition from fish sampled effi-ciently and effectively. The basic equationis:
A =Va
θ2aCV2 +Ba/L
(10.1)
where A is the sample size for ageing spot-ted seatrout in 2014; θa stands for the pro-portion of age a fish in a catch. Va andBa represent variance components withinand between length intervals for age a, re-spectively; CV is the coefficient of varia-tion; L was the total number of spottedseatrout used by VMRC to estimate lengthdistribution of the catches from 2008 to2012. θa, Va, Ba, and CV were calcu-lated using pooled age-length data of spot-ted seatrout collected from 2008 to 2012and using equations in Quinn and Deriso(1999). For simplicity, the equations arenot listed here. The equation (10.1) indi-cates that the more fish that are aged, the
smaller the CV (or higher precision) thatwill be obtained. Therefore, the criterionto age A (number) of fish is that A shouldbe a number above which there is only a1% CV reduction for the most major age incatch by aging an additional 100 or morefish. Finally, Al is A multiplied by the pro-portion of length interval l from the lengthdistribution of the 2008 to 2012 catch. Alis number of fish to be aged for length in-terval l in 2014.
10.2.2 Handling of collections
Otoliths were received by the Age &Growth Laboratory in labeled coin en-velopes. In the lab they were sorted by dateof capture, their envelope labels were ver-ified against VMRC’s collection data, andeach fish was assigned a unique Age andGrowth Laboratory identification number.All otoliths were stored dry in their originallabeled coin envelopes.
10.2.3 Preparation
Sagittal otoliths, hereafter, referred to as"otoliths", were processed for age deter-mination. The left or right otolith wasrandomly selected and attached, distalside down, to a glass slide with clearCrystalbondTM 509 adhesive. The otolithswere viewed by eye and, when necessary,under a stereo microscope to identify thelocation of the core, and the position ofthe core was marked using a pencil acrossthe otolith surface. At least one trans-verse cross-section (hereafter, referred toas "thin-section") was then removed fromthe marked core of each otolith using aBuehler IsoMetTM low-speed saw equippedwith two, 3-inch diameter, Norton diamondgrinding wheels (hereafter, referred to as"blades"), separated by a stainless steelspacer of 0.5 mm (diameter 2.5"). Thin-sections were placed on labeled glass slides
80

CHAPTER 10. SPOTTED SEATROUT CYNOSCION NEBULOSUS
and covered with a thin layer of Flo-texxmounting medium that not only fixed thesections to the slide, but more importantly,provided enhanced contrast and greaterreadability by increasing light transmissionthrough the thin-sections.
Click here to obtain the protocol atthe CQFE website on how to prepareotolith thin-section for ageing spottedseatrout.
10.2.4 Readings
The CQFE system assigns an age class toa fish based on a combination of numberof annuli in a thin-section, the date of cap-ture, and the species-specific period whenthe annulus is deposited. Each year, asthe fish grows, its otoliths grow and leavebehind markers of their age, called an an-nulus. Technically, an otolith annulus isthe combination of both the opaque andthe translucent band. In practice, only theopaque bands are counted as annuli. Thenumber of annuli replaces "x" in our nota-tion below, and is the initial "age" assign-ment of the fish.
Second, the thin-section is examined fortranslucent growth. If no translucentgrowth is visible beyond the last annulus,the otolith is called "even" and no modi-fication of the assigned age is made. Theinitial assigned age, then, is the age class ofthe fish. Any growth beyond the last an-nulus can be interpreted as either being to-ward the next age class or within the sameage class. If translucent growth is visiblebeyond the last annulus, a "+" is added tothe notation.
By convention all fish in the NorthernHemisphere are assigned a birth date ofJanuary 1. In addition, each species hasa specific period during which it depositsthe annulus. If the fish is captured afterthe end of the species-specific annulus de-
position period and before January 1, it isassigned an age class notation of "x+x",where "x" is the number of annuli in thethin-section. If the fish is captured be-tween January 1 and the end of the species-specific annulus deposition period, it is as-signed an age class notation of "x+(x+1)".Thus, any growth beyond the last annulus,after its "birthday" but before the end ofannulus deposition period, is interpreted asbeing toward the next age class.
For example, spotted seatrout otolith an-nulus formation occurs between March andMay (Ihde and Chittenden 2003). A spot-ted seatrout captured between January 1and May 31, before the end of the species’annulus deposition period, with three visi-ble annuli and some translucent growth af-ter the last annulus, would be assigned anage class of "x+(x+1)" or 3+(3+1), notedas 3+4. This is the same age-class assignedto a fish with four visible annuli capturedafter the end of May 31, the period of an-nulus deposition, which would be noted as4+4.
All thin-sections were aged by two differentreaders using a Nikon SMZ1000 stereo mi-croscope under transmitted light and dark-field polarization at between 8 and 20 timesmagnification (Figure 10.1). Each readeraged all of the otolith samples. All sam-
Figure 10.1: Otolith thin-section of a 4 year-old spotted seatrout with the last annulus onthe edge of the thin-section
ples were aged in chronological order, based
81
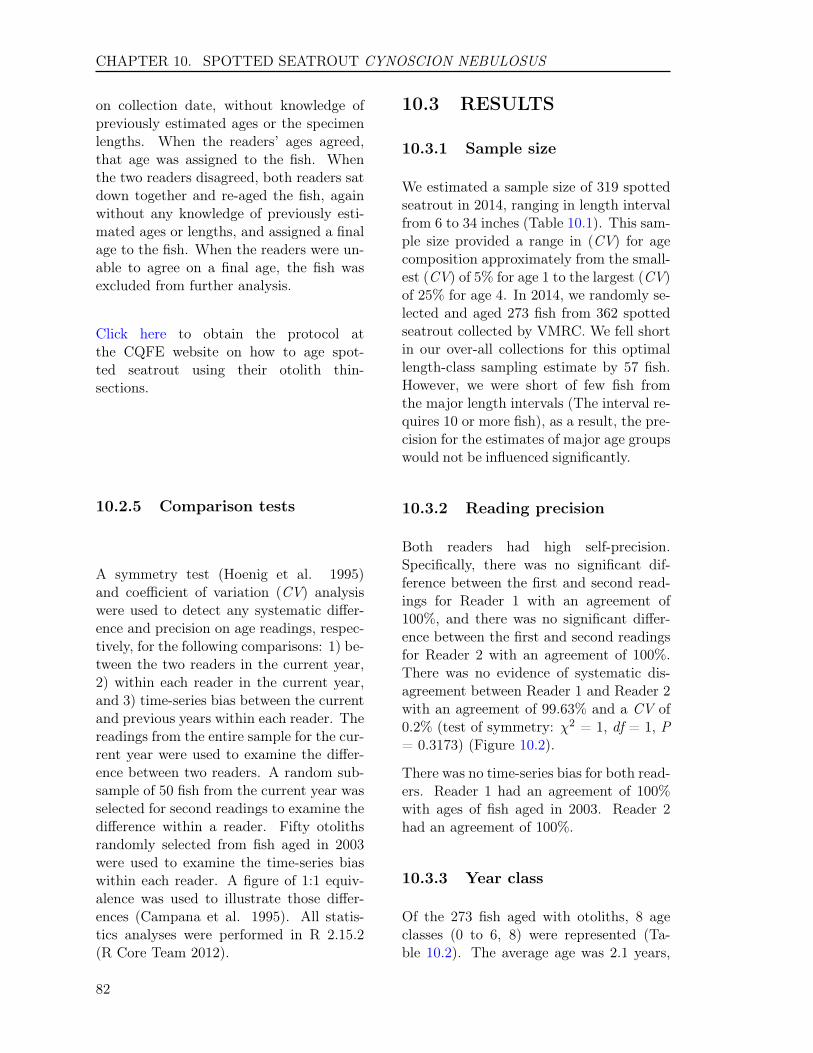
CHAPTER 10. SPOTTED SEATROUT CYNOSCION NEBULOSUS
on collection date, without knowledge ofpreviously estimated ages or the specimenlengths. When the readers’ ages agreed,that age was assigned to the fish. Whenthe two readers disagreed, both readers satdown together and re-aged the fish, againwithout any knowledge of previously esti-mated ages or lengths, and assigned a finalage to the fish. When the readers were un-able to agree on a final age, the fish wasexcluded from further analysis.
Click here to obtain the protocol atthe CQFE website on how to age spot-ted seatrout using their otolith thin-sections.
10.2.5 Comparison tests
A symmetry test (Hoenig et al. 1995)and coefficient of variation (CV) analysiswere used to detect any systematic differ-ence and precision on age readings, respec-tively, for the following comparisons: 1) be-tween the two readers in the current year,2) within each reader in the current year,and 3) time-series bias between the currentand previous years within each reader. Thereadings from the entire sample for the cur-rent year were used to examine the differ-ence between two readers. A random sub-sample of 50 fish from the current year wasselected for second readings to examine thedifference within a reader. Fifty otolithsrandomly selected from fish aged in 2003were used to examine the time-series biaswithin each reader. A figure of 1:1 equiv-alence was used to illustrate those differ-ences (Campana et al. 1995). All statis-tics analyses were performed in R 2.15.2(R Core Team 2012).
10.3 RESULTS
10.3.1 Sample size
We estimated a sample size of 319 spottedseatrout in 2014, ranging in length intervalfrom 6 to 34 inches (Table 10.1). This sam-ple size provided a range in (CV) for agecomposition approximately from the small-est (CV) of 5% for age 1 to the largest (CV)of 25% for age 4. In 2014, we randomly se-lected and aged 273 fish from 362 spottedseatrout collected by VMRC. We fell shortin our over-all collections for this optimallength-class sampling estimate by 57 fish.However, we were short of few fish fromthe major length intervals (The interval re-quires 10 or more fish), as a result, the pre-cision for the estimates of major age groupswould not be influenced significantly.
10.3.2 Reading precision
Both readers had high self-precision.Specifically, there was no significant dif-ference between the first and second read-ings for Reader 1 with an agreement of100%, and there was no significant differ-ence between the first and second readingsfor Reader 2 with an agreement of 100%.There was no evidence of systematic dis-agreement between Reader 1 and Reader 2with an agreement of 99.63% and a CV of0.2% (test of symmetry: χ2 = 1, df = 1, P= 0.3173) (Figure 10.2).
There was no time-series bias for both read-ers. Reader 1 had an agreement of 100%with ages of fish aged in 2003. Reader 2had an agreement of 100%.
10.3.3 Year class
Of the 273 fish aged with otoliths, 8 ageclasses (0 to 6, 8) were represented (Ta-ble 10.2). The average age was 2.1 years,
82

CHAPTER 10. SPOTTED SEATROUT CYNOSCION NEBULOSUS
Figure 10.2: Between-reader comparison ofotolith age estimates for spotted seatrout col-lected in Chesapeake Bay and Virginia watersof the Atlantic Ocean in 2014.
and the standard deviation and standarderror were 1.5 and 0.09, respectively. Year-class data show that the fishery was com-prised of 8 year-classes: fish from the 2006,2008 to 2014 year-classes, with fish primar-ily from the year classes of 2013 and 2011with 30% and 23.1%, respectively. The ra-tio of males to females was 1:0.99 in thesample collected (Figure 10.3).
Figure 10.3: Year-class frequency distributionfor spotted seatrout collected for ageing in2014. Distribution is broken down by sex. ’Un-known’ represents gonads that were not avail-able for examination or were not examined forsex during sampling.
10.3.4 Age-length key
We developed an age-length-key (Table10.3) that can be used in the conversion ofnumbers-at-length in the estimated catchto numbers-at-age using otolith ages. Thetable is based on VMRC’s stratified sam-pling of landings by total length inch inter-vals.
10.4 REFERENCES
Campana, S.E., M.C. Annand, and J.I.McMillan. 1995. Graphical and statis-tical methods for determining the con-sistency of age determinations. Trans.Am. Fish. Soc. 124:131-138.
Hoenig, J.M., M.J. Morgan, and C.A.Brown. 1995. Analyzing differences be-tween two age determination methodsby tests of symmetry. Can. J. Fish.Aquat. Sci. 52:364-368.
Ihde, T., Chittenden, M. 2003. Vali-dation of presumed annual marks onsectioned otoliths of spotted seatrout,Cynoscion nebulosus, in the ChesapeakeBay region. Bulletin of Marine Science,72(1):77-87, 2003.
Quinn, T. J. II, and R. B. Deriso. 1999.Quantitative Fish Dynamics. OxfordUniveristy Press. New York.
R Core Team (2012). R: A lan-guage and environment for statisticalcomputing. R Foundation for Sta-tistical Computing, Vienna, Austria.ISBN 3-900051-07-0, URL http://www.R-project.org.
83

CHAPTER 10. SPOTTED SEATROUT CYNOSCION NEBULOSUS
Table 10.1: Number of spotted seatrout collected and aged in each 1-inch length interval in 2014.’Target’ represents the sample size for ageing estimated for 2014, and ’Need’ represents number offish shorted in each length interval compared to the optimum sample size for ageing and number offish aged.
Interval Target Collected Aged Need6 - 6.99 5 0 0 57 - 7.99 5 0 0 58 - 8.99 5 0 0 59 - 9.99 5 0 0 5
10 - 10.99 6 0 0 611 - 11.99 10 6 6 412 - 12.99 21 20 20 113 - 13.99 16 11 11 514 - 14.99 14 16 14 015 - 15.99 19 27 20 016 - 16.99 29 46 31 017 - 17.99 32 41 32 018 - 18.99 22 34 22 019 - 19.99 24 33 24 020 - 20.99 19 26 20 021 - 21.99 9 16 10 022 - 22.99 10 14 10 023 - 23.99 9 15 10 024 - 24.99 8 9 8 025 - 25.99 6 10 7 026 - 26.99 5 7 6 027 - 27.99 5 11 6 028 - 28.99 5 10 6 029 - 29.99 5 6 6 030 - 30.99 5 2 2 331 - 31.99 5 1 1 432 - 32.99 5 0 0 533 - 33.99 5 1 1 434 - 34.99 5 0 0 5
Totals 319 362 273 57(Go back to text)
84
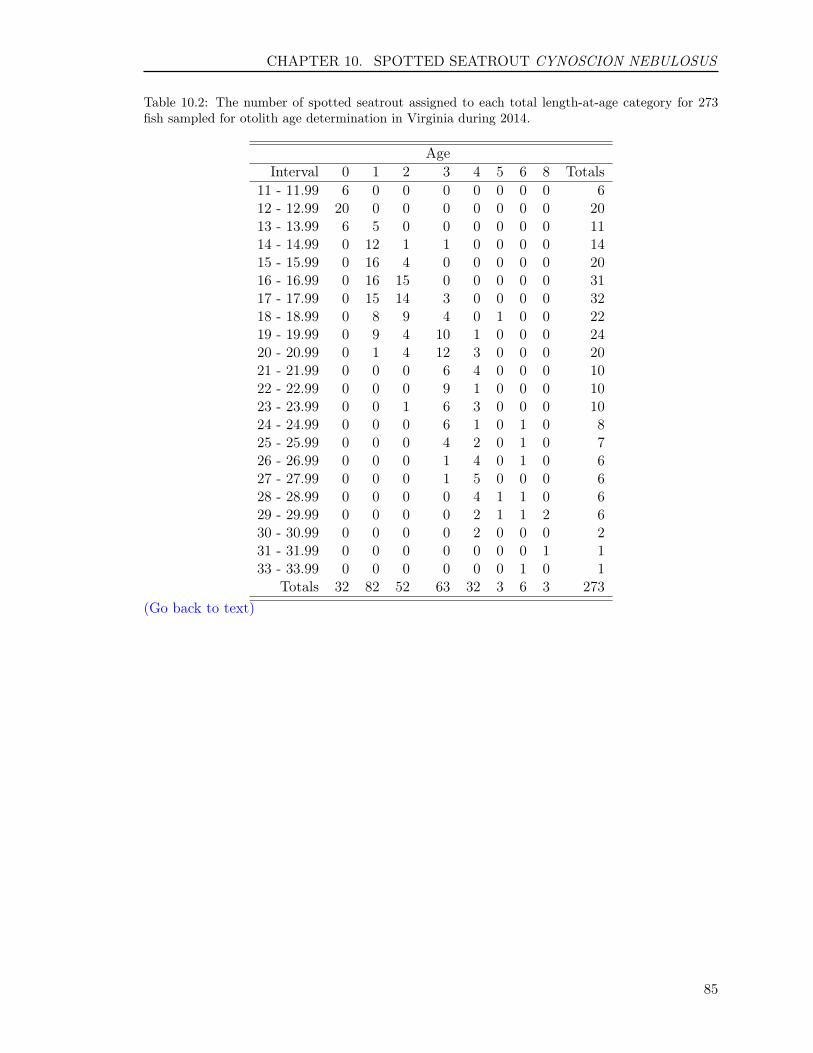
CHAPTER 10. SPOTTED SEATROUT CYNOSCION NEBULOSUS
Table 10.2: The number of spotted seatrout assigned to each total length-at-age category for 273fish sampled for otolith age determination in Virginia during 2014.
AgeInterval 0 1 2 3 4 5 6 8 Totals
11 - 11.99 6 0 0 0 0 0 0 0 612 - 12.99 20 0 0 0 0 0 0 0 2013 - 13.99 6 5 0 0 0 0 0 0 1114 - 14.99 0 12 1 1 0 0 0 0 1415 - 15.99 0 16 4 0 0 0 0 0 2016 - 16.99 0 16 15 0 0 0 0 0 3117 - 17.99 0 15 14 3 0 0 0 0 3218 - 18.99 0 8 9 4 0 1 0 0 2219 - 19.99 0 9 4 10 1 0 0 0 2420 - 20.99 0 1 4 12 3 0 0 0 2021 - 21.99 0 0 0 6 4 0 0 0 1022 - 22.99 0 0 0 9 1 0 0 0 1023 - 23.99 0 0 1 6 3 0 0 0 1024 - 24.99 0 0 0 6 1 0 1 0 825 - 25.99 0 0 0 4 2 0 1 0 726 - 26.99 0 0 0 1 4 0 1 0 627 - 27.99 0 0 0 1 5 0 0 0 628 - 28.99 0 0 0 0 4 1 1 0 629 - 29.99 0 0 0 0 2 1 1 2 630 - 30.99 0 0 0 0 2 0 0 0 231 - 31.99 0 0 0 0 0 0 0 1 133 - 33.99 0 0 0 0 0 0 1 0 1
Totals 32 82 52 63 32 3 6 3 273(Go back to text)
85

CHAPTER 10. SPOTTED SEATROUT CYNOSCION NEBULOSUS
Table 10.3: Age-Length key, as proportion-at-age in each 1-inch length interval, based on otolithages for spotted seatrout sampled for age determination in Virginia during 2014.
AgeInterval 0 1 2 3 4 5 6 8
11 - 11.99 1 0 0 0 0 0 0 012 - 12.99 1 0 0 0 0 0 0 013 - 13.99 0.55 0.45 0 0 0 0 0 014 - 14.99 0 0.86 0.07 0.07 0 0 0 015 - 15.99 0 0.8 0.2 0 0 0 0 016 - 16.99 0 0.52 0.48 0 0 0 0 017 - 17.99 0 0.47 0.44 0.09 0 0 0 018 - 18.99 0 0.36 0.41 0.18 0 0.05 0 019 - 19.99 0 0.38 0.17 0.42 0.04 0 0 020 - 20.99 0 0.05 0.2 0.6 0.15 0 0 021 - 21.99 0 0 0 0.6 0.4 0 0 022 - 22.99 0 0 0 0.9 0.1 0 0 023 - 23.99 0 0 0.1 0.6 0.3 0 0 024 - 24.99 0 0 0 0.75 0.12 0 0.12 025 - 25.99 0 0 0 0.57 0.29 0 0.14 026 - 26.99 0 0 0 0.17 0.67 0 0.17 027 - 27.99 0 0 0 0.17 0.83 0 0 028 - 28.99 0 0 0 0 0.67 0.17 0.17 029 - 29.99 0 0 0 0 0.33 0.17 0.17 0.3330 - 30.99 0 0 0 0 1 0 0 031 - 31.99 0 0 0 0 0 0 0 133 - 33.99 0 0 0 0 0 0 1 0
(Go back to text)
86

Chapter 11
STRIPED BASS Morone saxatilis
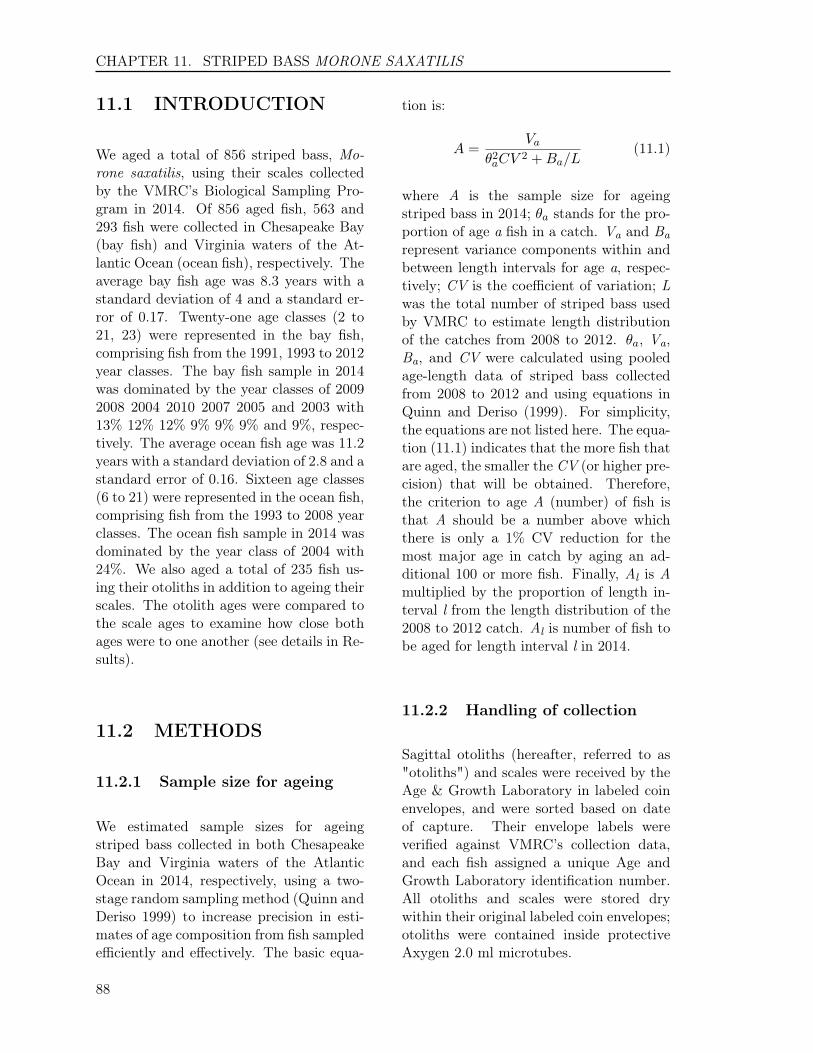
CHAPTER 11. STRIPED BASS MORONE SAXATILIS
11.1 INTRODUCTION
We aged a total of 856 striped bass, Mo-rone saxatilis, using their scales collectedby the VMRC’s Biological Sampling Pro-gram in 2014. Of 856 aged fish, 563 and293 fish were collected in Chesapeake Bay(bay fish) and Virginia waters of the At-lantic Ocean (ocean fish), respectively. Theaverage bay fish age was 8.3 years with astandard deviation of 4 and a standard er-ror of 0.17. Twenty-one age classes (2 to21, 23) were represented in the bay fish,comprising fish from the 1991, 1993 to 2012year classes. The bay fish sample in 2014was dominated by the year classes of 20092008 2004 2010 2007 2005 and 2003 with13% 12% 12% 9% 9% 9% and 9%, respec-tively. The average ocean fish age was 11.2years with a standard deviation of 2.8 and astandard error of 0.16. Sixteen age classes(6 to 21) were represented in the ocean fish,comprising fish from the 1993 to 2008 yearclasses. The ocean fish sample in 2014 wasdominated by the year class of 2004 with24%. We also aged a total of 235 fish us-ing their otoliths in addition to ageing theirscales. The otolith ages were compared tothe scale ages to examine how close bothages were to one another (see details in Re-sults).
11.2 METHODS
11.2.1 Sample size for ageing
We estimated sample sizes for ageingstriped bass collected in both ChesapeakeBay and Virginia waters of the AtlanticOcean in 2014, respectively, using a two-stage random sampling method (Quinn andDeriso 1999) to increase precision in esti-mates of age composition from fish sampledefficiently and effectively. The basic equa-
tion is:
A =Va
θ2aCV2 +Ba/L
(11.1)
where A is the sample size for ageingstriped bass in 2014; θa stands for the pro-portion of age a fish in a catch. Va and Barepresent variance components within andbetween length intervals for age a, respec-tively; CV is the coefficient of variation; Lwas the total number of striped bass usedby VMRC to estimate length distributionof the catches from 2008 to 2012. θa, Va,Ba, and CV were calculated using pooledage-length data of striped bass collectedfrom 2008 to 2012 and using equations inQuinn and Deriso (1999). For simplicity,the equations are not listed here. The equa-tion (11.1) indicates that the more fish thatare aged, the smaller the CV (or higher pre-cision) that will be obtained. Therefore,the criterion to age A (number) of fish isthat A should be a number above whichthere is only a 1% CV reduction for themost major age in catch by aging an ad-ditional 100 or more fish. Finally, Al is Amultiplied by the proportion of length in-terval l from the length distribution of the2008 to 2012 catch. Al is number of fish tobe aged for length interval l in 2014.
11.2.2 Handling of collection
Sagittal otoliths (hereafter, referred to as"otoliths") and scales were received by theAge & Growth Laboratory in labeled coinenvelopes, and were sorted based on dateof capture. Their envelope labels wereverified against VMRC’s collection data,and each fish assigned a unique Age andGrowth Laboratory identification number.All otoliths and scales were stored drywithin their original labeled coin envelopes;otoliths were contained inside protectiveAxygen 2.0 ml microtubes.
88
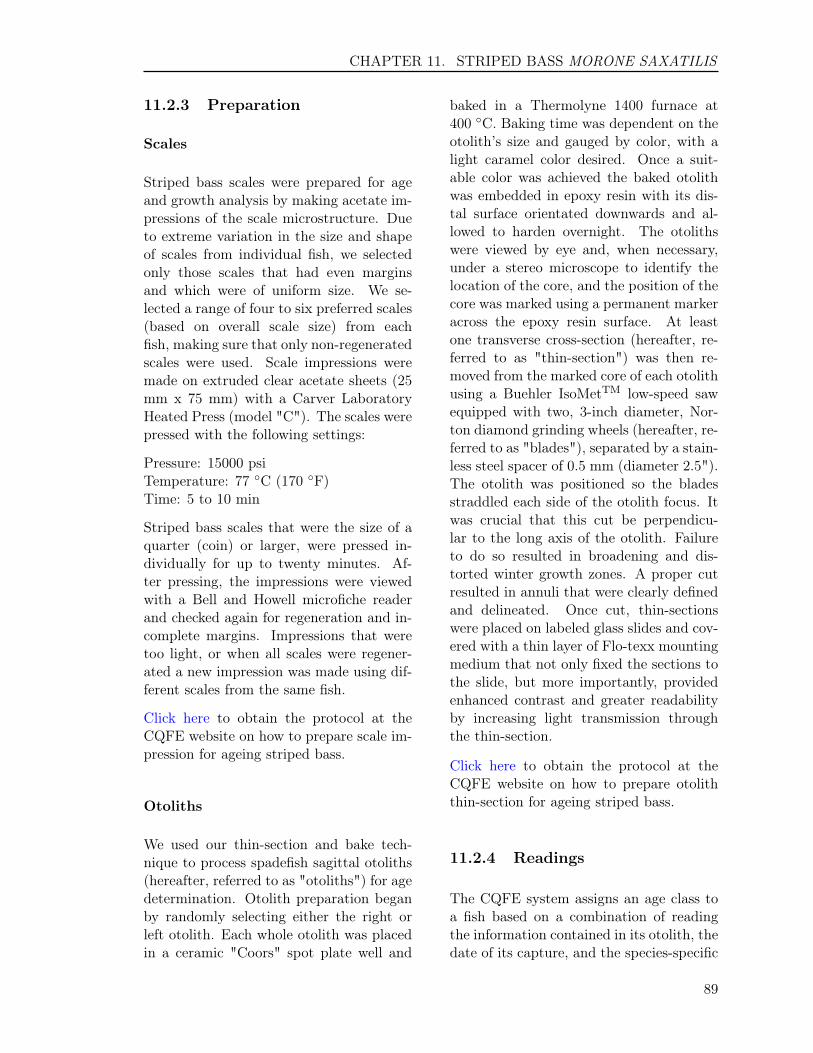
CHAPTER 11. STRIPED BASS MORONE SAXATILIS
11.2.3 Preparation
Scales
Striped bass scales were prepared for ageand growth analysis by making acetate im-pressions of the scale microstructure. Dueto extreme variation in the size and shapeof scales from individual fish, we selectedonly those scales that had even marginsand which were of uniform size. We se-lected a range of four to six preferred scales(based on overall scale size) from eachfish, making sure that only non-regeneratedscales were used. Scale impressions weremade on extruded clear acetate sheets (25mm x 75 mm) with a Carver LaboratoryHeated Press (model "C"). The scales werepressed with the following settings:
Pressure: 15000 psiTemperature: 77 ◦C (170 ◦F)Time: 5 to 10 min
Striped bass scales that were the size of aquarter (coin) or larger, were pressed in-dividually for up to twenty minutes. Af-ter pressing, the impressions were viewedwith a Bell and Howell microfiche readerand checked again for regeneration and in-complete margins. Impressions that weretoo light, or when all scales were regener-ated a new impression was made using dif-ferent scales from the same fish.
Click here to obtain the protocol at theCQFE website on how to prepare scale im-pression for ageing striped bass.
Otoliths
We used our thin-section and bake tech-nique to process spadefish sagittal otoliths(hereafter, referred to as "otoliths") for agedetermination. Otolith preparation beganby randomly selecting either the right orleft otolith. Each whole otolith was placedin a ceramic "Coors" spot plate well and
baked in a Thermolyne 1400 furnace at400 ◦C. Baking time was dependent on theotolith’s size and gauged by color, with alight caramel color desired. Once a suit-able color was achieved the baked otolithwas embedded in epoxy resin with its dis-tal surface orientated downwards and al-lowed to harden overnight. The otolithswere viewed by eye and, when necessary,under a stereo microscope to identify thelocation of the core, and the position of thecore was marked using a permanent markeracross the epoxy resin surface. At leastone transverse cross-section (hereafter, re-ferred to as "thin-section") was then re-moved from the marked core of each otolithusing a Buehler IsoMetTM low-speed sawequipped with two, 3-inch diameter, Nor-ton diamond grinding wheels (hereafter, re-ferred to as "blades"), separated by a stain-less steel spacer of 0.5 mm (diameter 2.5").The otolith was positioned so the bladesstraddled each side of the otolith focus. Itwas crucial that this cut be perpendicu-lar to the long axis of the otolith. Failureto do so resulted in broadening and dis-torted winter growth zones. A proper cutresulted in annuli that were clearly definedand delineated. Once cut, thin-sectionswere placed on labeled glass slides and cov-ered with a thin layer of Flo-texx mountingmedium that not only fixed the sections tothe slide, but more importantly, providedenhanced contrast and greater readabilityby increasing light transmission throughthe thin-section.
Click here to obtain the protocol at theCQFE website on how to prepare otoliththin-section for ageing striped bass.
11.2.4 Readings
The CQFE system assigns an age class toa fish based on a combination of readingthe information contained in its otolith, thedate of its capture, and the species-specific
89
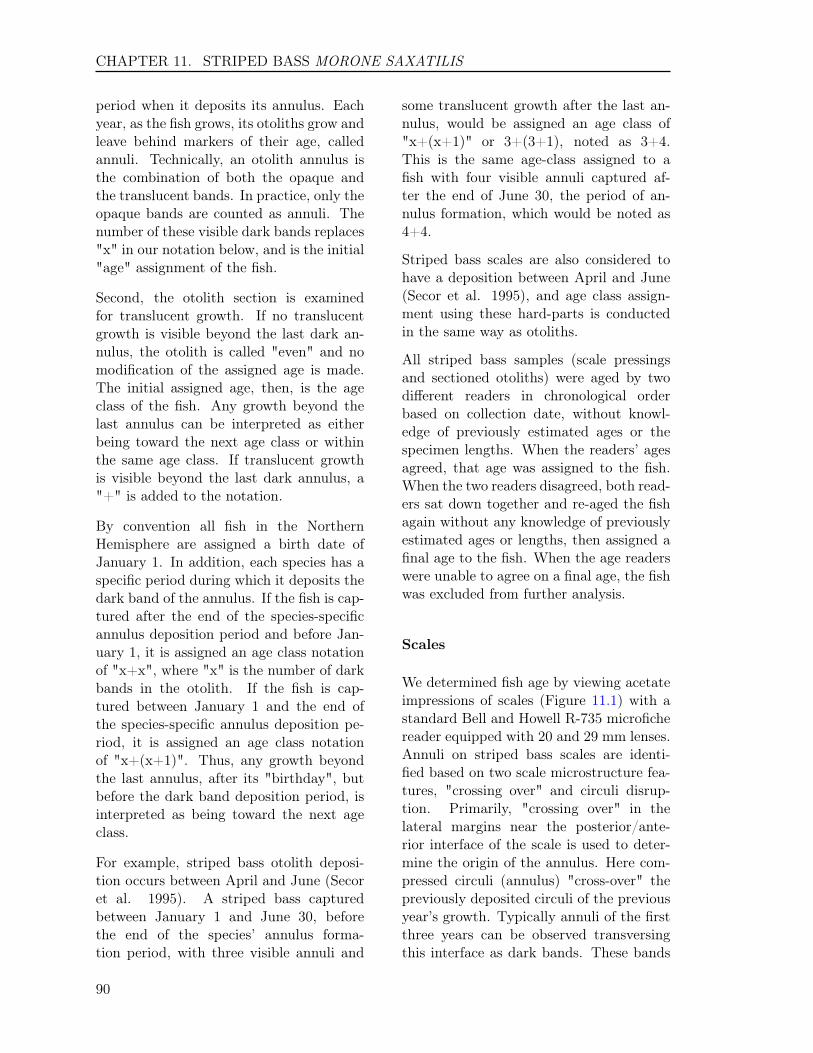
CHAPTER 11. STRIPED BASS MORONE SAXATILIS
period when it deposits its annulus. Eachyear, as the fish grows, its otoliths grow andleave behind markers of their age, calledannuli. Technically, an otolith annulus isthe combination of both the opaque andthe translucent bands. In practice, only theopaque bands are counted as annuli. Thenumber of these visible dark bands replaces"x" in our notation below, and is the initial"age" assignment of the fish.
Second, the otolith section is examinedfor translucent growth. If no translucentgrowth is visible beyond the last dark an-nulus, the otolith is called "even" and nomodification of the assigned age is made.The initial assigned age, then, is the ageclass of the fish. Any growth beyond thelast annulus can be interpreted as eitherbeing toward the next age class or withinthe same age class. If translucent growthis visible beyond the last dark annulus, a"+" is added to the notation.
By convention all fish in the NorthernHemisphere are assigned a birth date ofJanuary 1. In addition, each species has aspecific period during which it deposits thedark band of the annulus. If the fish is cap-tured after the end of the species-specificannulus deposition period and before Jan-uary 1, it is assigned an age class notationof "x+x", where "x" is the number of darkbands in the otolith. If the fish is cap-tured between January 1 and the end ofthe species-specific annulus deposition pe-riod, it is assigned an age class notationof "x+(x+1)". Thus, any growth beyondthe last annulus, after its "birthday", butbefore the dark band deposition period, isinterpreted as being toward the next ageclass.
For example, striped bass otolith deposi-tion occurs between April and June (Secoret al. 1995). A striped bass capturedbetween January 1 and June 30, beforethe end of the species’ annulus forma-tion period, with three visible annuli and
some translucent growth after the last an-nulus, would be assigned an age class of"x+(x+1)" or 3+(3+1), noted as 3+4.This is the same age-class assigned to afish with four visible annuli captured af-ter the end of June 30, the period of an-nulus formation, which would be noted as4+4.
Striped bass scales are also considered tohave a deposition between April and June(Secor et al. 1995), and age class assign-ment using these hard-parts is conductedin the same way as otoliths.
All striped bass samples (scale pressingsand sectioned otoliths) were aged by twodifferent readers in chronological orderbased on collection date, without knowl-edge of previously estimated ages or thespecimen lengths. When the readers’ agesagreed, that age was assigned to the fish.When the two readers disagreed, both read-ers sat down together and re-aged the fishagain without any knowledge of previouslyestimated ages or lengths, then assigned afinal age to the fish. When the age readerswere unable to agree on a final age, the fishwas excluded from further analysis.
Scales
We determined fish age by viewing acetateimpressions of scales (Figure 11.1) with astandard Bell and Howell R-735 microfichereader equipped with 20 and 29 mm lenses.Annuli on striped bass scales are identi-fied based on two scale microstructure fea-tures, "crossing over" and circuli disrup-tion. Primarily, "crossing over" in thelateral margins near the posterior/ante-rior interface of the scale is used to deter-mine the origin of the annulus. Here com-pressed circuli (annulus) "cross-over" thepreviously deposited circuli of the previousyear’s growth. Typically annuli of the firstthree years can be observed transversingthis interface as dark bands. These bands
90

CHAPTER 11. STRIPED BASS MORONE SAXATILIS
Figure 11.1: Scale impression of a 3 year-oldstriped bass.
remain consistent throughout the posteriorfield and rejoin the posterior/anterior in-terface on the opposite side of the focus.Annuli can also be observed in the anteriorlateral field of the scale. Here the annulitypically reveal a pattern of discontinuousand suddenly breaking segmented circuli.This event can also be distinguished by thepresence of concentric white lines, whichare typically associated with the disruptionof circuli.
Annuli can also be observed bisecting theperpendicular plain of the radial striationsin the anterior field of the scale. Radii em-anate out from the focus of the scale to-wards the outer corner margins of the an-terior field. These radial striations consistmainly of segmented concave circuli. Thepoint of intersection between radii and an-nuli results in a "straightening out" of theconcave circuli. This straightening of thecirculi should be consistent throughout theentire anterior field of the scale. This eventis further amplified by the presence of con-cave circuli neighboring both directly aboveand below the annulus. The first year’sannulus can be difficult to locate on somescales. It is typically best identified in thelateral field of the anterior portion of thescale. The distance from the focus to thefirst year’s annulus is typically larger with
respect to the following annuli. For the an-nuli two through six, summer growth gen-erally decreases proportionally. For agesgreater than six, a crowding effect of theannuli near the outer margins of the scaleis observed. This crowding effect createsdifficulties in edge interpretation. At thispoint it is best to focus on the straighten-ing of the circuli at the anterior margins ofthe scale.
When ageing young striped bass, zerothrough age two, extreme caution must betaken as not to over age the structure. Inyoung fish there is no point of reference toaid in the determination of the first year;this invariably results in over examinationof the scale and such events as hatching orsaltwater incursion marks (checks) may beinterpreted as the first year.
Otoliths
All thin-sections were aged by two differentreaders using a Nikon SMZ1000 stereo mi-croscope under transmitted light and dark-field polarization at between 8 and 20 timesmagnification (Figure 11.2). Each readeraged all of the otolith samples. By conven-
Figure 11.2: Otolith thin-section of a 4 year-old striped bass with the last annulus on theedge of the thin-section
tion an annulus is identified as the narrowopaque zone, or winter growth. Typicallythe first year’s annulus can be determinedby first locating the focus of the otolith.The focus is generally located, dependingon preparation, in the center of the otolith,and is visually well defined as a dark oblongregion. The first year’s annulus can be lo-cated directly below the focus, along the
91

CHAPTER 11. STRIPED BASS MORONE SAXATILIS
outer ridge of the sulcal groove on the ven-tral and dorsal sides of the otolith. Thisinsertion point along the sulcal ridge re-sembles a check mark (not to be confusedwith a false annulus). Here the annulus canbe followed outwards along the ventral anddorsal surfaces where it encircles the focus.Subsequent annuli also emanate from thesulcal ridge; however, they do not encir-cle the focus, but rather travel outwards tothe distal surface of the otolith. To be con-sidered a true annulus, each annulus mustbe rooted in the sulcus and travel with-out interruption to the distal surface of theotolith. The annuli in striped bass have atendency to split as they advance towardsthe distal surface. As a result, it is criti-cal that reading path proceed in a directiondown the sulcal ridge and outwards to thedistal surface.
Click here to obtain the protocol at theCQFE website on how to age striped bassusing their otolith thin-sections.
11.2.5 Comparison Tests
A symmetry test (Hoenig et al. 1995) andcoefficient of variation (CV) analysis wereused to detect any systematic differenceand precision on age readings, respectively,for following comparisons: 1) between thetwo readers in the current year; 2) withineach reader in the current year; 3) time-series bias between the current and previ-ous years within each reader; and 4) be-tween scale and otoliths ages. The readingsfrom the entire sample for the current yearwere used to examine the difference be-tween two readers. A random sub-sampleof 50 fish from the current year was selectedfor second readings to examine the differ-ence within a reader. Fifty otoliths ran-domly selected from fish aged in 2000 wereused to examine the time-series bias withineach reader. A figure of 1:1 equivalence wasused to illustrate those differences (Cam-
pana et al. 1995). All statistics analyseswere performed in R 2.15.2 (R Core Team2012).
11.3 RESULTS
11.3.1 Sample size
We estimated a sample size of 550 baystriped bass in 2014, ranging in length in-terval from 17 to 52 inches (Table 11.1).This sample size provided a range in CVfor age composition approximately fromthe smallest CV of 11% for age 7 to thelargest CV of 23% for age 14 of the bay fish.We randomly selected and aged 563 fishfrom 769 striped bass collected by VMRCin Chesapeake Bay in 2014. We fell shortin our over-all collections for this optimallength-class sampling estimate by 59 fish.However, we were short of some fish fromthe major length intervals (The interval re-quires 10 or more fish), as a result, theprecision for the estimates of major agegroups would possibly be influenced signif-icantly.
We estimated a sample size of 548 oceanstriped bass in 2014, ranging in length in-terval from 26 to 56 inches (Table 11.2).This sample size provided a range in CV forage composition approximately from thesmallest CV of 10% for age 7, 8, and 9to the largest CV of 22% for age 6 of theocean fish. We aged all 293 striped basscollected by VMRC in Virginia waters ofthe Atlantic Ocean in 2014. We fell shortin our over-all collections for this optimallength-class sampling estimate by 268 fish.However, we were short of many fish fromin the major length intervals (The inter-val requires 10 or more fish), as a result,the precision for the estimates of major agegroups would definitely be influenced sig-nificantly. Therefore, precaution should beused when developing ALK using these agedata.
92

CHAPTER 11. STRIPED BASS MORONE SAXATILIS
11.3.2 Scales
Reader 1 had high self-precision and Read 2had moderate self-precision. Specifically,there was no significant difference betweenthe first and second readings for Reader1 with an agreement of 64% (1 year orless agreement of 86%) and a CV of 3.9%(test of symmetry: χ2 = 16, df = 13, P =0.2491), and there was no significant differ-ence between the first and second readingsfor Reader 2 with an agreement of 44% (1year or less agreement of 70%) and a CV of7.5% (test of symmetry: χ2 = 19.67, df =15, P = 0.1851). There was an evidence ofsystematic disagreement between Reader 1and Reader 2 with an agreement of 45% (1year or less agreement of 83%) and a CVof 6.1% (test of symmetry: χ2 = 239.86, df= 57, P < 0.0001) (Figure 11.3).
Figure 11.3: Between-reader comparison ofscale age estimates for striped bass collectedin Chesapeake Bay and Virginia waters of theAtlantic Ocean in 2014.
There was no time-series bias for both read-ers. Reader 1 had an agreement of 57% (1year or less agreement of 92%) with ages offish aged in 2000 with a CV of 5.3% (testof symmetry: χ2 = 15.67, df = 14, P =0.3342). Reader 2 had an agreement of 47%(1 year or less agreement of 87%) with aCV of 7.2% (test of symmetry: χ2 = 17.53,df = 15, P = 0.288).
Of the 563 bay striped bass aged with
scales, 21 age classes (2 to 21, 23) were rep-resented (Table 11.3). The average age forthe sample was 8.3 years. The standarddeviation and standard error were 4 and0.17, respectively. Year-class data (Figure11.4) indicates that recruitment into thefishery in Chesapeake Bay begins at age 2,which corresponds to the 2012 year-classfor striped bass caught in 2014. Stripedbass in the sample in 2014 was dominatedby the year classes of 2009 2008 2004 20102007 2005 and 2003 with 13% 12% 12% 9%9% 9% and 9%, respectively. The sex ra-tio of male to female was 1:1.59 for the bayfish.
Figure 11.4: Year-class frequency distributionfor striped bass collected in Chesapeake Bay,Virginia for ageing in 2014. Distribution isbroken down by sex and estimated using scaleages. ’Unknown’ represents the fish gonadsthat were not available for examination or werenot examined for sex during sampling.
Of the 293 ocean striped bass aged withscales, 16 age classes (6 to 21) were repre-sented (Table 11.4). The average age forthe sample was 11.2 years. The standarddeviation and standard error were 2.8 and0.16, respectively. Year-class data (Figure11.5) indicates that recruitment into thefishery in Virginia waters of Atlantic oceanbegins at age 6, which corresponds to the2008 year-class for striped bass caught in2014. Striped bass in the sample in 2014was dominated by the year class of 2004with 24%. The sex ratio of male to female
93

CHAPTER 11. STRIPED BASS MORONE SAXATILIS
was 1:3.33 for the ocean fish.
Figure 11.5: Year-class frequency distributionfor striped bass collected in Virginia waters ofthe Atlantic Ocean for ageing in 2014. Distri-bution is broken down by sex and estimatedusing scale ages. ’Unknown’ represents the fishgonads that were not available for examinationor were not examined for sex during sampling.
11.3.3 Otoliths
Both readers had high self-precision.Specifically, there was no significant differ-ence between the first and second readingsfor Reader 1 with an agreement of 83% anda CV of 0.8% (test of symmetry: χ2 =5.33, df = 5, P = 0.3766), and there wasno significant difference between the firstand second readings for Reader 2 with anagreement of 88% and a CV of 0.6% (testof symmetry: χ2 = 6, df = 5, P = 0.3062).There was no evidence of systematic dis-agreement between Reader 1 and Reader 2with an agreement of 87% (1 year or lessagreement of 99%) and a CV of 0.6% (testof symmetry: χ2 = 18.67, df = 16, P =0.2863) (Figure 11.6).
There was no time-series bias for both read-ers. Reader 1 had an agreement of 78%with ages of fish aged in 2003 with a CV of2% (test of symmetry: χ2 = 13, df = 10, P= 0.2237). Reader 2 had an agreement of67% with a CV of 3.4% (test of symmetry:
Figure 11.6: Between-reader comparison ofotolith age estimates for striped bass collectedin Chesapeake Bay and Virginia waters of theAtlantic Ocean in 2014.
χ2 = 20, df = 12, P = 0.0671).
Of the 235 striped bass aged with otoliths,23 age classes (2 to 22, 25, 31) were rep-resented (Table 11.5). The average age forthe sample was 10.4 years. The standarddeviation and standard error were 5.9 and0.38, respectively.
11.3.4 Comparison of scale andotolith ages
We aged 235 striped bass using scales andotoliths. There was an evidence of system-atic disagreement between otolith and scaleages (test of symmetry: χ2 = 92.63, df =54, P = 0.0008) with an average CV of6.8%. There was an agreement of 45% be-tween scale and otoliths ages whereas scaleswere assigned a lower and higher age thanotoliths for 41% and 14% of the fish, re-spectively (Figure 11.7). There was also anevidence of bias between otolith and scaleages using an age bias plot (Figure 11.8),with scale generally assigned higher agesfor younger fish and lower ages for olderfish than otolith age estimates.
94
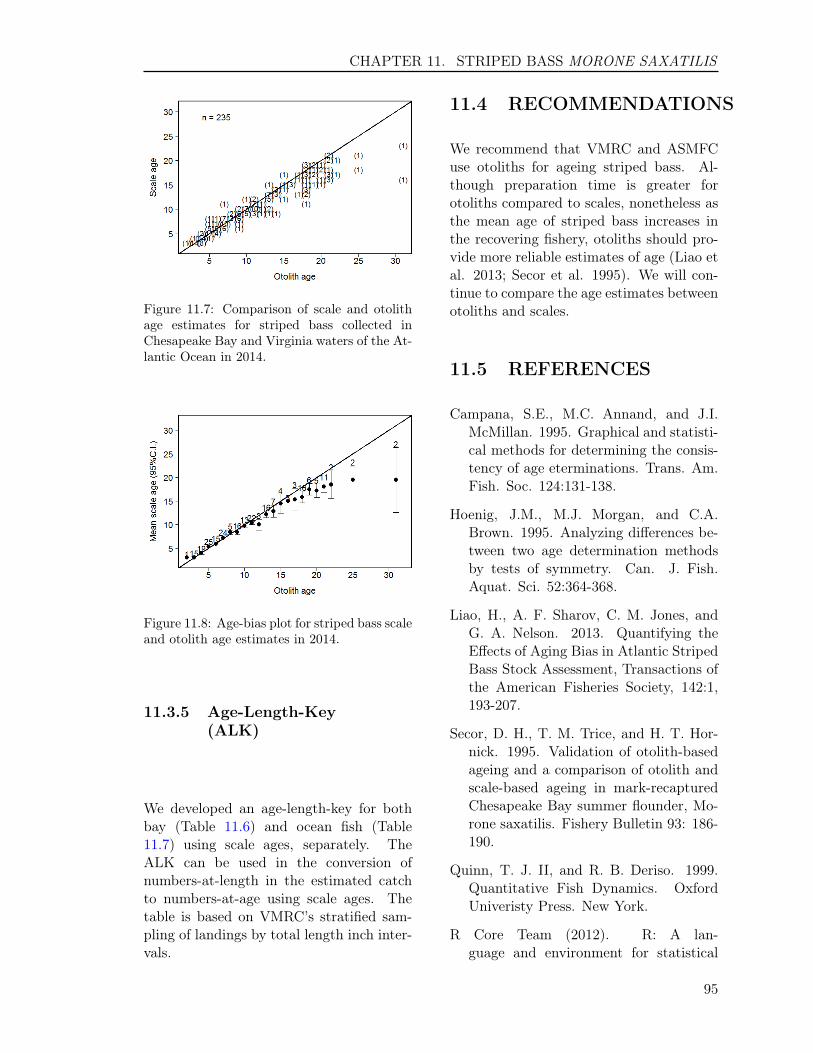
CHAPTER 11. STRIPED BASS MORONE SAXATILIS
Figure 11.7: Comparison of scale and otolithage estimates for striped bass collected inChesapeake Bay and Virginia waters of the At-lantic Ocean in 2014.
Figure 11.8: Age-bias plot for striped bass scaleand otolith age estimates in 2014.
11.3.5 Age-Length-Key(ALK)
We developed an age-length-key for bothbay (Table 11.6) and ocean fish (Table11.7) using scale ages, separately. TheALK can be used in the conversion ofnumbers-at-length in the estimated catchto numbers-at-age using scale ages. Thetable is based on VMRC’s stratified sam-pling of landings by total length inch inter-vals.
11.4 RECOMMENDATIONS
We recommend that VMRC and ASMFCuse otoliths for ageing striped bass. Al-though preparation time is greater forotoliths compared to scales, nonetheless asthe mean age of striped bass increases inthe recovering fishery, otoliths should pro-vide more reliable estimates of age (Liao etal. 2013; Secor et al. 1995). We will con-tinue to compare the age estimates betweenotoliths and scales.
11.5 REFERENCES
Campana, S.E., M.C. Annand, and J.I.McMillan. 1995. Graphical and statisti-cal methods for determining the consis-tency of age eterminations. Trans. Am.Fish. Soc. 124:131-138.
Hoenig, J.M., M.J. Morgan, and C.A.Brown. 1995. Analyzing differences be-tween two age determination methodsby tests of symmetry. Can. J. Fish.Aquat. Sci. 52:364-368.
Liao, H., A. F. Sharov, C. M. Jones, andG. A. Nelson. 2013. Quantifying theEffects of Aging Bias in Atlantic StripedBass Stock Assessment, Transactions ofthe American Fisheries Society, 142:1,193-207.
Secor, D. H., T. M. Trice, and H. T. Hor-nick. 1995. Validation of otolith-basedageing and a comparison of otolith andscale-based ageing in mark-recapturedChesapeake Bay summer flounder, Mo-rone saxatilis. Fishery Bulletin 93: 186-190.
Quinn, T. J. II, and R. B. Deriso. 1999.Quantitative Fish Dynamics. OxfordUniveristy Press. New York.
R Core Team (2012). R: A lan-guage and environment for statistical
95

CHAPTER 11. STRIPED BASS MORONE SAXATILIS
computing. R Foundation for Sta-tistical Computing, Vienna, Austria.ISBN 3-900051-07-0, URL http://www.R-project.org.
96

CHAPTER 11. STRIPED BASS MORONE SAXATILIS
Table 11.1: Number of bay striped bass collected and aged in each 1-inch length interval in 2014.’Target’ represents the sample size for ageing estimated for 2014, and ’Need’ represents number offish shorted in each length interval compared to the optimum sample size for ageing and number offish aged.
Interval Target Collected Aged Need17 - 17.99 5 2 2 318 - 18.99 9 16 10 019 - 19.99 21 32 23 020 - 20.99 20 42 26 021 - 21.99 26 49 32 022 - 22.99 26 48 33 023 - 23.99 28 51 35 024 - 24.99 30 54 32 025 - 25.99 26 53 27 026 - 26.99 25 42 27 027 - 27.99 20 31 23 028 - 28.99 18 28 19 029 - 29.99 14 26 18 030 - 30.99 13 19 16 031 - 31.99 15 21 18 032 - 32.99 18 28 18 033 - 33.99 19 21 20 034 - 34.99 23 23 23 035 - 35.99 26 18 18 836 - 36.99 34 30 30 437 - 37.99 31 30 30 138 - 38.99 16 11 11 539 - 39.99 11 6 6 540 - 40.99 11 3 3 841 - 41.99 7 7 7 042 - 42.99 7 13 9 043 - 43.99 6 12 8 044 - 44.99 5 21 13 045 - 45.99 5 17 11 046 - 46.99 5 10 10 047 - 47.99 5 3 3 248 - 48.99 5 1 1 449 - 49.99 5 0 0 550 - 50.99 5 0 0 551 - 51.99 5 1 1 452 - 52.99 5 0 0 5
Totals 550 769 563 59(Go back to text)
97

CHAPTER 11. STRIPED BASS MORONE SAXATILIS
Table 11.2: Number of ocean striped bass collected and aged in each 1-inch length interval in 2014.’Target’ represents the sample size for ageing estimated for 2014, and ’Need’ represents number offish shorted in each length interval compared to the optimum sample size for ageing and number offish aged.
Interval Target Collected Aged Need26 - 26.99 5 0 0 527 - 27.99 5 0 0 528 - 28.99 20 2 2 1829 - 29.99 37 5 5 3230 - 30.99 38 13 13 2531 - 31.99 38 7 7 3132 - 32.99 35 15 15 2033 - 33.99 37 29 29 834 - 34.99 40 29 29 1135 - 35.99 50 33 33 1736 - 36.99 48 32 32 1637 - 37.99 54 33 33 2138 - 38.99 33 22 22 1139 - 39.99 22 14 14 840 - 40.99 16 10 10 641 - 41.99 7 14 14 042 - 42.99 8 5 5 343 - 43.99 5 8 8 044 - 44.99 5 8 8 045 - 45.99 5 5 5 046 - 46.99 5 2 2 347 - 47.99 5 3 3 248 - 48.99 5 2 2 349 - 49.99 5 1 1 450 - 50.99 5 1 1 451 - 51.99 5 0 0 552 - 52.99 5 0 0 556 - 56.99 5 0 0 5
Totals 548 293 293 268(Go back to text)
98
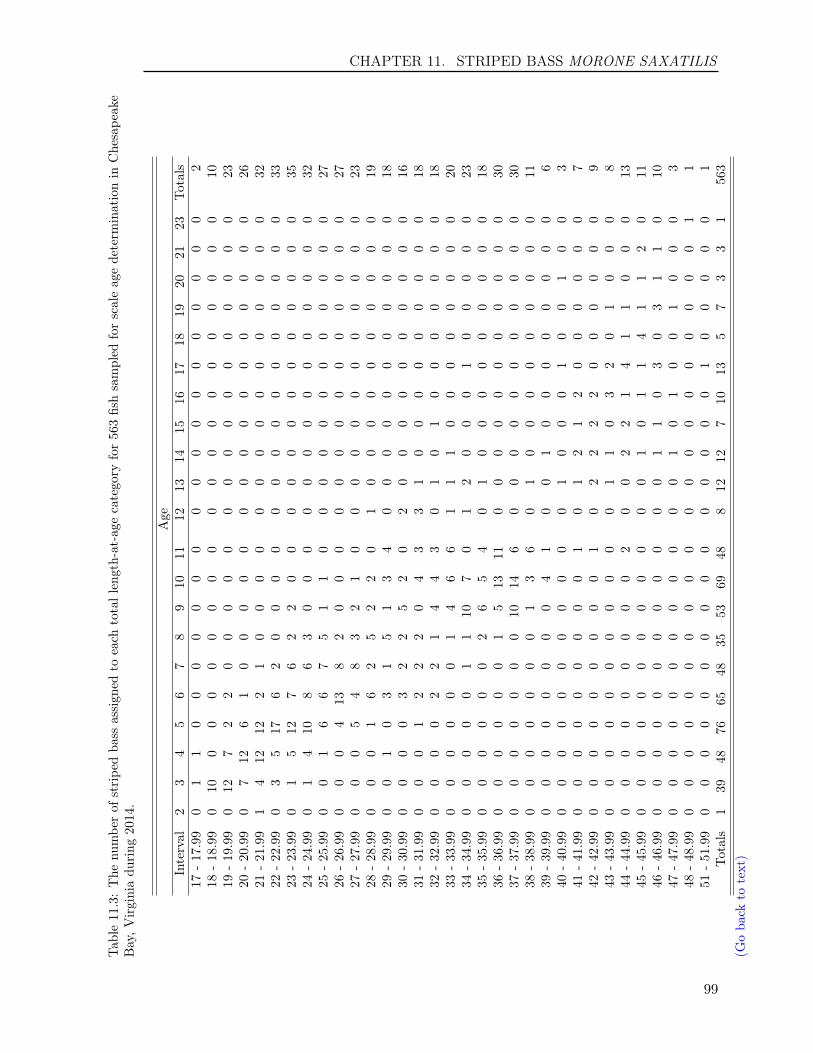
CHAPTER 11. STRIPED BASS MORONE SAXATILIS
Tab
le11
.3:The
numbe
rof
stripe
dba
ssassign
edto
each
totallength-at-age
category
for563fishsampled
forscaleag
edeterm
inationin
Chesape
ake
Bay,V
irginiadu
ring
2014.
Age
Interval
23
45
67
89
1011
1213
1415
1617
1819
2021
23Totals
17-17.99
01
10
00
00
00
00
00
00
00
00
02
18-18.99
010
00
00
00
00
00
00
00
00
00
010
19-19.99
012
72
20
00
00
00
00
00
00
00
023
20-20.99
07
126
10
00
00
00
00
00
00
00
026
21-21.99
14
1212
21
00
00
00
00
00
00
00
032
22-22.99
03
517
62
00
00
00
00
00
00
00
033
23-23.99
01
512
76
22
00
00
00
00
00
00
035
24-24.99
01
410
86
30
00
00
00
00
00
00
032
25-25.99
00
16
67
51
10
00
00
00
00
00
027
26-26.99
00
04
138
20
00
00
00
00
00
00
027
27-27.99
00
05
48
32
10
00
00
00
00
00
023
28-28.99
00
01
62
52
20
10
00
00
00
00
019
29-29.99
00
10
31
51
34
00
00
00
00
00
018
30-30.99
00
00
32
25
20
20
00
00
00
00
016
31-31.99
00
01
22
20
43
31
00
00
00
00
018
32-32.99
00
00
22
14
43
01
01
00
00
00
018
33-33.99
00
00
00
14
66
11
10
00
00
00
020
34-34.99
00
00
01
110
70
12
00
01
00
00
023
35-35.99
00
00
00
26
54
01
00
00
00
00
018
36-36.99
00
00
00
15
1311
00
00
00
00
00
030
37-37.99
00
00
00
010
146
00
00
00
00
00
030
38-38.99
00
00
00
01
36
01
00
00
00
00
011
39-39.99
00
00
00
00
41
00
10
00
00
00
06
40-40.99
00
00
00
00
00
01
00
01
00
10
03
41-41.99
00
00
00
00
01
01
21
20
00
00
07
42-42.99
00
00
00
00
01
02
22
20
00
00
09
43-43.99
00
00
00
00
00
01
10
32
01
00
08
44-44.99
00
00
00
00
02
00
22
14
11
00
013
45-45.99
00
00
00
00
00
00
10
11
41
12
011
46-46.99
00
00
00
00
00
00
11
03
03
11
010
47-47.99
00
00
00
00
00
00
10
10
01
00
03
48-48.99
00
00
00
00
00
00
00
00
00
00
11
51-51.99
00
00
00
00
00
00
00
01
00
00
01
Totals
139
4876
6548
3553
6948
812
127
1013
57
33
156
3(G
oba
ckto
text)
99
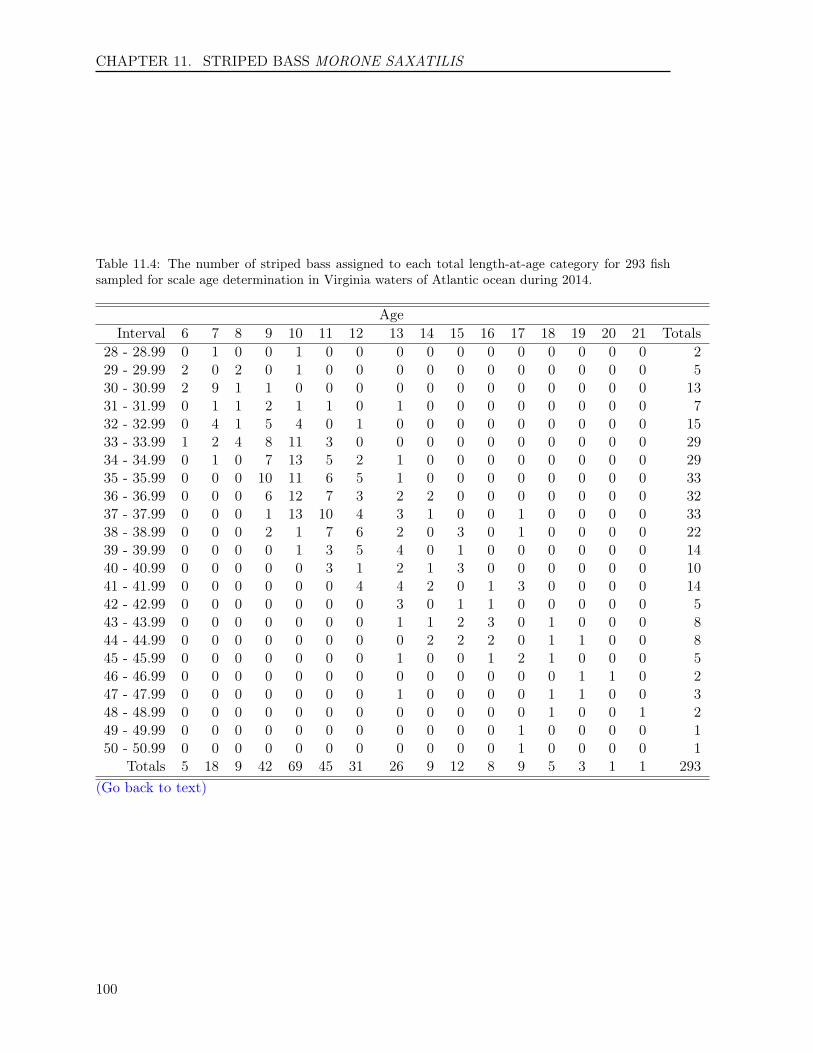
CHAPTER 11. STRIPED BASS MORONE SAXATILIS
Table 11.4: The number of striped bass assigned to each total length-at-age category for 293 fishsampled for scale age determination in Virginia waters of Atlantic ocean during 2014.
AgeInterval 6 7 8 9 10 11 12 13 14 15 16 17 18 19 20 21 Totals
28 - 28.99 0 1 0 0 1 0 0 0 0 0 0 0 0 0 0 0 229 - 29.99 2 0 2 0 1 0 0 0 0 0 0 0 0 0 0 0 530 - 30.99 2 9 1 1 0 0 0 0 0 0 0 0 0 0 0 0 1331 - 31.99 0 1 1 2 1 1 0 1 0 0 0 0 0 0 0 0 732 - 32.99 0 4 1 5 4 0 1 0 0 0 0 0 0 0 0 0 1533 - 33.99 1 2 4 8 11 3 0 0 0 0 0 0 0 0 0 0 2934 - 34.99 0 1 0 7 13 5 2 1 0 0 0 0 0 0 0 0 2935 - 35.99 0 0 0 10 11 6 5 1 0 0 0 0 0 0 0 0 3336 - 36.99 0 0 0 6 12 7 3 2 2 0 0 0 0 0 0 0 3237 - 37.99 0 0 0 1 13 10 4 3 1 0 0 1 0 0 0 0 3338 - 38.99 0 0 0 2 1 7 6 2 0 3 0 1 0 0 0 0 2239 - 39.99 0 0 0 0 1 3 5 4 0 1 0 0 0 0 0 0 1440 - 40.99 0 0 0 0 0 3 1 2 1 3 0 0 0 0 0 0 1041 - 41.99 0 0 0 0 0 0 4 4 2 0 1 3 0 0 0 0 1442 - 42.99 0 0 0 0 0 0 0 3 0 1 1 0 0 0 0 0 543 - 43.99 0 0 0 0 0 0 0 1 1 2 3 0 1 0 0 0 844 - 44.99 0 0 0 0 0 0 0 0 2 2 2 0 1 1 0 0 845 - 45.99 0 0 0 0 0 0 0 1 0 0 1 2 1 0 0 0 546 - 46.99 0 0 0 0 0 0 0 0 0 0 0 0 0 1 1 0 247 - 47.99 0 0 0 0 0 0 0 1 0 0 0 0 1 1 0 0 348 - 48.99 0 0 0 0 0 0 0 0 0 0 0 0 1 0 0 1 249 - 49.99 0 0 0 0 0 0 0 0 0 0 0 1 0 0 0 0 150 - 50.99 0 0 0 0 0 0 0 0 0 0 0 1 0 0 0 0 1
Totals 5 18 9 42 69 45 31 26 9 12 8 9 5 3 1 1 293(Go back to text)
100
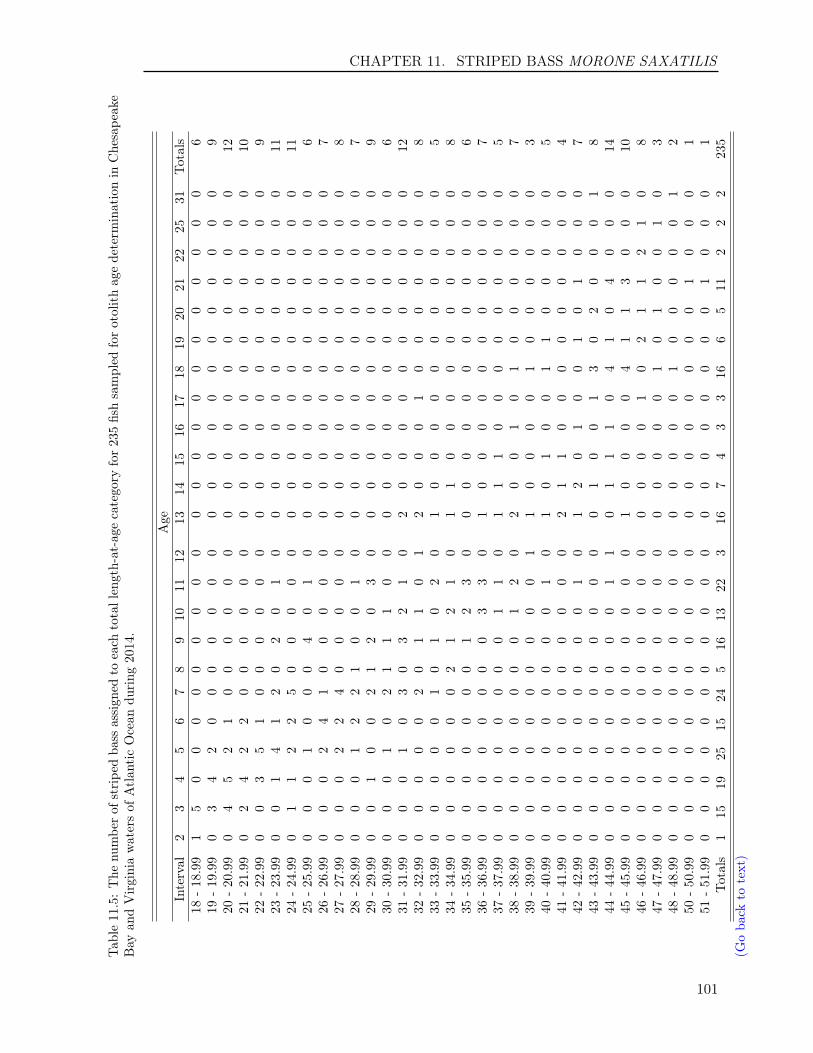
CHAPTER 11. STRIPED BASS MORONE SAXATILIS
Tab
le11
.5:The
numbe
rof
stripe
dba
ssassign
edto
each
totallength-at-age
category
for235fishsampled
forotolithag
edeterm
inationin
Chesape
ake
Bay
andVirginiawatersof
Atlan
ticOcean
during
2014.
Age
Interval
23
45
67
89
1011
1213
1415
1617
1819
2021
2225
31Totals
18-18
.99
15
00
00
00
00
00
00
00
00
00
00
06
19-19.99
03
42
00
00
00
00
00
00
00
00
00
09
20-20.99
04
52
10
00
00
00
00
00
00
00
00
012
21-21.99
02
42
20
00
00
00
00
00
00
00
00
010
22-22.99
00
35
10
00
00
00
00
00
00
00
00
09
23-23.99
00
14
12
02
01
00
00
00
00
00
00
011
24-24.99
01
12
25
00
00
00
00
00
00
00
00
011
25-25.99
00
01
00
04
01
00
00
00
00
00
00
06
26-26.99
00
02
41
00
00
00
00
00
00
00
00
07
27-27.99
00
02
24
00
00
00
00
00
00
00
00
08
28-28.99
00
01
22
10
01
00
00
00
00
00
00
07
29-29.99
00
10
02
12
03
00
00
00
00
00
00
09
30-30.99
00
01
02
11
10
00
00
00
00
00
00
06
31-31.99
00
01
03
03
21
02
00
00
00
00
00
012
32-32.99
00
00
02
01
10
12
00
01
00
00
00
08
33-33.99
00
00
01
01
02
01
00
00
00
00
00
05
34-34.99
00
00
00
21
21
01
10
00
00
00
00
08
35-35.99
00
00
00
01
23
00
00
00
00
00
00
06
36-36.99
00
00
00
00
33
01
00
00
00
00
00
07
37-37.99
00
00
00
00
11
01
11
00
00
00
00
05
38-38.99
00
00
00
00
12
02
00
10
10
00
00
07
39-39.99
00
00
00
00
00
11
00
00
10
00
00
03
40-40.99
00
00
00
00
01
01
01
00
11
00
00
05
41-41.99
00
00
00
00
00
02
11
00
00
00
00
04
42-42.99
00
00
00
00
01
01
20
10
01
01
00
07
43-43.99
00
00
00
00
00
00
10
01
30
20
00
18
44-44.99
00
00
00
00
01
10
11
10
41
04
00
014
45-45.99
00
00
00
00
00
01
00
00
41
13
00
010
46-46.99
00
00
00
00
00
00
00
01
02
11
21
08
47-47.99
00
00
00
00
00
00
00
00
10
10
01
03
48-48.99
00
00
00
00
00
00
00
00
10
00
00
12
50-50.99
00
00
00
00
00
00
00
00
00
01
00
01
51-51.99
00
00
00
00
00
00
00
00
00
01
00
01
Totals
115
1925
1524
516
1322
316
74
33
166
511
22
223
5(G
oba
ckto
text)
101
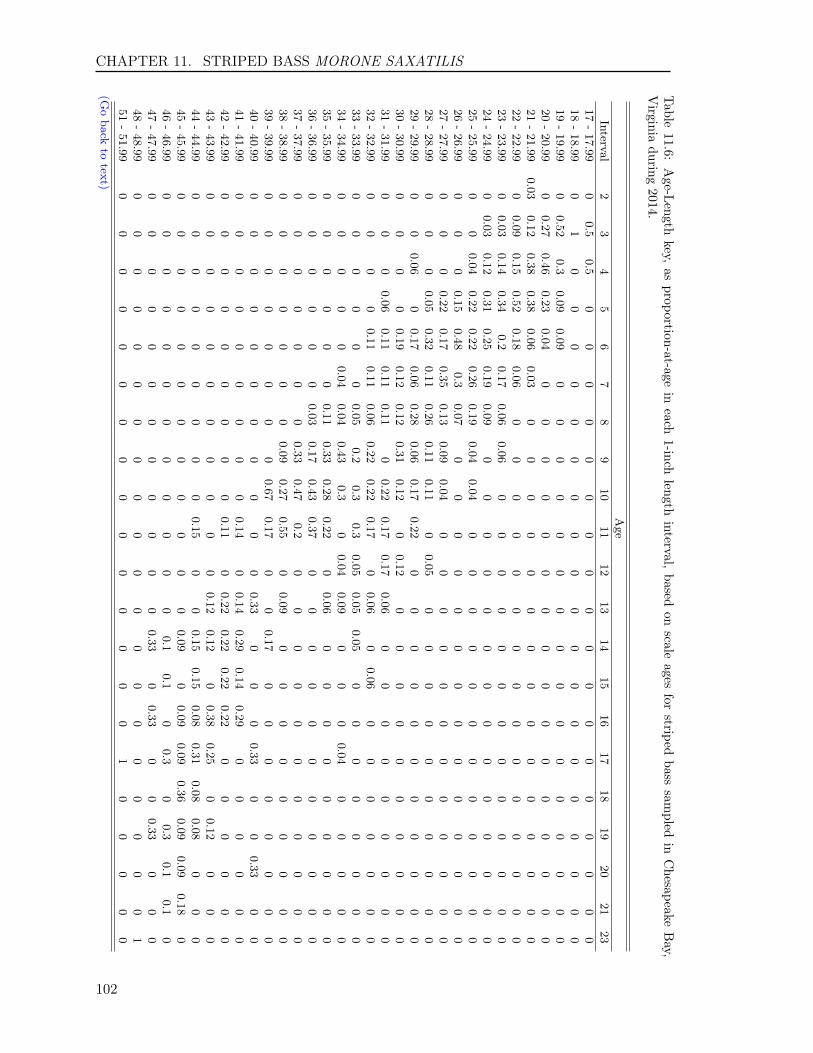
CHAPTER 11. STRIPED BASS MORONE SAXATILIS
Table
11.6:Age-Length
key,as
proportion-at-agein
each1-inch
lengthinterval,
basedon
scaleages
forstriped
basssam
pledin
Chesapeake
Bay,
Virginia
during2014.
Age
Interval2
34
56
78
910
1112
1314
1516
1718
1920
2123
17-
17.990
0.50.5
00
00
00
00
00
00
00
00
00
18-
18.990
10
00
00
00
00
00
00
00
00
00
19-
19.990
0.520.3
0.090.09
00
00
00
00
00
00
00
00
20-
20.990
0.270.46
0.230.04
00
00
00
00
00
00
00
00
21-
21.990.03
0.120.38
0.380.06
0.030
00
00
00
00
00
00
00
22-
22.990
0.090.15
0.520.18
0.060
00
00
00
00
00
00
00
23-
23.990
0.030.14
0.340.2
0.170.06
0.060
00
00
00
00
00
00
24-
24.990
0.030.12
0.310.25
0.190.09
00
00
00
00
00
00
00
25-
25.990
00.04
0.220.22
0.260.19
0.040.04
00
00
00
00
00
00
26-
26.990
00
0.150.48
0.30.07
00
00
00
00
00
00
00
27-
27.990
00
0.220.17
0.350.13
0.090.04
00
00
00
00
00
00
28-
28.990
00
0.050.32
0.110.26
0.110.11
00.05
00
00
00
00
00
29-
29.990
00.06
00.17
0.060.28
0.060.17
0.220
00
00
00
00
00
30-
30.990
00
00.19
0.120.12
0.310.12
00.12
00
00
00
00
00
31-
31.990
00
0.060.11
0.110.11
00.22
0.170.17
0.060
00
00
00
00
32-
32.990
00
00.11
0.110.06
0.220.22
0.170
0.060
0.060
00
00
00
33-
33.990
00
00
00.05
0.20.3
0.30.05
0.050.05
00
00
00
00
34-
34.990
00
00
0.040.04
0.430.3
00.04
0.090
00
0.040
00
00
35-
35.990
00
00
00.11
0.330.28
0.220
0.060
00
00
00
00
36-
36.990
00
00
00.03
0.170.43
0.370
00
00
00
00
00
37-
37.990
00
00
00
0.330.47
0.20
00
00
00
00
00
38-
38.990
00
00
00
0.090.27
0.550
0.090
00
00
00
00
39-
39.990
00
00
00
00.67
0.170
00.17
00
00
00
00
40-
40.990
00
00
00
00
00
0.330
00
0.330
00.33
00
41-
41.990
00
00
00
00
0.140
0.140.29
0.140.29
00
00
00
42-
42.990
00
00
00
00
0.110
0.220.22
0.220.22
00
00
00
43-
43.990
00
00
00
00
00
0.120.12
00.38
0.250
0.120
00
44-
44.990
00
00
00
00
0.150
00.15
0.150.08
0.310.08
0.080
00
45-
45.990
00
00
00
00
00
00.09
00.09
0.090.36
0.090.09
0.180
46-
46.990
00
00
00
00
00
00.1
0.10
0.30
0.30.1
0.10
47-
47.990
00
00
00
00
00
00.33
00.33
00
0.330
00
48-
48.990
00
00
00
00
00
00
00
00
00
01
51-
51.990
00
00
00
00
00
00
00
10
00
00
(Go
backto
text)
102
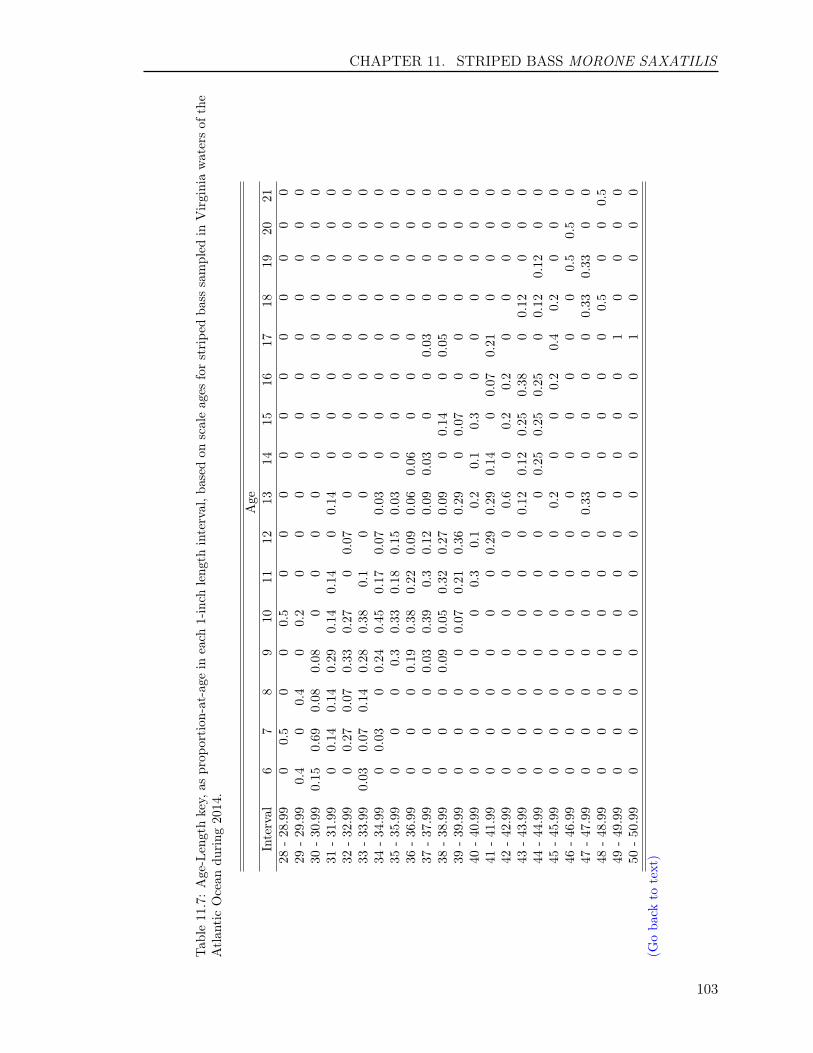
CHAPTER 11. STRIPED BASS MORONE SAXATILIS
Tab
le11
.7:Age-Lengthkey,
asprop
ortion
-at-agein
each
1-inch
leng
thinterval,b
ased
onscaleages
forstripe
dba
sssampled
inVirginiawatersof
the
Atlan
ticOcean
during
2014.
Age
Interval
67
89
1011
1213
1415
1617
1819
2021
28-28.99
00.5
00
0.5
00
00
00
00
00
029
-29.99
0.4
00.4
00.2
00
00
00
00
00
030
-30.99
0.15
0.69
0.08
0.08
00
00
00
00
00
00
31-31.99
00.14
0.14
0.29
0.14
0.14
00.14
00
00
00
00
32-32.99
00.27
0.07
0.33
0.27
00.07
00
00
00
00
033
-33.99
0.03
0.07
0.14
0.28
0.38
0.1
00
00
00
00
00
34-34.99
00.03
00.24
0.45
0.17
0.07
0.03
00
00
00
00
35-35.99
00
00.3
0.33
0.18
0.15
0.03
00
00
00
00
36-36.99
00
00.19
0.38
0.22
0.09
0.06
0.06
00
00
00
037
-37.99
00
00.03
0.39
0.3
0.12
0.09
0.03
00
0.03
00
00
38-38.99
00
00.09
0.05
0.32
0.27
0.09
00.14
00.05
00
00
39-39.99
00
00
0.07
0.21
0.36
0.29
00.07
00
00
00
40-40.99
00
00
00.3
0.1
0.2
0.1
0.3
00
00
00
41-41.99
00
00
00
0.29
0.29
0.14
00.07
0.21
00
00
42-42.99
00
00
00
00.6
00.2
0.2
00
00
043
-43.99
00
00
00
00.12
0.12
0.25
0.38
00.12
00
044
-44.99
00
00
00
00
0.25
0.25
0.25
00.12
0.12
00
45-45.99
00
00
00
00.2
00
0.2
0.4
0.2
00
046
-46.99
00
00
00
00
00
00
00.5
0.5
047
-47.99
00
00
00
00.33
00
00
0.33
0.33
00
48-48.99
00
00
00
00
00
00
0.5
00
0.5
49-49.99
00
00
00
00
00
01
00
00
50-50.99
00
00
00
00
00
01
00
00
(Goba
ckto
text)
103


Chapter 12
SUMMER FLOUNDER Paralichthysdentatus
CHAPTER 12. SUMMER FLOUNDER PARALICHTHYS DENTATUS
12.1 INTRODUCTION
We aged a total of 819 summer floun-der,Paralichthys dentatus, using theirscales collected by the VMRC’s BiologicalSampling Program in 2014. Of 819 agedfish, 371 and 448 fish were collected inChesapeake Bay (bay fish) and Virginiawaters of the Atlantic Ocean (ocean fish),respectively. The average bay fish age was3.5 years with a standard deviation of 1.6and a standard error of 0.08. Nine ageclasses (0 to 8) were represented in the bayfish, comprising fish from the 2006 to 2014year classes. The bay fish sample in 2014was dominated by the year classes of 2012and 2011 with 30% and 29%, respectively.The average ocean fish age was 4.9 yearswith a standard deviation of 2.1 and astandard error of 0.1. Fourteen age classes(1 to 14) were represented in the oceanfish, comprising fish from the 2000 to 2013year classes. The ocean fish sample in 2014was dominated by the year classes of 2009and 2010 with 24% and 23%, respectively.We also aged a total of 230 fish usingtheir otoliths in addition to ageing theirscales. The otolith ages were compared tothe scale ages to examine how close bothages were to one another (see details inResults).
12.2 METHODS
12.2.1 Sample size for ageing
We estimated sample sizes for ageing sum-mer flounder collected in both ChesapeakeBay and Virginia waters of the AtlanticOcean in 2014, respectively, using a two-stage random sampling method (Quinn andDeriso 1999) to increase precision in esti-mates of age composition from fish sampledefficiently and effectively. The basic equa-
tion is:
A =Va
θ2aCV2 +Ba/L
(12.1)
where A is the sample size for ageing sum-mer flounder in 2014; θa stands for the pro-portion of age a fish in a catch. Va and Barepresent variance components within andbetween length intervals for age a, respec-tively; CV is the coefficient of variation; Lwas the total number of summer flounderused by VMRC to estimate length distri-bution of the catches from 2008 to 2012.θa, Va, Ba, and CV were calculated usingpooled age-length data of summer floun-der collected from 2008 to 2012 and us-ing equations in Quinn and Deriso (1999).For simplicity, the equations are not listedhere. The equation (12.1) indicates thatthe more fish that are aged, the smallerthe CV (or higher precision) that will beobtained. Therefore, the criterion to ageA (number) of fish is that A should be anumber above which there is only a 1% CVreduction for the most major age in catchby aging an additional 100 or more fish. Fi-nally, Al is A multiplied by the proportionof length interval l from the length distribu-tion of the 2008 to 2012 catch. Al is num-ber of fish to be aged for length interval lin 2014.
12.2.2 Handling of collection
Sagittal otoliths (hereafter, referred to as"otoliths") and scales were received bythe Age & Growth Laboratory in labeledcoin envelopes, and were sorted based ondate of capture, their envelope labels wereverified against VMRC’s collection data,and each fish assigned a unique Age andGrowth Laboratory identification number.All otoliths and scales were stored drywithin their original labeled coin envelopes;otoliths were contained inside protectiveAxygen 2.0 ml microtubes.
106
CHAPTER 12. SUMMER FLOUNDER PARALICHTHYS DENTATUS
12.2.3 Preparation
Scales
Summer flounder scales were prepared forage and growth analysis by making ac-etate impressions of the scale microstruc-ture. Due to extreme variation in the sizeand shape of scales from individual fish,we selected only those scales that had evenmargins and which were of uniform size.We selected a range of four to six pre-ferred scales (based on overall scale size)from each fish, making sure that only non-regenerated scales were used. Scale im-pressions were made on extruded clear ac-etate sheets (25 mm x 75 mm) with aCarver Laboratory Heated Press (model"C"). The scales were pressed with the fol-lowing settings:
Pressure: 15000 psiTemperature: 77 ◦C (170 ◦F)Time: 5 to 10 min
summer flounder scales that were the sizeof a quarter (coin) or larger, were pressedindividually for up to twenty minutes. Af-ter pressing, the impressions were viewedwith a Bell and Howell microfiche readerand checked again for regeneration and in-complete margins. Impressions that weretoo light, or when all scales were regener-ated a new impression was made using dif-ferent scales from the same fish.
Click here to obtain the protocol at theCQFE website on how to prepare scale im-pression for ageing summer flounder.
Otoliths
We used our thin-section and bake tech-nique to process spadefish sagittal otoliths(hereafter, referred to as "otoliths") for agedetermination. Otolith preparation beganby randomly selecting either the right orleft otolith. Each whole otolith was placed
in a ceramic "Coors" spot plate well andbaked in a Thermolyne 1400 furnace at400 ◦C. Baking time was dependent on theotolith’s size and gauged by color, with alight caramel color desired. Once a suit-able color was achieved the baked otolithwas embedded in epoxy resin with its dis-tal surface orientated downwards and al-lowed to harden overnight. The otolithswere viewed by eye and, when necessary,under a stereo microscope to identify thelocation of the core, and the position of thecore was marked using a permanent markeracross the epoxy resin surface. At leastone transverse cross-section (hereafter, re-ferred to as "thin-section") was then re-moved from the marked core of each otolithusing a Buehler IsoMetTM low-speed sawequipped with two, 3-inch diameter, Nor-ton diamond grinding wheels (hereafter, re-ferred to as "blades"), separated by a stain-less steel spacer of 0.5 mm (diameter 2.5").The otolith was positioned so the bladesstraddled each side of the otolith focus. Itwas crucial that this cut be perpendicu-lar to the long axis of the otolith. Failureto do so resulted in broadening and dis-torted winter growth zones. A proper cutresulted in annuli that were clearly definedand delineated. Once cut, thin-sectionswere placed on labeled glass slides and cov-ered with a thin layer of Flo-texx mountingmedium that not only fixed the sections tothe slide, but more importantly, providedenhanced contrast and greater readabilityby increasing light transmission throughthe thin-section.
Click here to obtain the protocol atthe CQFE website on how to prepareotolith thin-section for ageing summerflounder.
12.2.4 Readings
The CQFE system assigns an age class toa fish based on a combination of reading
107

CHAPTER 12. SUMMER FLOUNDER PARALICHTHYS DENTATUS
the information contained in its otolith, thedate of its capture, and the species-specificperiod when it deposits its annulus. Eachyear, as the fish grows, its otoliths grow andleave behind markers of their age, calledannuli. Technically, an otolith annulus isthe combination of both the opaque andthe translucent bands. In practice, only theopaque bands are counted as annuli. Thenumber of these visible dark bands replaces"x" in our notation below, and is the initial"age" assignment of the fish.
Second, the otolith section is examinedfor translucent growth. If no translucentgrowth is visible beyond the last dark an-nulus, the otolith is called "even" and nomodification of the assigned age is made.The initial assigned age, then, is the ageclass of the fish. Any growth beyond thelast annulus can be interpreted as eitherbeing toward the next age class or withinthe same age class. If translucent growthis visible beyond the last dark annulus, a"+" is added to the notation.
By convention all fish in the NorthernHemisphere are assigned a birth date ofJanuary 1. In addition, each species has aspecific period during which it deposits thedark band of the annulus. If the fish is cap-tured after the end of the species-specificannulus deposition period and before Jan-uary 1, it is assigned an age class notationof "x+x", where "x" is the number of darkbands in the otolith. If the fish is cap-tured between January 1 and the end ofthe species-specific annulus deposition pe-riod, it is assigned an age class notationof "x+(x+1)". Thus, any growth beyondthe last annulus, after its "birthday", butbefore the dark band deposition period, isinterpreted as being toward the next ageclass.
For example, summer flounder otolith de-position occurs between January and April(Bolz et al. 2000). A summer floundercaptured between January 1 and April 30,
before the end of the species’ annulus for-mation period, with three visible annuliand some translucent growth after the lastannulus, would be assigned an age classof "x+(x+1)" or 3+(3+1), noted as 3+4.This is the same age-class assigned to afish with four visible annuli captured af-ter the end of June 30, the period of an-nulus formation, which would be noted as4+4.
Summer flounder scales are also consid-ered to have a deposition between Januaryand June (Bolz et al. 1999 and modifiedby CQFE), and age class assignment usingthese hard-parts is conducted in the sameway as otoliths.
All summer flounder samples (scale press-ings and sectioned otoliths) were aged bytwo different readers in chronological orderbased on collection date, without knowl-edge of previously estimated ages or thespecimen lengths. When the readers’ agesagreed, that age was assigned to the fish.When the two readers disagreed, both read-ers sat down together and re-aged the fishagain without any knowledge of previouslyestimated ages or lengths, then assigned afinal age to the fish. When the age readerswere unable to agree on a final age, the fishwas excluded from further analysis.
Scales
We determined fish age by viewing acetateimpressions of scales (Figure 12.1) with astandard Bell and Howell R-735 microfichereader equipped with 20 and 29 mm lenses.Annuli on summer flounder scales are iden-tified based on two scale microstructurefeatures, "crossing over" and circuli dis-ruption. Primarily, "crossing over" in thelateral margins near the posterior/ante-rior interface of the scale is used to deter-mine the origin of the annulus. Here com-pressed circuli (annulus) "cross-over" thepreviously deposited circuli of the previous
108
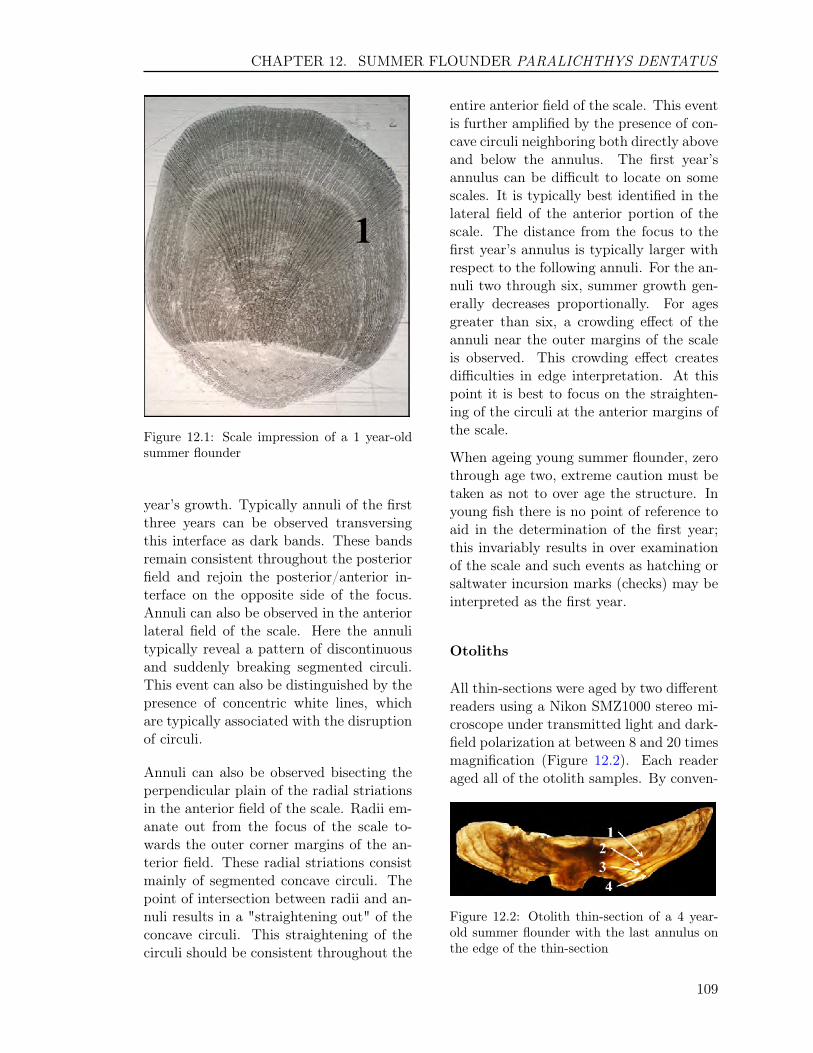
CHAPTER 12. SUMMER FLOUNDER PARALICHTHYS DENTATUS
Figure 12.1: Scale impression of a 1 year-oldsummer flounder
year’s growth. Typically annuli of the firstthree years can be observed transversingthis interface as dark bands. These bandsremain consistent throughout the posteriorfield and rejoin the posterior/anterior in-terface on the opposite side of the focus.Annuli can also be observed in the anteriorlateral field of the scale. Here the annulitypically reveal a pattern of discontinuousand suddenly breaking segmented circuli.This event can also be distinguished by thepresence of concentric white lines, whichare typically associated with the disruptionof circuli.
Annuli can also be observed bisecting theperpendicular plain of the radial striationsin the anterior field of the scale. Radii em-anate out from the focus of the scale to-wards the outer corner margins of the an-terior field. These radial striations consistmainly of segmented concave circuli. Thepoint of intersection between radii and an-nuli results in a "straightening out" of theconcave circuli. This straightening of thecirculi should be consistent throughout the
entire anterior field of the scale. This eventis further amplified by the presence of con-cave circuli neighboring both directly aboveand below the annulus. The first year’sannulus can be difficult to locate on somescales. It is typically best identified in thelateral field of the anterior portion of thescale. The distance from the focus to thefirst year’s annulus is typically larger withrespect to the following annuli. For the an-nuli two through six, summer growth gen-erally decreases proportionally. For agesgreater than six, a crowding effect of theannuli near the outer margins of the scaleis observed. This crowding effect createsdifficulties in edge interpretation. At thispoint it is best to focus on the straighten-ing of the circuli at the anterior margins ofthe scale.
When ageing young summer flounder, zerothrough age two, extreme caution must betaken as not to over age the structure. Inyoung fish there is no point of reference toaid in the determination of the first year;this invariably results in over examinationof the scale and such events as hatching orsaltwater incursion marks (checks) may beinterpreted as the first year.
Otoliths
All thin-sections were aged by two differentreaders using a Nikon SMZ1000 stereo mi-croscope under transmitted light and dark-field polarization at between 8 and 20 timesmagnification (Figure 12.2). Each readeraged all of the otolith samples. By conven-
Figure 12.2: Otolith thin-section of a 4 year-old summer flounder with the last annulus onthe edge of the thin-section
109

CHAPTER 12. SUMMER FLOUNDER PARALICHTHYS DENTATUS
tion an annulus is identified as the narrowopaque zone, or winter growth. Typicallythe first year’s annulus can be determinedby first locating the focus of the otolith.The focus is generally located, dependingon preparation, in the center of the otolith,and is visually well defined as a dark oblongregion. The first year’s annulus can be lo-cated directly below the focus, along theouter ridge of the sulcal groove on the ven-tral and dorsal sides of the otolith. Thisinsertion point along the sulcal ridge re-sembles a check mark (not to be confusedwith a false annulus). Here the annulus canbe followed outwards along the ventral anddorsal surfaces where it encircles the focus.Subsequent annuli also emanate from thesulcal ridge; however, they do not encir-cle the focus, but rather travel outwardsto the distal surface of the otolith. Tobe considered a true annulus, each annu-lus must be rooted in the sulcus and travelwithout interruption to the distal surface ofthe otolith. The annuli in summer flounderhave a tendency to split as they advance to-wards the distal surface. As a result, it iscritical that reading path proceed in a di-rection down the sulcal ridge and outwardsto the distal surface.
Click here to obtain the protocol atthe CQFE website on how to age sum-mer flounder using their otolith thin-sections.
12.2.5 Comparison Tests
A symmetry test (Hoenig et al. 1995) andcoefficient of variation (CV) analysis wereused to detect any systematic differenceand precision on age readings, respectively,for following comparisons: 1) between thetwo readers in the current year; 2) withineach reader in the current year; 3) time-series bias between the current and previ-ous years within each reader; and 4) be-tween scale and otoliths ages. The readings
from the entire sample for the current yearwere used to examine the difference be-tween two readers. A random sub-sampleof 50 fish from the current year was selectedfor second readings to examine the differ-ence within a reader. Fifty otoliths ran-domly selected from fish aged in 2000 wereused to examine the time-series bias withineach reader. A figure of 1:1 equivalence wasused to illustrate those differences (Cam-pana et al. 1995). All statistics analyseswere performed in R 2.15.2 (R Core Team2012).
12.3 RESULTS
12.3.1 Sample size
We estimated a sample size of 383 bay sum-mer flounder in 2014, ranging in length in-terval from 8 to 28 inches (Table 12.1).This sample size provided a range in CV forage composition approximately from thesmallest CV of 6% for age 2 to the largestCV of 22% for age 6 of the bay fish. Werandomly selected and aged 371 fish from455 summer flounder collected by VMRCin Chesapeake Bay in 2014. We fell shortin our over-all collections for this optimallength-class sampling estimate by 42 fish.However, we were short of no fish fromthe major length intervals (The interval re-quires 10 or more fish), as a result, the pre-cision for the estimates of major age groupswould not be influenced significantly.
We estimated a sample size of 446 oceansummer flounder in 2014, ranging in lengthinterval from 11 to 32 inches (Table 12.2).This sample size provided a range in CV forage composition approximately from thesmallest CV of 8% for age 3 to the largestCV of 21% for age 8 of the ocean fish. Werandomly selected and aged 448 fish from622 summer flounder collected by VMRCin Virginia waters of the Atlantic Ocean in2014. We fell short in our over-all collec-
110
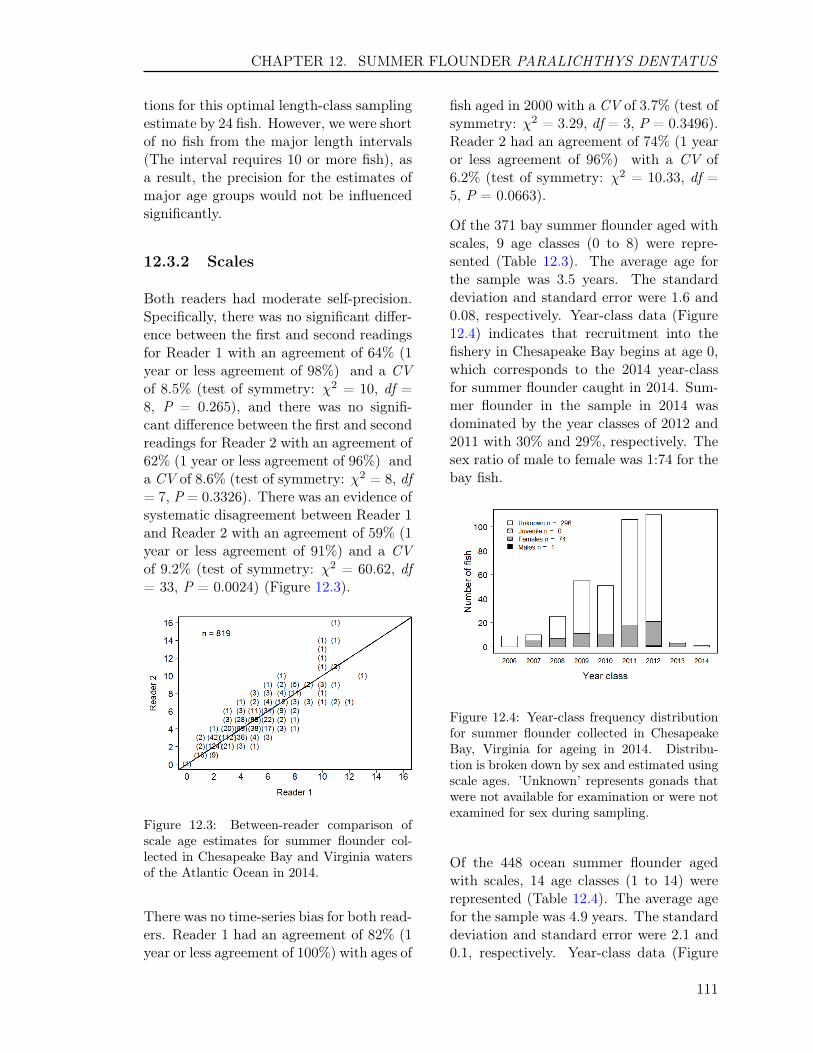
CHAPTER 12. SUMMER FLOUNDER PARALICHTHYS DENTATUS
tions for this optimal length-class samplingestimate by 24 fish. However, we were shortof no fish from the major length intervals(The interval requires 10 or more fish), asa result, the precision for the estimates ofmajor age groups would not be influencedsignificantly.
12.3.2 Scales
Both readers had moderate self-precision.Specifically, there was no significant differ-ence between the first and second readingsfor Reader 1 with an agreement of 64% (1year or less agreement of 98%) and a CVof 8.5% (test of symmetry: χ2 = 10, df =8, P = 0.265), and there was no signifi-cant difference between the first and secondreadings for Reader 2 with an agreement of62% (1 year or less agreement of 96%) anda CV of 8.6% (test of symmetry: χ2 = 8, df= 7, P = 0.3326). There was an evidence ofsystematic disagreement between Reader 1and Reader 2 with an agreement of 59% (1year or less agreement of 91%) and a CVof 9.2% (test of symmetry: χ2 = 60.62, df= 33, P = 0.0024) (Figure 12.3).
Figure 12.3: Between-reader comparison ofscale age estimates for summer flounder col-lected in Chesapeake Bay and Virginia watersof the Atlantic Ocean in 2014.
There was no time-series bias for both read-ers. Reader 1 had an agreement of 82% (1year or less agreement of 100%) with ages of
fish aged in 2000 with a CV of 3.7% (test ofsymmetry: χ2 = 3.29, df = 3, P = 0.3496).Reader 2 had an agreement of 74% (1 yearor less agreement of 96%) with a CV of6.2% (test of symmetry: χ2 = 10.33, df =5, P = 0.0663).
Of the 371 bay summer flounder aged withscales, 9 age classes (0 to 8) were repre-sented (Table 12.3). The average age forthe sample was 3.5 years. The standarddeviation and standard error were 1.6 and0.08, respectively. Year-class data (Figure12.4) indicates that recruitment into thefishery in Chesapeake Bay begins at age 0,which corresponds to the 2014 year-classfor summer flounder caught in 2014. Sum-mer flounder in the sample in 2014 wasdominated by the year classes of 2012 and2011 with 30% and 29%, respectively. Thesex ratio of male to female was 1:74 for thebay fish.
Figure 12.4: Year-class frequency distributionfor summer flounder collected in ChesapeakeBay, Virginia for ageing in 2014. Distribu-tion is broken down by sex and estimated usingscale ages. ’Unknown’ represents gonads thatwere not available for examination or were notexamined for sex during sampling.
Of the 448 ocean summer flounder agedwith scales, 14 age classes (1 to 14) wererepresented (Table 12.4). The average agefor the sample was 4.9 years. The standarddeviation and standard error were 2.1 and0.1, respectively. Year-class data (Figure
111
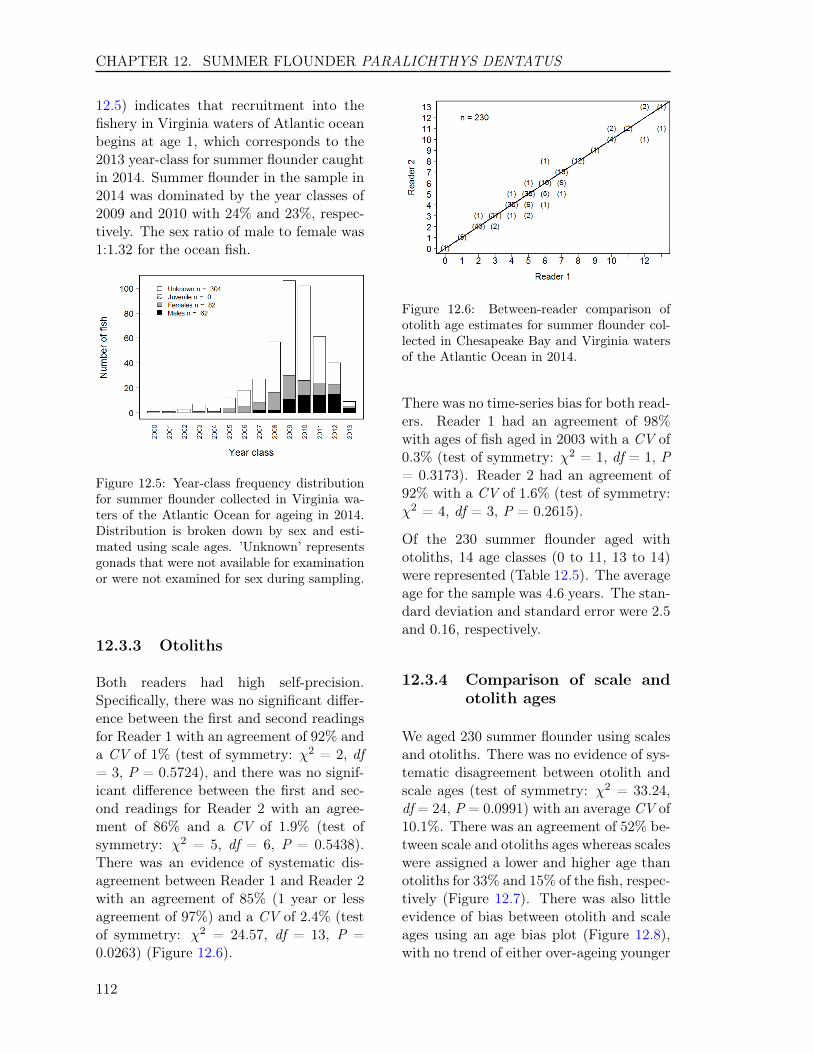
CHAPTER 12. SUMMER FLOUNDER PARALICHTHYS DENTATUS
12.5) indicates that recruitment into thefishery in Virginia waters of Atlantic oceanbegins at age 1, which corresponds to the2013 year-class for summer flounder caughtin 2014. Summer flounder in the sample in2014 was dominated by the year classes of2009 and 2010 with 24% and 23%, respec-tively. The sex ratio of male to female was1:1.32 for the ocean fish.
Figure 12.5: Year-class frequency distributionfor summer flounder collected in Virginia wa-ters of the Atlantic Ocean for ageing in 2014.Distribution is broken down by sex and esti-mated using scale ages. ’Unknown’ representsgonads that were not available for examinationor were not examined for sex during sampling.
12.3.3 Otoliths
Both readers had high self-precision.Specifically, there was no significant differ-ence between the first and second readingsfor Reader 1 with an agreement of 92% anda CV of 1% (test of symmetry: χ2 = 2, df= 3, P = 0.5724), and there was no signif-icant difference between the first and sec-ond readings for Reader 2 with an agree-ment of 86% and a CV of 1.9% (test ofsymmetry: χ2 = 5, df = 6, P = 0.5438).There was an evidence of systematic dis-agreement between Reader 1 and Reader 2with an agreement of 85% (1 year or lessagreement of 97%) and a CV of 2.4% (testof symmetry: χ2 = 24.57, df = 13, P =0.0263) (Figure 12.6).
Figure 12.6: Between-reader comparison ofotolith age estimates for summer flounder col-lected in Chesapeake Bay and Virginia watersof the Atlantic Ocean in 2014.
There was no time-series bias for both read-ers. Reader 1 had an agreement of 98%with ages of fish aged in 2003 with a CV of0.3% (test of symmetry: χ2 = 1, df = 1, P= 0.3173). Reader 2 had an agreement of92% with a CV of 1.6% (test of symmetry:χ2 = 4, df = 3, P = 0.2615).
Of the 230 summer flounder aged withotoliths, 14 age classes (0 to 11, 13 to 14)were represented (Table 12.5). The averageage for the sample was 4.6 years. The stan-dard deviation and standard error were 2.5and 0.16, respectively.
12.3.4 Comparison of scale andotolith ages
We aged 230 summer flounder using scalesand otoliths. There was no evidence of sys-tematic disagreement between otolith andscale ages (test of symmetry: χ2 = 33.24,df = 24, P = 0.0991) with an average CV of10.1%. There was an agreement of 52% be-tween scale and otoliths ages whereas scaleswere assigned a lower and higher age thanotoliths for 33% and 15% of the fish, respec-tively (Figure 12.7). There was also littleevidence of bias between otolith and scaleages using an age bias plot (Figure 12.8),with no trend of either over-ageing younger
112
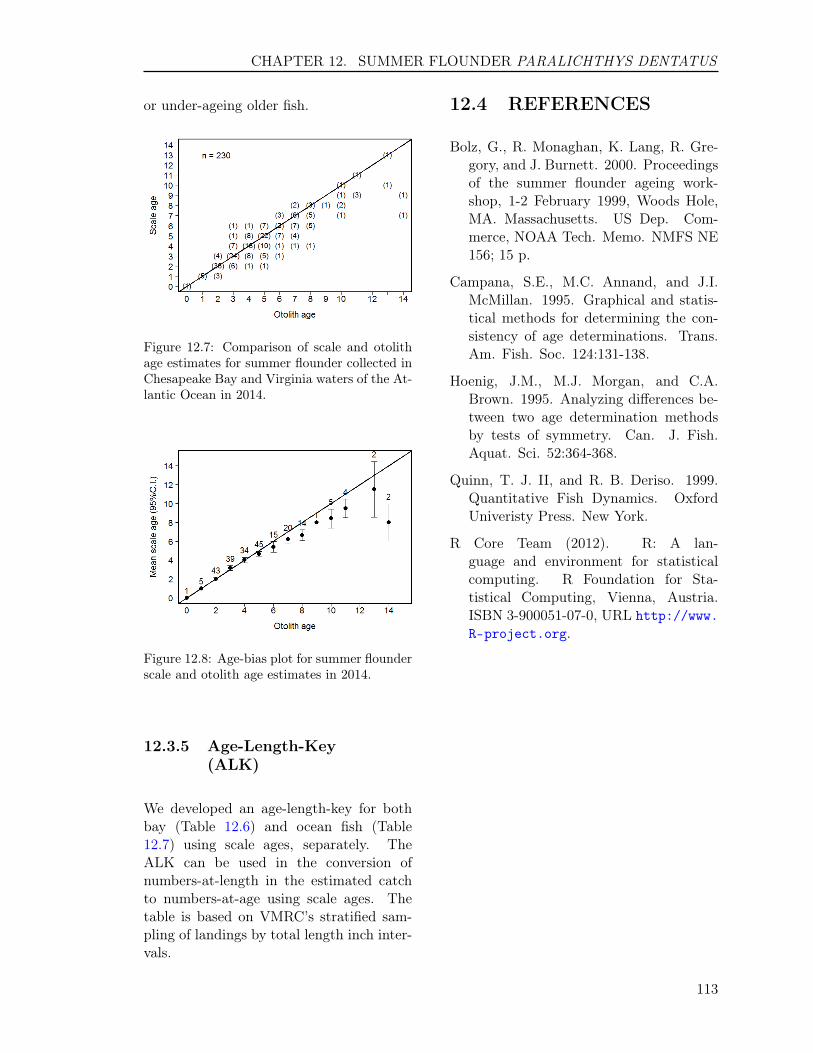
CHAPTER 12. SUMMER FLOUNDER PARALICHTHYS DENTATUS
or under-ageing older fish.
Figure 12.7: Comparison of scale and otolithage estimates for summer flounder collected inChesapeake Bay and Virginia waters of the At-lantic Ocean in 2014.
Figure 12.8: Age-bias plot for summer flounderscale and otolith age estimates in 2014.
12.3.5 Age-Length-Key(ALK)
We developed an age-length-key for bothbay (Table 12.6) and ocean fish (Table12.7) using scale ages, separately. TheALK can be used in the conversion ofnumbers-at-length in the estimated catchto numbers-at-age using scale ages. Thetable is based on VMRC’s stratified sam-pling of landings by total length inch inter-vals.
12.4 REFERENCES
Bolz, G., R. Monaghan, K. Lang, R. Gre-gory, and J. Burnett. 2000. Proceedingsof the summer flounder ageing work-shop, 1-2 February 1999, Woods Hole,MA. Massachusetts. US Dep. Com-merce, NOAA Tech. Memo. NMFS NE156; 15 p.
Campana, S.E., M.C. Annand, and J.I.McMillan. 1995. Graphical and statis-tical methods for determining the con-sistency of age determinations. Trans.Am. Fish. Soc. 124:131-138.
Hoenig, J.M., M.J. Morgan, and C.A.Brown. 1995. Analyzing differences be-tween two age determination methodsby tests of symmetry. Can. J. Fish.Aquat. Sci. 52:364-368.
Quinn, T. J. II, and R. B. Deriso. 1999.Quantitative Fish Dynamics. OxfordUniveristy Press. New York.
R Core Team (2012). R: A lan-guage and environment for statisticalcomputing. R Foundation for Sta-tistical Computing, Vienna, Austria.ISBN 3-900051-07-0, URL http://www.R-project.org.
113
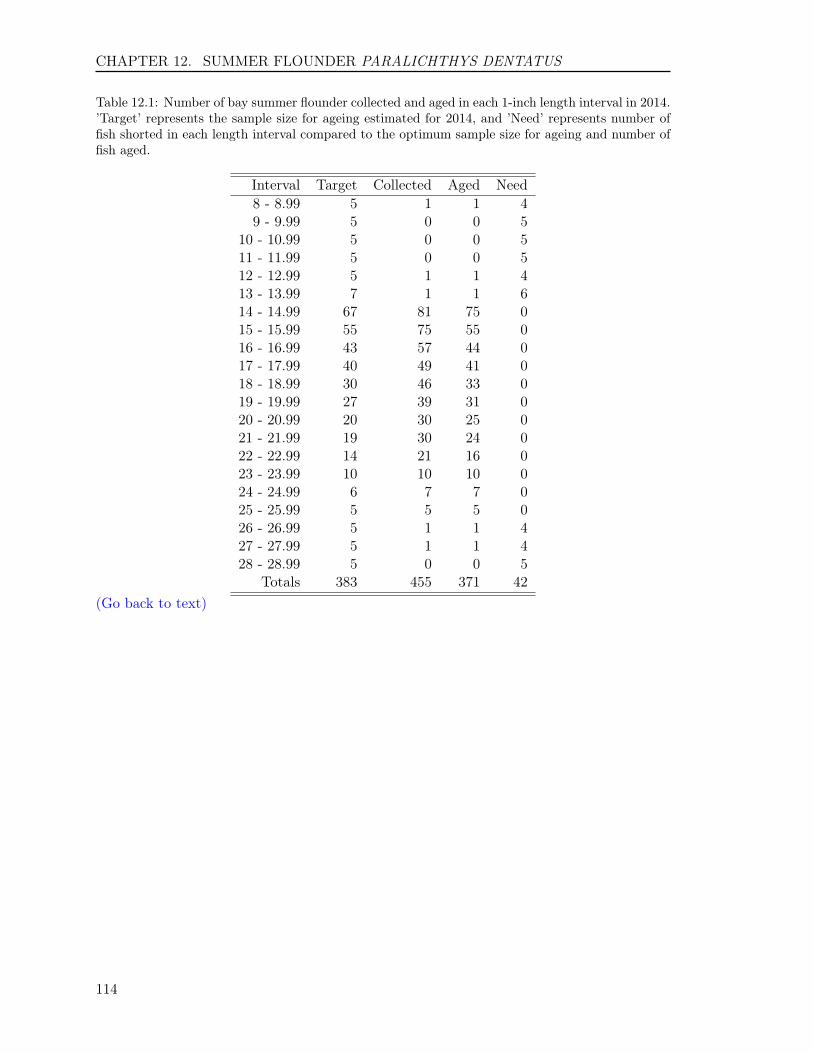
CHAPTER 12. SUMMER FLOUNDER PARALICHTHYS DENTATUS
Table 12.1: Number of bay summer flounder collected and aged in each 1-inch length interval in 2014.’Target’ represents the sample size for ageing estimated for 2014, and ’Need’ represents number offish shorted in each length interval compared to the optimum sample size for ageing and number offish aged.
Interval Target Collected Aged Need8 - 8.99 5 1 1 49 - 9.99 5 0 0 5
10 - 10.99 5 0 0 511 - 11.99 5 0 0 512 - 12.99 5 1 1 413 - 13.99 7 1 1 614 - 14.99 67 81 75 015 - 15.99 55 75 55 016 - 16.99 43 57 44 017 - 17.99 40 49 41 018 - 18.99 30 46 33 019 - 19.99 27 39 31 020 - 20.99 20 30 25 021 - 21.99 19 30 24 022 - 22.99 14 21 16 023 - 23.99 10 10 10 024 - 24.99 6 7 7 025 - 25.99 5 5 5 026 - 26.99 5 1 1 427 - 27.99 5 1 1 428 - 28.99 5 0 0 5
Totals 383 455 371 42(Go back to text)
114

CHAPTER 12. SUMMER FLOUNDER PARALICHTHYS DENTATUS
Table 12.2: Number of ocean summer flounder collected and aged in each 1-inch length intervalin 2014. ’Target’ represents the sample size for ageing estimated for 2014, and ’Need’ representsnumber of fish shorted in each length interval compared to the optimum sample size for ageing andnumber of fish aged.
Interval Target Collected Aged Need11 - 11.99 5 0 0 512 - 12.99 5 0 0 513 - 13.99 5 3 3 214 - 14.99 35 58 43 015 - 15.99 61 94 61 016 - 16.99 63 94 64 017 - 17.99 49 71 50 018 - 18.99 37 38 38 019 - 19.99 26 36 26 020 - 20.99 24 24 24 021 - 21.99 18 28 21 022 - 22.99 23 32 23 023 - 23.99 22 25 22 024 - 24.99 18 28 18 025 - 25.99 14 21 15 026 - 26.99 9 25 12 027 - 27.99 7 16 8 028 - 28.99 5 16 7 029 - 29.99 5 10 10 030 - 30.99 5 1 1 431 - 31.99 5 2 2 332 - 32.99 5 0 0 5
Totals 446 622 448 24(Go back to text)
115

CHAPTER 12. SUMMER FLOUNDER PARALICHTHYS DENTATUS
Table 12.3: The number of summer flounder assigned to each total length-at-age category for 371fish sampled for scale age determination in Chesapeake Bay, Virginia during 2014.
AgeInterval 0 1 2 3 4 5 6 7 8 Totals8 - 8.99 1 0 0 0 0 0 0 0 0 1
12 - 12.99 0 1 0 0 0 0 0 0 0 113 - 13.99 0 0 0 0 1 0 0 0 0 114 - 14.99 0 3 47 23 2 0 0 0 0 7515 - 15.99 0 0 31 20 2 2 0 0 0 5516 - 16.99 0 0 14 25 2 3 0 0 0 4417 - 17.99 0 0 11 16 6 7 0 1 0 4118 - 18.99 0 0 5 6 14 5 2 0 1 3319 - 19.99 0 0 2 6 11 10 2 0 0 3120 - 20.99 0 0 0 5 8 8 3 1 0 2521 - 21.99 0 0 0 3 1 9 7 2 2 2422 - 22.99 0 0 0 1 1 6 8 0 0 1623 - 23.99 0 0 0 1 1 2 1 4 1 1024 - 24.99 0 0 0 0 2 2 1 1 1 725 - 25.99 0 0 0 0 0 1 0 0 4 526 - 26.99 0 0 0 0 0 0 0 1 0 127 - 27.99 0 0 0 0 0 0 1 0 0 1
Totals 1 4 110 106 51 55 25 10 9 371(Go back to text)
116

CHAPTER 12. SUMMER FLOUNDER PARALICHTHYS DENTATUS
Table 12.4: The number of summer flounder assigned to each total length-at-age category for 448fish sampled for scale age determination in Virginia waters of Atlantic ocean during 2014.
AgeInterval 1 2 3 4 5 6 7 8 9 10 11 12 13 14 Totals
13 - 13.99 1 0 1 0 0 1 0 0 0 0 0 0 0 0 314 - 14.99 3 17 11 6 4 0 1 1 0 0 0 0 0 0 4315 - 15.99 4 12 12 13 14 5 1 0 0 0 0 0 0 0 6116 - 16.99 1 7 15 18 16 6 1 0 0 0 0 0 0 0 6417 - 17.99 0 2 9 22 14 2 0 0 1 0 0 0 0 0 5018 - 18.99 0 1 6 10 13 4 3 1 0 0 0 0 0 0 3819 - 19.99 0 1 0 10 7 2 4 1 1 0 0 0 0 0 2620 - 20.99 0 0 1 8 7 4 2 1 1 0 0 0 0 0 2421 - 21.99 0 0 3 4 9 5 0 0 0 0 0 0 0 0 2122 - 22.99 0 0 2 5 9 5 1 1 0 0 0 0 0 0 2323 - 23.99 0 0 1 3 6 6 5 1 0 0 0 0 0 0 2224 - 24.99 0 0 0 3 6 4 1 3 0 0 1 0 0 0 1825 - 25.99 0 0 0 0 1 6 2 2 3 0 0 1 0 0 1526 - 26.99 0 0 0 0 0 4 1 2 0 1 4 0 0 0 1227 - 27.99 0 0 0 0 0 1 2 2 1 1 1 0 0 0 828 - 28.99 0 0 0 0 0 1 0 1 2 1 1 1 0 0 729 - 29.99 0 0 0 0 0 1 3 1 2 0 0 1 1 1 1030 - 30.99 0 0 0 0 0 0 0 1 0 0 0 0 0 0 131 - 31.99 0 0 0 0 0 0 0 0 1 1 0 0 0 0 2
Totals 9 40 61 102 106 57 27 18 12 4 7 3 1 1 448(Go back to text)
117
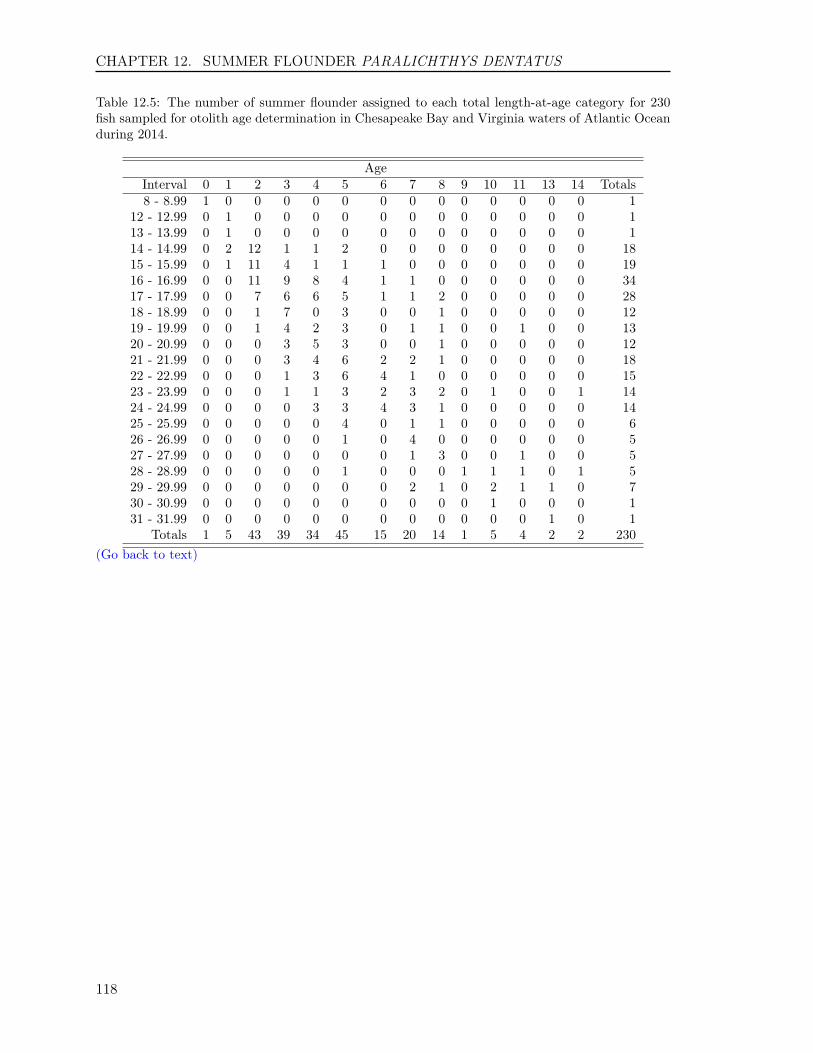
CHAPTER 12. SUMMER FLOUNDER PARALICHTHYS DENTATUS
Table 12.5: The number of summer flounder assigned to each total length-at-age category for 230fish sampled for otolith age determination in Chesapeake Bay and Virginia waters of Atlantic Oceanduring 2014.
AgeInterval 0 1 2 3 4 5 6 7 8 9 10 11 13 14 Totals8 - 8.99 1 0 0 0 0 0 0 0 0 0 0 0 0 0 1
12 - 12.99 0 1 0 0 0 0 0 0 0 0 0 0 0 0 113 - 13.99 0 1 0 0 0 0 0 0 0 0 0 0 0 0 114 - 14.99 0 2 12 1 1 2 0 0 0 0 0 0 0 0 1815 - 15.99 0 1 11 4 1 1 1 0 0 0 0 0 0 0 1916 - 16.99 0 0 11 9 8 4 1 1 0 0 0 0 0 0 3417 - 17.99 0 0 7 6 6 5 1 1 2 0 0 0 0 0 2818 - 18.99 0 0 1 7 0 3 0 0 1 0 0 0 0 0 1219 - 19.99 0 0 1 4 2 3 0 1 1 0 0 1 0 0 1320 - 20.99 0 0 0 3 5 3 0 0 1 0 0 0 0 0 1221 - 21.99 0 0 0 3 4 6 2 2 1 0 0 0 0 0 1822 - 22.99 0 0 0 1 3 6 4 1 0 0 0 0 0 0 1523 - 23.99 0 0 0 1 1 3 2 3 2 0 1 0 0 1 1424 - 24.99 0 0 0 0 3 3 4 3 1 0 0 0 0 0 1425 - 25.99 0 0 0 0 0 4 0 1 1 0 0 0 0 0 626 - 26.99 0 0 0 0 0 1 0 4 0 0 0 0 0 0 527 - 27.99 0 0 0 0 0 0 0 1 3 0 0 1 0 0 528 - 28.99 0 0 0 0 0 1 0 0 0 1 1 1 0 1 529 - 29.99 0 0 0 0 0 0 0 2 1 0 2 1 1 0 730 - 30.99 0 0 0 0 0 0 0 0 0 0 1 0 0 0 131 - 31.99 0 0 0 0 0 0 0 0 0 0 0 0 1 0 1
Totals 1 5 43 39 34 45 15 20 14 1 5 4 2 2 230(Go back to text)
118

CHAPTER 12. SUMMER FLOUNDER PARALICHTHYS DENTATUS
Table 12.6: Age-Length key, as proportion-at-age in each 1-inch length interval, based on scale agesfor summer flounder sampled in Chesapeake Bay, Virginia during 2014.
AgeInterval 0 1 2 3 4 5 6 7 88 - 8.99 1 0 0 0 0 0 0 0 0
12 - 12.99 0 1 0 0 0 0 0 0 013 - 13.99 0 0 0 0 1 0 0 0 014 - 14.99 0 0.04 0.63 0.31 0.03 0 0 0 015 - 15.99 0 0 0.56 0.36 0.04 0.04 0 0 016 - 16.99 0 0 0.32 0.57 0.05 0.07 0 0 017 - 17.99 0 0 0.27 0.39 0.15 0.17 0 0.02 018 - 18.99 0 0 0.15 0.18 0.42 0.15 0.06 0 0.0319 - 19.99 0 0 0.06 0.19 0.35 0.32 0.06 0 020 - 20.99 0 0 0 0.2 0.32 0.32 0.12 0.04 021 - 21.99 0 0 0 0.12 0.04 0.38 0.29 0.08 0.0822 - 22.99 0 0 0 0.06 0.06 0.38 0.5 0 023 - 23.99 0 0 0 0.1 0.1 0.2 0.1 0.4 0.124 - 24.99 0 0 0 0 0.29 0.29 0.14 0.14 0.1425 - 25.99 0 0 0 0 0 0.2 0 0 0.826 - 26.99 0 0 0 0 0 0 0 1 027 - 27.99 0 0 0 0 0 0 1 0 0
(Go back to text)
119

CHAPTER 12. SUMMER FLOUNDER PARALICHTHYS DENTATUS
Table
12.7:Age-Length
key,asproportion-at-age
ineach
1-inchlength
interval,basedon
scaleages
forsum
mer
floundersam
pledin
Virginia
waters
ofthe
Atlantic
Ocean
during2014.
Age
Interval1
23
45
67
89
1011
1213
1413
-13.99
0.330
0.330
00.33
00
00
00
00
14-14.99
0.070.4
0.260.14
0.090
0.020.02
00
00
00
15-15.99
0.070.2
0.20.21
0.230.08
0.020
00
00
00
16-16.99
0.020.11
0.230.28
0.250.09
0.020
00
00
00
17-17.99
00.04
0.180.44
0.280.04
00
0.020
00
00
18-18.99
00.03
0.160.26
0.340.11
0.080.03
00
00
00
19-19.99
00.04
00.38
0.270.08
0.150.04
0.040
00
00
20-20.99
00
0.040.33
0.290.17
0.080.04
0.040
00
00
21-21.99
00
0.140.19
0.430.24
00
00
00
00
22-22.99
00
0.090.22
0.390.22
0.040.04
00
00
00
23-23.99
00
0.050.14
0.270.27
0.230.05
00
00
00
24-24.99
00
00.17
0.330.22
0.060.17
00
0.060
00
25-25.99
00
00
0.070.4
0.130.13
0.20
00.07
00
26-26.99
00
00
00.33
0.080.17
00.08
0.330
00
27-27.99
00
00
00.12
0.250.25
0.120.12
0.120
00
28-28.99
00
00
00.14
00.14
0.290.14
0.140.14
00
29-29.99
00
00
00.1
0.30.1
0.20
00.1
0.10.1
30-30.99
00
00
00
01
00
00
00
31-31.99
00
00
00
00
0.50.5
00
00
(Goback
totext)
120
Chapter 13
TAUTOG Tautoga onitis

CHAPTER 13. TAUTOG TAUTOGA ONITIS
13.1 INTRODUCTION
We aged a total of 308 tautog,Tautoga oni-tis, using their opercula collected by theVMRC’s Biological Sampling Program in2014. Of 308 aged fish, 264 and 44 fishwere collected in Chesapeake Bay (bay fish)and Virginia waters of the Atlantic Ocean(ocean fish), respectively. The average agefor the bay fish was 5.2 years with a stan-dard deviation of 1.4 and a standard er-ror of 0.09. Ten age classes (3 to 12) wererepresented in the bay fish, comprising fishfrom the 2002 to 2011 year classes. Thebay fish sample in 2014 was dominated bythe year class of 2009 with 46%. The av-erage age for the ocean fish was 9.1 yearswith a standard deviation of 5.1 and a stan-dard error of 0.77. Fifteen age classes (3,5 to 17, 30) were represented in the oceanfish, comprising fish from the 1984, 1997to 2009, 2011 year classes. The ocean fishsample in 2014 was dominated by the yearclasses of 2009 and 2008 with 23% and 20%,respectively. We also aged a total of 301fish using their otoliths in addition to age-ing their opercula. The otolith ages werecompared to the operculum ages to exam-ine how close both ages were to one another(see details in Results).
13.2 METHODS
13.2.1 Sample size for ageing
We estimated sample sizes for ageing tau-tog collected in both Chesapeake Bay andVirginia waters of the Atlantic Ocean in2014, respectively, using a two-stage ran-dom sampling method (Quinn and Deriso1999) to increase precision in estimatesof age composition from fish sampled effi-ciently and effectively. The basic equationis:
A =Va
θ2aCV2 +Ba/L
(13.1)
where A is the sample size for ageing tau-tog in 2014; θa stands for the proportion ofage a fish in a catch. Va and Ba representvariance components within and betweenlength intervals for age a, respectively; CVis the coefficient of variation; L was the to-tal number of tautog used by VMRC toestimate length distribution of the catchesfrom 2008 to 2012. θa, Va, Ba, and CV werecalculated using pooled age-length data oftautog collected from 2008 to 2012 and us-ing equations in Quinn and Deriso (1999).For simplicity, the equations are not listedhere. The equation (13.1) indicates thatthe more fish that are aged, the smallerthe CV (or higher precision) that will beobtained. Therefore, the criterion to ageA (number) of fish is that A should be anumber above which there is only a 1% CVreduction for the most major age in catchby aging an additional 100 or more fish. Fi-nally, Al is A multiplied by the proportionof length interval l from the length distribu-tion of the 2008 to 2012 catch. Al is num-ber of fish to be aged for length interval lin 2014.
13.2.2 Handling of collection
Sagittal otoliths (hereafter, referred to as"otoliths") and opercula were received bythe Age & Growth Laboratory in labeledcoin envelopes, and were sorted based ondate of capture. Their envelope labels wereverified against VMRC’s collection data,and each fish assigned a unique Age andGrowth Laboratory identification number.All otoliths and opercula were stored drywithin their original labeled coin envelopes;otoliths were contained inside protectiveAxygen 2.0 ml microtubes.
122

CHAPTER 13. TAUTOG TAUTOGA ONITIS
13.2.3 Preparation
Opercula
Tautog opercula were boiled for severalminutes to remove any attached skin andconnective tissue. After boiling, operculawere inspected for damage. If there wereno obvious flaws, the opercula was driedand then stored in a new, labeled enve-lope.
Click here to obtain the protocol at theCQFE website on how to prepare opercu-lum for ageing tautog.
Otoliths
We used our thin-section and bake tech-nique to process spadefish sagittal otoliths(hereafter, referred to as "otoliths") for agedetermination. Otolith preparation beganby randomly selecting either the right orleft otolith. Each whole otolith was placedin a ceramic "Coors" spot plate well andbaked in a Thermolyne 1400 furnace at400 ◦C. Baking time was dependent on theotolith’s size and gauged by color, with alight caramel color desired. Once a suit-able color was achieved the baked otolithwas embedded in epoxy resin with its dis-tal surface orientated downwards and al-lowed to harden overnight. The otolithswere viewed by eye and, when necessary,under a stereo microscope to identify thelocation of the core, and the position of thecore was marked using a permanent markeracross the epoxy resin surface. At leastone transverse cross-section (hereafter, re-ferred to as "thin-section") was then re-moved from the marked core of each otolithusing a Buehler IsoMetTM low-speed sawequipped with two, 3-inch diameter, Nor-ton diamond grinding wheels (hereafter, re-ferred to as "blades"), separated by a stain-less steel spacer of 0.5 mm (diameter 2.5").The otolith was positioned so the blades
straddled each side of the otolith focus. Itwas crucial that this cut be perpendicu-lar to the long axis of the otolith. Failureto do so resulted in broadening and dis-torted winter growth zones. A proper cutresulted in annuli that were clearly definedand delineated. Once cut, thin-sectionswere placed on labeled glass slides and cov-ered with a thin layer of Flo-texx mountingmedium that not only fixed the sections tothe slide, but more importantly, providedenhanced contrast and greater readabilityby increasing light transmission throughthe thin-section.
Click here to obtain the protocol at theCQFE website on how to prepare otoliththin-section for ageing tautog.
13.2.4 Readings
The CQFE system assigns an age class toa fish based on a combination of readingthe information contained in its otolith, thedate of its capture, and the species-specificperiod when it deposits its annulus. Eachyear, as the fish grows, its otoliths grow andleave behind markers of their age, calledannuli. Technically, an otolith annulus isthe combination of both the opaque andthe translucent bands. In practice, only theopaque bands are counted as annuli. Thenumber of these visible dark bands replaces"x" in our notation below, and is the initial"age" assignment of the fish.
Second, the otolith section is examinedfor translucent growth. If no translucentgrowth is visible beyond the last dark an-nulus, the otolith is called "even" and nomodification of the assigned age is made.The initial assigned age, then, is the ageclass of the fish. Any growth beyond thelast annulus can be interpreted as eitherbeing toward the next age class or withinthe same age class. If translucent growthis visible beyond the last dark annulus, a"+" is added to the notation.
123
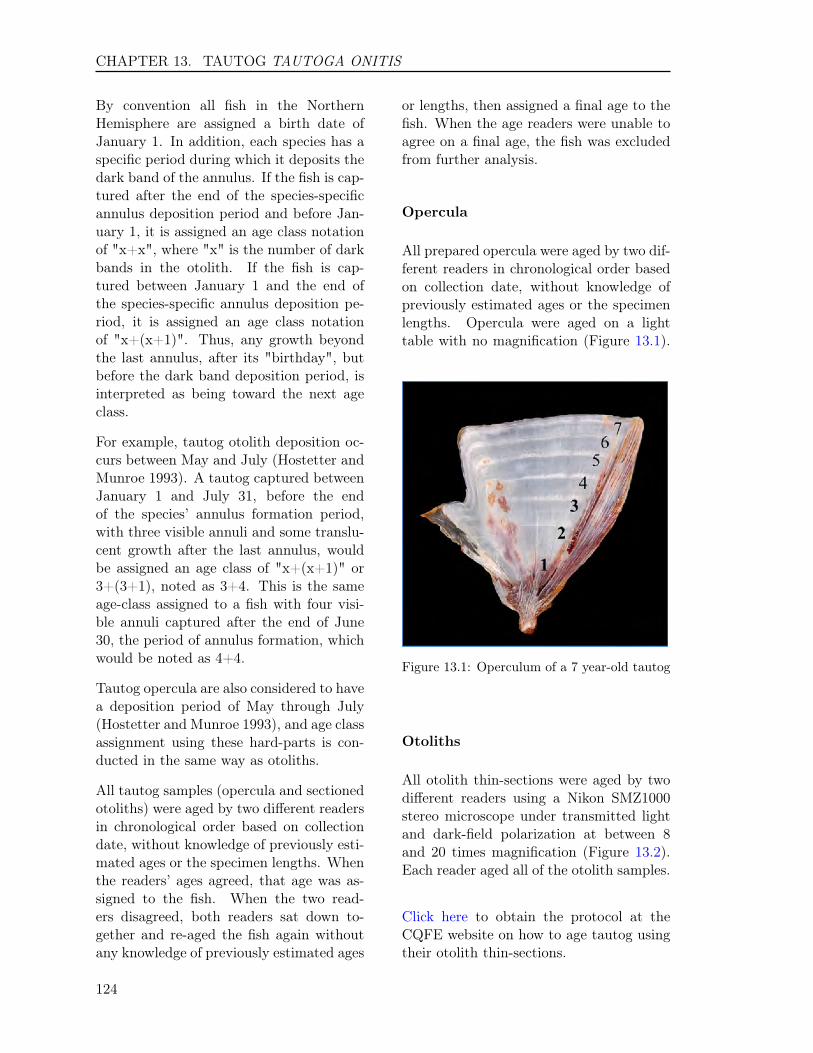
CHAPTER 13. TAUTOG TAUTOGA ONITIS
By convention all fish in the NorthernHemisphere are assigned a birth date ofJanuary 1. In addition, each species has aspecific period during which it deposits thedark band of the annulus. If the fish is cap-tured after the end of the species-specificannulus deposition period and before Jan-uary 1, it is assigned an age class notationof "x+x", where "x" is the number of darkbands in the otolith. If the fish is cap-tured between January 1 and the end ofthe species-specific annulus deposition pe-riod, it is assigned an age class notationof "x+(x+1)". Thus, any growth beyondthe last annulus, after its "birthday", butbefore the dark band deposition period, isinterpreted as being toward the next ageclass.
For example, tautog otolith deposition oc-curs between May and July (Hostetter andMunroe 1993). A tautog captured betweenJanuary 1 and July 31, before the endof the species’ annulus formation period,with three visible annuli and some translu-cent growth after the last annulus, wouldbe assigned an age class of "x+(x+1)" or3+(3+1), noted as 3+4. This is the sameage-class assigned to a fish with four visi-ble annuli captured after the end of June30, the period of annulus formation, whichwould be noted as 4+4.
Tautog opercula are also considered to havea deposition period of May through July(Hostetter and Munroe 1993), and age classassignment using these hard-parts is con-ducted in the same way as otoliths.
All tautog samples (opercula and sectionedotoliths) were aged by two different readersin chronological order based on collectiondate, without knowledge of previously esti-mated ages or the specimen lengths. Whenthe readers’ ages agreed, that age was as-signed to the fish. When the two read-ers disagreed, both readers sat down to-gether and re-aged the fish again withoutany knowledge of previously estimated ages
or lengths, then assigned a final age to thefish. When the age readers were unable toagree on a final age, the fish was excludedfrom further analysis.
Opercula
All prepared opercula were aged by two dif-ferent readers in chronological order basedon collection date, without knowledge ofpreviously estimated ages or the specimenlengths. Opercula were aged on a lighttable with no magnification (Figure 13.1).
Figure 13.1: Operculum of a 7 year-old tautog
Otoliths
All otolith thin-sections were aged by twodifferent readers using a Nikon SMZ1000stereo microscope under transmitted lightand dark-field polarization at between 8and 20 times magnification (Figure 13.2).Each reader aged all of the otolith samples.
Click here to obtain the protocol at theCQFE website on how to age tautog usingtheir otolith thin-sections.
124

CHAPTER 13. TAUTOG TAUTOGA ONITIS
Figure 13.2: Otolith thin-section of 6 year-oldtautog
13.2.5 Comparison Tests
A symmetry test (Hoenig et al. 1995) andcoefficient of variation (CV) analysis wereused to detect any systematic differenceand precision on age readings, respectively,for following comparisons: 1) between thetwo readers in the current year; 2) withineach reader in the current year; 3) time-series bias between the current and previ-ous years within each reader; and 4) be-tween operculum and otoliths ages. Thereadings from the entire sample for the cur-rent year were used to examine the differ-ence between two readers. A random sub-sample of 50 fish from the current year wasselected for second readings to examine thedifference within a reader. Fifty otolithsrandomly selected from fish aged in 2000were used to examine the time-series biaswithin each reader. A figure of 1:1 equiv-alence was used to illustrate those differ-ences (Campana et al. 1995). All statis-tics analyses were performed in R 2.15.2(R Core Team 2012).
13.3 RESULTS
13.3.1 Sample size
We estimated a sample size of 422 bay tau-tog in 2014, ranging in length interval from12 to 26 inches (Table 13.1). This samplesize provided a range in CV for age compo-sition approximately from the smallest CVof 9% for age 4 and 5 to the largest CV of
21% for age 8 of the bay fish. We aged 264of 265 tautog (The rest of fish were eitherwithout opercula or over-collected for cer-tain length interval(s)) collected by VMRCin Chesapeake Bay in 2014. We fell shortin our over-all collections for this optimallength-class sampling estimate by 163 fish.However, we were short of many fish fromthe major length intervals (The interval re-quires 10 or more fish), as a result, theprecision for the estimates of major agegroups would definitely be influenced sig-nificantly. Therefore, precaution should beused when developing ALK using these agedata.
We estimated a sample size of 409 oceantautog in 2014, ranging in length intervalfrom 11 to 30 inches (Table 13.2). Thissample size provided a range in CV for agecomposition approximately from the small-est CV of 10% for age 4 to the largest CV of25% for age 14 of the ocean fish. We agedall 44 tautog collected by VMRC in Vir-ginia waters of the Atlantic Ocean in 2014.We fell short in our over-all collections forthis optimal length-class sampling estimateby 365 fish. However, we were short ofmany fish from the major length intervals(The interval requires 10 or more fish), asa result, the precision for the estimates ofmajor age groups would definitely be influ-enced significantly. Therefore, precautionshould be used when developing ALK us-ing these age data.
13.3.2 Opercula
Both readers had high self-precision.Specifically, there was no significant differ-ence between the first and second readingsfor Reader 1 with an agreement of 72% (1year or less agreement of 96%) and a CVof 4.5% (test of symmetry: χ2 = 11.33, df= 7, P = 0.1247), and there was no signifi-cant difference between the first and secondreadings for Reader 2 with an agreement of
125
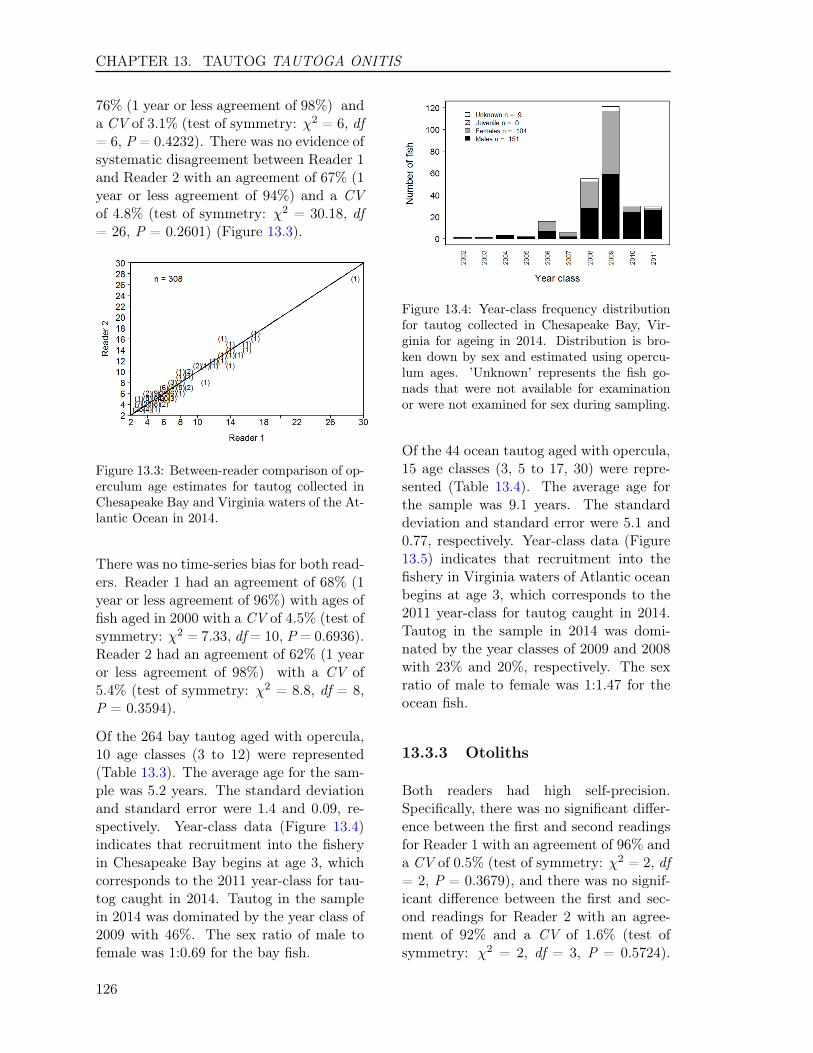
CHAPTER 13. TAUTOG TAUTOGA ONITIS
76% (1 year or less agreement of 98%) anda CV of 3.1% (test of symmetry: χ2 = 6, df= 6, P = 0.4232). There was no evidence ofsystematic disagreement between Reader 1and Reader 2 with an agreement of 67% (1year or less agreement of 94%) and a CVof 4.8% (test of symmetry: χ2 = 30.18, df= 26, P = 0.2601) (Figure 13.3).
Figure 13.3: Between-reader comparison of op-erculum age estimates for tautog collected inChesapeake Bay and Virginia waters of the At-lantic Ocean in 2014.
There was no time-series bias for both read-ers. Reader 1 had an agreement of 68% (1year or less agreement of 96%) with ages offish aged in 2000 with a CV of 4.5% (test ofsymmetry: χ2 = 7.33, df = 10, P = 0.6936).Reader 2 had an agreement of 62% (1 yearor less agreement of 98%) with a CV of5.4% (test of symmetry: χ2 = 8.8, df = 8,P = 0.3594).
Of the 264 bay tautog aged with opercula,10 age classes (3 to 12) were represented(Table 13.3). The average age for the sam-ple was 5.2 years. The standard deviationand standard error were 1.4 and 0.09, re-spectively. Year-class data (Figure 13.4)indicates that recruitment into the fisheryin Chesapeake Bay begins at age 3, whichcorresponds to the 2011 year-class for tau-tog caught in 2014. Tautog in the samplein 2014 was dominated by the year class of2009 with 46%. The sex ratio of male tofemale was 1:0.69 for the bay fish.
Figure 13.4: Year-class frequency distributionfor tautog collected in Chesapeake Bay, Vir-ginia for ageing in 2014. Distribution is bro-ken down by sex and estimated using opercu-lum ages. ’Unknown’ represents the fish go-nads that were not available for examinationor were not examined for sex during sampling.
Of the 44 ocean tautog aged with opercula,15 age classes (3, 5 to 17, 30) were repre-sented (Table 13.4). The average age forthe sample was 9.1 years. The standarddeviation and standard error were 5.1 and0.77, respectively. Year-class data (Figure13.5) indicates that recruitment into thefishery in Virginia waters of Atlantic oceanbegins at age 3, which corresponds to the2011 year-class for tautog caught in 2014.Tautog in the sample in 2014 was domi-nated by the year classes of 2009 and 2008with 23% and 20%, respectively. The sexratio of male to female was 1:1.47 for theocean fish.
13.3.3 Otoliths
Both readers had high self-precision.Specifically, there was no significant differ-ence between the first and second readingsfor Reader 1 with an agreement of 96% anda CV of 0.5% (test of symmetry: χ2 = 2, df= 2, P = 0.3679), and there was no signif-icant difference between the first and sec-ond readings for Reader 2 with an agree-ment of 92% and a CV of 1.6% (test ofsymmetry: χ2 = 2, df = 3, P = 0.5724).
126

CHAPTER 13. TAUTOG TAUTOGA ONITIS
Figure 13.5: Year-class frequency distributionfor tautog collected in Virginia waters of theAtlantic Ocean for ageing in 2014. Distribu-tion is broken down by sex and estimated usingoperculum ages. ’Unknown’ represents the fishgonads that were not available for examinationor were not examined for sex during sampling.
There was no evidence of systematic dis-agreement between Reader 1 and Reader 2with an agreement of 86% (1 year or lessagreement of 98%) and a CV of 1.8% (testof symmetry: χ2 = 21.94, df = 18, P =0.2345) (Figure 13.6). There was no time-
Figure 13.6: Between-reader comparison ofotolith age estimates for tautog collected inChesapeake Bay and Virginia waters of the At-lantic Ocean in 2014.
series bias for both readers. Reader 1 hadan agreement of 100% with ages of fish agedin 2003. Reader 2 had an agreement of 98%with a CV of 0.2% (test of symmetry: χ2
= 1, df = 1, P = 0.3173).
Of the 301 tautog aged with otoliths, 17age classes (2 to 17, 28) were represented(Table 13.5). The average age for the sam-ple was 5.8 years. The standard deviationand standard error were 2.8 and 0.16, re-spectively.
13.3.4 Comparison of operculumand otolith ages
We aged 301 tautog using opercula andotoliths. There was no evidence of sys-tematic disagreement between otolith andoperculum ages (test of symmetry: χ2 =35.6, df = 24, P = 0.0599) with an averageCV of 5.2%. There was an agreement of66% between operculum and otoliths ageswhereas opercula were assigned a lower andhigher age than otoliths for 17% and 18% ofthe fish, respectively (Figure 13.7). Therewas also little evidence of bias betweenotolith and operculum ages using an agebias plot(Figure 13.8), with no trend of ei-ther over-ageing younger or under-ageingolder fish.
Figure 13.7: Comparison of operculum andotolith age estimates for tautog collected inChesapeake Bay and Virginia waters of the At-lantic Ocean in 2014.
127

CHAPTER 13. TAUTOG TAUTOGA ONITIS
Figure 13.8: Age-bias plot for tautog opercu-lum and otolith age estimates in 2014.
13.3.5 Age-Length-Key(ALK)
We developed an age-length-key for bothbay (Table 13.6) and ocean fish (Table13.7) using operculum ages, separately.The ALK can be used in the conversion ofnumbers-at-length in the estimated catchto numbers-at-age using operculum ages.The table is based on VMRC’s stratifiedsampling of landings by total length inchintervals.
13.4 REFERENCES
Campana, S.E., M.C. Annand, and J.I.McMillan. 1995. Graphical and statis-tical methods for determining the con-sistency of age determinations. Trans.Am. Fish. Soc. 124:131-138.
Hoenig, J.M., M.J. Morgan, and C.A.Brown. 1995. Analyzing differences be-tween two age determination methodsby tests of symmetry. Can. J. Fish.Aquat. Sci. 52:364-368.
Hostetter, E. B., and T. A. Munroe. 1993.Age, growth, and reproduction of tautogTautoga onitis (Labridae: Perciformes)from coastal waters of Virginia. FisheryBulletin 91: 45-64.
Quinn, T. J. II, and R. B. Deriso. 1999.Quantitative Fish Dynamics. OxfordUniversity Press. New York.
R Core Team (2012). R: A lan-guage and environment for statisticalcomputing. R Foundation for Sta-tistical Computing, Vienna, Austria.ISBN 3-900051-07-0, URL http://www.R-project.org.
128
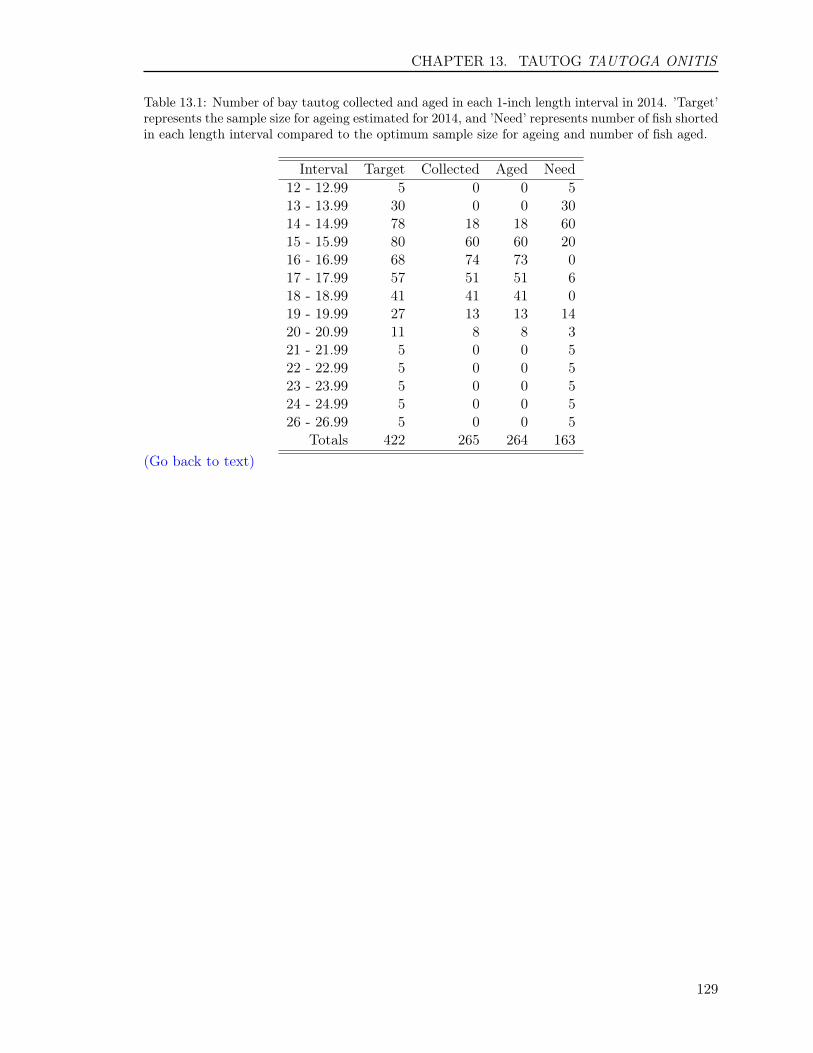
CHAPTER 13. TAUTOG TAUTOGA ONITIS
Table 13.1: Number of bay tautog collected and aged in each 1-inch length interval in 2014. ’Target’represents the sample size for ageing estimated for 2014, and ’Need’ represents number of fish shortedin each length interval compared to the optimum sample size for ageing and number of fish aged.
Interval Target Collected Aged Need12 - 12.99 5 0 0 513 - 13.99 30 0 0 3014 - 14.99 78 18 18 6015 - 15.99 80 60 60 2016 - 16.99 68 74 73 017 - 17.99 57 51 51 618 - 18.99 41 41 41 019 - 19.99 27 13 13 1420 - 20.99 11 8 8 321 - 21.99 5 0 0 522 - 22.99 5 0 0 523 - 23.99 5 0 0 524 - 24.99 5 0 0 526 - 26.99 5 0 0 5
Totals 422 265 264 163(Go back to text)
129
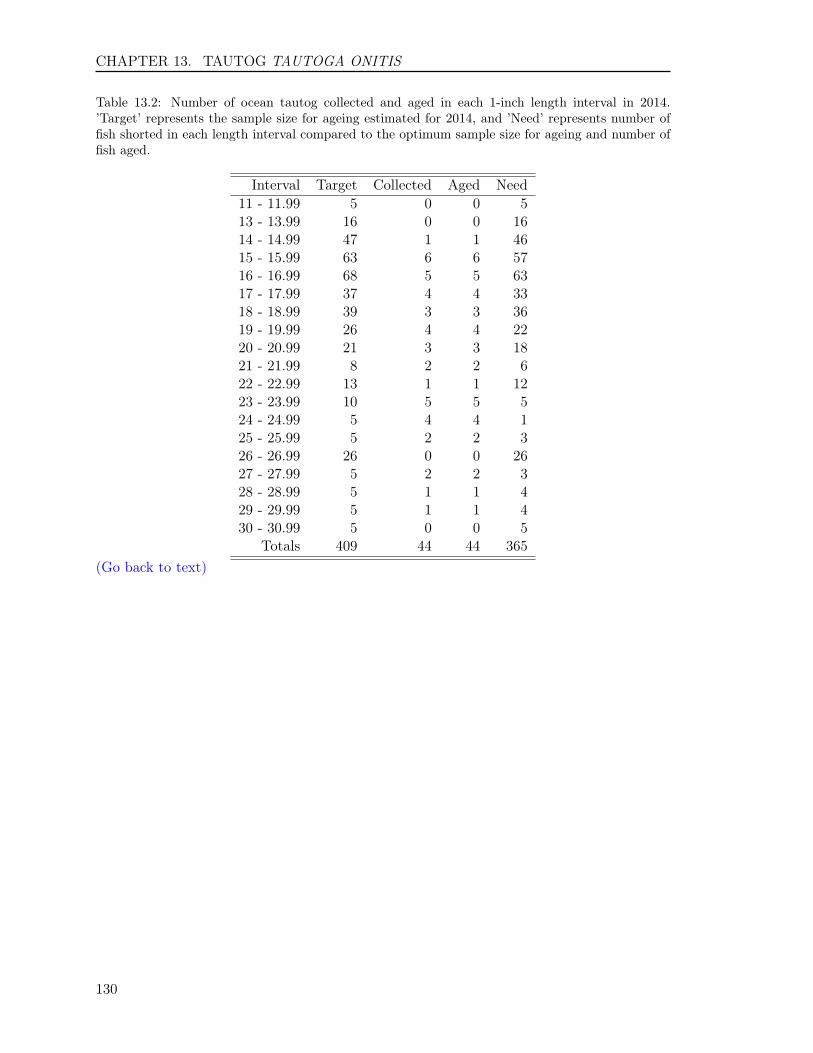
CHAPTER 13. TAUTOG TAUTOGA ONITIS
Table 13.2: Number of ocean tautog collected and aged in each 1-inch length interval in 2014.’Target’ represents the sample size for ageing estimated for 2014, and ’Need’ represents number offish shorted in each length interval compared to the optimum sample size for ageing and number offish aged.
Interval Target Collected Aged Need11 - 11.99 5 0 0 513 - 13.99 16 0 0 1614 - 14.99 47 1 1 4615 - 15.99 63 6 6 5716 - 16.99 68 5 5 6317 - 17.99 37 4 4 3318 - 18.99 39 3 3 3619 - 19.99 26 4 4 2220 - 20.99 21 3 3 1821 - 21.99 8 2 2 622 - 22.99 13 1 1 1223 - 23.99 10 5 5 524 - 24.99 5 4 4 125 - 25.99 5 2 2 326 - 26.99 26 0 0 2627 - 27.99 5 2 2 328 - 28.99 5 1 1 429 - 29.99 5 1 1 430 - 30.99 5 0 0 5
Totals 409 44 44 365(Go back to text)
130
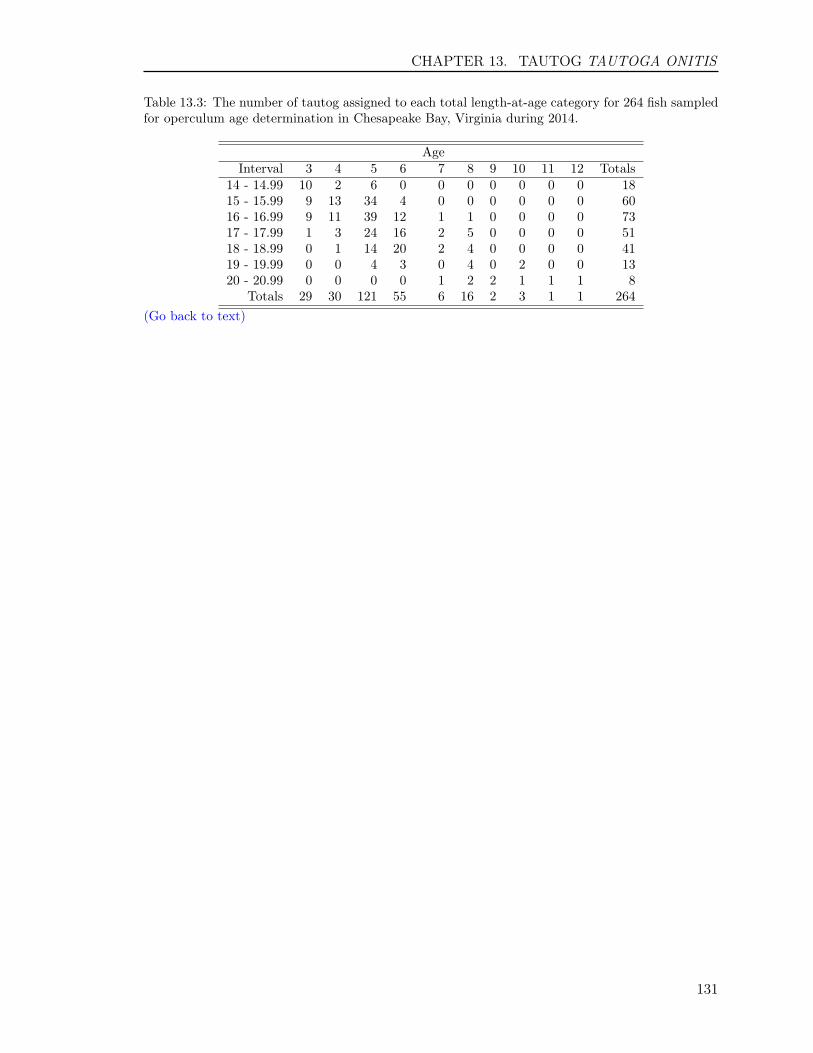
CHAPTER 13. TAUTOG TAUTOGA ONITIS
Table 13.3: The number of tautog assigned to each total length-at-age category for 264 fish sampledfor operculum age determination in Chesapeake Bay, Virginia during 2014.
AgeInterval 3 4 5 6 7 8 9 10 11 12 Totals
14 - 14.99 10 2 6 0 0 0 0 0 0 0 1815 - 15.99 9 13 34 4 0 0 0 0 0 0 6016 - 16.99 9 11 39 12 1 1 0 0 0 0 7317 - 17.99 1 3 24 16 2 5 0 0 0 0 5118 - 18.99 0 1 14 20 2 4 0 0 0 0 4119 - 19.99 0 0 4 3 0 4 0 2 0 0 1320 - 20.99 0 0 0 0 1 2 2 1 1 1 8
Totals 29 30 121 55 6 16 2 3 1 1 264(Go back to text)
131

CHAPTER 13. TAUTOG TAUTOGA ONITIS
Table 13.4: The number of tautog assigned to each total length-at-age category for 44 fish sampledfor operculum age determination in Virginia waters of Atlantic ocean during 2014.
AgeInterval 3 5 6 7 8 9 10 11 12 13 14 15 16 17 30 Totals
14 - 14.99 1 0 0 0 0 0 0 0 0 0 0 0 0 0 0 115 - 15.99 0 4 1 1 0 0 0 0 0 0 0 0 0 0 0 616 - 16.99 0 3 1 1 0 0 0 0 0 0 0 0 0 0 0 517 - 17.99 0 3 1 0 0 0 0 0 0 0 0 0 0 0 0 418 - 18.99 0 0 3 0 0 0 0 0 0 0 0 0 0 0 0 319 - 19.99 0 0 1 2 1 0 0 0 0 0 0 0 0 0 0 420 - 20.99 0 0 2 1 0 0 0 0 0 0 0 0 0 0 0 321 - 21.99 0 0 0 0 1 0 1 0 0 0 0 0 0 0 0 222 - 22.99 0 0 0 0 0 0 0 1 0 0 0 0 0 0 0 123 - 23.99 0 0 0 0 0 1 0 0 1 1 1 0 1 0 0 524 - 24.99 0 0 0 0 0 0 0 1 0 2 0 1 0 0 0 425 - 25.99 0 0 0 0 0 0 0 0 1 0 0 1 0 0 0 227 - 27.99 0 0 0 0 0 0 0 0 0 0 1 0 0 1 0 228 - 28.99 0 0 0 0 0 0 0 0 0 0 0 0 0 1 0 129 - 29.99 0 0 0 0 0 0 0 0 0 0 0 0 0 0 1 1
Totals 1 10 9 5 2 1 1 2 2 3 2 2 1 2 1 44(Go back to text)
132
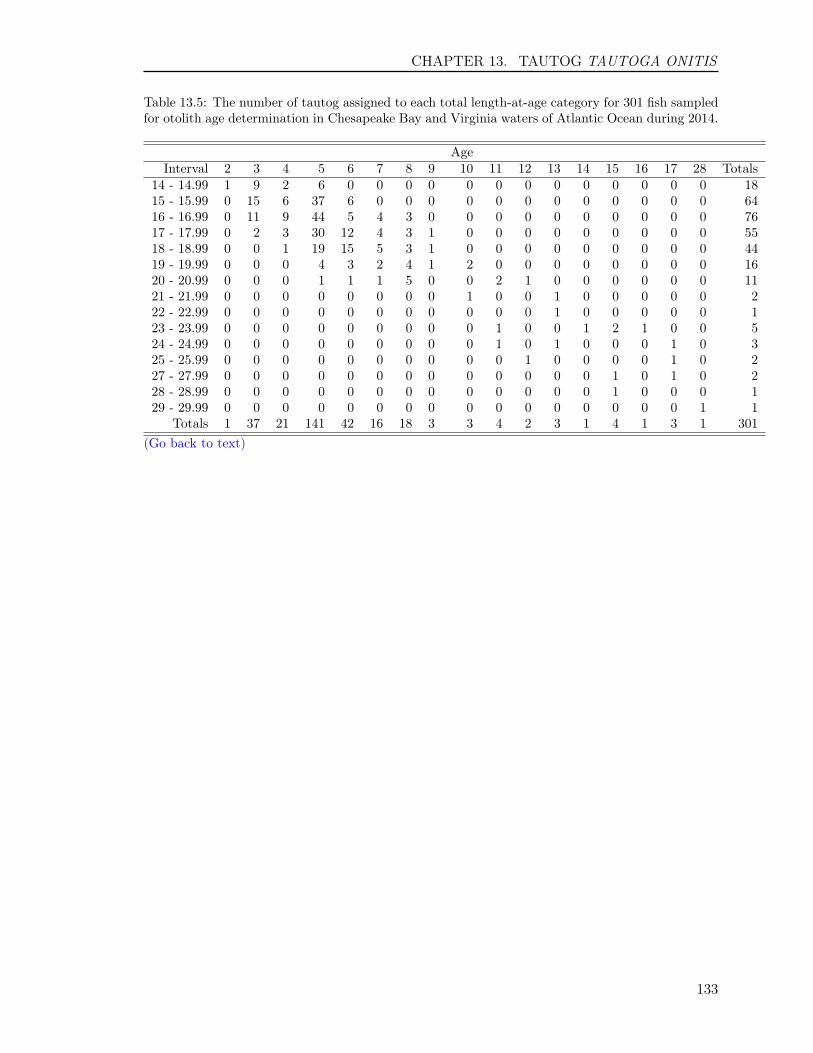
CHAPTER 13. TAUTOG TAUTOGA ONITIS
Table 13.5: The number of tautog assigned to each total length-at-age category for 301 fish sampledfor otolith age determination in Chesapeake Bay and Virginia waters of Atlantic Ocean during 2014.
AgeInterval 2 3 4 5 6 7 8 9 10 11 12 13 14 15 16 17 28 Totals
14 - 14.99 1 9 2 6 0 0 0 0 0 0 0 0 0 0 0 0 0 1815 - 15.99 0 15 6 37 6 0 0 0 0 0 0 0 0 0 0 0 0 6416 - 16.99 0 11 9 44 5 4 3 0 0 0 0 0 0 0 0 0 0 7617 - 17.99 0 2 3 30 12 4 3 1 0 0 0 0 0 0 0 0 0 5518 - 18.99 0 0 1 19 15 5 3 1 0 0 0 0 0 0 0 0 0 4419 - 19.99 0 0 0 4 3 2 4 1 2 0 0 0 0 0 0 0 0 1620 - 20.99 0 0 0 1 1 1 5 0 0 2 1 0 0 0 0 0 0 1121 - 21.99 0 0 0 0 0 0 0 0 1 0 0 1 0 0 0 0 0 222 - 22.99 0 0 0 0 0 0 0 0 0 0 0 1 0 0 0 0 0 123 - 23.99 0 0 0 0 0 0 0 0 0 1 0 0 1 2 1 0 0 524 - 24.99 0 0 0 0 0 0 0 0 0 1 0 1 0 0 0 1 0 325 - 25.99 0 0 0 0 0 0 0 0 0 0 1 0 0 0 0 1 0 227 - 27.99 0 0 0 0 0 0 0 0 0 0 0 0 0 1 0 1 0 228 - 28.99 0 0 0 0 0 0 0 0 0 0 0 0 0 1 0 0 0 129 - 29.99 0 0 0 0 0 0 0 0 0 0 0 0 0 0 0 0 1 1
Totals 1 37 21 141 42 16 18 3 3 4 2 3 1 4 1 3 1 301(Go back to text)
133
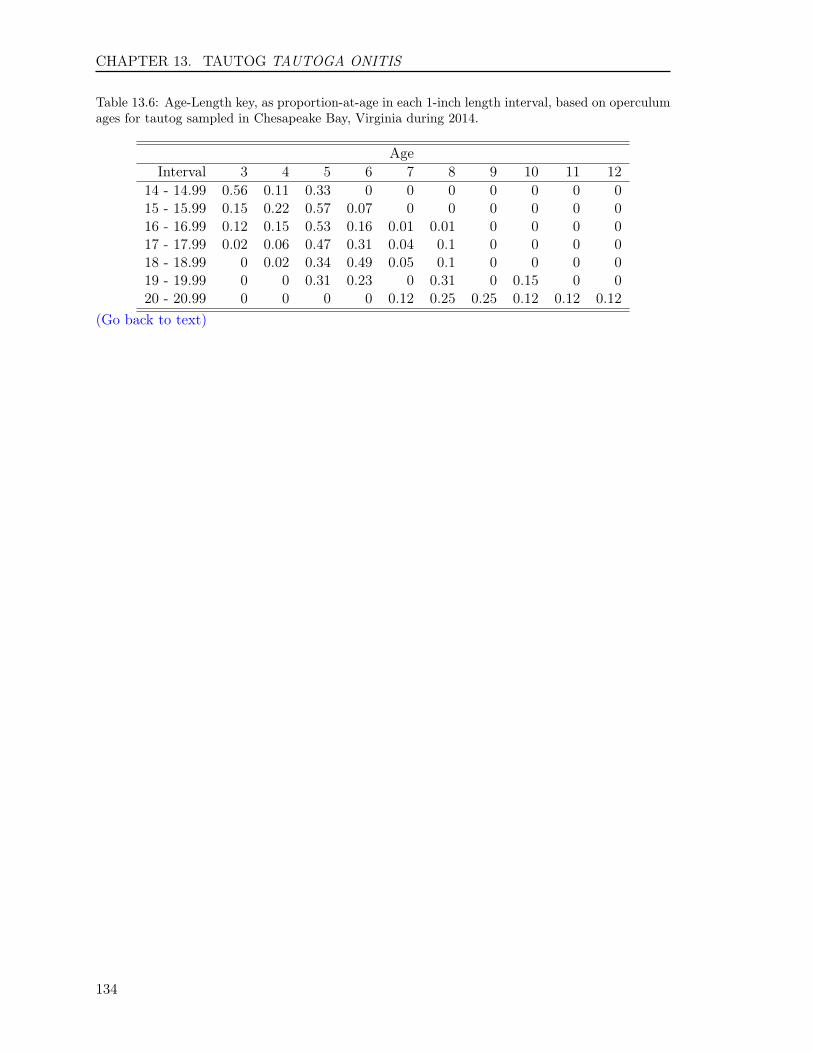
CHAPTER 13. TAUTOG TAUTOGA ONITIS
Table 13.6: Age-Length key, as proportion-at-age in each 1-inch length interval, based on operculumages for tautog sampled in Chesapeake Bay, Virginia during 2014.
AgeInterval 3 4 5 6 7 8 9 10 11 12
14 - 14.99 0.56 0.11 0.33 0 0 0 0 0 0 015 - 15.99 0.15 0.22 0.57 0.07 0 0 0 0 0 016 - 16.99 0.12 0.15 0.53 0.16 0.01 0.01 0 0 0 017 - 17.99 0.02 0.06 0.47 0.31 0.04 0.1 0 0 0 018 - 18.99 0 0.02 0.34 0.49 0.05 0.1 0 0 0 019 - 19.99 0 0 0.31 0.23 0 0.31 0 0.15 0 020 - 20.99 0 0 0 0 0.12 0.25 0.25 0.12 0.12 0.12
(Go back to text)
134

CHAPTER 13. TAUTOG TAUTOGA ONITIS
Tab
le13
.7:Age-Lengthkey,
asprop
ortion
-at-agein
each
1-inch
leng
thinterval,ba
sedon
operculum
ages
fortautog
sampled
inVirginiawatersof
theAtlan
ticOcean
during
2014.
Age
Interval
35
67
89
1011
1213
1415
1617
3014
-14.99
10
00
00
00
00
00
00
015
-15.99
00.67
0.17
0.17
00
00
00
00
00
016
-16.99
00.6
0.2
0.2
00
00
00
00
00
017
-17.99
00.75
0.25
00
00
00
00
00
00
18-18.99
00
10
00
00
00
00
00
019
-19.99
00
0.25
0.5
0.25
00
00
00
00
00
20-20.99
00
0.67
0.33
00
00
00
00
00
021
-21.99
00
00
0.5
00.5
00
00
00
00
22-22.99
00
00
00
01
00
00
00
023
-23.99
00
00
00.2
00
0.2
0.2
0.2
00.2
00
24-24.99
00
00
00
00.25
00.5
00.25
00
025
-25.99
00
00
00
00
0.5
00
0.5
00
027
-27.99
00
00
00
00
00
0.5
00
0.5
028
-28.99
00
00
00
00
00
00
01
029
-29.99
00
00
00
00
00
00
00
1(G
oba
ckto
text)
135


Chapter 14
WEAKFISH Cynoscion regalis

CHAPTER 14. WEAKFISH CYNOSCION REGALIS
14.1 INTRODUCTION
We aged a total of 295 weakfish, Cynoscionregalis, collected by the VMRC’s Biologi-cal Sampling Program for age and growthanalysis in 2014. The weakfish ages rangedfrom 1 to 6 years old with an average age of2.7, a standard deviation of 1, and a stan-dard error of 0.06. Six age classes (1 to6) were represented, comprising fish of the2008 to 2013 year-classes. The sample wasdominated by fish from the year-classes of2011 and 2012 with 38.3% and 32.9%, re-spectively.
14.2 METHODS
14.2.1 Sample size for ageing
We estimated sample size for ageing weak-fish in 2014 using a two-stage random sam-pling method (Quinn and Deriso 1999) toincrease precision in estimates of age com-position from fish sampled efficiently andeffectively. The basic equation is:
A =Va
θ2aCV2 +Ba/L
(14.1)
where A is the sample size for ageing weak-fish in 2014; θa stands for the proportionof age a fish in a catch. Va and Ba repre-sent variance components within and be-tween length intervals for age a, respec-tively; CV is the coefficient of variation; Lwas the total number of weakfish used byVMRC to estimate length distribution ofthe catches from 2008 to 2012. θa, Va, Ba,and CV were calculated using pooled age-length data of weakfish collected from 2008to 2012 and using equations in Quinn andDeriso (1999). For simplicity, the equationsare not listed here. The equation (14.1) in-dicates that the more fish that are aged,the smaller the CV (or higher precision)that will be obtained. Therefore, the cri-terion to age A (number) of fish is that A
should be a number above which there isonly a 1% CV reduction for the most ma-jor age in catch by aging an additional 100or more fish. Finally, Al is A multipliedby the proportion of length interval l fromthe length distribution of the 2008 to 2012catch. Al is number of fish to be aged forlength interval l in 2014.
14.2.2 Handling of collections
Otoliths were received by the Age &Growth Laboratory in labeled coin en-velopes, and were sorted by date of capture.Their envelope labels were verified againstVMRC’s collection data, and each fish wasassigned a unique Age and Growth Labo-ratory identification number. All otolithswere stored dry in their original labeledcoin envelopes.
14.2.3 Preparation
Sagittal otoliths, hereafter, referred to as"otoliths", were processed for age deter-mination following the methods describedin Lowerre-Barbieri et al. (1994) with afew modifications. The left or right otolithwas randomly selected and attached, dis-tal side down, to a glass slide with clearCrystalbondTM 509 adhesive. The otolithswere viewed by eye and, when necessary,under a stereo microscope to identify thelocation of the core, and the position ofthe core was marked using a pencil acrossthe otolith surface. At least one trans-verse cross-section (hereafter, referred toas "thin-section") was then removed fromthe marked core of each otolith using aBuehler IsoMetTM low-speed saw equippedwith two, 3-inch diameter, Norton diamondgrinding wheels (hereafter, referred to as"blades"), separated by a stainless steelspacer of 0.5 mm (diameter 2.5"). Thin-sections were placed on labeled glass slidesand covered with a thin layer of Flo-texx
138
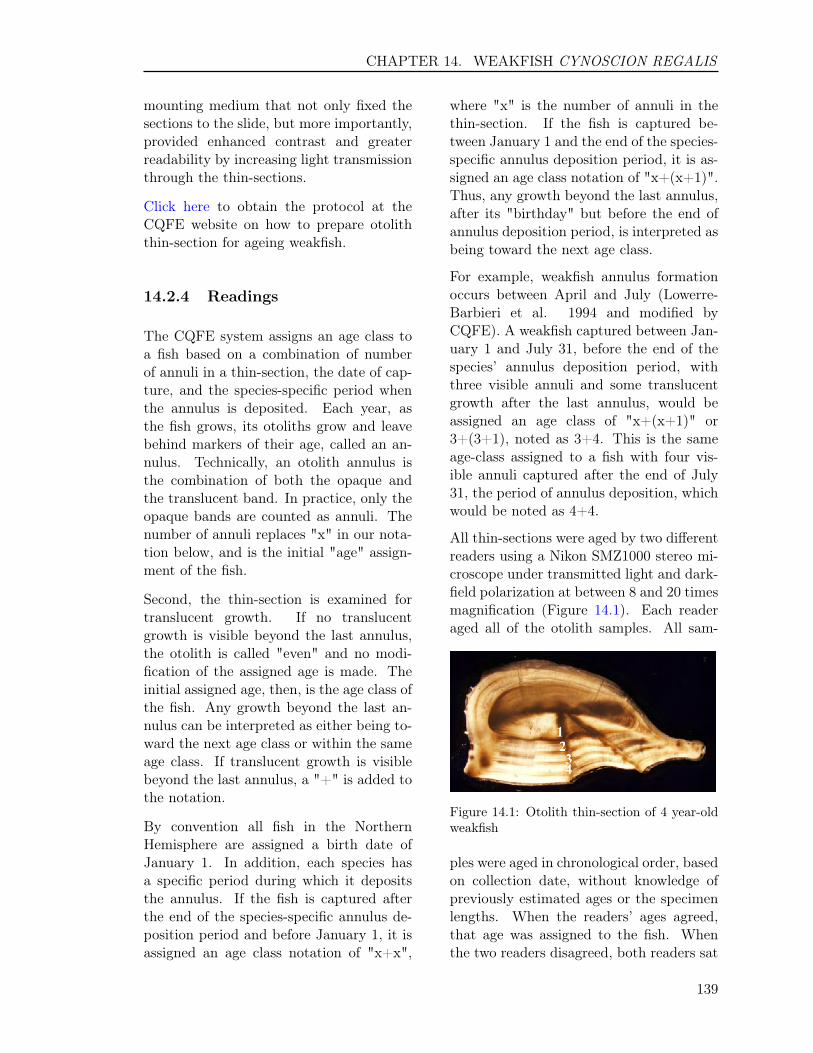
CHAPTER 14. WEAKFISH CYNOSCION REGALIS
mounting medium that not only fixed thesections to the slide, but more importantly,provided enhanced contrast and greaterreadability by increasing light transmissionthrough the thin-sections.
Click here to obtain the protocol at theCQFE website on how to prepare otoliththin-section for ageing weakfish.
14.2.4 Readings
The CQFE system assigns an age class toa fish based on a combination of numberof annuli in a thin-section, the date of cap-ture, and the species-specific period whenthe annulus is deposited. Each year, asthe fish grows, its otoliths grow and leavebehind markers of their age, called an an-nulus. Technically, an otolith annulus isthe combination of both the opaque andthe translucent band. In practice, only theopaque bands are counted as annuli. Thenumber of annuli replaces "x" in our nota-tion below, and is the initial "age" assign-ment of the fish.
Second, the thin-section is examined fortranslucent growth. If no translucentgrowth is visible beyond the last annulus,the otolith is called "even" and no modi-fication of the assigned age is made. Theinitial assigned age, then, is the age class ofthe fish. Any growth beyond the last an-nulus can be interpreted as either being to-ward the next age class or within the sameage class. If translucent growth is visiblebeyond the last annulus, a "+" is added tothe notation.
By convention all fish in the NorthernHemisphere are assigned a birth date ofJanuary 1. In addition, each species hasa specific period during which it depositsthe annulus. If the fish is captured afterthe end of the species-specific annulus de-position period and before January 1, it isassigned an age class notation of "x+x",
where "x" is the number of annuli in thethin-section. If the fish is captured be-tween January 1 and the end of the species-specific annulus deposition period, it is as-signed an age class notation of "x+(x+1)".Thus, any growth beyond the last annulus,after its "birthday" but before the end ofannulus deposition period, is interpreted asbeing toward the next age class.
For example, weakfish annulus formationoccurs between April and July (Lowerre-Barbieri et al. 1994 and modified byCQFE). A weakfish captured between Jan-uary 1 and July 31, before the end of thespecies’ annulus deposition period, withthree visible annuli and some translucentgrowth after the last annulus, would beassigned an age class of "x+(x+1)" or3+(3+1), noted as 3+4. This is the sameage-class assigned to a fish with four vis-ible annuli captured after the end of July31, the period of annulus deposition, whichwould be noted as 4+4.
All thin-sections were aged by two differentreaders using a Nikon SMZ1000 stereo mi-croscope under transmitted light and dark-field polarization at between 8 and 20 timesmagnification (Figure 14.1). Each readeraged all of the otolith samples. All sam-
Figure 14.1: Otolith thin-section of 4 year-oldweakfish
ples were aged in chronological order, basedon collection date, without knowledge ofpreviously estimated ages or the specimenlengths. When the readers’ ages agreed,that age was assigned to the fish. Whenthe two readers disagreed, both readers sat
139
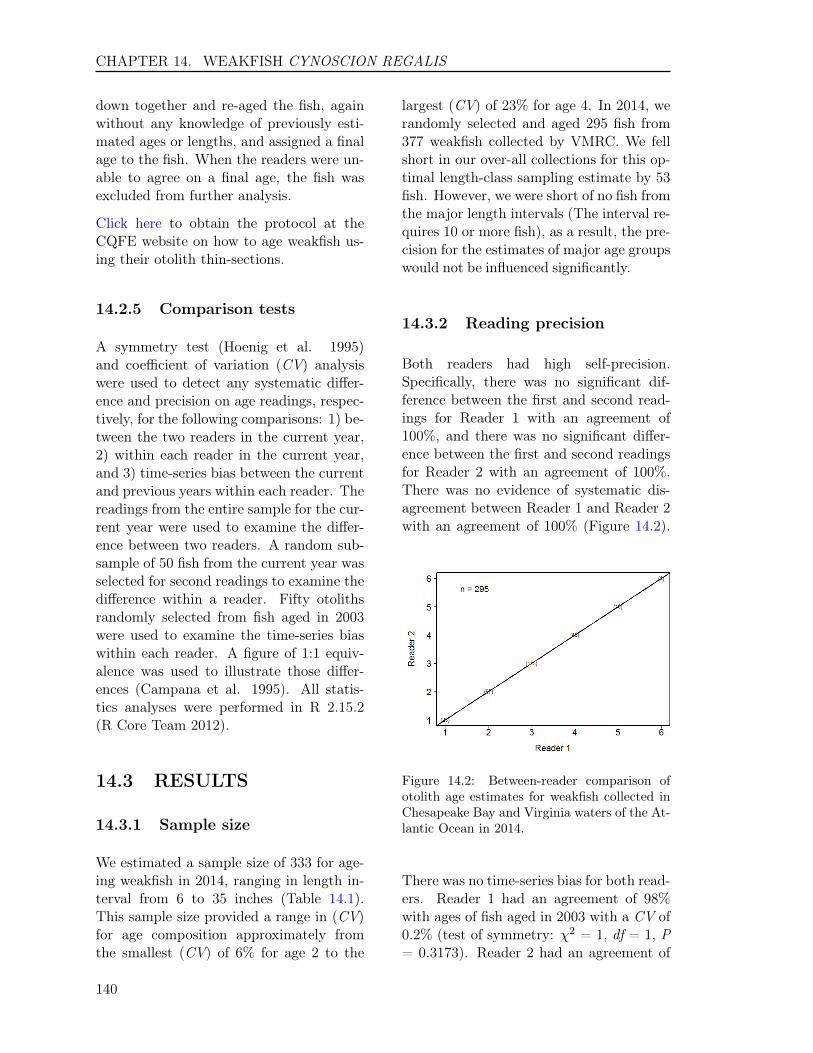
CHAPTER 14. WEAKFISH CYNOSCION REGALIS
down together and re-aged the fish, againwithout any knowledge of previously esti-mated ages or lengths, and assigned a finalage to the fish. When the readers were un-able to agree on a final age, the fish wasexcluded from further analysis.
Click here to obtain the protocol at theCQFE website on how to age weakfish us-ing their otolith thin-sections.
14.2.5 Comparison tests
A symmetry test (Hoenig et al. 1995)and coefficient of variation (CV) analysiswere used to detect any systematic differ-ence and precision on age readings, respec-tively, for the following comparisons: 1) be-tween the two readers in the current year,2) within each reader in the current year,and 3) time-series bias between the currentand previous years within each reader. Thereadings from the entire sample for the cur-rent year were used to examine the differ-ence between two readers. A random sub-sample of 50 fish from the current year wasselected for second readings to examine thedifference within a reader. Fifty otolithsrandomly selected from fish aged in 2003were used to examine the time-series biaswithin each reader. A figure of 1:1 equiv-alence was used to illustrate those differ-ences (Campana et al. 1995). All statis-tics analyses were performed in R 2.15.2(R Core Team 2012).
14.3 RESULTS
14.3.1 Sample size
We estimated a sample size of 333 for age-ing weakfish in 2014, ranging in length in-terval from 6 to 35 inches (Table 14.1).This sample size provided a range in (CV)for age composition approximately fromthe smallest (CV) of 6% for age 2 to the
largest (CV) of 23% for age 4. In 2014, werandomly selected and aged 295 fish from377 weakfish collected by VMRC. We fellshort in our over-all collections for this op-timal length-class sampling estimate by 53fish. However, we were short of no fish fromthe major length intervals (The interval re-quires 10 or more fish), as a result, the pre-cision for the estimates of major age groupswould not be influenced significantly.
14.3.2 Reading precision
Both readers had high self-precision.Specifically, there was no significant dif-ference between the first and second read-ings for Reader 1 with an agreement of100%, and there was no significant differ-ence between the first and second readingsfor Reader 2 with an agreement of 100%.There was no evidence of systematic dis-agreement between Reader 1 and Reader 2with an agreement of 100% (Figure 14.2).
Figure 14.2: Between-reader comparison ofotolith age estimates for weakfish collected inChesapeake Bay and Virginia waters of the At-lantic Ocean in 2014.
There was no time-series bias for both read-ers. Reader 1 had an agreement of 98%with ages of fish aged in 2003 with a CV of0.2% (test of symmetry: χ2 = 1, df = 1, P= 0.3173). Reader 2 had an agreement of
140
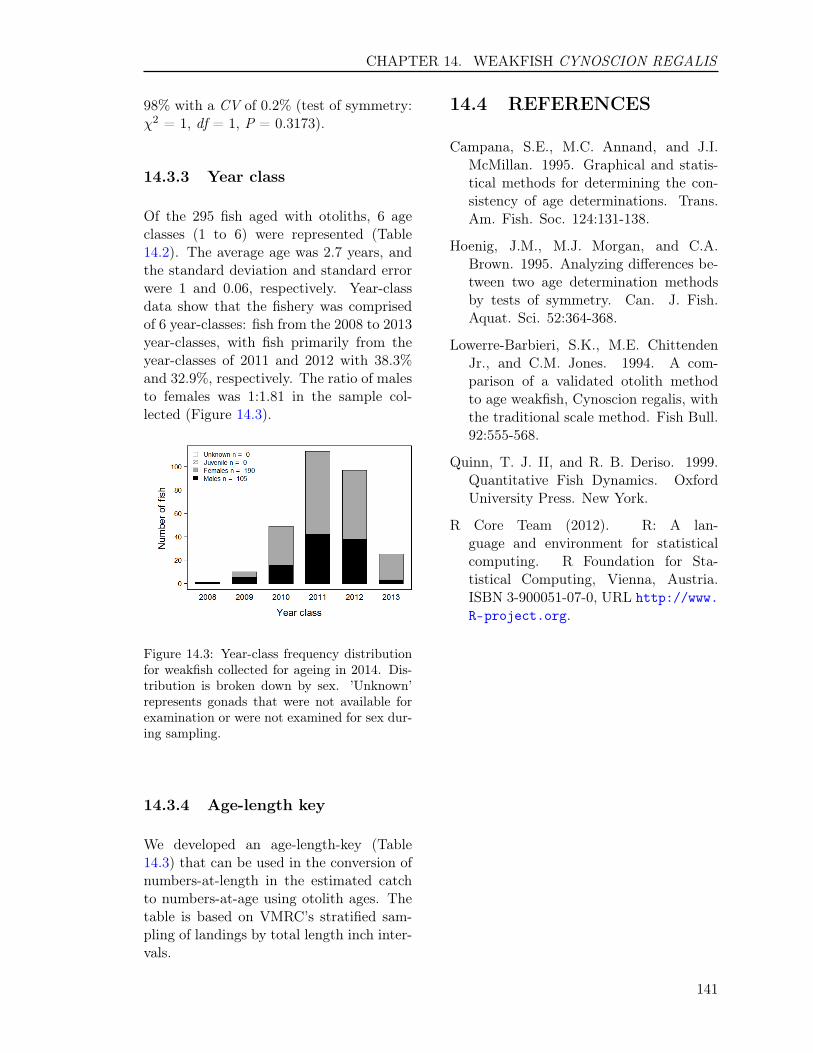
CHAPTER 14. WEAKFISH CYNOSCION REGALIS
98% with a CV of 0.2% (test of symmetry:χ2 = 1, df = 1, P = 0.3173).
14.3.3 Year class
Of the 295 fish aged with otoliths, 6 ageclasses (1 to 6) were represented (Table14.2). The average age was 2.7 years, andthe standard deviation and standard errorwere 1 and 0.06, respectively. Year-classdata show that the fishery was comprisedof 6 year-classes: fish from the 2008 to 2013year-classes, with fish primarily from theyear-classes of 2011 and 2012 with 38.3%and 32.9%, respectively. The ratio of malesto females was 1:1.81 in the sample col-lected (Figure 14.3).
Figure 14.3: Year-class frequency distributionfor weakfish collected for ageing in 2014. Dis-tribution is broken down by sex. ’Unknown’represents gonads that were not available forexamination or were not examined for sex dur-ing sampling.
14.3.4 Age-length key
We developed an age-length-key (Table14.3) that can be used in the conversion ofnumbers-at-length in the estimated catchto numbers-at-age using otolith ages. Thetable is based on VMRC’s stratified sam-pling of landings by total length inch inter-vals.
14.4 REFERENCES
Campana, S.E., M.C. Annand, and J.I.McMillan. 1995. Graphical and statis-tical methods for determining the con-sistency of age determinations. Trans.Am. Fish. Soc. 124:131-138.
Hoenig, J.M., M.J. Morgan, and C.A.Brown. 1995. Analyzing differences be-tween two age determination methodsby tests of symmetry. Can. J. Fish.Aquat. Sci. 52:364-368.
Lowerre-Barbieri, S.K., M.E. ChittendenJr., and C.M. Jones. 1994. A com-parison of a validated otolith methodto age weakfish, Cynoscion regalis, withthe traditional scale method. Fish Bull.92:555-568.
Quinn, T. J. II, and R. B. Deriso. 1999.Quantitative Fish Dynamics. OxfordUniversity Press. New York.
R Core Team (2012). R: A lan-guage and environment for statisticalcomputing. R Foundation for Sta-tistical Computing, Vienna, Austria.ISBN 3-900051-07-0, URL http://www.R-project.org.
141
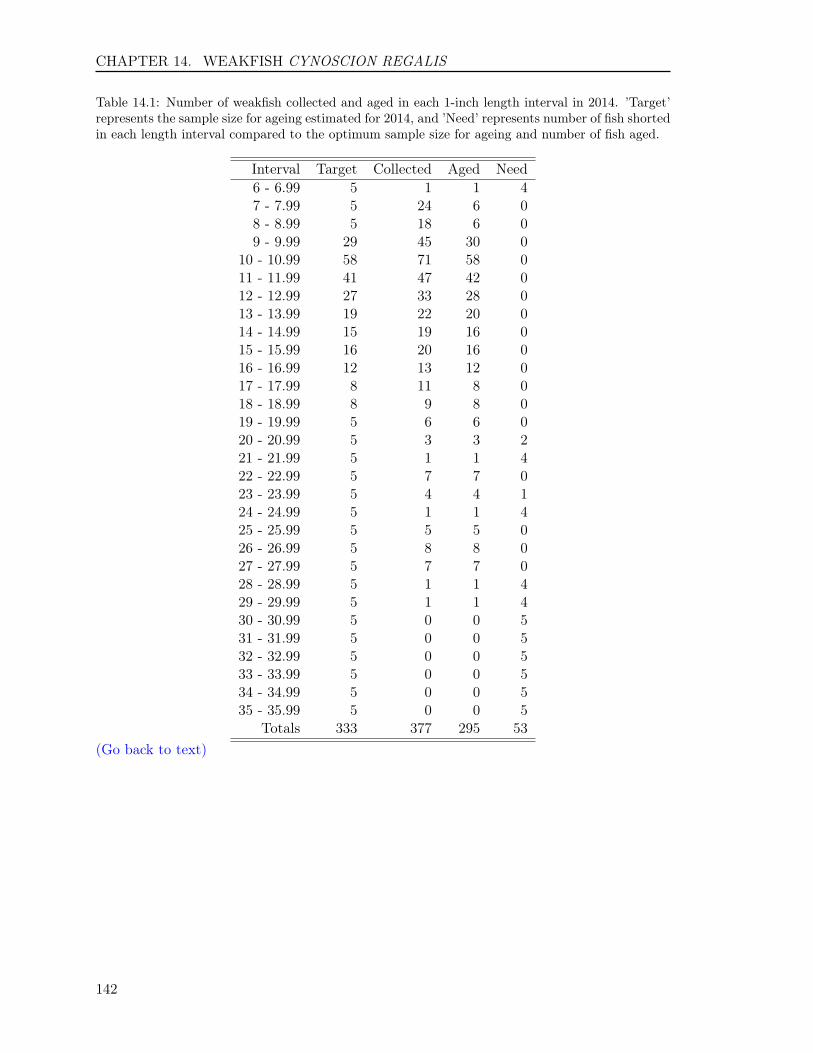
CHAPTER 14. WEAKFISH CYNOSCION REGALIS
Table 14.1: Number of weakfish collected and aged in each 1-inch length interval in 2014. ’Target’represents the sample size for ageing estimated for 2014, and ’Need’ represents number of fish shortedin each length interval compared to the optimum sample size for ageing and number of fish aged.
Interval Target Collected Aged Need6 - 6.99 5 1 1 47 - 7.99 5 24 6 08 - 8.99 5 18 6 09 - 9.99 29 45 30 0
10 - 10.99 58 71 58 011 - 11.99 41 47 42 012 - 12.99 27 33 28 013 - 13.99 19 22 20 014 - 14.99 15 19 16 015 - 15.99 16 20 16 016 - 16.99 12 13 12 017 - 17.99 8 11 8 018 - 18.99 8 9 8 019 - 19.99 5 6 6 020 - 20.99 5 3 3 221 - 21.99 5 1 1 422 - 22.99 5 7 7 023 - 23.99 5 4 4 124 - 24.99 5 1 1 425 - 25.99 5 5 5 026 - 26.99 5 8 8 027 - 27.99 5 7 7 028 - 28.99 5 1 1 429 - 29.99 5 1 1 430 - 30.99 5 0 0 531 - 31.99 5 0 0 532 - 32.99 5 0 0 533 - 33.99 5 0 0 534 - 34.99 5 0 0 535 - 35.99 5 0 0 5
Totals 333 377 295 53(Go back to text)
142

CHAPTER 14. WEAKFISH CYNOSCION REGALIS
Table 14.2: The number of weakfish assigned to each total length-at-age category for 295 fish sampledfor otolith age determination in Virginia during 2014.
AgeInterval 1 2 3 4 5 6 Totals6 - 6.99 1 0 0 0 0 0 17 - 7.99 6 0 0 0 0 0 68 - 8.99 3 3 0 0 0 0 69 - 9.99 5 23 2 0 0 0 30
10 - 10.99 7 29 21 1 0 0 5811 - 11.99 1 15 23 3 0 0 4212 - 12.99 1 12 12 3 0 0 2813 - 13.99 1 7 9 3 0 0 2014 - 14.99 0 2 8 6 0 0 1615 - 15.99 0 3 7 6 0 0 1616 - 16.99 0 1 10 1 0 0 1217 - 17.99 0 0 3 5 0 0 818 - 18.99 0 1 5 2 0 0 819 - 19.99 0 1 2 3 0 0 620 - 20.99 0 0 3 0 0 0 321 - 21.99 0 0 1 0 0 0 122 - 22.99 0 0 4 3 0 0 723 - 23.99 0 0 2 2 0 0 424 - 24.99 0 0 0 1 0 0 125 - 25.99 0 0 1 2 2 0 526 - 26.99 0 0 0 6 2 0 827 - 27.99 0 0 0 2 5 0 728 - 28.99 0 0 0 0 0 1 129 - 29.99 0 0 0 0 1 0 1
Totals 25 97 113 49 10 1 295(Go back to text)
143

CHAPTER 14. WEAKFISH CYNOSCION REGALIS
Table 14.3: Age-Length key, as proportion-at-age in each 1-inch length interval, based on otolithages for weakfish sampled for age determination in Virginia during 2014.
AgeInterval 1 2 3 4 5 66 - 6.99 1 0 0 0 0 07 - 7.99 1 0 0 0 0 08 - 8.99 0.5 0.5 0 0 0 09 - 9.99 0.17 0.77 0.07 0 0 0
10 - 10.99 0.12 0.5 0.36 0.02 0 011 - 11.99 0.02 0.36 0.55 0.07 0 012 - 12.99 0.04 0.43 0.43 0.11 0 013 - 13.99 0.05 0.35 0.45 0.15 0 014 - 14.99 0 0.12 0.5 0.38 0 015 - 15.99 0 0.19 0.44 0.38 0 016 - 16.99 0 0.08 0.83 0.08 0 017 - 17.99 0 0 0.38 0.62 0 018 - 18.99 0 0.12 0.62 0.25 0 019 - 19.99 0 0.17 0.33 0.5 0 020 - 20.99 0 0 1 0 0 021 - 21.99 0 0 1 0 0 022 - 22.99 0 0 0.57 0.43 0 023 - 23.99 0 0 0.5 0.5 0 024 - 24.99 0 0 0 1 0 025 - 25.99 0 0 0.2 0.4 0.4 026 - 26.99 0 0 0 0.75 0.25 027 - 27.99 0 0 0 0.29 0.71 028 - 28.99 0 0 0 0 0 129 - 29.99 0 0 0 0 1 0
(Go back to text)
144