virgo off-line activity:data flow, data distribution and ...morandin/comm/com_i_sintesi.pdfvirgo...
TRANSCRIPT
1 Fulvio Ricci
VIRGO off-line activity:data flow, datadistribution and computational problem
Fulvio Ricci
Dipartimento di Fisica Università di Roma La Sapienza
&
I.N.F.N. Sezione di Roma

2 Fulvio Ricci
Outlin e
l Virgo: detector complexity and constraints fordata acquisition and analysis
l The Virgo on-line software, the data flow anddata distribution
l Off-line computing: the data Analysis– The general strategy for G.W. data analysis
– Main examples of data analysisl Search of signals from Coalescent binary starsl Full sky neutron stars searchl Stochastic background
l Computing necessities and Conclusion

3 Fulvio Ricci
Detector Complexity Constraints
l VIRGO has many different sub-systems(vacuum, laser, suspensions, DAQ,...)
⇒ separate R&D test, commissioning -> modularity
l VIRGO is a set of feedback loops⇒ main feedback loop (mirror pos.): sampling @ 10 kHz.
⇒ main physics signal (h): sampling @ 20 kHz
⇒ the controls and the ‘physics’ are strongly coupled
⇒ the data acquisition spies the detector
⇒ on-line/off line software should follow the same design principle and obey thesame quality criteria

4 Fulvio Ricci
Detector Size Constraints
l Experiment distributed over 4 buildings up to 3km apartexample:
The Photodiode signals have
to be globally correlated
to compute the mirror positions
and act on them in real time
⇒ data transmission issues (timing, synchronisation, protocol,...)
⇒ networking issues
⇒ digital feed back loop
Laser
Photodiodes Locations
(3 buildings)
ReadoutReadout
Readout
5 Fulvio Ricci
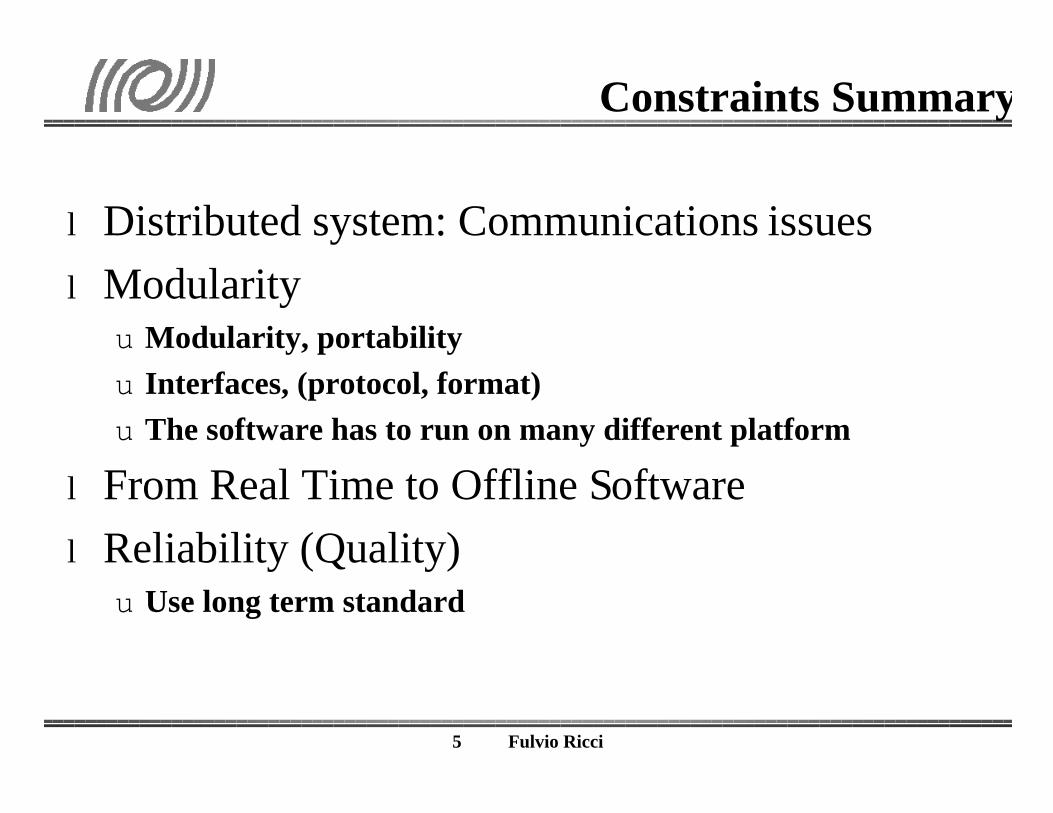
Constraints Summary
l Distributed system: Communications issues
l Modularityu Modularity, portabilityu Interfaces, (protocol, format)u The software has to run on many different platform
l From Real Time to Offline Software
l Reliability (Quality)u Use long term standard

6 Fulvio Ricci
Data Collection and data flow

7 Fulvio Ricci
Raw data Processed data Selected dataFlow/s 4.0 MB .3 MB .34 MB (1%)
.7 MB (10%)
Flow/day 350 GB 26 GB 30 G B (1%)60 GB (10%)
Flow/year 126 TB 9.5 TB 11 TB (1%)22 TB (10%)
Tapes/year (50 GBDLT)
2500 190 220 (1%)440 (10%)
Data flow

8 Fulvio Ricci
Data Distributio n

9 Fulvio Ricci
Data analysis
1 10 100 1000 1000010
-26
10-25
10-24
10-23
10-22
10-21
10-20
10-19
10-18
10-17
10-16
10-15
Magnetic Creep
Acoustic Newtonian (Thorne) Newtonian (Cella)
Total Seismic ∆α-δP coupling Thermal Total Thermal Mirror Shot Noise Radiation Pressure Quantum Limit
h [1/sqrt(Hz)]
Frequency [Hz]
The Spectral sensitivity curve of Virgo: Sh(f) 1/2 vs. f

10 Fulvio Ricci
Data analysis: a basic concept
The detector output o(t) is the sum of the signal h(t) and the noise n(t) :o(t)=h(t)+n(t)
The “matched filter” is a linear technique of “patter-matching” that permits toenhance the signal to the respect of the noise by optimizing the Signal toNoise ratio (SNR).To apply this technique we need as filter input-An hypothesis concerning the form of the signal (or its Fourier transform)H(f)-The spectral properties of the noise S(f)
Thus, it can be demonstrated that the optimum filter output c(t) is
c(t)=k ∫ exp(i2π f t) H*(f) [ O(f) / S(f) ] d f
Basic Concept in the G. W. data analysis: the Linear Optimum Filter

11 Fulvio Ricci
The filter acts on both signal and noise so that the filter variable c is the sum ofthe filtered noise N and the filtered signal S. Thus, the analytical expression ofc(t) is derived by imposing the maximisation condition to the SNR filteringfunction
SNR = <c,h> 2/<c,c> =
=∫ C* (f) [H(f)/S(f)]df 2 ∫ [(C*(f)C(f))/S(f)] df = O(c,h) <h,h>
where
O (c,h) = <c,h> 2 / (<h,h> <c,c>) 1/2
…a basic concept
In the time domain the filter corresponds to the convolution of theoutput with the waveform function. In a discrete domain
c(t) = Σj w(t-j) o(j)
where the index j spans from the past to the future (no causality) and wis the filter weight defined by the detector noise and signal model.

12 Fulvio Ricci
Data Analysis
Application ofthe optimum
filter to the dataof the Garching
(Germany)interferometer.
Here a short burstsignal has been
added to the dataand the filter is
designed for a δ-like function
Band limited output
Filter variablederived from the
above output signal
13 Fulvio Ricci
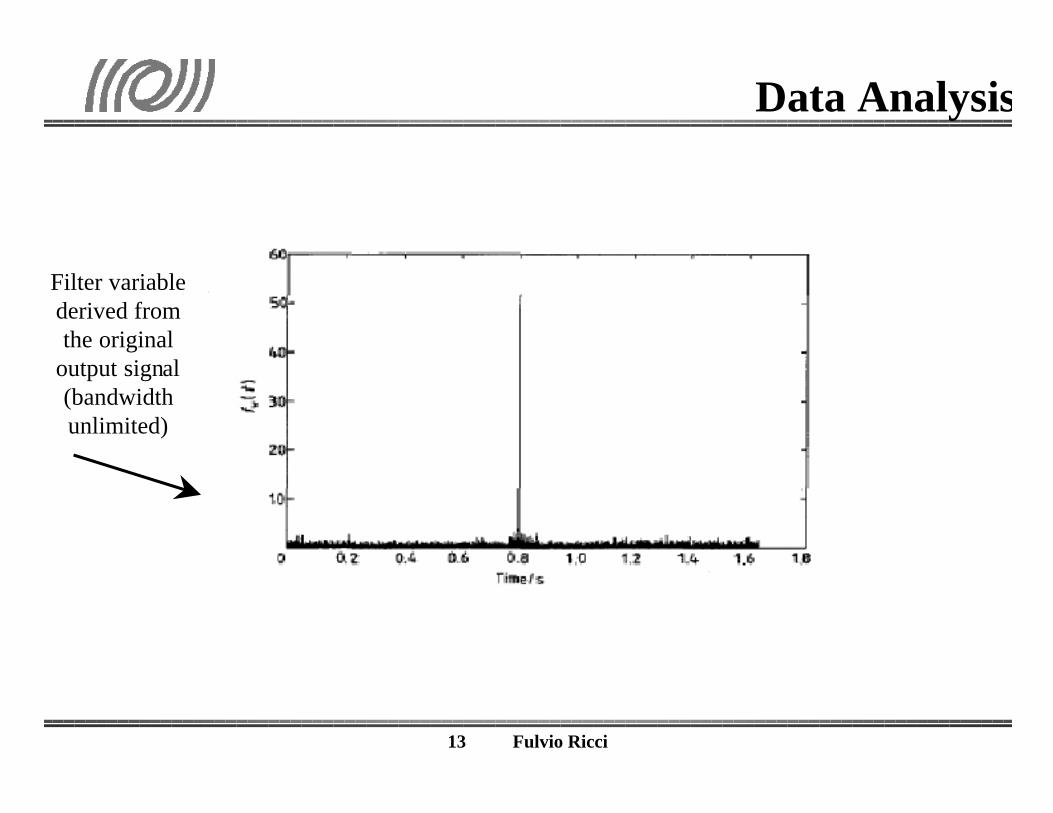
Data Analysis
Filter variablederived fromthe original
output signal(bandwidthunlimited)

14 Fulvio Ricci
Data Analysis
Data Analysis Items-simulation-noise studies-h reconstruction-search for bursts from Supernovae explosions-Pulsars in binary systems-stochastic background signal- ………….-coincidences among different detectors and G.W. network analysis
Signal search based on high demanding computing task:
-Signal from Coalescent binary systems
-Continuos signals from Neutron Stars

15 Fulvio Ricci
Coalescent binary system
Two compact stars are rotating one torespect of the other while the orbital radiusis decreasing progressively up to the finalstable orbit.
Coalescent binary system
h(t)
time

16 Fulvio Ricci
The CHIRP(expected signal from a coalescent binary system)
h(t) = (A/r) M (πM F) 2/3 e-iΦ(t) with
Φ(t)= Φc – (1/16) [256 (tc-t)/(5M)]5/8
where
M=[(m1 m2 )3/5 / (m1+m2) 1/5]F(t) = (1/πM) [5M / 256 (tc-t)]3/8
Φc tc phase and time of coalescence Ë F(tc) = ∞Φ(t) = 2 π ∫ F(t') dt'
The Fourier transform of h(t)H(f) = [(30 π)1/2/ 24] [A M2/r] (πM f)–7/6 eiψ
with
ψ = 2 π f tc – Φc – π/4 + (3/128) (πM f)–5/3

17 Fulvio Ricci
.. Coalescent binary system
SNR fmin-7/6
The chirp is tracked during its evolutionfor a time Tchirp
Tchirp = 2.9 (100/ fmin ) 8/3
LIGO I fmin ~ 100 Hz Tchirp ~ 3 s
VIRGO f min ~ 10 Hz Tchirp ~ 1400 s
SNRVIRGO/SNR LIGO I ~ 15 2
Longer waveform Template, HigherComputing Power !

18 Fulvio Ricci
HOW MANY TEMPLATES?
This number depends on the dimensions of the parameter space andits discretization. The choice of the metric of the parameter space isbased on the optimization of the event detection probability. To compute the values we assumed that the event areuniformly distributed in the parameter space and the eventnumber is proportional to the ratio (SNR/ SNRmax)3
A bank of templates with 40 Hz cut off costs 450 Gflops and 1.1Tword with 15% of event lossA factor 3 in computing power and a factor 30 in memory isrequired to lose less than 10 % in events

19 Fulvio Ricci
Results in [ ] are for a standard one step search strategy
Resultsfmin(Hz) M/Mo P (flops) S (words) Events
20 0.25 1.5 [1.8] *1012 3.2 [24] *1013 90.7 %20 0.5 3.0 [3.6] *1011 2.2 [16] *1012 90.7 %20 1.0 5.6 [6.7] *1010 1.4 [3.6] *1011 90.7%30 0.25 8.5 [10] *1011 6.4 [49] *1011 88.7%30 0.5 1.6 [2.0] *1011 4.4 [32] *1011 88.7%30 1.0 3.1 [3.7] *1010 3.0 [21] *1010 88.7%40 0.25 4.5 [6.0] *1011 1.1 [14] *1012 85.1%40 0.5 8.6 [1.1] *1010 7.4 [88] *1010 85.1%40 1.0 1.7 [2.1] *1010 5.0 [57] *109 85.1 %

20 Fulvio Ricci
CONTINUOUS SIGNAL(G.W. emission from asymmetric Neutron stars)
Periodic gravitational waves are emitted in many processes involving singlestars or binary systems. For a single rotating deformed star the gravitationalsignal emitted is:
h(t) = ho cos (2 Ω t)Ω: angular velocity of the star
ho = (4 G / c 4 δ ) I Ω 2 εI momentum of inertia; ε ellipticity; δ distance
We are interested in periodic sources radiating in the Virgo sensitivity band.These involve compact stars, namely NEUTRON STARS.
About 109 NEUTRON STARS are expected to exist in the Galaxy, but on
~ 1000 have been detected, most as PULSARS.
Neutron stars

21 Fulvio Ricci
Neutron starsPulsar spin-downIt can be due to many causes, among which emission of electromagnetic radiation and,hopefully, gravitational radiation.If the loss mechanisms of the star is just the G.W. emission, the neutron star ellipticity is
εmax = 1.9 10 5 [( df / dt ) / f 5 ] 1/2
where, f is the rotation frequency and I ~ 10 38 kg m 2 the momentum of inertia of the star
ho~1 10 -27 (I /10 38 kg m 2) (f /100 Hz)2 (10 kpc/ δ ) (εmax / 10 -6)
LESSON: search at lower distances (full sky ~ 4 π solid angle) and inthe high frequency region
h ~ 10 -26

22 Fulvio Ricci
[df/dt ] vs. f
23 Fulvio Ricci
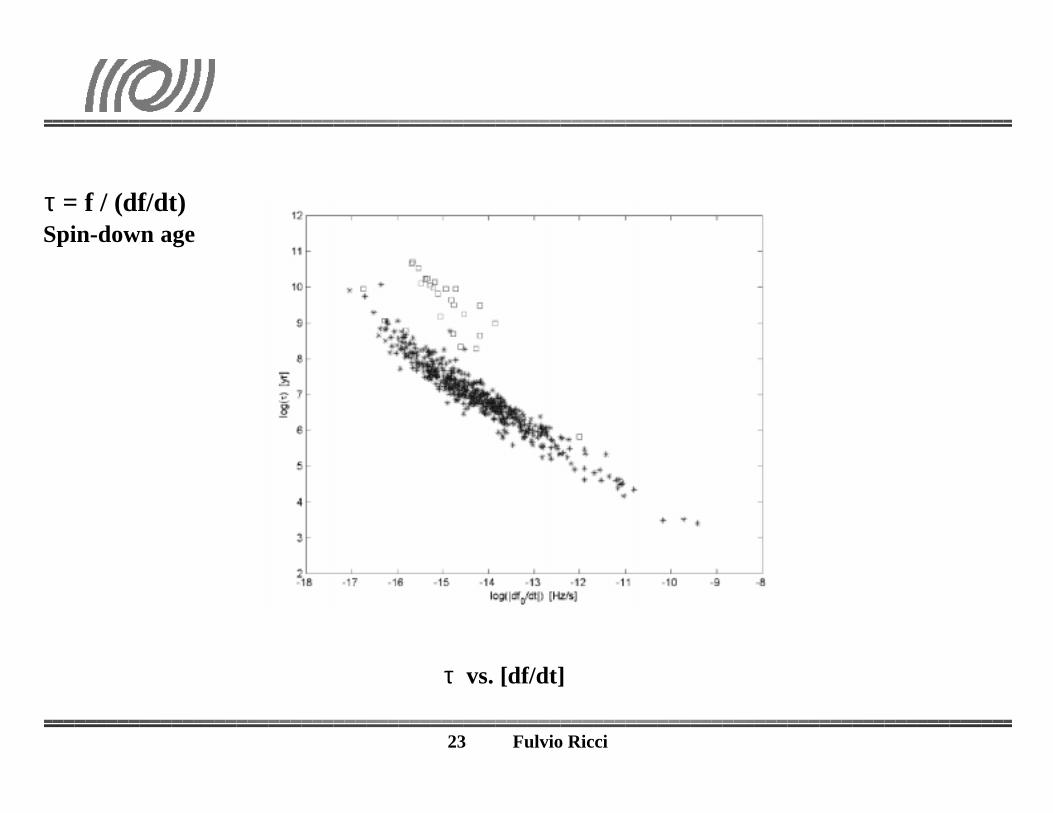
τ vs. [df/dt]
τ = f / (df/dt) Spin-down age

24 Fulvio Ricci

25 Fulvio Ricci

26 Fulvio Ricci
…Neutron StarsBasically the analysis is developed by using the coordinates of the SOLAR SYSTEMREFERENCE frame ("SSB frame")Hypothesis about the signal wave form: the signal is quasi monochromatic because of
-the slowing down of the source ("spin down" parameters)
-the relative motion of the source and the detector (the Doppler correction depends onthe position of the source in the sky)
The time evolution of the intrinsic frequency of the signal is
f (t) = fo ( 1+ v . n /c) ( 1 + Σ fk t k )
v detector velocity , n unity vector of the detector - source direction, fk spin downparameters, fo source intrinsic frequency, f (t) observed frequency
v(t) = vrev (t) + vrot (t) < vrev> ~ 32 km/s ~100 < vrev >
Maximum Doppler shift ∆fmax ~ 10-4 fo

27 Fulvio Ricci
….Neutron Stars
The full sky signal search based on the optimum linear strategy
- The expected signal on the Earth is quasi monochromatic.In order to reduce the search problem to that of a pure monochromatic signal, we have toimpose to the data the Doppler correction. Thus, we need divide the sky in patches and foreach frequency we apply the Doppler correction.
- Then we have just to perform FFT on strecths of data as long as possible ( 1/ Tobs). This isequivalent in the time domain to apply to the data an time integration equal to theobservation time Tobs.
In this way we have for the SNR
SNR ~ 1 10 -21 (I /10 38 kg m 2) f 2ε (1 kpc/δ) (Tobs /1yr )1/2 (1/ Sh)1/2
ε∼ 10 -6 ; Sh1/2 ∼ 10 -23 [1/Hz] ; f ~ 500 Hz : SNR ~ 25

28 Fulvio Ricci
….Neutron StarWe need to divide the sky in patches . How many of them ?This depends on the angular resolution of the detector ∆Θ that is a function of the observedfrequency and it improves with the observation time Tobs.
Npatch = 1.3 10 13 (f / 1 kHz) 2 (Tobs / 10 7) 4For a given frequency f and bandwidth ∆f the dimension of the data set to be considered isis immediately derived in function of Tobs
We assume that the computation time is equal to Tobs , and we derive the number of floatingpoint operations Nflop to be performed for the linear optimum strategy and the neededcomputing power Pc.
Nflop = 2 10 10 (f / 1 kHz) (Tobs / 10 10 )
Pc [Mflop] = 5 10 20 (f / 1 kHz) 2 (Tobs ) 4
Tobs = 72 hours ==>> 200 Mflop Tobs = 1 year ==>> 5 1010 Tflop
Conclusion: we must abandon the linear optimum strategy

29 Fulvio Ricci
Optimal detection
1 month 4 months 1 year
FFT length 2.6E+09 1.0E+10 3.1E+10
Sky points 2.1E+11 3.4E+12 3.1E+13Spin-down points (1st ) 2 .2E+04 3.5E+05 3.1E+06Spin-down points (2nd ) 1 .0E+00 1.1E+01 3.2E+02Freq. points (500 Hz) 1.3E+09 5.0E+09 1.6E+10Total points 6.0E+24 6.5E+28 4.8E+32
Comp. power (Tflops) 1 .0E+12 1.5E+16 3.6E+19
Sensitivity (nominal) 1.2E-26 6.0E-27 3.6E-27(background 10^-23*Hz^-0.5)Sens. for 10^9 candidates 7.4E-26 4.1E-26 2.7E-26

30 Fulvio Ricci
The sensitivity limit of the detector forthis kind of signal is determined by theavailable computing power Pc
We have to introduce a sub-optimal method withlimited SNR loss designed for realistic values of
Pc ~ 1 - 10 Tflop
Hierarchical searchThe idea is to alternate incoherent search step to coherent ones.
Incoherent search step: no phase information is usedCoherent search step: in practice it concernsfrequency zooming and Complex FFT
Hierarchical search

31 Fulvio Ricci
...Hierarchical searcThe starting point is the filling of a specific Data Base where short FFTs of theVIRGO data are stored (low frequency resolution)
Incoherent Step: the main porpuose is to select a large number of possible sourcecandidates that we validate by the following coherent step
At present there are two possible approaches for the first step
1) STACKING SLIDE techniqueWe divide in small fequency interval (slide) the periodograms acquired in timesequence.The corresponding slides are summed incoherently and the candidate peaks areselected by choosing a suitable threshold.
Advantage: easier implementation on a parallel computing architecture
Disadvantage: weak method to the respect of non-stationary noise behavior of thedetector because the selection criteria depends on the amplitude of the signal intothe single bin of the periodogram.

32 Fulvio Ricci
2) HOUGH TRANSFORMThe method has been proposed by the Virgo Rome group in order to have realy in amore robust algorithm.The length of the single short FFT is chosen to have a bin larger than the maximumpossible Doppler shift. However, looking at the various FFT taken in time sequence thesignal peak moves out of the original bin because of the Doppler effect.Thus, we look how the frequency peaks move in function of the time that define the FFTsequence. If it is a real signal it has to follow the deterministic Doppler law
f (t) = fo ( 1+ v . n /c) ( 1 + Σ fk t k )
The formula tell us that for each observed frequency f (ti) the locus of the points of thecelestial sphere where we can locate a source generating a g.w. signal is a circle. If thesignal is still there, at the time tj the new circle related to f (tj) will intersect the old one inthe source location of the sky.Advantage: robust algorithm and high computational speed (most part of thecomputation is performed with integers)Disadvantage: it requires a large software development and accurate tuning
…..Hierarchical search

33 Fulvio Ricci
Number of points in the parameter space
Number of frequency bins Nν = TFFT / 2 ∆T
Freq. bins in the Doppler band NDB = Nn 10-4
Sky points Nsky = 4 p Nn2
Spin-down points NSD(j) = 2 Nν (TFFT / τµin )( j)
Total number of points Ntot = Nsky Π j NSD(j)

34 Fulvio Ricci
Sensitivity
Optimal detection nominal h (OD) = (4 Sh / Tobs)1/2
sensitivity
Hierarchical method h(HM) = h (OD) (Tobs / TFFT)1/4
nominal sensitivity
Minimum detectable h (CR= 1)

35 Fulvio Ricci
Hierarchical method
¥ divide the data in (interlaced) chunks; the length is such that thesignal remains inside one frequency bin
• do the FFT of the chunks; this is the SFDB
• do the first “incoherent step” (Hough or Radon transform) andtake candidates to follow
• do the first “coherent step”, following up candidates with longer“corrected” FFTs, obtaining a refined SFDB (on the fly)
• repeat the preceding two step, until we arrive at the full resolution
36 Fulvio Ricci
Short FFT data base
The SFDB is a collection of (interlaced) FFTs, with such a lengththat the varying frequency signal power would be collected all in asingle bin.
The FFTs will be windowed.
We plan to do 4 different SFDBs, with different sampling times,in order to optimise the detection in different bands.

37 Fulvio Ricci
Incoherent steps: Radon transform
• using the SFDB, create the periodograms and then a time-
frequency map
• for each point in the parameter space, shift and add the
periodograms, in order to all the bins with the signal are
added together

38 Fulvio Ricci
Incoherent steps: Hough transform
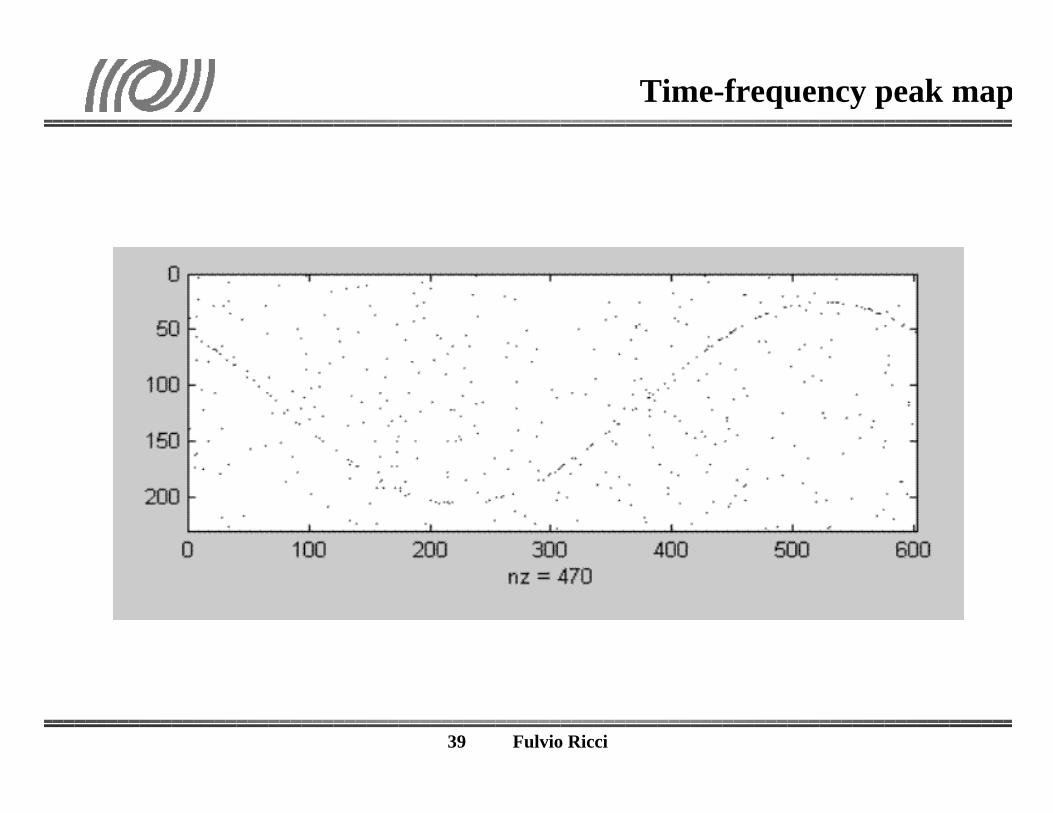
• using the SFDB, create the periodograms and then
a time-frequency map of the peaks above a threshold
• for each spin-down parameters point and each
frequency value, create a sky map (“Hough map”); to
create a H map, sum an annulus of “1” for each peak;
an histogram is then created, that must have a
prominent peak at the “source”
39 Fulvio Ricci
Time-frequency peak map

40 Fulvio Ricci
Hough map – single annulus

41 Fulvio Ricci
Hough map – single annulus (detail)

42 Fulvio Ricci
Hough map – source reconstruction

43 Fulvio Ricci
Source reconstruction - detail

44 Fulvio Ricci
Hough vs Radon
What we gain with Hough ?• about 10 times less in computing power• robustness respect to non-stationarity• operation with 2-bytes integers
What we lose ?• about 12 % in sensitivity (can be cured)• more complicate analysis

45 Fulvio Ricci
Coherent steps
With the coherent step we partially correct the frequencyshift due to the Doppler effect and to the spin-down.Then we can do longer FFTs, and so we can have a morerefined time-frequency map.
This steps is done only on “candidate sources”, survivedto the preceding incoherent step.

46 Fulvio Ricci
Loss respect to the optimum
47 Fulvio Ricci
Tuning a hierarchical search
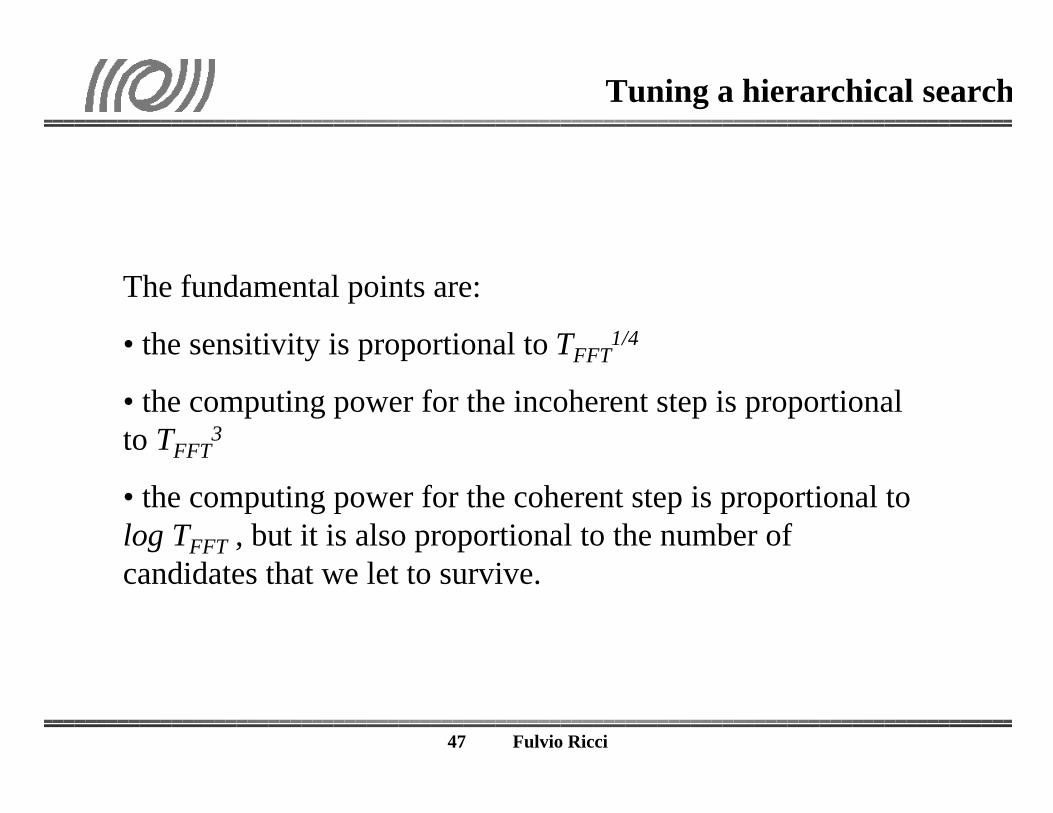
The fundamental points are:
• the sensitivity is proportional to TFFT1/4
• the computing power for the incoherent step is proportionalto TFFT
3
• the computing power for the coherent step is proportional tolog TFFT , but it is also proportional to the number ofcandidates that we let to survive.

48 Fulvio Ricci
Candidate sources
The result of an analysis is a list of candidates (for example,10^6 candidates).
Each candidate has a set of parameters:
• the frequency at a certain epoch
• the position in the sky
• 2~3 spin-down parameters

49 Fulvio Ricci
Banda 1 Banda 2 Banda 3 Banda 4Frequenza Max della banda (Hz) 2500 625 156.25 39.0625Banda Doppler (Hz) 0.25 0.0625 0.0156 0.0039Numero di Picchi nella banda Doppler 1643684 410921 102730 25683Risoluzione angolare nel cielo (rad) 1.9073E-03 3.8147E-03 7.6294E-03 1.5259E-02Numero di pixels nel cielo 3.4542E+06 8.6355E+05 2.1589E+05 5.3972E+04Numero di frequenze indipendenti 3.1457E+06 1.5729E+06 7.8643E+05 3.9322E+05Prametri di Spin down (solo l’ordine 1) 839 419 210 105Numero Totale di parametri 2.8976E+09 3.6220E+08 4.5275E+07 5.6594E+06Numero di operazioni per ogni picco 6.5884E+03 3.2942E+03 1.6471E+03 8.2355E+02Numero totale di operazioni 2.8577E+19 8.9302E+17 2.7907E+16 8.7209E+14Potenza di calcolo per passo (GFlops) 1.8109E+03 5.6592E+01 1.7685E+00 5.5265E-02Potenza di calcolo complessiva (GFlops)3.6219E+03 1.1318E+02 3.5370E+00 1.1053E-01

50 Fulvio Ricci
Stochastic background
The detection of stochastic background of Gravitational Waves is an otherambitious goal of the gravitational wave experiments.
Two main sources have to be considered :a) Stochastic background of Cosnmological OriginRelic G.W. carry information on the State of the Universe at the Planck era when
gravitons decoupled from the primordial plasma (Very High EnergyPhysics).
b) Stochastic background of AstrophysicalOrigin generated by the Supernovaeexplosions at high red shift (Z~ 4)
The detection strategy is basically a cross-correlation ofthe output of two antennas at least.

51 Fulvio Ricci
Stochastic background

52 Fulvio Ricci
Quadro di sviluppo del Tier 1 di Virgo Italia
¥ u n i t s end 2001 end 2003
¥ C PU capacity* 46 kSI2000 (200 Gflops) 300 kSI2000 (1.3Tflops)
¥ d i sk capacity TBytes 8 100
¥ d i sk I/O rate GBytes/sec 5 5
Quadro complessivo delle risorse di calcolo off-line di Virgo – Italia
¥ u n i t s end 2001 end 2003
¥ C PU capacity* 80 kSI2000 (350 Gflops) 800kSI2000(3.5Tflops)
¥ d i sk capacity TBytes 10 100
¥ d i sk I/O rate GBytes/sec 5 5
53 Fulvio Ricci