virtual full-scale testing for investigating strength
TRANSCRIPT

1
Virtual full-scale testing for investigating strength characteristics of
a composite wind turbine blade
Can Muyan1,2, Demirkan Coker1,2
1Aerospace Department, Middle East Technical University, Ankara, 06800, Turkey 2Structural Mechanics and Materials Laboratory, RUZGEM (METUWIND) Center for Wind Energy Research, Middle East 5
Technical University, Ankara, 06800, Turkey
Correspondence to: Demirkan Coker ([email protected])
Abstract. Full-scale structural tests enable us to monitor the mechanical response of the blades under various loading
scenarios. Yet these tests must be accompanied by numerical simulations so that the physical basis of the progressive
damage development can be captured and interpreted correctly. Within the scope of this paper, the previous work of the 10
authors concerning the strength analysis of an existing 5-m GFRP wind turbine blade using Puck failure criteria is revisited.
A significant outcome of the previous study was that the nonlinear Puck material model is necessary for a more realistic
simulation of failure mechanisms. In the current work, under extreme load cases, the internal flange at the leading edge and
trailing edge of the blade are identified as the mainly damaged regions. Moreover, the dominant failure mechanism is
expected to be the de-bonding at the trailing and leading edges. When extreme load case is applied as a combination of edge-15
wise and flap-wise loading cases, less damage is observed compared to the pure flap-wise loading case. This damage
evolution is attributed to the stiffer structural behavior of the blade under combined loading condition.
1 Introduction
As fundamental eco-friendly renewable energy resources, wind turbines are designed to operate over a lifespan of 20 years.
According to Holmes et al. (2007), long-term structural reliability of wind turbine components is vital when the high cost of 20
manufacturing, inspection, and repair, especially for turbines located in remote regions, are considered. Composite blades are
among the most critical components of a wind turbine, which are subjected to complex loading conditions. A rotor blade
failure can have a significant impact on turbine downtime and safety. In order to assure sufficient mechanical resistance,
structural testing and analysis must be conducted. However, structural testing methods such as full-scale testing of the blade
are expensive and troublesome due to the construction of a test set-up. In order to capture and understand the physical basis 25
of the progressive damage development correctly, tests need to be accompanied by numerical analysis methods (Chen et al.,
2017). Moreover, structural analyses are utilized to calibrate structural blade test set-ups for different loading conditions. In
the literature, there are many studies on the structural behavior of composite turbine blades. A novel methodology for the
structural design and analysis of 8-m tidal current turbine blade is presented based on the Puck phenomenological failure
criteria for fibre and inter-fibre failure by Fagan et al. (2016). The methodology that is developed in the study predicted 30

2
damage values for different load cases. This methodology is an iterative design process using the failure criteria to check the
structural strength of the blade. Their turbine blade Finite Element Model did not include geometric nonlinearity.
Passipoularidis et al. (2011) developed a fatigue damage simulator (FADAS) utilizing Puck failure criteria for the life
prediction of GFRP laminates, which are commonly used for the construction of wind turbine blades under variable
amplitude loading. In Passipoularidis et al. (2011)’s study, failure analysis is done on the ply level based on Classical 35
Lamination Theory (CLT). Puck failure criteria are implemented to predict failure initiation and sudden stiffness
degradation. The predictions of FADAS agree well with fatigue data and show that the algorithm is able to take into account
load sequence effects, as well. Another study conducted by Jensen et al. (2006) is about the full-scale test and nonlinear
FEM simulation of a 34-meter composite wind turbine blade under flap-wise loading. Load-displacement curves are used to
predict the location of failure initiation, which leads to ultimate failure. After comparing the test with simulation, 40
delamination of the skin and the following buckling was found to be the main failure mechanism for ultimate collapse. Chen
et al. (2017) revisited their previous study concerning the structural collapse of a 52.3 m composite rotor blade in a full-scale
bending test and explained the sequence of failure events from the video record of the test. In addition to this, they
introduced a new methodology for predicting delamination and skin/core failure modes, which must be analyzed according
to the DNV GL standard (2015). In their paper, Haselbach and Branner (2016) discuss the initiation and development of 45
trailing edge failure in the full-scale test of a 34-m wind turbine blade. They highlight the influence of buckling on the
damage onset in the trailing edge and sandwich panel failure. As a further outcome of the study, they show that modeling
technique utilizing the fracture mechanics approach for the failure in trailing edge delivers good agreement with
experiments. Besides this study, Haselbach (2017) investigated different trailing edge modeling methods in his work. He
analyzed the trailing edge failure under edgewise and flap-wise loading conditions. In conclusion, he pointed out that 50
modeling the adhesive bonding in the trailing edge with solid brick elements and connecting them to the shell elements of
the skin with Multi-Point Constraints (MPC) shows the best agreement with experiments. Recently, Castelos and
Balzani (2016) studied the effect of geometric nonlinearities on the fatigue analysis of the trailing edge bonding in wind
turbine blades. They point out that the superposition of stresses for the fatigue may be misleading for modern, flexible rotor
blades where geometric nonlinearities must be considered. In addition to this, they propose a novel methodology for 55
calculating stresses with a new load application method that reduces geometric nonlinear behavior of the blade.
Within the scope of this work, the authors of this study refer back to their previous paper concerning the strength analysis of
an existing 5-meter GFRP turbine blade using Puck failure criteria (Ozyildiz et al., 2018). In the previous work, the FE
Model of the blade was built in ANSYS ACP environment. ANSYS APDL Code was developed to carry out progressive
damage analysis and degradation rules. As part of the previous study, the linear Puck material model was compared with the 60
nonlinear progressive Puck material model. They have seen that the load patterns change as the elements fail when
progressive Puck criteria are used. Therefore, they concluded that progressive failure analysis is necessary to capture a more
realistic simulation of failure mechanisms prior to testing.

3
The goal of this work is to identify the main failure mechanisms or modes that may lead to the collapse of the wind turbine
blade during the flap-wise, edge-wise, and combined flap-wise and edge-wise bending conditions. For this purpose, the 65
structural behavior of the blade under these extreme loading conditions are investigated. After an in-depth understanding of
the damage development, the failure initiation regions are determined to be the trailing edge, and internal flange. The main
failure mechanism is expected to be de-bonding in this region. Based on the main failure mechanism, it is seen that under
flap-wise loading, spar design needs improvement, but under edge-wise loading, the current design is over-conservative. On
top of this, in combined edge-wise and flap-wise loading, less damage is observed compared to the pure flap-wise loading 70
case. This damage evolution is explained by the stiffer structural behavior of the blade under combined loading condition.
The existing blade was designed as part of a joint-project between Core Team of the University of Patras and METUWIND
– METU Center for Wind Energy. The blade was designed for a wind turbine that has 30 kW nominal power capacity at 10
m/s wind speed. According to the wind turbine characteristics, optimized aerodynamic blade design was finalized by the
blade manufacturer. The existing blade consists of five main parts: suction side, pressure side, internal flange, “hat-shaped” 75
chassis/spar, and flange, as seen in Figure 1.
Figure 1. Blade assembly for the 5-meter METUWIND turbine blade (Philippidis and Roukis, 2013).
2 Methodology 80
For the progressive failure analysis of the blade, Puck criteria explained briefly in the following paragraphs, are used. Puck
failure criteria (Puck and Schuermann, 2002) are one the most commonly used and well-established criteria for the

4
assessment of composite laminate strength. In this study, Puck’s failure criteria are implemented for the evaluation of stress
results of unidirectional and tri-axial composite laminates.
For fiber failure, Puck’s criteria are as follows: 85
𝑓𝐸(𝐹𝐹)𝑇 =
𝜎1
𝑋𝑇= 1 if 𝜎1 > 0 (1)
𝑓𝐸(𝐹𝐹)𝐶 =
𝜎1
𝑋𝐶= 1 if 𝜎1 < 0
(2)
where 𝑓𝐸(𝐹𝐹)𝑇 and 𝑓𝐸(𝐹𝐹)
𝑐 are stress exposures for fiber failure under tension and compression loading cases. 𝜎1 is the stress
value in fiber direction, 𝑋𝑇 and 𝑋𝑐 are tensile and compressive strengths in fiber direction, respectively. Puck’s inter-fiber
failure uses different equations depending on the failure mode, which is detected. Under two dimensional (2-D) biaxial
loading, the failure modes, which can be detected, are summarized in Figure 2 below. In Figure 2 the transition point from
failure mode B to failure mode C is denoted by the point (𝜏21𝑐, 𝑅⊥⊥𝐴 ) and is calculated by the ratio 𝑅⊥⊥
𝐴 /𝜏21𝑐. Their values 90
are calculated by the expressions below:
𝑅⊥⊥𝐴 =
𝑆
2𝑝⊥∥(−)
[√1 + 2𝑝⊥∥(−) 𝑌𝑐
𝑆− 1] (3)
𝜏21𝑐
= 𝑅⊥∥√1 + 2𝑝⊥⊥(−)
and 𝑝⊥⊥(−)
= 𝑝⊥∥(−) 𝑅⊥⊥
𝐴
𝑆
(4)
Figure 2. Failure envelope under biaxial loading (Knops, 2008).
Depending on the region of the failure envelope, the following inter-fiber failure expressions are written:
𝑓𝐸(𝐼𝐹𝐹)𝐴 = [(
𝜎6
𝑆)
2
+ (1 − 𝑝⊥𝐼𝐼(+) 𝑌𝑇
𝑆)
2
(𝜎2
𝑌𝑇)
2
]1/2
+ 𝑝⊥𝐼𝐼(+) 𝜎2
𝑆= 1 if 𝜎2 ≥ 0 (5)

5
𝑓𝐸(𝐼𝐹𝐹)𝐵 =
1
𝑆{[(𝜎6)2 + (𝑝⊥𝐼𝐼
(−)𝜎2)
2]
1/2
+ 𝑝⊥𝐼𝐼(−)
𝜎2} = 1 if {𝜎2 < 0
|𝜎2
𝜎6| ≤
𝑅⊥⊥𝐴
𝜏21𝐶
(6)
𝑓𝐸(𝐼𝐹𝐹)𝐶 = [(
𝜎6
2(1+𝑝⊥⊥(−)
)𝑆)
2
+ (𝜎2
𝑌𝐶)
2
]𝑌𝐶
(−𝜎2)= 1 if {
𝜎2 < 0
|𝜎2
𝜎6| ≥
𝑅⊥⊥𝐴
𝜏21𝐶
(7)
95
In the equations above 𝑝⊥𝐼𝐼(+)
, 𝑝⊥𝐼𝐼(−)
and 𝑝⊥⊥(−)
represent inclination parameters that control the shape of the failure envelope.
According to Puck and Schürmann (2002), 𝑝⊥𝐼𝐼(+)
= 0.3 and 𝑝⊥𝐼𝐼(−)
= 0.25 are chosen for the GFRP material. 𝜎2 is the stress
value in the transverse fiber direction, 𝑌𝑇 and 𝑌𝑐 are tensile and compressive strengths in the transverse fiber direction. Shear
stress and shear strength are represented by 𝜎6 and S, respectively. If the value of failure exposure (fE) exceeds 1, failure
initiation occurs. Mode A is caused by tensile and shear stresses. Modes B occurs under compressive and shear stresses. 100
Mode C is a dangerous failure mode in compressive shearing, which may lead to ultimate failure.
Degradation rules are applied to the elements which fail according to the specific Puck’s failure criteria that are inter-fiber
failure (IFF) mode A, B, or C (Eq. (5), (6) and Eq. (7), respectively). As presented by Passipoularidis et al. (2011), based on
degradation rules in Table 1, transverse elasticity and shear moduli of the damaged elements are reduced accordingly.
Recommended parameters c, 𝜂𝑟 and 𝜉 for the degradation function of the GFRP material in Eq. (8) are taken from Knops 105
and Bögle (2006). 𝑓𝐸(𝐼𝐹𝐹)𝐴 , 𝑓𝐸(𝐼𝐹𝐹)
𝐵 and 𝑓𝐸(𝐼𝐹𝐹)𝐶 are the failure exposure values that are considered for determining the failure
mode during the analysis.

6
Table 1: Degradation rules according to the failure mode.
Failure Mode Degradation Rule
FF (Tension / Compression) or
IFF(C) in 3 plies or more Failure of the laminate
IFF (A)
𝐸2 = 𝜂𝐸2 𝐺12 = 𝜂𝐺12 𝜈12 = 𝜂𝜈12
IFF (B)
𝐸2 = 𝜂𝐸2 𝐺12 = 𝜂𝐺12 𝜈12 = 𝜂𝜈12
IFF (C) in one or two plies
𝐸2 = 0.1𝐸2 𝐺12 = 0.1𝐺12 𝜈12 = 0.1𝜈12
110
In Eq. (8) 𝜂 is known as the degradation factor and can be expressed according to the equation below:
𝜂 =
1 − 𝜂𝑟
1 + 𝑐(𝑓𝐸(𝐼𝐹𝐹) − 1)𝜉+ 𝜂𝑟 (8)
The summary of the algorithm of the FE analysis based progressive failure analysis of a composite laminate using Puck
failure criteria is shown in Figure 3. The complete algorithm is implemented using ANSYS Parametric Design
Language (APDL). First, using ANSYS APDL script, different material numbers are given to each lamina, which constitutes
elements of the composite laminates. This step is necessary because, during the execution of the progressive damage 115
propagation, each lamina is subjected to different degradation rules. Then, an extreme load case is applied incrementally to
the model, and static analysis is run. Afterward, in the post-processing module, stresses are read. From Puck failure criteria
for FF (Eq. (1) and (2)) and IFF (Eq. (5), (6) and (7)), failure exposures are calculated. Depending on the rules presented in
Table 1whether ply failure happens is checked. If ply failure occurs due to First-Fiber-Failure (FFF) or if IFF(C) is observed
in 3 plies or more, element failure is assumed to take place. If IFF A or B or IFF C in less than three plies is seen, gradual 120
degradation rules are applied, and after the assembly of the new constitutive material model, the load is incremented, and the
analysis is re-run. This calculation procedure is run until the solution does not converge. If the solution does not converge,
the analysis aborted. As seen from the flow chart, as long as no FF or IFF failure occurs, without updating the constitutive
material model, load is incremented, and the analysis is executed.

7
125
Figure 3. Flowchart of the FE Analysis Based Strength Analysis of a Composite Laminate Using Puck Failure Criteria.
Validation of the APDL Code against experimental data provided by Puck and Schuermann (2002) is done for the [0/90]s
GFRP laminate/MY750 and [0/±45/90]s CFRP laminate/AS4 3501-6 under uniaxial tension loading. As seen from Figure 4,
there is a good agreement between APDL Code and experimental data for the progressive failure analysis of [0/90]s
GFRP/MY750 and [0/±45/90]s CFRP/AS4 3501-6 laminates. 130
(a) (b) Figure 4. Validation of the APDL Code for the progressive failure analysis of (a) [0/90]s GFRP/MY750 laminate under 𝜎𝑥
uniaxial tension (b) [0/±45/90]s CFRP/AS4 3501-6 laminate under 𝜎𝑦 uniaxial tension.

8
2.1 Finite Element Model of the METUWIND Blade
The two-dimensional blade technical drawings, which include the blade aerodynamic design details such as cord length and 135
twist angle along the blade, were provided by the blade manufacturer Compblades. By using these given two-dimensional
blade drawings, the three-dimensional CAD model of the blade is prepared in NX 12.0 environment. In Table 2, the material
properties and design allowables of the blade materials for static analysis is listed as given in the technical report written by
Philippidis and Roukis (2013). Referring to Germanischer Lyod (2010), design allowables are obtained from the knockdown
of the experimental strength values by the material safety factor 2.406. 140
Table 2. Material properties and design allowables of METUWIND blade for static analysis
Material Property Unidirectional
Laminate
Steel Gel Coat CSM 300 Divinycell H45
Density, ρ [kg/mm3 ] 1896 7850 1200 1896 200
Thickness, h [mm] 0.716 5.3 0.9 0.358 5 or 10
E1 [GPa] 24.84 210 3.98 9.14 55x10-3
E2 [GPa] 9.14 55x10-3
ν12 0.29 0.3 0.34 0.29 0.4
G12 [GPa] 2.38 15 x10-3
XT [MPa] 191.73 581.8 35.29 16.86 1.4
XC [MPa] 101.16 0.6
YT [MPa] 16.86 1.4
YC [MPa] 50.41 0.6
S [MPa] 11.29 0.56
The skin of the blade is composed of unidirectional and tri-axial laminates, whereas only tri-axial laminates are used for the
spar. The lay-up sequence for the pressure and suction side differs only in the area from 1.25m to 2.0m, where an extra 145
unidirectional glass fabric was placed in the suction side of the blade. The root part of the blade is composed of
unidirectional laminate, tri-axial laminates, and steel. The outer surface of the blade is covered with transparent Gel Coat and
a layer of chopped strand mat, 300 g/m2 CSM 300. In addition to this, the Divinycell H45 foam used in the trailing edge is of
10 mm thickness in the area from 0.7m to 2.0m and 5mm thickness from 2.0m to 3.0m. Since the gel coat, CSM 300, and
foam do not have a significant contribution to the strength of the blade; these materials are not included in the Finite Element 150
Model.
After geometric modeling of the blade, the material model of the blade structure is prepared in Ansys ACP/Pre module.
Plane stress SHELL 181 quadrilateral elements are used to mesh the blade entirely in ANSYS Workbench, as seen in Figure
5. The total number of elements in the FE Model is 48,326. Depending on the stress concentration regions, mesh density is
increased in specific regions of the blade. The fine mesh density is chosen on the blade leading and trailing edges for detailed 155
investigation of the stress distribution in these areas, as depicted in Figure 5. The decision for the mesh refinement is based
on the compromise between accuracy and computing time. The analysis takes about four hours with an Intel Core i7 Desktop
PC with 16 GB RAM.
9
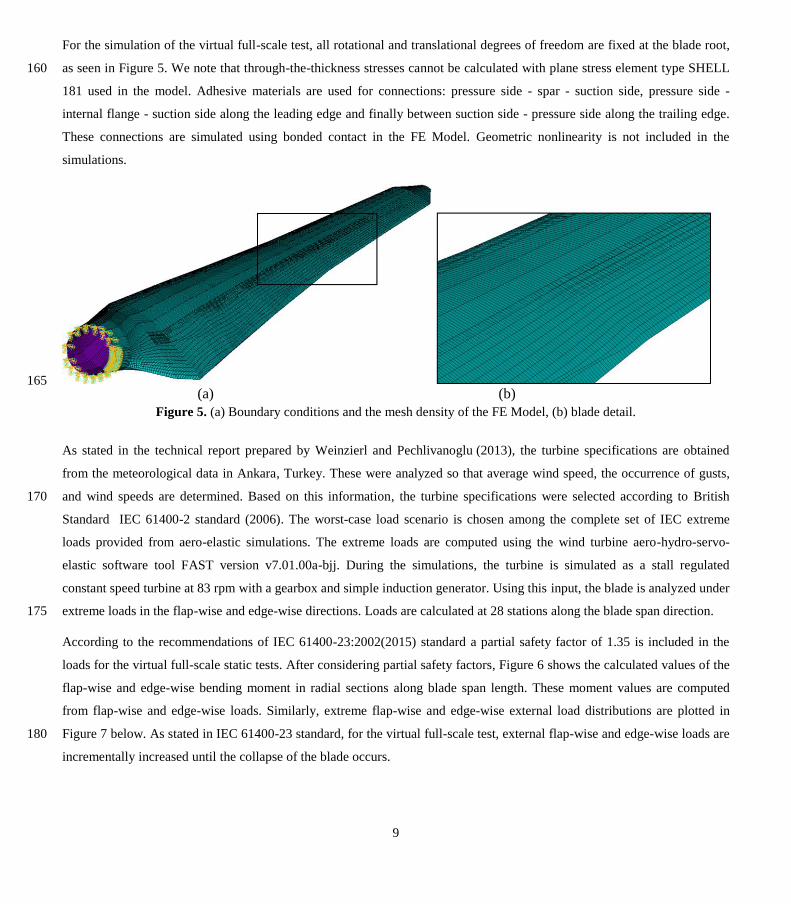
For the simulation of the virtual full-scale test, all rotational and translational degrees of freedom are fixed at the blade root,
as seen in Figure 5. We note that through-the-thickness stresses cannot be calculated with plane stress element type SHELL 160
181 used in the model. Adhesive materials are used for connections: pressure side - spar - suction side, pressure side -
internal flange - suction side along the leading edge and finally between suction side - pressure side along the trailing edge.
These connections are simulated using bonded contact in the FE Model. Geometric nonlinearity is not included in the
simulations.
165 (a) (b)
Figure 5. (a) Boundary conditions and the mesh density of the FE Model, (b) blade detail.
As stated in the technical report prepared by Weinzierl and Pechlivanoglu (2013), the turbine specifications are obtained
from the meteorological data in Ankara, Turkey. These were analyzed so that average wind speed, the occurrence of gusts,
and wind speeds are determined. Based on this information, the turbine specifications were selected according to British 170
Standard IEC 61400-2 standard (2006). The worst-case load scenario is chosen among the complete set of IEC extreme
loads provided from aero-elastic simulations. The extreme loads are computed using the wind turbine aero-hydro-servo-
elastic software tool FAST version v7.01.00a-bjj. During the simulations, the turbine is simulated as a stall regulated
constant speed turbine at 83 rpm with a gearbox and simple induction generator. Using this input, the blade is analyzed under
extreme loads in the flap-wise and edge-wise directions. Loads are calculated at 28 stations along the blade span direction. 175
According to the recommendations of IEC 61400-23:2002(2015) standard a partial safety factor of 1.35 is included in the
loads for the virtual full-scale static tests. After considering partial safety factors, Figure 6 shows the calculated values of the
flap-wise and edge-wise bending moment in radial sections along blade span length. These moment values are computed
from flap-wise and edge-wise loads. Similarly, extreme flap-wise and edge-wise external load distributions are plotted in
Figure 7 below. As stated in IEC 61400-23 standard, for the virtual full-scale test, external flap-wise and edge-wise loads are 180
incrementally increased until the collapse of the blade occurs.

10
In order to avoid stress singularities in the FE Model, extreme flap-wise and edge-wise external loads are given over 28
stations of the blade suction and pressure sides as displayed in Figure 8(a) and Figure 9(a). From Figure 8(b) and Figure 9(b)
it is seen that the load at these stations are distributed among the nodes along the spar width on the suction and pressure
sides. 185
Figure 6. Extreme moment distribution along span length.
Figure 7. Extreme external load distribution along span length.
0
2
4
6
8
10
12
14
16
18
20
0.0 0.5 1.0 1.5 2.0 2.5 3.0 3.5 4.0 4.5 5.0
M (
kNm
)
Length of station from root (m)
Flapwise
Edgewise
0
100
200
300
400
500
600
0.0 0.5 1.0 1.5 2.0 2.5 3.0 3.5 4.0 4.5 5.0
F (k
N)
Length of station from root (m)
Flapwise
Edgewise

11
190
(a)
(b)
Figure 8. Extreme flap-wise load application to blade FE Model: (a) top and (b) side view.
(a)
(b)
Figure 9. Extreme edge-wise load application to blade FE Model: (a) top and (b) side view.

12
3 Results and discussion
In this section, results from the virtual full-scale of the blade under flap-wise, edgewise, and combined edgewise and flap-195
wise loading extreme loading conditions are presented. At the end of the section, a comparative study of these three loading
scenarios is given.
3.1 Virtual full-scale testing under flap-wise loading
Load displacement curves in the range between 10% - 150% of extreme flap-wise loading of the blade are displayed for the
linear Puck model and nonlinear progressive Puck model in Figure 10. Loads are computed from the reaction forces at the 200
blade root, and the displacement is measured at a node near the blade tip. It can be observed from the figure that up to 90%
of the extreme flap-wise loading, the stiffness for both models remains almost the same. After 90% loading, stiffness
reduction starts in the nonlinear progressive Puck model due to the first element failure at the internal flange tip. According
to the simulation output data, elements begin to fail due to FF or IFF(C) starting from this loading increment, as will be
shown in the next section. Element failures in the internal flange are followed by the failures in the trailing edge. In addition 205
to this, the output data show that degradations in the transverse elasticity, shear moduli and Poisson’s ratio starting at 40%
loading occur, but this does not play a significant role in the deflection of the blade as can be seen from the figure. When the
loading is further increased up to 130%, the deflection of the nonlinear model is about twice the deflection of the linear
model. At this point, the blade is considered to be close to the ultimate failure. Finally, the blade collapses after 150% of
extreme flap-wise loading. 210
Figure 10. Load displacement curves of the blade using the linear Puck model and nonlinear Puck progressive model under
extreme flap-wise loading.

13
The total deformation of the nonlinear blade model versus the undeformed model under 100% extreme flap-wise loading is
displayed in Figure 11. The maximum blade deflection at the blade tip is 111 mm. 215
Figure 11. Total deformation of the nonlinear METUWIND blade model vs. undeformed model under 100% extreme flap-
wise loading condition (scale factor: x5).
During the full-scale test, the internal flange and suction side of the blade are the two parts, which are damaged primarily. 220
Since internal flange is rather thin, for visualization reasons, damage propagation in the suction side of the blade is
presented. Figure 12 shows the evolution of the failed elements in the suction side of the blade at 90%, 100%, 120%, and
150% of extreme flap-wise loading. According to the implemented methodology, an element fails if FF or IFF(C) in three or
more plies of an element is detected. Element failure begins at 90% loading in the trailing edge, and the failed elements are
shown in black. As seen from the figure number of failed elements increase along the trailing edge towards the blade tip and 225
root as the load is further increased to 120%, and the suction side is heavily damaged at 150%.
Since the adhesive is the weakest interface at these locations, the main failure mechanism is expected to be debonding, or
delamination in this region before FF or IFF(C) occurs. This expectation can be justified by the variation of the contact
friction stress in trailing edge adhesive interface as depicted in Figure 13. At 100% flap-wise loading the evolution of the
failed elements is shown in black and denoted by region A in Figure 12 (b). At the same location we observe a significant 230
increase in contact friction stress as denoted by region A in Figure 13. This contact stress peak in region A can lead to de-
bonding. Furthermore, bearing in mind that adhesive is modeled as bonded contact, the current modeling technique is not
capable of simulating the progression of debonding. It is worth noting that, plane stress elements, which are used to model
the blade are not able to show through-the-thickness stresses, which may futher help to trigger debonding/delamination
failure mechanisms. 235
240

14
(a)
(b)
(c)
(d)
Figure 12. Element failure progression on the suction side of the blade at (a) 90%, (b) 100%, (c) 120% and (d) %150 of
extreme flap-wise loading.
Figure 13. Contact friction stress in the trailing edge adhesive interface along blade spanwise direction at 100% extreme
flap-wise loading. 245
0
5
10
15
20
25
30
35
40
500 1000 1500 2000 2500 3000 3500 4000 4500 5000
Co
nta
ct F
rict
ion
Stre
ss (
MPa
)
Location in Spanwise Direction (mm)
Region A
Region A

15
In Figure 14 inter-fiber failure mode A (IFF(A)) and inter-fiber failure mode B (IFF(B)) distribution in the suction side are
shown on the same plot. If both failure exposures are present in an element, the higher failure exposure IFF(A) or IFF(B) is
shown. Based on the output data from the virtual full-scale test of the blade, the damage initiation begins at 40% of extreme
flap-wise loading due to IFF(A) or IFF(B). The figure shows that inter-fiber failure starts at the trailing edge of the suction
side towards spar end. As discussed in the methodology chapter, failure exposures greater than or equal to one indicate 250
damage, and damaged regions are shown in red. Under 40% to 100% loading damage propagates by increasing load
increments, as shown in Figure 15. From the regions where inter-fiber failure values are high, detail section D is created on
the blade suction side. This detailed section is used to study the damage evolution in Figure 15. After the beginning of failure
at 40%, the damaged regions grow along the trailing edge towards the blade tip and root. It is worth noting that, IFF(A) and
IFF(B) do not lead to the element failure. When IFF(A) or IFF(B) occurs, only the transverse, shear moduli, and Poisson’s 255
ratio are reduced according to the degradation rules. As seen from Figure 10, degradation in the stiffness and Poisson’s ratio
does not lead to the change in the slope of the force-displacement curve. This observation means there are no considerable
changes in the blade stiffness. However, at 100% load, there are failed elements due to FF or IFF(C), as will be discussed in
the preceding paragraphs, and at this point, the slope of the force-displacement curve, i.e., blade stiffness decreases. Since
the IFF(A) or IFF(B) of the failed elements are zero, they appear as dark blue regions inside red areas. When the elements 260
fail, they do not contribute to strength anymore, and the load will be carried by the neighboring elements. As a result, IFF(A)
or IFF(B) evolves around the failed elements.
Figure 14. Detail section D from the suction side of the blade at 40% of extreme flap-wise loading.
(a)
(b)
Figure 15. Failure progression on blade suction side at (a) 40% and (b) 100% of extreme flap-wise loading in detail D.
Detail D

16
Damage progression regarding IFF(C) and FF in detail section D of the blade is further investigated in Figure 16. In Figure 265
16, fiber-failure (FF) and inter-fiber failure mode C (IFF(C)) distribution in the suction side is shown on the same plot. If
both failure exposures are present in an element, the higher failure exposure FF or IFF(C) is shown. In the figure, failure
exposures are plotted under 90%, 100%. 120% and 150% loading. At 90% loading, the regions depicted in red are the
regions where the failure index is equal to or greater than one, the stiffness of the elements is set to zero. As a consequence,
in the following load increment of 100% loading, the regions, which appear in red at 90% loading, become dark blue. After 270
setting their stiffness to zero, their failure exposure FF or IFF(C) is zero, and they do not contribute to the strength of the
blade anymore. We note that these dark blue regions correspond to the failed elements in Figure 12. At 100% loading, the
failed region evolves along the trailing edge, as depicted in red. The new failed regions, together with the failed elements
from previous runs, are represented by the failed elements in black in Figure 12. We note FF and IFF(C) initiate in the same
location as IFF(A) or IFF(B). 275
(a)
(b)
(c)
(d)
Figure 16. Failure progression on the blade suction side at (a) 90%, (b) 100%, (c) 120% and (d) %150 of extreme flap-wise
loading in detail D.

17
3.2 Virtual full-scale testing under edgewise loading
Load displacement curves in the range between 10% - 350% of extreme flap-wise loading of the blade are displayed for the
linear Puck model and nonlinear progressive Puck model in Figure 17. Loads are computed from the reaction forces at the 280
blade root, and the displacement is measured at a node near the blade tip. It can be observed from the figure that up to 320%
of the extreme flap-wise loading, the stiffness for both models remains almost the same. After 320% loading, stiffness
reduction starts in the nonlinear progressive Puck model due to the first element failure at the internal flange tip. Finally, at
%350 loading blade is close to collapse.
285
Figure 17. Load displacement curves of the blade using the linear Puck model and nonlinear Puck progressive model under
edgewise loading.
The total deformation of the nonlinear blade model versus the undeformed model under 100% extreme flap-wise loading is
displayed in Figure 18. The maximum blade deflection at the blade tip is 27 mm and much less than the deformation
compared to pure flap-wise loading. Figure 19 shows the evolution of the failed elements due to FF and IFF(C) in the suction 290
side of the blade at 320%, 330%, 340% and 350% of extreme edgewise loading. Element failure in the trailing edge near root
begins at 330% loading, and the failed elements are shown in black. We observe from Figure 19 that since the spar has more
structural strength than the suction side in edgewise direction, damage grows inside the suction side further and ends at the
boundary where the spar is located until %340 loading. As seen from the figure number of failed elements increase in the
trailing edge towards the spar and root as the load is further increased to 350%. Starting from 350% loading, the part of the 295
suction side connected to the spar caps is heavily damaged.

18
Figure 18. Total deformation of the nonlinear METUWIND blade model vs. undeformed model under 100% extreme edge-
wise loading condition (scale factor: x10). 300
(a)
(b)
(c)
(d)
Figure 19. Element failure progression on the suction side of the blade at (a) 320% (no element failure) (b) 330%, (c) 340%
and (d) 350% of extreme edgewise loading.

19
In Figure 20, fiber-failure (FF) and inter-fiber failure mode C (IFF(C)) distribution in the suction side are shown on the same
plot. In the figure, failure exposures are plotted under 320%, 330%, 340%, and 350% loading. The regions where the failure 305
index is equal to or greater than one are depicted in red. The stiffness of these elements is set to zero. These regions, which
appear as dark blue regions in Figure 20 (c) and (d) correspond to the failed elements in Figure 19. At 340% and %350
loading cases, the failed region evolves along the trailing edge, as depicted in red. The new failed areas, together with the
failed elements from previous runs, are represented by the failed elements in black in Figure 19. Based on the results, blade
design exhibits excessive safety in edgewise direction and is considered to be over-conservative for this type of loading. 310
(a)
(b)
(c)
(d)
Figure 20. Failure progression on the blade suction side at (a) 320%, (b) 330%, (c) 340% and (d) 350% of extreme edge-
wise loading.
3.3 Virtual full-scale testing under combined edgewise and flap-wise loading
Load displacement curves in the range between 10% - 160% of combined extreme flap-wise and edgewise loading of the 315
blade are displayed for the linear Puck model and nonlinear progressive Puck model in Figure 21. Loads are computed from
the reaction forces at the blade root, and the displacement is measured at a node near the blade tip. The figure shows that up
to 110% extreme flap-wise loading, the stiffness for both models remains almost the same. After 110% loading, stiffness
reduction starts in the nonlinear progressive Puck model due to the first element failure at the internal flange tip. Finally, at
%160 loading blade is close to collapse. 320

20
Figure 21. Load displacement curves of the blade using the linear Puck model and nonlinear Puck progressive model under
combined edgewise and flap-wise loading.
The total deformation of the nonlinear blade model versus the undeformed model under 100% combined extreme flap-wise 325
and edgewise loading is displayed in Figure 22. The maximum blade deflection at the blade tip is 103 mm and less than the
deformation in pure flap-wise loading. We further note that the deflection in the edgewise direction is less than the deflection
in the span-wise direction. Figure 23 shows the evolution of the failed elements due to FF and IFF(C) in the suction side of
the blade at 100%, 110%, 120%, and 160% of the combined extreme edgewise and flap-wise loading. As in the pure flap-
wise loading case, element failure distribution is represented in black. Yet under the same load increment, the number of 330
failed elements are less compared to pure flap-wise loading case. This observation is due to resistance, i.e., stiffer behavior
of the blade to bending under combined loading case. Element failure in the trailing edge begins at 110% loading. Similar to
the pure flap-wise loading, the number of failed elements increases in the trailing edge towards the spar and root as the load
is further increased up to 160% loading. Since compared to edgewise loading the spar stiffness in the flap-wise direction is
less, at 160% combined loading damage grows further inside the suction side where the spar is located. 335

21
(a)
(b)
Figure 22. Total deformation of the nonlinear METUWIND blade model vs. undeformed model under 100% combined
extreme edgewise and flap-wise loading condition (a) side view (b) top view (scale factor: x5). 340
(a)
(b)
(c)
(d)
Figure 23. Element failure progression on the suction side of the blade at (a) 100%, (b) 110%, (c)120% and (d) 160% of
combined extreme flap-wise and edgewise loading.

22
In Figure 24, fiber-failure (FF) and inter-fiber failure mode C (IFF(C)) distribution in the suction side caused by combined
flap-wise and edgewise loading are shown. In the figure, failure exposures are plotted under 100%, 110%, 120%, and 160%
loading. The regions where the failure index is equal to or greater than one are depicted in red. The stiffness of these 345
elements is set to zero. These regions, which appear as dark blue regions in Figure 24 (c) and (d) correspond to the failed
elements in Figure 23. At 120% and %160 loading cases the failed region evolves along the trailing edge as depicted in red.
The new failed regions, together with the failed elements from previous runs, are represented by the failed elements in black
in Figure 23. When the results in Figure 24 are compared with Figure 16, one can conclude that the damaged area under
combined loading is less than pure flap-wise loading case. In combined loading case and pure flap-wise loading, the damage 350
growth begins and continues along the trailing and leading edges. Based on the results, blade design is considered to be safe
for the combined load case.
(a)
(b)
(c)
(d)
Figure 24. Failure progression on the blade suction side at (a) 100%, (b) 110%, (c)120% and (d) 160% of combined extreme 355
flap-wise and edgewise loading.

23
3.4 Comparative study of virtual full-scale testing under flap-wise, edgewise and combined flap-wise and edgewise
loading
In Figure 25, load-displacement curves of the blade under edgewise, flap-wise, and combined edgewise plus flap-wise
loading conditions are plotted on the same graph for comparison reasons. In the figure, resultant loads at the blade root 360
versus total displacements at a location near the blade tip are plotted. We see that the slope of the load-displacement curve is
highest for edgewise loading followed by edgewise plus flap-wise loading. For flap-wise loading, the slope of the load-
displacement curve is the lowest. Since slope is a measure of stiffness, the blade exhibits stiffest behavior in the pure edge-
wise loading direction, followed by the edgewise plus flap-wise loading and the pure flap-wise loading.
365
Figure 25. Load displacement curves of the blade under edgewise, flap-wise, and edgewise plus flap-wise loading.
As a further investigation, the structural response of the blade under pure flap-wise versus combined loading is depicted in
Figure 26. In the figure, instead of the resultant components of the combined loading, its flap-wise components, i.e., load and
displacement in flap-wise direction, are plotted. It is seen that the blade exhibits a stiffer behavior in flap-wise direction
under combined loading condition compared to pure loading cases. The blade is stronger under combined loading and at 370
100% loading there are no failed elements as shown in Figure 23(a). Moreover, Figure 26 shows that after the blade is
damaged, at 150% flap-wise loading the deflection of the blade under combined loading is approximately 60% of the
deflection under the pure flap-wise loading case.
0
4000
8000
12000
16000
20000
24000
0 200 400 600 800 1000
Load
ing
(N)
Displacement (mm)
Edgewise Loading
Flapwise Loading
Edgewise+Flapwise Loading

24
Figure 26. Load-displacement curves of the blade under pure flap-wise and combined loading using flap-wise components 375
of the load and displacement.
In Figure 27, element failure progression is compared for edgewise, flap-wise, and combined loading scenarios under %120
resultant loading. We observe that the degree of the failed region is highest for the flap-wise loading case, followed by
combined loading, and there is no failed region in the edgewise loading case. This failure development can be explained by
the variation of the blade stiffness as discussed in Figure 25. Less failure is observed for stiffer blades due to the resistance 380
of the blade to bending.
(a)
(b)
(c)
Figure 27. Element failure progression on the suction side of the blade at (a) flap-wise, (b) edgewise (no element failure)
and (c) combined flap-wise and edgewise 120% extreme loading case.

25
4 Conclusions
In this work, virtual full-scale test of an existing 5-meter composite wind turbine blade under extreme flap-wise, edgewise 385
and combined flap-wise and edgewise loading conditions is conducted using Puck material damage model. Failure on the
lamina level is investigated using Puck failure criteria (2D). The main conclusions are as follows:
1. Failure of elements are observed, and the blade is found to deflect extensively after the application of 90% extreme
flap-wise loading, ultimate failure is expected to occur. In contrast, element failures are not observed under pure 390
edgewise and combined edgewise and flap-wise extreme load cases until 100% extreme loading.
2. Less damage evolution is observed under combined edgewise and flap-wise loading compared to flap-wise loading. This
damage progression can be explained by the fact that the blade exhibits more resistance to bending, i.e., stiffer when it is
subjected to combined loading.
3. Plots of the load-displacement curves of the blade under extreme loading conditions show that slope reduction in the 395
curves, i.e., stiffness reduction becomes notable only after failure of elements due to IFF(C) or FF. Shear and transverse
stiffness reductions caused by IFF(A) and IFF(B) do not lead to significant changes in the overall structural stiffness of
the blade.
4. Failure initiation begins with inter-fiber failure (IFF(A) or IFF(B)), and as the load is further increased element failure
due to fiber failure or explosive failure mode, IFF(C) occurs in the same failure initiation region. 400
5. Based on the identified failure mechanism and simulation results, spar design seems to be over-conservative under
edgewise-loading, but strength improvement is needed for pure flap-wise loading. This improvement can be achieved by
increasing the area moment of inertia of the spar for the pure flap-wise loading case.
6. Since the adhesive is the weakest interface, the main failure mechanism is expected to be the de-bonding at the trailing
and leading edges. Plane strength elements are not capable of capturing the main failure mechanism, which is triggered 405
by the through-the-thickness stresses.
Author contributions. CM implemented the failure analysis method, conducted the numerical simulations, and wrote the
paper. DC is the supervisor and guided CM for the conception of the ideas and participated in writing, structuring, and
review of the paper. 410
Data availability. The data that supports the results of this research are not publicly available due to confidentiality reasons.
Competing interests. The authors declare that they have no conflict of interest.
415
Acknowledgment. This work was partly supported by RUZGEM, METU Center for Wind Energy at the Middle East
Technical University.

26
References
ANSYS Inc. http://www.ansys.com, Release17.2, 2017.
British IEC 61400-2 Standard: Wind Turbines, Part 2: Design requirements for small wind turbine, 2006. 420
Chen, X., Zhao, X., and Xu, J.: Revisiting the structural collapse of a 52.3 m composite wind turbine blade in a full-scale
bending test, Wind Energy, 20, 1111–1127, https://doi.org/10.1002/we.2087, 2017.
DNV GL Standard: DNV GL-ST-0376-Rotor Blades for Wind Turbines, 2015.
Fagan, E. M., Kennedy, C. R., Leen, S. B., and Goggins, J.: Damage mechanics based design methodology for tidal current
turbine composite blades, Renewable Energy, 97, 358 – 372, https://doi.org/10.1016/j.renene.2016.05.093, 2016. 425
FAST https://nwtc.nrel.gov/FAST7, Release v7.01.00a-bjj, 2013.
Germanischer Lloyd Guidelines: Rules and Guidelines Industrial Services, Guideline for the Certification of Wind Turbines,
2010.
Haselbach, P U.: An advanced structural trailing edge modelling method for wind turbine blades, Composite Structures, 180,
521-530, https://doi.org/10.1016/j.compstruct.2017.08.029, 2017. 430
Haselbach, P. U. and Branner, K.: Initiation of trailing edge failure in full-scale wind turbine blade test, Engineering Fracture
Mechanics, 162, 136-154, https://doi.org/10.1016/j.engfracmech.2016.04.041,2016.
Holmes, J., Sørensen, B., and Brøndsted, P.: Reliability of wind turbine blades: An overview of materials testing, in:
Proceedings of the Wind Power Shanghai 2007, pp. 310–315, Chinese Renewable Energy Industry Association, 1-3
November 2007. 435
IEC 61400-23:2002: Part 23 Full-Scale Structural Testing of Rotor Blades, 2015.
Jensen, F., Falzon, B., Ankersen, J., and Stang, H.: Structural testing and numerical simulation of a 34m composite wind
turbine blade, Composite Structures, 76, 52 – 61, https://doi.org/10.1016/j.compstruct.2006.06.008, 2006.
Knops, M. and Bögle, C.: Gradual failure in fibre/polymer laminates, Composites Science and Technology, 66, 616–625,
https://doi.org/10.1016/j.compscitech.2005.07.044, 2006. 440
Knops, M.: Analysis of Failure in Fiber Polymer Laminates: The Theory of Alfred Puck, Springer,
https://doi.org/10.1007/978-3-540-75765-8, 2008.
Noever Castelos, P., and Balzani, C., The impact of geometric non-linearities on the fatigue analysis of trailing edge bond
lines in wind turbine rotor blades, Journal of Physics: Conference Series, Bristol: IOP Publishing Ltd.,
https://doi.org/10.15488/532, 2016. 445
Ozyildiz, M., Muyan, C., and Coker, D.: Strength Analysis of a Composite Turbine Blade Using Puck Failure Criteria,
Journal of Physics: Conference Series, 1037, 042 027, https://doi.org/10.1088/1742-6596/1037/4/042027, 2018.
Passipoularidis, V. A., Philippidis, T. P., and Brondsted, P.: Fatigue life prediction in composites using progressive damage
modelling under block and spectrum loading, International Journal of Fatigue, 33, 132–144,
https://doi.org/10.1016/j.ijfatigue.2010.07.011, 2011. 450

27
Philippidis, T. and Roukis, G.: Structure design report of METUWIND small rotor Blade, Confidential Interim Report, 2013.
Philippidis, T., Assimakopoulou, T., and Roukis, G.: Static tests on GFRP composites made of METYX Glass NCF,
Confidential Interim Report, 2013.
Puck, A. and Schürmann, H.: Failure analysis of FRP laminates by means of physically based phenomenological models,
Composites Science and Technology, 62, 1633–1662, https://doi.org/10.1016/S0266-3538(01)00208-1, 2002. 455
SIEMENS NX http:// www.plm.automation siemens.com, Release 12.0, 2017.
Weinzierl G. and Pechlivanoglou G.: Blade Design Loads METU-5.0, Rev. 1.5, SMARTBLADE GmbH Internal Technical
Specification, 2013.