virtual instrumentation with labview - alessandra flamminialessandra-flammini.unibs.it/sistemi...
TRANSCRIPT

Virtual Instrumentation With LabVIEW
NI Course
• Questo corso è disponibile in rete all’indirizzo:http://zone.ni.com/devzone/learningcenter.nsf/03f7c60f17aad210862567a90054a26c/55974411828f779086256ce9007504bd
• O comunque digitando “course” nel campo search della home page www.ni.com

Course Goals
• Understand the components of a Virtual Instrument• Introduce LabVIEW and common LabVIEW functions • Build a simple data acquisition application• Create a subroutine in LabVIEW• Work with Arrays, Clusters, and Structures• Learn About Printing & Documentation Features• Develop in Basic Programming Architectures• Publish VIs on the Web

Section I
• LabVIEW terms• Components of a LabVIEW application• LabVIEW programming tools• Creating an application in LabVIEW

Front Panel• Controls = Inputs• Indicators = Outputs
Block Diagram• Accompanying “program”
for front panel• Components “wired”
together
LabVIEW Programs Are Called Virtual Instruments (VIs)

VI Front PanelFront Panel Toolbar
GraphLegend
BooleanControl
WaveformGraph
Icon
PlotLegend
ScaleLegend

VI Block Diagram
Wire Data
GraphTerminal
SubVI
While LoopStructure
Block Diagram Toolbar Divide
Function
Numeric Constant
Timing Function
Boolean Control Terminal

Express VIs, VIs and Functions• Express VIs: interactive VIs with configurable dialog page• Standard VIs: modularized VIs customized by wiring• Functions: fundamental operating elements of
LabVIEW; no front panel or block diagram
Express VI Standard VI
Function

Controls and Functions Palettes
Controls Palette(Front Panel Window)
Functions Palette(Block Diagram Window)

Operating Tool
Positioning/Resizing Tool
Labeling Tool
Wiring Tool
Shortcut Menu Tool
• Floating Palette• Used to operate and modify
front panel and block diagram objects.
Scrolling Tool
Breakpoint Tool
Probe Tool
Color Copy Tool
Coloring Tool
Tools Palette
Automatic Selection Tool
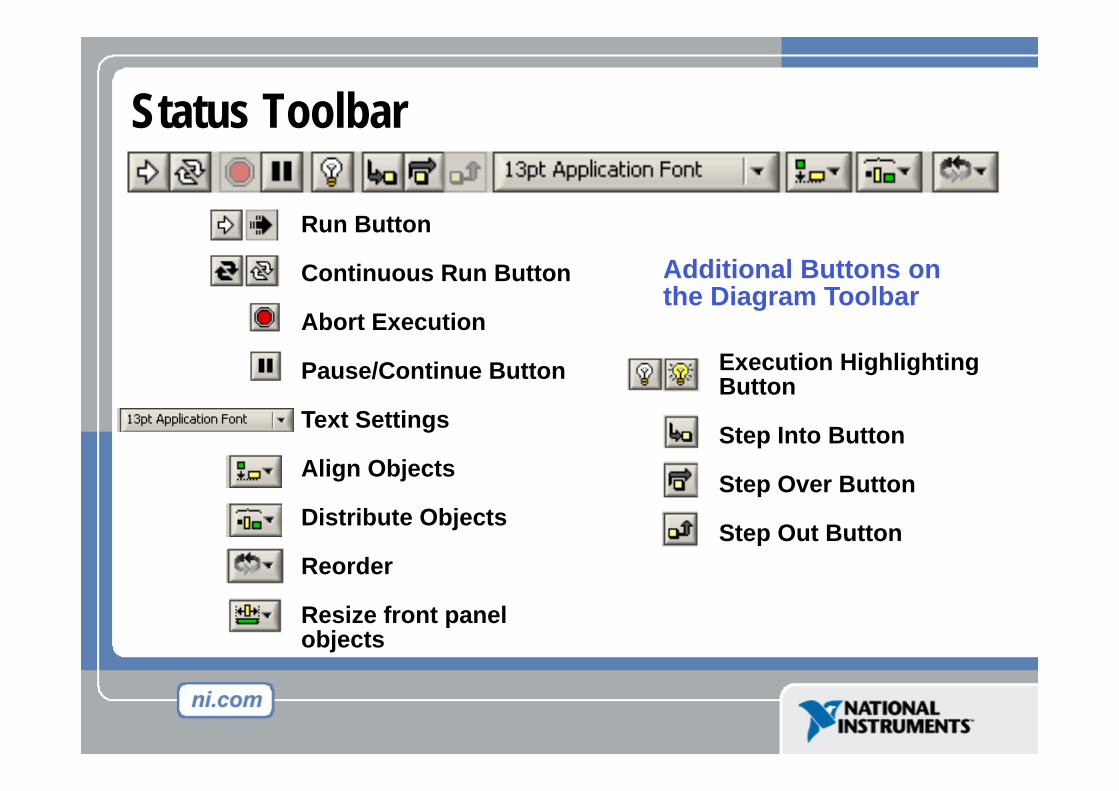
Run Button
Continuous Run Button
Abort Execution
Pause/Continue Button
Text Settings
Align Objects
Distribute Objects
Reorder
Resize front panel objects
Execution Highlighting Button
Step Into Button
Step Over Button
Step Out Button
Additional Buttons on the Diagram Toolbar
Status Toolbar
Do Not Delete This Slide

Open and Run a Virtual InstrumentExample finder

Starting a VI• Open a
blank VI or project
• Open an existing VI or project and modify it
• Open a template to begin a new VI or project

ControlTerminals
Block Diagram Window
Front Panel Window
Indicator Terminals
Creating a VI

Creating a VI – Block Diagram

Wiring Tips – Block DiagramWiring “Hot Spot”
Clean Up WiringUse Automatic Wire Routing
Click To Select Wires

Do Not Delete This Slide
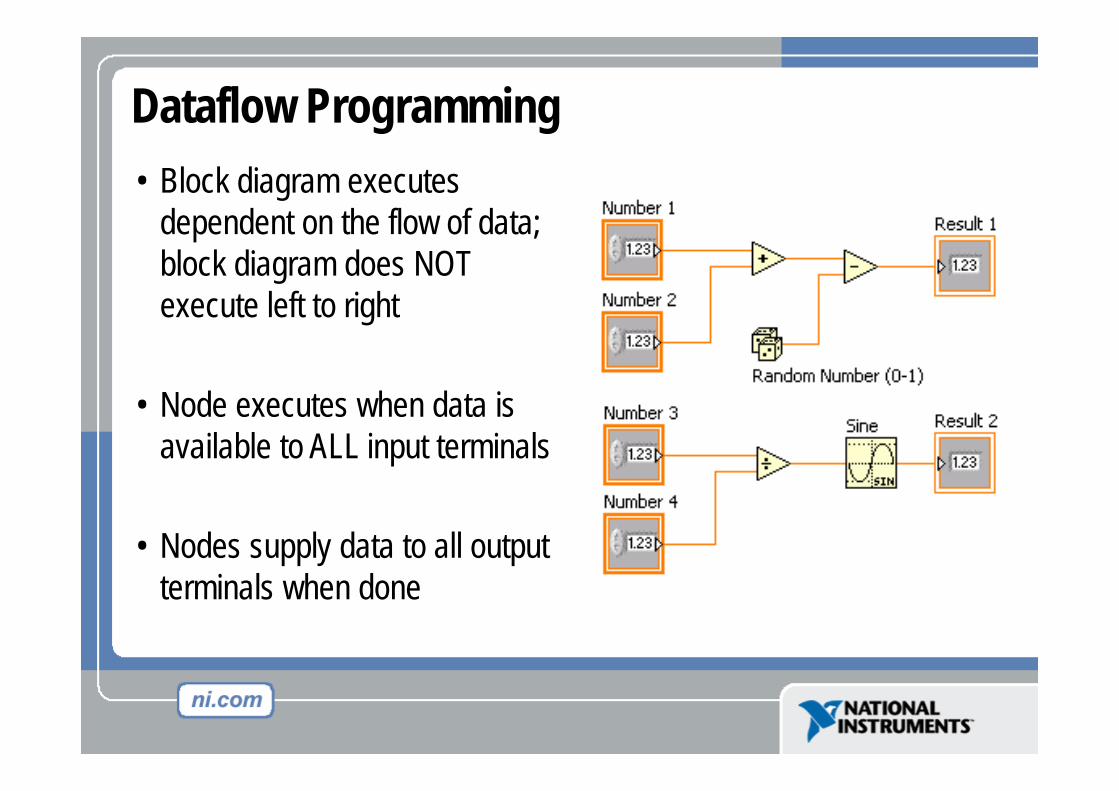
• Block diagram executes dependent on the flow of data; block diagram does NOT execute left to right
• Node executes when data is available to ALL input terminals
• Nodes supply data to all output terminals when done
Dataflow Programming
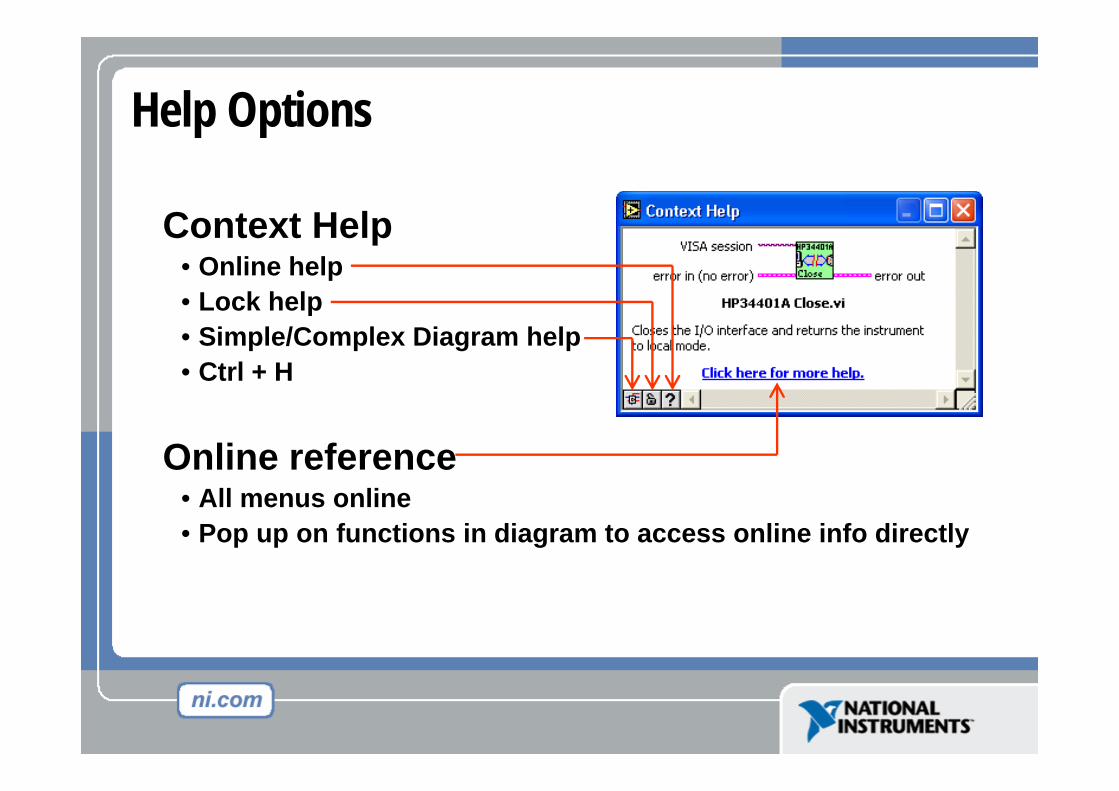
Help Options
Context Help• Online help• Lock help• Simple/Complex Diagram help• Ctrl + H
Online reference• All menus online• Pop up on functions in diagram to access online info directly

Do Not Delete This Slide
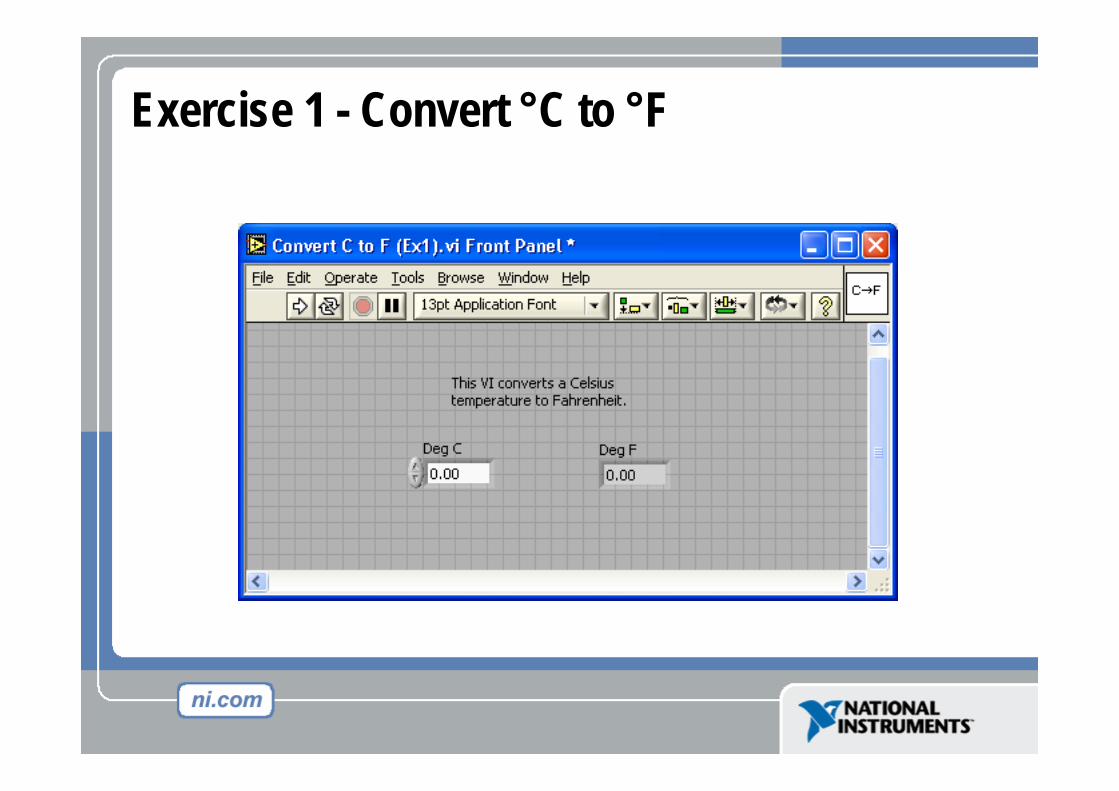
Exercise 1 - Convert °C to °F

Debugging Techniques• Finding Errors
• Execution Highlighting
• Probe
Click on broken Run buttonWindow showing error appears
Click on Execution Highlighting button; data flow is animated using bubbles. Values are displayed on wires.
Right-click on wire to display probe and it shows data as it flows through wire segment
You can also select Probe tool from Tools palette and click on wire

Debugging Techniques – Execution Highlighting
– Use execution highlighting to watch the data flow through the block diagram
– If the VI runs more slowly than expected, confirm that you turned off execution highlighting in subVIs
24
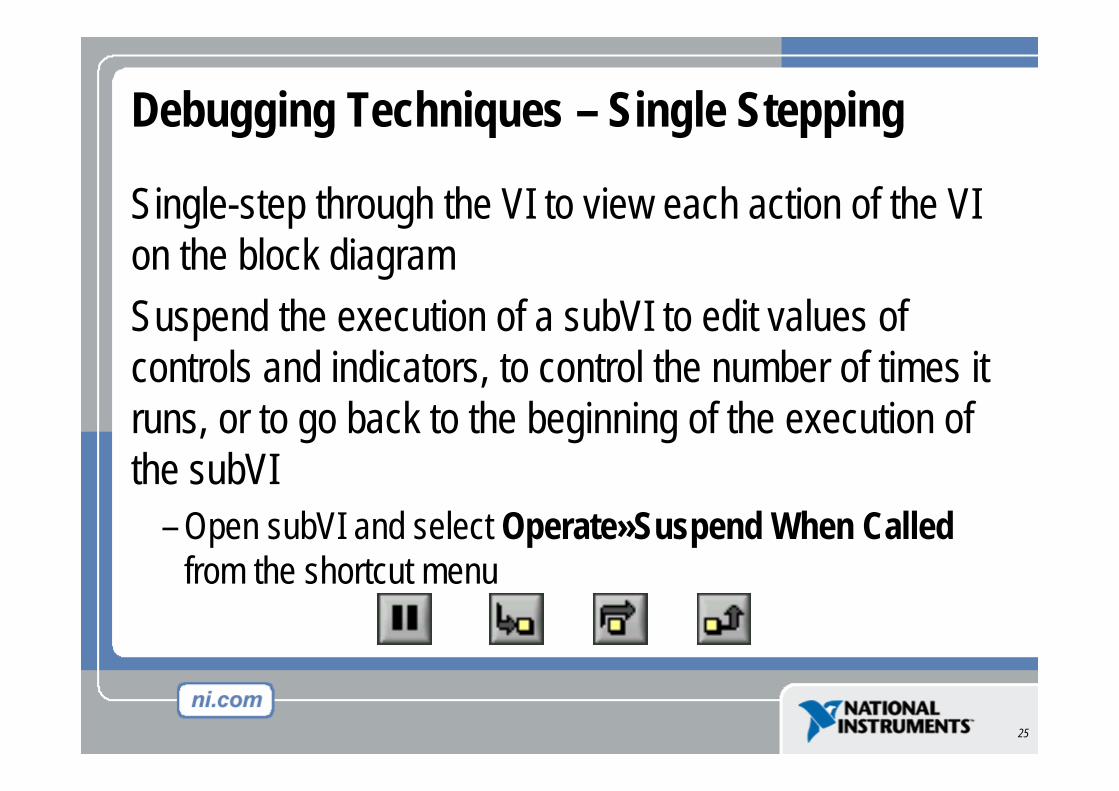
Debugging Techniques – Single Stepping
Single-step through the VI to view each action of the VI on the block diagramSuspend the execution of a subVI to edit values of controls and indicators, to control the number of times it runs, or to go back to the beginning of the execution of the subVI
– Open subVI and select Operate»Suspend When Calledfrom the shortcut menu
25

Debugging Techniques – Probes
– Use the Probe tool to observe intermediate data values and to check the error output of VIs and functions, especially those performing I/O
– Retain the values in the wires so that you can probe wires for data after execution
26

Debugging Techniques – Breakpoints
– When you reach a breakpoint during execution, the VI pauses and the Pause button appears red
– You can take the following actions at a breakpoint:• Single-step through execution using the single-stepping buttons• Probe wires to check intermediate values• Change values of front panel controls • Click the Pause button to continue running to the next breakpoint
or until the VI finishes running
27
Error Checking and Error Handling
– No matter how confident you are in the VI you create, you cannot predict every problem a user can encounter
– Without a mechanism to check for errors, you know only that the VI does not work properly
– Error checking tells you why and where errors occur• Automatic error handling• Manual error handling
28

Error Checking and Error Handling – Automatic Error Handling
– LabVIEW automatically handles any known error when a VI runs by:
• suspending execution,• highlighting the subVI or function where the error occurred,• and displaying the Error dialog box
– Select File»VI Properties and select Execution from the Category pull-down menu to disable automatic error handling for a specific VI
29
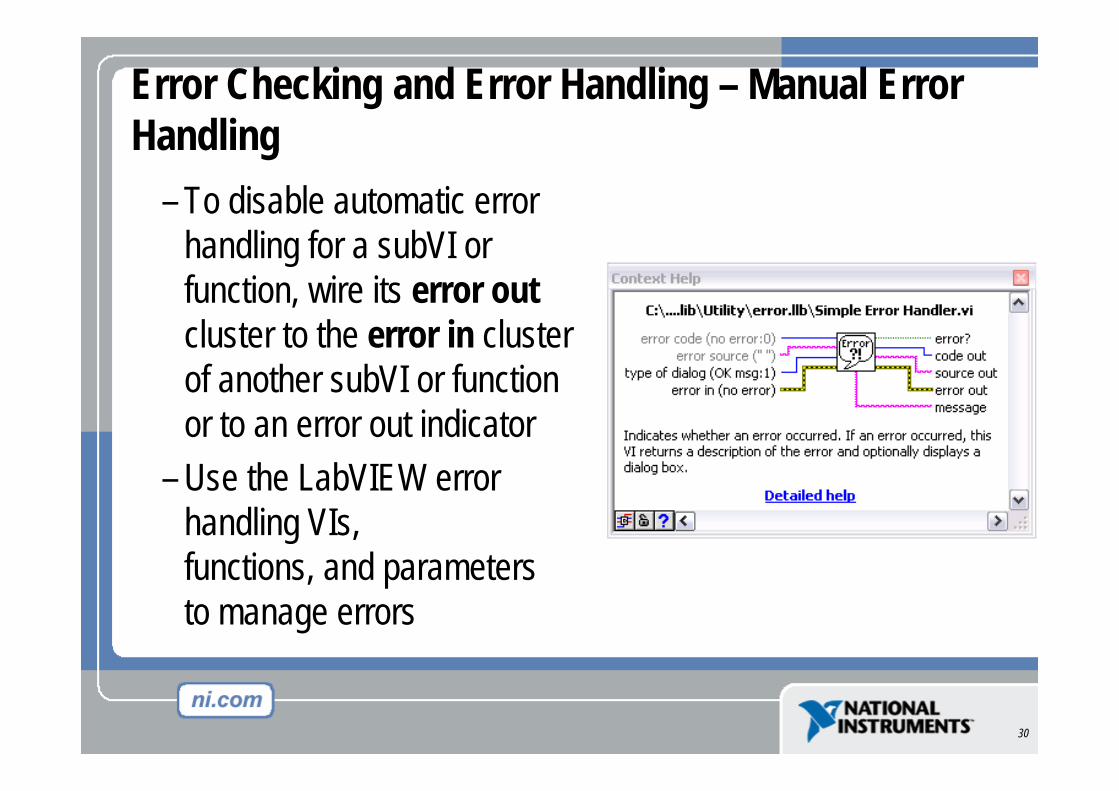
Error Checking and Error Handling – Manual Error Handling
– To disable automatic error handling for a subVI or function, wire its error outcluster to the error in cluster of another subVI or function or to an error out indicator
– Use the LabVIEW error handling VIs, functions, and parameters to manage errors
30
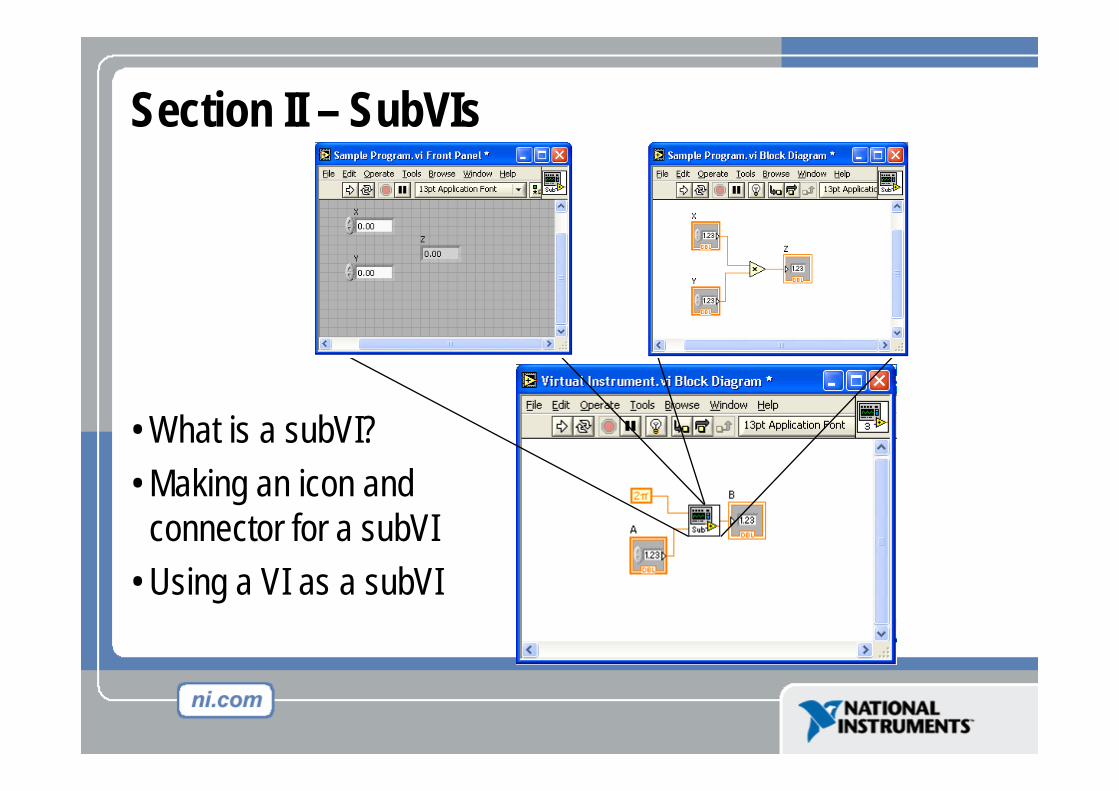
Section II – SubVIs
• What is a subVI?• Making an icon and
connector for a subVI• Using a VI as a subVI
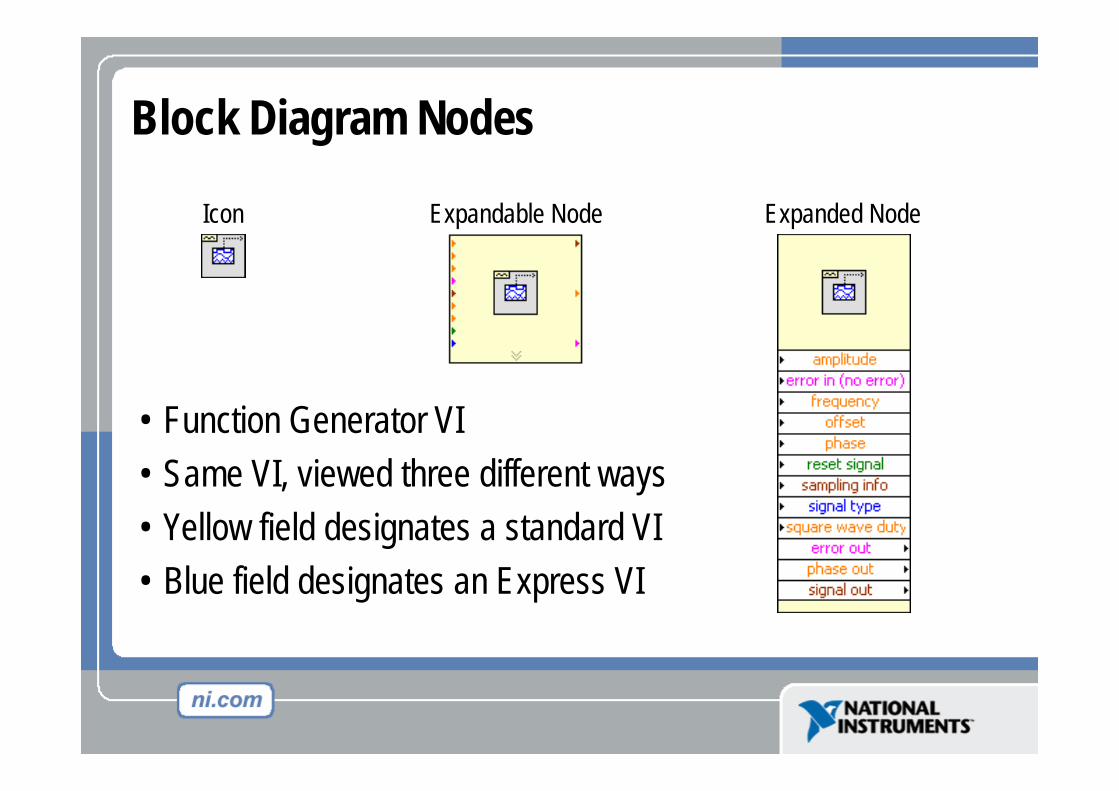
Block Diagram Nodes
Icon Expandable Node Expanded Node
• Function Generator VI• Same VI, viewed three different ways• Yellow field designates a standard VI• Blue field designates an Express VI

SubVIs• A SubVI is a VI that can be used within another VI• Similar to a subroutine• Advantages
– Modular– Easier to debug– Don’t have to recreate code– Require less memory

Icon and Connector
• An icon represents a VI in other block diagrams
• A connector shows available terminals for data transfer
Icon
Connector
Terminals
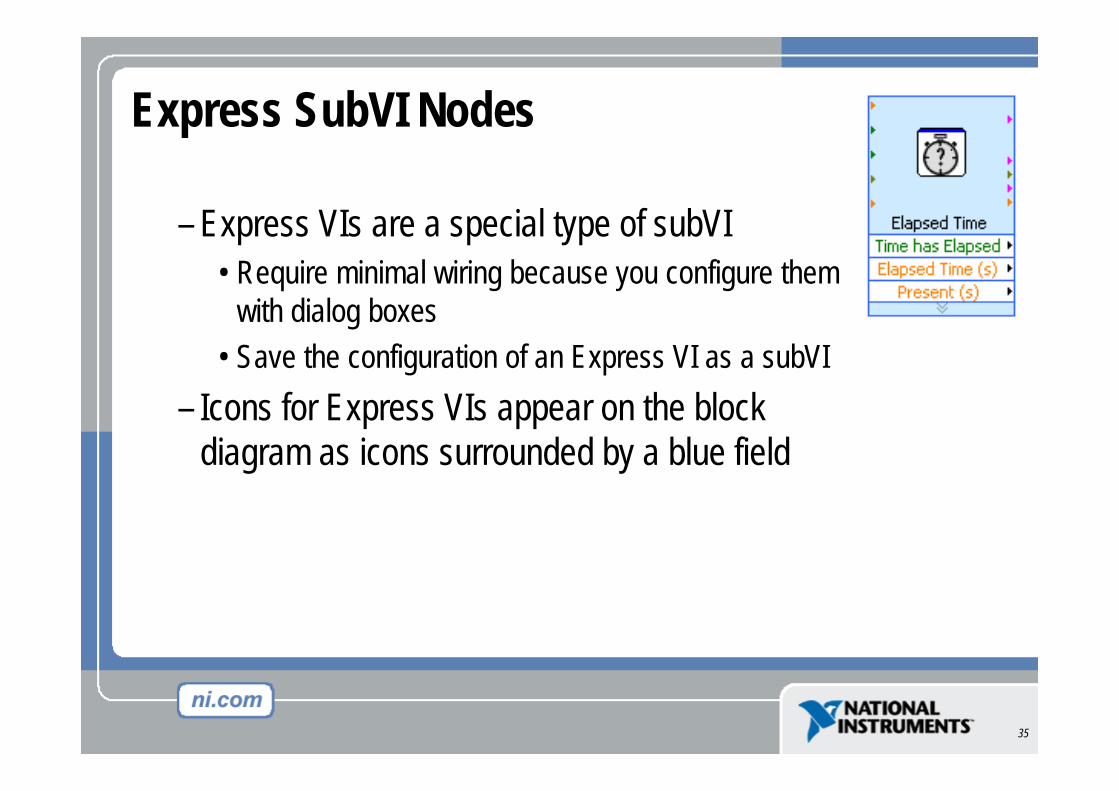
Express SubVI Nodes
– Express VIs are a special type of subVI• Require minimal wiring because you configure them
with dialog boxes• Save the configuration of an Express VI as a subVI
– Icons for Express VIs appear on the block diagram as icons surrounded by a blue field
35

Icons/Expandable Nodes
36

Block Diagram – Wires
– Transfer data between block diagram objects through wires– Wires are different colors, styles, and thicknesses,
depending on their data types– A broken wire appears as a dashed
black line with a red X in the middle
37
Scalar1D Array2D Array
DBL Numeric Integer Numeric String
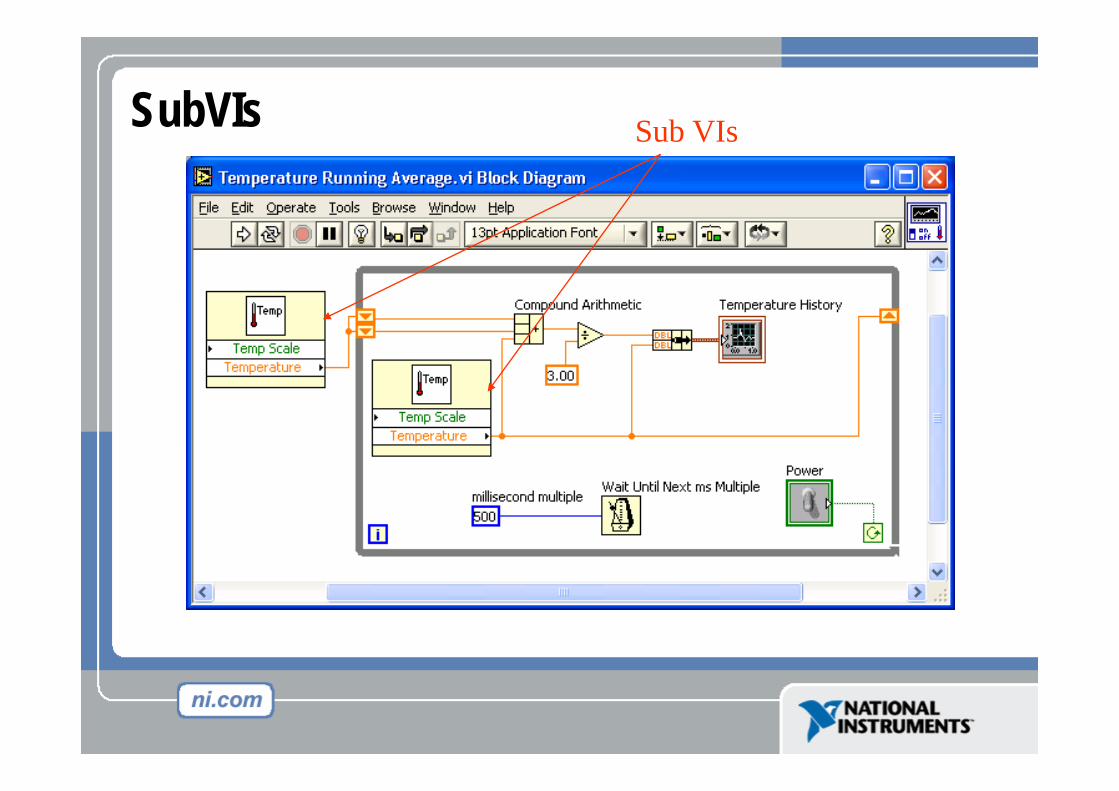
SubVIs Sub VIs

Steps to Create a SubVI
• Create the Icon• Create the Connector• Assign Terminals• Save the VI• Insert the VI into a Top Level VI
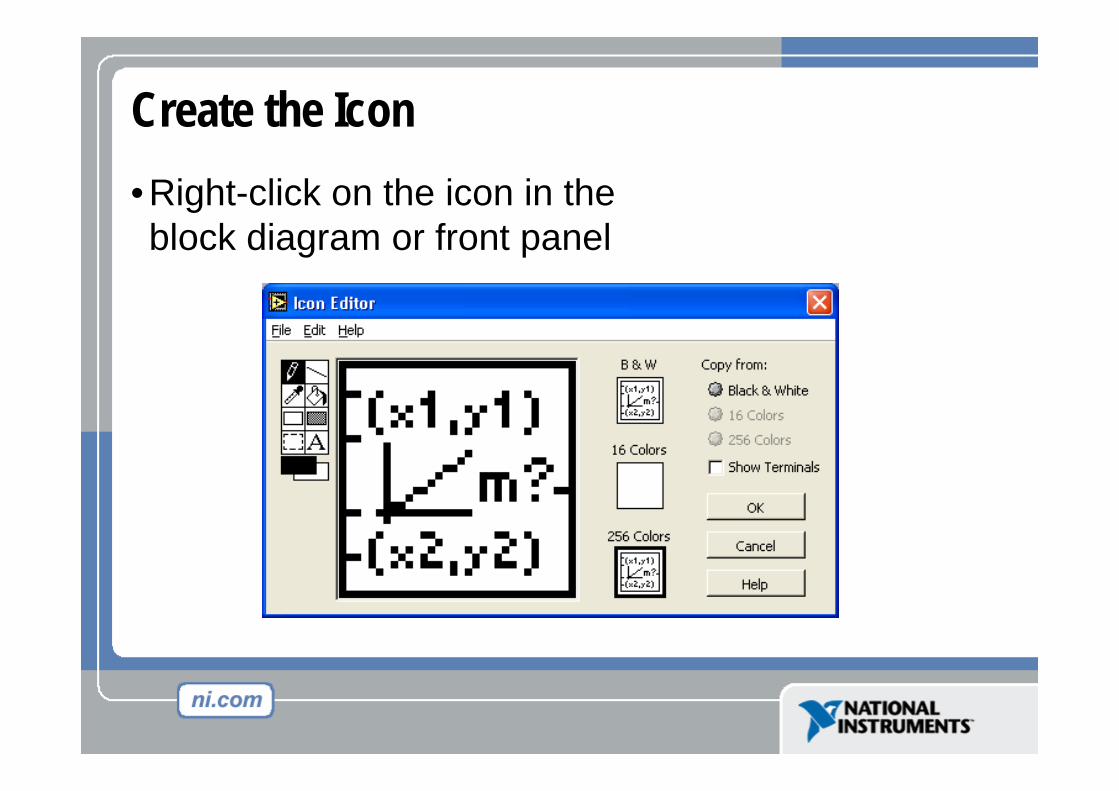
Create the Icon• Right-click on the icon in the block diagram or front panel

Create the ConnectorRight click on the icon pane (front panel only)
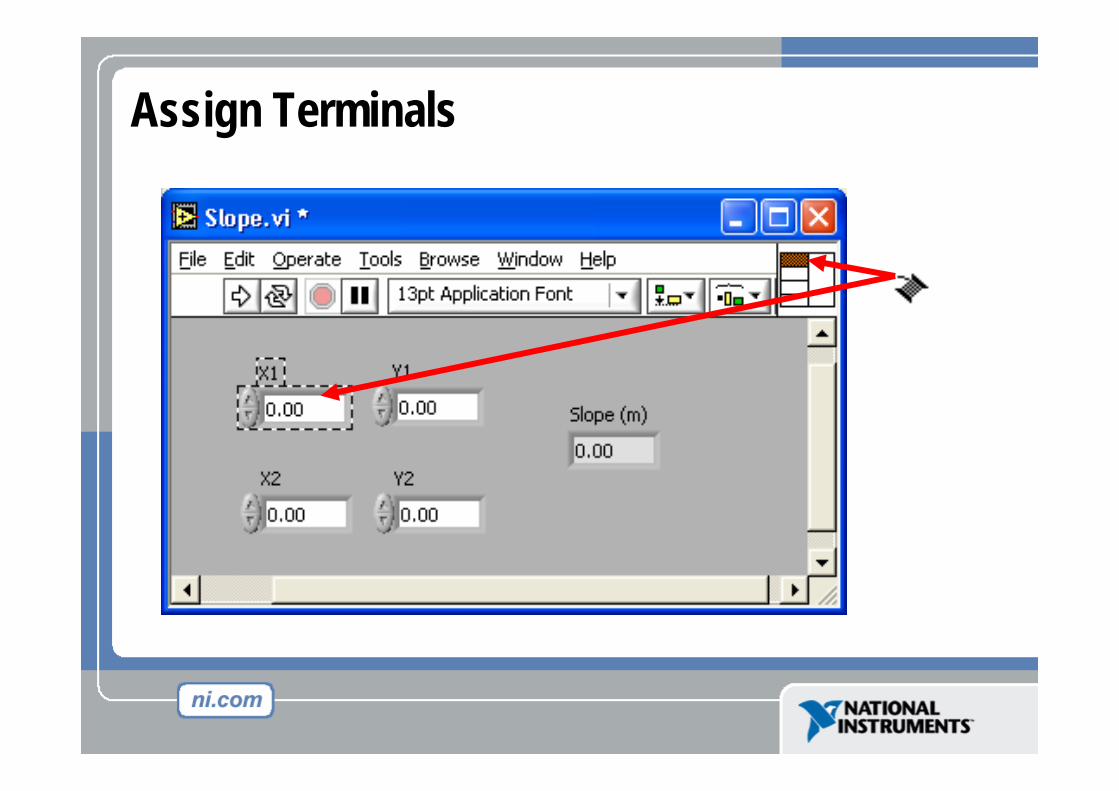
Assign Terminals

Save The VI
• Choose an Easy to Remember Location• Organize by Functionality
– Save Similar VIs into one directory (e.g. Math Utilities)• Organize by Application
– Save all VIs Used for a Specific Application into one directory or library file (e.g. Lab 1 – Frequency Response)
• Library Files (.llbs) combine many VI’s into a single file, ideal for transferring entire applications across computers

Insert the SubVI into a Top Level VIAccessing user-made subVIs
Functions >>All Functions >> Select a VIOr
Drag icon onto target diagram
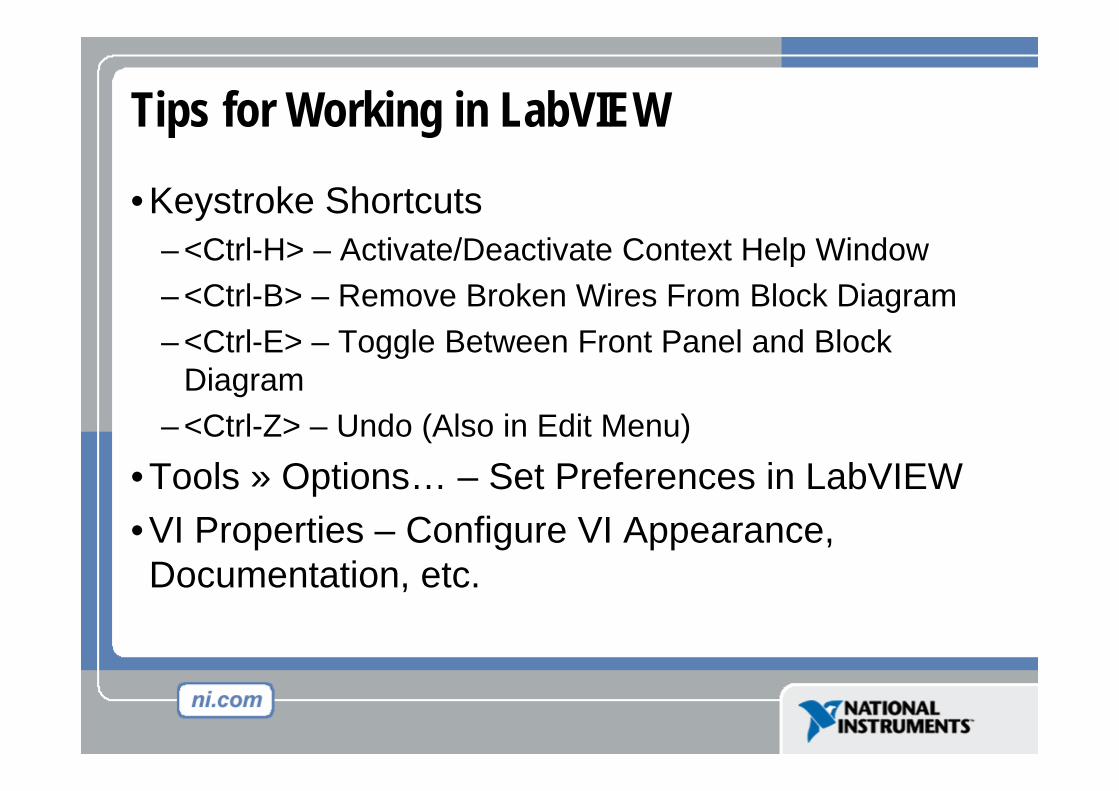
Tips for Working in LabVIEW
• Keystroke Shortcuts– <Ctrl-H> – Activate/Deactivate Context Help Window– <Ctrl-B> – Remove Broken Wires From Block Diagram– <Ctrl-E> – Toggle Between Front Panel and Block
Diagram– <Ctrl-Z> – Undo (Also in Edit Menu)
• Tools » Options… – Set Preferences in LabVIEW• VI Properties – Configure VI Appearance, Documentation, etc.

Section III – Data Acquisition
• Data acquisition (DAQ) basics• Connecting Signals• Simple DAQ application
Computer
DAQ Device
Terminal Block
Cable
Sensors

Data Acquisition in LabVIEW
Traditional NI-DAQSpecific VIs for performing:• Analog Input• Analog Output• Digital I/O• Counter operations
NI-DAQmxNext generation driver: • VIs for performing a
task• One set of VIs for all
measurement types

DAQ – Data AcquisitionTemperature Acquisition using the DAQ Assistant
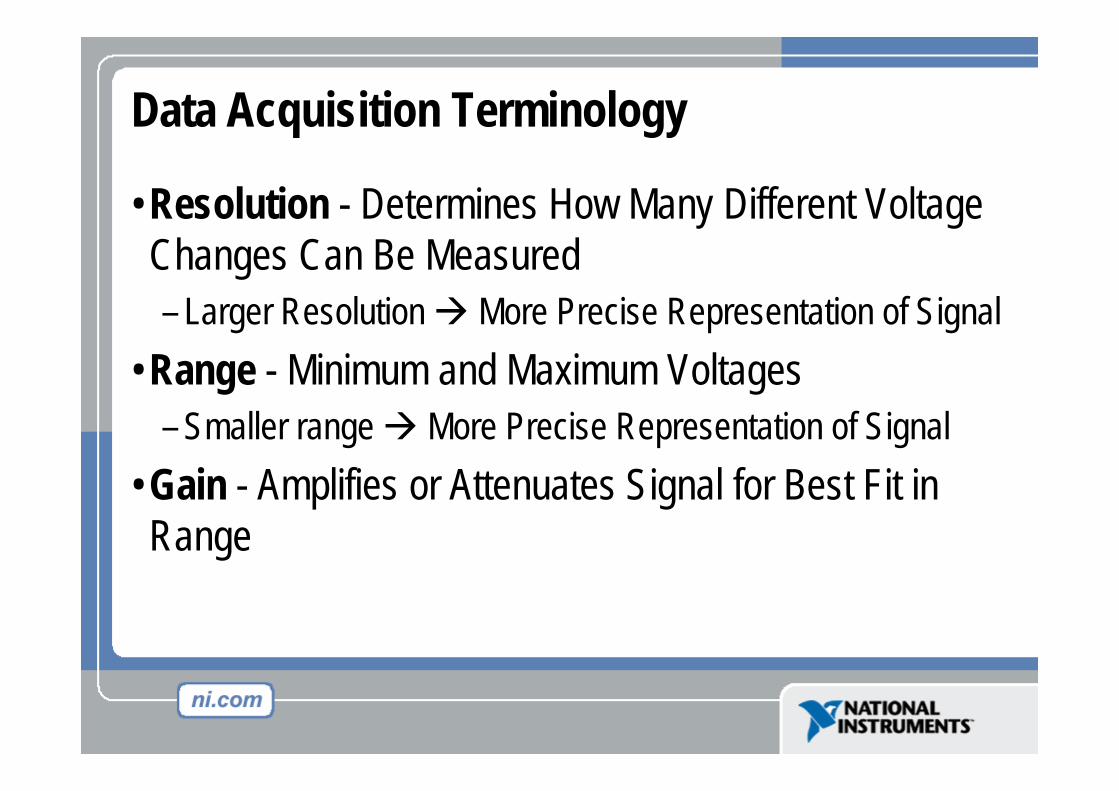
Data Acquisition Terminology
• Resolution - Determines How Many Different Voltage Changes Can Be Measured– Larger Resolution More Precise Representation of Signal
• Range - Minimum and Maximum Voltages– Smaller range More Precise Representation of Signal
• Gain - Amplifies or Attenuates Signal for Best Fit in Range

Do Not Delete This Slide

Hardware Connections
BNC-2120 PCI-6014
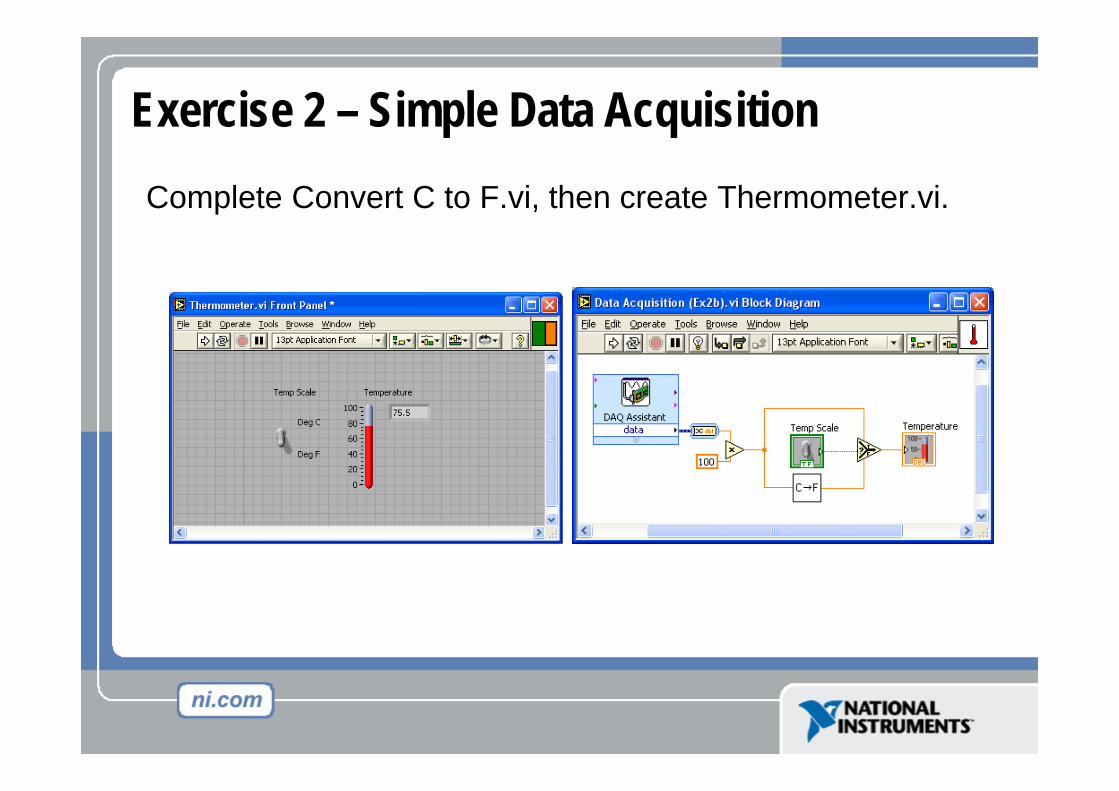
Exercise 2 – Simple Data AcquisitionComplete Convert C to F.vi, then create Thermometer.vi.

Do Not Delete This Slide

Section IV – Loops and Charts
• For Loop• While Loop• Charts• Multiplots

While Loops
LabVIEW While Loop Flowchart Pseudo Code
Repeat (code);
Until Condition met;
End;

While Loops1. Select the loop 2. Enclose code to be repeated
3. Drop or drag additional nodes and then wire

While Loops
– Iteration terminal: returns number of times loop has executed; zero indexed
– Conditional terminal: defines when the loop stops
Iteration Terminal Conditional Terminal

While Loops – Tunnels – Tunnels transfer data into and out of structures– The tunnel adopts the color of the data type wired to the
tunnel– Data pass out of a loop after the loop terminates– When a tunnel
passes data into a loop, the loop executes only after data arrive at the tunnel
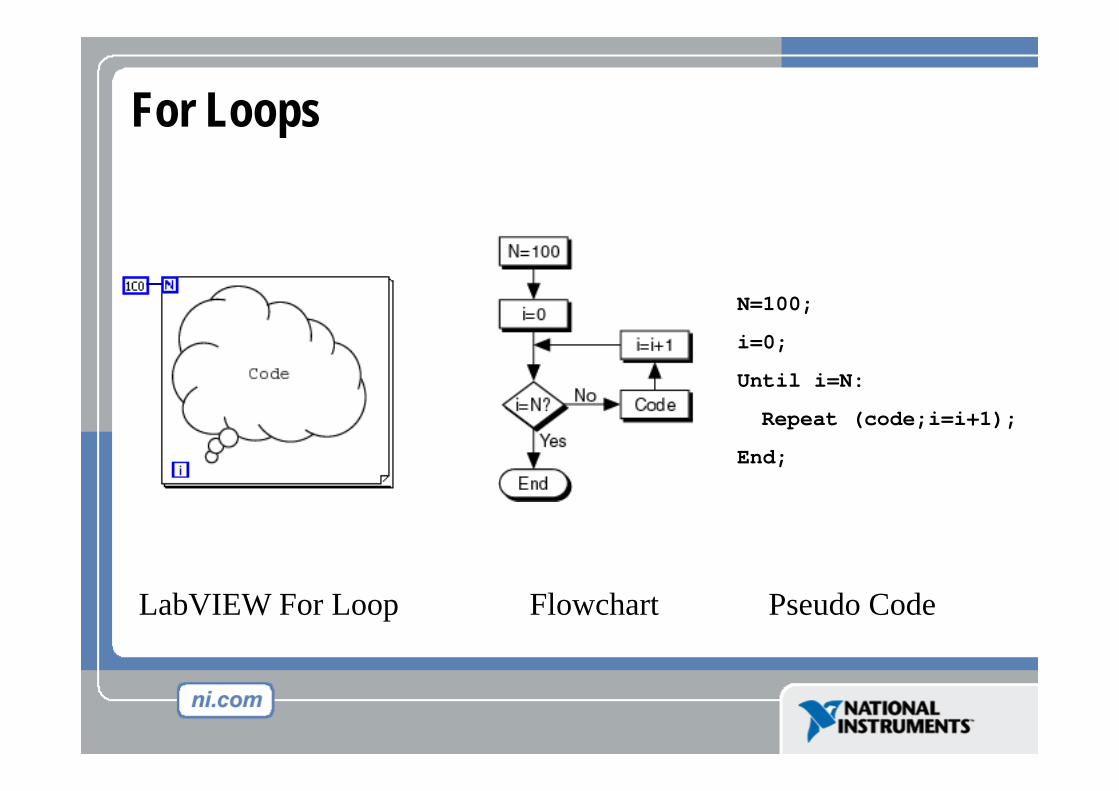
For Loops
LabVIEW For Loop Flowchart Pseudo Code
N=100;
i=0;
Until i=N:
Repeat (code;i=i+1);
End;

For Loops
– Create a For Loop the same way you create a While Loop– If you need to replace an existing While Loop with a For
Loop, right-click the border of the While Loop, and select Replace with For Loop from the shortcut menu
– The value in the count terminal (an input terminal) indicates how many times to repeat the subdiagram
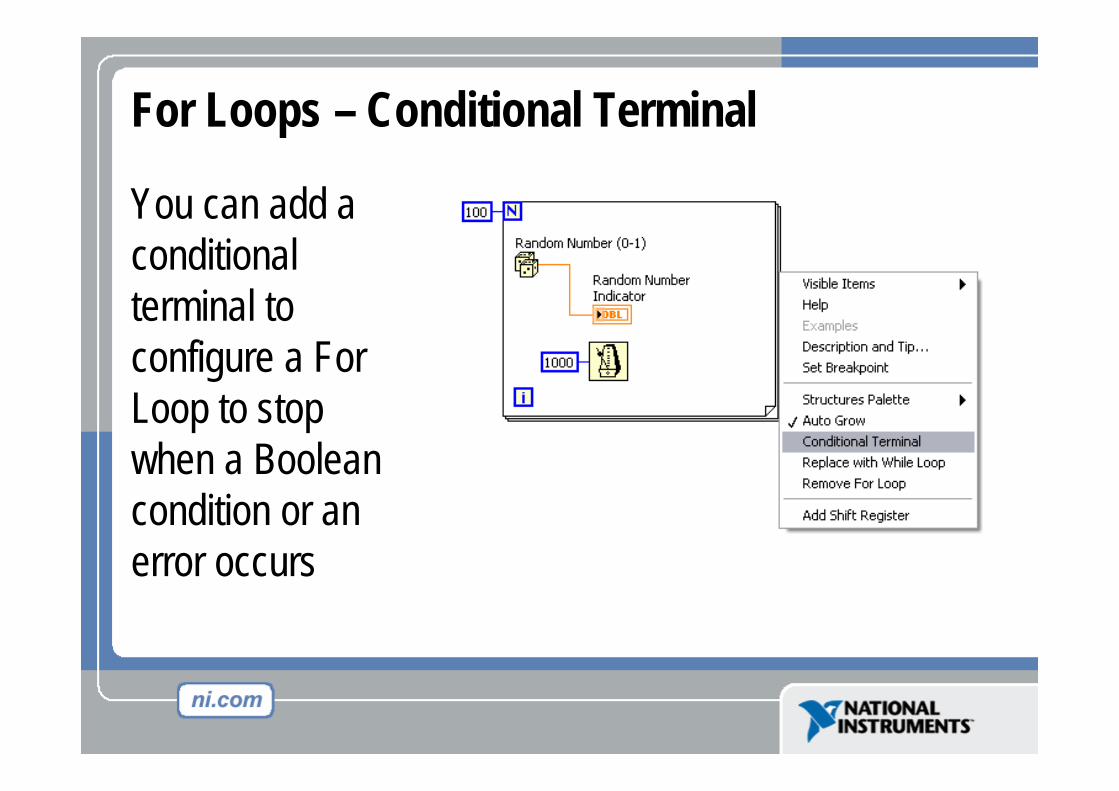
For Loops – Conditional Terminal
You can add a conditional terminal to configure a For Loop to stop when a Boolean condition or an error occurs
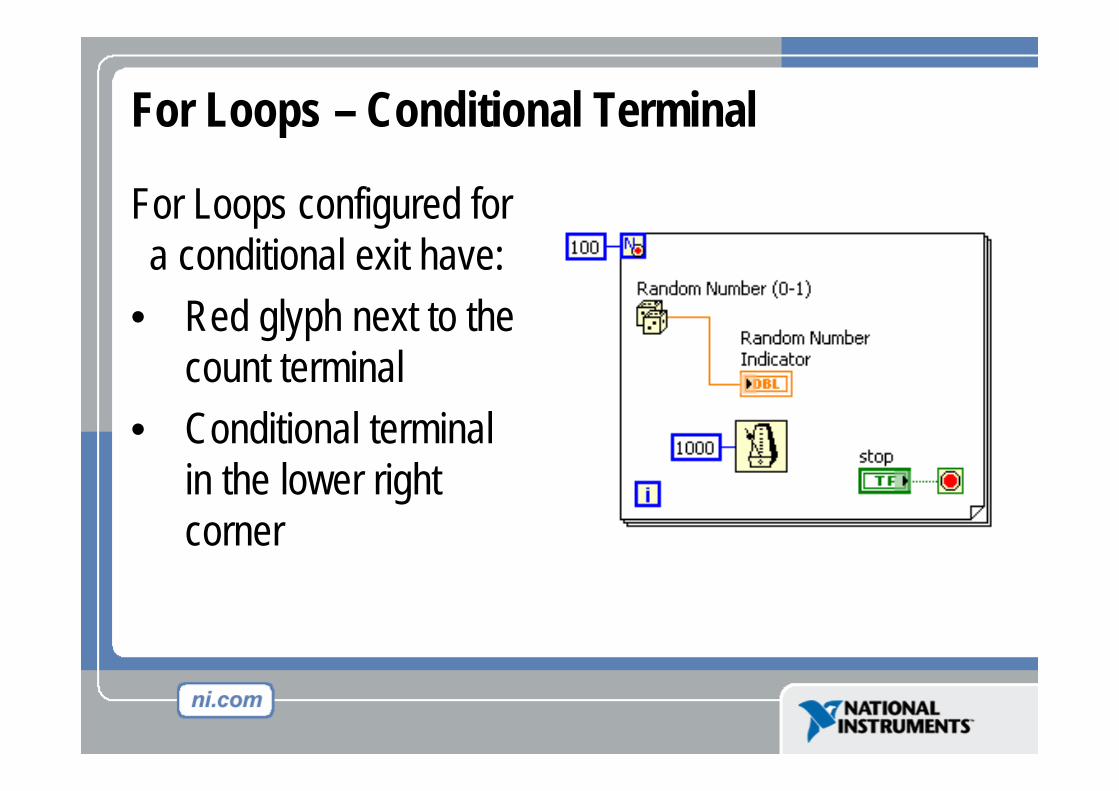
For Loops – Conditional Terminal
For Loops configured for a conditional exit have:
• Red glyph next to the count terminal
• Conditional terminal in the lower right corner
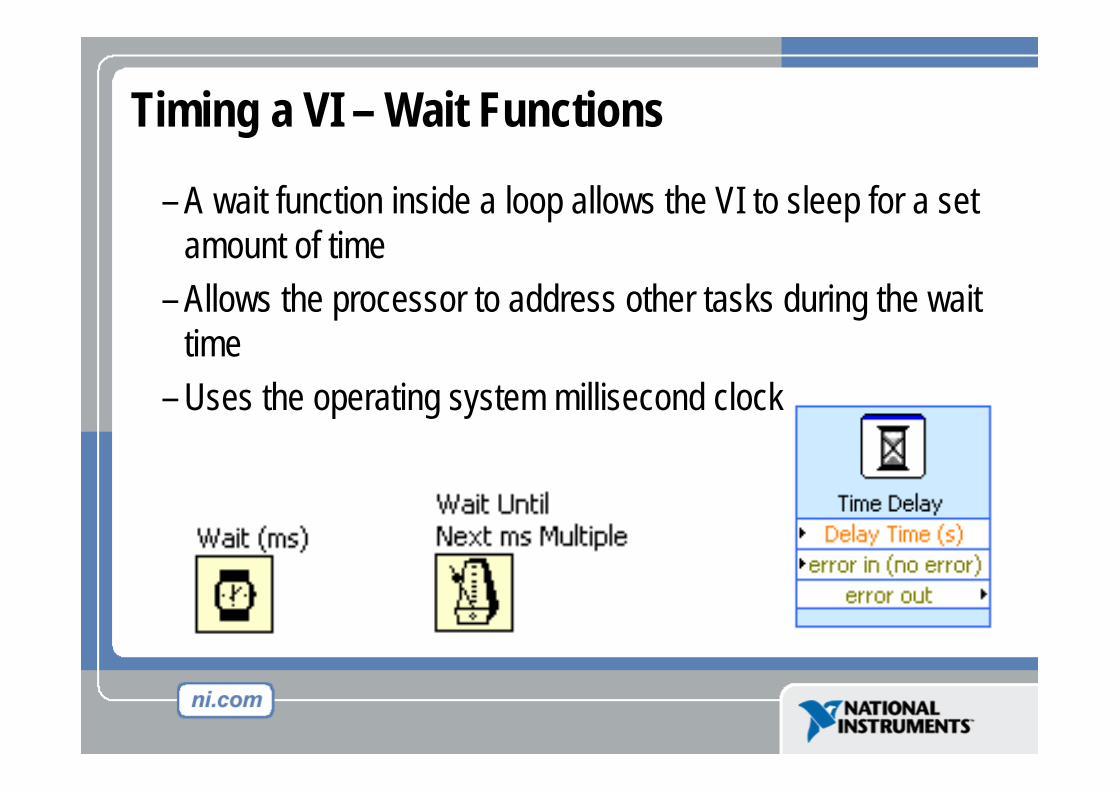
Timing a VI – Wait Functions
– A wait function inside a loop allows the VI to sleep for a set amount of time
– Allows the processor to address other tasks during the wait time
– Uses the operating system millisecond clock
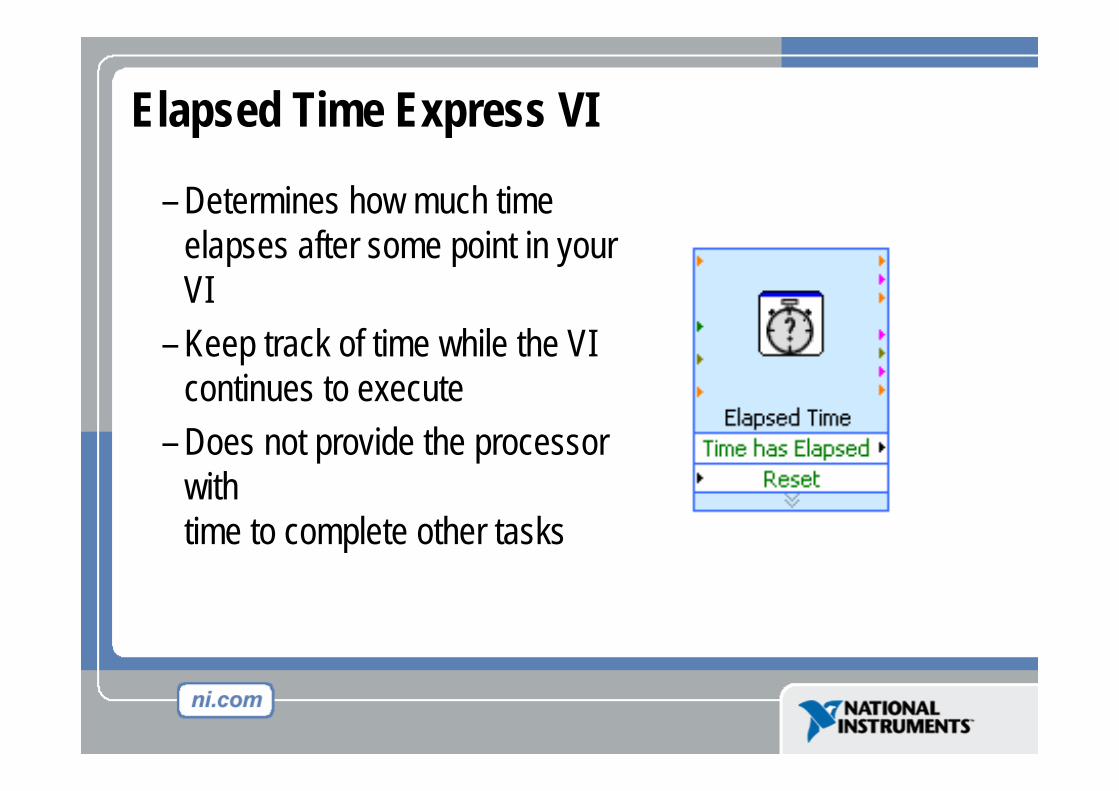
Elapsed Time Express VI
– Determines how much time elapses after some point in your VI
– Keep track of time while the VI continues to execute
– Does not provide the processor with time to complete other tasks

Charts
Waveform chart – special numeric indicator that can display a history of values
Controls >> Graph Indicators >> Waveform Chart

Wiring Data into Charts
Single Plot Charts Multiplot Charts

Iterative Data Transfer
– When programming with loops, you often need to know the values of data from previous iterations of the loop
– Shift registers transfer values from one loop iteration to the next
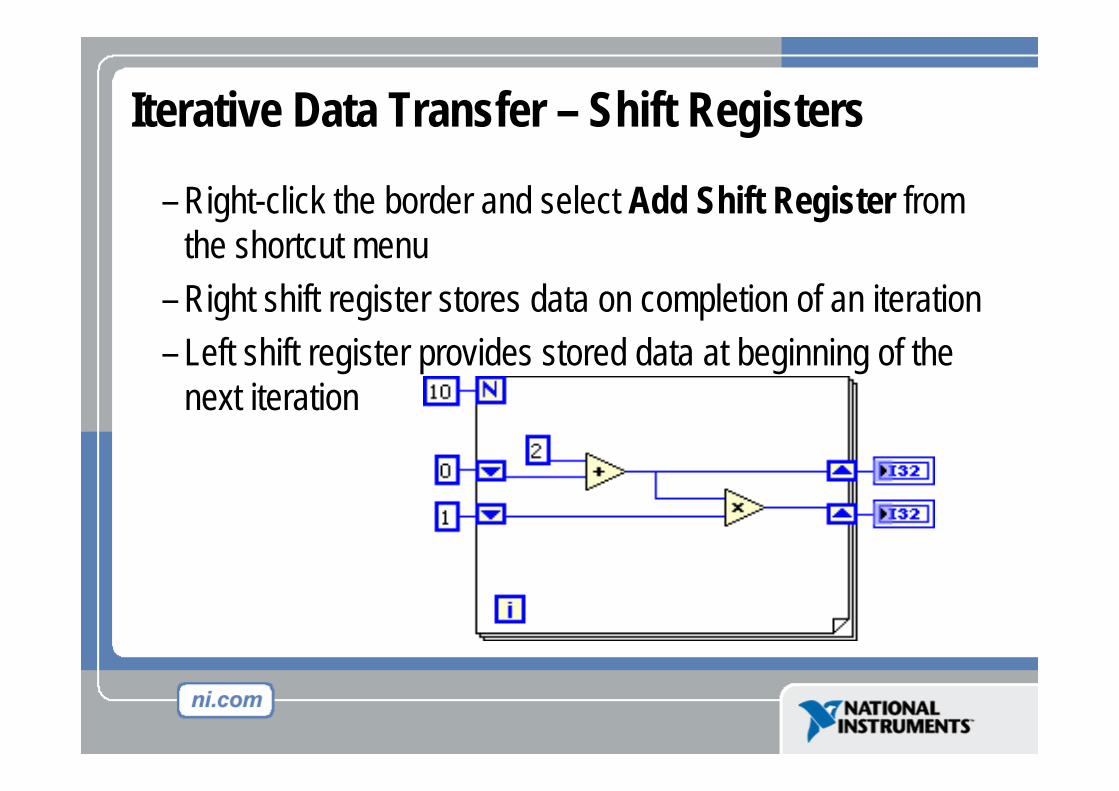
Iterative Data Transfer – Shift Registers
– Right-click the border and select Add Shift Register from the shortcut menu
– Right shift register stores data on completion of an iteration– Left shift register provides stored data at beginning of the
next iteration

Block Diagram 1st run 2nd runInitializedShiftRegister
Output = 5 Output = 5
Not InitializedShiftRegister
Output = 4 Output = 8
Iterative Data Transfer – InitializingVI finishes Run againRun once
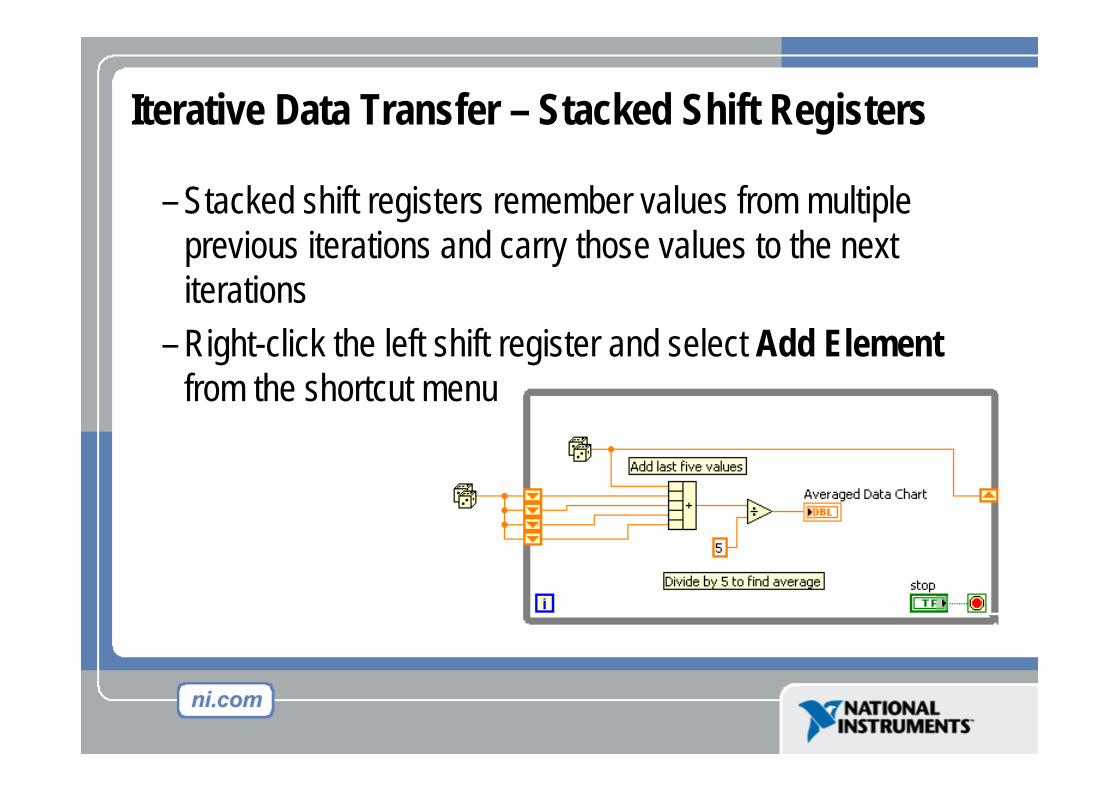
Iterative Data Transfer – Stacked Shift Registers
– Stacked shift registers remember values from multiple previous iterations and carry those values to the next iterations
– Right-click the left shift register and select Add Elementfrom the shortcut menu

Exercise 3 – Using loops Students build Use a loop.vi.
Section V – Arrays & File I/O• Build arrays manually• Have LabVIEW build arrays automatically• Write to a spreadsheet file• Read from a spreadsheet file

Adding an Array to the Front PanelFrom the Controls >> All Controls >> Array and Cluster subpalette, select the Array Shell
Drop it on the screen.
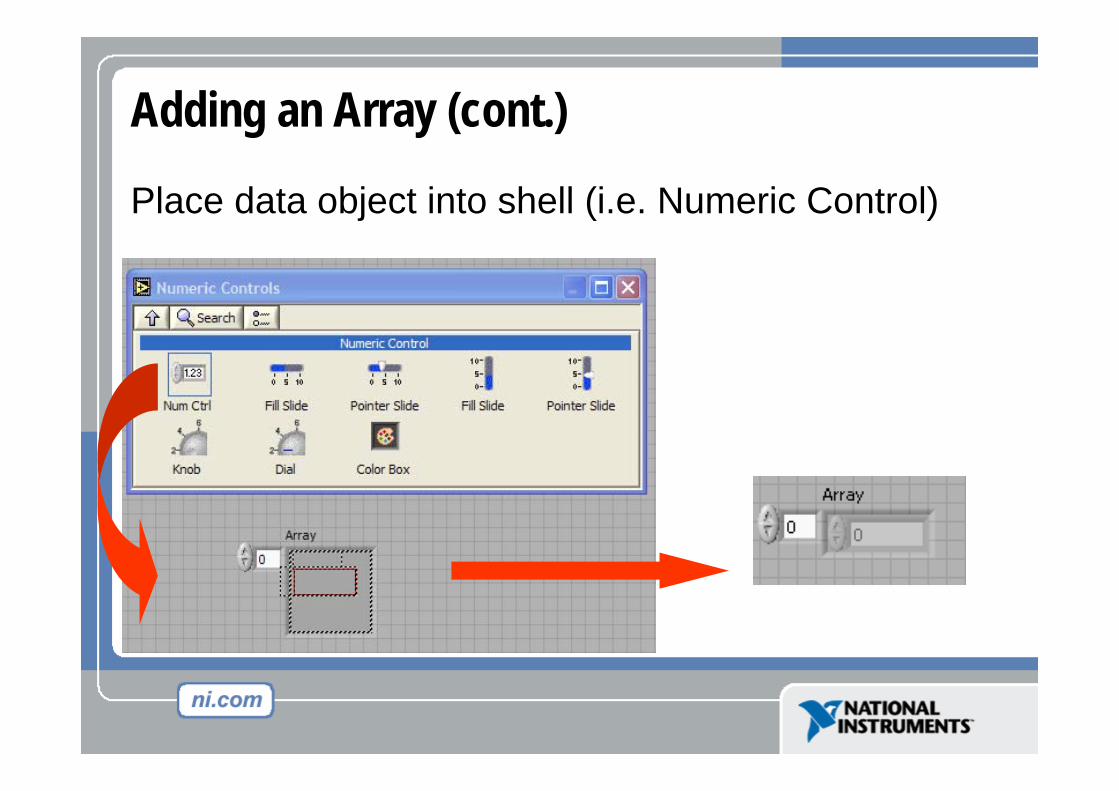
Adding an Array (cont.)
Place data object into shell (i.e. Numeric Control)

Creating an Array with a Loop
• Loops accumulate arrays at their boundaries
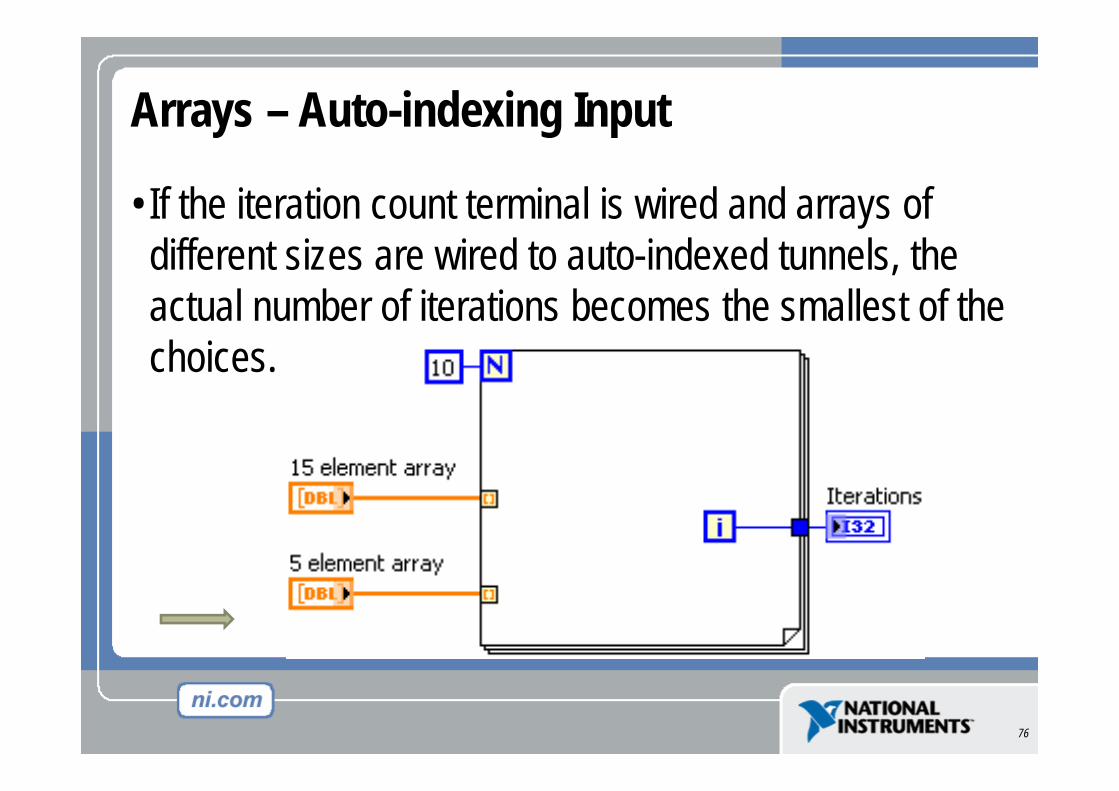
Arrays – Auto-indexing Input
• If the iteration count terminal is wired and arrays of different sizes are wired to auto-indexed tunnels, the actual number of iterations becomes the smallest of the choices.
76

Arrays – Auto-indexing Output
– When you auto-index an array output tunnel, the output array receives a new element from every iteration of the loop
– Auto-indexed output arrays are always equal in size to the number of iterations
77
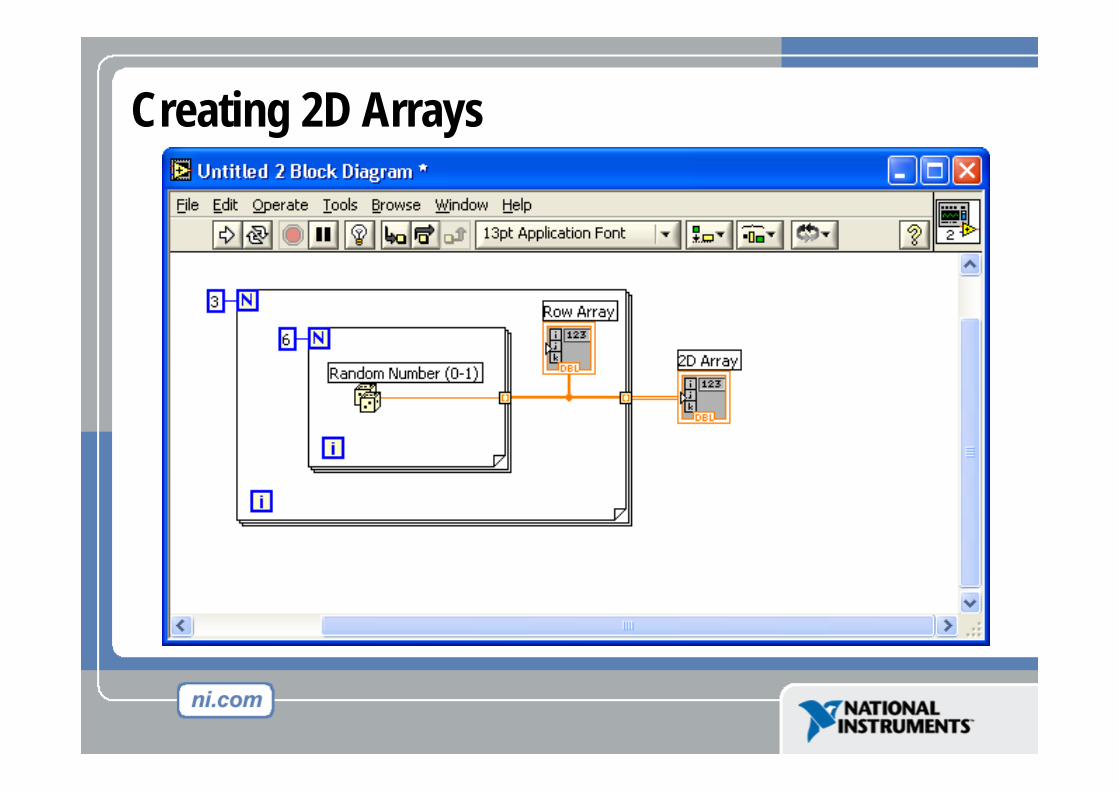
Creating 2D Arrays
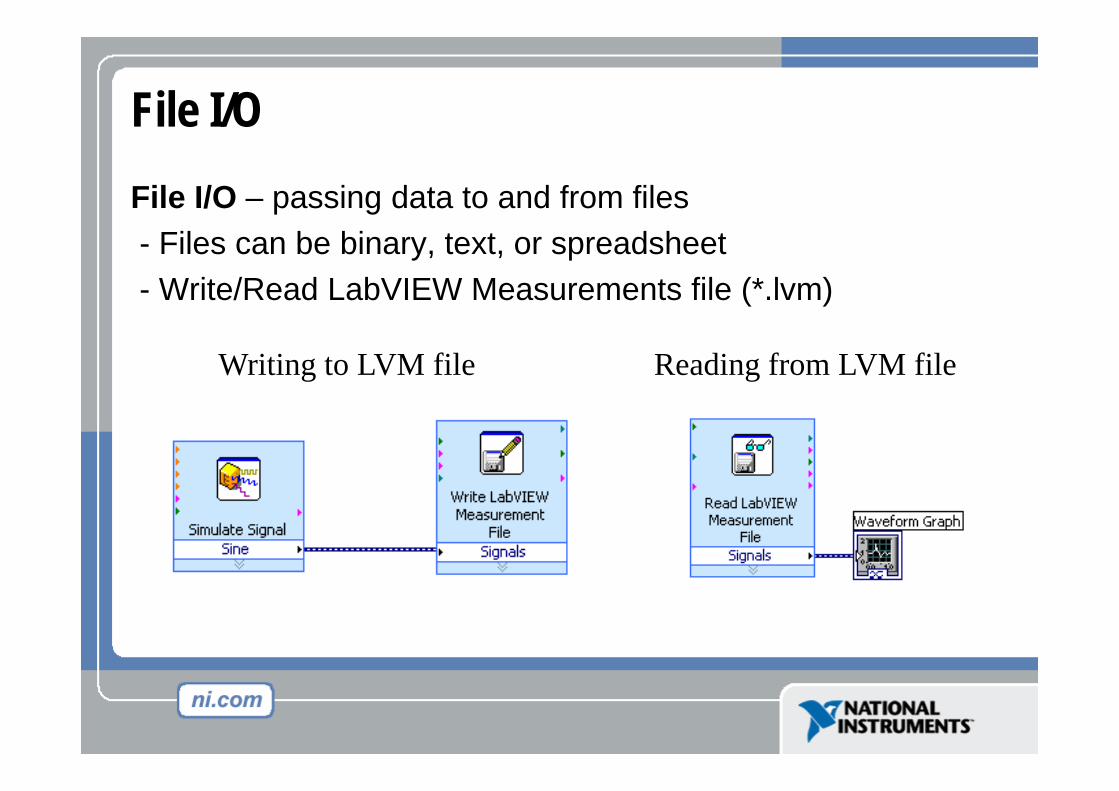
File I/OFile I/O – passing data to and from files- Files can be binary, text, or spreadsheet- Write/Read LabVIEW Measurements file (*.lvm)
Writing to LVM file Reading from LVM file

Write LabVIEW Measurement File• Includes the open, write, close and error handling functions • Handles formatting the string with either a tab or comma
delimiter • Merge Signals function is used to combine data into the
dynamic data type
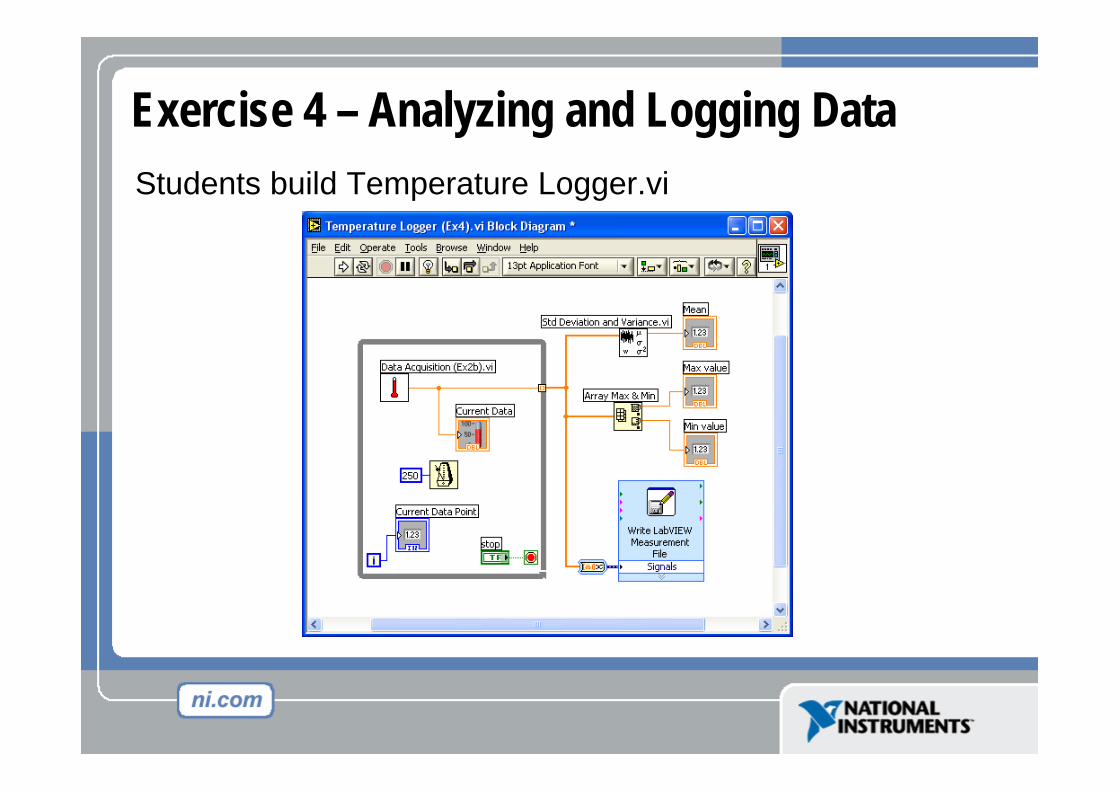
Exercise 4 – Analyzing and Logging DataStudents build Temperature Logger.vi
Section VI – Array Functions & Graphs
• Basic Array Functions• Use graphs• Create multiplots with graphs

Array Functions – BasicsFunctions >> All functions>> Array

Array Functions – Build Array

Graphs• Selected from the Graph palette of Controls menuControls>>All Controls>>Graphs
Waveform Graph – Plot an array of numbers against their indicesExpress XY Graph – Plot one array against anotherDigital Waveform Graph – Plot bits from binary data

Do Not Delete This Slide
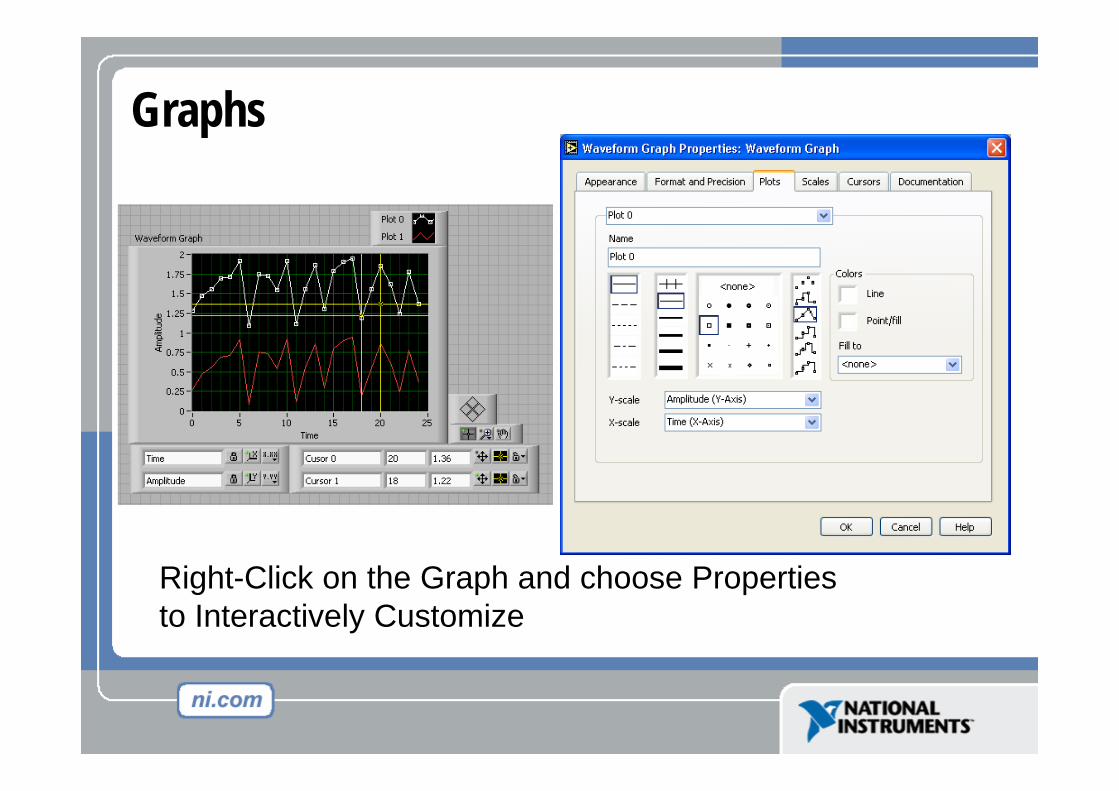
Graphs
Right-Click on the Graph and choose Propertiesto Interactively Customize
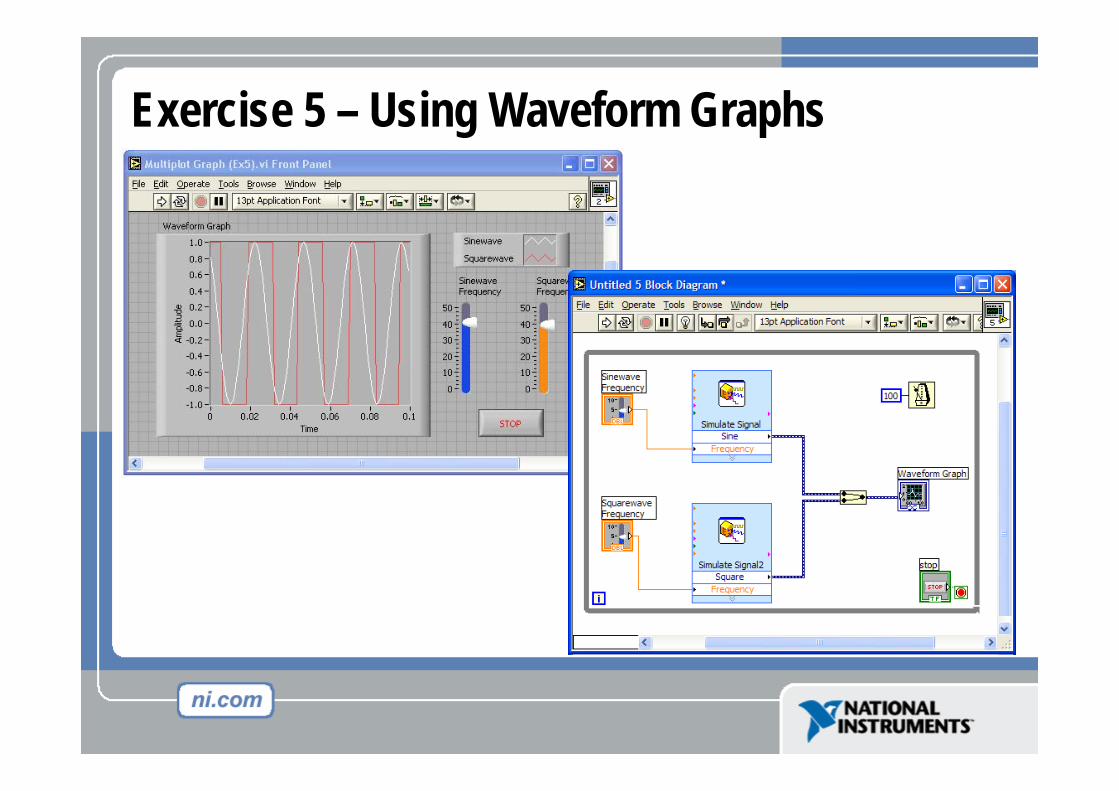
Exercise 5 – Using Waveform Graphs

Section VII – Strings, Clusters, & Error Handling
• Strings• Creating Clusters• Cluster Functions• Error I/O

Strings• A string is a sequence of displayable or nondisplayable
characters (ASCII)• Many uses – displaying messages, instrument control, file
I/O• String control/indicator is in the Controls »Text Control or
Text Indicator

Clusters
• Data structure that groups data together• Data may be of different types• Analogous to struct in C• Elements must be either all controls or all indicators• Thought of as wires bundled into a cable
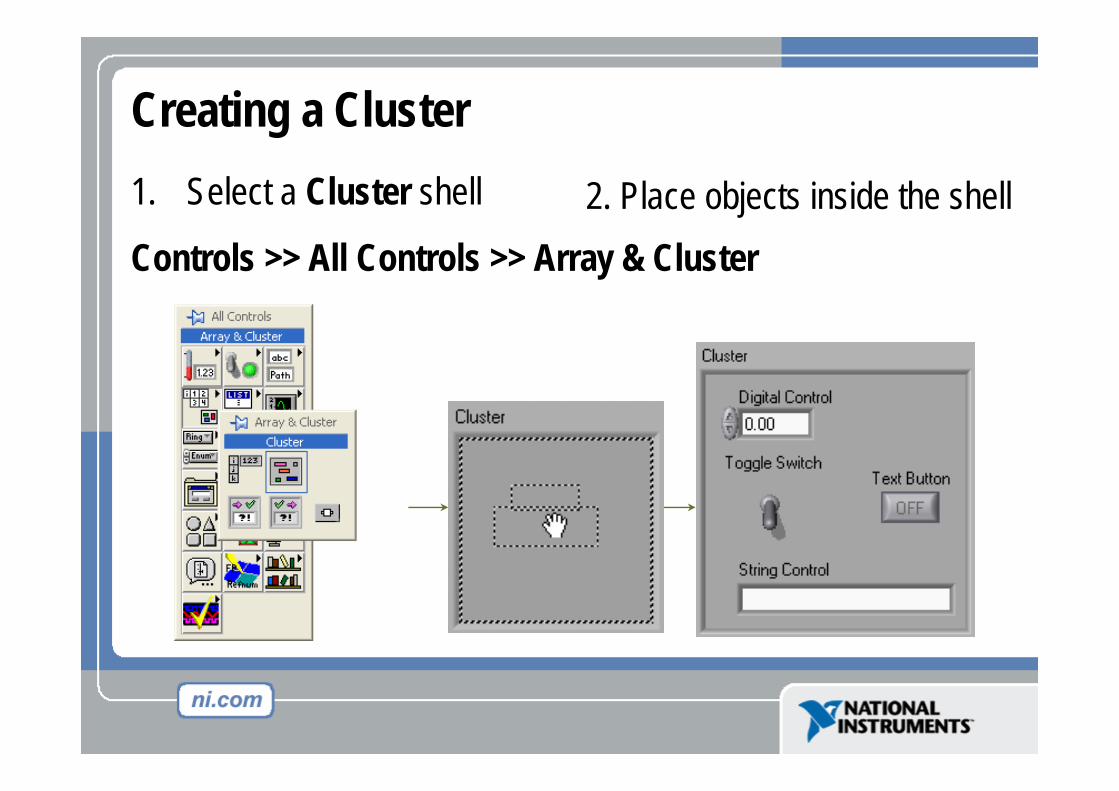
Creating a Cluster1. Select a Cluster shell
Controls >> All Controls >> Array & Cluster2. Place objects inside the shell

Cluster Functions• In the Cluster subpalette of the Functions>>All
functions palette• Can also be accessed by right-clicking on the cluster
terminal
Bundle
(Terminal labels reflect data type)
Bundle By Name

Cluster Functions
Unbundle
Unbundle By Name
Unbundled cluster in the diagram
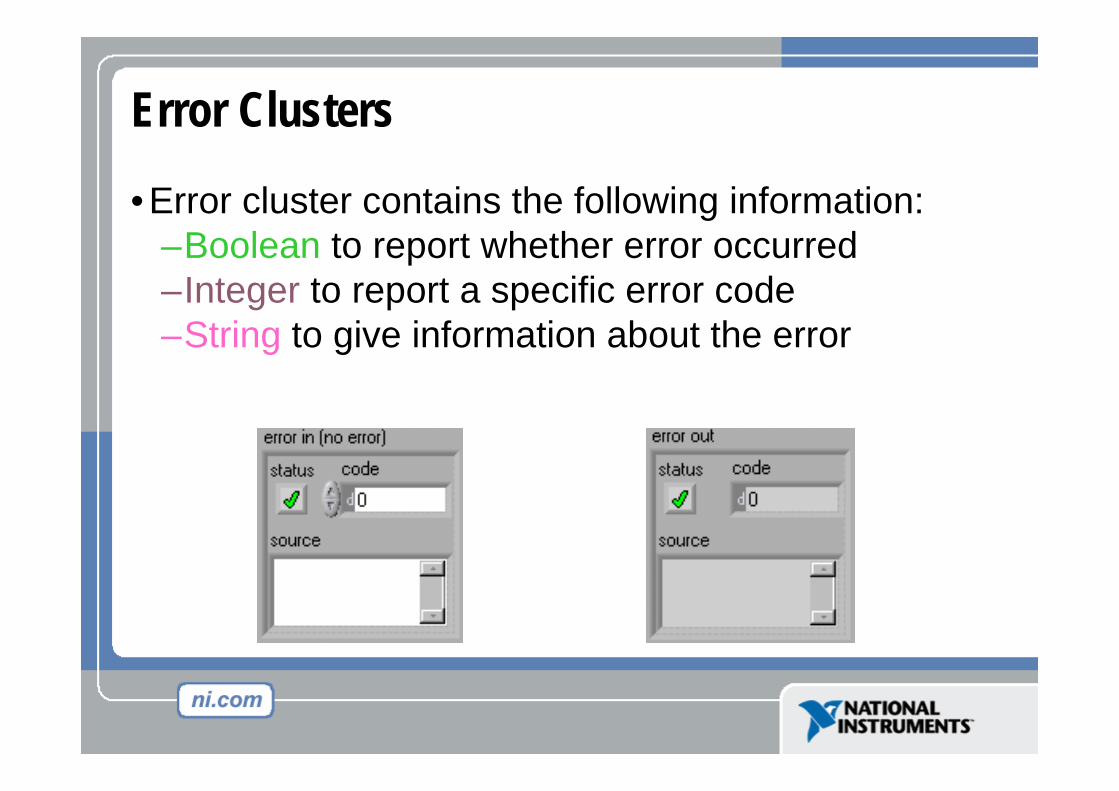
Error Clusters
• Error cluster contains the following information:–Boolean to report whether error occurred–Integer to report a specific error code–String to give information about the error

Error Handling Techniques• Error information is passed from one subVI to the next• If an error occurs in one subVI, all subsequent subVIs are
not executed in the usual manner• Error Clusters contain all error conditions• Automatic Error Handling
error clusters
Section VIII - Case & Sequence Structures, Formula Nodes
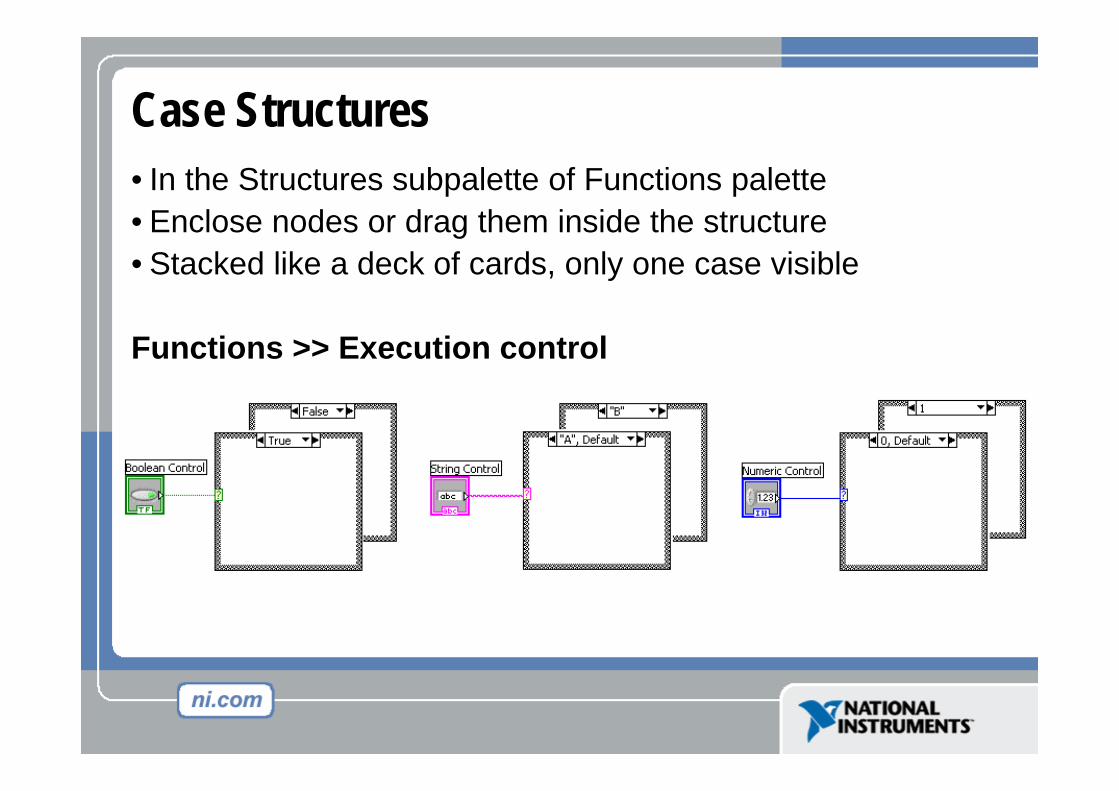
Case Structures• In the Structures subpalette of Functions palette• Enclose nodes or drag them inside the structure• Stacked like a deck of cards, only one case visible
Functions >> Execution control
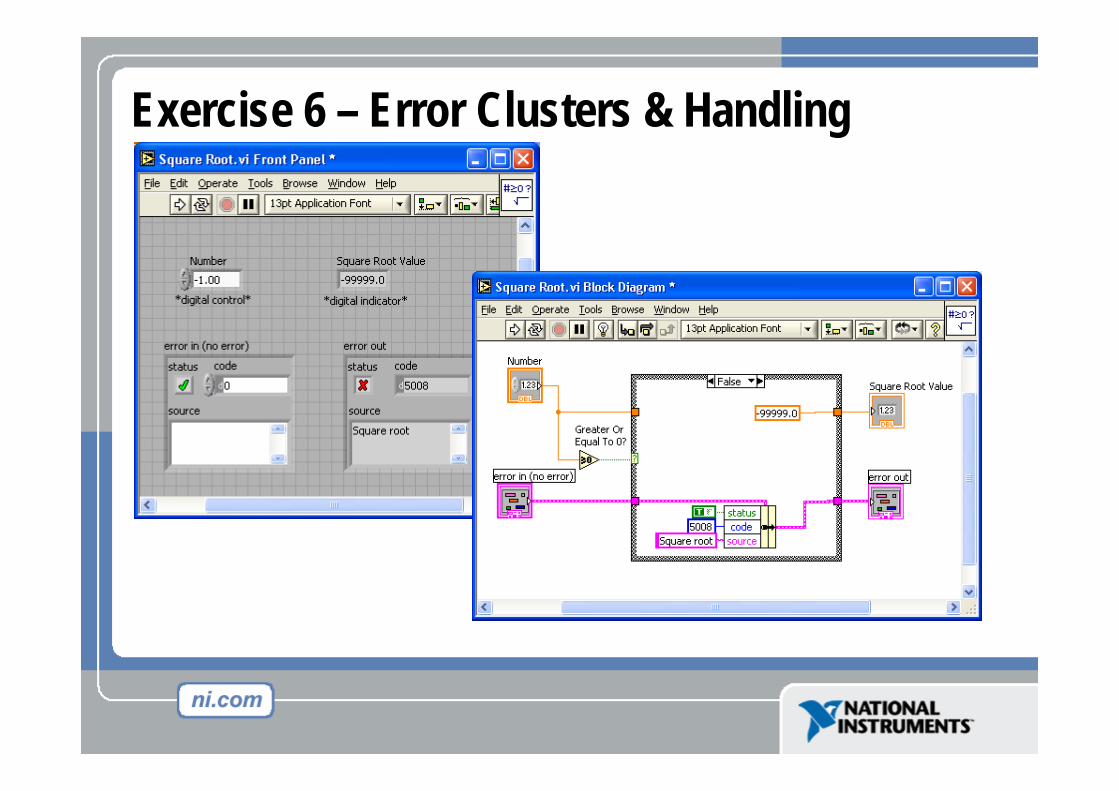
Exercise 6 – Error Clusters & Handling
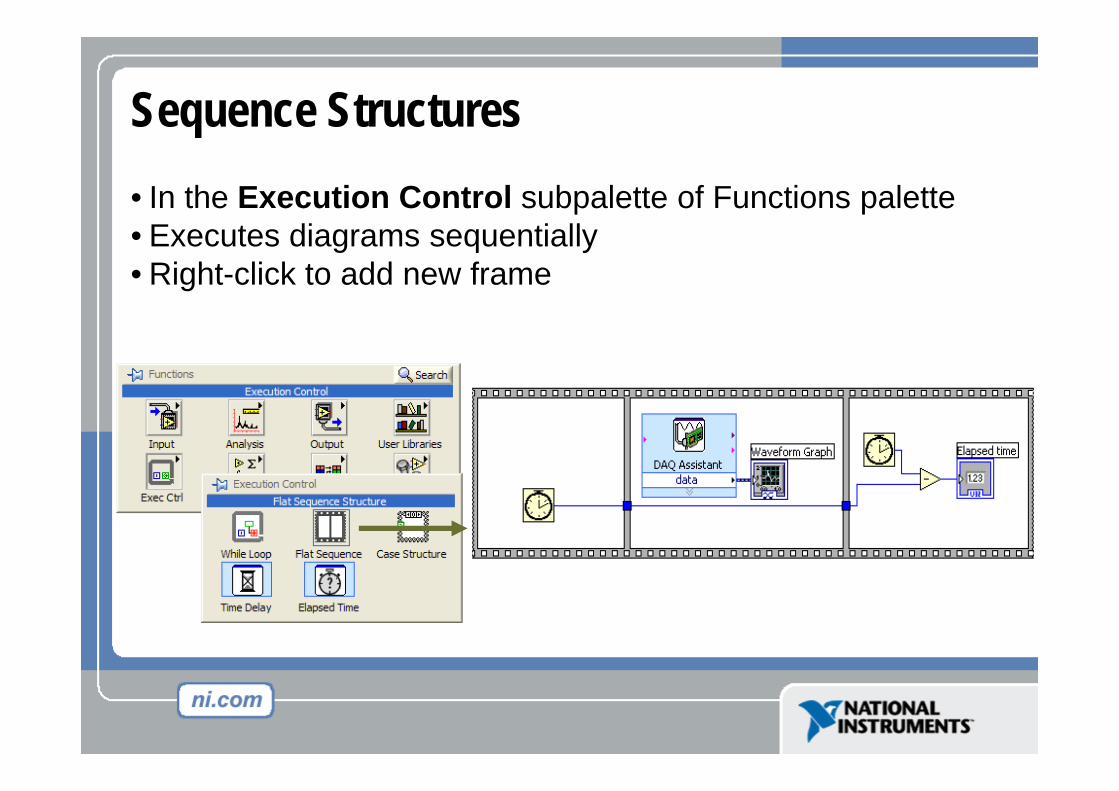
Sequence Structures• In the Execution Control subpalette of Functions palette• Executes diagrams sequentially• Right-click to add new frame
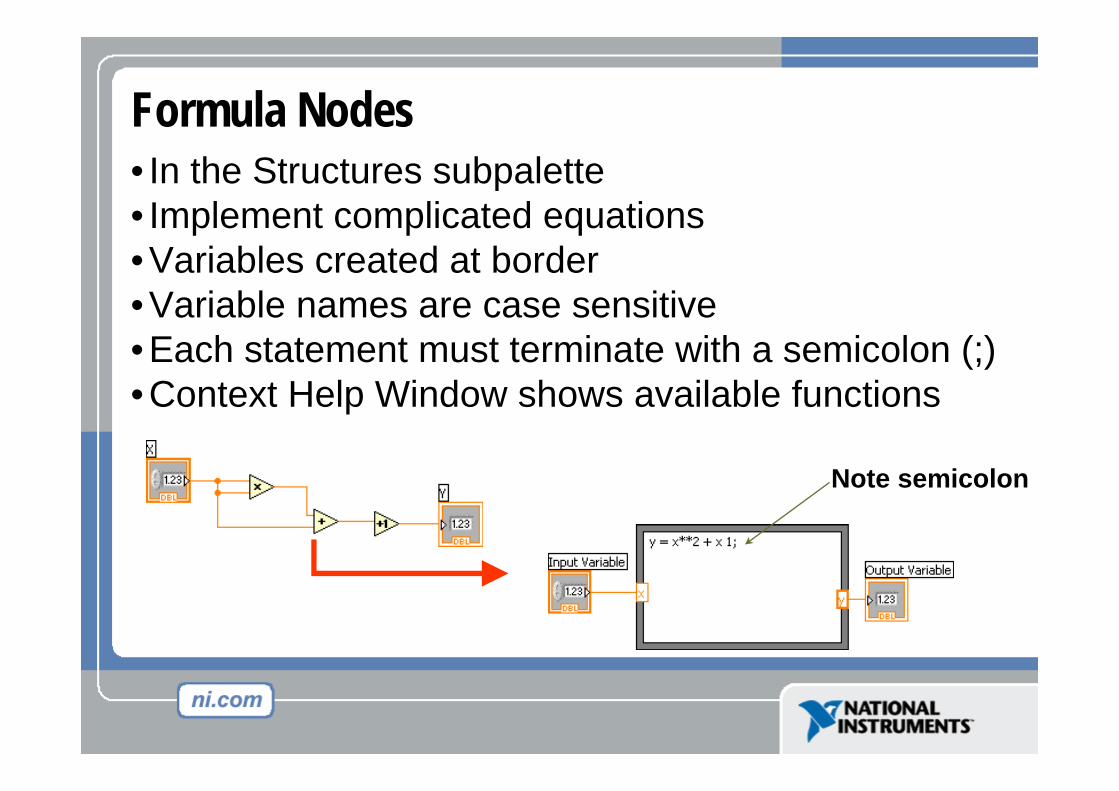
Formula Nodes• In the Structures subpalette • Implement complicated equations• Variables created at border• Variable names are case sensitive• Each statement must terminate with a semicolon (;)• Context Help Window shows available functions
Note semicolon

Section IX – Printing & Documentation
• Print From File Menu to Printer, HTML, Rich Text File• Programmatically Print Graphs or Front Panel Images• Document VIs in VI Properties » Documentation Dialog• Add Comments Using Free Labels on Front Panel & Block Diagram
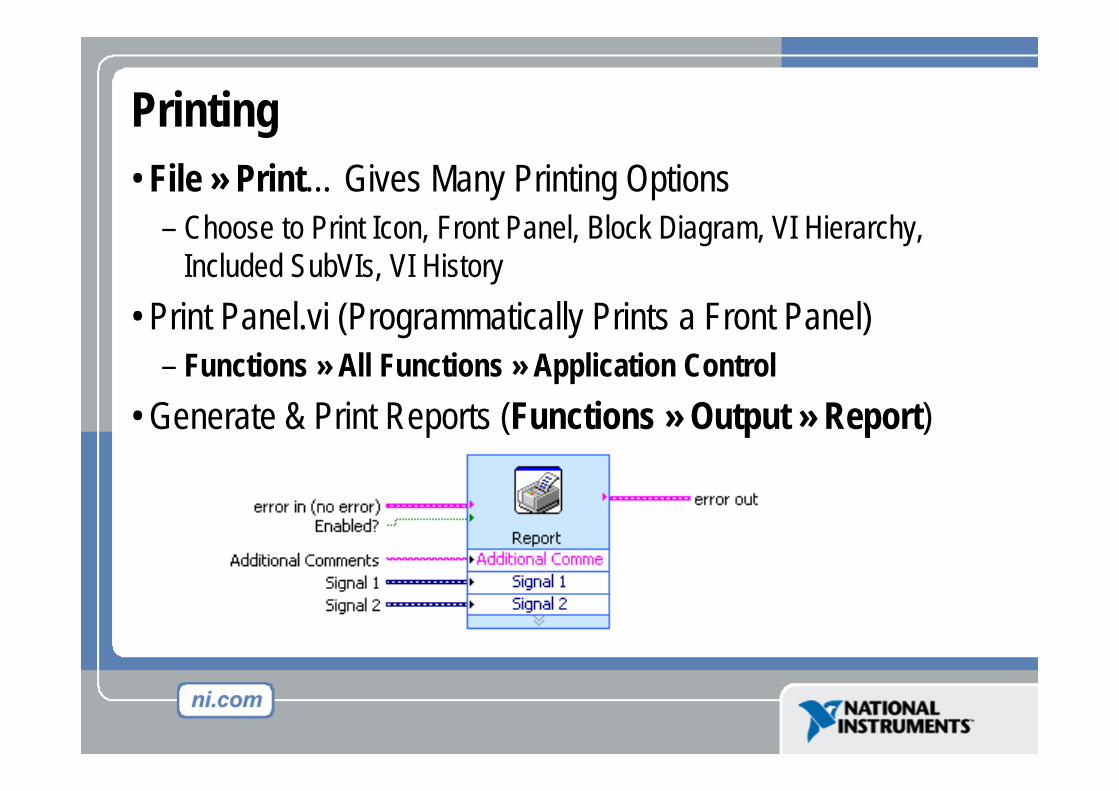
Printing• File » Print… Gives Many Printing Options
– Choose to Print Icon, Front Panel, Block Diagram, VI Hierarchy, Included SubVIs, VI History
• Print Panel.vi (Programmatically Prints a Front Panel) – Functions » All Functions » Application Control
• Generate & Print Reports (Functions » Output » Report)

Documenting VIs
• VI Properties » Documentation– Provide a Description and Help Information for a VI
• VI Properties » Revision History– Track Changes Between Versions of a VI
• Individual Controls » Description and Tip…– Right Click to Provide Description and Tip Strip
• Use Labeling Tool to Document Front Panels & Block Diagrams

Section X – Basic Programming Architecture
• Simple VI Architecture• General VI Architecture• State Machine Architecture

Simple VI Architecture
• Functional VI that produces results when run– No “start” or “stop” options– Suitable for lab tests, calculations
• Example: Convert C to F.vi

General VI Architecture
• Three Main Steps– Startup– Main Application– Shutdown
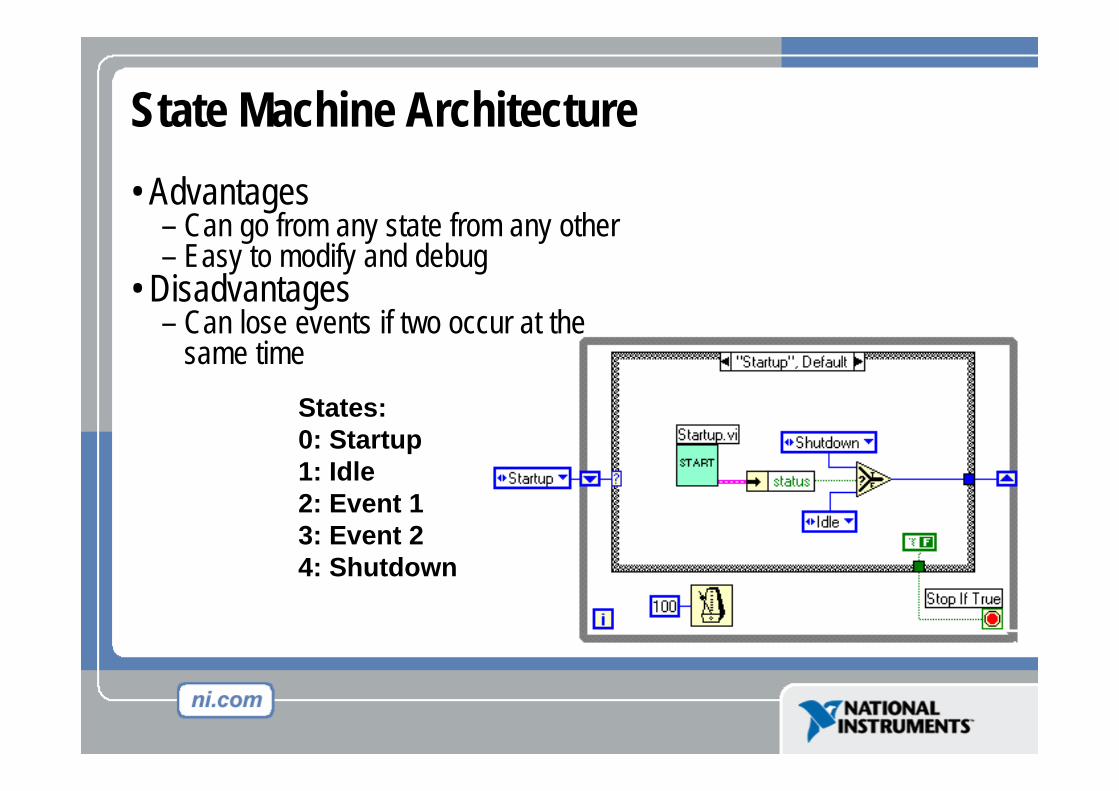
State Machine Architecture• Advantages
– Can go from any state from any other– Easy to modify and debug
• Disadvantages– Can lose events if two occur at the
same timeStates:0: Startup1: Idle2: Event 13: Event 24: Shutdown
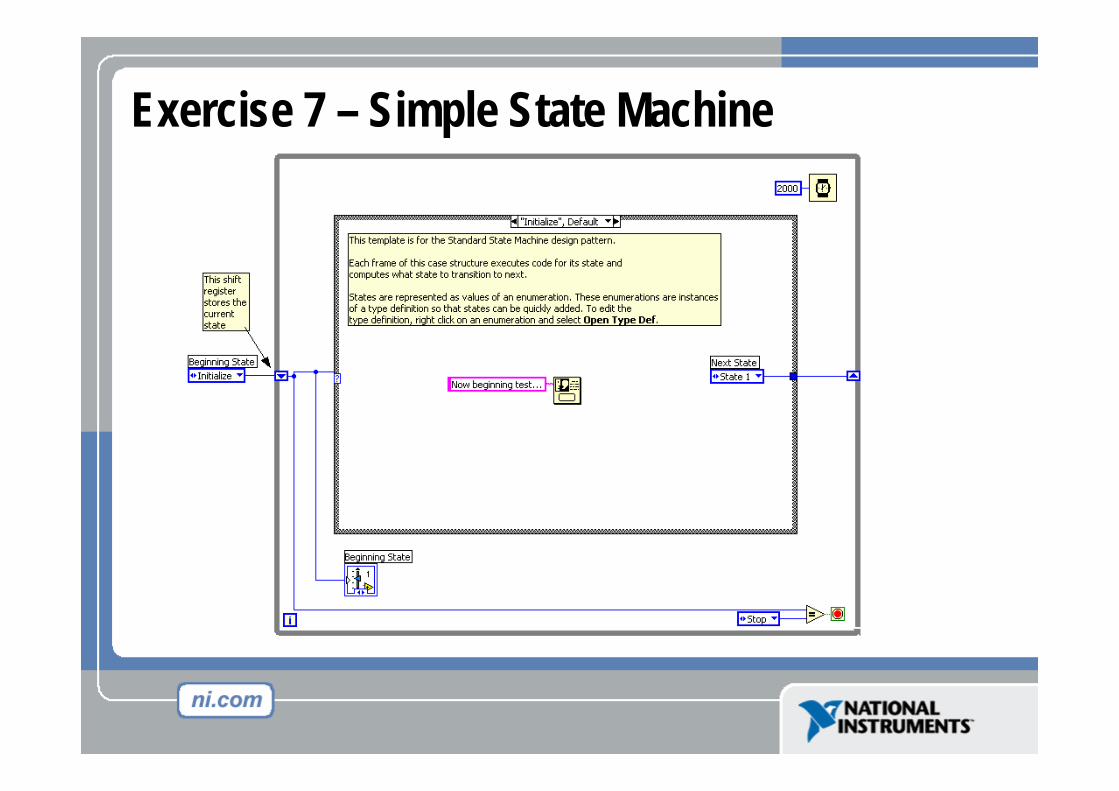
Exercise 7 – Simple State Machine

Do Not Delete This Slide
Section XI – Remote Front Panels
• View & Control LabVIEW Front Panels from a Web Browser
• Requires no programming• Remote clients see “live” front panel updates• Multiple clients can view the same panel simultaneously
• Only one client can control the front panel at a time
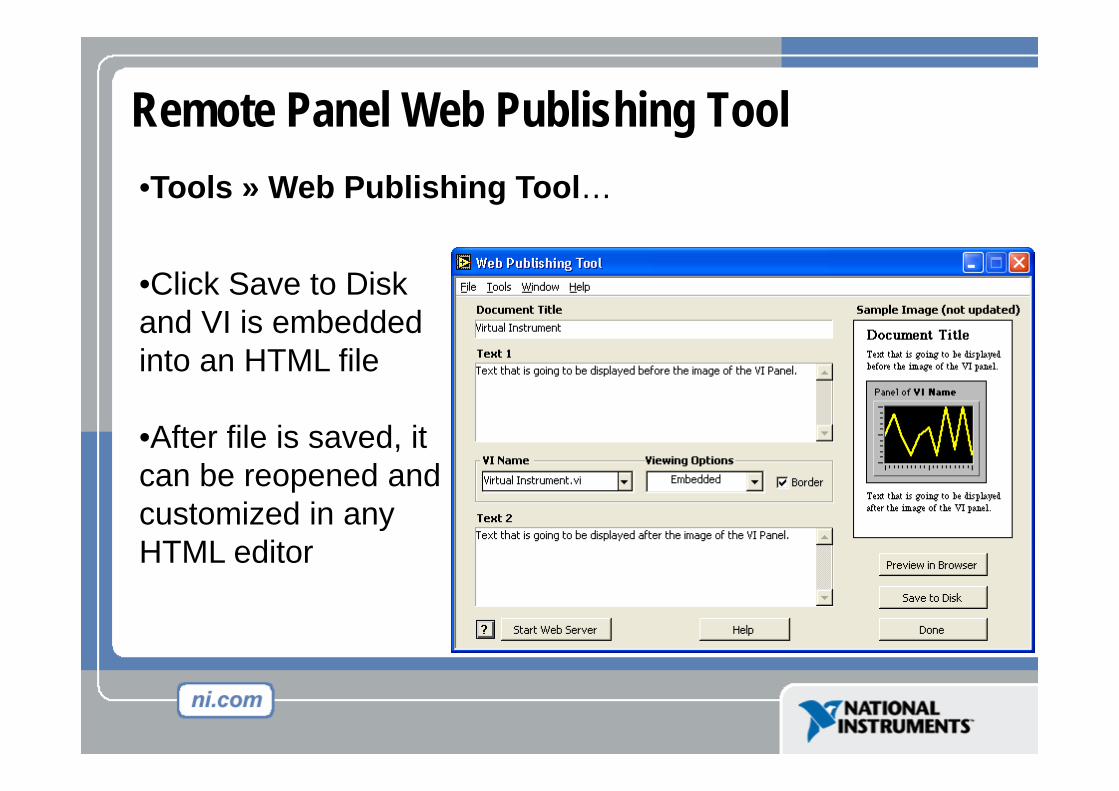
Remote Panel Web Publishing Tool•Tools » Web Publishing Tool…
•Click Save to Disk and VI is embedded into an HTML file
•After file is saved, it can be reopened and customized in any HTML editor

Remote Front Panels - Resources
• NI Developer Zone (zone.ni.com)– Search for Remote Front
Panel– Tutorials & Instructions Are
Available for Download– Information on
Incorporating Web Cameras into Remote Panel Applications

Section XII – Additional Topics
• Property Nodes• Local Variables• Global Variables• DataSocket• Binary File I/O
Variables
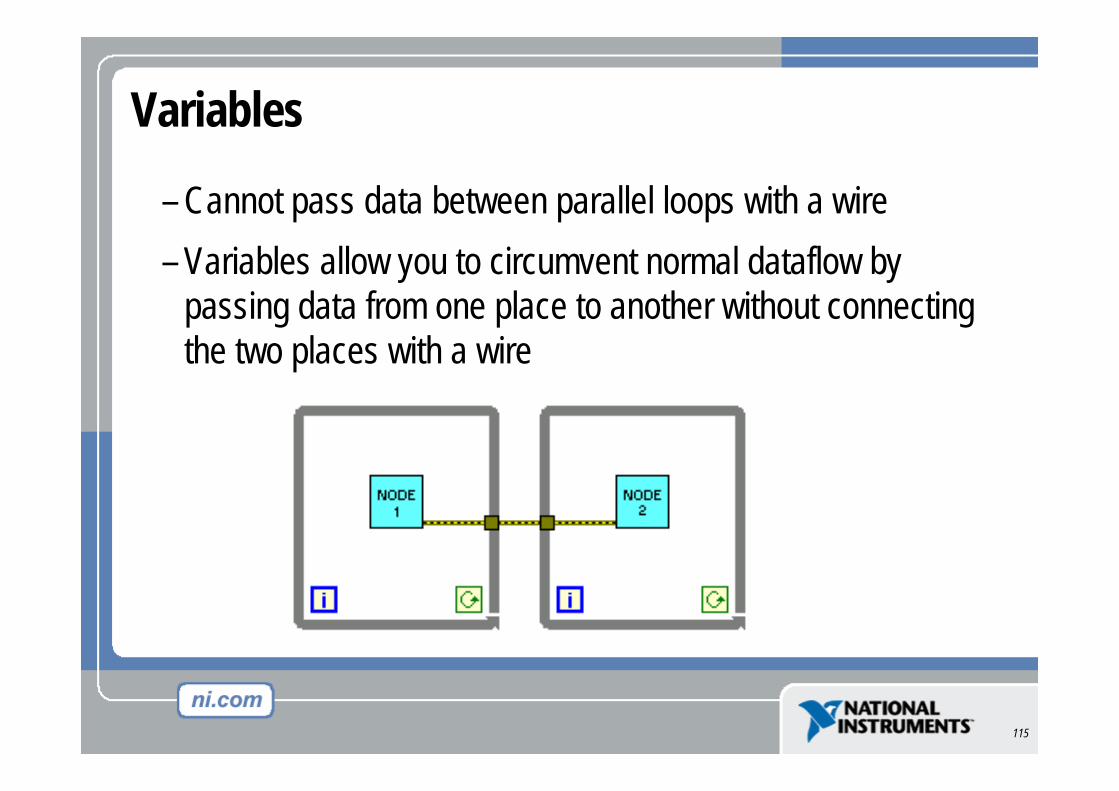
– Cannot pass data between parallel loops with a wire– Variables allow you to circumvent normal dataflow by
passing data from one place to another without connecting the two places with a wire
115
Variables
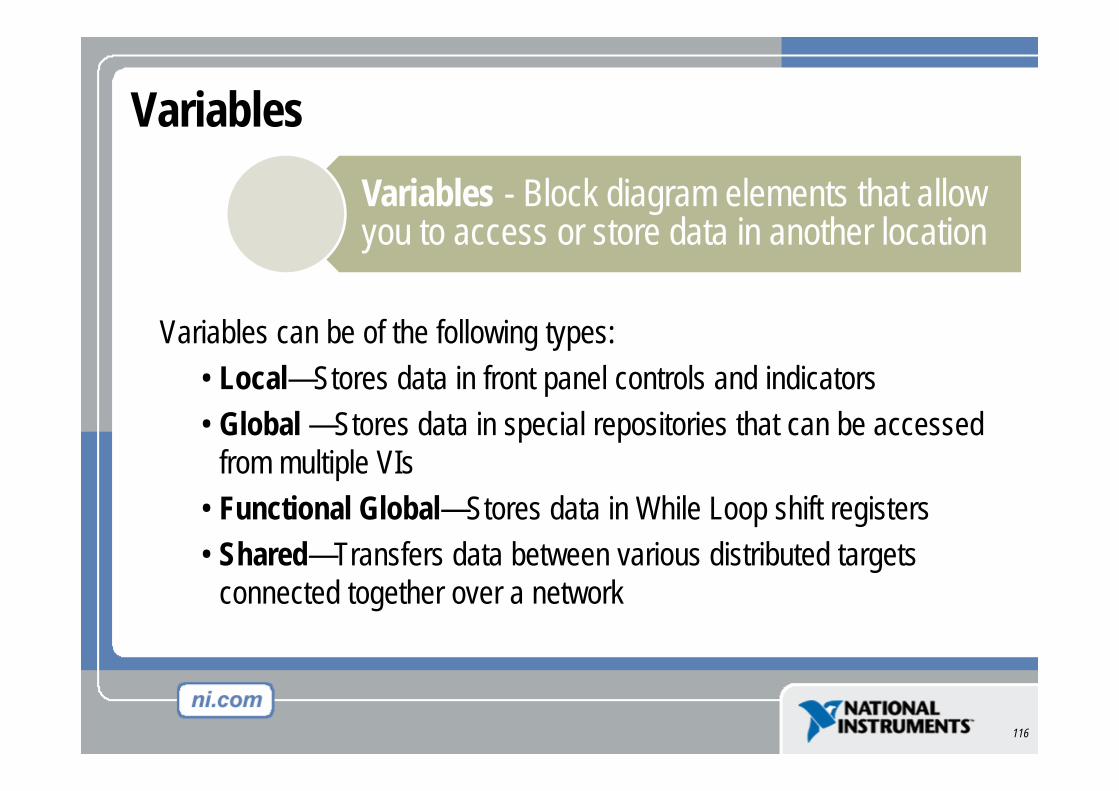
Variables can be of the following types:• Local—Stores data in front panel controls and indicators• Global —Stores data in special repositories that can be accessed
from multiple VIs• Functional Global—Stores data in While Loop shift registers• Shared—Transfers data between various distributed targets
connected together over a network
116
Variables - Block diagram elements that allow you to access or store data in another location

Variables – Using in a Single VI
• Use local variables to pass data within a single VI
117
Variables – Using Between VIs
• Use a global variable or a single process shared variable to share data between multiple VIs– Use a global variable to share data among VIs on the same
computer, especially if you do not use a project file– Use a single process shared variable if you may need to
share the variable information among VIs on multiple computers in the future
118

Variables – Using Between VIs• Single Process Shared Variables

Variables – Creating Shared Variables– You must have a project open
to create a shared variable– Variable configuration data is
stored in Project Libraries– LabVIEW will automatically
create a library if the variable was not created from an existing library
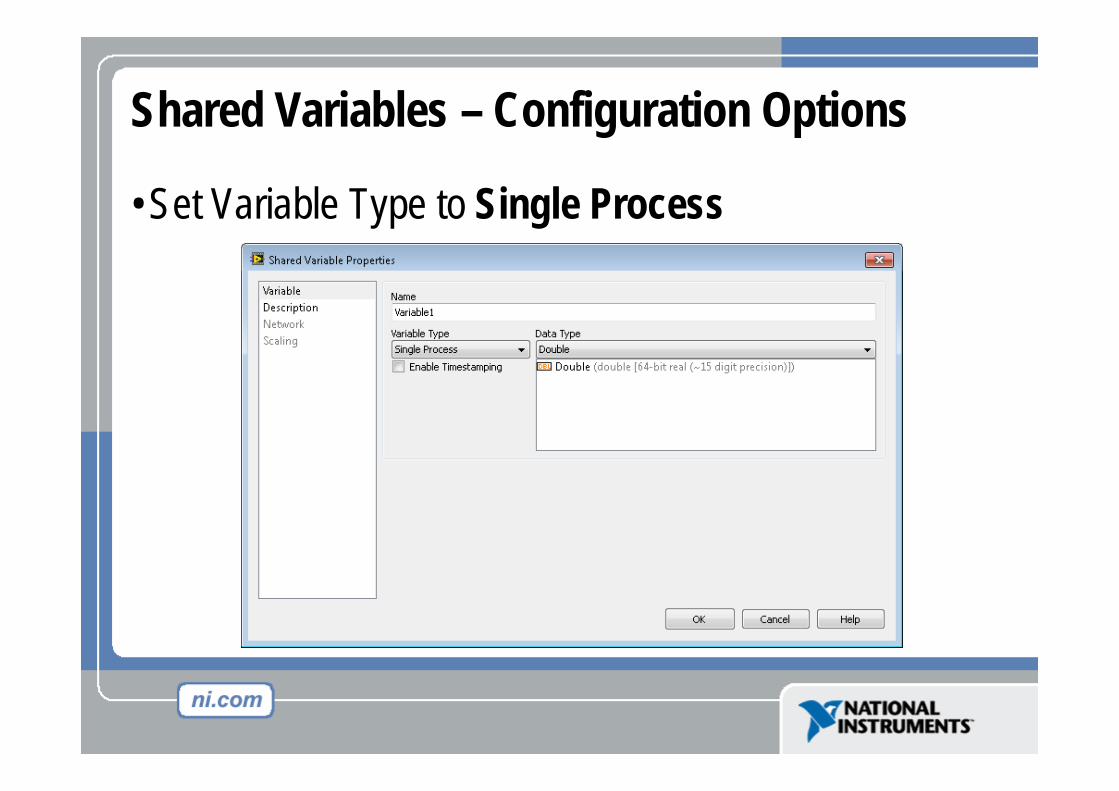
Shared Variables – Configuration Options
• Set Variable Type to Single Process

Where Do I Go From Here?
• Example programs (Help» Find Examples…)• LabVIEW Student Edition (www.ni.com/labviewse)• Web resources (ni.com)
– NI Developer Zone (zone.ni.com)– Application Notes – Info-labview newsgroup (www.info-labview.org/)– Instrument Driver Library (www.ni.com/idnet)