virtual testing of curved vehicle restraint systems
TRANSCRIPT

Virtual testing of curved vehicle restraint systems
Bertold Fröhlich
Bundesanstalt für Straßenwesen
1 Abstract
Real crash tests against vehicle restraint systems according to the standard EN 1317 are performed with straight barriers. The objective of this study is to investigate the performance of a curved barrier. A validated model of a real tested vehicle restraint system was subjected to a modification. The straight barrier in the original simulation model was modified with different constant curvatures. Virtual crash tests with straight and differently curved barriers were carried out with the same boundary conditions as the real test. The results concerning the behavior of the vehicle and the barrier were compared. The expected consequences of a barrier in a curve are the following: The vehicle is contained by the barrier. The dynamic deflection of the barrier during the crash is lower than the dynamic deflection of the unmodified straight barrier. The acceleration severity increases due to the curvature of the barrier.
2 Vehicle restraint system (VRS)
In Germany, a VRS (fig. 1) is used along roads and bridges and as separation between two contra-directional lanes, in order to improve road safety. They are usually made out of steel or concrete, as a prefabricated or an in-situ construction. In the event of failure of all available active safety systems a VRS should contain the errant vehicle, redirect it safely, and minimize the injury of the occupant and other road users.
Fig. 1: Vehicle restraint system.
2.1 Real testing of vehicle restraint systems
VRS are evaluated according to European standard EN 13171: In crash tests with cars (fig. 2), busses
or lorries (fig. 3) the behavior of the VRS and the vehicle during the crash is observed. The displacement of the VRS due to the impact is determined and the occupant loading is measured with an accelerometer that is installed in the vehicle. The test results shall enable road authorities to compare and select suitable systems with regards to road safety.
Fig. 2: Real test of a vehicle restraint system with a car.
Fig. 3 Real test of a vehicle restraint system with a lorry.

2.2 Virtual testing of vehicle restraint systems
Real crash tests are carried out at considerable expenses in material, manpower and time. It is a reasonable option to establish virtual methods for crash analysis, e.g. with the software LS-DYNA. Their application and requirements for validation is currently described in DIN EN 1317-5:2012-06 in conjunction with DIN CEN/TR 16303:2012 and will be further regulated in the upcoming EN 16303
2.
3 Virtual test of a curved vehicle restraint system
As already mentioned above real crash tests against VRS according to the standard EN 1317 are performed with straight barriers. On the other hand, roads and also the VRS are curved. The objective of this study is to investigate and quantify the influence on the performance of a curved barrier and compare it to the straight barrier.
3.1 Verification of the virtual model with a straight barrier
The virtual impact test that was investigated consists of a Ford Taurus4 model and a crash barrier
model developed by Meywerk et. al.3. The Finite-Element (FE) model of the vehicle is visualized in fig.
5., the FE model of the barrier is shown in fig. 6. The main features are given in the table 1 and 2.
Tab. 1
Vehicle: Ford Taurus
Total mass 1665 kg
Impact velocity 110 km/h
Element length 7.5 … 20 mm
Shell thickness 1 … 3 mm
Contact Automatic Single Surface
Fig. 5: FE model of the vehicle
Crash barrier: ESP 2.0
Length 37 m
Material Steel
Element length 5 … 10 mm
Shell thickness 3 … 5 mm
Connections Spotwelds (with failure)
Contact Automatic Single Surface
Tab. 2
Fig. 6: FE model of the Barrier
In the combined model (vehicle and VRS) the smallest time-step calculated by LS-DYNA is s. Because of expected nonlinearities an explicit simulation type was chosen. The contact type between the vehicle and the barrier is Automatic Surface To Surface. Due to inappropriate settings in the contact definition and consequently bad contact energy the original input deck given by Meywerk et. al.
3 was modified. The energy was well balanced (fig. 7) by using the following contact parameters in
the contact between the vehicle and the VRS: sst = mst = 0.6 mm, sfst = sfmt = 1, soft = 1, vdc = 10. They had to be chosen very carefully due to long simulation time. The ratio of the energy types and the added mass as required acc. to prEN16303
2 are given in the table 3.

Fig. 7: Energy balance of the virtual test with a straight barrier.
Type ratio [%] Relative to
Total energy ≈100 Total energy
Contact energy < 2 Internal energy
Hourglass energy 6 Total energy
Hourglass energy 15 Internal energy
Hourglass energy per part < 3 Internal energy
Added mass 2.5 Total mass
Added mass per part Max. 20 Part Tab. 3: The ratio of the energy types and the added mass as required acc. to prEN16303
2
3.2 Validation of the virtual model with a straight barrier
The real test that was reproduced virtually consisted of an impact of a car (BMW 5, 1991) with a mass of 1474 kg with a velocity of 110 km/h on an ESP 2.0 barrier (fig. 4). The comparison of the results of the real test and the virtual test are summarized in tab. 4. In the virtual test, the dynamic deflection is higher, as a result of the higher mass of the vehicle, and consequently a higher rebound and ASI value. The virtual test can be used as a reference and its result can be compared to the modified model.
Fig. 4: Real test of a barrier ESP 2.0. BAST, TB32 2011-7D-01.
Real test Virtual test
Mass of the vehicle 1474 kg 1665 kg
Impact velocity 110 km/h 110 km/h
Impact angle 20° 20°
Dynamic deflection 1000 mm 1200 mm
Acceleration severity index 0.6 0.74 Tab. 4: Comparison of the results of the real test and the simulation with the unmodified model.

3.3 Modification of the virtual model with a straight barrier
The straight barrier in the original model was modified with different constant curvatures. The barriers have different curvature radii R, R = 60 m, R = 90 m and R = 120 m, that are common in practice.
4 Results and comparison
The results of the virtual crash tests with the modified model concerning the behavior of the vehicle and the barrier were compared (see the sequence in fig. 8). Original model
Straight barrier Curvature radius of the barrier R = 120 m
Curvature radius of the barrier R = 90 m
Curvature radius of the barrier R = 60 m
0 ms
150 ms
300 ms
450 ms
600 ms
Fig. 8: Sequence of the simulation of an impact on a straight barrier and a curved barrier.
4.1 Dynamic deflection
The dynamic deflection is the maximum deformation of the barrier under impact and is calculated as the distance between the traffic face of the system in its initial position and its maximum displacement. This quantity among others can be used to determine the space that is needed for the VRS to work properly. Therefore, it is one performance criterion that can be used to compare the curved barriers with different curvature radii R, R = 60 m, R = 90 m and R = 120 m and the straight barrier, considering the deflection during impact measured in Millimeters.

Fig. 9: Dynamic deflection of the straight barrier and curved barriers with different curvatures during impact.
Fig. 9 shows the dynamic deflection in millimeters of the barrier for the three curved barriers and the straight barrier vs. simulation time in seconds. It can be concluded that a curvature of the barrier does not enlarge the maximum value of its dynamic deflection. In contrast, the dynamic deflection of a curved barrier compared to the deflection of a straight barrier is lower after 0.3 s.
4.2 Acceleration Severity Index (ASI)
Vehicle acceleration during the impact is measured by an accelerometer that is installed in the vehicle. The components of the acceleration are measured and combined to form the acceleration severity index ASI by the following formula:
With , , and . The components of the acceleration
are integrated over 50 ms. The ASI for the curved barriers R = 60 m, R = 90 m, R = 120 m and also for the straight barrier are shown in fig. 10. The maximum ASI value is approx. 30 % higher for a curved barrier (R = 60 m) compared to a straight barrier.
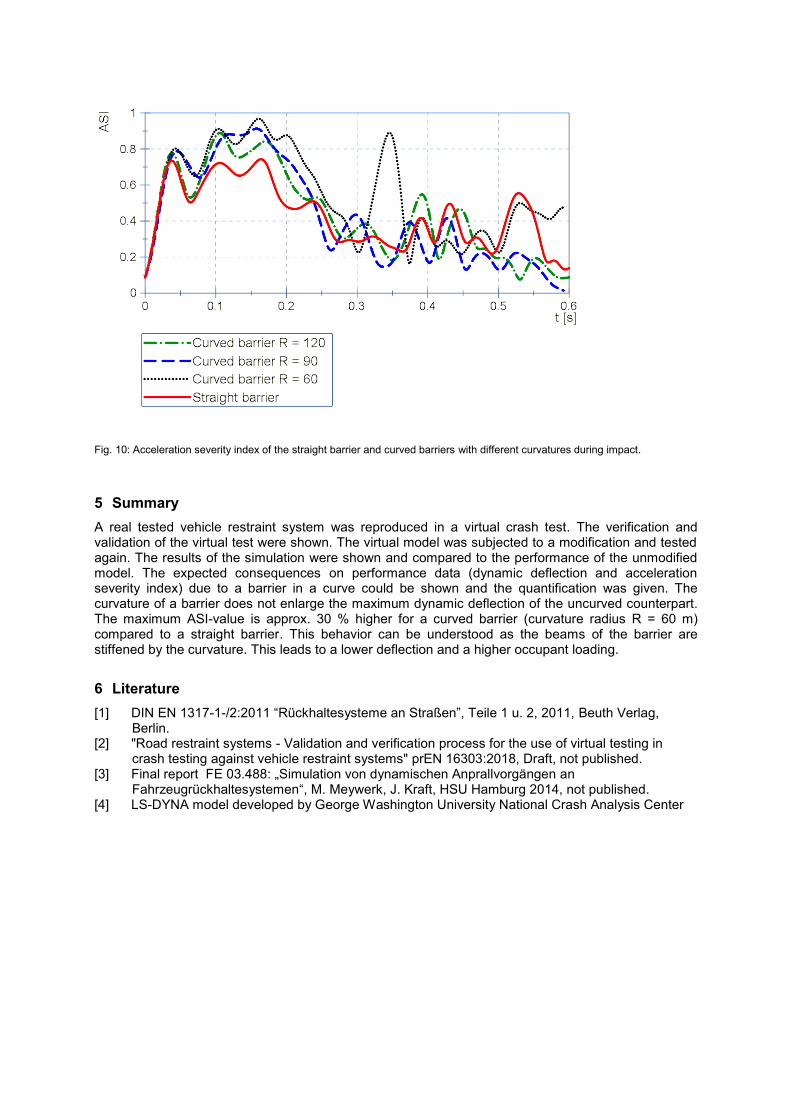
Fig. 10: Acceleration severity index of the straight barrier and curved barriers with different curvatures during impact.
5 Summary
A real tested vehicle restraint system was reproduced in a virtual crash test. The verification and validation of the virtual test were shown. The virtual model was subjected to a modification and tested again. The results of the simulation were shown and compared to the performance of the unmodified model. The expected consequences on performance data (dynamic deflection and acceleration severity index) due to a barrier in a curve could be shown and the quantification was given. The curvature of a barrier does not enlarge the maximum dynamic deflection of the uncurved counterpart. The maximum ASI-value is approx. 30 % higher for a curved barrier (curvature radius R = 60 m) compared to a straight barrier. This behavior can be understood as the beams of the barrier are stiffened by the curvature. This leads to a lower deflection and a higher occupant loading.
6 Literature
[1] DIN EN 1317-1-/2:2011 “Rückhaltesysteme an Straßen”, Teile 1 u. 2, 2011, Beuth Verlag, Berlin.
[2] "Road restraint systems - Validation and verification process for the use of virtual testing in crash testing against vehicle restraint systems" prEN 16303:2018, Draft, not published.
[3] Final report FE 03.488: „Simulation von dynamischen Anprallvorgängen an Fahrzeugrückhaltesystemen“, M. Meywerk, J. Kraft, HSU Hamburg 2014, not published.
[4] LS-DYNA model developed by George Washington University National Crash Analysis Center