virtualized baseband units consolidation in advanced lte
TRANSCRIPT

San Jose State University San Jose State University
SJSU ScholarWorks SJSU ScholarWorks
Master's Projects Master's Theses and Graduate Research
Fall 2017
VIRTUALIZED BASEBAND UNITS CONSOLIDATION IN ADVANCED VIRTUALIZED BASEBAND UNITS CONSOLIDATION IN ADVANCED
LTE NETWORKS USING MOBILITY- AND POWER-AWARE LTE NETWORKS USING MOBILITY- AND POWER-AWARE
ALGORITHMS ALGORITHMS
Uladzimir Karneyenka San Jose State University
Follow this and additional works at: https://scholarworks.sjsu.edu/etd_projects
Part of the Computer Sciences Commons
Recommended Citation Recommended Citation Karneyenka, Uladzimir, "VIRTUALIZED BASEBAND UNITS CONSOLIDATION IN ADVANCED LTE NETWORKS USING MOBILITY- AND POWER-AWARE ALGORITHMS" (2017). Master's Projects. 571. DOI: https://doi.org/10.31979/etd.sg3g-dr33 https://scholarworks.sjsu.edu/etd_projects/571
This Master's Project is brought to you for free and open access by the Master's Theses and Graduate Research at SJSU ScholarWorks. It has been accepted for inclusion in Master's Projects by an authorized administrator of SJSU ScholarWorks. For more information, please contact [email protected].

VIRTUALIZED BASEBAND UNITS CONSOLIDATION IN ADVANCED LTE
NETWORKS USING MOBILITY- AND POWER-AWARE ALGORITHMS
A Writing Project Report
Presented to
The Faculty of the Department of Computer Science
San Jose State University
In Partial Fulfillment
Of the Requirements for the Degree
Master of Science
By
Uladzimir Karneyenka
May 2017

© 2017
Uladzimir Karneyenka
ALL RIGHTS RESERVED

ABSTRACT
Virtualization of baseband units in Advanced Long-Term Evolution networks and a rapid
performance growth of general purpose processors naturally raise the interest in resource
multiplexing. The concept of resource sharing and management between virtualized instances is
not new and extensively used in data centers. We adopt some of the resource management
techniques to organize virtualized baseband units on a pool of hosts and investigate the behavior
of the system in order to identify features which are particularly relevant to mobile environment.
Subsequently, we introduce our own resource management algorithm specifically targeted to
address some of the peculiarities identified by experimental results.

ACKNOWLEDGEMENTS
I would like to express my gratitude to Dr. Melody Moh for being my project advisor and
providing invaluable mentorship and help with organizing, focusing and seeing this project
through. Also I want to thank the committee – Dr. Melody Moh, Dr. Teng Moh, and Dr. Robert
Chun – for their time and much appreciated comments and suggestions.

Table of Contents
I. Introduction ............................................................................................................................. 1
II. Related Work ........................................................................................................................... 4
III. Clustering and Packing Algorithms ..................................................................................... 6
A. Clustering ............................................................................................................................. 6
B. Packing ................................................................................................................................. 8
C. Metrics ............................................................................................................................... 11
IV. Simulation and Experiments Setup .................................................................................... 13
V. Simulation Results ................................................................................................................. 15
A. Clustering results ............................................................................................................... 15
B. Experiment I....................................................................................................................... 21
C. Experiment II ..................................................................................................................... 23
VI. Conclusion ......................................................................................................................... 31
References ..................................................................................................................................... 34
Appendix A: Simulator Implementation ....................................................................................... 36

List of Acronyms
AP Affinity Propagation (algorithm)
BBU Base Band Unit
BFH Best Fit Host (algorithm)
BS Base Station
CoMP Coordinated Multipoint
CPU Central Processing Unit
FCC Federal Communications Commission
FF First Fit (algorithm)
GPP General Purpose Platform
KVM Kernel-based Virtual Machine
LTE Long-Term Evolution
LXC Linux Containers
QoS Quality of Service
RM Resource Manager
RRH Remote Radio Head
UE User Equipment
VBBU Virtual Base Band Unit
VBS Virtual Base Station
VM Virtual Machine

1
I. INTRODUCTION
The general trend in mobile devices usage shows persistent growth as the range of products
that can make use of a cellular connectivity also increasing – phones, tablets, laptops, and
vehicles. And now, the devices labeled as Internet of Things (IoT) are also getting introduced to
the pool. This growing demand for connectivity requires service providers to react accordingly in
order to accommodate not only coverage requirements, but also maintain a satisfactory Quality
of Service (QoS); and for a service provider to stay competitive it has to invest into more sites.
At the same time, various costs associated with deployment and operation of base stations (BS)
are increasing each year; and the analysis of actual expenditures associated with a cellular site
shows great spending not only in hardware, but also from utility and rental bills [16]. Another
issue with a traditional cellular architecture worth noting is its rigidity which is due to hardware
usually being vendor-locked. To some extent this constraint exacerbates any attempt to mix-and-
match the hardware and to upgrade or migrate to new standards and protocols [1].
When we talk about increasing number of mobile devices and the architecture that provides
connectivity we also have to consider the “mobility” aspect. There is a notion of a “tidal effect”
which can be inferred if we look at one’s average weekday routine and then apply it to a
population of any town or city [16]. An average person sleeps at night, gets up in the morning,
commutes to the place of business, and then, towards the evening, goes back home. The
researchers identified common trends for the residential, business, and entertainment areas
drawing attention to the periods of prolonged time with the major energy waste when the cellular
infrastructure is fully operational while having little demand. It should be stressed, a site
providing connectivity must be operational 24/7, and the same requirement stands when a service
provider increases the number of sites in the area in order to accommodate the growing number
of users. There are various research papers which address the energy problem for areas with
densely populated cellular sites during “off-peak” hours. The major potential challenge applying
those algorithms is to deploy them in a heavily vendor-locked infrastructure.
Increasing cost associated with deploying, operating, maintaining and scaling cellular
networks led the researchers to investigate and propose a new architecture shifting away from a
traditional distributed paradigm and embrace centralization [16]. The main concept is to move as
much processing from remote sites as possible leaving just key functionality required for radio

2
signal acquisition and broadcast. The proposed separation of functionality was applied on an
evolved base station known as eNodeB from the Long-Term Evolution (LTE) communication
standard, within which two main processing blocks were identified – Remote Radio Head (RRH)
and Base Band Unit (BBU).
Fig. 1. Modularization and separation of eNodeB functionality.
RRH is responsible for functions required to transmit and receive radio signal, and BBU
performs baseband processing along with other functionalities associated with L1, L2, and L3 –
layers from LTE protocol stack [1]. With the presence of a high-bandwidth low-latency link,
such as fiber-optics communication, RRH and BBU can be distanced from each other by tens of
kilometers without breaking stringent constraints specified by the LTE standard. Placing BBUs
from multiple remote sites at a central location by itself reduces various costs and also enables
migration from vendor-locked packages towards general purpose platforms (GPP) by
implementing and running BBU in software. An ongoing research, implementation and
evaluation of BBU realization in software shows that it is feasible to have BBU functionality
hosted on GPP. Bhaumik et al. designed, implemented and tested their own framework based on

3
OpenAirInterface project which allowed them to run multiple BBU instances on GPP [15]. The
investigation by Nikaein on performance outlined some of the processing requirements for GPP
to host BBU within various non- and virtualized host environments such as Virtual Machine
(KVM) and containers (Docker, LXC) [10]. Since running a BBU instance is very
computationally demanding, to reduce performance hit on a host’s CPU, a split BBU architecture
can be applied, which originally was designed to alleviate inter-BBU communication load for
cooperative scheme based scenarios [5]. Furthermore, this split allows mixing and matching
various hosting platforms optimized for various performance tasks, e.g. memory intensive, CPU
intensive, etc., and consequently taking advantage of heterogeneity of platforms which might
occur due to the progress in computing architectures.
Virtualizing a BBU and running its instance on a GPP at a centralized location allows for
hardware resource multiplexing and additionally gives researchers the opportunity to investigate
whether power saving techniques applicable in cloud data centers can be adopted to manage
BBU pool resources in a more energy efficient manner.
In this paper we are adapting some energy-efficient resource management algorithms from
data centers and apply them on a BBU pool. Along with them, we designed and implemented our
own packing algorithms specifically targeted to be applied on a centralized mobile wireless
architecture. Also, similar to the work done by Zou et al. and Lee et al., a few clustering
algorithms are considered for the experiments in order to apply the same concepts for energy
conservation in an RRH pool [13][14]. In our case, we will be looking at both – BBU and RRH
pools – since in a centralized architecture they are separated but still interdependent. We
developed a high-level behavioral simulator which allowed us to simulate and investigate the
behavior of BBUs, RRHs and mobile users in a centralized architecture when we apply various
clustering and packing techniques. From these simulations we attempt to draw some guidelines
for a resource manager to follow in order to run an energy-efficient, yet performance-conscious
system.
This paper format is: Section II covers the background, followed by Section III, where we
discuss clustering and packing algorithms used in the experiments. The simulator
implementation is discussed in Section IV. Section V and Section VI cover the input details and

4
simulation results respectively. And Section VII is a discussion and conclusion on acquired
experimental results.
II. RELATED WORK
In a centralized cellular architecture there are two areas we are interested in for energy
conservation – remote sites and BBU Pool. One of the ideas considered for manipulating energy
consumption on remote sites is to monitor run-time load and change operational power state of
individual towers provided sufficient density of sites serving the area. And for BBU Pool,
various multiplexing and consolidation techniques on BBU instances can be applied assuming
BBU implementation allows for virtualization.
The concept of manipulating power state of running towers is applicable for both –
centralized and traditional (decentralized) – cellular architectures, and some proposed schemes
specifically target the latter in order to improve the energy efficiency within the existing
infrastructure. Zou et al. propose a clustering algorithm to partition the area and monitor runtime
load requirements in order to bring towers up or down, effectively keeping just enough
operational towers to meet the demand [13]. The algorithm requires a full state view for all the
sites involved and is specifically tailored for areas with a high volume of cellular sites which are
underutilized during “off-peak” hours. A decentralized scheme is proposed by Lee et al. in their
research where a message-passing algorithm is applied to solve the problem of identifying
towers which can be switched to a dormant state [14]. Mobile devices are clustered around
particular towers using a form of an affinity propagation algorithm, and then the towers that were
found underutilized can be brought down. The results from experiments in a simulated
environment allowed to draw an important conclusion that the aggregate power consumption for
a multi-site area can be reduced when the activation of towers is demand-based. Along with the
techniques which target underutilized sites, a concept to reduce the aggregate power
consumption of densely placed towers during “peak” hours can be considered [5]. It requires a
fine-grained tuning of a tower power output in order to provide just enough signal strength to
cover smaller area of responsibility, this approach not only reduces inter-site interference, but
potentially also improves energy efficiency.
To optimize a BBU pool’s power consumption, consolidation techniques can be applied on
virtualized BBUs to reduce the number of active hosts. We can borrow some insight on various

5
techniques and algorithms used in cloud data centers where resource managers (RM) pack virtual
machines on hosts using criteria such as computational, storage, bandwidth and other
requirements. It should be noted that the timing requirements for data centers and BBU Pool are
very different and while the former can allow to have an interruption of service for a few
seconds , time required to migrate a VM, the latter has more real-time characteristics and
whatever operations required to consolidate virtualized BBUs are subject to a strict timing.
When resource managers perform VM packing on hosts, they limit available resources which
in turn can impair the performance of an individual VM if at some point it requires more
resources due to some external stimulus. To accommodate fluctuations in resource demand, RM
can take advantage of history- and pattern-based prediction methods and provision required
resources more efficiently [7]. In conjunction with known bin-packing algorithms RM can
consolidate VMs with fewer migrations and proactively meet the resource demand. Pompili et al.
in their work also address packing within BBU Pool using history of data traffic and mobility
where RM can make some assumptions about day-to-day usage patterns, perform location-based
clustering, identify correlation between several areas and associated clusters, and pack them so
cumulative resource usage would not exceed host’s resource cap, e.g. packing together clusters
which exhibit opposite utilization trends [5]. VMs can also be clustered together based on inter-
VM traffic and subsequently consolidated on hosts using a bin-packing algorithm [8]. The main
advantage of this approach is that it reduces inter-host bandwidth requirement and improves
inter-VM bandwidth since VMs with an active cross-talk are more likely to be placed on the
same host effectively reducing the hop count to zero. When BBU implementation is non-atomic,
that is, there is a mechanism to initiate, preempt and control the input into a BBU instance, RM
can map BBUs to hosts on-demand whenever the input or resources are available. Bhaumik et al.
developed a framework that allows for resource pooling where BBU instances are mapped for
processing using a cyclic scheduling algorithm whenever the input data frames become available
[15]. This approach allows RM to enforce real-time characteristic of BBU instances by dropping
any data frame that does not fit allotted time and prevent a schedule violation for consecutive
time-slots in the queue.

6
III. CLUSTERING AND PACKING ALGORITHMS
In this paper we are considering various power saving techniques and approaches adopted
from data centers and derived from relevant research on centralized and decentralized cellular
architectures. We use clustering algorithms to group closely related BBU instances, collect usage
and mobility information for history- and pattern-based provisioning, and use several packing
algorithms to consolidate virtual BBU instances on hosts in order to reduce active host count and
improve energy efficiency within a BBU pool.
A. Clustering
Before we apply clustering on virtual BBUs (VBBU), we associate each RRH with a VBBU
instance in a one-to-one mapping to form a virtual base station (VBS). Then we can cluster
VBSs using different criteria, for example, based on RRH’s location [5]. The main advantage of
such clustering is that it can facilitate inter-VBS management such as handover handling or
coordinated multipoint (CoMP) operations [1][4][9]. Once the clusters are formed, we can treat
them as VMs and map them on hosts. Another clustering criterion we consider is the mobility
information where we take into account traffic intensity between RRHs. Also, during clustering,
the bandwidth cap on host can be considered to avoid grouping VBS instances which during
“peak” hours might cause bandwidth starvation, although, for the purpose of this discussion, we
assume a host is capable to handle the aggregate bandwidth from all its VBS instances.
Our default clustering algorithm is a variant of a greedy hierarchical clustering with a
bounding condition being the inter-VBS distance restriction for all elements within the forming
clusters. With some assumptions, such as the check at line 14, where the implementation can be
optimized by employing some geometry, the complexity of this algorithm is O(n2), where n is
the number of VBSs. We also make use of a grid structure which fetches neighboring VBSs
much quicker instead of being forced to iterate through all VBS instances in order to check for
proximity [13]. This grid structure is created during RRHs initialization and calculated only once.
The grid breaks 2D area into cells to which we map enclosed RRHs. For a position of interest,
we can acquire a corresponding cell and neighbors around it in a linear time and subsequently all
of the associated RRHs.

7
Fig. 2. Hierarchical clustering algorithm
Note: at line 4, we are getting all the neighbors around the position of curr_vbs, and that includes
curr_vbs itself.
We also added another clustering algorithm – affinity propagation (AP) [6]. There are a few
advantages to this algorithm over our default clustering scheme: a) it’s a formal algorithm in
contrast to our ad hoc default algorithm b) in a default AP implementation, the clusters are
formed around actual points which we can safely designate as master nodes; c) to some extent
we can modify clustering conditions in order to form clusters with specific properties, for
example, we use the inter-RRH mobility information to gauge the intensity of users’ movements
1. For each curr_vbs in VBSList
2. | If curr_vbs is clustered
3. | | goto 1
4. | Get all VBS near curr_vbs’s position into NeighborVBSList
5. | Sort NeighborVBSList into NeighborVBSListSorted
6. | curr_cluster = null
7. | For each other_vbs in NeighborVBSListSorted
8. | | If other_vbs is clustered
9. | | | If curr_cluster is null
10. | | | | If curr_vbs fits criteria of other_vbs’s cluster
11. | | | | | Assign curr_vbs to other_vbs’s cluster
12. | | | | | curr_cluster = other_vbs’s cluster
13. | | | Else If other_vbs’s cluster NOT curr_cluster
14. | | | | | If two clusters can be merged
15. | | | | | | Merge other_vbs’s cluster INTO curr_cluster
16. | | Else
17. | | | If curr_cluster is null
18. | | | | curr_cluster = new cluster
19. | | | If other_vbs fits criteria of curr_cluster
20. | | | | Assign other_vbs to curr_cluster
21. | If curr_cluster is null
22. | | curr_cluster = new cluster
23. | | Assign curr_vbs to curr_cluster
24. | Mark all in curr_cluster as clustered

8
from site to site and use it as a weight during AP cluster formulation which potentially can
maximize handovers within cluster.
In order for our logical entities to have dynamic resource requirements we are grouping VBSs
into cluster. We are making the same assumption regarding RRHs and assume that some RRHs
can be put to sleep, while other RRHs in vicinity can be dynamically reconfigured to compensate
the coverage in the affected areas [5][13][14],. So, when a particular tower is deactivated, in a
centralized architecture, we can subsequently deactivate or otherwise reduce processing footprint
inside BBU Pool, and if we have all VBSs clustered, the corresponding cluster’s resource
requirements decrease correspondingly. We are also using history-based prediction to
proactively allocate or release resources used by VBS clusters [5][7]. To resize a VBS cluster we
check each VBS instance for the immediate resource demand along with its historical data, and
when some predetermined threshold is passed, the algorithm activates or deactivates VBS,
effectively changing the amount of resources required.
B. Packing
Once clusters are established we can pack them based on runtime conditions to target
particular performance goals such as throughput and energy conservation. We evaluate five
packing algorithms:
1) Best Fit Host (BFH) algorithm which with the use of regression analysis packs VBS
clusters on hosts and reduces the number of redundant migrations [7].
2) First-Fit (FF) packing algorithm which requires less steps than BFH [8]. And we also
make use of regression analysis which improves packing and prevents overutilization on hosts.
3) Mobility pattern (MP) based algorithm adopted from a packing concept discussed by
Pompili et al. where the pattern is derived from usage history to identify pairs of clusters
exhibiting reverse trends [5]. For example, a cluster for a residential area can be paired up with
a cluster for a business area and if their usage pattern are reverse of each other they can be
potentially packed on the same host effectively sharing resources and reducing further
unnecessary migration.
4) Location-aware (LA) packing algorithm is the one we introduce in this paper. By default
we form clusters using location-based principle which has a positive impact on any inter-VBS

9
intensive task such as handovers. For the same reason, packing clusters together on the same
host can improve the performance of VBSs’ operations.
5) This is a modification of the location-aware packing, where we add into consideration the
mobility factor between sites (LAM). We monitor and keep track of User Equipment (UE)
movement and use history to measure the expected traffic intensity between cellular sites which
translates into inter-cluster UE mobility, and we use it as a criterion (weights) to perform
location-aware packing.
6) This is a modification of the location-aware packing algorithms above where we also
consider the history of inter-RRH handovers (LAMH).

10
Fig. 3. Location-aware packing algorithm (with mobility)
Sorting on lines 7, 9, 16, and 18 can be done only once using available history. On lines 1
through 13, we are attempting to fit clusters on any host that has enough resources and an
instance of any neighboring cluster. The condition statements on lines 6 and 15 enable the
algorithm to pick the most promising neighbor based on mobility information. If there are
clusters that were not associated with any host due to neighbors’ hosts being packed or because
1. Sort clusters by resources needed into ClustersSorted
2. Reverse sort hosts by utilization into HostSortedReversed
3. For curr_cluster in ClustersSorted
4. | If curr_cluster’s host overultilized
5. | | Disassociate curr_cluster with its host
6. | If use mobility info
7. | | Reverse sort neighbors’ hosts by mobility weights
8. | Else
9. | | Reverse sort neighbors’ hosts by utilization
10. | For each neighbors’ host
11. | | If current host is a fit
12. | | | Disassociate curr_cluster with its host
13. | | | Associate curr_cluster with current host
14. For curr_cluster in DisassociatedClusters
15. | If use mobility info
16. | | Reverse sort neighbors’ hosts by mobility weights
17. | Else
18. | | Reverse sort neighbors hosts by utilization
19. | For each neighbors host
20. | | If current host is a fit
21. | | | Associate curr_cluster with current host
/* Handle host overutilization */
22. If DisassociatedClusters not empty
23. | Do bin-packing on DisassociatedClusters
/* Attempt to free up underutilized hosts /*
24. Sort hosts by utilization with new mapping into NewHostsSorted
25. For curr_host in NewHostsSorted
26. | Sort clusters on curr_host by utilization
27. | For each cluster on host
28. | | Do best fit packing

11
originally it belonged to an overutilized host, the algorithm tries to pack them again with the
same location-based and/or mobility criteria. After that, if there are still clusters left without a
host, we apply a bin-packing algorithm which also activates new hosts on demand (lines 22-23).
This effectively allows to address detected overutilization. Lines 24-28 are there to pick any
slack and attempt to free up any underutilized hosts by re-associating their clusters to other more
heavily packed hosts that fit. Complexity breakdown of this algorithm with M representing the
cluster count, and N – the host count, is:
• lines 3-13: O(MN)
• lines 14-21: O(MN)
• lines 22-23: O(M2)
• lines 24-28: O(MN)
The lines 22-23 of the algorithm are operating on a very small number of clusters, and the
associated complexity has a very little effect on overall performance, so, for our proposed
packing algorithm, we can assume the complexity to be of O(MN).
C. Metrics
Power
In centralized cellular architecture we have eNodeB broken into two components – RRH and
BBU. An RRH has a smaller form factor than an eNodeB, requires less computational capacity,
and, in some situations, can take advantage of a passive cooling altogether generating much
smaller operational power footprint. A BBU, when moved to a centralized location such as a
BBU pool, is most likely integrated into a centralized power and cooling infrastructure and we
can only roughly estimate the impact it has on a BBU pool’s power consumption. The power
budget in a data center involves interdependent power components and runtime power takes a
non-linear form [12]. In this paper we are only looking at computational components of a data
center, and since we are assuming that our BBU pool takes form of a data center with VBBUs
being hosted on GPPs, we borrow a power model elaborated by data centers researchers [7][17]:
Etotal = Ecomp + Emigr + Eswit (1)
����� = ∑ ���� )) � ���� (2)

12
���� = 4 ∗∑ �����
��
��� (3)
, where the total energy (1) is the sum of the computational energy (2), the energy required to
migrate VBBU instances between hosts (3), and the energy required to bring up hosts from a
dormant state. For (2), N stands for the number of servers in consideration and ��� )) is the
power consumption by ith
server with a utilization ui(t). In (3), Pm stands for unit migration power
consumption, Cj – migrated/transferred data size, and BWj is the bandwidth used while migrating
the jth
VM. Also, to simplify the power model, we are going to look at CPU utilization only and
exclude any memory or storage power consumption from consideration. Ecomp is a sum of all
individual hosts’ power consumption which we compute as functions of their corresponding
CPU utilization. Emigr is the power consumed to perform all the migrations which involves
accounting for the size of data transmitted and the bandwidth. Eswit can be considered to be a sum
of constants, especially in the case when the computing systems used in the pool are
homogeneous.
Migrations
To analyze packing algorithms’ performances we also look into the overall number of
migrations. To move a VBBU instance time and resources are consumed, and, depending on the
size of VBBUs and frequency they have to be migrated with, more load is added to the intra-
BBU pool network which can potentially introduce congestion and affect the quality of service.
Handovers
When mobile devices move between different areas of coverage within the cellular network,
they have to undergo the process of transfer of their state from the tower they leave to the tower
found in range. This process involves passing the corresponding UE context between towers, and
in a centralized cellular architecture it can be facilitated if VBSs performing handovers are on the
same host. On Figure 4, UE1 physically moves from the RRH1’s coverage area into the RRH2’s
which causes the UE1’s context to be transferred between corresponding VBBUs, and since they
are sharing the same host it is less costly time- and resource-wise compared to the handover
shown for UE2.
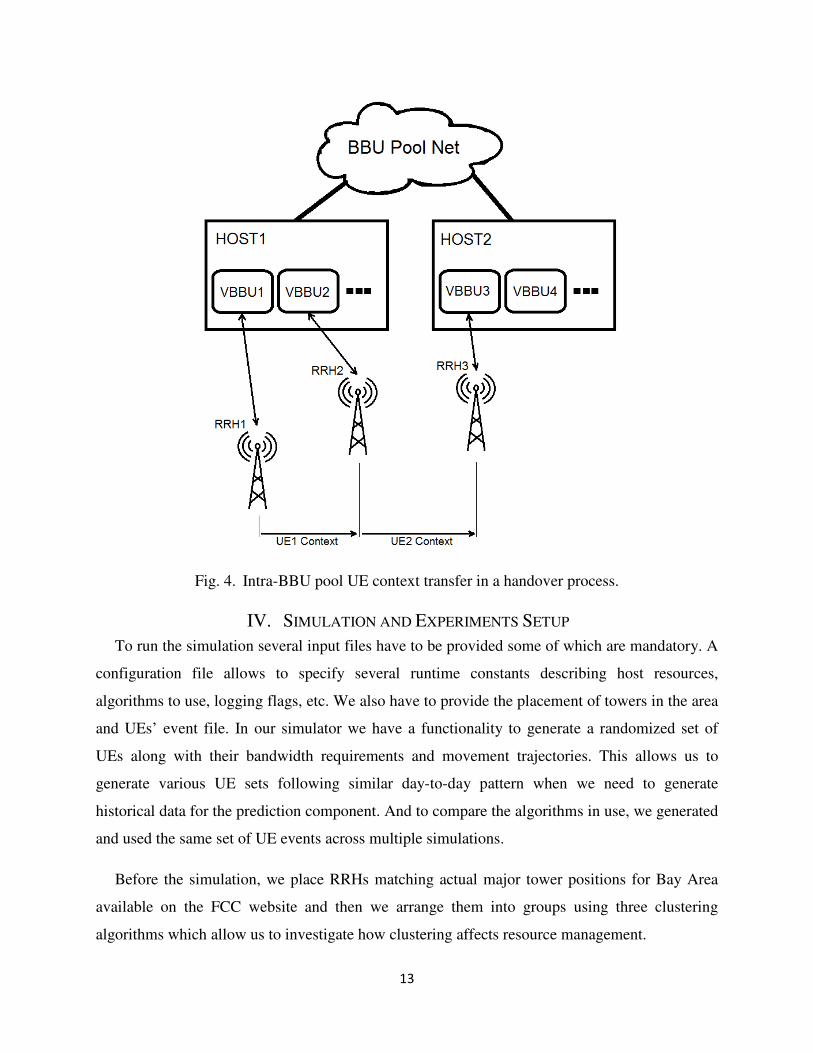
13
Fig. 4. Intra-BBU pool UE context transfer in a handover process.
IV. SIMULATION AND EXPERIMENTS SETUP
To run the simulation several input files have to be provided some of which are mandatory. A
configuration file allows to specify several runtime constants describing host resources,
algorithms to use, logging flags, etc. We also have to provide the placement of towers in the area
and UEs’ event file. In our simulator we have a functionality to generate a randomized set of
UEs along with their bandwidth requirements and movement trajectories. This allows us to
generate various UE sets following similar day-to-day pattern when we need to generate
historical data for the prediction component. And to compare the algorithms in use, we generated
and used the same set of UE events across multiple simulations.
Before the simulation, we place RRHs matching actual major tower positions for Bay Area
available on the FCC website and then we arrange them into groups using three clustering
algorithms which allow us to investigate how clustering affects resource management.

14
TABLE I. Clustering algorithms used.
TABLE II. Packing algorithms used.
TABLE I and II list the clustering and packing algorithms used in the experiments with
associated codes used in the graphs and the time complexity. For TABLE I, r stands for the
number of towers we are clustering, and for TABLE II M and N represent the number of clusters
and hosts respectively.
Algorithm Name Code Complexity
Best Fit Host [7] BFH O(MN)
First Fit [8] FF O(M log M)
Mobility Pattern [5] MP O(M log M)
Location aware LA O(MN)
Location aware with Mobility LAM O(MN)
Location aware with mobility and handovers LAMH O(MN)
Algorithm Name Code Complexity
Hierarchical Clustering HIER O(r2)
Affinity Propagation [6] AP O(r2)
Affinity Propagation with Traffic APT O(r2)

15
V. SIMULATION RESULTS
A. Clustering results
Figure 5 shows the result of hierarchical clustering where the main criteria is the inter-RRH
distance within clusters. The main purpose and advantage of this algorithm is the fact that all of
the RRHs are equipotent and each can take up on a role of a master node, this, in turn, produces
tighter clusters.
Fig. 5. Hierarchical clustering applied on mapped out RRHs.

16
For the affinity propagation (AP) algorithm shown on Figure 6 we have a little bit lax distance
constraint. In the default algorithm setup the clusters are formed around one of the points –
exemplars, – and that resulted in a spatially bigger clusters, and consequently, fewer clusters
overall.
Fig. 6. Affinity propagation applied on mapped out RRHs.

17
Additionally, we customized the AP algorithm by introducing weights into cluster
consideration which allowed us flexibly apply slack on point-to-point distance constraint and
bias edges with higher UE mobility. On Figure 7 we can see how those features affect some of
the clusters (marked by ovals on both figures for AP), where new edges were added because of
the slack and/or weights.
Fig. 7. Affinity propagation with traffic awareness applied on mapped out RRHs.
Due to different grouping goals used in the hierarchical clustering and affinity propagation
algorithms, the resulting RRH distribution over clusters shows a significant imbalance biasing
towards small clusters in the former. From TABLE III we can see how drastically the
distribution of RRHs varies when applying different algorithms. It should be noted that it is the

18
distance restriction in a hierarchical clustering and affinity propagation that contributes to this
difference. We also see how the introduction of weights causes cluster count reduction in affinity
propagation and reduces bias towards smaller clusters (1-RRH) even more.
TABLE III. RRH count breakdown across clusters.
All the simulations share the same set of UE events which provides a stimulus to RRH
clusters. And since we are experimenting with three clustering algorithms we have three sets of
clusters’ response. Every time a cluster resizes due to events from UEs, its resource utilization in
the BBU-pool also gets affected subsequently inducing the resource manager to re-evaluate the
resource requirements on corresponding host. The packing algorithms then re-arrange clusters on
hosts to eliminate underprovisioning and to free the resources if re-packing allows for it.
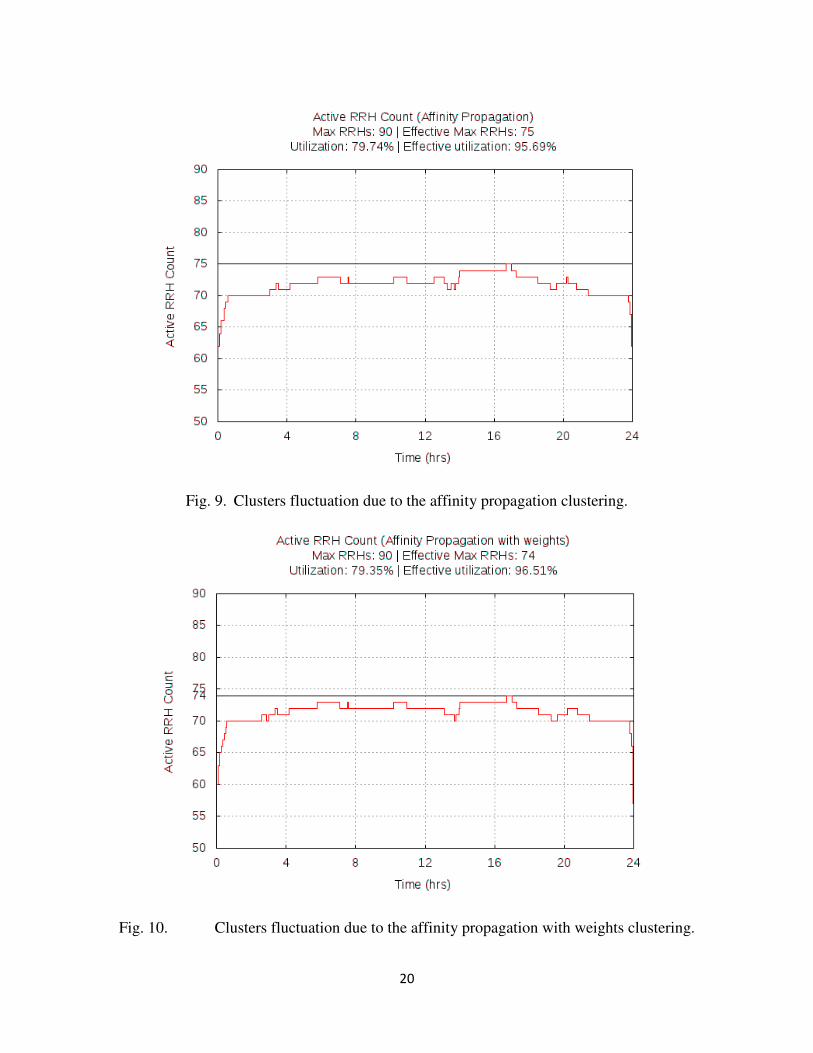
Figures 8-10 show clusters fluctuations due to a moderate stimulus from UE input. There are
steep rise and drop near the beginning and the end of the simulation, but in general, local runtime
maximums coming from UE events show mild variation causing flatter waveform. In TABLE III
the hierarchical clustering algorithm shows bias towards smaller clusters compared to AP-type
algorithms, and the corresponding waveform on Figure 8 shows a little bit more aggressive
response to the input.
These figures list “utilization” and “effective utilization” values which allow us to estimate
the potential energy savings compared to a static use of RRH in the latter, and a static
Hierarchical
clustering
Affinity
propagation
Affinity propagation
with traffic awareness
Clusters 50 42 36
1-RRH Clusters 17 13 5
2-RRH Clusters 26 12 12
3-RRH Clusters 7 15 15
4-RRH Clusters 0 2 4

19
provisioning in the former, when the resource manager activates just enough RRHs to provide
coverage for the predicted peak. The utilization percentages are based on area under the curve
calculation. For example, the whole system has 90 RRHs installed, out of which approximately
84% are used in general throughout the simulation when hierarchical clustering is applied
(Figure.8). The simulation also showed at the peak only 79 RRHs are utilized, which is
“effective” RRH count which the system needs to operate throughout the day, and “effective
utilization” basically represents how much of those 79 RRHs were utilized during the simulation.
So, “utilization” and “effective utilization” percentages shown on these figures are to represent
the ratio of the area under the runtime curve to the areas under the maximum and runtime peak
correspondingly.
Fig. 8. Clusters fluctuation due to the hierarchical clustering.
20
Fig. 9. Clusters fluctuation due to the affinity propagation clustering.
Fig. 10. Clusters fluctuation due to the affinity propagation with weights clustering.

21
From these figures we can draw a parallel with the experiments where the researches
manipulate the clusters of cellular towers to conserve the energy [14][13]. Our experiments also
show the promise to reduce power consumption if towers’ operating states can be manipulated
without loss of coverage. For the given input we see about 80% of the RRH pool utilization
which translates to roughly 20% of saving, and if we consider a scenario when the UE activity is
extremely low, such as at night, this figure drops to the floor value corresponding to the number
of clusters in the system. In this regard, the clustering method and consequently the size of the
clusters can affect how much saving can be achieved during those quiescent hours. From
TABLE III, assuming the worst case scenario when we can only have small clusters such as in
the hierarchical clustering, the potential energy saving in the RRH pool is about 40%. Again, we
want to emphasize that in this paper we are assuming some towers within a cluster are capable to
compensate for those that were switched off.
B. Experiment I
One of the potential advantages discussed by proponents for a centralization of radio networks
is the overall improvement in performance for the tasks involving inter-tower cooperation such
as handovers, interference mitigation techniques, CoMP, etc. [1][4][16][5]. In this part of our
experiment we investigate how packing can affect the number of handovers that happen between
clusters packed on different hosts. A UE handover involves migration of UE context between
towers, which takes time and bandwidth, and in a centralized architecture, where the BBU pool
aggregates multiple virtual towers and the internal network assumed to be shared between all of
them, suboptimal BBU instance placement can result in unnecessary bandwidth increase due to
handovers being passed between physically neighboring BBUs which happened to be served by
different hosts.
In this experiment, we are using a hierarchical clustering algorithm to form the clusters (in-
figure abbr: HIER), and pack them using six different algorithms where only location-aware
algorithms consider RRH physical position during packing calculation. We have three
configurations for each packing experiment, where we vary the size of the host (4CPU and
5CPU) and the initial packing - location based (L.Init) and randomized (R.Init). For randomized
placement we just force 1-to-1 host-cluster mapping during initialization and let the packing
algorithms deal with it.

22
Figure 11 shows the percentage of how many handovers between clusters located on different
hosts occur. We are not considering handovers within the cluster, since they are already on the
same host, so, the percentage is relative to overall handovers between different clusters.
Fig. 11. Inter-host handovers.
We can see a general trend is that by adding a location-awareness to the packing algorithms
the overall inter-host handovers improves. The graph shows several outliers of which “HIER
BFH 5CPU L.Init.” stands out the most and is just a good example of the fact that an algorithm
without a location-awareness incorporated, also can produce a good result, although it is not
quite as consistent across different simulations. The investigation of this result showed that there
was a combination of three major factors that benefited the BFH in this simulation. First, we
used a location based cluster placement during initialization. Secondly, the BFH by itself avoids
any unnecessary migrations and is quite static if the resource utilization fluctuations are mild.

23
Thirdly, Figure 9 confirms the fact that in this particular simulation, the input variation was
probably not enough for the BFH algorithm to significantly affect the initial cluster packing.
One thing to note regarding location-aware algorithms is that they do not force the packing
using whatever criteria they are based on. During the resource usage evaluation, the algorithms
merely look up any “good” neighbors and if the resources are available only then the neighbors
are brought together. This approach aims to put neighbors together, but at the same time, might
cause a less tight packing.
C. Experiment II
For the second experiment we are running all six packing algorithms against clusters formed
during initialization by three clustering algorithms. The purpose of this experiment is to
investigate the performance of the algorithms discussed in this paper, identify potential problems
and establish some facts from the results.
Since we are packing dynamic clusters of virtualized BBUs on hosts it has an effect on the
host pool. Figure 12 depicts aggregated statistics for the pool collected during simulation,
specifically – the global minimum of active hosts, the global average, and the global maximum.
In this graph the most representative information is the average host count and its relation to the
global maximum. Out of all experiments, for the current input, “HIER BFH” is the most well
behaved with regard to the host utilization which is indicated by its average and maximum
values being close. Nevertheless, as TABLE III indicates, all “HIER” type experiments deal with
greater number of clusters, and we can see that it has been reflected with average host count
being greater than in “AP*” types.

24
Fig. 12. Active host count runtime statistics.
All the experiments in this part take advantage of location-based initialization, and all the
algorithms make extensive use of regression analysis of history data for resource usage. Because
of that, the resource manager resizes and packs clusters tightly more often than not. The outcome
of this is that the average runtime values for the host count in these experiments are the most
representative for the resource utilization, and on Figure 13 we can see the bars corresponding to
the estimated processing power follow the trend.

25
Fig. 13. Estimated power in the BBU pool.
Both – Figure 12 and Figure 13 – show the similar tendency to benefit clustering which
results in a smaller set such as APT. The global minimum values in Figure 12 along with
TABLE III allow us to extrapolate that during “off-peak” hours, the AP- and APT- based setups
would have much better energy saving characteristics due to the single fact that they have fewer
clusters.

26
On the figure below we can see some experiments report an extensive use of migrations, so
we further investigated this and found out that in some scenarios, the packing algorithms that
have multiple criteria to make the decision can have some sort of a jitter which can lead to an
excessive number of migrations as it can be observed on Figure 14 for “HIER LAM”, “AP MP”,
and “APT MP” experiments.
Fig. 14. Cluster migrations due to re-packing.

27
All three experiments, upon deeper investigation, proved to be the extreme cases when the
lack of priorities and restricting policies affects the decision making process resulting in
suboptimal placement and jitter which can occur for example when there are multiple equipotent
solutions to a packing problem. Compared to the BFH algorithm, our location-aware algorithms
still have some room for improvement since a great number of migrations not only burdens the
internal network, but also can affect the quality of service.
As in Experiment I, here we also gathered and examined the handover statistics. Figure 15
shows the handovers count during simulation for all packing and clustering algorithms.
Fig. 15. Inter-cluster handovers.
The trend shown by the stacked bars in the figure reflect the fact that the number of inter-
cluster handovers gets affected by the clustering algorithm. But also, we can see that having
smaller clusters has it benefits since packing algorithms have better opportunity to arrange them
in more handover-friendly manner. The evidence of this is more clearly shown in Figure 16
where we isolate inter-host handovers. In this figure we can trace and extrapolate two interesting

28
features. 1) Having smaller clusters, even if their number increases as a result, positively affects
inter-host handover count, especially when location-aware packing is used. 2) Enforcing
specifics investigation during packing, beneficially impacts inter-host handovers as well – from
the figure above we can see how using more location-specific properties to negotiate packing
positively affects inter-host handover count.
Fig. 16. Inter-host handovers.
There is one more thing we want to discuss, which is the host pool utilization. Figure 17
shows the effective host pool utilization, meaning, we have calculated here what the utilization
advantage is compared to the runtime active host count maximum. The idea behind it is that we
are comparing dynamic packing to the static packing when the resource manager estimates
expected utilization peak, allocates the necessary resources and activates them for the full period.
It has to be noted, that in this comparison we are looking at the most optimistic scenario for the
static provisioning where the ceiling for utilization is based on a well-packed runtime maximum.

29
Fig. 17. Host pool utilization.
The purpose of the figure above is not to compare the algorithms against each other, rather we
want to see the improvement in the host utilization if the alternative solution for the resource
management is based on a static provisioning when the global maximum is assumed to be from a
dynamic provisioning and the clusters are initialized on hosts and never overutilize their hosts
during the runtime.
In the figure we see the improvement in the host pool utilization to be about 7% in average if
we exclude two outliers – “HIER BFH” and “APT MP”. In conjunction with previous results,
these two special cases allow us to extrapolate the following. 1) If the clustering and packing
algorithms effectively “cushion” the input fluctuation as it happened in “HIER BFH”, the global

30
maximum can be misleading for a static provisioner to make any assumptions about the peak.
The evidence of that can be seen if we look at other “HIER” based experiments, where the global
maximum is a bit higher. 2) “APT MP” experiment shows that at some point during the runtime
the packing algorithm had a suboptimal packing configuration resulting in the host utilization
spike. We can extrapolate that in a real life situation, this spike value would be more appropriate
for a static provisioner to assume, especially if we look back at the clusters fluctuation waveform
and note that for this experiment the clusters are mostly at 80% utilization on average and there
is no guarantee that at some point the input wouldn’t reach the ceiling. So we can expect the
potential reasonable savings in the host pool utilization to be more notable than the average
shown in the figure above.
TABLE IV. Clustering algorithms features.
Clustering
algorithms
Advantages Disadvantages
Hierarchical
Clustering
Inherently can cluster towers that share
common characteristics, e.g. intra-cluster
distance restriction.
Adding new criteria does not increase the
runtime complexity.
Not flexible if the clustering
criteria includes
approximations or
assumptions.
Node traversal order affects
the resulting clusters.
Affinity
propagation
Inherently forms clusters around existing
nodes.
Flexibility in adjusting clustering criteria:
selecting candidate centroids, size of the
cluster, applying custom cluster rules.
Convergence time is not
deterministic and runtime
can fluctuate.
Affinity
propagation
[6] with
mobility
Specialization by applying custom rules, in
this case, using historical data of UE
mobility.
Increased convergence time
compared to normal Affinity
Propagation.

31
TABLE V. Packing algorithms features.
VI. CONCLUSION
Centralized radio access network architecture is an actively researched topic and there are
multiple implementation aspects that has to be addressed before it becomes more widespread. In
this paper we are making several assumptions about capabilities of this architecture which are in
accordance with numerous publications on the subject:
• a fronthaul can span a few dozen of kilometers,
• general purpose platforms are capable to host multiple BBU instances,
• migration of BBU instances between the hosts is feasible without the degradation of
service,
• RRH’s operating state can be remotely manipulated,
• RRH’s zones of responsibility can be dynamically adjusted affecting its power and
coverage area.
Packing
algorithms
Advantages Disadvantages
BFH [7] Tight packing. Without specialization can result
in increased inter-host
bandwidth utilization due to UE
migrations.
FF [8] Fastest out of all used algorithms used
in this experiment.
Same as in BFH.
Sub-optimal packing.
MP [5] Allows packing clusters that
complement each other which, when
grouped, exhibit the overall resource
requirements to be near flat-line in the
course of the selected period.
Requires history analysis and
pattern recognition.
Can result in increased inter-
host bandwidth utilization due
to UE migration if neglected.
False positives can cause sub-
optimal packing.
LA (and its
variants –
LAM, LAMH)
Specialization.
Targets the mobility characteristic
which affects bandwidth utilization
within BBU Pool.
Requires history analysis and
pattern recognition.
Sub-optimal packing can be
introduced to meet the
specialization and target
requirements.

32
In our experiments the main focus was on BBU instances, which we organized into clusters
and placed them on hosts using three clustering and six packing algorithms. Our goals were to
adapt the packing algorithms from data centers, investigate their behavior in the mobile
environment and, based on the results, propose alternative solutions and recommendations.
Dynamically manipulating clusters of BBU instances based on demand from UEs has a
positive effect on RRH pool as well, given that there is a one-to-one RRH-BBU mapping and
their operation states are synchronized, i.e. when a BBU is turned “off”, the corresponding RRH
transitions to a dormant state as well. Our results also showed savings in power usage within the
RRH pool, even for scenarios when variations in the UE usage pattern are not extensive during
active hours [13][14].
Adapting packing algorithms from data centers to manage BBU instances within a BBU pool
improved the overall energy efficiency and resource utilization [7][8]. For example the BFH
algorithm showed the best result packing the clusters on fewer hosts with the lowest number of
migrations. But, the lack of a mechanism to account for mobility information introduced the
overhead caused by the increased inter-host traffic associated with UE handovers. Furthermore,
during the “peak” hours, the performance of the mobile network (e.g. QoS) might be prioritized
over energy conservation, thus a packing that reduces inter-host traffic associated with inter-
BBU cooperation would be more beneficial. In this paper we introduced a location-aware
algorithm and two modifications that target more specific aspects of mobile environment which
potentially can help to address the issue of increased inter-host traffic.
Our experiments showed that packing algorithms adapted from data centers can be improved
with the regard to inter-host traffic by simply applying location-aware initialization during initial
packing, although, it does not guarantee the consistency across the runs. In this regard, location-
aware algorithms showed more promise to consistently reduce inter-host traffic by sacrificing the
packing efficiency. From the experiments we can outline a few guidelines to address packing
problem in the mobile environment.
• Avoid generic solutions being applied across various regions – each area requires fine-
tuning to address its peculiarities.
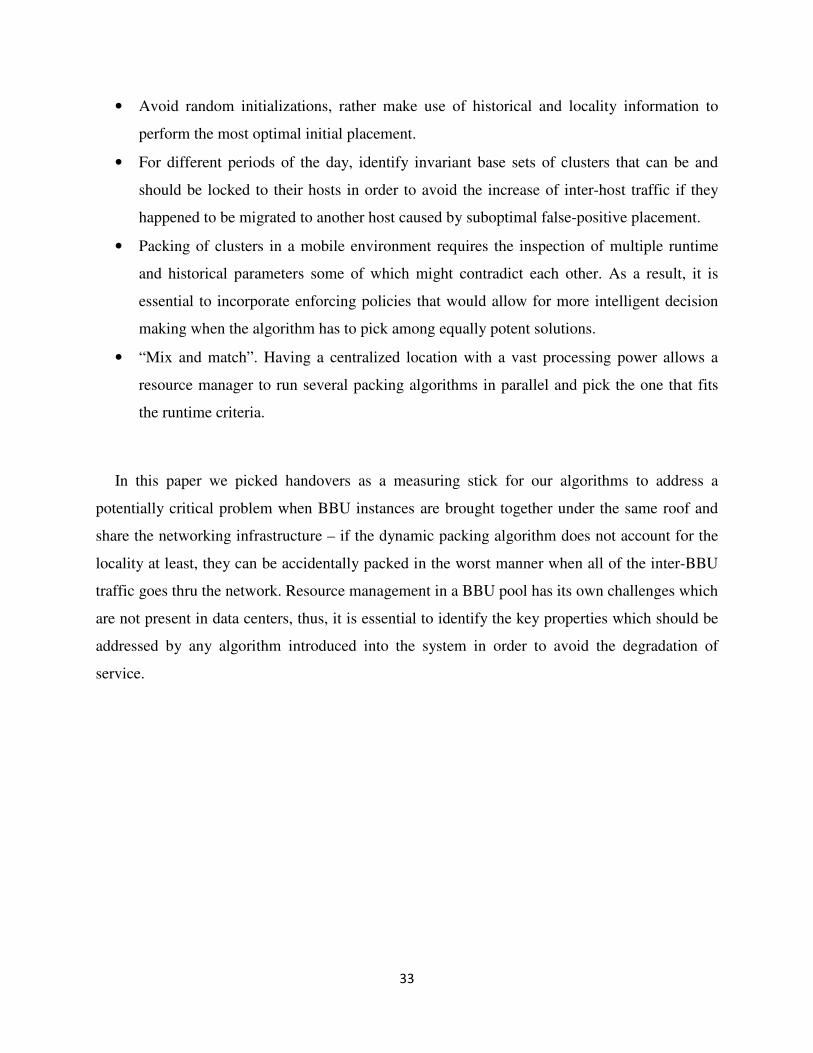
33
• Avoid random initializations, rather make use of historical and locality information to
perform the most optimal initial placement.
• For different periods of the day, identify invariant base sets of clusters that can be and
should be locked to their hosts in order to avoid the increase of inter-host traffic if they
happened to be migrated to another host caused by suboptimal false-positive placement.
• Packing of clusters in a mobile environment requires the inspection of multiple runtime
and historical parameters some of which might contradict each other. As a result, it is
essential to incorporate enforcing policies that would allow for more intelligent decision
making when the algorithm has to pick among equally potent solutions.
• “Mix and match”. Having a centralized location with a vast processing power allows a
resource manager to run several packing algorithms in parallel and pick the one that fits
the runtime criteria.
In this paper we picked handovers as a measuring stick for our algorithms to address a
potentially critical problem when BBU instances are brought together under the same roof and
share the networking infrastructure – if the dynamic packing algorithm does not account for the
locality at least, they can be accidentally packed in the worst manner when all of the inter-BBU
traffic goes thru the network. Resource management in a BBU pool has its own challenges which
are not present in data centers, thus, it is essential to identify the key properties which should be
addressed by any algorithm introduced into the system in order to avoid the degradation of
service.

34
REFERENCES
[1] A.Checko, H.L. Christiansen, Y.Yan, L.Scolari,G.Kardaras, M.S.Berger,L.Dittmann, "Cloud
RAN for Mobile Networks—A Technology Overview", IEEE Communication
Survey&Tutorials, Vol.17, No.1, 1st Quarter 2015, pp.405-426.
[2] A. Virdis, G. Stea, G. Nardini, "SimuLTE - A Modular System-level Simulator for
LTE/LTE-A Networks based on OMNeT++," Proc. 4th International Conference on
Simulation and Modeling Methodologies Technologies and Applications (SIMULTECH
2014), Aug. 2014.
[3] C. De Sa, “Basic Collision Detection in 2D”, http://devmag.org.za/2009/04/13/basic-
collision-detection-in-2d-part-1/, Apr. 2009.
[4] D. Lee et al., "Coordinated multipoint transmission and reception in LTE-advanced:
deployment scenarios and operational challenges," in IEEE Communications Magazine, vol.
50, no. 2, pp. 148-155, February 2012.
[5] D. Pompili, A. Hajisami and T. X. Tran, "Elastic resource utilization framework for high
capacity and energy efficiency in cloud RAN," in IEEE Communications Magazine, vol. 54,
no. 1, pp. 26-32, January 2016.
[6] Frey BJ, Dueck D, "Clustering by passing messages between data points," Science
315(5814):972–976, 2007.
[7] J. Huang, K. Wu and M. Moh, "Dynamic Virtual Machine migration algorithms using
enhanced energy consumption model for green cloud data centers," 2014 International
Conference on High Performance Computing & Simulation (HPCS), Bologna, 2014, pp. 902-
910.
[8] J. Liu, J. Guo and D. Ma, "Traffic Aware Virtual Machine Packing in Cloud Data Centers,"
2016 IEEE 2nd International Conference on Big Data Security on Cloud (BigDataSecurity),
IEEE International Conference on High Performance and Smart Computing (HPSC), and
IEEE International Conference on Intelligent Data and Security (IDS), New York, NY, 2016,
pp. 256-261.
[9] K. Alexandris, N. Nikaein, R. Knopp and C. Bonnet, "Analyzing X2 handover in LTE/LTE-
A," 2016 14th International Symposium on Modeling and Optimization in Mobile, Ad Hoc,
and Wireless Networks (WiOpt), Tempe, AZ, 2016, pp. 1-7.
[10] Navid Nikaein, "Processing Radio Access Network Functions in the Cloud: Critical
Issues and Modeling," Proceedings of the 6th International Workshop on Mobile Cloud
Computing and Services, September 11-11, 2015, Paris, France.
[11] R. N. Calheiros, R. Ranjan, A. Beloglazov, C. A. F. De Rose, and R. Buyya, "CloudSim:
a toolkit for modeling and simulation of cloud computing environments and evaluation of
resource provisioning algorithms," Software-Practice and Experience, v. 41, pp. 23-50, 2011.
[12] S. Pelley, D. Meisner, T.F. Wenisch, J. VanGilder, “Understanding and abstracting total
datacenter power,” in: Workshop on Energy-Efficient Design, 2009.
[13] S.Zou, Y.Zhang, Y.Tang, “Resource Allocation Mechanism Based on Two-Step
Mapping for Saving Energy in Wireless Network Virtualization”, IEEE 9th International
Conference on Anti-counterfeiting, Security, and Identification, 2015, pp. 150-154.
[14] Sang Hyun Lee, Illsoo Sohn, "Affinity Propagation for Energy-Efficient BS Operations
in Green Cellular Networks", Wireless Communications IEEE Transactions on, vol. 14, pp.
4534-4545, 2015, ISSN 1536-1276.

35
[15] Sourjya Bhaumik , Shoban Preeth Chandrabose , Manjunath Kashyap Jataprolu , Gautam
Kumar , Anand Muralidhar , Paul Polakos , Vikram Srinivasan , Thomas Woo, "CloudIQ: a
framework for processing base stations in a data center", Proceedings of the 18th annual
international conference on Mobile computing and networking, August 22-26, 2012,
Istanbul, Turkey.
[16] “C-RAN The Road Towards Green RAN”, China Mobile Research Institute, Beijing,
China, Oct. 2011, Tech. Rep.
[17] J. Huang, K. Wu, and M. Moh, “Dynamic virtual machine migration algorithms using
enhanced energy consumption model for green cloud data centers,” 2014 International
Conference on High Performance Computing and Simulation (HPCS).

36
APPENDIX A: SIMULATOR IMPLEMENTATION
To run the experiments we built a high-level behavioral event-driven application to simulate
BBU pool, RRHs and mobile UEs. We looked at various simulation platforms before committing
to develop our own and had to discard them with a single reason being their accuracy. It is
inevitable for any simulation tool with the increased accuracy and adherence to the real-life
implementation to have the runtime speed significantly reduced and consequently the turnaround
time for the results increased. LTE targeted simulators such as SimuLTE or MatLab-based
Vienna LTE-A Simulators are tailored towards accurate simulation of LTE architecture’s
underlying protocols from application layer down to physical layer of the stack which in turn has
an adverse effect on a simulation time. We also looked at CloudSim platform, a modeling tool
for data centers, and while we discarded it as our base platform, we borrowed some of the ideas
used in its implementation [11].
The diagram on Figure 18 shows the essential components in our implementation along with
their logical association with a BBU pool and open world.
Fig. 18. CRANSim block diagram
37
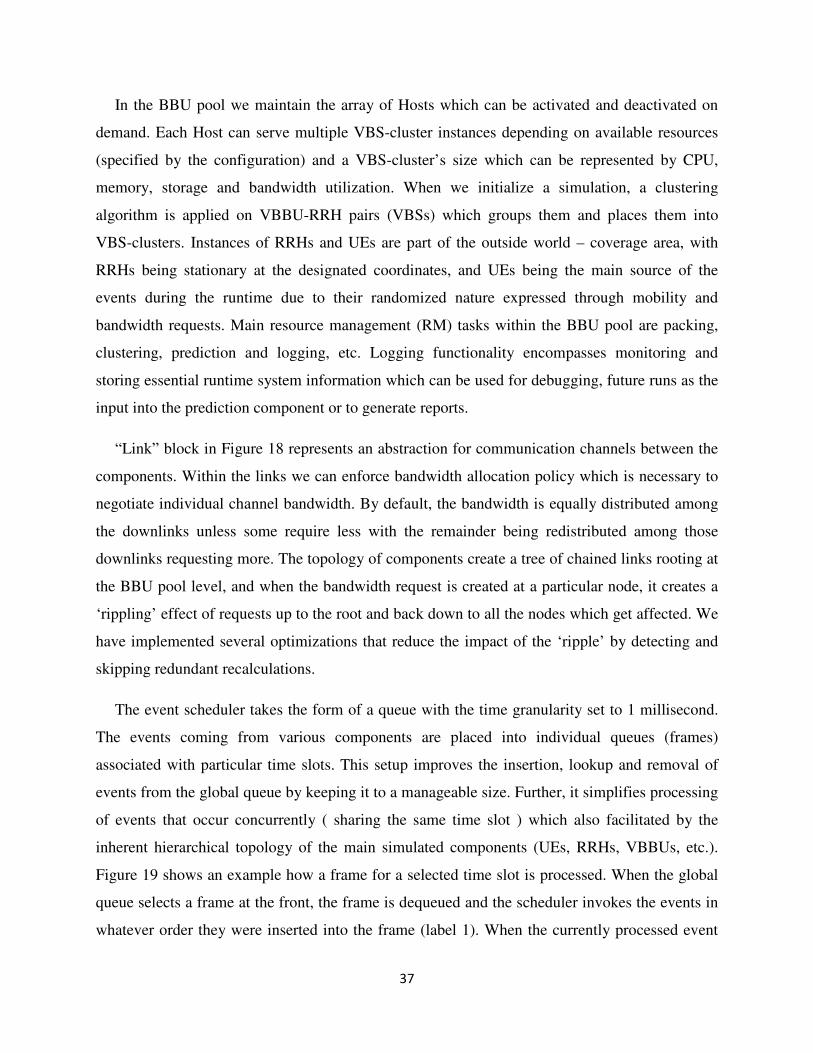
In the BBU pool we maintain the array of Hosts which can be activated and deactivated on
demand. Each Host can serve multiple VBS-cluster instances depending on available resources
(specified by the configuration) and a VBS-cluster’s size which can be represented by CPU,
memory, storage and bandwidth utilization. When we initialize a simulation, a clustering
algorithm is applied on VBBU-RRH pairs (VBSs) which groups them and places them into
VBS-clusters. Instances of RRHs and UEs are part of the outside world – coverage area, with
RRHs being stationary at the designated coordinates, and UEs being the main source of the
events during the runtime due to their randomized nature expressed through mobility and
bandwidth requests. Main resource management (RM) tasks within the BBU pool are packing,
clustering, prediction and logging, etc. Logging functionality encompasses monitoring and
storing essential runtime system information which can be used for debugging, future runs as the
input into the prediction component or to generate reports.
“Link” block in Figure 18 represents an abstraction for communication channels between the
components. Within the links we can enforce bandwidth allocation policy which is necessary to
negotiate individual channel bandwidth. By default, the bandwidth is equally distributed among
the downlinks unless some require less with the remainder being redistributed among those
downlinks requesting more. The topology of components create a tree of chained links rooting at
the BBU pool level, and when the bandwidth request is created at a particular node, it creates a
‘rippling’ effect of requests up to the root and back down to all the nodes which get affected. We
have implemented several optimizations that reduce the impact of the ‘ripple’ by detecting and
skipping redundant recalculations.
The event scheduler takes the form of a queue with the time granularity set to 1 millisecond.
The events coming from various components are placed into individual queues (frames)
associated with particular time slots. This setup improves the insertion, lookup and removal of
events from the global queue by keeping it to a manageable size. Further, it simplifies processing
of events that occur concurrently ( sharing the same time slot ) which also facilitated by the
inherent hierarchical topology of the main simulated components (UEs, RRHs, VBBUs, etc.).
Figure 19 shows an example how a frame for a selected time slot is processed. When the global
queue selects a frame at the front, the frame is dequeued and the scheduler invokes the events in
whatever order they were inserted into the frame (label 1). When the currently processed event

38
generates a new event that must be scheduled for an immediate execution, the scheduler inserts it
right at the front of the global queue with the same timestamp (label 2). And if some event wants
to register a new event with a delay, the scheduler performs a binary insertion at the requested
time position (label 3).
Fig. 19. Scheduler’s global queue processing.
The main source of events for the simulation is UE. Each UE can request a certain bandwidth
for a particular duration of time by creating a bandwidth request event for the uplink channel
connected to the RRH in range. Also, some UEs move actively across the coverage area
generating numerous movement events at which point the mobility functionality not only
calculates the displacement, but also triggers connectivity and handover events. Handover also
can be the source of bandwidth recalculation events - when a UE detaches from a RRH, it
releases any bandwidth used, and then has to request for a bandwidth allocation when it attaches
to another RRH.

39
The movement processing is one of the most expensive functions in this simulator. When UE
moves, it has to maintain in- and out-of-range state with a neighboring RRH. In our
implementation we tried two approaches to perform mobility tracking – a time sampling and a
trajectory pre-calculation. For the sample-based method we used 500 millisecond intervals when
the UE has to verify its proximity and either attach or detach to the closest RRH. This method
proved to be extremely costly for the simulations spanning a 24 hour period with the UE pool
measured in thousands. To address this performance issue we attempted to use a trajectory pre-
calculation technique based on collision detection techniques used in a video game development
[3]. During initialization we parse UE’s trajectory and perform path segmentation at the key
points when UE crosses the regions covered by RRHs, then, for each segment we create a list of
the in-range RRHs which further improves the performance since the number of RRHs to check
for proximity is greatly reduced. The downside of this approach is that it requires a lot more
memory to run the simulation.