virtues of investment fund recommendations: consumer reports and
TRANSCRIPT
Virtues of Investment Fund Recommendations: Consumer Reports and Money Magazine
C. Edward Chang
Missouri State University
Thomas M. Krueger Texas A&M University-Kingsville
In February 2007, Consumer Reports (CR) and Money magazine (MM) published investment fund recommendations. CR recommended only mutual funds while about one fifth (13 of 67) of MM selections were exchange-traded funds. Enough time has now passed to allow for a rigorous evaluation of these two selections. The findings of this study consistently laud the performance of both recommendations, because both significantly outperform category averages. The abnormal performance of CR funds appears to arise from minimizing risk, whereas MM funds’ strength lies in reducing costs and making selections that will benefit more from market advances. INTRODUCTION
Consumer Reports and Money magazine are two of the most popular magazines published in the United States. Consumer Reports claims to be one of the ten leading magazines in the country, with 4.3 million subscribers, and 16 million readers (Center for Advancing Health, 2009, p. 39). Money magazine has a circulation of 1.9 million copies and readership of 8.0 million, and, like Consumer Reports, is published twelve times a year (Nationwide Newspapers, 2012). According to the Audit Bureau of Circulation (2012), this circulation level ranks Money in 36th place. For comparison purposes, People magazine, which ranked #10 in the United States in 2011 had a circulation of 3.6 million copies in June 2011 (Kantor, 2012).
Magazines, be they financial or general, rely upon eye-catching stories to sell issues. One of the best ways to attract new subscribers is with claims of having some sort of unique insight from which readers can benefit. Finance publications often rely upon listing of stocks for investors to hone in on, as illustrated by Fortune magazine’s Investor’s Guide 2012 special issue devoted to the top selections for 2012. Within that edition, readers can find stories on purchases of investments including stocks, bonds, metals, and real estate, in articles with such catchy titles as “Where Do I Put My Money Now?” (Sloan, 2011) and “Advice from the Expert Roundtable” (Covin, 2011).
The problem is that all publications dealing with prediction of the future have only a conjecture regarding future condition. They have no prior knowledge. While there is a place for strategic investment and investment analysis, the ability to accurately predict the best investments would be an anomaly, running counter to the semi-strong efficient market hypothesis. In 2007, Consumer Reports and Money magazine ran articles claiming to have identified the best investment funds for the future. After reviewing
Journal of Applied Business and Economics vol. 14(3) 2013 35
a variety of studies regarding investment prediction by finance publications, the remainder of this report compares these two investment recommendations. LITERATURE REVIEW Stock Recommendations
The finance literature is full of examples of finance publications that attempted to predict the future and failed. There are also individual examples of supposed sleuths who had examined investments and came out with the best. A widely-reported example (i.e., Barker (2007) and Orcutt (2012)) is Fortune magazine’s 2000 article titled “10 Stocks to Last the Decade.” Of the ten stocks listed only one finished the decade with a higher price. Twice as many went out of business, and the remaining seven finished the decade with a loss!
Instead of drawing conclusions from one published prediction, several researchers have taken a more rigorous approach. In fact, the rigorous study of the success of financial service agencies goes back many decades. In 1933, in the midst of what came to be known as the “Great Depression,” Cowles studied the forecasting ability of leading financial information service agencies. In the first volume of Econometrica, Cowles (1933) reports that, on average, securities purchased on the basis of forecasters’ suggestions underperformed the market.
Over the ensuing eighty years, a multitude of research has analyzed the performance of investment gurus. Brody and Rees (1996) divide the information set into the complicated (as they characterize as The Wall Street Journal Transcript) and simplistic (which they characterize as Money magazine). They go on to highlight the success of the simplistic Value Line Investment Survey, and support given to the “Value Line Enigma” by Copeland and Mayers (1982) and Pawlukiewicz and Preece (1991).
Brody and Rees’ (1996) contribution to the investor advice literature is an early direct assessment of the performance of stock purchase and sale recommendations published in two popular investment magazines. They analyze the relative performance of 130 recommendations by Money magazine and 109 by Changing Times in 1990, in total there were 214 buy recommendations and 25 sell recommendations. Over the ensuing year, the median cumulative return on the buy recommendations was significantly worse than the market return. Although the “sell” portfolio outperformed the market, results were driven by a single investment. Comparison of Money magazine and Changing Times led to the conclusion that only Changing Times recommendations can provide abnormal profits. However, the market-excess returns evaporated after a short period of time. By comparison, our study examines mutual fund recommendations, over a more recent period of time, is based on a longer holding period, and compares the performance of Money magazine to Consumer Reports. Mutual Fund Recommendations
The mutual fund industry has been one of the extraordinary growth stories in the history of U.S. financial markets. In 1984, net fund assets totaled $370 million; in 2010 they were $10.4 trillion (Haslem, 2010, page xvii). In 2010, 96 million individual investors in 55 million households owned mutual funds. The essential force of this growth has been the effectiveness of mutual funds as vehicles for providing investors with retirement incomes and financial wealth. Performances of various types of mutual funds have been documented in numerous studies; many of which are summarized in Haslem’s masterfully written books (Haslem, 2003; Haslem, 2010).
Jensen’s (1968) classic study of mutual fund performance found that the average mutual fund produced disappointing returns. Throughout the remainder of the 20th century and into the current epoch the value of active mutual fund management continues to be hotly debated. In their comprehensive analysis of active versus passive management across investment categories over time, Fortin and Michelson (2002) found significant advantages to indexing. Only in the small company equity market and international stock market were mutual fund managers able to seek out inefficiencies and outperform the benchmark index. In all other instances, the index return was significantly greater than the average fund return. Using a technique that controls for situations where mutual funds ended up with significant alphas
36 Journal of Applied Business and Economics vol. 14(3) 2013
by luck alone, Barras, Scaillet, and Wermers (2010) find that virtually no funds exhibit persistent positive performance. Furthermore, the very small proportion of funds that beat market index, has shrunk over time.
Moreover, Comer, Larrymore, and Rodriguez (2008) examined the success of the Wall Street Journal’s predictions reported in its “Smart Money Fund Screen” during 2005. Across 389 mutual funds in the sample, the funds generate positive alphas during the year before publication. However, post publication there is an average decline of over two percent! An important aspect of their findings is that the worst publication performance was experienced by domestic equity funds, which make up a plurality of the investment funds recommended by CR and MM.
In an attempt to explain their results, Comer, Larrymore, and Rodriguez (2008) note the findings of Brown, Harlow, and Starks (1996) and Busse (2001) who observed that equity fund managers strategically shift the risk of their portfolio in the opposite direction of performance. Comer, Larrymore, and Rodriguez find that a majority of funds did not alter their benchmark risk levels. Funds chosen by CR and MM tend to have lower risk levels than found within Morningstar benchmark categories, which may provide a partial explanation for the success of CR and MM portfolios. Performance of Consumer Reports' Recommended Mutual Funds
We were unable to find any studies of specific investment fund recommendations by Money magazine. Only two articles have evaluated the performance of Consumer Reports’ recommended mutual funds. The Index Investor critically commented that the Consumer Reports’ (2005) multi-attribute utility analysis “runs the risk of producing answers that are at best misleading and sometimes flat-out wrong” (The Index Investor). After adjusting for matching categories and index fund benchmarks, the Index Investor found that many of the 52 Consumer Reports’ funds actually had negative alphas between 1995 and 2004, with an average alpha of only 0.17%. The Index Investor concluded that Consumer Reports recommended “actively managed mutual funds, whose expense levels and tax costs are demonstrably higher than those on comparable index funds, without any statistically significant evidence that the active funds’ risk/return trade-off is superior.” The Index Investor considered Consumer Reports’ recommenda-tion of mutual funds in 2005 a big mistake by an organization that is generally extremely reliable.
Moreover, Index Investor’s alpha calculations are based on a period prior to mutual fund recommendation. The positive 0.17% alpha may be a result of fund selection based on historical performance. However, historical performance is not available to investors. Our analysis of mutual funds subsequent to Consumer Reports’ publication focuses on whether their analysts have any investment selection skills.
Chen (2011) examines 60 mutual funds presented in the February 2007 issue of Consumer Reports. Data for the same group of mutual funds were obtained as of September 30, 2008 to evaluate the recommendations provided in Consumer Reports. In order to exclude the major declines that occurred in the stock market in October 2008, the time periods of November 30, 2006 and September 30, 2008 were analyzed in her study. She examines the relationship between mutual funds’ net assets, share prices, manager tenures, expense ratio, tax–cost ratio and annualized returns to see whether Consumer Reports is a reliable source for investors seeking to purchase mutual funds. Chen concludes that Consumer Reports may not be a reliable source for investors seeking to improve their investment decisions.
We believe our research is an improvement over that of Chen for several reasons. We deal with a more recent time period and do not exclude any period of abnormal stock market performance. This research investigates an extended time period and expands on the number of return and risk measures in prior studies. Furthermore, we compare the performance of Consumer Reports and Money magazine.
Hedge funds have been the focus of many recent empirical studies. One of the more notable of these is Ibbotson, Chen, and Zhu’s (2011) assignment of return to fees, risk, and risk-adjusted return. They find that hedge funds provide excess risk-adjusted return in every year during the 1995-2009 period. Even when replacing the traditional beta measure of systematic risk with Fung and Hsieh’s (2004) seven-factor model, Ibbotson, Chen, and Zhu found significant alphas for hedge funds. Our study is not limited to hedge funds, which are atypical and would be inconsistent with the concept of studying the impact of
Journal of Applied Business and Economics vol. 14(3) 2013 37
picking funds on the basis of widely-disseminated investment information. Our examination of post-announcement performance does not suffer from a backfill bias, which Malkiel and Saha (2005) found could add more than five percent to returns for hedge funds. DATA AND RESEARCH METHOD Comparison of Fund Recommendations
Of course, this comparison would be irrelevant if CR and MM recommended the same funds. Fortunately, that is far from being the case, as shown in Table 1, which is a summary of the recommendations exhibited in Appendix A. CR recommended 84 funds, while MM recommended 67 funds, which are both less than one percent of the mutual funds within the same Morningstar categories chosen, as shown on the top line of Table 1. In total, the sample consists of 146 investment funds, 79 are unique to CR, 62 are unique to MM, and 5 were in both sets of recommendations. The investment funds selected by both magazines and their Morningstar category are American Funds AMCAP A (Large Growth), T. Rowe Price Equity Income (Large Value), Vanguard Windsor II Investors (Large Value), T. Rowe Price New Era (Natural Resources), and Royce Pennsylvania Mutual Investment (Small Blend).
Panel A of Table 1 reports the recommendation concentration across Morningstar categories. Both magazines are in agreement with regard to asset allocation, providing the most recommendations in domestic stocks and the least in municipal bonds. This commonality is probably a function of the total number of funds in these Morningstar categories. As shown in the right column of Panel A, 52.0 percent of all funds in the categories chosen by these magazines were domestic stock funds, while only 3.7 percent were municipal bond funds.
At 22.6 percent, balanced funds garnered the second highest number of CR recommendations, which MM excluded from its recommendations. However, MM placed 16.4 percent of its recommendations in fixed-income funds, which were not covered by CR. MM was also twice as likely to propose investment in an international stock fund.
Panel B of Table 1 reports that there was a notable difference within the individual Morningstar categories. A plurality of CR funds was in the large value Morningstar category, with selections in the moderate allocation category and small blend categories being the second and third most common. None of these Morningstar categories take the top three spots in the MM listing. Instead, MM urges investment in large blend, foreign large blend, and mid-cap blend funds. As reported in the right column, a plurality of mutual funds falls in Morningstar’s large blend category. Large blend funds are the fourth most frequent category in CR’s recommendations, despite being the most frequent in MM’s listing.
Panel C of Table 1 contrasts the concentration of the magazines’ recommendations. It reports the percentage of all recommendations in the top four listed Morningstar categories, which were given in Panel B. Both CR (46.4 percent) and MM (38.8 percent) have a higher concentration than found in mutual funds (35.0 percent) overall. Furthermore, it should be noted that the 35.0 percent value is based solely on the investment fund categories covered by CR or MM. Inclusion of other Morningstar categories (e.g., intermediate government and muni national long) would reduce the mutual fund concentration in the top four Morningstar categories.
Panel D and Panel E reveal the biggest differences in CR and MM recommendations. Panel D focuses on stock selections, while Panel E exhibits differences in other fund types. In these categories, there is at least a four fund difference in the number of funds chosen by CR or MM versus the other magazine. Mutual funds totals in the right column demonstrate that at least one hundred and forty-eight funds were available in each Morningstar category.
CR recommended almost three times as many large value stock funds, as shown in the top row of Panel D. CR also suggested five additional small blend funds and world stock funds; the latter category was totally devoid of a recommendation in the MM listing. Instead, MM recommended five more foreign large blend stock funds and four more diversified emerging market stock funds. CR did not identify any of the 241 funds in this latter Morningstar category as worthy selections.
38 Journal of Applied Business and Economics vol. 14(3) 2013
As shown in Panel E, which is consistent with the results reported in Panel A, large differences exist in the recommendations of non-stock funds. CR recommended balanced moderate allocation funds and balanced world allocation funds a total of fifteen times. However, MM did not recommend one fund from either Morningstar category. At the other extreme, MM selected four intermediate fixed-income funds, while CR did not recommend one of these 869 funds. Obviously, there are significant differences in the recommendations of CR and MM. This report investigates the relative performance of each recommendation over the ensuing five years. Data
All investment fund information comes from Morningstar. Investment funds are assigned to a specified category by Morningstar. If two or more investment funds within a Morningstar category are recommended an average of the funds’ performance on the measure under consideration is computed. An average of the Morningstar category averages are presented for each magazine’s set of recommendations. These are matched with the average of the portfolios consisting of all mutual funds in the same categories. Two sets of numbers are reported; one based solely on stock investments, while the other consists of stock funds, fixed-income funds, and balanced funds. This will be referred to as the average of all categories.
Creation of category averages has several benefits. For instance, investors can invest in a variety of securities and Morningstar categories. By computing averages for each category with magazine recommendations, we even out investment across the Morningstar categories. These averages are combined to create averages of all equity categories and averages of all categories recommended by the magazines. Our results are not biased by the frequency of recommendations within a given category by a magazine.
Another advantage of computing Morningstar category averages is that it allows us to create portfolios of all mutual funds in a given category. For instance, our results are not biased by the existence of 1,387 mutual funds in the Morningstar’s large blend category, as compared to there being only 86 mutual funds in Morningstar’s natural resources category. Findings are also not biased by the concentration of magazine recommendations in a given category. A benchmark is created by summing together the mean returns of each category. In creation of the benchmark, we only include categories in which a specified magazine made a recommendation. For instance, in the “all” mutual fund benchmark for CR’s recommendation, real estate is not included. However, it is included in the MM benchmark. Standard pairwise t-tests are computed using Excel to estimate the significance of the differences in these means.
A direct comparison between CR and MM is also presented. First, Morningstar categories in which CR and MM made a recommendation were identified. Category average results were then computed for each. Averages of these category averages will be presented in the columns on the right side of the following tables along with t-test statistics. These columns only include equity categories, because no agreement existed on investment in any of the other categories. Capture Ratios
Due to their relative newness to the portfolio evaluation process, additional information will be shared on the capture ratios. Much like the Sortino measure’s focus on standard deviation below the mean, capture ratios have gained popularity because of their ability to provide important investment insight and because they are intuitive and easily understood by investors. Upside capture ratios compare an investment performance against a market index during periods when the benchmark’s performance is positive. On the other hand, downside capture ratios compare the performance to a benchmark during periods when the benchmark’s performance is negative.
A value of 100% for either capture ratio implies that the investment fully captures, or matches, the market surrogate’s return during the period evaluated. A value exceeding 100% indicates that the investment captured more return than the benchmark of the upward movement. This is good news if the market advanced, but bad news if the market declined. A value less than 100% means the investment
Journal of Applied Business and Economics vol. 14(3) 2013 39
captured less return than its benchmark, which is good in down markets but bad news in up markets. Capture ratios provide insight regarding whether a fund is relatively aggressive or defensive in nature. Investors can also make portfolio allocation decisions based on their expectation of future market performance; for instance, selecting funds with high capture ratios in anticipation of market advances. FINDINGS Investment Fund Characteristics Expense Ratio
Abnormal fund performance may arise from astute selection of investment funds with low expense ratios. Selection of funds with high expense ratios would raise the return hurdle necessary to match category performance. Consequently, the first aspect studied of the investment funds recommended by CR and MM is their expense ratios. As shown in Panel A of Table 2, the average expense ratio of CR equity recommendations is 0.40 percent (i.e., 1.00% – 1.40%) below the category average. The average expense ratio of all CR recommendations is 0.36 percent (i.e., 0.95% – 1.31%) below the category average. In both instances, CR recommendations have expense ratios that are significantly lower at the 0.01 level.
Expense ratios are even lower for the MM recommendations. Considering the equity recommenda-tions, the expense ratios are 0.62 percent (i.e., 0.76% - 1.38%) lower. Across all recommendations, the MM recommendations have an expense ratio that is 0.59 percent (i.e., 0.66% - 1.25%) lower. Both of these are significant at the 0.01 level. When limiting the analysis to only those Morningstar categories in which CR and MM made a recommendation, MM recommendations on average have an expense ratio that is 0.33 percent (i.e., 1.05% – 0.72%) lower, which is significant at 0.01 level. Annual Turnover
Expense ratios may be minimized by reducing portfolio turnover, which could however result in slower reaction to economic events and diminish return. On the other hand, investors may feel more comfortable investing in portfolios whose contents are stable. As shown in Panel B of Table 2, the annual turnover of CR equity recommendations is under forty percent (i.e., 39.85%), and less than half of the category average. When considering all CR recommendations, annual turnover again is approximately half of the benchmark. The differences in annual turnovers are significant at the 0.01 level.
Likewise, MM recommendation’s turnover ratios are lower than their category averages at the 0.01 level. In fact, the turnover falls to only 28.81 percent among the equity component of MM’s listing. Though not significantly different, there is a large disparity in the annual turnover of the CR and MM recommendations, with the MM set having an average turnover ratio that is three fifths (i.e., 29.16% ÷ 48.45%) as large. Five-Year Tax Cost Ratio
Morningstar reports a tax cost ratio to measure the percentage of a fund’s annual return that is reduced by the taxes investors pay on distributions. For instance, a tax cost ratio of 2.1 percent reduces portfolio value by this 2.1 percent to cover taxes. Investors must pay taxes on dividends and capital gains distributions in the year they are received. Like expense ratios, tax cost ratios negatively impact investors and are concentrated in the 0.0 to 5.0 percent range. A zero percent tax cost ratio indicates the fund had no taxable distributions. Assuming equal distributions, a higher tax cost ratio indicates that the fund was less tax efficient.
Tax cost ratios of CR equity recommendations were higher than their category average. Given the low variation in tax cost ratios, this 0.09 percent (i.e., 0.87% – 0.78%) difference was significant at almost the 0.01 level. When including balanced funds and the single state long-term municipal bond fund, the difference diminishes to an insignificant 0.04 percent.
By comparison, tax cost ratios of MM equity recommendations were lower than their category average by 0.29 percent (i.e., 0.74% - 1.03%), which was almost significant at the 0.05 level. Though the
40 Journal of Applied Business and Economics vol. 14(3) 2013

difference diminishes to 0.23 percent (i.e., 0.90% – 1.13%), additional degrees of freedom from adding the non-equity selections to the sample and lower variability result in a difference that is significant at the 0.05 level. Within the Morningstar categories with both CR and MM recommendations, MM have a tax cost ratio that is 0.14 percent (i.e., 0.69% – 0.83%) lower, which is significant at the 0.10 level. Looking back across Table 2, MM recommendations have preferable lower expense ratios and higher tax efficiency. Return and Risk
Average annual rates of return over the March 2007 to February 2012 period are presented in Panel A of Table 3. The portfolio of funds recommended by CR earned a return that was over one percent higher whether considering equities or all proposed investments. The difference is significant at the 0.01 level.
Likewise, MM equity recommendations earned a return that was over one percent higher than their category average. The one instance where the recommended funds do not beat the category average by at least one percent is MM recommendations across all categories. However, the 0.88 percent (i.e., 2.63% - 1.75%) difference is still significant at the 0.01 level. With a difference of only 0.08 percent (i.e., 2.40% -2.32%), and lack of statistical significance, one cannot say that either the CR or MM recommendations earned a higher rate of return.
The standard deviation of monthly returns over the five-year holding period is presented in Panel B of Table 3. Compared with category benchmarks, CR recommendations provide the preferable lower level of variation, whether considering equity categories alone or all recommendations. Across the sixty observations, the standard deviation difference reaches a level of 2.07 percent (i.e., 23.29% - 21.22%) within the equity categories. When expanding the sample to all Morningstar categories with a CR recommendation, the smaller 1.70% (i.e., 20.81% - 19.21%) standard deviation difference is still significant at the 0.01 level.
In one of the first instances where MM recommendations do not outperform the category average, the standard deviations are virtually identical for the chosen funds and their category averages. Consequently, the standard deviation of the CR selection has less risk than funds chosen by MM. However, the difference falls short of the 0.05 level.
Betas, which are exhibited in Panel C of Table 3, follow the same pattern as standard deviations. Betas of funds chosen by CR are consistently lower than category averages at approximately the 0.01 level. MM betas are very similar to category averages. In fact, the equity fund betas are identical to their category average. The 0.08 (i.e., 1.12 – 1.04) difference in betas between MM recommendations and CR recommendations, is significant at the 0.05 level. The fact that this small difference is significant at this level attests to the fact that the chosen investment funds’ betas have little variation. Looking back across the return and risk information exhibited in Table 3, it is obvious that both magazines identified returns that provided higher returns over the ensuing five years, with CR recommendations having the added bonus of picking funds with significantly lower levels of risk. Risk-Adjusted Return Measures
Given the significantly higher returns and lower or similar risk, as reported in Table 3, it is not surprising that the recommended investment funds provided significantly higher risk-adjusted returns. Sharpe ratios measure excess returns on the basis of total variation, using standard deviation which was presented in Panel A of Table 3. Panel A of Table 4 reveals that Sharpe ratios of recommended funds are consistently better than the category averages. The difference is consistently significant at least at the 0.05 level, and only dropping to that level when measuring significance for the MM selections across all categories. The Sharpe ratios of the CR funds and MM funds are virtually identical, at 0.18 and 0.17, respectively.
Treynor measures, presented in Panel B of Table 4, measure return in excess of the Treasury rate relative to systematic risk or beta. CR funds’ typical better relative performance is perhaps most clearly identified using this risk-adjusted return measure. While the category average is a negative 0.21% annually, which implies that average returns were less than Treasury yields, CR equity funds’ Treynor
Journal of Applied Business and Economics vol. 14(3) 2013 41

measure was 1.17%. Even the lesser, “all categories” estimate of excess beta-adjusted returns is a Treynor measure that is six times larger than the category average. While the MM selections were also significant at the 0.01 level, their Treynor measure was a smaller 0.36 for equities. However, relative to the -0.59 for the equity category average, this performance is very good. Across all recommendations the MM choices fell short of providing Treynor measures that were twice their benchmark’s average. In those equity categories where CR and MM are making recommendations, the difference is small and insignificant.
Alpha measures are exhibited in Panel C of Table 4. They represent the excess return determined by subtracting the required return estimated using the capital asset pricing model from the actual return. Once again, the CR and MM selections consistently dominate the category averages. Across both recommendations, the average annual excess rate of return is almost one percent, which is always significant at the 0.01 level. Perhaps the biggest surprise is the reversal in recommendation dominance. While CR equities have the larger Treynor measure, MM equity funds have the larger alpha measures. However, the difference in those equity categories where CR and MM are making recommendations is not significant at even the 0.10 level. What can be gained from the study of risk-adjusted returns is that both recommendations clearly provided better choices whether considering total risk or systematic risk in computing risk-adjusted returns. Performance During Varying Market Conditions
The Sortino measure, presented in Panel A of Table 5, is a risk-adjusted return measure similar to the Sharpe measure. Unlike the Sharpe measure’s adjustment of return in excess of the Treasury yield for all price variance as measured by standard deviation, the Sortino measure only includes negative price variation in the denominator. As such, it does not penalize investments for above-average returns. The Sortino measures presented in Table 5 are always greater than the Sharpe measures presented in Table 4, because the denominator is only a portion of the standard deviation. For instance, the equity funds recommended by CR have a Sharpe measure of 0.16 and a Sortino measure of 0.22, both of which are statistically significant at the 0.01 level.
Considering only downside risk using the Sortino measure produces a change in the relative confidence one can have in claiming that the CR and MM recommendations provide useful information in one of four instances. However, the statistical significance of MM recommendations, as a whole, drops slightly from 0.05 to 0.10. As with the Sharpe ratios, the CR and MM Sortino ratios for the equity fund categories they have in common is virtually identical.
Upside and downside capture ratios are commonly used to determine how much an investment participates in the upward or downward movement of the market. Upside and downside capture ratios are presented in Panel B and Panel C of Table 5, respectively. The importance of reviewing both is immediately evident, when analyzing CR fund performance. Category averages have significantly higher upside capture ratios, in Panel B, which would run counter to the results presented above which indicate that excess returns arise from CR recommendations. Downside capture ratios, given in Panel C, are also significant. However, in this case, significantly higher capture ratios would imply that the categories tend to be populated with funds that magnify market losses. Within all categories, CR funds understate the market decline, resulting in a downside capture ratio less than 100 percent of the decline. This finding is consistent with that reported in Panel A of Table 5, where it is reported that CR funds have a significantly higher Sortino measure.
By comparison, there is no significant difference in MM fund capture ratios, in either rising for falling markets. This finding indicates that the abnormally good performance of MM selections is not a function of market conditions. However, the same cannot be said for the CR versus MM comparison exhibited in the right set of columns in Table 5. Here we see that MM choices provide a larger benefit to investors when markets are rising and detriment when markets are falling. The differences, 9.58% (i.e., 115.79% – 106.21%) during market advances and 8.92% (i.e., 111.30% – 102.38%) during market declines come close to offsetting each other. Looking back at the information provided in Table 5, it appears as though CR recommendations should be courted by investors expecting a market decline and MM recommendations should be sought by those anticipating a market increase.
42 Journal of Applied Business and Economics vol. 14(3) 2013
Morningstar Rankings Morningstar rankings in terms of return, risk, and risk-adjusted return (or “star” ranking) are
exhibited in Panel A, Panel B, and Panel C of Table 6, respectively. A distribution is created by Morningstar for each category, allowing investors to assess the performance of their fund relative to the other funds in that category. Funds are not ranked across category. Hence, category averages always have a value of three, “3,” which is the middle score on Morningstar’s 5-level rankings system. Ideally, one would like to have a high ranking on the return measure, a low ranking on the risk measure, and a high ranking on the risk-adjusted return measure.
In most instances, recommended funds have a Morningstar return ranking that is significantly better than the category average at the 0.01 level. The best ranking is earned by MM equity funds, which have a return ranking of 3.47 on average. The lowest ranking, and one that is significant at only the 0.10 level is that attained by CR equity funds. In categories with both CR and MM recommendations, the average CR recommendation is 3.32 and MM recommendation is 3.55, which are not significantly different.
CR recommendations, whether considered on an equity-alone or all-categories basis, have significantly less risk at the 0.01 level. MM risk measures are virtually identical to the category average. As a consequence, it is not surprising that the Morningstar risk ranking of the CR recommendations is lower than that of the MM recommendations in those equity categories where both magazines made recommendations. A lower rating on this measure is preferable.
Consistent with the higher returns and lower risk reported in Panel A and Panel B, respectively, Panel C of Table 6 reports that CR choices supply a risk-adjusted return that is significantly higher than the category average at the 0.01 level. The best performance estimate reported on Table 6 is the “star” rating of CR across all categories, which comes in at a ranking of 3.57, or closer to the ranking of “4” than “3.” MM recommendations also beat their category averages on this measure, but have a lesser 0.05 level of significance. Given the higher return ranking of MM recommendations and lower risk ranking of CR recommendations, it is not surprising that the rankings based on risk-adjusted return are similar and not statistically different. Taking the information in Table 6 as a whole, when considering the distribution of returns, risk and risk-adjusted returns it appears as though both CR and MM identified very useful selections for their readerships, with the CR suggestions providing less risk. CONCLUSION
This investigation examines the investment fund selection ability of Consumer Reports relative to the equally-widely disseminated Money magazine. Although a majority of recommended funds invest in stock in both instances, CR and MM chose vastly different investment funds. Within the equity fund universe, the magazines focused on different Morningstar categories. Furthermore, within the same Morningstar category, the magazines seldom chose the same stock. Nonetheless, the findings of this study consistently laud the performance of both recommendations, finding both recommendations outperform category averages. Furthermore, the difference is frequently significant at the 0.01 level. There is a slight preponderance of CR recommendations over its category average versus the performance of the MM choices relative to its category average.
On a head-to-head basis, in those categories where both magazines made recommendations each publication has its own strengths. CR funds’ strength appears to be based on minimizing risk, by picking funds with significantly lower standard deviations, betas, downside capture ratios, and Morningstar risk rankings. On the other hand, MM funds’ strength lies in reducing costs (through lower expense ratios and better tax efficiency) and making selections that will benefit more from market advances.
Despite its apparent ability to pick investment funds, CR has only produced one other listing of mutual fund recommendations. Future research could analyze how its February 2005 recommendations performed relative to the recommendation made by MM near the same point in time. Alternatively, one could expand the study by including recommendations made by Fortune magazine or another investment-oriented publication. Such research would provide insight to the robustness of these results which found
Journal of Applied Business and Economics vol. 14(3) 2013 43

startling market inefficiencies relative to recommendations made by both Consumer Reports and Money magazine. REFERENCES Audit Bureau of Circulation. (2012). “Circulation averages for six months ended 12/31/2011," downloaded on May 17, 2012 at http://abcas3.accessabc.com/ecirc/magtitlesearch.asp. Barker, B. (2007). “10 Stocks to Last the Decade, Revisited,” downloaded on June 8, 2012 at http://www.fool.com/investing/general/2007/02/02/10-stocks-to-last-the-decade-revisited.aspx. Barras, L., Scaillet, O. & Wermers, R. (2010). False Discoveries in Mutual Fund Performance: Measuring Luck in Estimated Alphas. Journal of Finance, 65, (4), February, 179-216. Brody, R.G. & Rees, L. (1996). The Performance of Popular Investment Magazine Stock Analysts. Journal of Applied Business Research, 12, (1), 42-46. Brown, K., Harlow, W.N. & Starks, L. (1996). Of Tournaments and Temptations: An Analysis of Managerial Incentives in the Mutual Fund Industry. Journal of Finance, 51, (1), June, 85-110. Busse, J. (2001). Another Look at Mutual Fund Tournaments. Journal of Financial and Quantitative Analysis, 36, (1), March, 53-73. Center for Advancing Health. (2009). “Consumer Reports: Car Buying Guide: A Case Report For Getting Tools Used,” downloaded on June 12, 2012 at http://www.cfah.org/activities/getting_tools_used/consumer.pdf. Chen, H. (2011). Analysis of Consumer Reports' Recommended Mutual Funds Compared to Actual Performance. Journal of Financial Services Marketing, 16, (1), June, 42-49. Comer, G., Larrymore, N. & Rodriguez, J. (2008). “Do Mutual Fund Media Recommendations Hold Value? An Empirical Analysis of The Wall Street Journal’s Smart Money Fund Screen,” working paper, Georgetown University, downloaded June 5, 2012 from uark.edu and papers.ssrn.com Consumer Reports. (2005). Stock Mutual Funds: 70 All-weather Winners. Consumer Reports, March, 28-33. Consumer Reports. (2007). 60 Funds You Can Count On. Consumer Reports, February, 18-22. Copeland, T.E. & Mayers, D. (1982). The Value Line Enigma (1965–1978): A Case Study of Performance Issues. Journal of Financial Economics, 10, (3), November, 289-321. Cowles, A., III. (1933). Can Stock Market Forecasters Forecast? Econometrica, 1, (3), July, 309-324. Covin, G. (2011). Advice from the Expert Roundtable. Fortune, 164, (10), December 26, 88-98. Fortin, R. & Michelson, S. (2002). Indexing versus Active Mutual Fund Management. Journal of Financial Planning, 15, (9), September, 82-94. Fung, W. & Hsieh, D.A. (2004). Hedge Fund Benchmarks: A Risk-Based Approach. Financial Analysts Journal, 60, (5), September/October, 65–80.
44 Journal of Applied Business and Economics vol. 14(3) 2013
Haslem, J. (2003). Mutual Funds: Risk and Performance Analysis for Decision Making, Malden, MA: Blackwell Publishing. Haslem, J. (2010). Mutual Funds: Portfolio Structures, Analysis, Management, and Stewardship. Hoboken, NJ: Wiley. Ibbotson, R.G., Chen, P. & Zhu, K.X. (2011). The ABCs of Hedge Funds: Alphas, Betas, and Costs. Financial Analysts Journal, 67, (1), January/February, 15-25. The Index Investor. (undated). “Consumer Reports: Mutual Fund Review - Critique” <http://www.indexinvestor.com/Free/consumerReports.php> Jensen, M. (1968). The Performance of Mutual Funds in the Period 1945-1964. Journal of Finance, 23, (2), May, 389-416. Kantor, S. (2012). “The Top 25 U.S. Consumer Magazines from June 2011,” downloaded on May 17, 2012 at http://accessabc.wordpress.com/2011/08/09/the-top-25-consumer-magazines-from-june-2011-fas-fax/. Malkiel, B.G. & Saha, A. (2005). Hedge Funds: Risk and Return. Financial Analysts Journal, 61, (6), November/December, 80–88. Money. (2007). The Money 70. Money, 36, (2), February, 64-66. Nationwide Newspapers. (2012). “Advertise in Money Magazine,” downloaded on June 6 at http://www.nationwideadvertising.com/adinmoma.html. Orcutt, J.R. (2012). “Common Sense Investing: Long-Term Predictions Sure to Go Wrong,” downloaded on June 6, 2012 at http://allocationforlife.blogspot.com/2012/01/long-term-predictions-sure-to-go-wrong.html. Pawlukiewicz, J.E. & Preece, D.C. (1991). The Impact of Value Line Special Situation Recommendations on Stock Prices: Evidence from the Over-the-Counter Market. The Financial Review, 26, (4), November, 547-568. Sloan, A. (2011). Where Do I Put My Money Now? Fortune, 164, (10), December 26, 85-87.
Journal of Applied Business and Economics vol. 14(3) 2013 45

TABLE 1 COMPARISON OF CONSUMER REPORTS AND MONEY MAGAZINE SELECTIONS
Consumer Reports Money Magazine All Mutual Funds Number of funds 84 67 12,847 Panel A: Allocation Across Major Morningstar Categories Domestic Stock International Balanced Fixed-Income Municipal Bond
65.5% 10.7% 22.6% 0.0% 1.2%
61.2% 20.9% 0.0%
16.4% 1.5%
52.0% 15.3% 12.8% 16.2% 3.7%
Panel B: Morningstar category with Largest Allocations Top Category Second Category Third Category Fourth Category
Large Value Moderate Allocation
Small Blend Large Blend
Large Blend Foreign Large Blend
Mid-Cap Blend Large Value
Large Blend Large Growth Large Value
Intermediate Term bond Panel C: Percent of Funds from four Largest Morningstar Categories Percent of Funds 46.4% 38.8% 35.0% Panel D: Biggest Differences in stock allocation ( Categories with at least 4 fund difference) Large Value Small Blend World Stock … Foreign Large Blend Diversified Emerging Markets
14 funds 8 funds 5 funds
… 1 fund 0 funds
5 funds 3 funds 0 funds
… 6 funds 4 funds
973 funds 493 funds 504 funds
… 552 funds 241 funds
Panel E: Examples of Differences in Other Morningstar Categories (at least 4 fund difference) Balanced Moderate Allocation Balanced World Allocation ………. Intermediate Fixed-Income
10 funds 5 funds ………. 0 funds
0 funds 0 funds ………. 4 funds
749 funds 148 funds ……….
869 funds
46 Journal of Applied Business and Economics vol. 14(3) 2013

TABLE 2 FUND CHARACTERISTICS: EXPENSE RATIO, ANNUAL
TURNOVER, AND TAX COST RATIO
Morningstar Categories with CR Selections
Morningstar Categories with MM Selections
Categories with CR and MM Overlap
Consumer Reports
Category Average
Money Magazine
Category Average
Consumer Reports
Money Magazine
Panel A. Expense Ratio (%)
Equity Categories
1.00 1.40 0.76 1.38 1.05 0.72 0.000*** 0.000*** 0.000***
All Categories
0.95 1.31 0.66 1.25 0.000*** 0.000***
Panel B. Annual Turnover (%)
Equity Categories
39.85 82.35 28.81 84.24 48.45 29.16 0.002*** 0.000*** 0.144
All Categories
39.29 78.55 45.47 96.21 0.000*** 0.000***
Panel C. Five-Year Tax Cost Ratio (%)
Equity Categories
0.87 0.78 0.74 1.03 0.83 0.69 0.017** 0.060* 0.070*
All Categories
0.85 0.81 0.90 1.13 0.194 0.046**
***, **, * reflect significance at the 0.01, 0.05, and 0.10 levels, respectively
Journal of Applied Business and Economics vol. 14(3) 2013 47
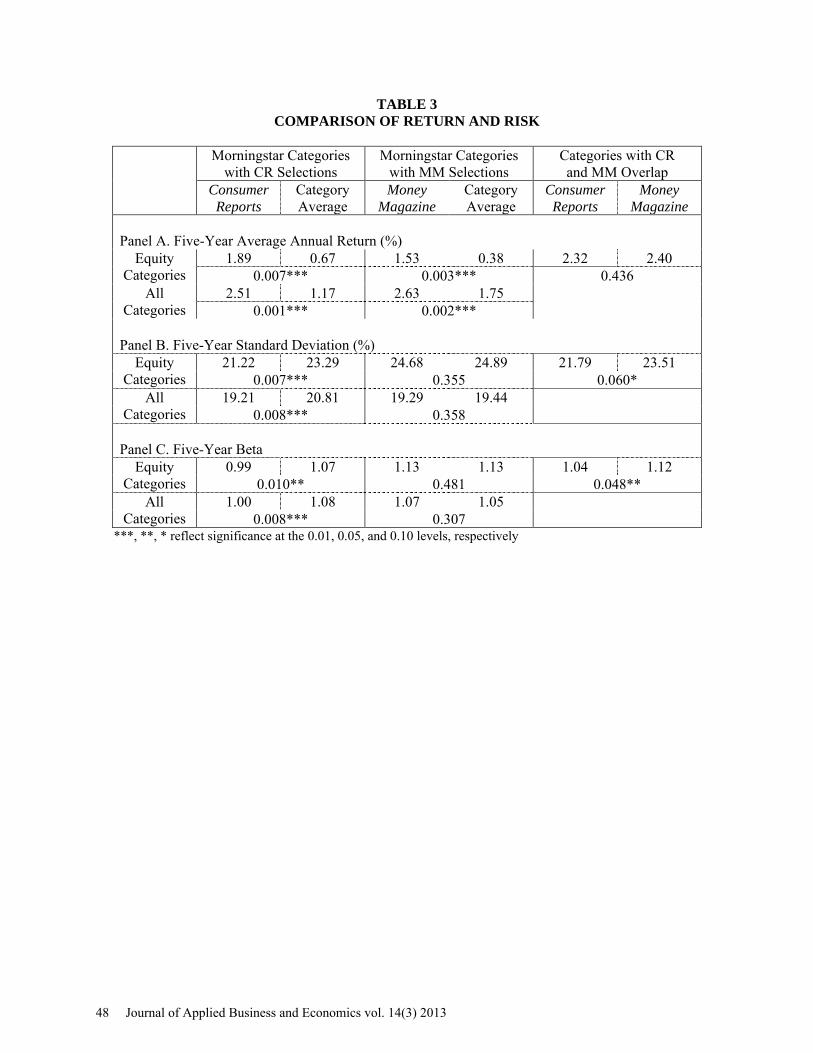
TABLE 3 COMPARISON OF RETURN AND RISK
Morningstar Categories
with CR Selections Morningstar Categories
with MM Selections Categories with CR and MM Overlap
Consumer Reports
Category Average
Money Magazine
Category Average
Consumer Reports
Money Magazine
Panel A. Five-Year Average Annual Return (%)
Equity Categories
1.89 0.67 1.53 0.38 2.32 2.40 0.007*** 0.003*** 0.436
All Categories
2.51 1.17 2.63 1.75 0.001*** 0.002***
Panel B. Five-Year Standard Deviation (%)
Equity Categories
21.22 23.29 24.68 24.89 21.79 23.51 0.007*** 0.355 0.060*
All Categories
19.21 20.81 19.29 19.44 0.008*** 0.358
Panel C. Five-Year Beta
Equity Categories
0.99 1.07 1.13 1.13 1.04 1.12 0.010** 0.481 0.048**
All Categories
1.00 1.08 1.07 1.05 0.008*** 0.307
***, **, * reflect significance at the 0.01, 0.05, and 0.10 levels, respectively
48 Journal of Applied Business and Economics vol. 14(3) 2013
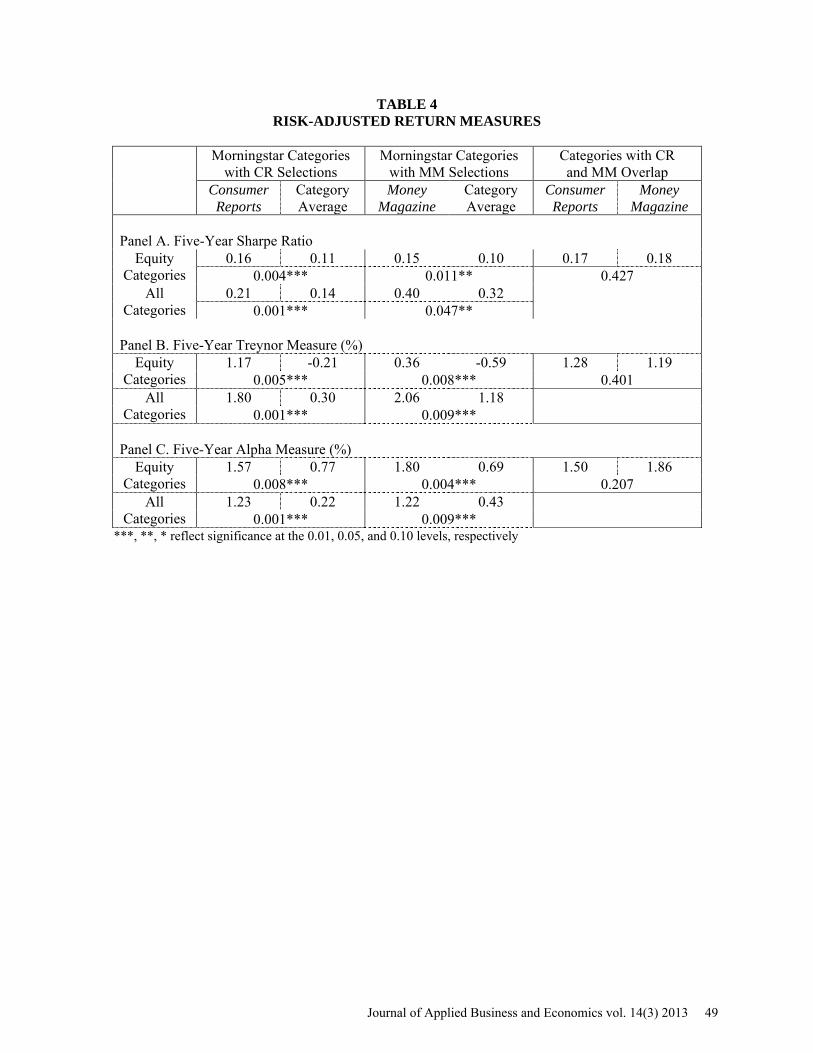
TABLE 4 RISK-ADJUSTED RETURN MEASURES
Morningstar Categories
with CR Selections Morningstar Categories
with MM Selections Categories with CR and MM Overlap
Consumer Reports
Category Average
Money Magazine
Category Average
Consumer Reports
Money Magazine
Panel A. Five-Year Sharpe Ratio
Equity Categories
0.16 0.11 0.15 0.10 0.17 0.18 0.004*** 0.011** 0.427
All Categories
0.21 0.14 0.40 0.32 0.001*** 0.047**
Panel B. Five-Year Treynor Measure (%)
Equity Categories
1.17 -0.21 0.36 -0.59 1.28 1.19 0.005*** 0.008*** 0.401
All Categories
1.80 0.30 2.06 1.18 0.001*** 0.009***
Panel C. Five-Year Alpha Measure (%)
Equity Categories
1.57 0.77 1.80 0.69 1.50 1.86 0.008*** 0.004*** 0.207
All Categories
1.23 0.22 1.22 0.43 0.001*** 0.009***
***, **, * reflect significance at the 0.01, 0.05, and 0.10 levels, respectively
Journal of Applied Business and Economics vol. 14(3) 2013 49
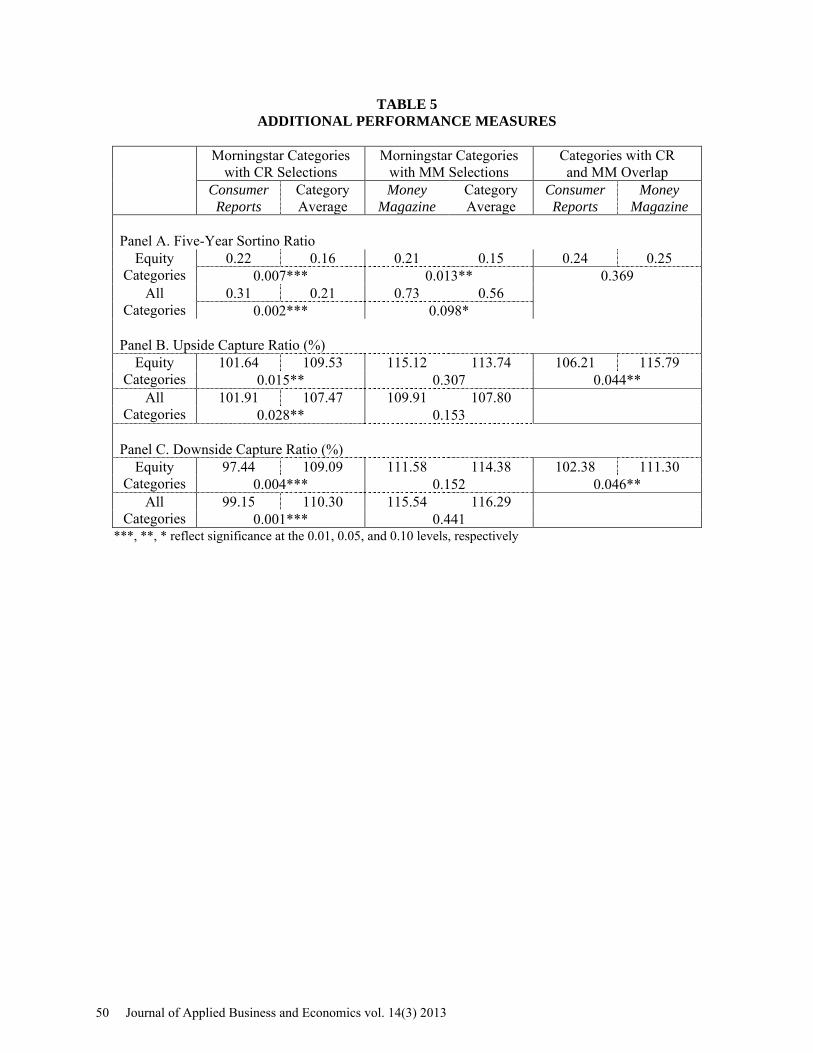
TABLE 5 ADDITIONAL PERFORMANCE MEASURES
Morningstar Categories
with CR Selections Morningstar Categories
with MM Selections Categories with CR and MM Overlap
Consumer Reports
Category Average
Money Magazine
Category Average
Consumer Reports
Money Magazine
Panel A. Five-Year Sortino Ratio
Equity Categories
0.22 0.16 0.21 0.15 0.24 0.25 0.007*** 0.013** 0.369
All Categories
0.31 0.21 0.73 0.56 0.002*** 0.098*
Panel B. Upside Capture Ratio (%)
Equity Categories
101.64 109.53 115.12 113.74 106.21 115.79 0.015** 0.307 0.044**
All Categories
101.91 107.47 109.91 107.80 0.028** 0.153
Panel C. Downside Capture Ratio (%)
Equity Categories
97.44 109.09 111.58 114.38 102.38 111.30 0.004*** 0.152 0.046**
All Categories
99.15 110.30 115.54 116.29 0.001*** 0.441
***, **, * reflect significance at the 0.01, 0.05, and 0.10 levels, respectively
50 Journal of Applied Business and Economics vol. 14(3) 2013
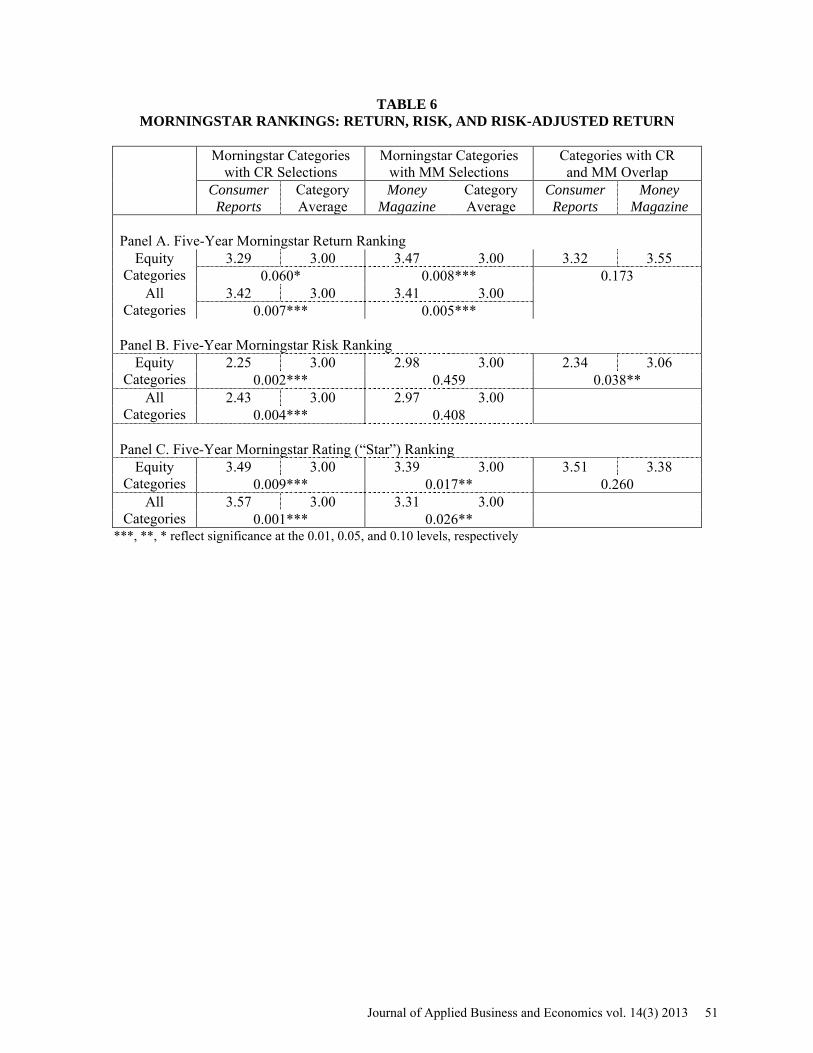
TABLE 6 MORNINGSTAR RANKINGS: RETURN, RISK, AND RISK-ADJUSTED RETURN
Morningstar Categories
with CR Selections Morningstar Categories
with MM Selections Categories with CR and MM Overlap
Consumer Reports
Category Average
Money Magazine
Category Average
Consumer Reports
Money Magazine
Panel A. Five-Year Morningstar Return Ranking
Equity Categories
3.29 3.00 3.47 3.00 3.32 3.55 0.060* 0.008*** 0.173
All Categories
3.42 3.00 3.41 3.00 0.007*** 0.005***
Panel B. Five-Year Morningstar Risk Ranking
Equity Categories
2.25 3.00 2.98 3.00 2.34 3.06 0.002*** 0.459 0.038**
All Categories
2.43 3.00 2.97 3.00 0.004*** 0.408
Panel C. Five-Year Morningstar Rating (“Star”) Ranking
Equity Categories
3.49 3.00 3.39 3.00 3.51 3.38 0.009*** 0.017** 0.260
All Categories
3.57 3.00 3.31 3.00 0.001*** 0.026**
***, **, * reflect significance at the 0.01, 0.05, and 0.10 levels, respectively
Journal of Applied Business and Economics vol. 14(3) 2013 51

APPENDIX A
Numbers of Available Investment Funds Recommended by Consumer Reports (CR) and Money Magazine (MM) in February 2007 and All Mutual Funds as of March 31, 2012
Morningstar Category CR MFs MM MFs CR MM Domestic Stock Funds Commodities Broad Basket 34 1 34 1 Financial 1 86 86 1 Health 1 118 118 1 Large Blend 7 1,387 9 1,387 7 9 Large Growth 2 1,266 4 1,266 2 4 Large Value 14 973 5 973 14 5 Mid-Cap Blend 6 314 6 314 6 6 Mid-Cap Growth 3 595 3 595 3 3 Mid-Cap Value 5 309 3 309 5 3 Natural Resources 3 86 2 86 3 2 Real Estate 196 3 196 3 Small Blend 8 493 3 493 8 3 Small Growth 1 572 1 572 1 1 Small Value 4 255 1 255 4 1 International Stock Funds Diversified Emerging Mkts 241 4 241 4 Foreign Large Blend 1 552 6 552 1 6 Foreign Large Growth 1 165 165 1 Foreign Large Value 1 264 2 264 1 2 Foreign Small/Mid Growth 106 1 106 1 Foreign Small/Mid Value 1 35 35 1 Global Real Estate 104 1 104 1 World Stock 5 504 504 5 Balanced Funds Aggressive Allocation 2 287 287 2 Conservative Allocation 2 462 462 2 Moderate Allocation 10 749 749 10 World Allocation 5 148 148 5 Fixed-Income Funds High Yield Bond 438 1 438 1 Inflation-Protected Bond 139 2 139 2 Intermediate-Term Bond 869 4 869 4 Short Government 125 1 125 1 Short-Term Bond 324 2 324 2 World Bond 180 1 180 1 Municipal Bond Funds Muni National Interm 182 1 182 1 Muni Single State Long 1 289 289 1
Total 84 12,847 67 12,847 84 67 MFs: all mutual funds in this Morningstar category. Funds in shaded cells are category-matched, and are used for comparisons.
52 Journal of Applied Business and Economics vol. 14(3) 2013