viruses using multivalent glycan arrays determination of ... · determination of receptor...
TRANSCRIPT
Electronic Supplementary Information
Determination of receptor specificities for whole influenza viruses using multivalent glycan arrays
Mia L. Huang,a Miriam Cohen,b Christopher J. Fisher,a Robert J. Schooley,c Pascal Gagneux , b Kamil Godulaa*
a Department of Chemistry and Biochemistry, University of California San Diego, 9500 Gilman Drive, La Jolla, CA 92093. b Department of Pathology, Division of Comparative Pathology and medicine, University of California San Diego, 9500 Gilman Drive, San Diego, CA, 92093-0687. c Division of Infectious Diseases, Department of Medicine, University of California San Diego, 9500 Gilman Drive, San Diego, CA, 92093-0358.
Table of contentsMaterials and methods ………………………………..……………………………………………………2
Instrumentation…………………………………………….…………………………………………………2
Scheme S1. Overview of glycopolymer synthesis…………………………………….…………………2
General procedure and characterization data for the synthesis of side chain-reactive polymers…..3Figure S1. 1H NMR spectrum for polymer precursor 1a.Figure S2. 1H NMR spectrum for polymer precursor 1b.Figure S3. 1H NMR spectrum for polymer 1.
General procedure for the ligation of glycans to polymer backbones………….………………………4Table S1. Glycopolymer ligation efficiencies, valences, and molecular weights.Figure S4. 1H NMR spectrum of lactose glycopolymer (2a).Figure S5. 1H NMR spectrum of 3’-sialyllactose glycopolymer (2b).Figure S6. 1H NMR spectrum of 6’sialyllactose glycopolymer (2c).Figure S7. 1H NMR analysis of the hydrolysis of 3’-sialyllactose in pH 4.5, 50°C.Figure S8. 1H NMR analysis of the hydrolysis of 6’-sialyllactose in pH 4.5, 50°C.
Microarray experiments……………………………………………………………………..…..…………10Procedure for microarray printingLectin hybridization
Figure S9. Microarray images of arrays incubated with lectins.Virus production and hybridization
Figure S10. Microarray images of arrays incubated with whole H1N1 and H3N2 viruses.Figure S11. Microarray images of arrays incubated with whole H1N1 at 64 HAU.
References……………………………………………………………………….…………………………15
1
Electronic Supplementary Material (ESI) for ChemComm.This journal is © The Royal Society of Chemistry 2014
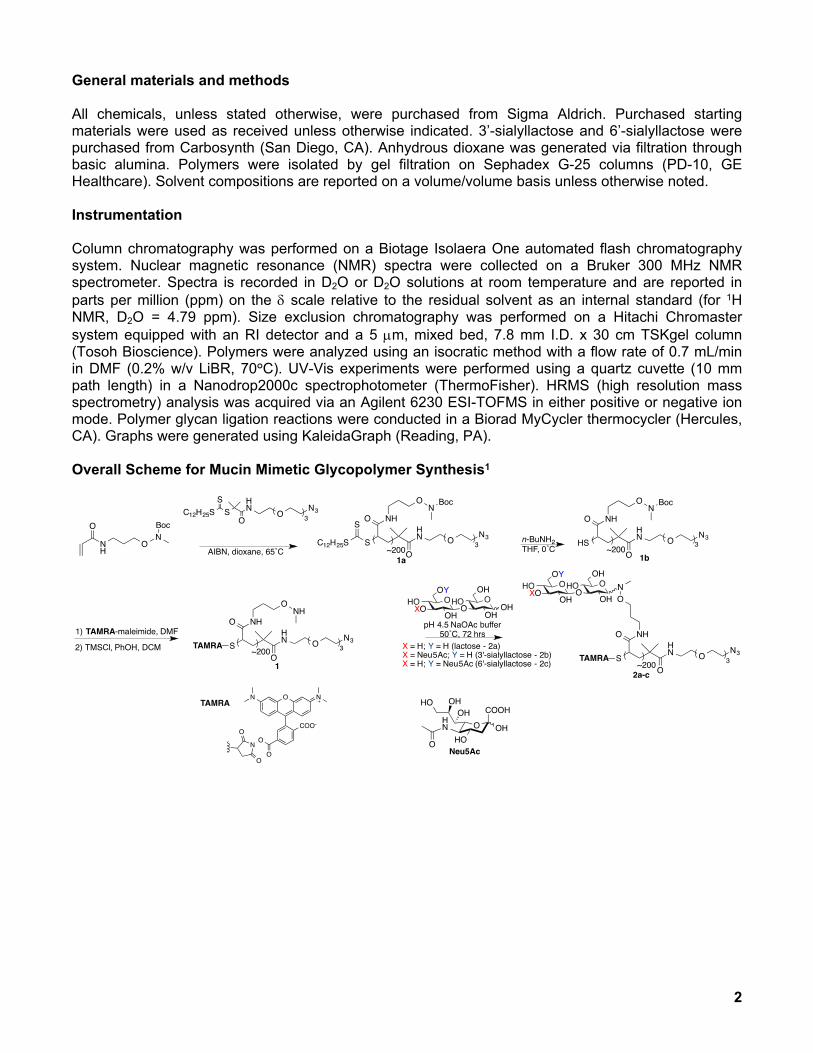
General materials and methods
All chemicals, unless stated otherwise, were purchased from Sigma Aldrich. Purchased starting materials were used as received unless otherwise indicated. 3’-sialyllactose and 6’-sialyllactose were purchased from Carbosynth (San Diego, CA). Anhydrous dioxane was generated via filtration through basic alumina. Polymers were isolated by gel filtration on Sephadex G-25 columns (PD-10, GE Healthcare). Solvent compositions are reported on a volume/volume basis unless otherwise noted.
Instrumentation
Column chromatography was performed on a Biotage Isolaera One automated flash chromatography system. Nuclear magnetic resonance (NMR) spectra were collected on a Bruker 300 MHz NMR spectrometer. Spectra is recorded in D2O or D2O solutions at room temperature and are reported in parts per million (ppm) on the scale relative to the residual solvent as an internal standard (for 1H NMR, D2O = 4.79 ppm). Size exclusion chromatography was performed on a Hitachi Chromaster system equipped with an RI detector and a 5 m, mixed bed, 7.8 mm I.D. x 30 cm TSKgel column (Tosoh Bioscience). Polymers were analyzed using an isocratic method with a flow rate of 0.7 mL/min in DMF (0.2% w/v LiBR, 70°C). UV-Vis experiments were performed using a quartz cuvette (10 mm path length) in a Nanodrop2000c spectrophotometer (ThermoFisher). HRMS (high resolution mass spectrometry) analysis was acquired via an Agilent 6230 ESI-TOFMS in either positive or negative ion mode. Polymer glycan ligation reactions were conducted in a Biorad MyCycler thermocycler (Hercules, CA). Graphs were generated using KaleidaGraph (Reading, PA).
Overall Scheme for Mucin Mimetic Glycopolymer Synthesis1
2
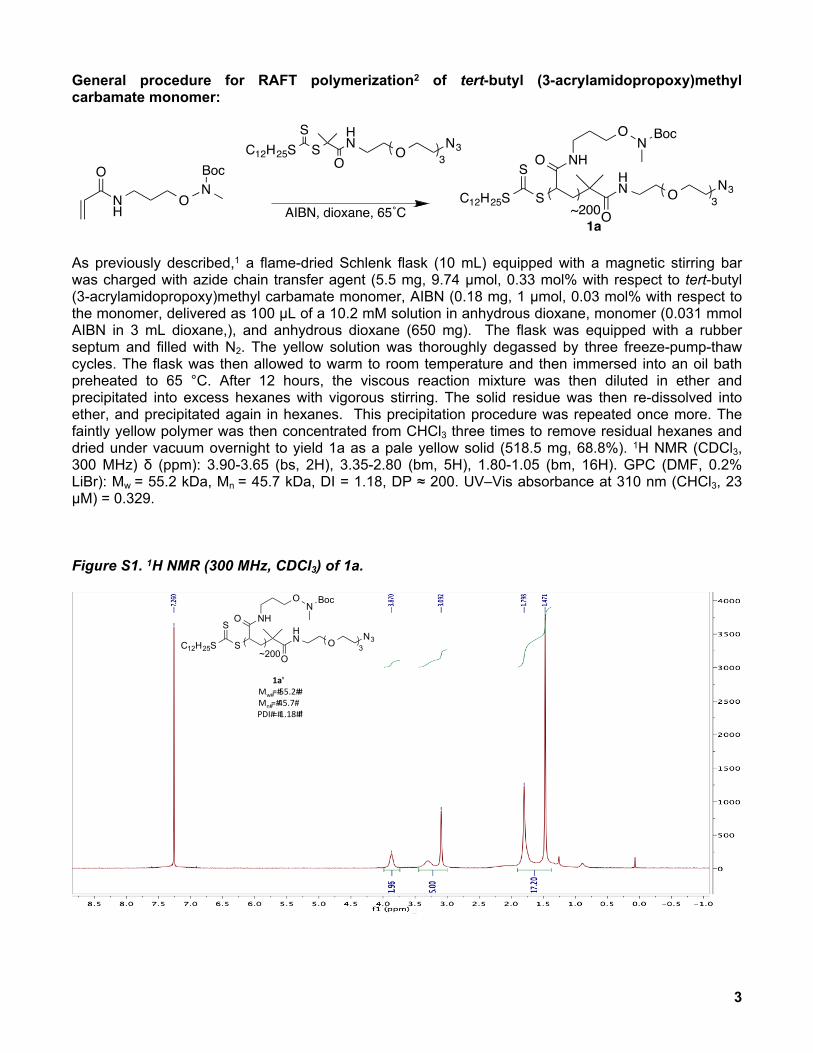
General procedure for RAFT polymerization2 of tert-butyl (3-acrylamidopropoxy)methyl carbamate monomer:
As previously described,1 a flame-dried Schlenk flask (10 mL) equipped with a magnetic stirring bar was charged with azide chain transfer agent (5.5 mg, 9.74 µmol, 0.33 mol% with respect to tert-butyl (3-acrylamidopropoxy)methyl carbamate monomer, AIBN (0.18 mg, 1 µmol, 0.03 mol% with respect to the monomer, delivered as 100 µL of a 10.2 mM solution in anhydrous dioxane, monomer (0.031 mmol AIBN in 3 mL dioxane,), and anhydrous dioxane (650 mg). The flask was equipped with a rubber septum and filled with N2. The yellow solution was thoroughly degassed by three freeze-pump-thaw cycles. The flask was then allowed to warm to room temperature and then immersed into an oil bath preheated to 65 °C. After 12 hours, the viscous reaction mixture was then diluted in ether and precipitated into excess hexanes with vigorous stirring. The solid residue was then re-dissolved into ether, and precipitated again in hexanes. This precipitation procedure was repeated once more. The faintly yellow polymer was then concentrated from CHCl3 three times to remove residual hexanes and dried under vacuum overnight to yield 1a as a pale yellow solid (518.5 mg, 68.8%). 1H NMR (CDCl3, 300 MHz) δ (ppm): 3.90-3.65 (bs, 2H), 3.35-2.80 (bm, 5H), 1.80-1.05 (bm, 16H). GPC (DMF, 0.2% LiBr): Mw = 55.2 kDa, Mn = 45.7 kDa, DI = 1.18, DP ≈ 200. UV–Vis absorbance at 310 nm (CHCl3, 23 μM) = 0.329.
Figure S1. 1H NMR (300 MHz, CDCl3) of 1a. CF#I#93'
SO
HN
O NHS
C12H25S~200
ON
Boc
ON3
3
1a'Mw#=#55.2##Mn#=#45.7#PDI#=#1.18##'
3
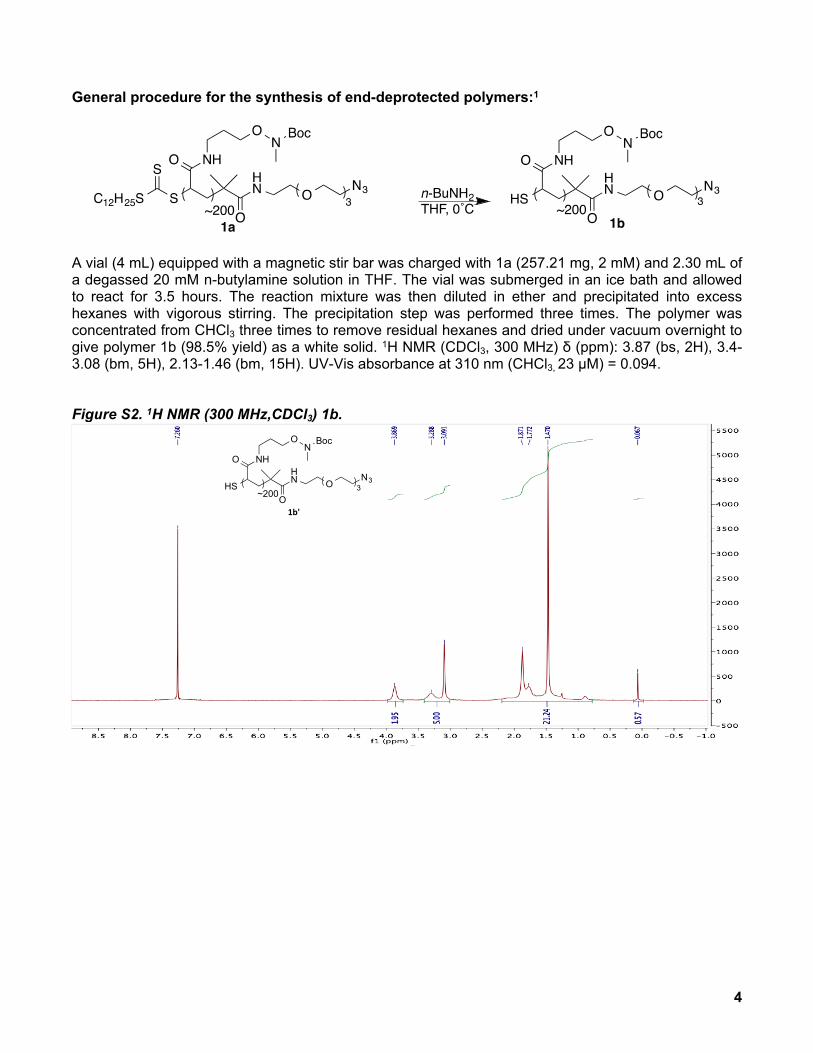
General procedure for the synthesis of end-deprotected polymers:1
A vial (4 mL) equipped with a magnetic stir bar was charged with 1a (257.21 mg, 2 mM) and 2.30 mL of a degassed 20 mM n-butylamine solution in THF. The vial was submerged in an ice bath and allowed to react for 3.5 hours. The reaction mixture was then diluted in ether and precipitated into excess hexanes with vigorous stirring. The precipitation step was performed three times. The polymer was concentrated from CHCl3 three times to remove residual hexanes and dried under vacuum overnight to give polymer 1b (98.5% yield) as a white solid. 1H NMR (CDCl3, 300 MHz) δ (ppm): 3.87 (bs, 2H), 3.4-3.08 (bm, 5H), 2.13-1.46 (bm, 15H). UV-Vis absorbance at 310 nm (CHCl3, 23 μM) = 0.094.
Figure S2. 1H NMR (300 MHz,CDCl3) 1b. CF#II#66'
HSO
HN
O NH
~200
ON
Boc
ON3
3
1b'
4
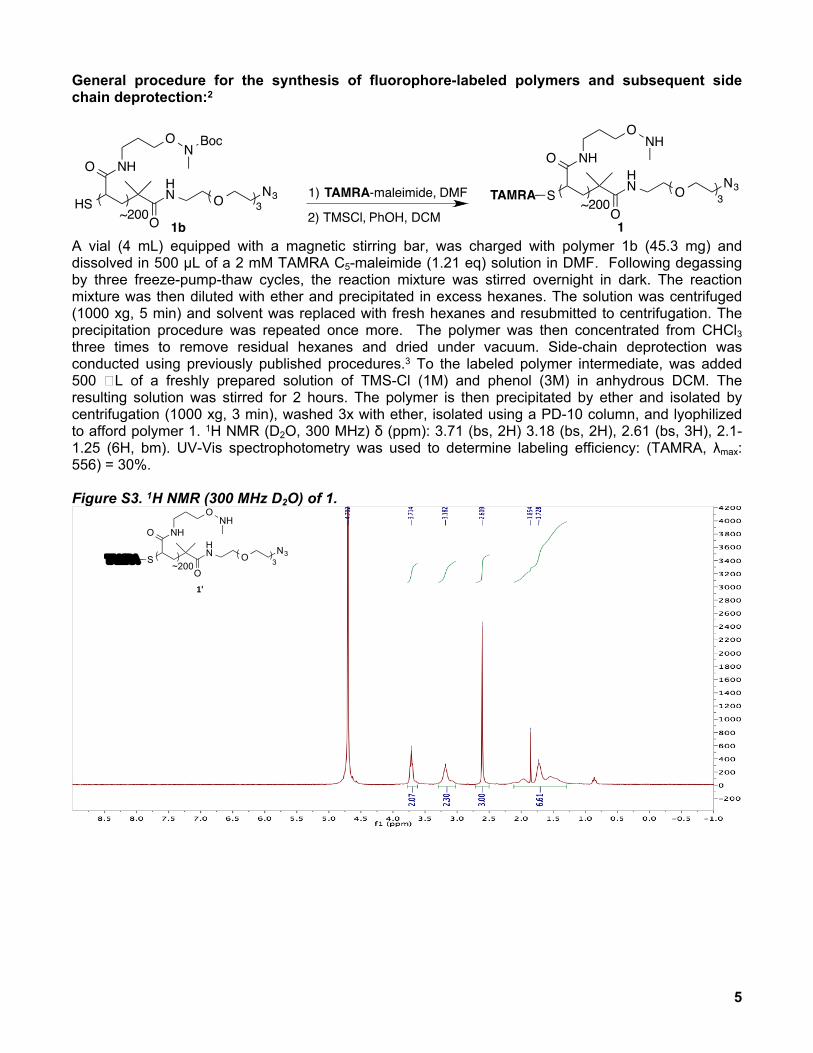
General procedure for the synthesis of fluorophore-labeled polymers and subsequent side chain deprotection:2
A vial (4 mL) equipped with a magnetic stirring bar, was charged with polymer 1b (45.3 mg) and dissolved in 500 µL of a 2 mM TAMRA C5-maleimide (1.21 eq) solution in DMF. Following degassing by three freeze-pump-thaw cycles, the reaction mixture was stirred overnight in dark. The reaction mixture was then diluted with ether and precipitated in excess hexanes. The solution was centrifuged (1000 xg, 5 min) and solvent was replaced with fresh hexanes and resubmitted to centrifugation. The precipitation procedure was repeated once more. The polymer was then concentrated from CHCl3 three times to remove residual hexanes and dried under vacuum. Side-chain deprotection was conducted using previously published procedures.3 To the labeled polymer intermediate, was added 500 L of a freshly prepared solution of TMS-Cl (1M) and phenol (3M) in anhydrous DCM. The resulting solution was stirred for 2 hours. The polymer is then precipitated by ether and isolated by centrifugation (1000 xg, 3 min), washed 3x with ether, isolated using a PD-10 column, and lyophilized to afford polymer 1. 1H NMR (D2O, 300 MHz) δ (ppm): 3.71 (bs, 2H) 3.18 (bs, 2H), 2.61 (bs, 3H), 2.1-1.25 (6H, bm). UV-Vis spectrophotometry was used to determine labeling efficiency: (TAMRA, λmax: 556) = 30%.
Figure S3. 1H NMR (300 MHz D2O) of 1. CF#II#72.3'
SO
HN
O NH
~200
ONH
ON3
3TAMRA
1'
5
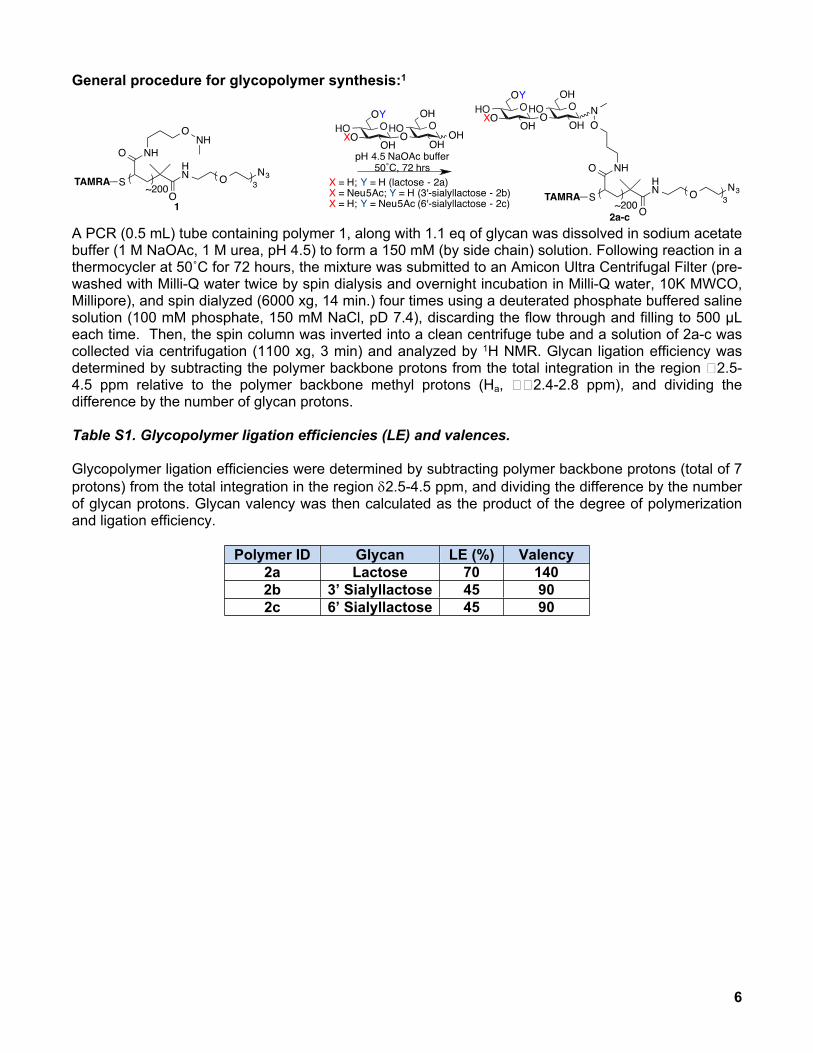
General procedure for glycopolymer synthesis:1
A PCR (0.5 mL) tube containing polymer 1, along with 1.1 eq of glycan was dissolved in sodium acetate buffer (1 M NaOAc, 1 M urea, pH 4.5) to form a 150 mM (by side chain) solution. Following reaction in a thermocycler at 50˚C for 72 hours, the mixture was submitted to an Amicon Ultra Centrifugal Filter (pre-washed with Milli-Q water twice by spin dialysis and overnight incubation in Milli-Q water, 10K MWCO, Millipore), and spin dialyzed (6000 xg, 14 min.) four times using a deuterated phosphate buffered saline solution (100 mM phosphate, 150 mM NaCl, pD 7.4), discarding the flow through and filling to 500 µL each time. Then, the spin column was inverted into a clean centrifuge tube and a solution of 2a-c was collected via centrifugation (1100 xg, 3 min) and analyzed by 1H NMR. Glycan ligation efficiency was determined by subtracting the polymer backbone protons from the total integration in the region 2.5-4.5 ppm relative to the polymer backbone methyl protons (Ha, 2.4-2.8 ppm), and dividing the difference by the number of glycan protons.
Table S1. Glycopolymer ligation efficiencies (LE) and valences.
Glycopolymer ligation efficiencies were determined by subtracting polymer backbone protons (total of 7 protons) from the total integration in the region 2.5-4.5 ppm, and dividing the difference by the number of glycan protons. Glycan valency was then calculated as the product of the degree of polymerization and ligation efficiency.
Polymer ID Glycan LE (%) Valency2a Lactose 70 1402b 3’ Sialyllactose 45 902c 6’ Sialyllactose 45 90
6
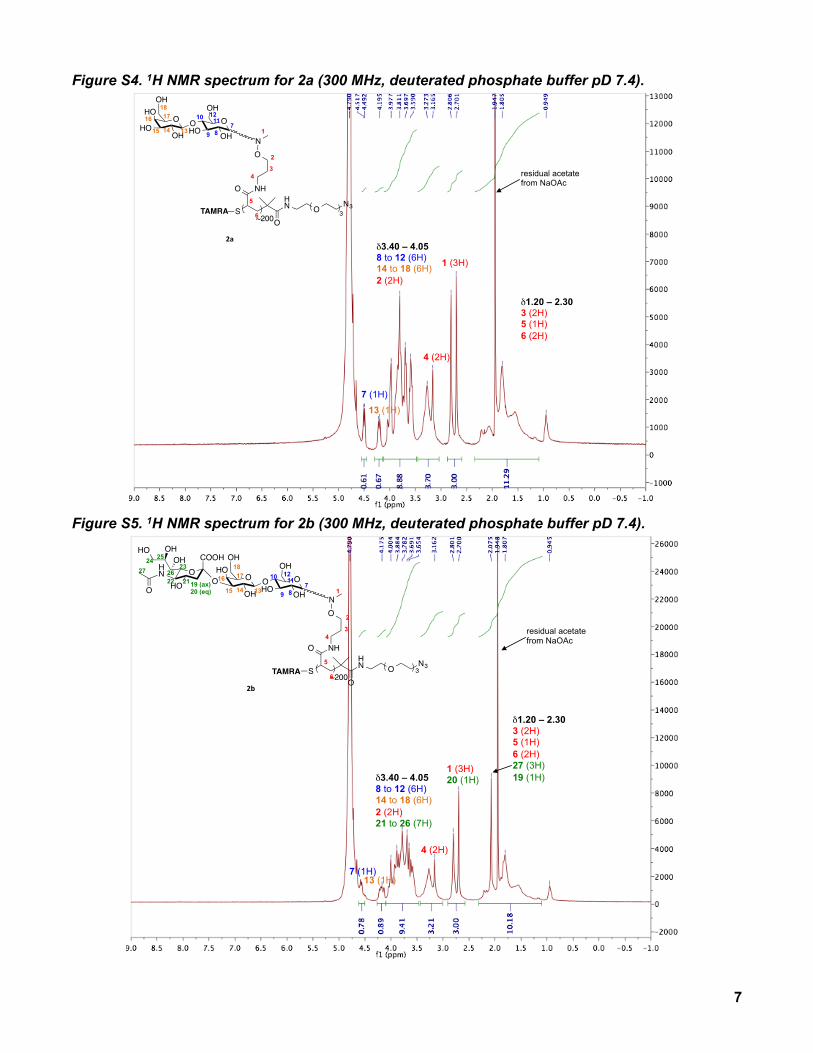
Figure S4. 1H NMR spectrum for 2a (300 MHz, deuterated phosphate buffer pD 7.4).
Figure S5. 1H NMR spectrum for 2b (300 MHz, deuterated phosphate buffer pD 7.4).
7
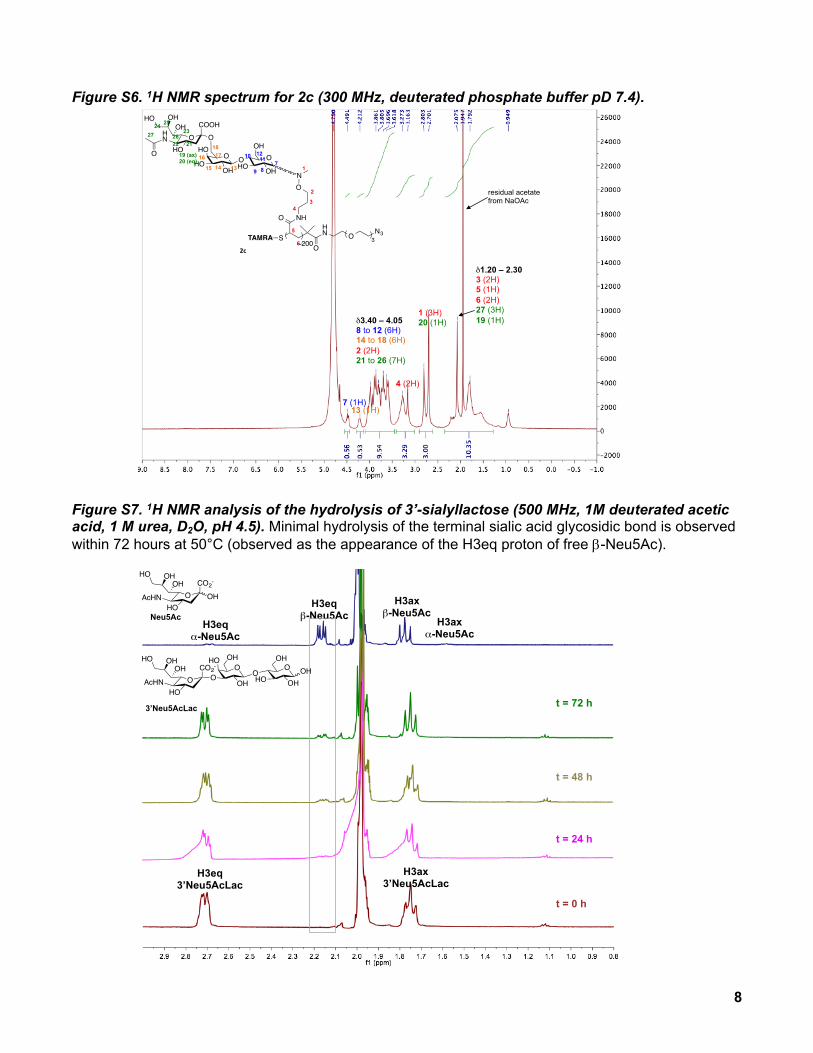
Figure S6. 1H NMR spectrum for 2c (300 MHz, deuterated phosphate buffer pD 7.4).
Figure S7. 1H NMR analysis of the hydrolysis of 3’-sialyllactose (500 MHz, 1M deuterated acetic acid, 1 M urea, D2O, pH 4.5). Minimal hydrolysis of the terminal sialic acid glycosidic bond is observed within 72 hours at 50°C (observed as the appearance of the H3eq proton of free -Neu5Ac).
8
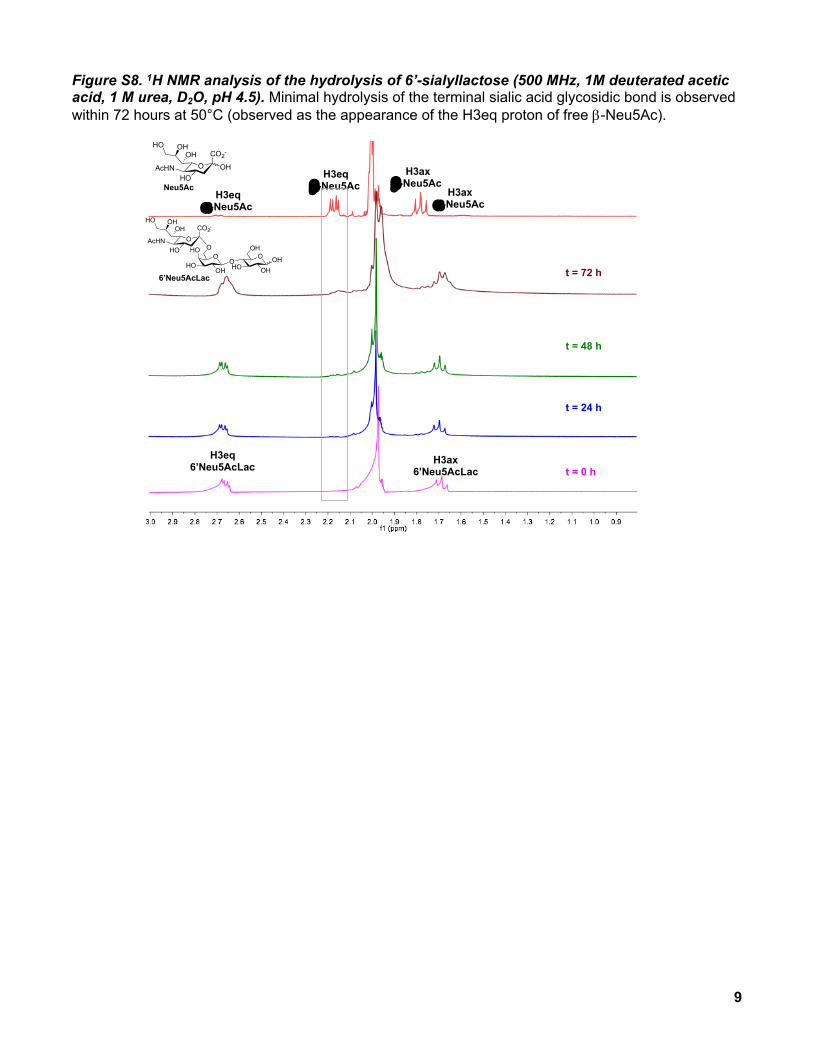
Figure S8. 1H NMR analysis of the hydrolysis of 6’-sialyllactose (500 MHz, 1M deuterated acetic acid, 1 M urea, D2O, pH 4.5). Minimal hydrolysis of the terminal sialic acid glycosidic bond is observed within 72 hours at 50°C (observed as the appearance of the H3eq proton of free -Neu5Ac).
t = 72 h
t = 48 h
t = 24 h
t = 0 h
H3eq -Neu5Ac
H3eq -Neu5Ac
H3ax 6’Neu5AcLac
H3eq 6’Neu5AcLac
H3ax -Neu5Ac
H3ax -Neu5Ac
OHO
AcHN
CO2-
HO OHOH
OH
Neu5Ac
O
OH
OH
OHO
O
OH
OHO
HO
OHO
AcHN
CO2-
HO OHOH
OH
6’Neu5AcLac
9
Microarray fabrication
Procedure for generating ADIBO-functionalized slidesTo generate azadibenzocyclooctyne (ADIBO)-functionalized slides,4 the epoxy slides were rinsed with water and allowed to react overnight at room temperature with azadibenzocyclooctyne-amine (1 mM in DMF, 10 mM DIPEA)5 in a Coplin jar. The slides were then sonicated in methanol (2 x 15 min), rinsed with water, and centrifuged at 500 rpm for 5 min to “spin-dry,” and stored at 4°C until use. Prior to printing, the slides were passivated with 1% BSA, 0.1% Tween20 for 1 hr at room temperature, washed with PBS (2 x 15 min), rinsed with water, and spin dried.
Determination of Glycan Concentration for Microarray Printing: Using the TAMRA labeling efficiency (30%), a polymer molarity can be calculated using the dye concentration determined by UV-Vis absorbance at 556 nm. Being that valency represents a ratio of glycans ligated per molecule of polymer, it can be used to stoichiometrically compare moles of glycan to moles of polymer.
[glycan] = [polymer] x (% ligation efficiency) = [TAMRA] / 0.30 x (% ligation efficiency)
For polymer 2a, [TAMRA] = 21.5 M; hence, [polymer] = 21.5 M / 0.30 = 71.7 M, and
[lactose] = 71.7 M x 70 = 5.0 mM
Procedure for microarray printing Microarrays were fabricated on epoxide-coated glass (SuperChip, ThermoFisher) using a GIX Microplotter Desktop (Sonoplot, Middleton, WI) and analyzed using a Axon GenePix 4000B microarray scanner (Molecular Devices). For microarray experiments, all water used was doubly-distilled from a Milli-Q water purification system (Millipore). PBS solutions were prepared from a 20X PBS pH 7.5 stock solution (Amresco), filtered through a 0.22 m membrane filter, and titrated to the desired pH.
The glycopolymers were printed at various concentrations (10 M – 10 mM, by glycan) on the ADIBO-coated slides at 80-85% relative humidity (in 0.005% Tween, pH 7.4). Each concentration was spotted as four replicate spots, and each slide contained 16 full sub-arrays. To improve spot morphology after printing, the slides were briefly humidified over a 80 deg C water bath and snap-dried over a dry 80 deg C glass surface. The printed slides were allowed to react overnight at 4 deg C. Following a quick rinse with water, the slides were plunged in 0.1% Triton-X/PBS for 2 min, followed by additional 15 min. to remove unbound polymers, washed in PBS (2 x 15 min.), rinsed with water, and spin dried. To create individual sub-arrays on the slide, hydrophobic boundaries were drawn (Invitrogen PAP pen) around each sub-array.
10
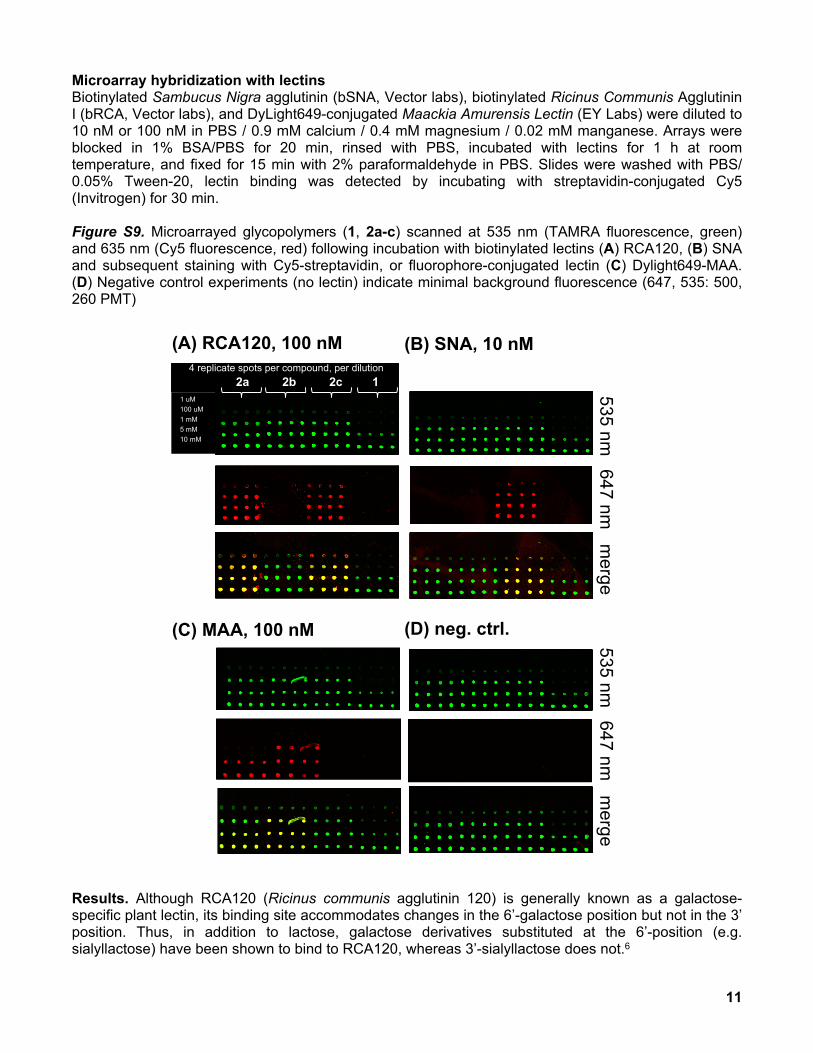
Microarray hybridization with lectinsBiotinylated Sambucus Nigra agglutinin (bSNA, Vector labs), biotinylated Ricinus Communis Agglutinin I (bRCA, Vector labs), and DyLight649-conjugated Maackia Amurensis Lectin (EY Labs) were diluted to 10 nM or 100 nM in PBS / 0.9 mM calcium / 0.4 mM magnesium / 0.02 mM manganese. Arrays were blocked in 1% BSA/PBS for 20 min, rinsed with PBS, incubated with lectins for 1 h at room temperature, and fixed for 15 min with 2% paraformaldehyde in PBS. Slides were washed with PBS/ 0.05% Tween-20, lectin binding was detected by incubating with streptavidin-conjugated Cy5 (Invitrogen) for 30 min.
Figure S9. Microarrayed glycopolymers (1, 2a-c) scanned at 535 nm (TAMRA fluorescence, green) and 635 nm (Cy5 fluorescence, red) following incubation with biotinylated lectins (A) RCA120, (B) SNA and subsequent staining with Cy5-streptavidin, or fluorophore-conjugated lectin (C) Dylight649-MAA. (D) Negative control experiments (no lectin) indicate minimal background fluorescence (647, 535: 500, 260 PMT)
(B) SNA, 10 nM
(C) MAA, 100 nM
535 nm
647 nm
merge
4 replicate spots per compound, per dilution 2a 2b 2c 1
(A) RCA120, 100 nM
1 uM 100 uM 1 mM 5 mM 10 mM
(D) neg. ctrl.
535 nm
647 nm
merge
Results. Although RCA120 (Ricinus communis agglutinin 120) is generally known as a galactose-specific plant lectin, its binding site accommodates changes in the 6’-galactose position but not in the 3’ position. Thus, in addition to lactose, galactose derivatives substituted at the 6’-position (e.g. sialyllactose) have been shown to bind to RCA120, whereas 3’-sialyllactose does not.6
11
Virus production
Two influenza strains A/PR/8/34(H1N1) and A/Aichi/2/68(H3N2) were purchased from ATCC. MDCK cells (ATCC CCL-34) were maintained in Dulbeco’s modified Eagle’s medium (DMEM, Cellgro) supplemented with 10% fetal calf serum (FCS). All viruses were propagated in MDCK cells that were transferred to DMEM medium supplemented with 0.2% BSA fraction V (EMD), 25mM HEPES buffer (Gibco), 2 g/ml TPCK-trypsin (Worthington Corporation), and 1% penicillin/streptomycin.
Incubation of microarrays with virusesThe arrays were blocked with 1% BSA/PBS (20 min, RT), and rinsed with PBS. Virus binding to the array was evaluated by incubating A/PR/8/34 (H1N1) at ~1000 or ~500 HAU (hemagglutinating units), or A/Aichi/2/68(H3N2) at the same HAU for 1 hr at RT. Viral stocks were concentrated using a Microcon-50 filtration system (Millipore) when necessary. Viruses were diluted in PBS (0.9 mM calcium, 0.4 mM magnesium) to the appropriate HAU concentration. Following incubation with the viruses, the slides were washed extensively in PBS and fixed with 2% para-formaldehyde in PBS for 15 min. Viral binding was detected by incubation with anti-H1 (A/California/06/09, IA-01SW-0100, eEnzyme) or anti-H3 (A/Shandong/9/99, MIA-H3-246, eEnzyme) antibodies for 30 min, followed by goat-anti-rabbit-IgG-Alexa647 (A31573, Invitrogen) or goat-anti-mouse-IgG-Cy5 (A10523, Invitrogen) antibodies, respectively. Antibodies were diluted in 1% BSA/PBS/0.05% Tween20, and washed post fixation in PBS/0.05%Tween20.
12
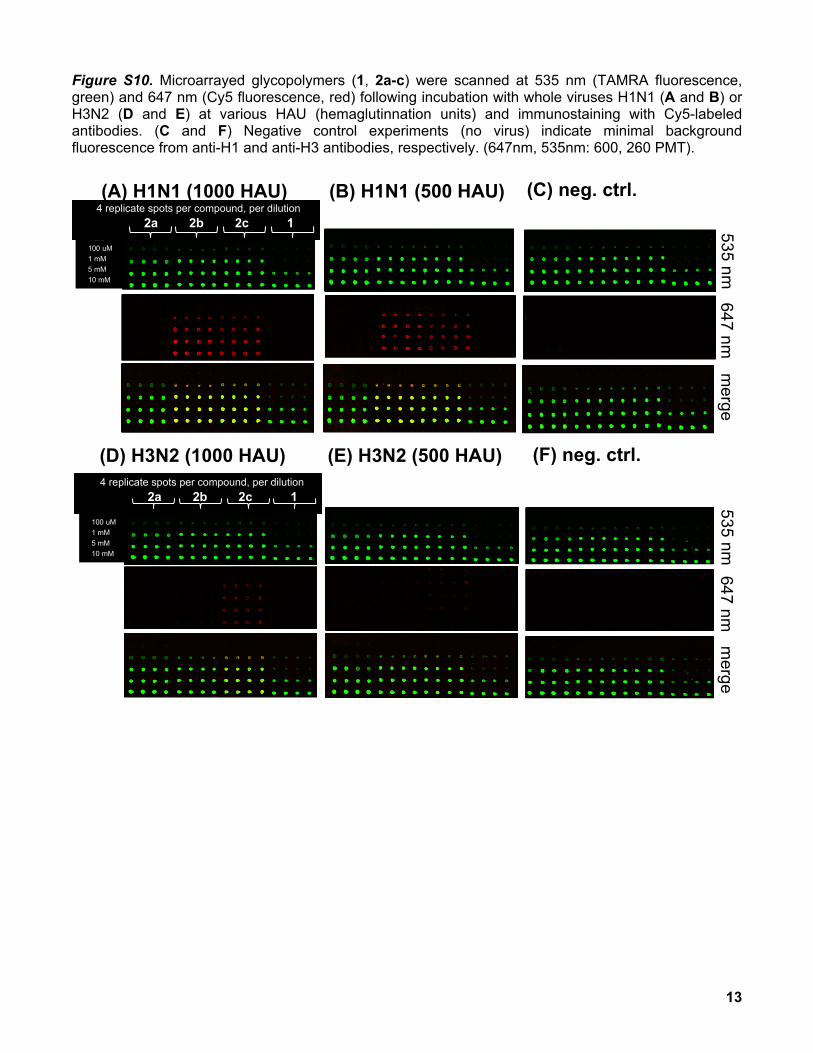
Figure S10. Microarrayed glycopolymers (1, 2a-c) were scanned at 535 nm (TAMRA fluorescence, green) and 647 nm (Cy5 fluorescence, red) following incubation with whole viruses H1N1 (A and B) or H3N2 (D and E) at various HAU (hemaglutinnation units) and immunostaining with Cy5-labeled antibodies. (C and F) Negative control experiments (no virus) indicate minimal background fluorescence from anti-H1 and anti-H3 antibodies, respectively. (647nm, 535nm: 600, 260 PMT).
(A) H1N1 (1000 HAU)
535 nm
647 nm
merge
1 uM 100 uM 1 mM 5 mM 10 mM
4 replicate spots per compound, per dilution 2a 2b 2c 1
(B) H1N1 (500 HAU)
(D) H3N2 (1000 HAU) (E) H3N2 (500 HAU)
535 nm 647 nm
m
erge
1 uM 100 uM 1 mM 5 mM 10 mM
4 replicate spots per compound, per dilution 2a 2b 2c 1
(C) neg. ctrl.
(F) neg. ctrl.
13
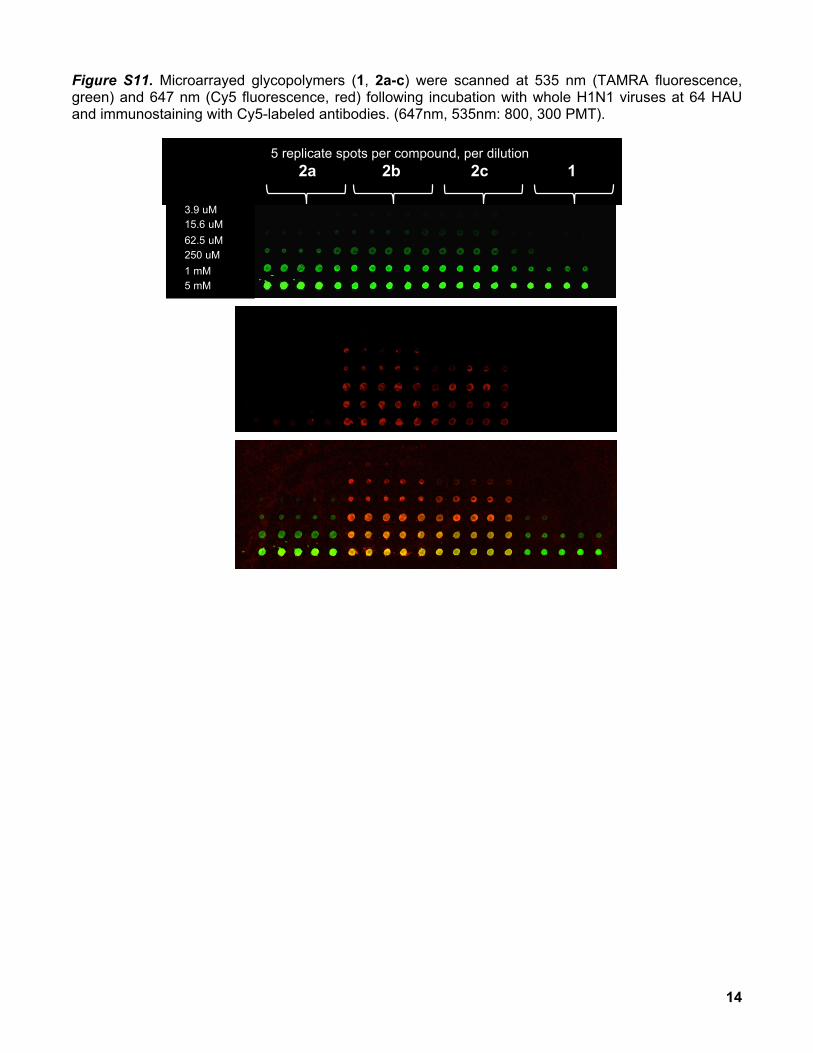
Figure S11. Microarrayed glycopolymers (1, 2a-c) were scanned at 535 nm (TAMRA fluorescence, green) and 647 nm (Cy5 fluorescence, red) following incubation with whole H1N1 viruses at 64 HAU and immunostaining with Cy5-labeled antibodies. (647nm, 535nm: 800, 300 PMT).
3.9 uM 15.6 uM 62.5 uM 250 uM 1 mM 5 mM
5 replicate spots per compound, per dilution 2a 2b 2c 1
14
REFERENCES:
1 M. L. Huang, R. A. A. Smith, G. W. Trieger, K. Godula. J. Am. Chem. Soc., 2014, 136, 10565-10568.2 J. Chiefari, Y. K. Chong, F. Ercole, J. Krstina, J. Jeffery, T.P.T. Le, R.T. A. Mayadunne, G. F. Meijs, C.L.
Moad, G. Moad, E. Rizzardo, S.H. Thang, Macromolecules 1998, 31, 5559-5562
3 E. Kaiser, F. Picart, T. Kubiak, J.P. Tam, R. B. J. Merrifield, Org. Chem., 1993, 58, 5167-5175.4 A. Kuzmin, A. Poloukhtine, M. A. Wolfert, V. V. Popik, Bioconj. Chem. 2010, 21, 2076-2085.5 X. Ning, J. Guo, W. M. Wolfert, G. J. Boons. Angew. Chem., Int. Ed. Engl. 2008, 47, 2553-2555.6 M. Fais, R. Karamanska, S. Allman, S. A. Fairhurst, P. Innocenti, A. J. Fairbanks, T. J. Donohoe, B. G. Davis,
D. A. Russell, R. A. Field. Chem. Sci. 2011, 2, 1952-1959.
15